Embed Size (px)
Citation preview
Timing and Wealth Effects of
German Dual Class Stock Unifications#
Ingolf Dittmann§ Niels Ulbricht§
20 September 2004
Abstract: This paper studies the reasons and the costs of separating ownership from control
by analyzing the decision of German dual class firms to consolidate their share
structure from dual to single class equity between 1990 and 2001. We find that the
firm value increases significantly by an average 4% on the announcement day. A
significant part of the variation in abnormal returns can be explained by the ownership
structure. A logit analysis of the unification decision yields that firms with less
entrenched management are more likely to unify. Also, firms that are financially
constrained are more likely to abolish dual class shares; these firms often issue
additional shares after the stock unification.
JEL Classification Codes: G32, G34
# We would like to thank Ernst Maug, Colin Mayer, Fabrice Riva, Mario C. Santos, and seminar
participants at the 2003 Meeting of the German Finance Association and the 2004 Meeting of the European Financial Management Association for helpful discussions and comments. We also thank Christian Bassen for valuable research assistance. A previous version of this paper was circulated under the title “When do firms abolish dual class stocks?”.
§ Humboldt-Universität zu Berlin, School of Business and Economics, Spandauer Str. 1, 10178 Berlin, Germany; e-mail: [email protected], [email protected]
2
1. Introduction Dual class shares are common in many countries around the world. Among the 49
countries analyzed by La Porta et al. (1998), 38 permit some form of separation
between ownership and control and at least 21 of them actually do have dual class
firms.1 This paper addresses the question whether dual class structures create or
destroy value. The theoretical literature on this issue is indecisive as it just points out
the costs and benefits of separating ownership from control but cannot determine the
net effect. On the other hand, there is surprisingly little empirical evidence on the
efficiency of dual class shares, and empirical results are mixed and often
inconclusive.2
This paper analyzes a unique sample of 89 German dual class firms from 1990 to
2001. Over this period, 32 firms decided to abolish their dual class structure. By
analyzing the abnormal returns to the stock unification announcement, we can answer
the question about the efficiency of dual class shares for the subset of firms that
choose to abolish them. In addition, this approach allows us to distinguish between
several potential sources of inefficiency, so that we can identify the main costs of dual
class shares. We also analyze firms’ decisions to abolish the dual class structure in
order to understand why and when controlling shareholders agree to a dilution of their
voting power.
We work with German data, because Germany is one of the largest capital markets
where a large fraction of firms maintains a dual class structure.3 Also, dual class
structures are more homogenous in Germany than in many other countries, especially
in the U.S. or the U.K., because German law severely restricts a firm’s choice of
dividend and voting rights of inferior voting shares. Moreover, German legislation on
dual class shares did not change during our sample period. In particular, there was no
legal change that forced firms to abolish dual class shares as in Israel (see Hauser and
Lauterbach, 2004) or Switzerland (Kunz, 2002).
1 In a study on cross-listed dual class firms, Doidge (2003) analyzes a sample of dual class firms
from 20 countries which are included in the La Porta et al (1998) list. The 21st country is the U.S. 2 See Section 2 for a brief review of the literature on the costs and benefits of dual class structures. 3 In 1995, 26 of the largest 100 publically traded German firms had dual class stock.
3
In our event study, we find a 10% significant positive abnormal return for non-
voting shares and a 3% marginally significant positive abnormal return for voting
shares. The total market capitalization increases significantly by 4% on average. Since
the controlling shareholder must have agreed to the unification, the positive abnormal
returns imply that dual class structures destroyed corporate value for those firms that
choose to unify. Our results do not imply, however, that all dual class structures are
inefficient. Existing event studies (Ang and Megginson, 1989, for U.K. data and
Kunz, 2002, for Swiss data) do not find a significant effect of the announcement of a
stock unification on a firm’s market capitalization. Ang and Megginson (1989) work
with monthly share prices, so that their tests have comparatively low power. The stock
unifications analyzed by Kunz (2002) were largely anticipated due to a previous
change in legislation that leveled the differences between the individual share classes.
In our dataset, we can also find indications that stock unifications were partly
anticipated. Therefore, the 4% abnormal announcement return should be regarded a
conservative estimate of the discount at which these dual class firms traded in the
past.
In regressions of the cumulative abnormal returns we find strong evidence that the
discount at which dual class firms trade before the unification announcement is
mainly determined by agency costs. About 19% of the variation in the cumulative
abnormal returns can be explained by the size of the largest voting block: Firms with
larger blocks experience higher abnormal returns. Interestingly, the second largest
block is not significantly related to the abnormal return, but the sum of all reported
blocks is more significant than the largest block alone and can explain approximately
32% of the variation. This finding suggests that the smaller blockholders do not
prevent the largest blockholder from extracting private benefits, but rather enter into a
coalition with the largest blockholder to share in the private benefits. In addition, we
find weak evidence for the hypotheses that dual class firms trade at a discount because
liquidity is spread over two classes of shares or because dual class firms are less likely
to be included in a stock market index. In contrast, we cannot find any evidence that
international investors avoid dual class firms.
In the second part of the paper, we investigate when and why controlling
shareholders agree to abolish the firm’s dual class structure. We argue that the
discount at which dual class companies trade in the market translates into a cost for
the controlling shareholder if she wants to sell some of her shares or if the company
4
plans to issue additional shares to outside shareholders. If these costs exceed the
blockholder’s expected private benefits from control, she will agree to a stock
unification. Therefore, we expect that financially constrained firms (which need new
equity capital) and firms with less entrenched managers4 (who have fewer
opportunities to extract private benefits) are more likely to perform a stock
unification. In a logit analysis, we find that the size of the largest voting block has a
significant negative impact on the unification probability, which corroborates that
firms with more entrenched managers are less likely to perform a stock unification.
On the other hand, zero dividend payments significantly increase the probability of a
stock unification, so financially constrained firms are more likely to abolish dual class
shares.
Our empirical results are in stark contrast to the reasons for the stock unification
given by the firms themselves. The reasons most frequently given are to improve
liquidity, to become more attractive to international investors and to improve the
chances of the firm being included in a major stock index. Interestingly, these reasons
are hardly significant in our empirical analysis. Instead, corporate governance issues
turn out to be the main determinants of the decision to abolish dual class shares and
the subsequent stock market reaction. Only three firms in our sample officially
admitted that they abolished dual class shares in order to improve corporate
governance.
We also establish that a stock unification is only one aspect of a more general
transformation of a firm’s ownership structure. In particular, we find that the average
size of the largest voting block gradually decreases from 62% four years prior to the
unification to 46% immediately before the unification and to 41% two years after the
unification. Hence, the general picture that emerges from our analysis and previous
research is that the introduction and the abolition of a dual class structure are two
natural points of the life cycle of a firm. Young firms are typically financed by an
individual or a family. As a firm grows, it needs more equity capital and the
controlling shareholder might decide to issue non-voting shares in order to stay in
control and continue consuming private benefits of control. As such a firm grows
further and issues additional shares, the dual class structure becomes more and more
costly to the controlling shareholder. Therefore, at some critical firm size, the
4 We do not distinguish between controlling shareholder and managers in this paper.
5
blockholder decides to abandon the dual class structure and to give up her exclusive
control. Consequently, a dual class structure should be considered a phase a firm is
going through rather than a fixed characteristic of a firm.5
The paper is organized as follows. The next section reviews the literature on the
costs and benefits of dual class structures. On this basis, we develop a few hypotheses
in Section 3 that will guide the subsequent empirical analysis. Section 4 introduces the
dataset and some institutional details. Sections 5 and 6 contain the empirical analysis.
Section 5 studies the wealth effects of a stock unification and Section 6 investigates
the unification decision. Finally, Section 7 concludes. The appendix explains how the
variables used in the analysis have been constructed.
2. Review of the literature on the costs and benefits of dual class structures
Dual class firms typically have a blockholder who holds more than 50% of the
voting rights but considerably less than 50% of the cash flow rights.6 Such a
controlling shareholder pays less than 50 cents for each dollar of private benefits she
extracts from the firm. Consequently, more private benefits of control are extracted
under a dual class structure than under a single class structure. If the controlling
shareholder is risk neutral and wealthy enough to hold 50% of the cash flow rights, a
single class structure is clearly more efficient than a dual class structure, because the
5 This argument could be analyzed with a duration model that models the time passed until the
retirement of non-voting shares. Since our independent variables can only be sampled at annual
intervals, a discrete proportional hazard model would be the most obvious choice. However, under the
assumption that the baseline hazard does not depend on the duration (i.e. age) of the dual class
structure, the discrete proportional hazard model is identical to the logit model used in our analysis (see
Beck, Katz and Tucker, 1998). 6 In our sample, the largest shareholder controls a median 52.9% of the votes (see Table 2) and
owns 36.8% of the cash flows (not reported in the tables). This is in line with DeAngelo and DeAngelo
(1985) who report for the United States that corporate officers and their families hold a median 56.9%
of the votes and 24% of the cash flows. In contrast, Bergström and Rydqvist (1990) find that the largest
shareholder coalition of Swedish dual class companies holds an average 40.3% of voting rights and
31.9% of cash flow rights. These results suggest that the proportion of votes needed for the extraction
of private benefits differs between countries. In the following, we use the 50% threshold for illustrative
purposes only. The argument continues to hold for any higher or lower threshold than 50%.
6
additional private benefits extracted under the dual class structure are more expensive
to the firm than their value to the controlling shareholder is. However, if either the
controlling shareholder is not wealthy enough to buy 50% of the cash flow rights or
she is risk averse and therefore not willing to invest more money in the firm, a dual
class structure can be efficient, because it allows the extraction of efficient private
benefits that have a higher value to the controlling shareholder than they cost to the
firm (see Bebchuck, 1999, and Gomes, 2000). In addition, a dual class structure can
improve the managements’ incentives to exert effort (Aghion and Tirole, 1997), to
invest in firm specific human capital (DeAngelo and DeAngelo, 1985, Denis and
Denis, 1994), or to pursue the firm’s growth opportunities (Attari and Banerjee,
2003).
An additional cost of dual class structures can arise when there are competing
management teams that differ in their management quality and the amount of private
benefits they can extract from the firm. Grossman and Hart (1988) and Harris and
Raviv (1988) show that an inefficient team might end up managing the firm under a
dual class structure, because they can extract more private benefits. In contrast, Blair,
Golbe and Gerard (1989) and Burkart, Gromb and Panunzi (1998) argue that dual
class structures can be efficient because they potentially raise the probability of a
welfare increasing takeover.
Given these contrary theoretical results, the question whether or not dual class
structures are efficient remains an empirical issue. In order to answer this question,
estimates of the costs of the dual class structure to the firm and estimates of the
additional private benefits obtained by the controlling shareholder are needed, and
accordingly the empirical literature falls into two branches. The first branch is
concerned with the estimation of private benefits of control. Barclay and Holderness
(1989) and Dyck and Zingales (2001) estimate private benefits of control from the
price difference between block trades and market prices, whereas Nenova (2003) and
Dittmann (2003), among others, estimate private benefits of control from dual class
share prices.
The second branch, to which this paper contributes, attempts to estimate the costs
of the dual class structure to minority shareholders. Smart and Zutter (2003) find that
dual class IPO firms have a markedly higher earnings-to-price multiplier than single
class IPO firms. Partch (1987) finds a significantly positive price response of 1.2% to
the announcement of plans to create a second class of shares in the US, but the median
7
price response is not significantly different from zero. In contrast, Jarrell and Poulsen
(1988) find a small significantly negative wealth effect of –0.8% for a wave of dual
class recapitalizations in the mid 1980s. For the UK, Ang and Megginson (1989)
report a positive abnormal return of 5.1% to the announcement of a plan to issue
restricted voting shares. A potential explanation for these contradictory findings is
that the introduction of a dual class structure also helps to overcome financing
constraints faced by the firm. Such financing constraints can arise when the
controlling shareholder is neither willing to invest more money in her firm nor to
relinquish control by selling new equity to outsiders (see Attari and Banerjee, 2003).
In such a situation, the announcement of a dual class reclassification means that a
financially constrained single class firm becomes a financially unconstrained dual
class firm, and it will be difficult to disentangle the two effects.
A more promising way to quantify the costs of the dual class structure is to study
the abnormal returns to the announcement of a dual class stock unification, i.e. the
abolition of inferior voting shares. To our knowledge, there are only two other papers
that perform such an event study: Ang and Megginson (1989) consider 49 UK firms
that announced a stock unification between 1955 and 1982. Kunz (2002) analyzes 46
Swiss dual class unifications between 1992 and 1994. Neither study finds a significant
effect of the unification announcement on the firm value. The reason for the
insignificance of the results presumably is that Ang and Megginson (1989) work with
monthly returns, so that their tests have comparatively low power, while the stock
unifications analyzed by Kunz (2002) were largely anticipated due to a previous
change in Swiss legislation that greatly reduced the practical differences between
voting and non-voting shares. Nevertheless, Kunz (2002) reports a significantly
positive abnormal return of non-voting shares of 2.6%.
Our paper makes several contributions to the literature. It is the first paper that
finds a statistically and economically significant abnormal increase in firm value to
the announcement of a stock unification. It is also the first paper that analyzes the
main determinants of these abnormal returns. As the controlling shareholders must
have agreed to the stock unifications analyzed in this paper, we can also estimate an
upper bound of the additional private benefits the controlling shareholder obtained in
8
the past under the dual class structure.7 Moreover, we can at least partially judge the
efficiency of dual class structures. Finally, our paper is – together with independent
work by Pajuste (2004) – the first paper that analyzes the decision to abolish dual
class stock and hence to give up the separation between ownership and control.8
3. Hypothesis development
3.1 Hypotheses on the wealth effect of dual class stock unifications
From the literature reviewed in the previous section, we derive the general
hypothesis that a dual class structure has a negative impact on the market value of the
firm, where the market value is defined as the number of voting shares multiplied by
the market price of voting shares plus the number of non-voting shares multiplied by
the market price of non-voting shares. Note that this market value does not include
private benefits of control. Therefore, this hypothesis does not state that dual class
firms are inefficient; it merely asserts that minority shareholders are better off with a
single class firm.9 We list the potential reasons for the discount at which dual class
firms trade in the form of four hypotheses:
Hypothesis A1 (agency costs): Dual class firms with more entrenched
management trade at a higher discount. We call the management of a firm
‘entrenched’ if (1) they have incentives to extract inefficient private benefits (i.e. the
costs of these private benefits to the firm exceed their value to the management) and
7 If the total market capitalization increases by 4% on the announcement day and the controlling
shareholder held 50% of the voting rights before the stock unification, the value of the additional
private benefits consumed under the dual class structure must have been lower than 2% (=50%*4%) of
the market capitalization. Otherwise the controlling shareholder would not have agreed to the stock
unification. 8 The decision to introduce dual class shares has been studied by Lehn, Netter and Poulsen (1990)
and Mikkelson and Partch (1994). 9 We could also formulate the reverse hypothesis that a dual-class structure is beneficial to minority
shareholders, because it provides better incentives for managers to exert effort, to invest in firm-
specific human capital, or to pursue the firm’s growth opportunities. Under this hypothesis, however, it
is not clear why we should observe any stock unifications. In what follows, we do not derive additional
hypotheses from the potential benefits of dual class shares, because our dataset does not allow testing
them.
9
(2) they are not prevented from such inefficient rent extraction. In a dual class firm,
managers are more entrenched if they control a large proportion of voting rights but
own only a small proportion of the cash flow rights. On the other hand, entrenchment
is potentially mitigated by minority blocks of voting shares, especially if these blocks
are held by institutional investors. Empirical evidence in favor of the agency costs
hypothesis A1 has been presented by Gompers, Ishii and Metrick (2004) who show
that Tobin’s q of U.S. dual class firms tends to increase in the proportion of cash flow
rights held by insiders and to decrease in the proportion of voting rights held by
insiders.
Hypothesis A2 (international investors): International investors avoid dual
class shares, so dual class firms trade at a discount. We hypothesize that
international investors prefer to invest in standardized stock, i.e. in stock of single
class firms. One share-one vote is a straight-forward form of shareholder organization
that does not differ much across countries or firms. In contrast, the potential
characteristics of superior and inferior voting shares vary considerably across
countries and firms. As international investors are unlikely to know all these details,
they simply avoid dual class firms. As a consequence, a dual class firm has a smaller
investor base which results in less efficient risk sharing and therefore lower share
prices (see Merton, 1987).
As international investors only invest in firms they have “heard of,” we conjecture
that the dual class discount is larger for bigger firms and for firms with a large
proportion of foreign sales. An international investor is unlikely to invest in a small,
local firm – independently of its share structure. Also, this discount is likely to be
lower for firms that already have an international block investor.
Hypothesis A3 (liquidity): Dual class firms trade at a discount, because total
liquidity is spread over two classes of shares. Under liquidity aspects, dual class
structures can be regarded as an artificial segmentation of the market for the
company’s stock. When this segmentation is overcome by a stock unification, the
merged market is likely to be more liquid in terms of volume or bid-ask spread.
Higher liquidity leads to higher market values, as shown by Amihud and Mendelsohn
(1986). We will test this hypothesis by considering the abnormal returns to the
announcement of a stock unification separately for each class of shares. According to
this hypothesis, the abnormal return should be higher for a class of shares with low
liquidity that is unified with a class of shares with high liquidity.
10
Hypothesis A4 (index membership): A dual class firm has lower chances to be
included in a major stock index. Therefore, dual class firms trade at a discount.
Two important criteria for a class of shares being included in one of the two major
German indices10 are its market capitalization and its average turnover. A stock
unification improves both measures and therefore improves the probability of being
included in a stock index. Shleifer (1986), Dhillon and Johnson (1991) and Beneish
and Whaley (1996) show that a firm that is added to the S&P 500 enjoys a permanent
price increase of 3 to 4 percent. If a similar index effect is present in Germany, we
expect a larger abnormal return to the announcement of a stock unification for those
firms that are close to being included in or excluded from one of the two major
indices.
There is a sizeable empirical literature which regresses the relative price difference
between voting and non-voting shares on liquidity measures, the firm’s ownership
structure, and other proxies for agency costs (e.g. Smith and Amoako-Adu, 1995, and
Nenova, 2003). Zingales (1995), Rydqvist (1996), and Dittmann (2004) theoretically
show that the price difference depends on the stability of the ruling coalition and on
the private benefits that can be extracted by insiders, but it does not depend on the
costs of the dual class structure. Consequently, this branch of the literature cannot
provide any evidence for or against our hypotheses A1 to A4.
3.2 Hypotheses on the timing of dual class stock unifications
According to the hypotheses formulated in the previous section, dual class firms
trade at a discount in the market, which implies that dual class firms could increase
their market value by abolishing the dual class structure. As a consequence, dual class
structures are not stable in firms with dispersed ownership, because all shareholders
would be better off with a single class structure. In the presence of a price discount for
dual class firms, dual class structures can only be stable when there is a controlling
shareholder. This implication is corroborated by the empirical evidence (see, among
others, DeAngelo and DeAngelo, 1985, Bergström and Rydqvist, 1990, Megginson,
10 The two major German stock indices are the DAX and the MDAX. The DAX contains the largest
30 companies which are traded at the Frankfurt stock exchange. Before 24 March 2003, the MDAX
contained the largest 70 firms not already included in the DAX. Since 24 March 2003, the MDAX
contains only the largest 50 firms not already included in the DAX.
11
1990, and Table 2 in this paper): Dual class firms almost always have a controlling
blockholder.
We argue that the discount at which dual class companies trade is the key reason
for the controlling shareholder to agree to a stock unification. If the controlling
shareholder sells some of her shares or if the firm issues new stock, the price discount
translates into a cost to the controlling shareholder which she can only avoid by
abolishing the dual class structure before such a transaction. On the other hand, as
long as no additional shares are sold to outsiders, there is no reason to give up the
separation between ownership and control. This argument leads to four hypotheses
about the timing of dual class stock unifications.
Hypothesis B1 (entrenchment): Dual class firms with more entrenched
management are less likely to abolish the dual class structure. Recall that we call
managers ‘entrenched’ if (1) they have incentives to extract inefficient private benefits
and (2) they are not prevented from such inefficient rent extraction. Entrenched
managers have more opportunities to extract private benefits of control so the value of
the dual class structure to managers (weakly) increases in the degree of entrenchment.
Hypothesis B2 (growth opportunities): Dual class firms with strong growth
opportunities are more likely to abolish the dual class structure. In order to pursue
its growth opportunities, the firm will have to issue additional equity. In this situation,
the controlling shareholder incurs a significant cost from the dual class structure, as
the company’s shares trade at a discount in the market. There are three possible
actions for the controlling shareholder: When private benefits of control are low, she
will abolish the dual class structure first and then issue additional equity. On the other
hand, if private benefits are high, the controlling shareholder will not agree to a stock
unification. Then she will either decide to issue new equity at a discount or she will
not issue any equity and pass up the growth opportunity. She will pass up the growth
opportunity if the expected growth is small, because then the costs from issuing new
shares at a discount are higher than the benefit from growth. Hence, dual class firms
can be expected to grow at a slower rate than comparable single class firms.
Hypothesis B3 (financing constraints): Financially constrained dual class
firms are more likely to abolish the dual class structure. We call a firm financially
constrained if it has difficulties financing its current operations from retained earnings
or additional debt. Financial constraints can be overcome by issuing additional equity,
but under a dual class structure this incurs additional costs to the firm and its
12
controlling shareholder. Therefore, we hypothesize that financially constrained firms
are more likely to abolish the dual class structure and to issue new equity
subsequently. One reason for financial constraints are positive growth opportunities,
so hypotheses B2 and B3 are closely related. However, firms can also be financially
constrained without having strong growth opportunities, for instance when they are
restructuring their operations.
Hypothesis B4 (cashing out): Dual class firms whose controlling shareholders
want to sell a significant amount of their shares are more likely to abolish the
dual class structure. When controlling shareholders want to sell shares, they will
consider abolishing the dual class structure first and then offering their shares in order
to avoid selling at a discount. This argument only holds if the shares will be sold to
small shareholders or to an institutional investor. When a block of shares is sold to
another non-institutional blockholder, the discount of the share price in the market is
irrelevant. Institutional investors, on the other hand, typically have little incentives to
extract private benefits of control and are interested in a high market valuation of their
investments.
In independent work, Pajuste (2004) presents a logit analysis of the decision to
abolish dual class stock for a sample of dual class firms from seven European
countries including Germany.11 Her evidence mainly corroborates our entrenchment
hypothesis B1. In particular, she finds that firms are more likely to abolish the dual
class structure if the separation between ownership and control is low, if the largest
shareholder is a financial institution, or if the firm is cross listed in the US. Also, the
number of acquisitions has a positive impact on the unification probability. This
finding supports our growth opportunities hypothesis B2. Amoako-Adu and Smith
(2001) list the reasons given by 54 Canadian firms why they consolidated their share
structure from dual to single class equity. These self-reported reasons are in line with
11 Pajuste’s (2004) works with a sample of dual class firms from seven European countries
(including Germany) that is constructed from different data sources than our sample. She considers the
period from 1996 to 2002, while we analyze the years 1990 to 2001. She also includes firms with only
one type of stock listed whereas we restrict our analysis to firms with both types of shares listed.
Finally, her ownership data are from 1996 while we work with annual ownership data. Pajuste (2004)
does not consider announcement effects, which is the main contribution of our paper. Also, our results
on the relevance of the ownership structure for the unification decision nicely complement Pajuste’s
(2004) results.
13
the financing constraint hypothesis B3, the cashing out hypothesis B4 and the
international investor hypothesis A2. Note that Amoako-Adu and Smith (2001) do not
investigate these hypotheses empirically.
4. Dataset and institutional details German law distinguishes between voting and non-voting shares. Shares with
multiple or fractional votes are not permitted and the number of non-voting shares
must not exceed the number of voting shares. Non-voting shares must be vested with
a cumulative minimum dividend, the size of which (typically between 2% and 10% of
the face value) is laid down in the company’s charter. Accordingly, the total dividend
is distributed among the two types of shares in the following order: First, minimum
dividends and arrears on non-voting shares are settled. Then each voting share
receives an amount up to the minimum dividend of non-voting shares. Finally, what
remains is distributed equally among all shares, so that the dividend of a voting share
never exceeds that of a non-voting share. If the minimum dividend is not paid in two
consecutive years, each non-voting share receives a temporary voting right until the
arrears are fully paid. Moreover, a reduction of the minimum dividend or a conversion
of non-voting shares into voting shares can only be declared if – in addition to the
general annual meeting – 75% of non-voting shareholders agree in a separate meeting.
In all other circumstances, only voting shares have the right to vote.
Our dataset is based on the Karlsruher Kapitalmarkt Datenbank (KKMDB), a
scientific database that contains German stock market data from 1960 onwards. Dual
class companies have been identified by their securities’ identification number and
name.12 For the identified 139 firms, we compiled ownership information13, the
12 The first five digits of the six-digit German security identification number identify the firm and
the last digit the type of security. A last digit between 0 and 2 is reserved for classes of common voting
shares, whereas digits of 3 and higher typically identify non-voting shares and other securities (like
participation certificates or options). We searched for pairs of stock with the same first five digits and
at least one last digit of 3 or higher. Then we analyzed the names of these securities in order to
eliminate all pairs that obviously were not shares of a dual class firm. 13 Before 1995, German disclosure laws required that share holdings of 25% or more must be
published. From 1995 onwards, all voting blocks of at least 5% are to be reported. Consequently, our
ownership data are comparatively imprecise before 1995. Note, however, that for only 5% of our
observations before 1995 the size of the largest blockholding is not reported (and therefore set equal to
14
number of outstanding shares and charter provisions regarding voting power and
dividend differences from Handbuch der deutschen Aktiengesellschaften, the German
equivalent of Moody’s Manual. We excluded firms for which (1) we could not obtain
stock market data for both shares on at least 60 days (22 firms), (2) both types of
shares carry voting rights14 (8 firms), (3) we could not find any information on the
voting arrangement (4 firms), (4) the two types of shares differed in their
transferability15 (2 firms), or (5) there was a maximum dividend for non-voting shares
(2 firms). We also excluded one company that unified its dual class structure twice
within eight years only to issue new non-voting shares a few weeks later both times.
No other company introduced new non-voting shares after unifying its dual class
structure. We obtained price, volume, and dividend series as well as information on
seasoned equity offerings from KKMDB. Accounting data were extracted from the
Worldscope database.
If one of the two types of shares of a company ceased to trade before December
2001, we searched the leading German business papers Handelsblatt, Börsenzeitung,
and Frankfurter Allgemeine Zeitung for the reason of the discontinuation and its first
announcement. Since this search was often not successful for discontinuations that
took place before 1990 and since we could identify only three stock unifications
before 1990, we focus on the period from January 1990 to December 2001 in our logit
analysis. For this period, we could identify the reasons of all discontinuations. We
dropped another 11 firms from our sample, because we do not have market data on
both types of shares for any year after 1990. Our final dataset contains 89 dual class
companies and 814 firm-year observations. For 42 of these companies, one or both
zero). Our results do not change when we drop these observations from our dataset. Nevertheless,
information on smaller blocks must be considered unreliable before 1995. We address this problem by
using year dummies and by repeating our analysis for the subsample from 1995 to 2001. In our event
study sample, we verify our ownership data using newspaper articles, so that the data reflect the
situation immediately before the unification announcement. In this sample, we always have information
on the largest voting block. 14 In German, non-voting shares are – rather euphemistically – called preference shares as they are
entitled to a minimum (or preferred) dividend. The preference shares of eight firms were voting shares. 15 For these firms, voting shares must be registered with the firm, and the firm may refuse to register
shareholders. Non-voting shares are bearer shares. We exclude these firms, because in a stock
unification registered voting shares and bearer non-voting shares are exchanged for bearer voting
shares. Hence a stock unification also improves the transferability of voting shares.
15
types of shares ceased to trade during our observation period. We classify 32 of these
discontinuations as stock unifications: One company bought back its non-voting
shares, and 31 companies converted each non-voting share into one voting share. In
one of these 31 conversions, non-voting shareholders had to make an additional
payment, and in eight cases there were outstanding past minimum dividends that were
not paid before the conversion. The remaining 10 discontinuations were due to
bankruptcy (1), mergers (8), or tender offers (1).
Figure 1 displays the frequency of stock unifications for each year in our sample.
In 1990, 1991 and 1994, there were no stock unifications and, before 1996, the
frequency never exceeded 3%. In contrast, the frequency of stock unifications was
always above 6% after 1997 with a peak of over 10% in 2000. There are a number of
reasons for the growing popularity of stock unifications in the mid 1990s. First, during
the 1990s, the German stock market became more internationally oriented. Firms
were concerned about the attractiveness of their capital structure to international
investors and dual class shares were generally seen as an impediment for international
investments. In addition, in August 2000, Deutsche Börse announced a change of the
rules that determine which companies are included in the major German stock indices.
After the change had taken effect in June 2002, companies were ranked according to
the free float of their most liquid class of stock – and not anymore according to their
total market capitalization. Hence, some companies unified their dual class shares in
order to stay in an index or to increase the probability to be included in an index.
Table 1 summarizes the reasons for the stock unification given by the firms at the time
of the announcement. Firms most frequently claim to unify in order to improve
liquidity, to become more attractive for international investors, or to secure their index
membership.
We consider 21 variables in order to explain timing and wealth effects of dual class
stock unifications. A detailed description of all variables can be found in Appendix A;
Table 2 displays a brief description and summary statistics. Table 2A contains those
variables that describe the ownership structure and the market environment of the
firms in our sample. The overall frequency of stock unifications (Conversion) is 4.1%.
The largest block of voting shares (BSize1) is, on average, 55.6% and the second-
largest block of voting shares (BSize2) is 7.2%. 69% of the firms have no institutional
investor (NoInstInv) and 85% no international investor (NoInterInv) among their
reported blockholders. The proportion of voting shares (PropVS) varies from 50% to
16
97% and averages 69%. The market capitalization (MCap) varies between € 0.3m and
€ 61bn with an average of € 1.5bn. Finally note that the firms in our sample issued
additional shares (SEO) every eighth year on average. Dual class firms perform an
SEO significantly more often than single class firms which issue additional shares
every 12 years. The reason for this difference presumably is the guaranteed minimum
dividend on non-voting shares which forces dual class firms to pay out more
dividends than single class firms.
Table 2B contains the summary statistics for ten variables that are based on
accounting data. Here and in the following analysis, we exclude financial firms (i.e.
firms whose SIC code starts with ‘6’) whenever we use these accounting variables,
because accounting data are generally not comparable between financial and non-
financial firms. As proxies for growth opportunities, we use Tobin’s q, investment
scaled by total assets and sales growth. Proxies for financial constraints are dividends,
cash flows, cash, and increase in total debt (all scaled by total assets), as well as
leverage and the payout ratio.
5. Market reaction to the announcement of a stock unification
This section presents the results of an event study for 29 German firms that
announced a stock unification between 1989 and 2002 and actually performed a stock
unification thereafter. To our knowledge there was never an announcement of a stock
unification that was not completed. In order to increase the number of firms in the
event study, we consider a slightly larger time period than in the logit dataset and
include five firms in addition to the 32 stock unifications described in the previous
section.16 We then exclude eight of these 37 firms for the following reasons. For two
firms, we could not find the date of the first announcement in the business press; three
firms simultaneously announced other important events like a merger, a major
16 We include one firm (Massa) that announced a stock unification in 1989 and three firms (Escada,
Heidelberger Zement, MAN) that announced a unification during the first eight months of 2002. We
did not include 1989 and 2002 in the logit dataset, because there was only a single stock unification in
1989 and we could not obtain the 2002 data for all firms at the time we constructed the dataset. The
fifth additional firm is Sixt which we dropped from the logit dataset, because they introduced new non-
voting shares two months after they unified their share structure.
17
restructuring program or an immediate trading halt; two firms continued to have two
types of shares with equal voting right but different registration requirements17; and
one firm had more than 64% missing return observations in the estimation window
and the event window.18
According to German law, non-voting shares can be converted one-to-one into
voting shares if – in addition to the general annual meeting – 75% of non-voting
shareholders agree in a separate meeting. Then the dual class structure is immediately
abandoned. Alternatives are to repurchase non-voting shares in the market, or to offer
non-voting shareholders to exchange each non-voting share plus a fixed cash payment
for one voting share. In both cases, non-voting shareholders cannot be forced to
participate in the conversion, so that the dual class structure – at least formally –
continues to exist.19 Presumably, this is the reason why one-to-one conversions are
much more popular in Germany than in Israel (see Hauser and Lauterbach, 2004).
Table 3 provides a list of the 29 companies in our event study. It shows the
company name, the date of the first announcement, the terms of conversion, and
additional announcements made on the same day. The typical terms of conversion are
that each non-voting share is converted into one voting share without any additional
payment or any compensation to old voting shareholders. Column 3 of Table 3 shows
the deviations from this general rule. In five cases, outstanding minimum dividends
were not paid. In two cases, non-voting shareholders had to make an additional
payment equal to two thirds of the previous price difference between voting and non-
voting shares. One company announced to buy back non-voting shares for 80% of the
price of voting shares. As some companies announced other events like a stock split,
an SEO, or an extra dividend, we separately analyze a group of 13 firms that
exclusively announced a stock unification and that did not require an additional
17 These firms initially had non-voting shares, unregistered voting shares, and registered voting
shares. They announced the conversion of non-voting shares into unregistered voting shares. 18 All remaining firms have less than 8% missing values in either window. 19 MAN, for example, announced an exchange offer for non-voting shareholders in March 2002.
During a period of six weeks, each non-voting share could be exchanged for one voting share for an
additional payment of €3.30, which corresponds to two thirds of the average price difference between
voting and non-voting shares during the previous three months. 86.2% of all non-voting shares were
exchanged at these terms, so that the proportion of voting shares increased from 72% to 96%. In June
2004, non-voting shares were still listed on the Frankfurt stock exchange.
18
payment from non-voting shareholders. The names of these companies are printed in
bold letters in Table 3.
We use a 41 day event window and a 200 day estimation window from trading day
–220 to –21 relative to the announcement date. We estimate a market model using the
full Frankfurt market portfolio (DAFOX) provided by KKMDB. Figure 2 shows the
average cumulative abnormal returns (CAR) for voting shares, non-voting shares and
the total market capitalization of the 29 firms in our sample. Figure 3 displays the
corresponding plot for the 13 firms with “clean” announcements. Both plots suggest
that there was a run-up for voting and non-voting shares to a CAR between 6% and
10% on day –1. On the announcement day, non-voting shares experience an
additional abnormal return of 3% in the full sample and 2.5% in the ‘clean’ sub-
sample, while there is no distinct reaction for voting shares. In the full sample, the
CAR declines gradually over the remaining event window for both shares. In the
‘clean’ sub-sample, however, the CAR fluctuates around its day 1 value over the
remaining days of the event window.
Table 4 displays the results of three tests for zero abnormal return around the
announcement date. The Standard Test is the most popular parametric test in event
study analysis.20 Cowan and Sergeant (1996) show in a simulation study that the
Standard Test rejects the null hypothesis too often in two situations: (1) if the
announcement has an impact not only on the mean but also on the variance of the
abnormal returns, and (2) if the shares under consideration are thinly traded. As some
of the companies in our sample are very small, we are particularly worried about the
thin trading bias and therefore also report the results of two non-parametric tests: the
Corrado (1989) Rank Test and the Generalized Sign Test proposed by Corrado and
Zivney (1992). In Cowan and Sergeant’s (1996) simulation study, these two tests
turned out to be robust to thin trading and to changes in the return variance.
Panel A of Table 4 shows that the reaction of non-voting shares is significantly
positive according to all three tests. The abnormal returns of voting shares (shown in
Panel B) are also positive but smaller than the abnormal returns of non-voting
20 Campbell, Lo and MacKinlay (1997) describe this test (‘J2’) on p. 162. Cowan and Sergeant
(1996) call it ‘Patell test’.
19
shares.21 In both samples, the generalized sign test cannot reject the null hypothesis of
zero abnormal returns for voting shares. In contrast, the Corrado rank test finds a
significant abnormal reaction in the full sample but not in the ‘clean’ sub-sample. The
standard test rejects the null hypothesis in both samples. We conclude that there is
some evidence that voting shares experience a positive abnormal announcement
return. Finally, Panel C displays that the reaction of the full market capitalization (i.e.
the weighted sum of the reactions of voting and non-voting shares) is again
significantly positive in both samples according to all three tests. Across the three
windows and the two samples, estimates for the average increase of the firms’ market
value vary between 3.3% and 6.3%.
Altogether, Table 4 corroborates our general hypothesis that dual class firms trade
at a discount in the stock market. In order to learn about the reasons why this is the
case, we present univariate regressions of the cumulative abnormal return (CAR) in
Table 5. Panel A displays the results for the [-4, 1] window, Panel B for the [-10, 10]
window. We do not perform multivariate regressions as the sample size (29 firms)
appears to be too small.
The table shows that the size of the largest block of voting shares, BSize1, has a
significant positive effect on the CAR, whereas the second largest block, BSize2, is
insignificant. Given the two results on BSize1 and BSize2, it is not surprising that the
proportion of voting shares not contained in the reported blocks, Freefloat, has a
significantly negative impact on the cumulative abnormal returns. It is interesting to
note, however, that this impact is larger and considerably more significant than the
effect of BSize. Also, the variable Freefloat explains 32% of the variation in abnormal
market returns over the [-4, 1] window compared to only 19% that is explained by the
largest block size BSize. This result suggests that smaller blockholders do not prevent
the largest blockholder from extracting private benefits (then Freefloat should have
less explanatory power than BSize), but rather enter into a coalition with the largest
blockholder in order to share private benefits. The effect of Freefloat is also
economically significant: A decrease of the free float by five percentage points will
lead to an average increase of the abnormal announcement return by one percentage
21 The difference in the abnormal returns of voting and non-voting shares is statistically significant
at the 5% level in the full sample. In the ‘clean’ sub-sample, the difference is insignificant. These
results are not shown in the tables.
20
point. Therefore, the agency costs hypothesis A1 is clearly corroborated by the data.
We also find weak evidence that the presence of an institutional investor results in a
lower abnormal return as predicted by this hypothesis. In contrast the proportion of
voting shares (PropVS) is insignificant.22
Our results from Table 5 do not support the international investors hypothesis A2.
Neither the presence of an international investor, nor the size of the firm have a
significant effect on the cumulative abnormal returns. The percentage of foreign sales
has a highly significant negative effect on the CAR over the [-4, 1] window, but this
effect is not robust as demonstrated in Panel B for the [-10, 10] window. According to
the index membership hypothesis A4, firms that are close to be included in or
excluded from an index (i.e. for which IndexDistance is small) should enjoy a larger
cumulative abnormal return. The sign of IndexDistance is indeed negative as
expected, but this variable is only marginally significant for the [-4, 1] window and
insignificant for the [-10, 10] window.23
The liquidity hypothesis A3 implies that the abnormal return of a particular class of
shares should be higher if this class of shares has low liquidity and if it is unified with
a more liquid class of shares. In order to check this implication, we regress the voting
CARs on the trading volume of voting shares and on the trading volume of non-voting
shares.24 The results are reported in the upper part of Table 6. The signs of the
estimated coefficients are indeed as expected but none of the coefficients is
significantly different from zero. The lower part of Table 6 shows the results of two
similar regressions of the non-voting CARs. For the [-4; 1] window, we find that the
cumulative abnormal return is significantly higher for less liquid non-voting shares.
However, the same coefficient is insignificant for the [-10; 10] window.
22 We also considered additional dummy variables that indicate whether the largest blockholder is
an institution, an individual (or a family), or the state. These variables remain insignificant in all
regressions, so we do not report these results. 23 One could also argue that the positive abnormal returns might be due to changes in future growth
expectations. It is difficult, however, to find proxies for changes in growth expectations. The only
evidence we can provide on this issue is that the incidence of a future SEO (as measured by our
variable SEO) is not significantly correlated with abnormal returns. In addition, this growth expectation
hypothesis cannot explain the influence of the ownership structure on abnormal returns. 24 Our data source does not contain bid or ask prices, so we cannot use bid-ask spreads.
21
6. Empirical analysis of the timing of stock unifications
In this section, we turn to the question why and when the controlling shareholder
agrees to a stock unification. We first consider only those firms that did announce a
stock unification during our sample period. Table 7 displays the average value of 17
firm characteristics for each of the five years from two years before to two years after
the announcement. The average size of the largest block of voting shares decreases
monotonically and significantly from 54% two years before the announcement to 41%
two years after the announcement. Figure 4 demonstrates that the gradual decline of
BSize1 already starts four years before the announcement of a stock unification.25
However, the average proportion of cash flow rights held by the largest blockholder
increases from year 0 to year 1 as some controlling shareholders buy additional shares
around the unification time in order to secure control. This refutes the cashing out
hypothesis B4; controlling shareholders do not disinvest after the stock unification.
Figure 4 also displays the proportion of non-voting shares held by the controlling
shareholder. There is a slight increase from 3.7% to 5.4% during the year before the
announcement of a stock unification, but this increase in not significant. Hence, we do
not find any evidence for Bigelli’s (2004) hypothesis that the controlling shareholder
buys non-voting shares prior to the announcement in order to benefit from the dual
class unification.26
Apart from the change in BSize1, the ownership structure of the firms that
abolished dual class shares does not change significantly as Table 7 shows. The
incidence of a seasoned equity offering (SEO) is higher in years 0 and 1 than in years
–1 and +2. Even though these changes are not significant, they suggest that dual class
25 There is no general decrease in BSize1 over time, neither in the full sample nor in the sample of
dual class firms that never unified. On the contrary, BSize1 increases from an average 55% in 1995 to
60% in 2001 in the full sample. 26 In the business press, we found only one report of a controlling shareholder who bought
additional non-voting shares prior to the announcement of a stock unification. The reported motivation
was to secure a majority of the voting rights rather than to make a trading gain from buying non-voting
shares at a lower price. Note however that, according to German disclosure laws, blocks of non-voting
shares need not be reported.
22
firms choose to unify before they issue new shares.27 Our proxies for growth
opportunities (TobinsQ, Investment, and SalesGrowth) suggest that unifying firms
grow faster before the unification (–2 to 0) than after the unification (+1 and +2), even
though the individual changes are not significant. Finally, the payout ratio (PayoutR)
rises significantly from 13% two years before to 24% two years after the unification.
However, the other proxies for financing constraints do not indicate that a stock
unification helps to relax financing constraints.
The next step in our analysis is to compare firms that abolished their dual class
structure during our sample period with those firms that did not give up dual class
shares. Table 8 displays the means of the 20 variables in our analysis for the two
groups. Most characteristics do not vary across the two subsets. At the 5%
significance level, only the dummy NoDiv2 – which signals that no dividends have
been paid on non-voting shares during the last two years – is significantly higher for
firms that abolish dual class shares.28 This finding can be interpreted as evidence for
our financial constraints hypothesis B3. Note, however, that in years in which NoDiv2
= 1, non-voting shares have the right to vote until the unpaid minimum dividends are
paid. Hence, this variable could also signal lower management entrenchment and
therefore be interpreted as evidence for the entrenchment hypothesis B1.
At the 10% significance level, the seasoned equity offering dummy SEO is
significantly higher for firms that abolish dual class shares than for those that do not.
We interpret this finding as evidence for the growth opportunities hypothesis B2,
because an SEO clearly signals future growth. This interpretation is consistent with
the results for the other three proxies for growth opportunities (TobinsQ, Investment
and SalesGrowth), although none of these differences are statistically significant.
We now turn from comparing firms with and without stock unification to
comparing firm-years with and without stock unification, i.e. we also consider the
within-firm variation in addition to the between-firm variation. Table 9 shows that the
size of the largest voting block BSize1 is significantly smaller in unification years than
27 There are eight firm-years in our dataset, in which the firm announced a stock unification and
issued new equity. In all cases, the equity was issued after the unification announcement. 28 We also considered dummy variables that signal ‘no dividends on non-voting shares in the
current year’ or ‘no dividends on voting shares’. The empirical results are very similar for these
variables. The reason is that these dummies are highly correlated, because voting shares cannot receive
dividends when non-voting shares do not receive any.
23
in other years. Also, the proportion of voting shares PropVS is significantly higher for
firm-years in which a unification is announced. This implies that, on average, dual
class firms repurchase non-voting shares before they announce a stock unification.
Both results corroborate the entrenchment hypothesis B1.
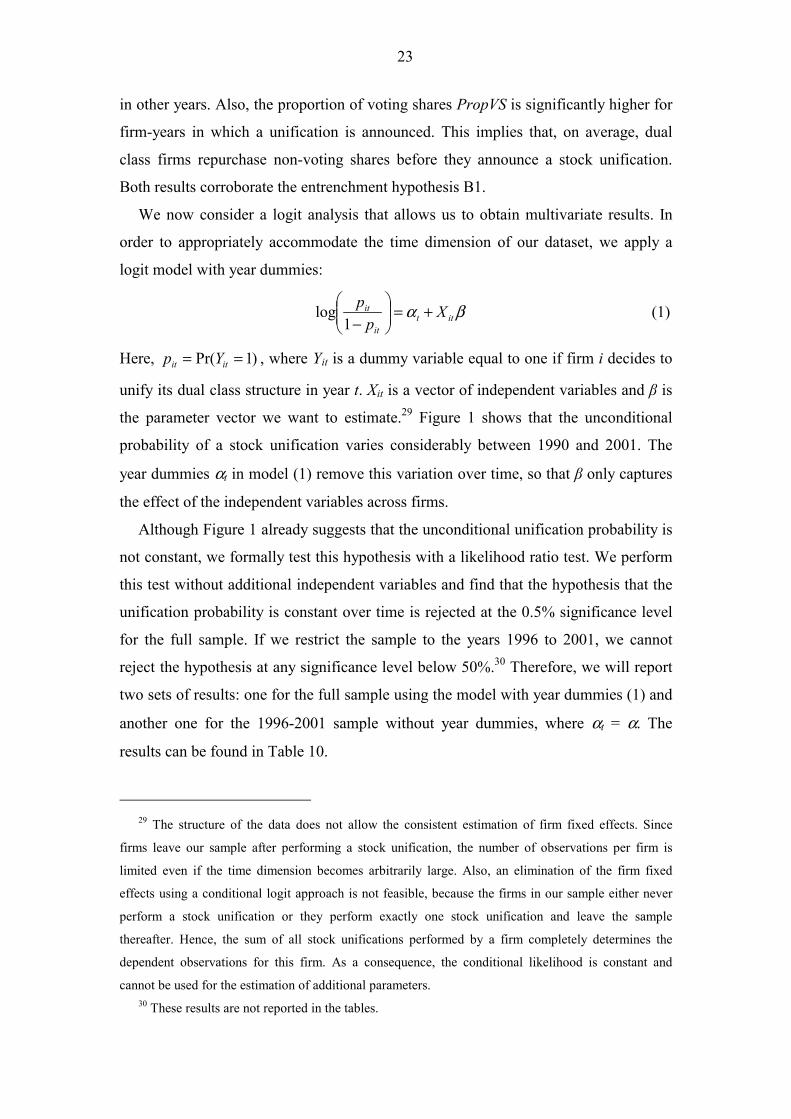
We now consider a logit analysis that allows us to obtain multivariate results. In
order to appropriately accommodate the time dimension of our dataset, we apply a
logit model with year dummies:
βα ittit
it Xp
p +=
−1
log (1)
Here, )1Pr( == itit Yp , where Yit is a dummy variable equal to one if firm i decides to
unify its dual class structure in year t. Xit is a vector of independent variables and β is
the parameter vector we want to estimate.29 Figure 1 shows that the unconditional
probability of a stock unification varies considerably between 1990 and 2001. The
year dummies αt in model (1) remove this variation over time, so that β only captures
the effect of the independent variables across firms.
Although Figure 1 already suggests that the unconditional unification probability is
not constant, we formally test this hypothesis with a likelihood ratio test. We perform
this test without additional independent variables and find that the hypothesis that the
unification probability is constant over time is rejected at the 0.5% significance level
for the full sample. If we restrict the sample to the years 1996 to 2001, we cannot
reject the hypothesis at any significance level below 50%.30 Therefore, we will report
two sets of results: one for the full sample using the model with year dummies (1) and
another one for the 1996-2001 sample without year dummies, where αt = α. The
results can be found in Table 10.
29 The structure of the data does not allow the consistent estimation of firm fixed effects. Since
firms leave our sample after performing a stock unification, the number of observations per firm is
limited even if the time dimension becomes arbitrarily large. Also, an elimination of the firm fixed
effects using a conditional logit approach is not feasible, because the firms in our sample either never
perform a stock unification or they perform exactly one stock unification and leave the sample
thereafter. Hence, the sum of all stock unifications performed by a firm completely determines the
dependent observations for this firm. As a consequence, the conditional likelihood is constant and
cannot be used for the estimation of additional parameters. 30 These results are not reported in the tables.
24
The table shows that the proportion of voting shares PropVS is highly significant in
the univariate logit regression (model 2) but becomes insignificant in the multivariate
regressions (model 4). On the other hand, BSize1 and NoDiv2 remain significant and
can explain a considerable fraction of the variation in the sample. We do not include
SEO in the logit regression, because firms are likely to decide simultaneously on a
stock unification and an SEO, so that the SEO dummy is not exogenous in regressions
of the unification decision. In linear instrumental variables regressions where we use
all remaining variables listed in Table 2 as instruments (results not shown in the
tables), SEO has no significant influence on the unification decision.31 We conclude
from Table 10 that firms with less entrenched management and financially
constrained firms are more likely to abolish dual class shares.
31 We also analyzed the two decisions jointly in an unordered logit model. The only additional
insight of this exercise is that firms are more likely to perform an SEO when leverage is high. We
therefore do not report these results in the tables.
25
7. Conclusions and further notes In this paper, we empirically study the costs of separating ownership and control
and the reasons for giving up this separation. We use a panel dataset of 89 German
dual class firms over a time period of 12 years and show in an event study that
abolishing the dual class structure results in a 4% abnormal increase in total market
capitalization. The average abnormal announcement return for non-voting shares
(approx. 10%) is markedly higher than for voting shares (approx. 3%). In regressions
of the cumulative abnormal returns, we find strong support for the agency cost
hypothesis A1 that firms with more entrenched management trade at a higher discount
in the stock market, as the announcement return is significantly positively related to
the size of the largest block of voting shares and negatively related to the proportion
of shares in the free float. We also find weak evidence in favor of the liquidity
hypothesis A3 and of the index membership hypothesis A4. Compared to agency
costs, however, liquidity and index membership appear to be second order effects. We
do not find any evidence for hypothesis A2 that international investors avoid dual
class firms.
The second part of the paper analyzes the decision to abolish dual class shares. We
find substantial evidence for our argument that firms with more entrenched
management are less likely and that firms in need of additional equity capital are more
likely to consolidate their share structure from dual to single class equity. We find no
evidence, however, that the controlling shareholder opts for a stock unification
because she wants to divest her investment. On the contrary, the average controlling
shareholder invests additional money in the firm at the time of the stock unification in
order to secure control.
The fact that our logit analysis can identify a number of determinants of stock
unifications suggests that the market should – at least to some extent – anticipate
stock unification announcements. In our sample of 29 firms that announce a stock
unification we find indeed clear evidence for such an anticipation: The spread at
which non-voting shares trade relative to voting shares declines on average by 44%
from two years before the unification announcement to four weeks before the
announcement. Therefore, the 4% abnormal increase in firm value should be regarded
a conservative estimate of the net costs of the dual class structure for these firms.
26
Our event study yields that non-voting shares enjoy a significantly higher abnormal
return to the unification announcement than voting shares. This result raises the
question why voting shareholders give away so much value to non-voting
shareholders. Why doesn’t the firm buy back the non-voting shares instead of
converting them into voting shares? This question implicitly assumes that non-voting
shares can be bought by the company at a price equal to or slightly above their pre-
announcement price. Whether this assumption is reasonable critically depends on
what happens to the remaining non-voting shareholders who are not willing to sell
their shares. There are three possible scenarios. First, if the remaining non-voting
shareholders can be forced to sell, a buy-back might indeed be cheaper than a stock
unification. In Germany this is not feasible, except if the corporate charter explicitly
allows it.32 Even if this is the case, German courts might prevent a forced buy-back
because of a violation of the principle of proportionality. Alternatively, the remaining
non-voting shares continue to exist. In this case, a buy-back is cheaper than a stock
unification, but the original aim to simplify the capital structure and to abandon non-
voting shares is not achieved.33 Finally, the company can convert the remaining non-
voting shares into voting shares. If non-voting shareholders correctly anticipate this,
they will not be willing to sell their shares for the pre-announcement price. In fact,
there is little difference between a buy-back with subsequent stock unification and a
straight stock unification right away. Hence, a buy-back is not a cheaper alternative to
a stock unification as it may seem to be at first glance.
32 Such a rule must be laid down in the corporate charter before the first offering of non-voting
shares. Typically, corporate charters of German dual class firms do not include such a rule. 33 In fact, this is the case for the only buy-back in our sample: RWE AG announced a buy-back on
June 25, 1999. Two and a half years later, only 53% of the non-voting shares have been bought back by
the company. In June 2004, RWE non-voting shares were still listed and traded on the Frankfurt stock
exchange.
27
Appendix: Description of variables All variables are compiled for the year Y under consideration if not stated differently.
For years in which a firm announced a stock unification, we made sure that the
ownership variables reflect the situation before the announcement date.
Conversion is a dummy variable that is set equal to one for those years in which the
firm announced a dual class unification. In all cases, the unification was completed in
the same calendar year.
BSize1 is the largest block of voting shares expressed as a percentage of all
outstanding voting shares. Separate stakes that were obviously or reportedly held by
members of one family were counted as one block.
BSize2 is the second-largest block of voting shares.
Freefloat is equal to one minus the sum of all blocks of voting shares reported in
Handbuch der deutschen Aktiengesellschaften.
NoInstInv is a dummy variable that is set equal to one for those years in which none
of the voting blockholders was an institutional investor. We counted neither the state
nor specialized holdings that were founded only to invest in the considered company
as an institutional investor.
NoInterInv is a dummy variable that is set equal to one for those years in which all
voting blockholders were German individuals or German firms.
PropVS is the number of voting shares divided by the number of voting and non-
voting shares.
MCap is the market capitalization in million euro at the end of June of year Y–1.
logMCap is the natural logarithm of MCap.
IndexDistance is the natural logarithm of the distance to the smallest constituent of
the next index in terms of market capitalization. More precisely, it is defined as
{ }( )MDAXiDAXi MCAPMCAPMCAPMCAP −− ,minln , where MCAPDAX is the market
capitalization of the smallest firm in the DAX index, MCAPMDAX is the market
capitalization of the smallest firm in the MDAX index, and MCAPi is the market
capitalization (Worldscope code 08001) of the considered firm i. All inputs are from
year Y-1.
SEO is a dummy variable that is set equal to one for those years in which the firm
issued new shares in a seasoned equity offering.

28
TobinsQ is total assets (02999) plus market capitalization (MCap) minus book equity
(03501) scaled by total assets. All inputs are from year Y-1.
Investment is capital expenditure (04601) of year Y-1 scaled by total assets of year
Y-2.
SalesGrowth is sales (01001) of year Y-1 divided by sales of year Y-2 minus one.
Dividends is dividends (04551) of year Y-1 scaled by total assets of year Y-2.
NoDiv2 is a dummy variable that is set equal to one for those years in which the firm
did not pay dividends on non-voting shares for at least two consecutive years (years Y
and Y-1). In this situation, non-voting shares carry a voting right until the arrears are
fully settled. NoDiv2 is calculated from KKMDB data.
Cashflow is the free cash flow of year Y-1 scaled by total assets of year Y-2. Free
cash flow is EBITDA (18198) minus taxes (01451) minus capital expenditure
(04601).
Cash is cash and short-term investments (02001) of year Y-1 scaled by total assets of
year Y-1.
DebtChange is total debt (03255) of year Y-1 minus total debt of year Y-2 scaled by
total assets of year Y-2.
Leverage is total debt (03255) divided by the sum of total debt and book equity
(03501). All inputs are from year Y-1.
PayoutR Payout ratio is the quotient of dividends (04551) plus stock repurchases
(04751) on the one hand and EBITDA (18198) minus interest (01251) minus taxes
(01451) on the other hand. All inputs are from year Y-1.
ForeignSales is international sales (07151) divided by net sales (01001). All inputs
are from year Y-1.
29
References Aghion, Philippe and Jean Tirole (1997): “Formal and real authority in
organizations”, Journal of Political Economy 105, 1-29.
Amihud, Yakov and Haim Mendelson (1986): “Asset pricing and the bid-ask spread”, Journal of Financial Economics 17, 223-249.
Amoako-Adu, Ben and Brian F. Smith (2001): “Dual class firms: Capitalization, ownership structure and recapitalization back into single class”, Journal of Banking and Finance 25, 1083-1111.
Ang, James S. and William L. Megginson (1989): “Restricted voting shares, ownership structure, and the market value of dual-class firms”, Journal of Financial Research 12, 301-318.
Attari, Mukarram and Suman Banerjee (2003): “Strategic underinvestment, managerial entrenchment and ownership structure of a firm”, discussion paper, University of Wisconsin.
Barclay, Michael J. and Clifford G. Holderness (1989): “Private benefits from control of public corporations”, Journal of Financial Economics 25, 371-395.
Bebchuk, Lucian Arye (1999): “A rent-protection theory of corporate ownership and control”, NBER working paper 7203.
Beck, Nathaniel, Jonathan N. Katz and Richard Tucker (1998): “Taking time seriously: Time-series-cross-section analysis with a binary dependent variable”, American Journal of Political Science 42, 1260-1288.
Beneish, Messod D. and Robert E. Whaley (1996): “An anatomy of the “S&P Game”: The effects of changing the rules”, Journal of Finance 51, 1909-1930.
Bergström, Clas and Kristian Rydqvist (1990): “Ownership of equity in dual-class firms”, Journal of Banking and Finance 14, 255-269.
Bigelli, Marco (2004): “Dual class stock unifications and shareholders’ expropriation”, discussion paper, University of Bologna.
Blair, Douglas H., Devra L. Golbe and James M. Gerard (1989): “Unbundling the voting rights and profit claims of common shares”, Journal of Political Economy 97, 420-443.
Burkart, Mike, Denis Gromb and Fausto Panunzi (1998): “Why higher takeover premia protect minority shareholders”, Journal of Political Economy 106, 172-204.
Campbell, John Y., Andrew W. Lo and A. Craig MacKinlay (1997): The Econometrics of Financial Markets, Princeton University Press, Princeton New Jersey.
Corrado, Charles J. (1989): “A nonparametric test for abnormal security-price performance in event studies”, Journal of Financial Economics 23, 385-395.
Corrado, Charles J. and Terry L. Zivney (1992): “The specification and power of the sign test in event study hypothesis tests using daily stock returns”, Journal of Financial and Quantitative Analysis 27, 465-478.
30
Cowan, Arnold R. and Anne M.A. Sergeant (1996): “Trading frequency and event study test specification”, Journal of Banking and Finance 20, 1731-1757.
DeAngelo, Harry and Linda DeAngelo (1985): “Managerial ownership of voting rights: A study of public corporations with dual classes of common stock”, Journal of Financial Economics 14, 33-69.
Dhillon, Upinder and Herb Johnson (1991): “Changes in the Standard and Poor’s 500 list”, Journal of Business 64, 75-85.
Denis, David J. and Diane K. Denis (1994): “Majority owner-managers and organizational efficiency”, Journal of Corporate Finance 1, 91-118.
Dittmann, Ingolf (2003): “Measuring private benefits of control from the returns of voting and non-voting shares”, discussion paper, Humboldt University, Berlin.
Dittmann, Ingolf (2004): “Block trading, ownership structure, and the value of corporate votes”, discussion paper, Humboldt-University, Berlin
Doidge, Craig (2003): “U.S. cross-listings and the private benefits of control: Evidence from dual class firms”, discussion paper, University of Toronto.
Dyck, Alexander and Luigi Zingales (2002): “Private benefits of control: An international comparison”, discussion paper, Harvard Business School.
Gomes, Armando (2000): “Going public without governance: Managerial reputation effects”, Journal of Finance 55, 615-646.
Gompers, Paul, Joy Ishii and Andrew Metrick (2004): “Incentives vs. control: An analysis of U.S. dual-class companies”, NBER working paper.
Grossman, Sanford J. and Oliver D. Hart (1988): “One share-one vote and the market for corporate control”, Journal of Financial Economics 20, 175-202.
Harris, Milton and Artur Raviv (1988): “Corporate governance: Voting rights and majority rules”, Journal of Financial Economics 20, 203-235.
Hauser, Shmuel and Beni Lauterbach (2004): “The value of voting rights to majority shareholders: Evidence from dual class stock unifications”, ECGI discussion paper.
Jarrell, Gregg A. and Annette B. Poulsen (1988): “Dual-class recapitalizations as antitakeover mechanisms: The recent evidence”, Journal of Financial Economics 20, 129-152.
Kunz, Roger M. (2002): “Simplification of equity capital structure and market value”, Financial Markets and Portfolio Management 16, 30-52.
La Porta, Rafael, Florencio Lopez-de-Silanes, Andrei Shleifer and Robert W. Vishny (1998): “Law and finance”, Journal of Political Economy 106, 1113-1155.
Lehn, Kenneth, Jeffry Netter and Annette Poulsen (1990): “Consolidating corporate control: Dual-class recapitalizations versus leveraged buyouts”, Journal of Financial Economics 27, 557-580.
Merton, Robert C. (1987): “A simple model of capital market equilibrium with incomplete information”, Journal of Finance 42, 483-510.
Megginson, William L. (1990): “Restricted voting stock, acquisition premiums, and the market value of corporate control”, Financial Review 25, 175-198.
31
Mikkelson, Wayne H. and M. Megan Partch (1994): “The consequences of unbundling managers’ voting rights and equity claims”, Journal of Corporate Finance 1, 175-199.
Nenova, Tatiana (2003): “The value of corporate voting rights and control: A cross-country analysis”, Journal of Financial Economics 68, 325-351.
Pajuste, Anete (2004): “What drives the unification of multiple voting class shares?”, discussion paper, Stockholm School of Economics.
Partch, M. Megan (1987): “The creation of a class of limited voting common stock and shareholder wealth”, Journal of Financial Economics 18, 313-339.
Rydqvist, Kristian (1996): “Takeover bids and the relative prices of shares that differ in their voting rights”, Journal of Banking and Finance 20, 1407-1425.
Shleifer, Andrei (1986): “Do demand curves for stocks slope down?”, Journal of Finance 41, 579-590.
Smart, Scott B. and Chad J. Zutter (2003): “Control as a motivation for underpricing: a comparison of dual and single-class IPOs”, Journal of Financial Economics 69, 85-110.
Smith, Brian F. and Ben Amoako-Adu (1995): “Relative prices of dual class shares”, Journal of Financial and Quantitative Analysis 30, 223-238.
Zingales, Luigi (1995): “What determines the value of corporate votes?”, Quarterly Journal of Economics 110, 1047-1073.
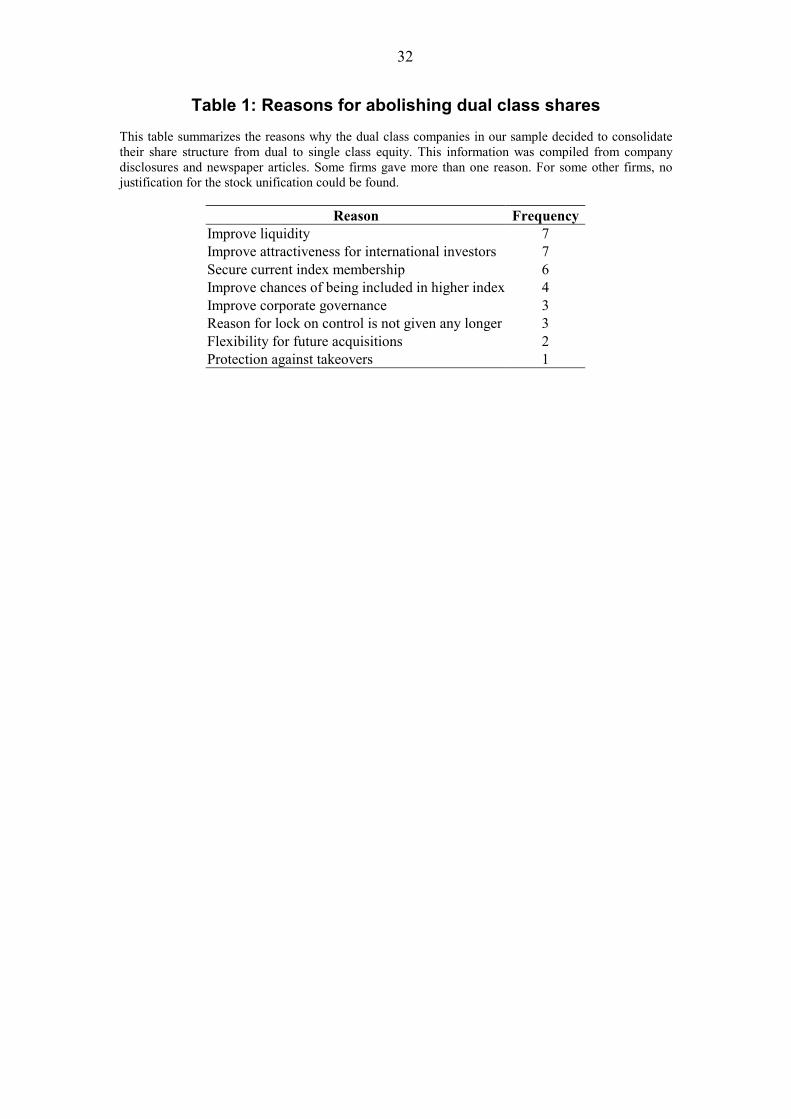
32
Table 1: Reasons for abolishing dual class shares This table summarizes the reasons why the dual class companies in our sample decided to consolidate their share structure from dual to single class equity. This information was compiled from company disclosures and newspaper articles. Some firms gave more than one reason. For some other firms, no justification for the stock unification could be found.
Reason Frequency Improve liquidity 7 Improve attractiveness for international investors 7 Secure current index membership 6 Improve chances of being included in higher index 4 Improve corporate governance 3 Reason for lock on control is not given any longer 3 Flexibility for future acquisitions 2 Protection against takeovers 1
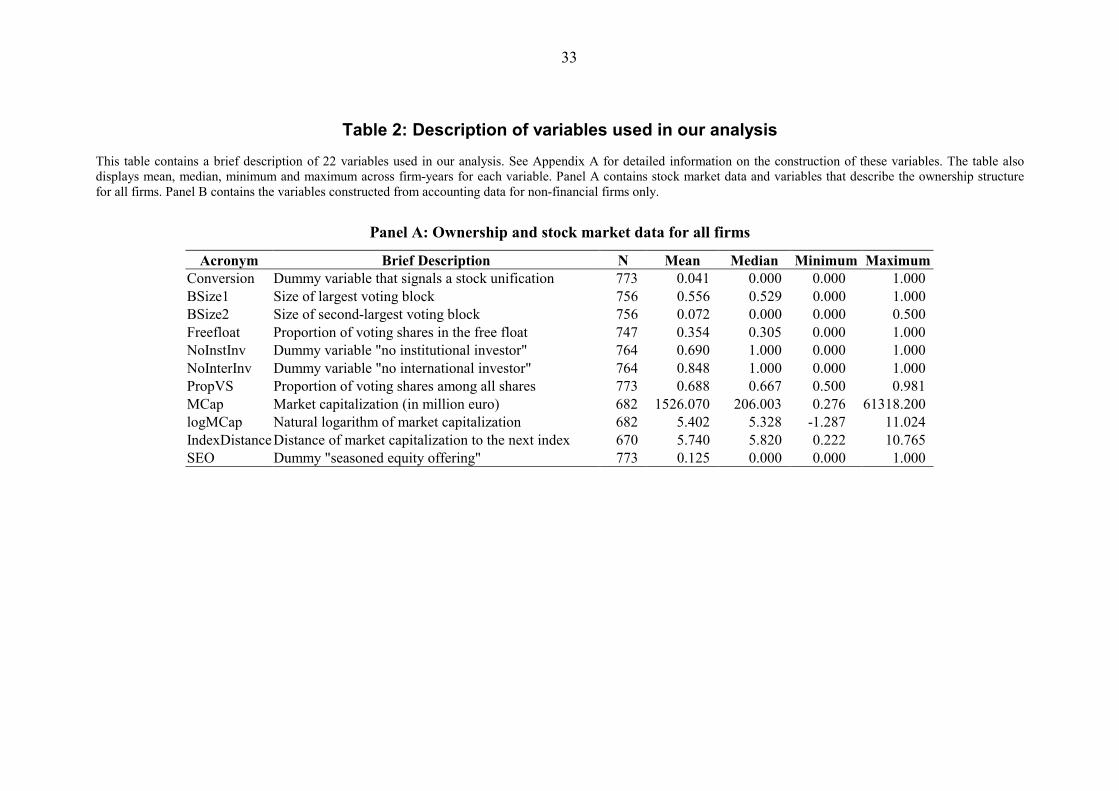
33
Table 2: Description of variables used in our analysis This table contains a brief description of 22 variables used in our analysis. See Appendix A for detailed information on the construction of these variables. The table also displays mean, median, minimum and maximum across firm-years for each variable. Panel A contains stock market data and variables that describe the ownership structure for all firms. Panel B contains the variables constructed from accounting data for non-financial firms only.
Panel A: Ownership and stock market data for all firms
Acronym Brief Description N Mean Median Minimum MaximumConversion Dummy variable that signals a stock unification 773 0.041 0.000 0.000 1.000 BSize1 Size of largest voting block 756 0.556 0.529 0.000 1.000 BSize2 Size of second-largest voting block 756 0.072 0.000 0.000 0.500 Freefloat Proportion of voting shares in the free float 747 0.354 0.305 0.000 1.000 NoInstInv Dummy variable "no institutional investor" 764 0.690 1.000 0.000 1.000 NoInterInv Dummy variable "no international investor" 764 0.848 1.000 0.000 1.000 PropVS Proportion of voting shares among all shares 773 0.688 0.667 0.500 0.981 MCap Market capitalization (in million euro) 682 1526.070 206.003 0.276 61318.200 logMCap Natural logarithm of market capitalization 682 5.402 5.328 -1.287 11.024 IndexDistance Distance of market capitalization to the next index 670 5.740 5.820 0.222 10.765 SEO Dummy "seasoned equity offering" 773 0.125 0.000 0.000 1.000
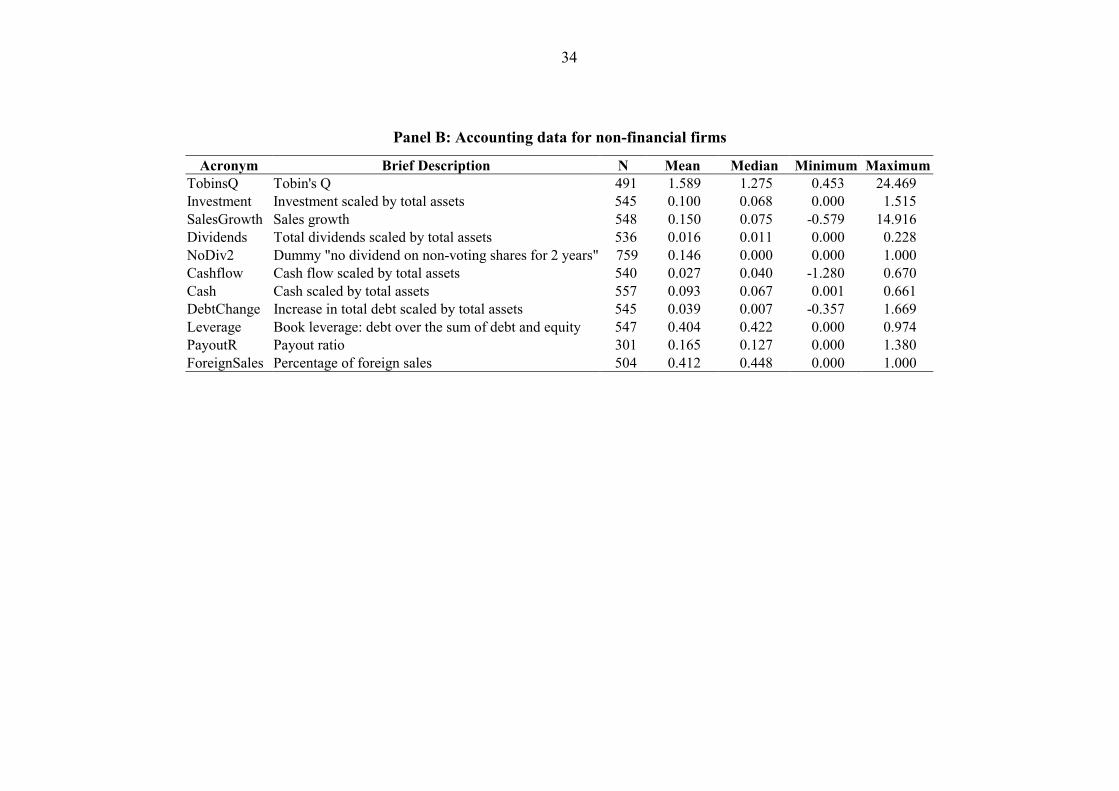
34
Panel B: Accounting data for non-financial firms
Acronym Brief Description N Mean Median Minimum MaximumTobinsQ Tobin's Q 491 1.589 1.275 0.453 24.469 Investment Investment scaled by total assets 545 0.100 0.068 0.000 1.515 SalesGrowth Sales growth 548 0.150 0.075 -0.579 14.916 Dividends Total dividends scaled by total assets 536 0.016 0.011 0.000 0.228 NoDiv2 Dummy "no dividend on non-voting shares for 2 years" 759 0.146 0.000 0.000 1.000 Cashflow Cash flow scaled by total assets 540 0.027 0.040 -1.280 0.670 Cash Cash scaled by total assets 557 0.093 0.067 0.001 0.661 DebtChange Increase in total debt scaled by total assets 545 0.039 0.007 -0.357 1.669 Leverage Book leverage: debt over the sum of debt and equity 547 0.404 0.422 0.000 0.974 PayoutR Payout ratio 301 0.165 0.127 0.000 1.380 ForeignSales Percentage of foreign sales 504 0.412 0.448 0.000 1.000
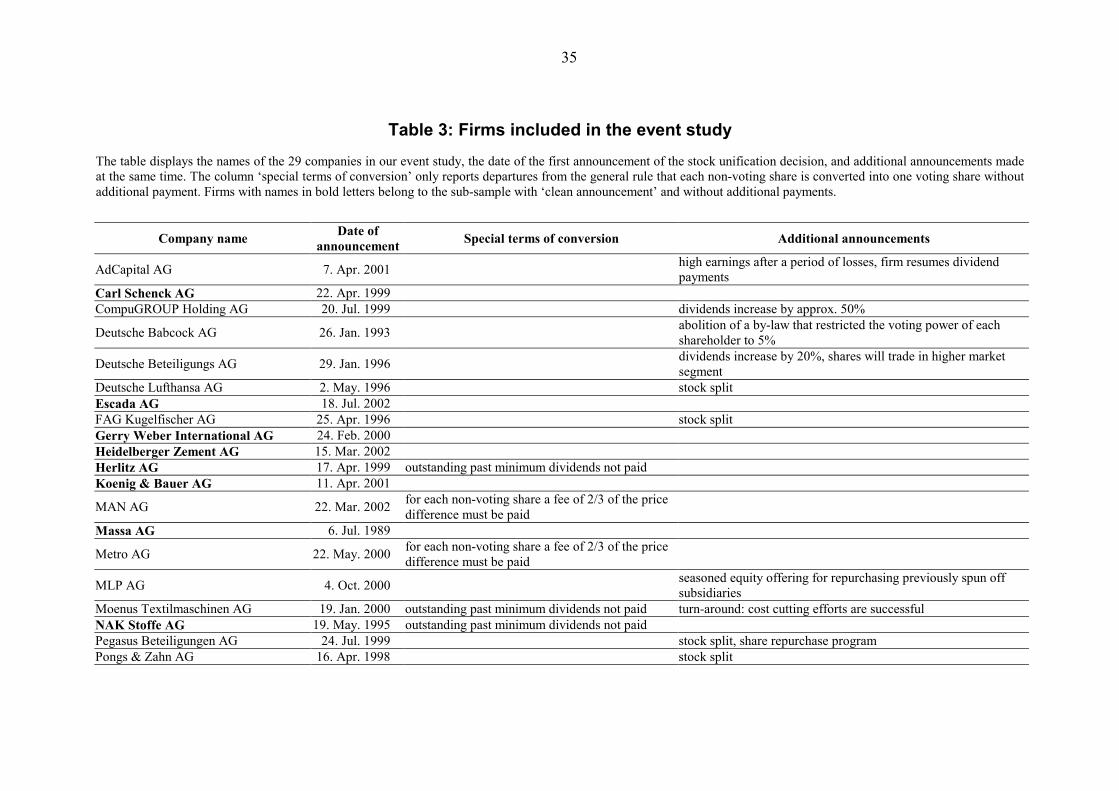
35
Table 3: Firms included in the event study The table displays the names of the 29 companies in our event study, the date of the first announcement of the stock unification decision, and additional announcements made at the same time. The column ‘special terms of conversion’ only reports departures from the general rule that each non-voting share is converted into one voting share without additional payment. Firms with names in bold letters belong to the sub-sample with ‘clean announcement’ and without additional payments.
Company name Date of announcement Special terms of conversion Additional announcements
AdCapital AG 7. Apr. 2001 high earnings after a period of losses, firm resumes dividend payments
Carl Schenck AG 22. Apr. 1999 CompuGROUP Holding AG 20. Jul. 1999 dividends increase by approx. 50%
Deutsche Babcock AG 26. Jan. 1993 abolition of a by-law that restricted the voting power of each shareholder to 5%
Deutsche Beteiligungs AG 29. Jan. 1996 dividends increase by 20%, shares will trade in higher market segment
Deutsche Lufthansa AG 2. May. 1996 stock split Escada AG 18. Jul. 2002 FAG Kugelfischer AG 25. Apr. 1996 stock split Gerry Weber International AG 24. Feb. 2000 Heidelberger Zement AG 15. Mar. 2002 Herlitz AG 17. Apr. 1999 outstanding past minimum dividends not paid Koenig & Bauer AG 11. Apr. 2001
MAN AG 22. Mar. 2002 for each non-voting share a fee of 2/3 of the price difference must be paid
Massa AG 6. Jul. 1989
Metro AG 22. May. 2000 for each non-voting share a fee of 2/3 of the price difference must be paid
MLP AG 4. Oct. 2000 seasoned equity offering for repurchasing previously spun off subsidiaries
Moenus Textilmaschinen AG 19. Jan. 2000 outstanding past minimum dividends not paid turn-around: cost cutting efforts are successful NAK Stoffe AG 19. May. 1995 outstanding past minimum dividends not paid Pegasus Beteiligungen AG 24. Jul. 1999 stock split, share repurchase program Pongs & Zahn AG 16. Apr. 1998 stock split
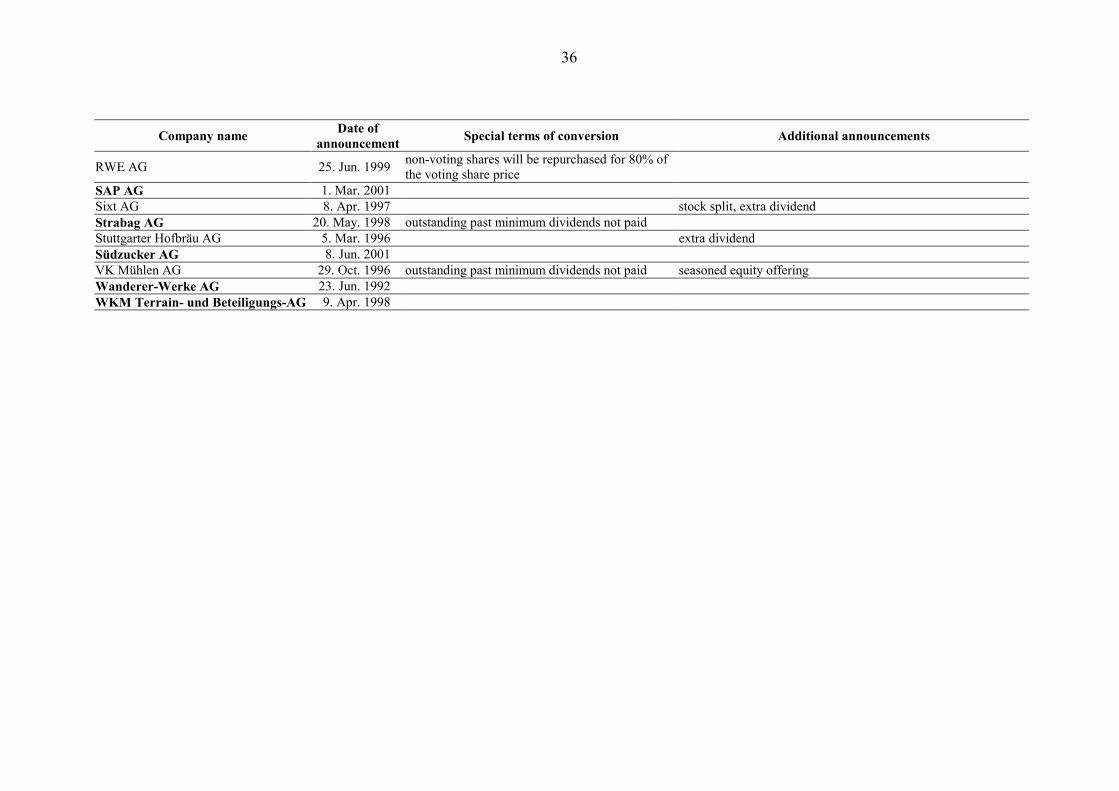
36
Company name Date of announcement Special terms of conversion Additional announcements
RWE AG 25. Jun. 1999 non-voting shares will be repurchased for 80% of the voting share price
SAP AG 1. Mar. 2001 Sixt AG 8. Apr. 1997 stock split, extra dividend Strabag AG 20. May. 1998 outstanding past minimum dividends not paid Stuttgarter Hofbräu AG 5. Mar. 1996 extra dividend Südzucker AG 8. Jun. 2001 VK Mühlen AG 29. Oct. 1996 outstanding past minimum dividends not paid seasoned equity offering Wanderer-Werke AG 23. Jun. 1992 WKM Terrain- und Beteiligungs-AG 9. Apr. 1998
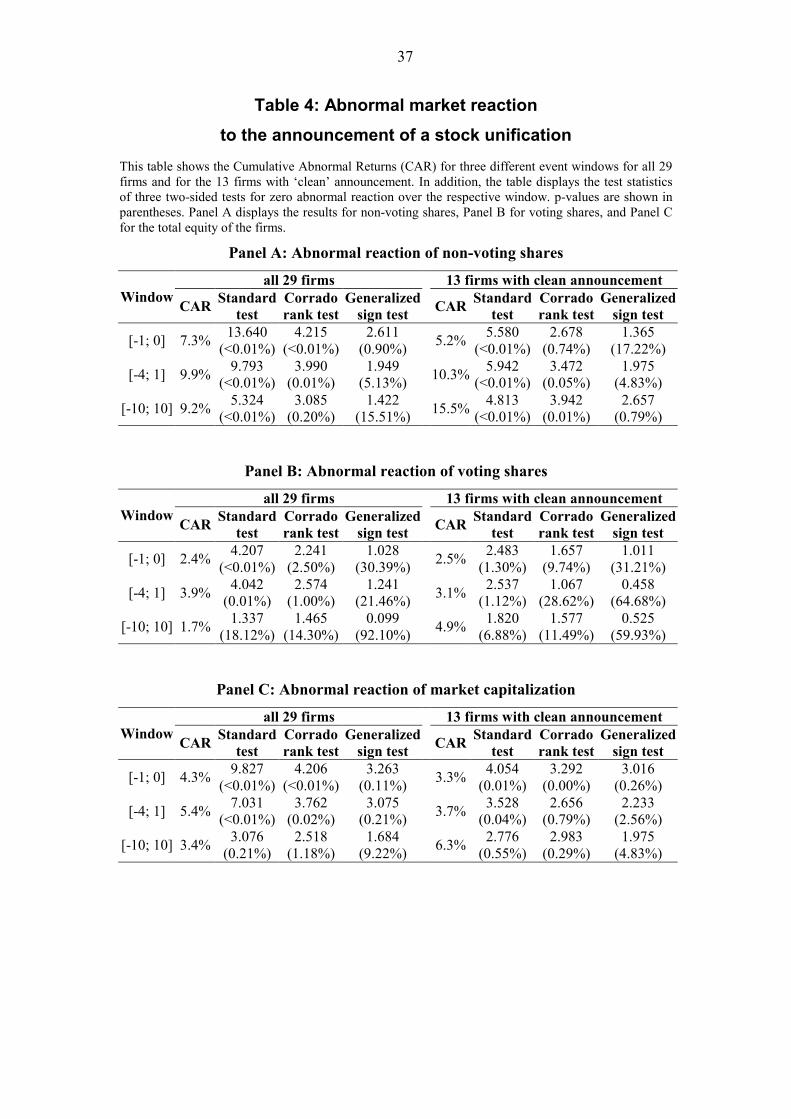
37
Table 4: Abnormal market reaction to the announcement of a stock unification
This table shows the Cumulative Abnormal Returns (CAR) for three different event windows for all 29 firms and for the 13 firms with ‘clean’ announcement. In addition, the table displays the test statistics of three two-sided tests for zero abnormal reaction over the respective window. p-values are shown in parentheses. Panel A displays the results for non-voting shares, Panel B for voting shares, and Panel C for the total equity of the firms.
Panel A: Abnormal reaction of non-voting shares
all 29 firms 13 firms with clean announcement Window CAR Standard
test Corrado rank test
Generalized sign test CAR Standard
test Corrado rank test
Generalized sign test
[-1; 0] 7.3% 13.640 (<0.01%)
4.215 (<0.01%)
2.611 (0.90%) 5.2% 5.580
(<0.01%)2.678
(0.74%) 1.365
(17.22%)
[-4; 1] 9.9% 9.793 (<0.01%)
3.990 (0.01%)
1.949 (5.13%) 10.3% 5.942
(<0.01%)3.472
(0.05%) 1.975
(4.83%)
[-10; 10] 9.2% 5.324 (<0.01%)
3.085 (0.20%)
1.422 (15.51%) 15.5% 4.813
(<0.01%)3.942
(0.01%) 2.657
(0.79%)
Panel B: Abnormal reaction of voting shares
all 29 firms 13 firms with clean announcement Window CAR Standard
test Corrado rank test
Generalized sign test CAR Standard
test Corrado rank test
Generalized sign test
[-1; 0] 2.4% 4.207 (<0.01%)
2.241 (2.50%)
1.028 (30.39%) 2.5% 2.483
(1.30%) 1.657
(9.74%) 1.011
(31.21%)
[-4; 1] 3.9% 4.042 (0.01%)
2.574 (1.00%)
1.241 (21.46%) 3.1% 2.537
(1.12%) 1.067
(28.62%) 0.458
(64.68%)
[-10; 10] 1.7% 1.337 (18.12%)
1.465 (14.30%)
0.099 (92.10%) 4.9% 1.820
(6.88%) 1.577
(11.49%) 0.525
(59.93%)
Panel C: Abnormal reaction of market capitalization
all 29 firms 13 firms with clean announcement Window CAR Standard
test Corrado rank test
Generalized sign test CAR Standard
test Corrado rank test
Generalized sign test
[-1; 0] 4.3% 9.827 (<0.01%)
4.206 (<0.01%)
3.263 (0.11%) 3.3% 4.054
(0.01%) 3.292
(0.00%) 3.016
(0.26%)
[-4; 1] 5.4% 7.031 (<0.01%)
3.762 (0.02%)
3.075 (0.21%) 3.7% 3.528
(0.04%) 2.656
(0.79%) 2.233
(2.56%)
[-10; 10] 3.4% 3.076 (0.21%)
2.518 (1.18%)
1.684 (9.22%) 6.3% 2.776
(0.55%) 2.983
(0.29%) 1.975
(4.83%)
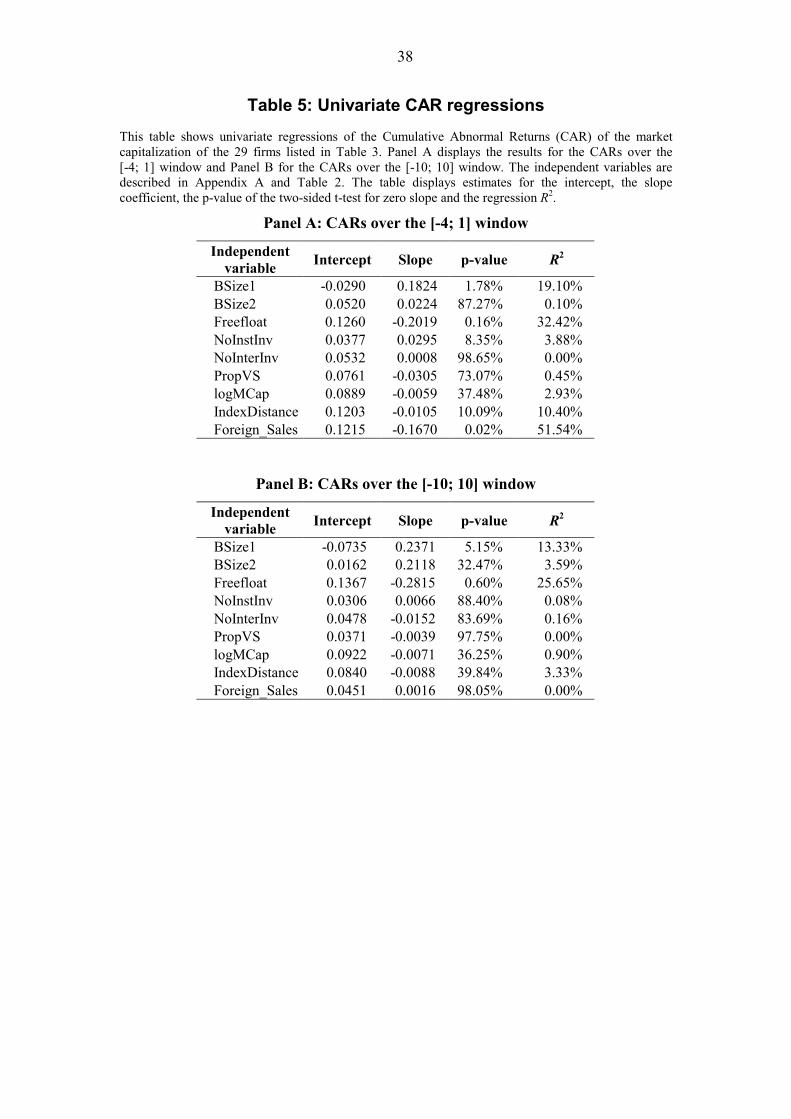
38
Table 5: Univariate CAR regressions This table shows univariate regressions of the Cumulative Abnormal Returns (CAR) of the market capitalization of the 29 firms listed in Table 3. Panel A displays the results for the CARs over the [-4; 1] window and Panel B for the CARs over the [-10; 10] window. The independent variables are described in Appendix A and Table 2. The table displays estimates for the intercept, the slope coefficient, the p-value of the two-sided t-test for zero slope and the regression R2.
Panel A: CARs over the [-4; 1] window
Independent variable Intercept Slope p-value R2
BSize1 -0.0290 0.1824 1.78% 19.10% BSize2 0.0520 0.0224 87.27% 0.10% Freefloat 0.1260 -0.2019 0.16% 32.42% NoInstInv 0.0377 0.0295 8.35% 3.88% NoInterInv 0.0532 0.0008 98.65% 0.00% PropVS 0.0761 -0.0305 73.07% 0.45% logMCap 0.0889 -0.0059 37.48% 2.93% IndexDistance 0.1203 -0.0105 10.09% 10.40% Foreign_Sales 0.1215 -0.1670 0.02% 51.54%
Panel B: CARs over the [-10; 10] window
Independent variable Intercept Slope p-value R2
BSize1 -0.0735 0.2371 5.15% 13.33% BSize2 0.0162 0.2118 32.47% 3.59% Freefloat 0.1367 -0.2815 0.60% 25.65% NoInstInv 0.0306 0.0066 88.40% 0.08% NoInterInv 0.0478 -0.0152 83.69% 0.16% PropVS 0.0371 -0.0039 97.75% 0.00% logMCap 0.0922 -0.0071 36.25% 0.90% IndexDistance 0.0840 -0.0088 39.84% 3.33% Foreign_Sales 0.0451 0.0016 98.05% 0.00%
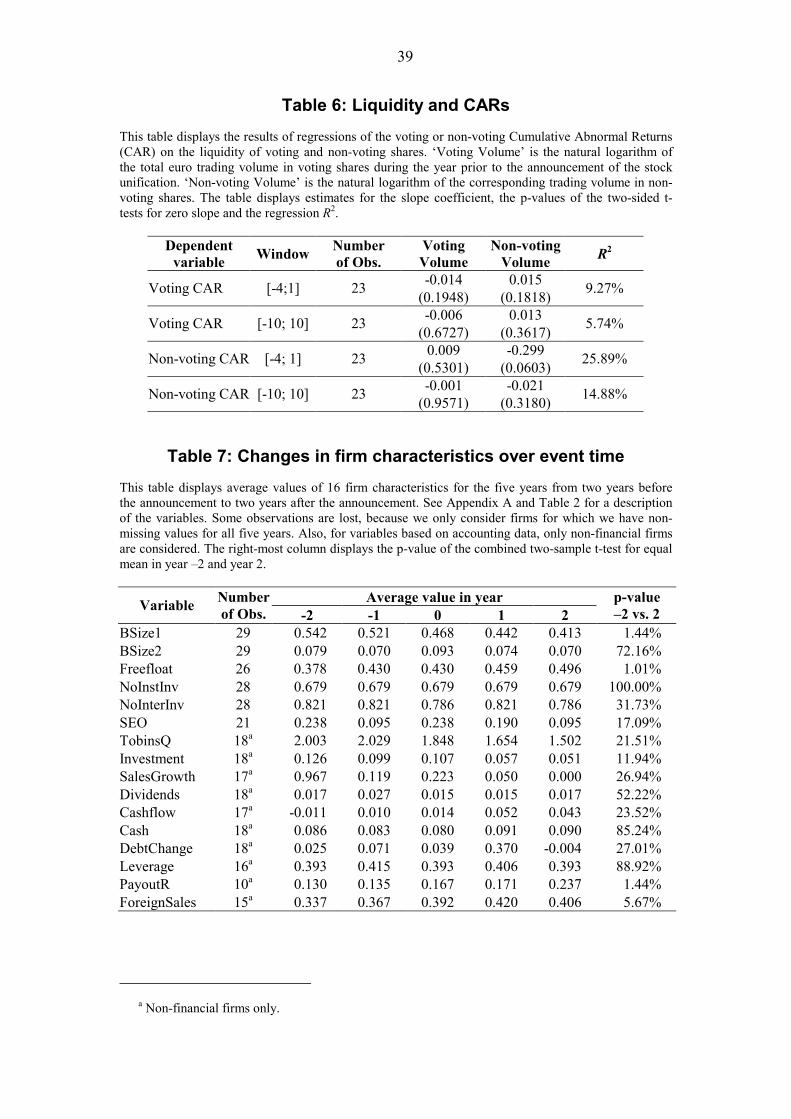
39
Table 6: Liquidity and CARs This table displays the results of regressions of the voting or non-voting Cumulative Abnormal Returns (CAR) on the liquidity of voting and non-voting shares. ‘Voting Volume’ is the natural logarithm of the total euro trading volume in voting shares during the year prior to the announcement of the stock unification. ‘Non-voting Volume’ is the natural logarithm of the corresponding trading volume in non-voting shares. The table displays estimates for the slope coefficient, the p-values of the two-sided t-tests for zero slope and the regression R2.
Dependent variable Window Number
of Obs. Voting Volume
Non-voting Volume R2
-0.014 0.015 Voting CAR [-4;1] 23 (0.1948) (0.1818) 9.27%
-0.006 0.013 Voting CAR [-10; 10] 23 (0.6727) (0.3617) 5.74%
0.009 -0.299 Non-voting CAR [-4; 1] 23 (0.5301) (0.0603) 25.89%
-0.001 -0.021 Non-voting CAR [-10; 10] 23 (0.9571) (0.3180) 14.88%
Table 7: Changes in firm characteristics over event time This table displays average values of 16 firm characteristics for the five years from two years before the announcement to two years after the announcement. See Appendix A and Table 2 for a description of the variables. Some observations are lost, because we only consider firms for which we have non-missing values for all five years. Also, for variables based on accounting data, only non-financial firms are considered. The right-most column displays the p-value of the combined two-sample t-test for equal mean in year –2 and year 2.
Average value in year Variable Number of Obs. -2 -1 0 1 2
p-value –2 vs. 2
BSize1 29 0.542 0.521 0.468 0.442 0.413 1.44% BSize2 29 0.079 0.070 0.093 0.074 0.070 72.16% Freefloat 26 0.378 0.430 0.430 0.459 0.496 1.01% NoInstInv 28 0.679 0.679 0.679 0.679 0.679 100.00% NoInterInv 28 0.821 0.821 0.786 0.821 0.786 31.73% SEO 21 0.238 0.095 0.238 0.190 0.095 17.09% TobinsQ 18a 2.003 2.029 1.848 1.654 1.502 21.51% Investment 18a 0.126 0.099 0.107 0.057 0.051 11.94% SalesGrowth 17a 0.967 0.119 0.223 0.050 0.000 26.94% Dividends 18a 0.017 0.027 0.015 0.015 0.017 52.22% Cashflow 17a -0.011 0.010 0.014 0.052 0.043 23.52% Cash 18a 0.086 0.083 0.080 0.091 0.090 85.24% DebtChange 18a 0.025 0.071 0.039 0.370 -0.004 27.01% Leverage 16a 0.393 0.415 0.393 0.406 0.393 88.92% PayoutR 10a 0.130 0.135 0.167 0.171 0.237 1.44% ForeignSales 15a 0.337 0.367 0.392 0.420 0.406 5.67%
a Non-financial firms only.
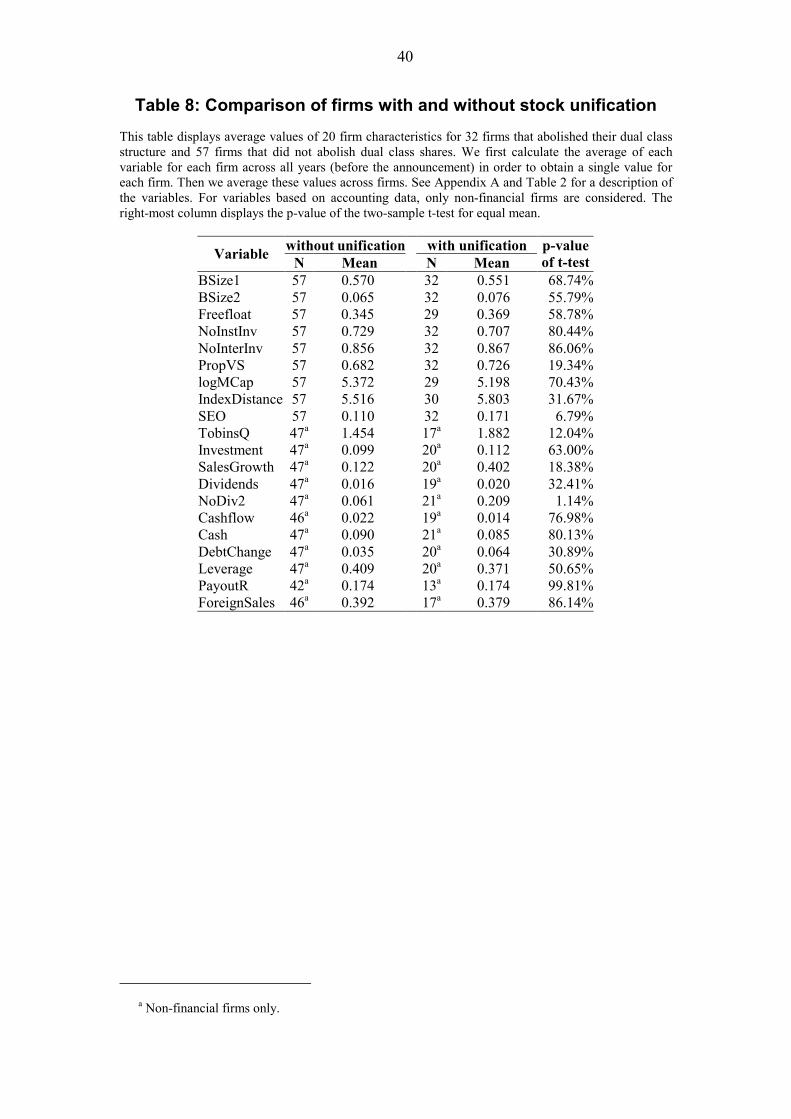
40
Table 8: Comparison of firms with and without stock unification This table displays average values of 20 firm characteristics for 32 firms that abolished their dual class structure and 57 firms that did not abolish dual class shares. We first calculate the average of each variable for each firm across all years (before the announcement) in order to obtain a single value for each firm. Then we average these values across firms. See Appendix A and Table 2 for a description of the variables. For variables based on accounting data, only non-financial firms are considered. The right-most column displays the p-value of the two-sample t-test for equal mean.
without unification with unification Variable N Mean N Mean p-value of t-test
BSize1 57 0.570 32 0.551 68.74%BSize2 57 0.065 32 0.076 55.79%Freefloat 57 0.345 29 0.369 58.78%NoInstInv 57 0.729 32 0.707 80.44%NoInterInv 57 0.856 32 0.867 86.06%PropVS 57 0.682 32 0.726 19.34%logMCap 57 5.372 29 5.198 70.43%IndexDistance 57 5.516 30 5.803 31.67%SEO 57 0.110 32 0.171 6.79%TobinsQ 47a 1.454 17a 1.882 12.04%Investment 47a 0.099 20a 0.112 63.00%SalesGrowth 47a 0.122 20a 0.402 18.38%Dividends 47a 0.016 19a 0.020 32.41%NoDiv2 47a 0.061 21a 0.209 1.14%Cashflow 46a 0.022 19a 0.014 76.98%Cash 47a 0.090 21a 0.085 80.13%DebtChange 47a 0.035 20a 0.064 30.89%Leverage 47a 0.409 20a 0.371 50.65%PayoutR 42a 0.174 13a 0.174 99.81%ForeignSales 46a 0.392 17a 0.379 86.14%
a Non-financial firms only.
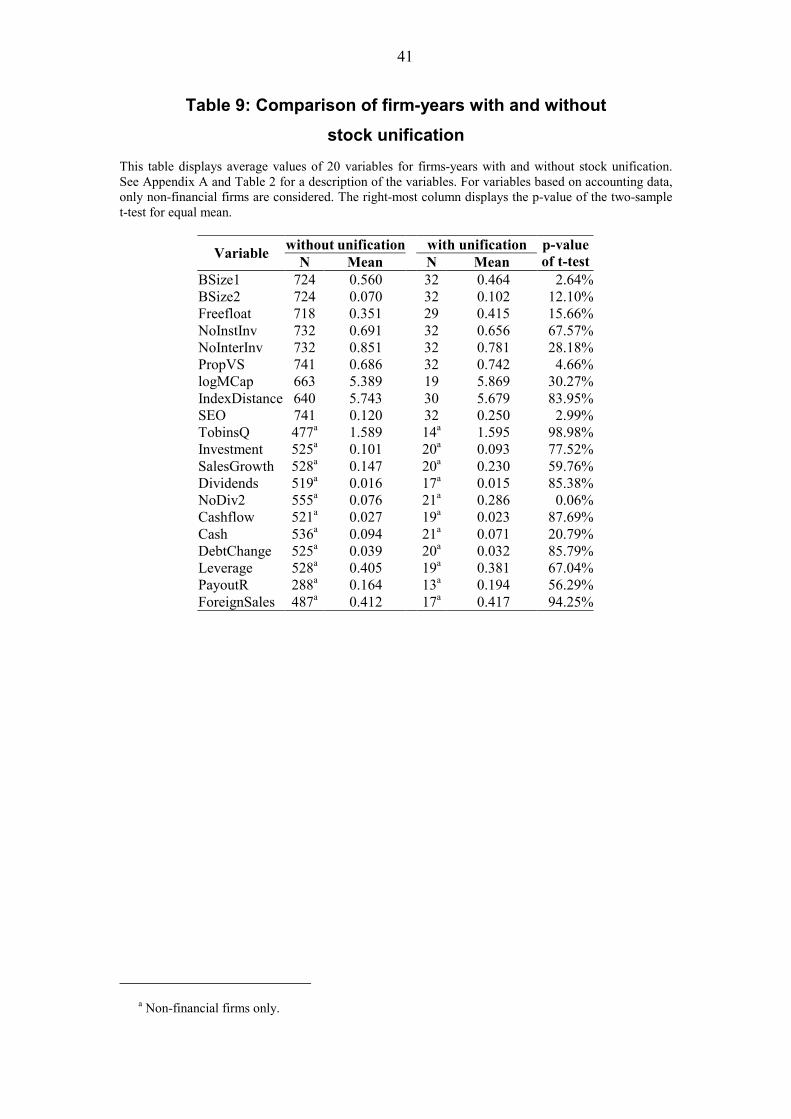
41
Table 9: Comparison of firm-years with and without stock unification
This table displays average values of 20 variables for firms-years with and without stock unification. See Appendix A and Table 2 for a description of the variables. For variables based on accounting data, only non-financial firms are considered. The right-most column displays the p-value of the two-sample t-test for equal mean.
without unification with unification Variable N Mean N Mean p-value of t-test
BSize1 724 0.560 32 0.464 2.64%BSize2 724 0.070 32 0.102 12.10%Freefloat 718 0.351 29 0.415 15.66%NoInstInv 732 0.691 32 0.656 67.57%NoInterInv 732 0.851 32 0.781 28.18%PropVS 741 0.686 32 0.742 4.66%logMCap 663 5.389 19 5.869 30.27%IndexDistance 640 5.743 30 5.679 83.95%SEO 741 0.120 32 0.250 2.99%TobinsQ 477a 1.589 14a 1.595 98.98%Investment 525a 0.101 20a 0.093 77.52%SalesGrowth 528a 0.147 20a 0.230 59.76%Dividends 519a 0.016 17a 0.015 85.38%NoDiv2 555a 0.076 21a 0.286 0.06%Cashflow 521a 0.027 19a 0.023 87.69%Cash 536a 0.094 21a 0.071 20.79%DebtChange 525a 0.039 20a 0.032 85.79%Leverage 528a 0.405 19a 0.381 67.04%PayoutR 288a 0.164 13a 0.194 56.29%ForeignSales 487a 0.412 17a 0.417 94.25%
a Non-financial firms only.
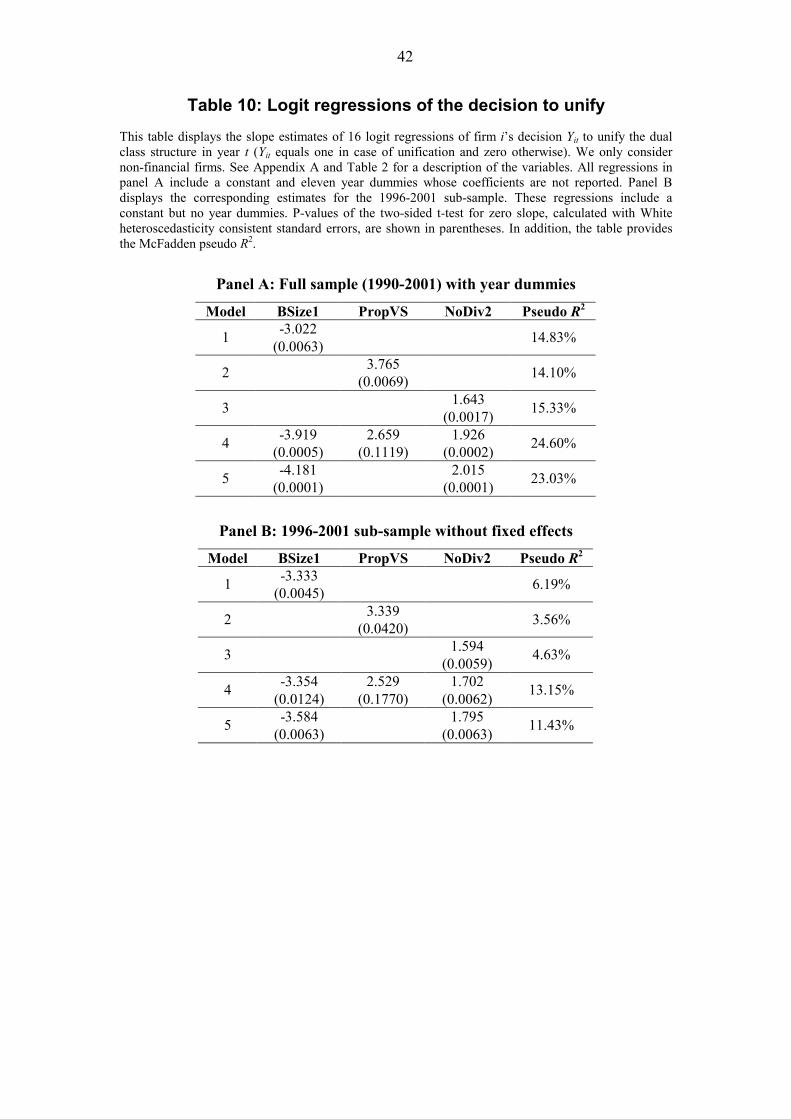
42
Table 10: Logit regressions of the decision to unify This table displays the slope estimates of 16 logit regressions of firm i’s decision Yit to unify the dual class structure in year t (Yit equals one in case of unification and zero otherwise). We only consider non-financial firms. See Appendix A and Table 2 for a description of the variables. All regressions in panel A include a constant and eleven year dummies whose coefficients are not reported. Panel B displays the corresponding estimates for the 1996-2001 sub-sample. These regressions include a constant but no year dummies. P-values of the two-sided t-test for zero slope, calculated with White heteroscedasticity consistent standard errors, are shown in parentheses. In addition, the table provides the McFadden pseudo R2.
Panel A: Full sample (1990-2001) with year dummies
Model BSize1 PropVS NoDiv2 Pseudo R2 -3.022 1 (0.0063) 14.83%
3.765 2 (0.0069) 14.10%
1.643 3 (0.0017) 15.33%
-3.919 2.659 1.926 4 (0.0005) (0.1119) (0.0002) 24.60%
-4.181 2.015 5 (0.0001) (0.0001) 23.03%
Panel B: 1996-2001 sub-sample without fixed effects
Model BSize1 PropVS NoDiv2 Pseudo R2 -3.333 1 (0.0045) 6.19%
3.339 2 (0.0420) 3.56%
1.594 3 (0.0059) 4.63%
-3.354 2.529 1.702 4 (0.0124) (0.1770) (0.0062) 13.15%
-3.584 1.795 5 (0.0063) (0.0063) 11.43%
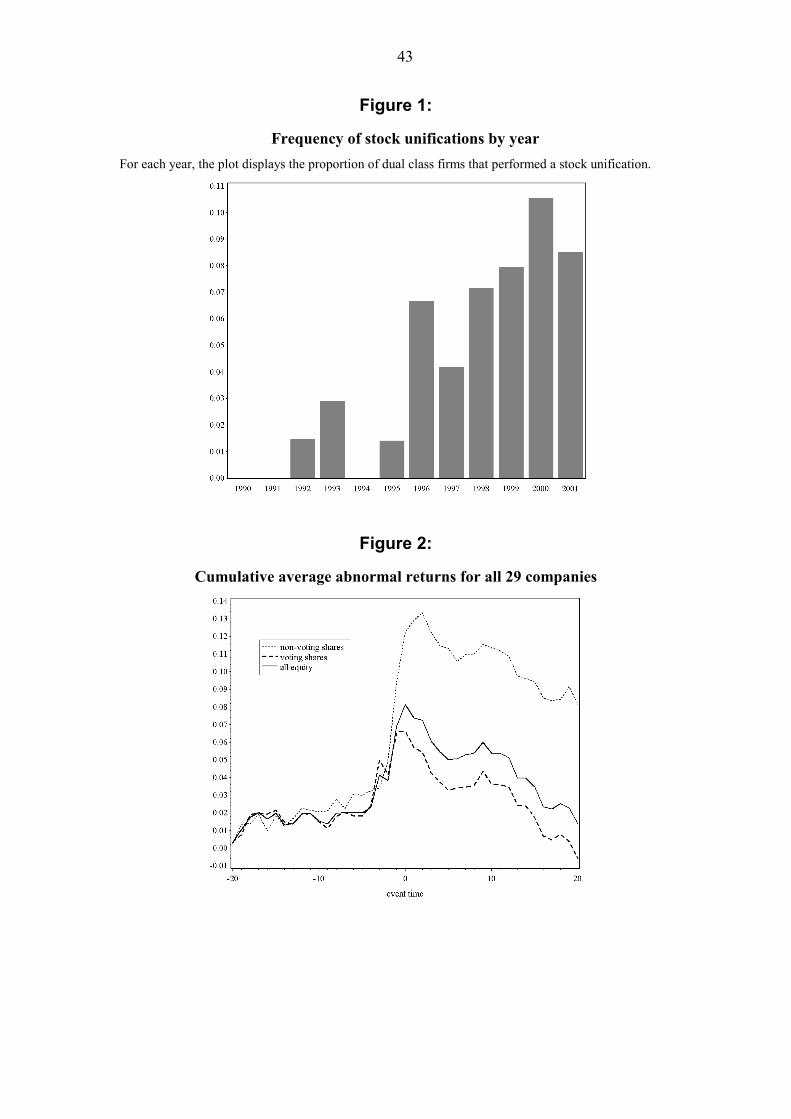
43
Figure 1:
Frequency of stock unifications by year For each year, the plot displays the proportion of dual class firms that performed a stock unification.
Figure 2:
Cumulative average abnormal returns for all 29 companies
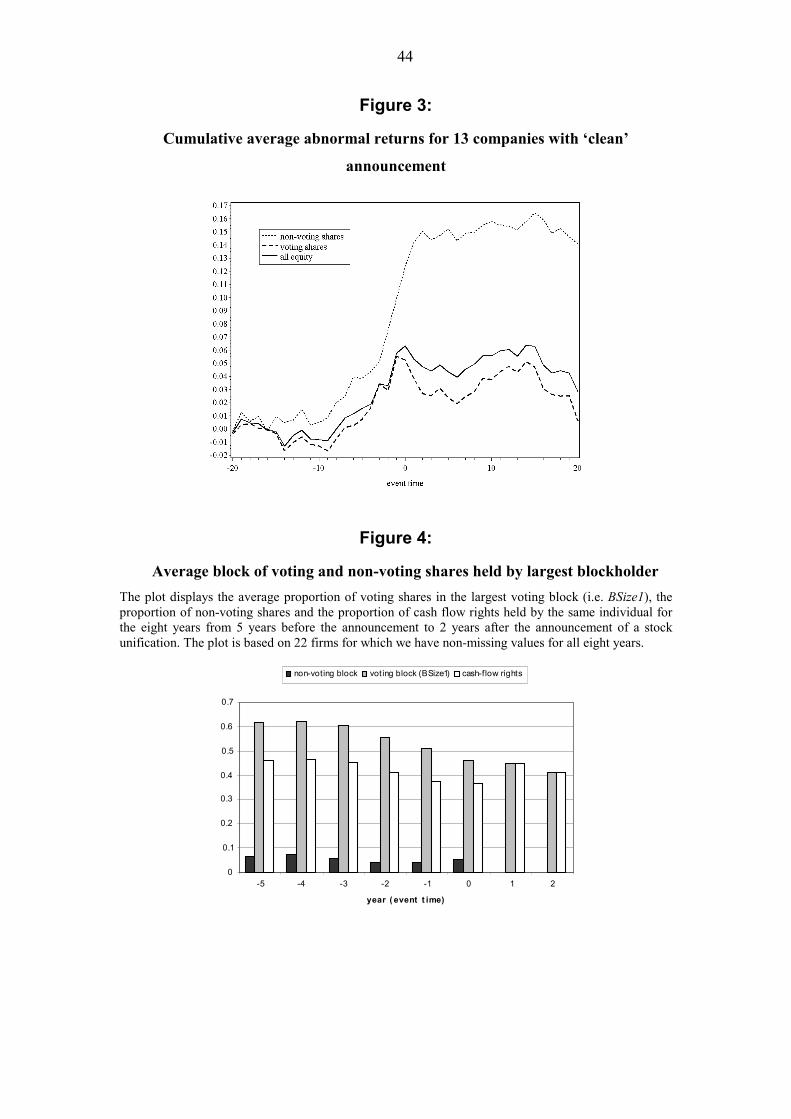
44
Figure 3:
Cumulative average abnormal returns for 13 companies with ‘clean’
announcement
Figure 4:
Average block of voting and non-voting shares held by largest blockholder The plot displays the average proportion of voting shares in the largest voting block (i.e. BSize1), the proportion of non-voting shares and the proportion of cash flow rights held by the same individual for the eight years from 5 years before the announcement to 2 years after the announcement of a stock unification. The plot is based on 22 firms for which we have non-missing values for all eight years.
0
0.1
0.2
0.3
0.4
0.5
0.6
0.7
-5 -4 -3 -2 -1 0 1 2
year ( event t ime)
non-voting block vot ing block (BSize1) cash-flow rights