Embed Size (px)
Citation preview
Time Variation of the Fine Structure Constant from Realistic Models of Oklo
Natural Nuclear Reactors*
Chris GouldNorth Carolina State University and TUNL
Eduard SharapovJINR, Dubna
Steve LamoreauxYale University
•Work supported in part by US Department of Energy, Office of Nuclear Physics and Los Alamos National Laboratory LDRD
http://link.aps.org/abstract/PRC/v74/e024607
INT April 25 2007
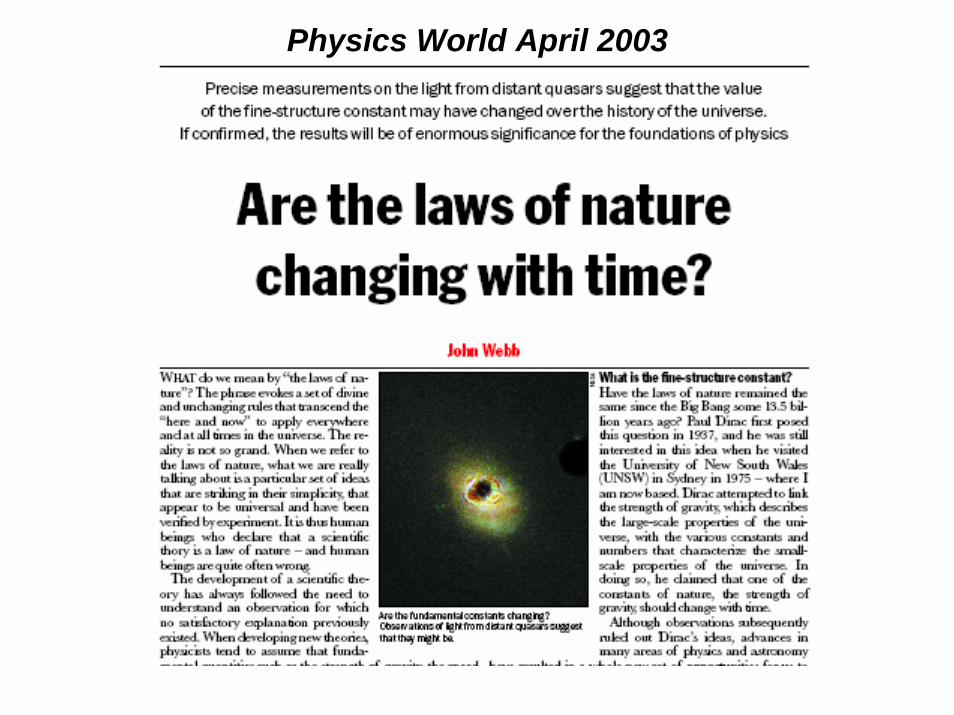
Physics World April 2003
Outline• Introduction – time varying constants• History of Oklo natural nuclear reactors• Realistic modeling of Oklo reactor zones• Calculations of 149Sm effective cross section• Bounds on ∆α/α from RZ2 and RZ10• Conclusions
Time variation of fundamental constants
• Long history (Dirac: GN ~ 1 / t )• Feature of extra dimensional theories
(Uzan, RMP 03)• Only dimensionless ratios have meaning
(αG ∼ GN mp2/ ћc , W ~ ms/ΛQCD , me/mp)
• Among the most studied is the fine structure constant αΕΜ ∼ e2/ћc ~ 1/137
• If αΕΜ does vary, it’s a matter of taste whether to ascribe it to e, ћ or c
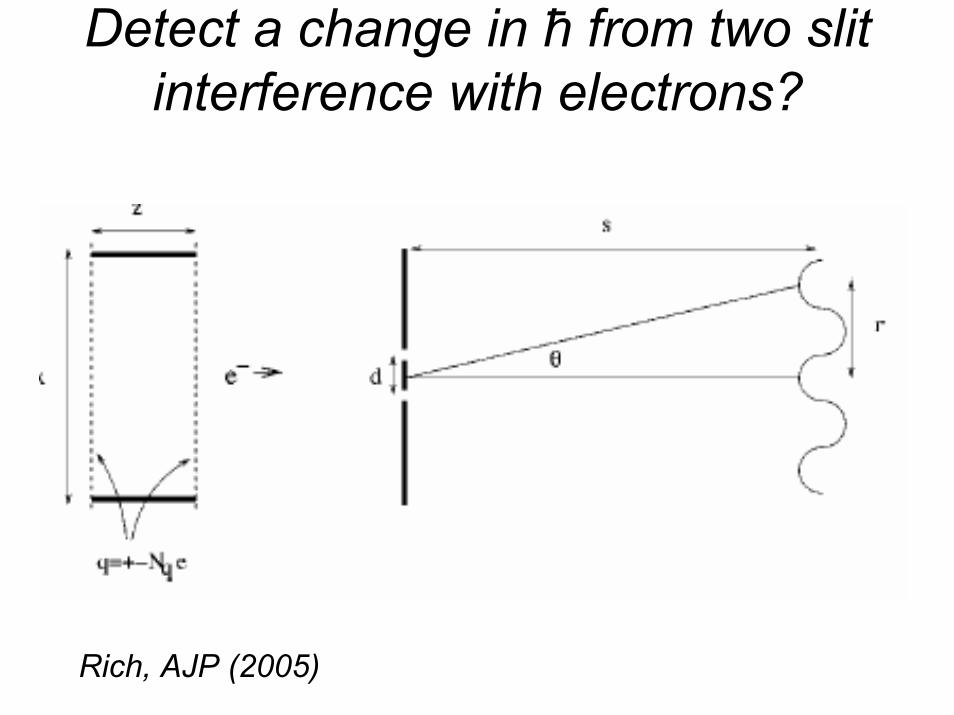
Detect a change in ћ from two slit interference with electrons?
Rich, AJP (2005)
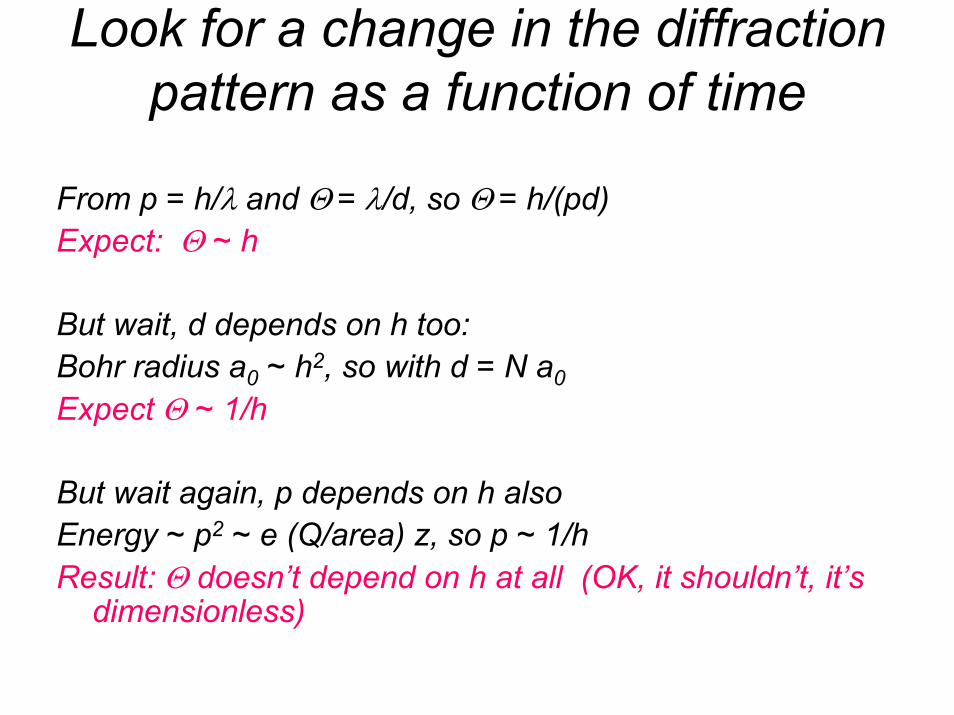
Look for a change in the diffraction pattern as a function of time
From p = h/λ and Θ = λ/d, so Θ = h/(pd) Expect: Θ ~ h
But wait, d depends on h too:Bohr radius a0 ~ h2, so with d = N a0 Expect Θ ~ 1/h
But wait again, p depends on h alsoEnergy ~ p2 ~ e (Q/area) z, so p ~ 1/hResult: Θ doesn’t depend on h at all (OK, it shouldn’t, it’s
dimensionless)
Does α vary with time - Quasars
• Observations of absorption lines in the spectra of distant quasars (z > 0.5)- model independent probe of times ~ 10 BY.
• Webb et al (01): α increased by ~ 1x10⁻⁵ (5σ effect)
• Srianand et al (04): no change, or (Murphy et al (06) reanalysis), 3σ effect increase
• Mathews et al (05): change due to Mg isotope abundance differences?
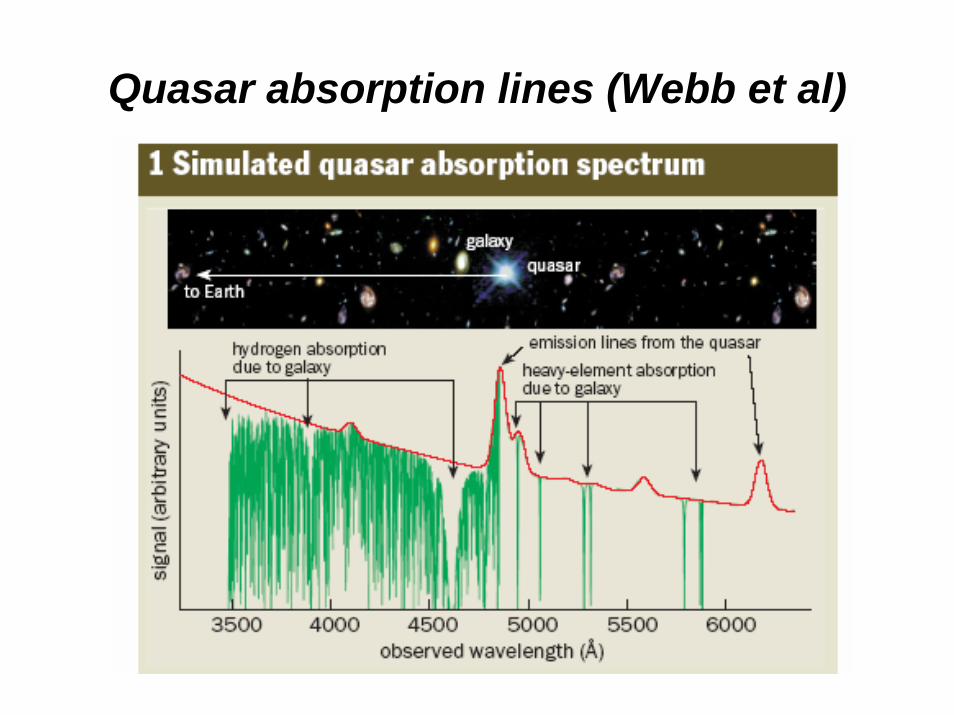
Quasar absorption lines (Webb et al)
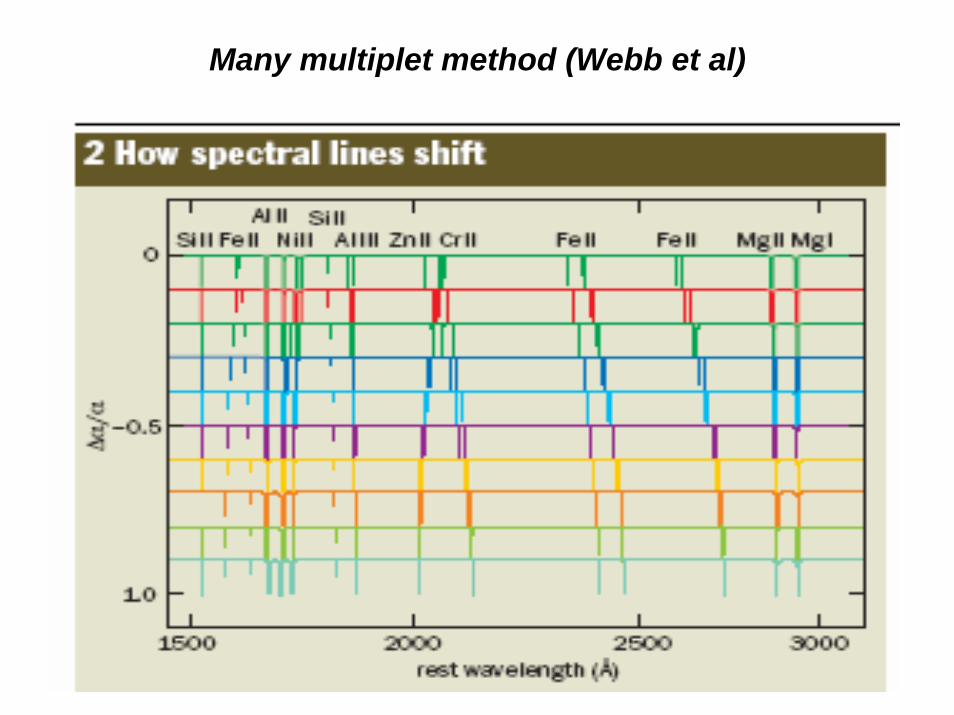
Many multiplet method (Webb et al)
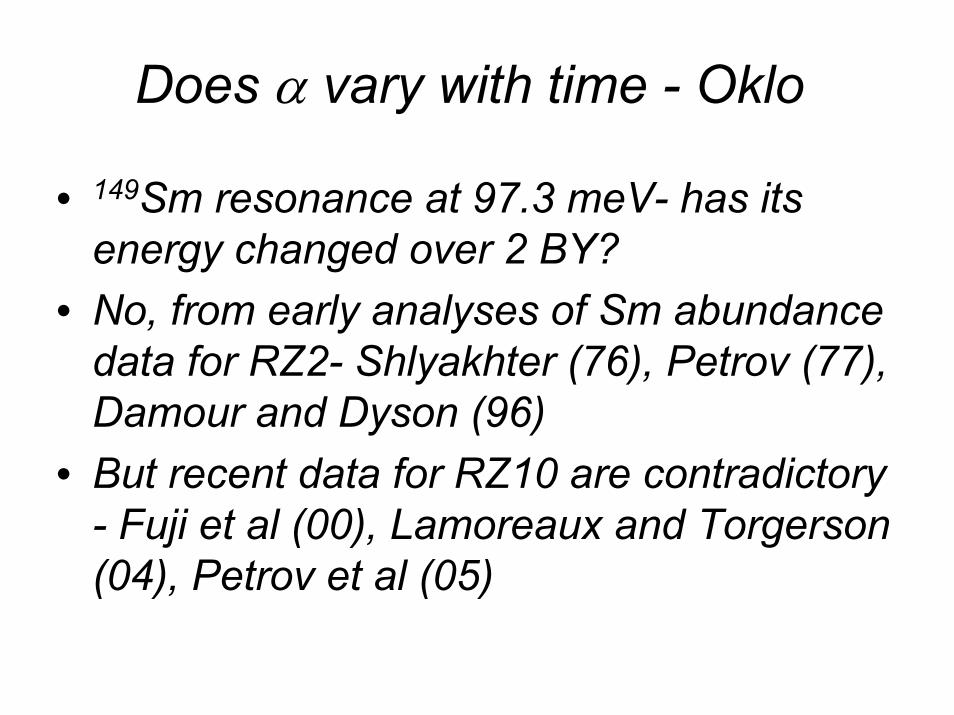
Does α vary with time - Oklo
• 149Sm resonance at 97.3 meV- has its energy changed over 2 BY?
• No, from early analyses of Sm abundance data for RZ2- Shlyakhter (76), Petrov (77), Damour and Dyson (96)
• But recent data for RZ10 are contradictory - Fuji et al (00), Lamoreaux and Torgerson(04), Petrov et al (05)
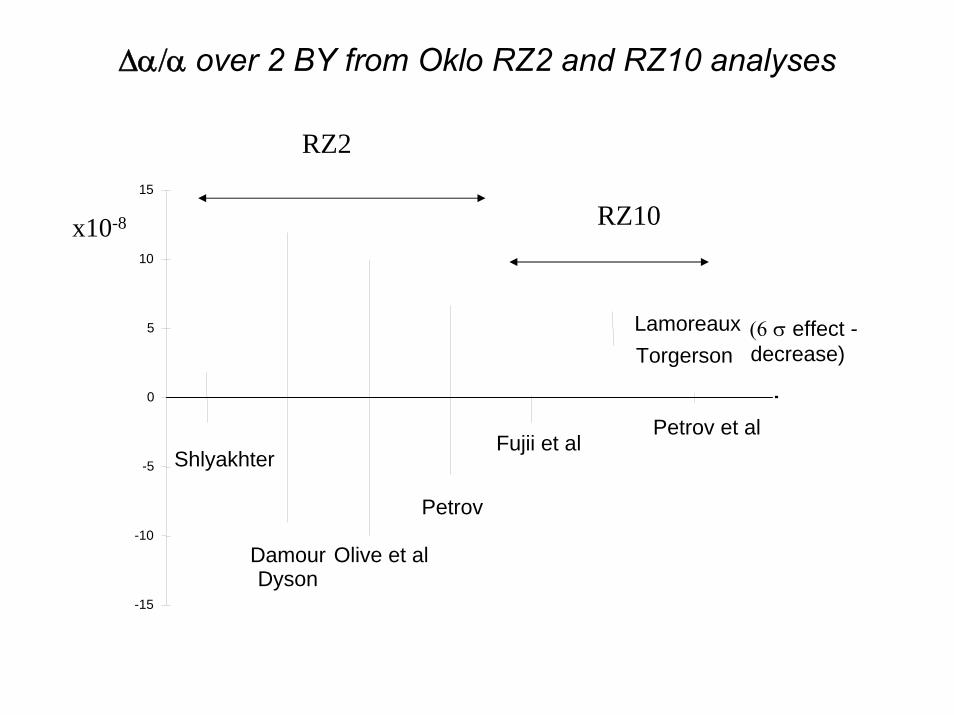
∆α/α over 2 BY from Oklo RZ2 and RZ10 analyses
-15
-10
-5
0
5
10
15
Shlyakhter
DamourDyson
Olive et al
Petrov
Fujii et al
LamoreauxTorgerson
Petrov et al
x10-8
RZ2
RZ10
(6 σ effect -decrease)
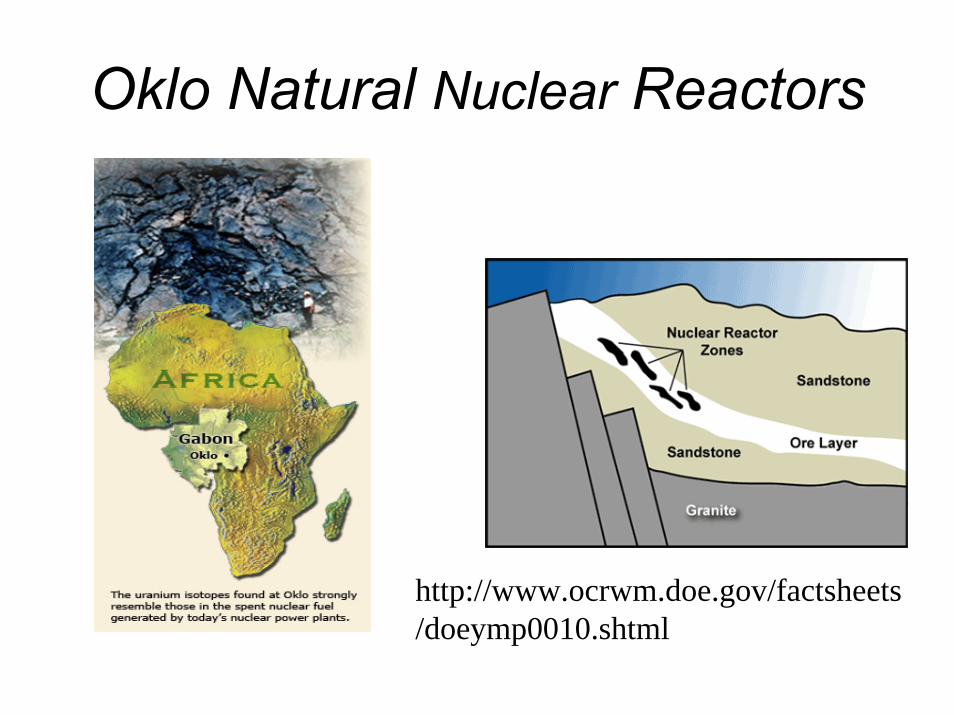
Oklo Natural Nuclear Reactors
http://www.ocrwm.doe.gov/factsheets/doeymp0010.shtml
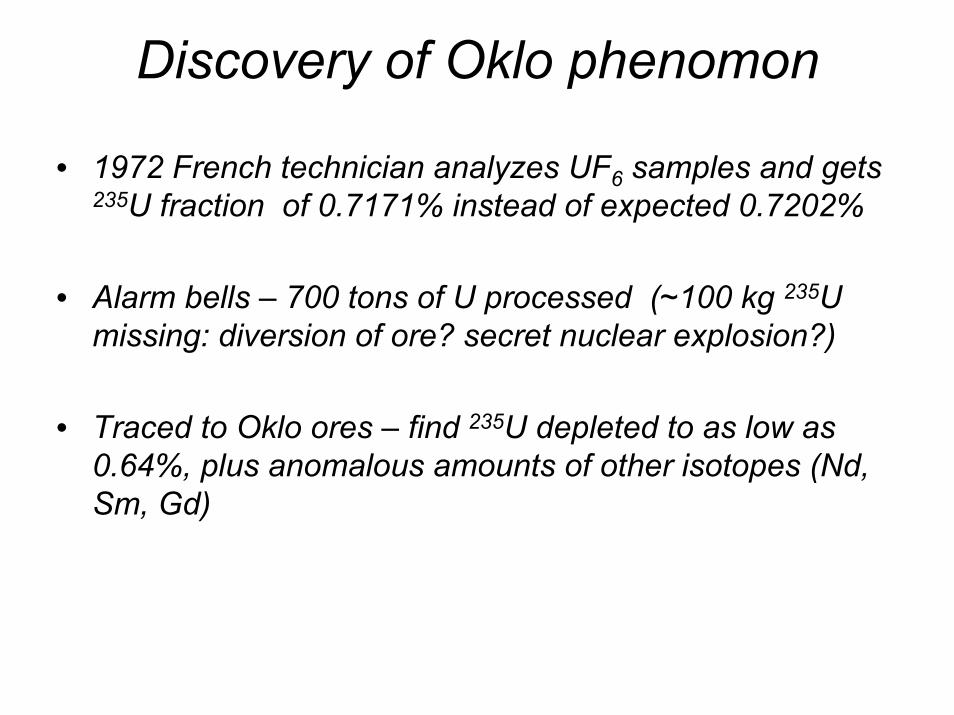
Discovery of Oklo phenomon
• 1972 French technician analyzes UF6 samples and gets 235U fraction of 0.7171% instead of expected 0.7202%
• Alarm bells – 700 tons of U processed (~100 kg 235U missing: diversion of ore? secret nuclear explosion?)
• Traced to Oklo ores – find 235U depleted to as low as 0.64%, plus anomalous amounts of other isotopes (Nd, Sm, Gd)
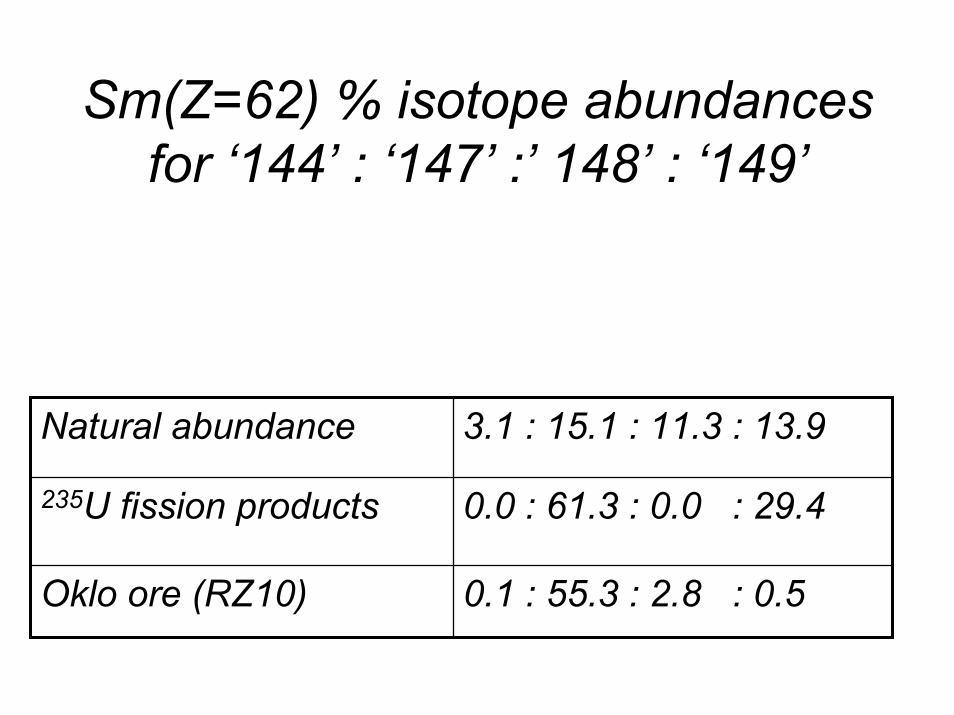
Sm(Z=62) % isotope abundances for ‘144’ : ‘147’ :’ 148’ : ‘149’
Natural abundance 3.1 : 15.1 : 11.3 : 13.9
235U fission products 0.0 : 61.3 : 0.0 : 29.4
Oklo ore (RZ10) 0.1 : 55.3 : 2.8 : 0.5
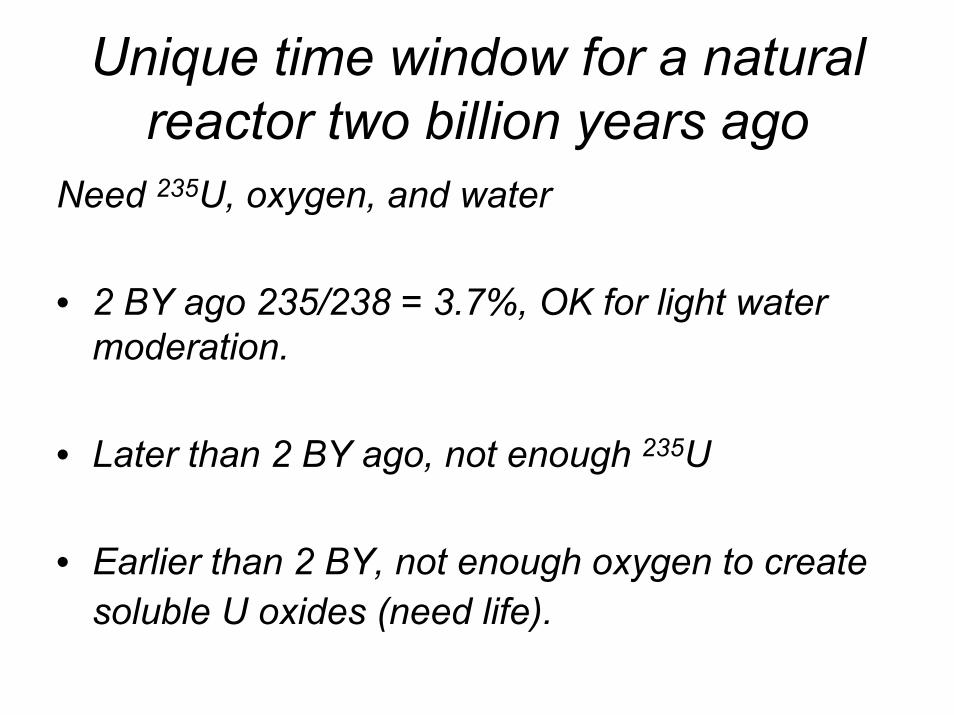
Unique time window for a natural reactor two billion years ago
Need 235U, oxygen, and water
• 2 BY ago 235/238 = 3.7%, OK for light water moderation.
• Later than 2 BY ago, not enough 235U
• Earlier than 2 BY, not enough oxygen to create soluble U oxides (need life).
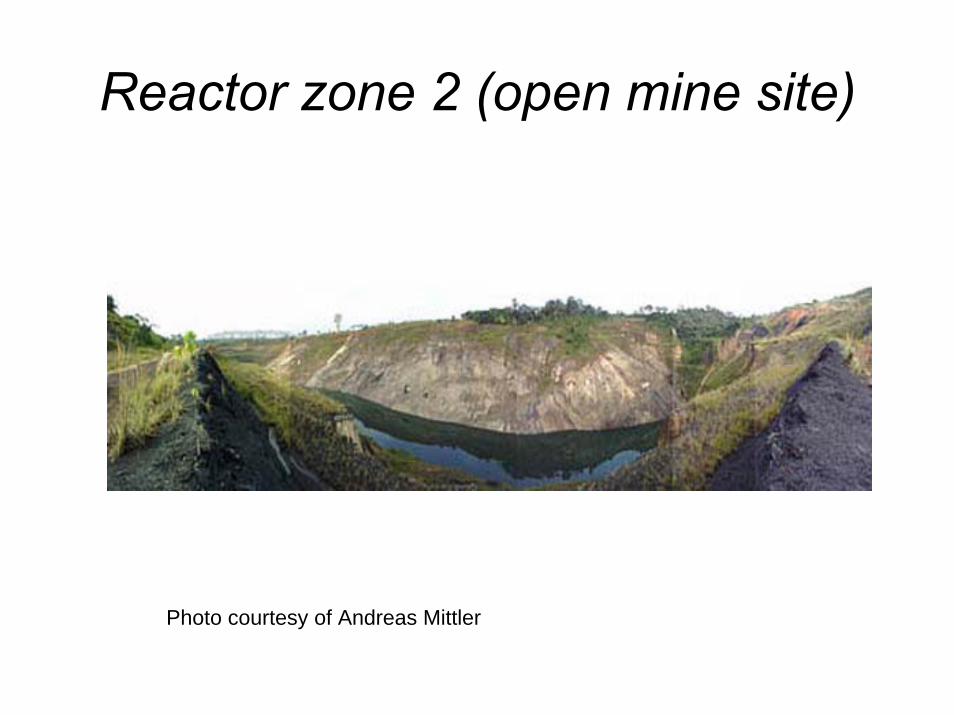
Reactor zone 2 (open mine site)
Photo courtesy of Andreas Mittler
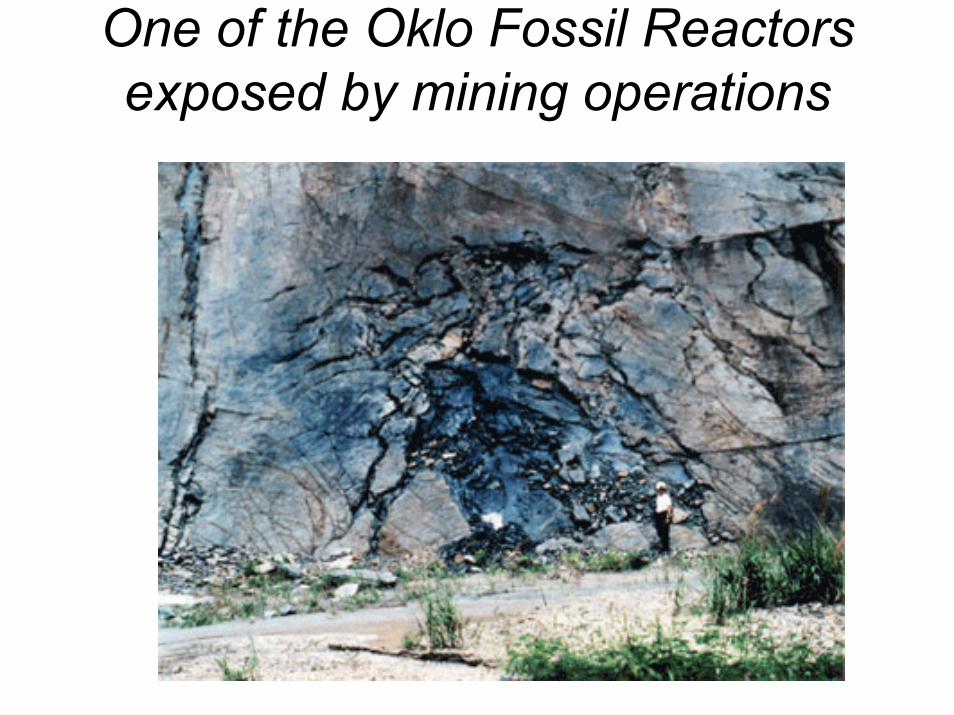
One of the Oklo Fossil Reactors exposed by mining operations
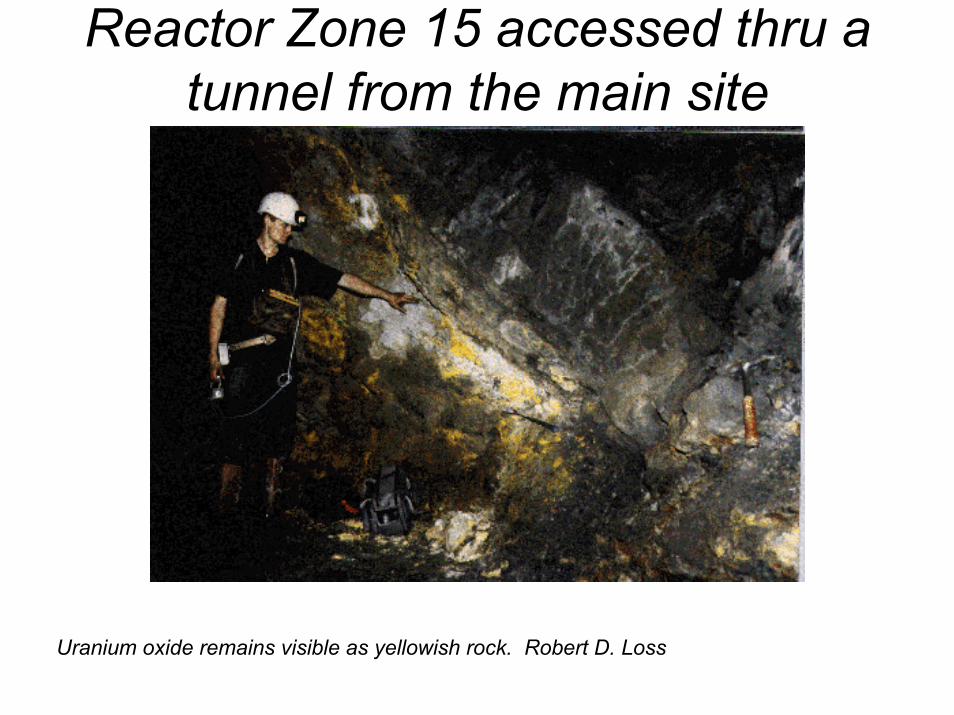
Reactor Zone 15 accessed thru a tunnel from the main site
Uranium oxide remains visible as yellowish rock. Robert D. Loss
Reactor zones 2 and 10
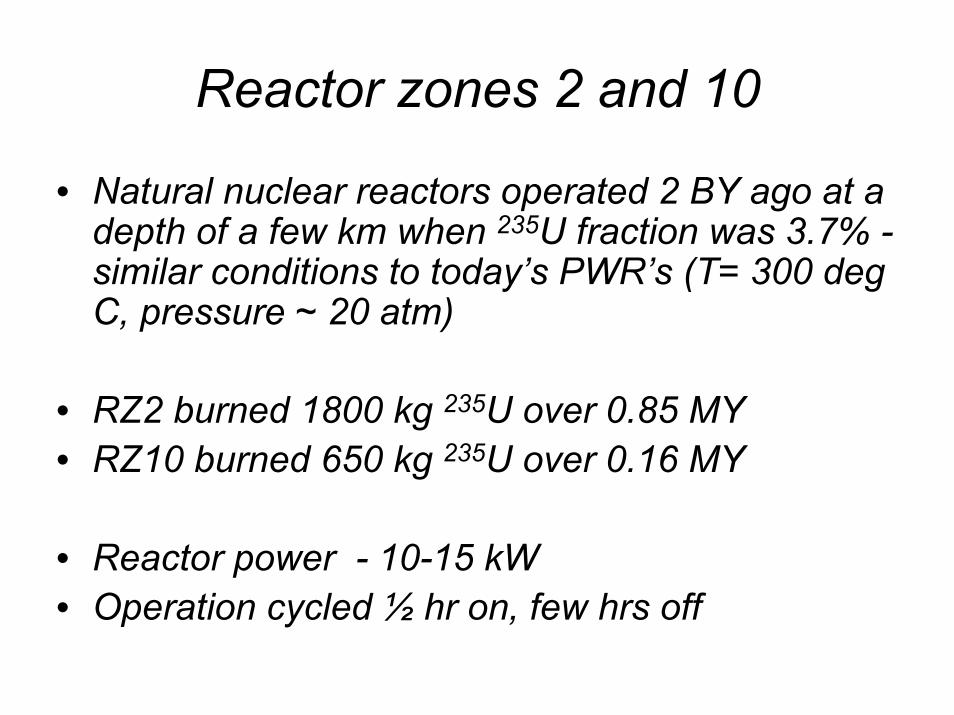
• Natural nuclear reactors operated 2 BY ago at a depth of a few km when 235U fraction was 3.7% -similar conditions to today’s PWR’s (T= 300 deg C, pressure ~ 20 atm)
• RZ2 burned 1800 kg 235U over 0.85 MY• RZ10 burned 650 kg 235U over 0.16 MY
• Reactor power - 10-15 kW• Operation cycled ½ hr on, few hrs off
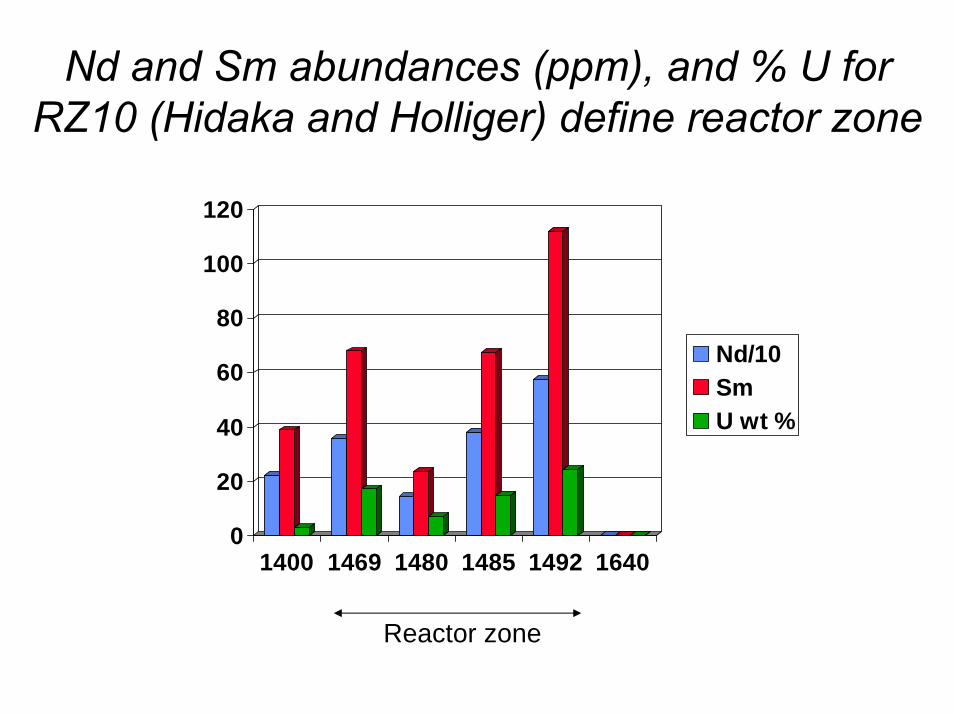
Nd and Sm abundances (ppm), and % U for RZ10 (Hidaka and Holliger) define reactor zone
0
20
40
60
80
100
120
1400 1469 1480 1485 1492 1640
Nd/10SmU wt %
Reactor zone
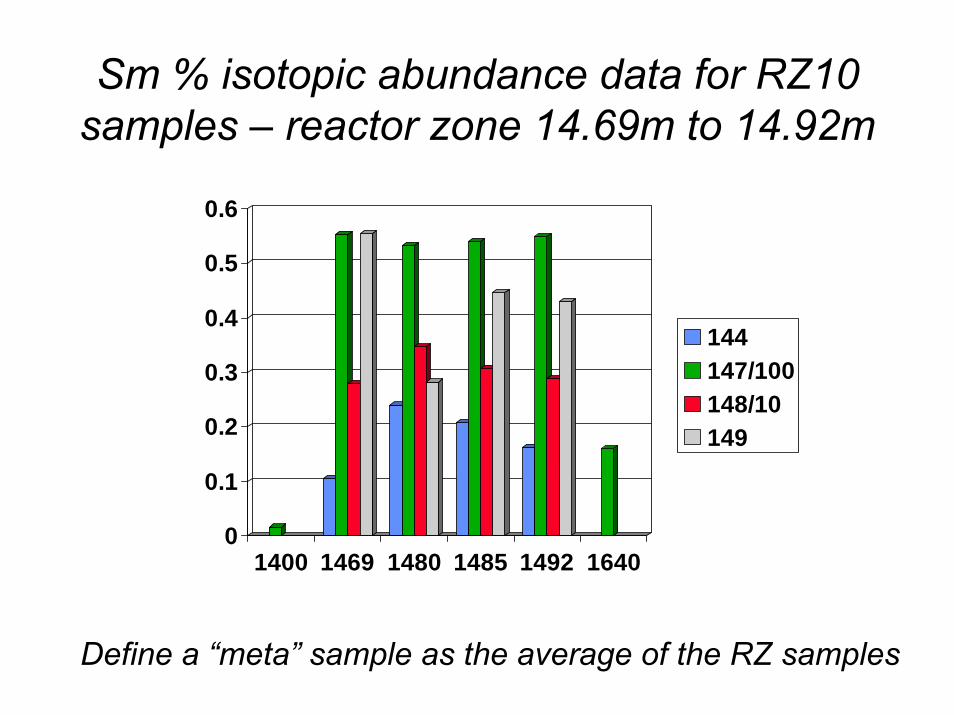
Sm % isotopic abundance data for RZ10 samples – reactor zone 14.69m to 14.92m
0
0.1
0.2
0.3
0.4
0.5
0.6
1400 1469 1480 1485 1492 1640
144147/100148/10149
Define a “meta” sample as the average of the RZ samples
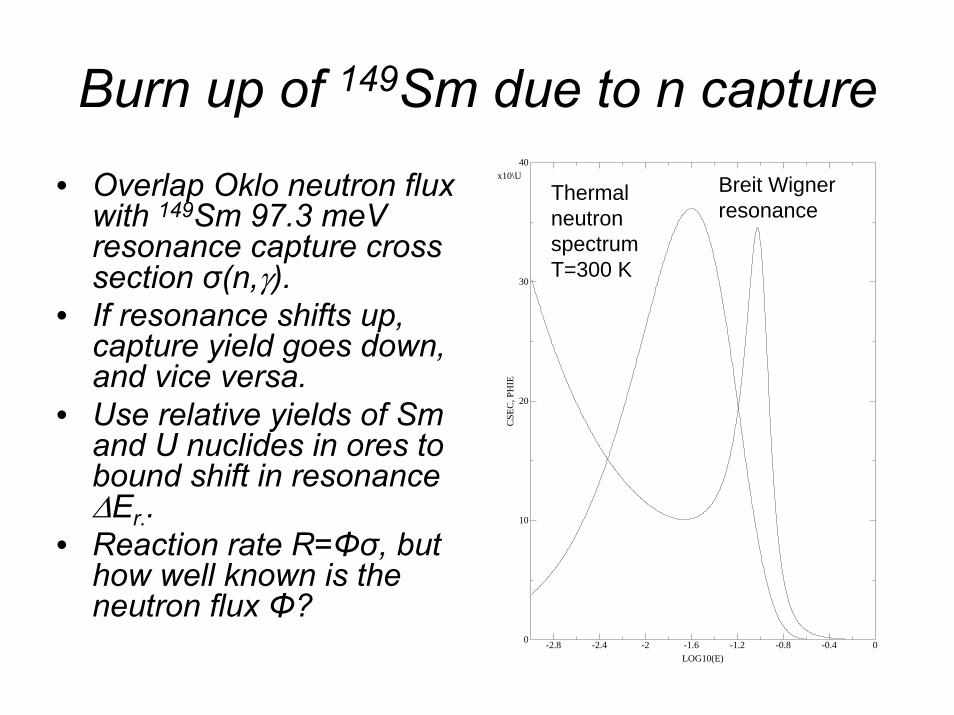
Burn up of 149Sm due to n capture
• Overlap Oklo neutron flux with 149Sm 97.3 meVresonance capture cross section σ(n,γ).
• If resonance shifts up, capture yield goes down, and vice versa.
• Use relative yields of Smand U nuclides in ores to bound shift in resonance ∆Er..
• Reaction rate R=Φσ, but how well known is the neutron flux Φ?
-2.8 -2.4 -2 -1.6 -1.2 -0.8 -0.4 00
10
20
30
40
x10\U
LOG10(E)
CSE
C, P
HIE
Thermal neutron spectrumT=300 K
Breit Wigner resonance
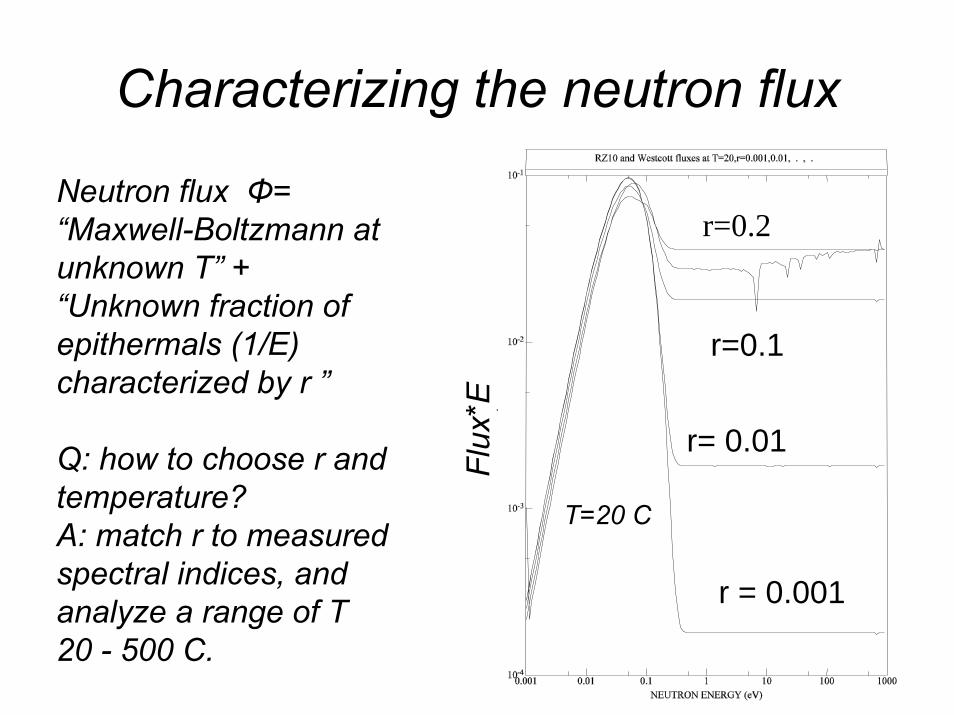
Characterizing the neutron flux
r = 0.001
r= 0.01
r=0.1
r=0.2
Flux
*E
Neutron flux Φ= “Maxwell-Boltzmann at unknown T” + “Unknown fraction of epithermals (1/E) characterized by r ”
Q: how to choose r and temperature?A: match r to measured spectral indices, and analyze a range of T 20 - 500 C.
T=20 C
Analysis of Oklo isotopic abundances show r is not zero
Isotopic abundances depend on reaction rate: R = Φeff σeff• Effective flux Φeff = n v0• Effective cross section σeff = (1/ nv0) ∫ σ(v) n(v) v dv• Rewrite as a function of thermal cross section σ0 and r:
Example: σeff (143Nd) = 335 -100 r
From 143Nd, 147Sm, 235U geochemical data (Naudet, HH) RZ2: r = 0.20 – 0.25RZ10: r = 0.15 ± 0.02
Use r values to select realistic models of the reactor zones, and then calculate the implications for 149Sm burn up.
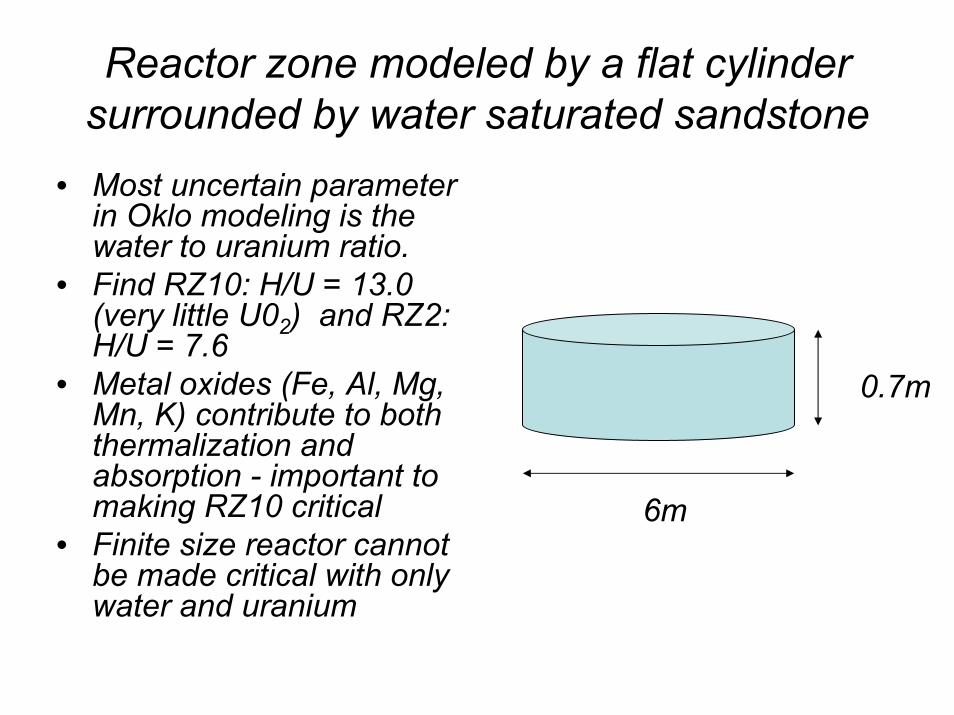
Reactor zone modeled by a flat cylinder surrounded by water saturated sandstone
• Most uncertain parameter in Oklo modeling is the water to uranium ratio.
• Find RZ10: H/U = 13.0 (very little U02) and RZ2: H/U = 7.6
• Metal oxides (Fe, Al, Mg, Mn, K) contribute to both thermalization and absorption - important to making RZ10 critical
• Finite size reactor cannot be made critical with only water and uranium
6m
0.7m
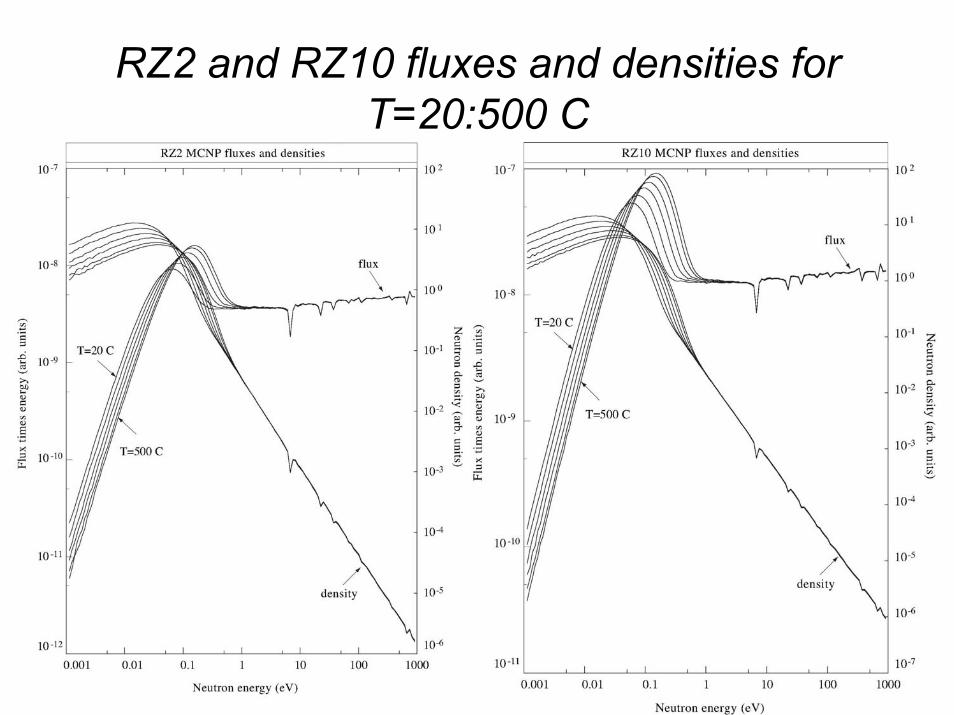
RZ2 and RZ10 fluxes and densities for T=20:500 C
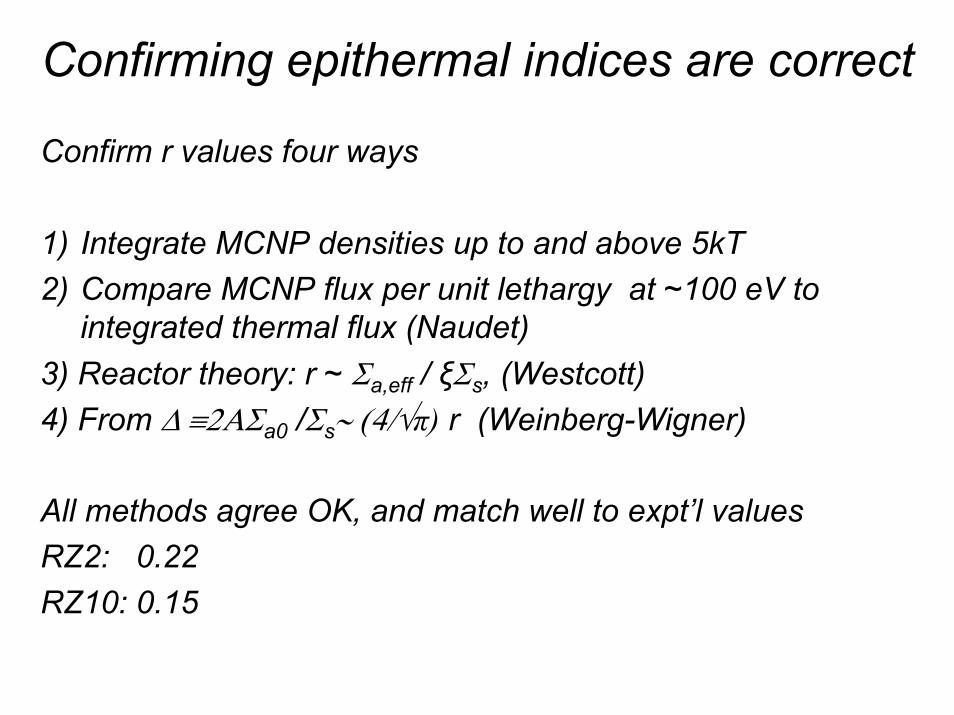
Confirming epithermal indices are correct
Confirm r values four ways
1) Integrate MCNP densities up to and above 5kT2) Compare MCNP flux per unit lethargy at ~100 eV to
integrated thermal flux (Naudet)3) Reactor theory: r ~ Σa,eff / ξΣs, (Westcott)4) From ∆ ≡2ΑΣa0 /Σs∼ (4/√π) r (Weinberg-Wigner)
All methods agree OK, and match well to expt’l valuesRZ2: 0.22 RZ10: 0.15
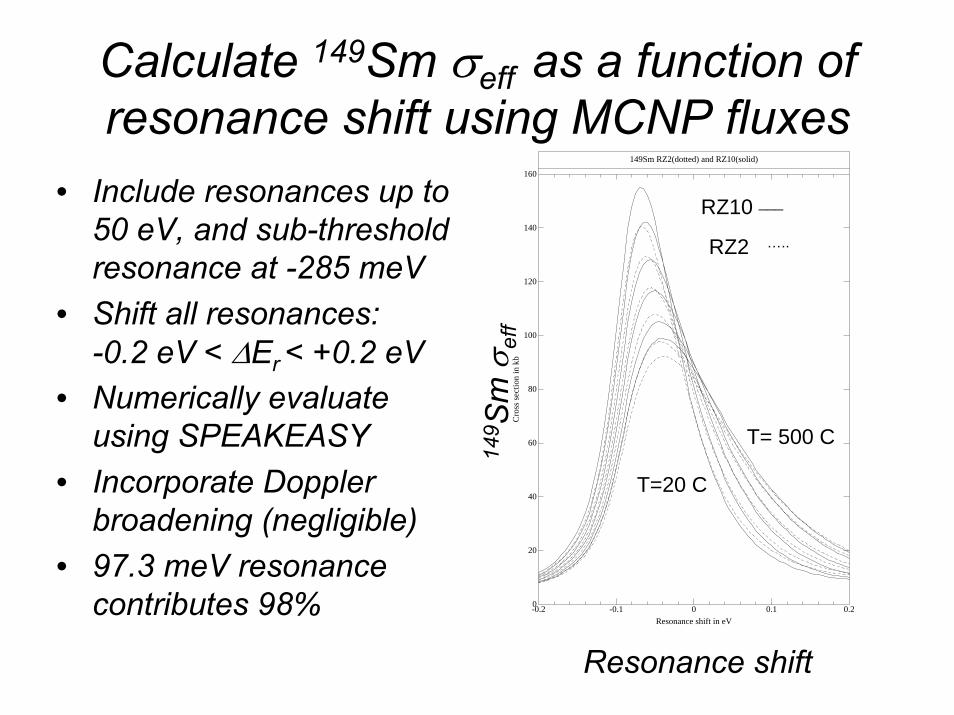
Calculate 149Sm σeff as a function of resonance shift using MCNP fluxes
-0.2 -0.1 0 0.1 0.20
20
40
60
80
100
120
140
160
Resonance shift in eV
Cro
ss s
ectio
n in
kb
149Sm RZ2(dotted) and RZ10(solid)
T=20 C
T= 500 C
RZ10 ___
RZ2 …..
Resonance shift
149 S
m σ
eff
• Include resonances up to 50 eV, and sub-threshold resonance at -285 meV
• Shift all resonances: -0.2 eV < ∆Er < +0.2 eV
• Numerically evaluate using SPEAKEASY
• Incorporate Doppler broadening (negligible)
• 97.3 meV resonance contributes 98%
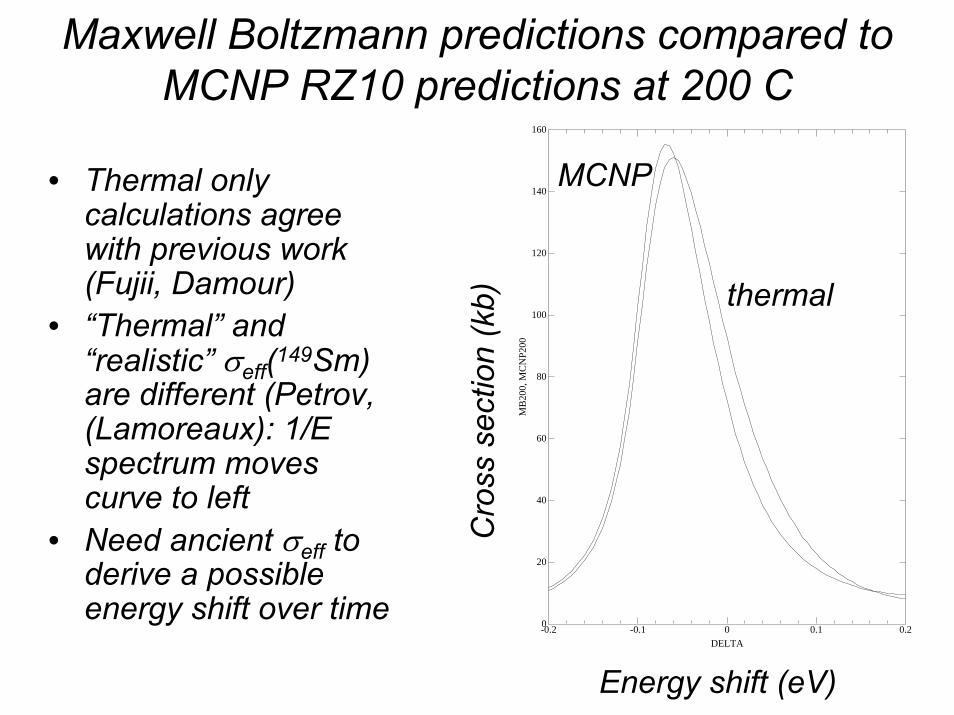
Maxwell Boltzmann predictions compared to MCNP RZ10 predictions at 200 C
-0.2 -0.1 0 0.1 0.20
20
40
60
80
100
120
140
160
DELTA
MB
200,
MC
NP2
00
thermal
MCNP
Cro
ss s
ectio
n (k
b)
• Thermal only calculations agree with previous work (Fujii, Damour)
• “Thermal” and “realistic” σeff(149Sm) are different (Petrov, (Lamoreaux): 1/E spectrum moves curve to left
• Need ancient σeff to derive a possible energy shift over time
Energy shift (eV)
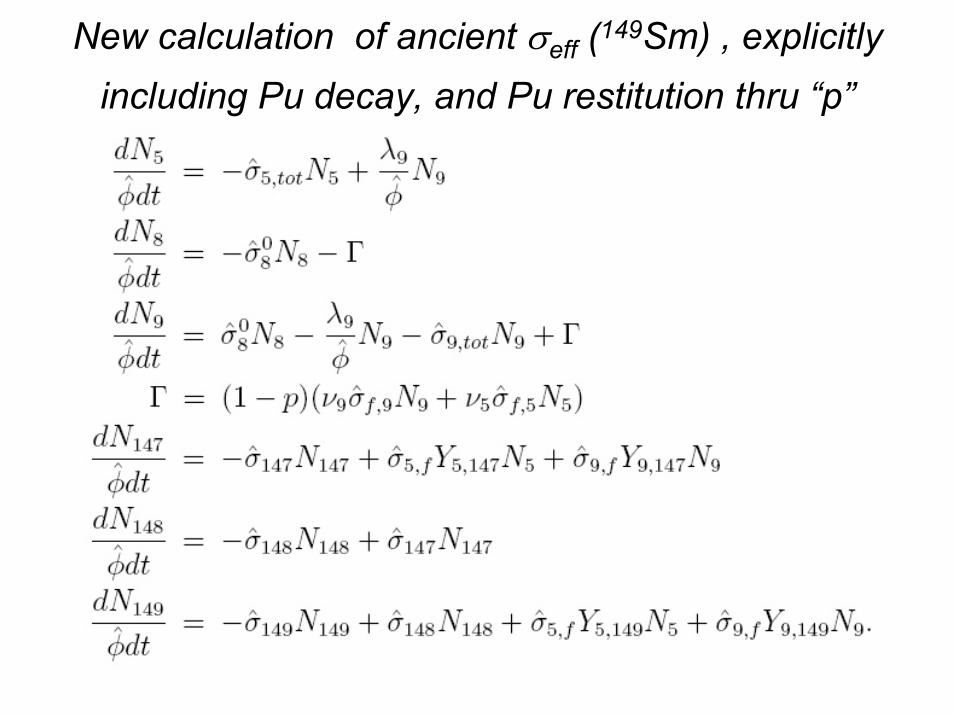
New calculation of ancient σeff (149Sm) , explicitly including Pu decay, and Pu restitution thru “p”
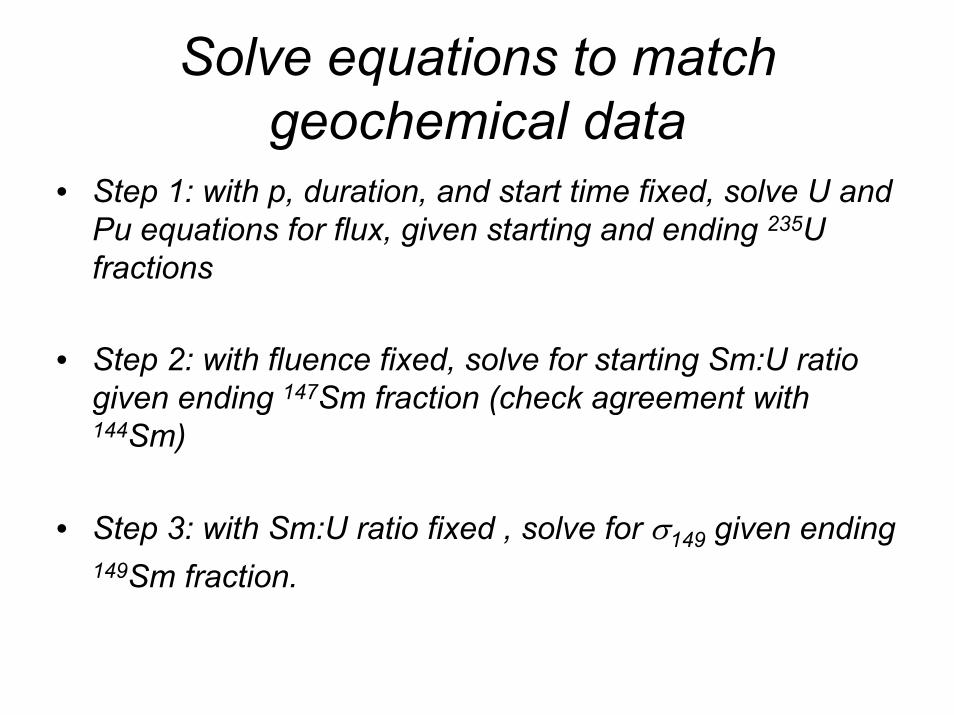
Solve equations to match geochemical data
• Step 1: with p, duration, and start time fixed, solve U and Pu equations for flux, given starting and ending 235U fractions
• Step 2: with fluence fixed, solve for starting Sm:U ratio given ending 147Sm fraction (check agreement with 144Sm)
• Step 3: with Sm:U ratio fixed , solve for σ149 given ending 149Sm fraction.
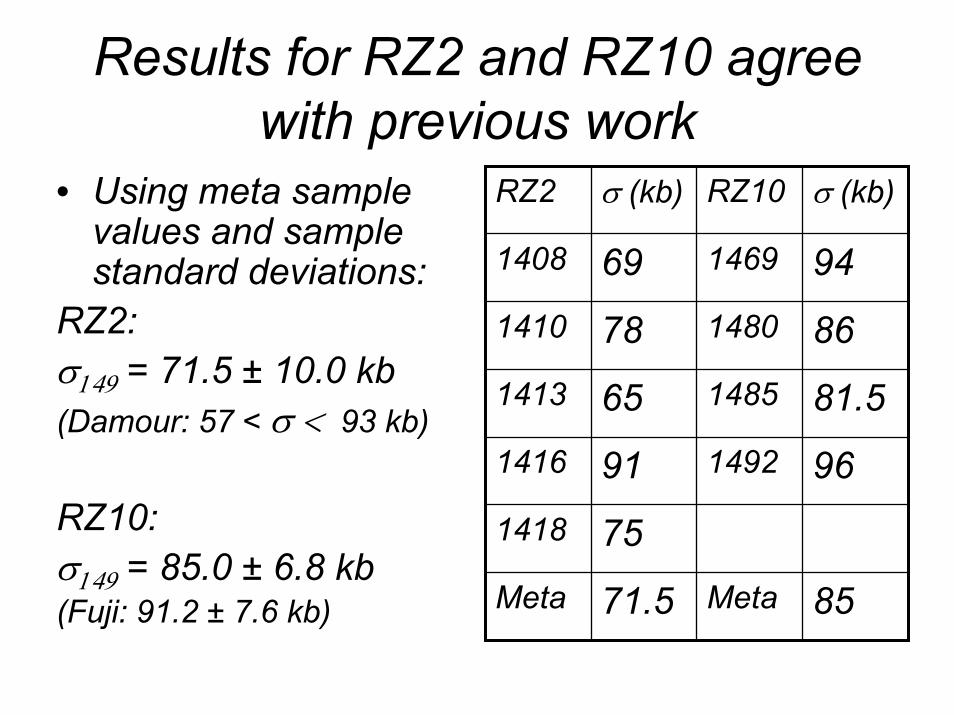
Results for RZ2 and RZ10 agree with previous work
• Using meta sample values and sample standard deviations:
RZ2: σ149 = 71.5 ± 10.0 kb(Damour: 57 < σ < 93 kb)
RZ10: σ149 = 85.0 ± 6.8 kb(Fuji: 91.2 ± 7.6 kb)
RZ2 σ (kb) RZ10 σ (kb)
1408 69 1469 94
1410 78 1480 86
1413 65 1485 81.5
1416 91 1492 96
1418 75
Meta 71.5 Meta 85
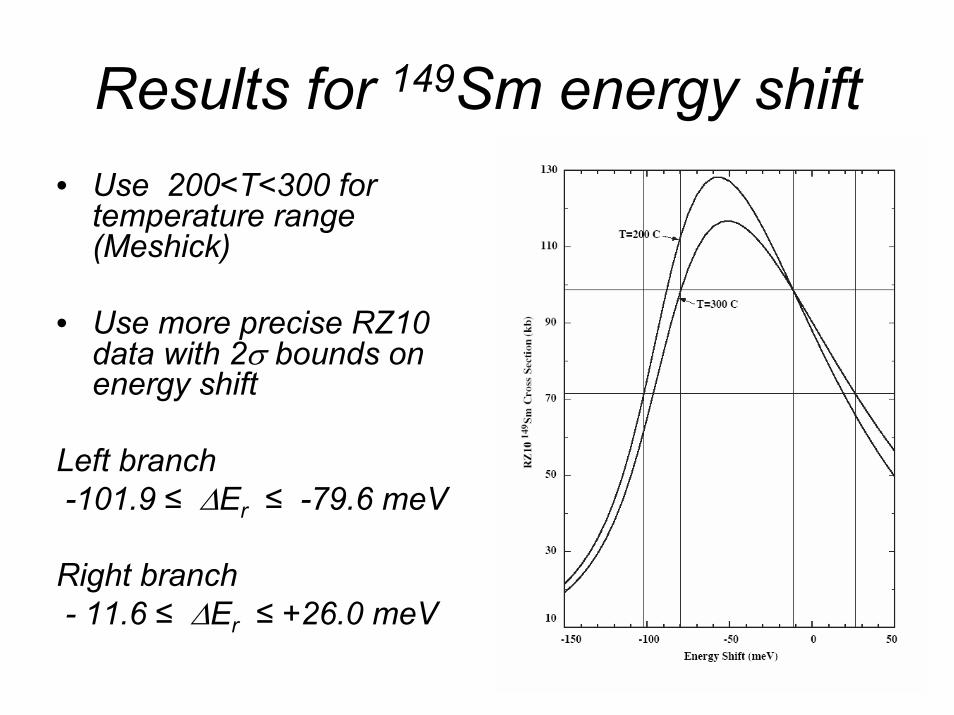
Results for 149Sm energy shift• Use 200<T<300 for
temperature range (Meshick)
• Use more precise RZ10 data with 2σ bounds on energy shift
Left branch-101.9 ≤ ∆Er ≤ -79.6 meV
Right branch- 11.6 ≤ ∆Er ≤ +26.0 meV
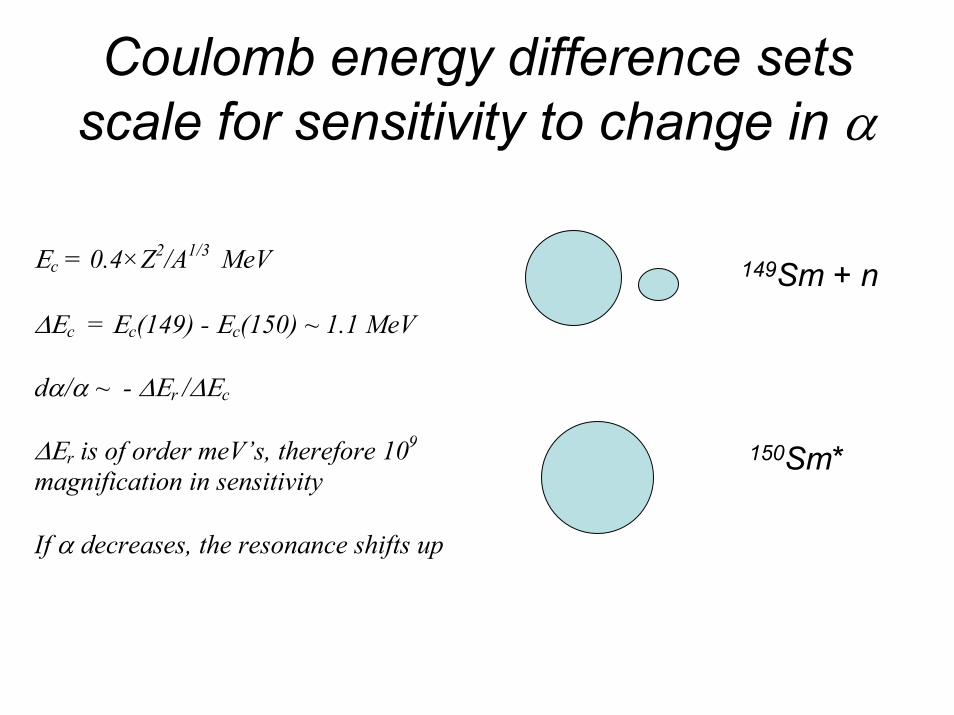
Coulomb energy difference sets scale for sensitivity to change in α
Εc = 0.4×Z2/A1/3 MeV ∆Εc = Εc(149) - Εc(150) ~ 1.1 MeV dα/α ~ - ∆Εr /∆Εc
∆Εr is of order meV’s, therefore 109 magnification in sensitivity If α decreases, the resonance shifts up
149Sm + n
150Sm*
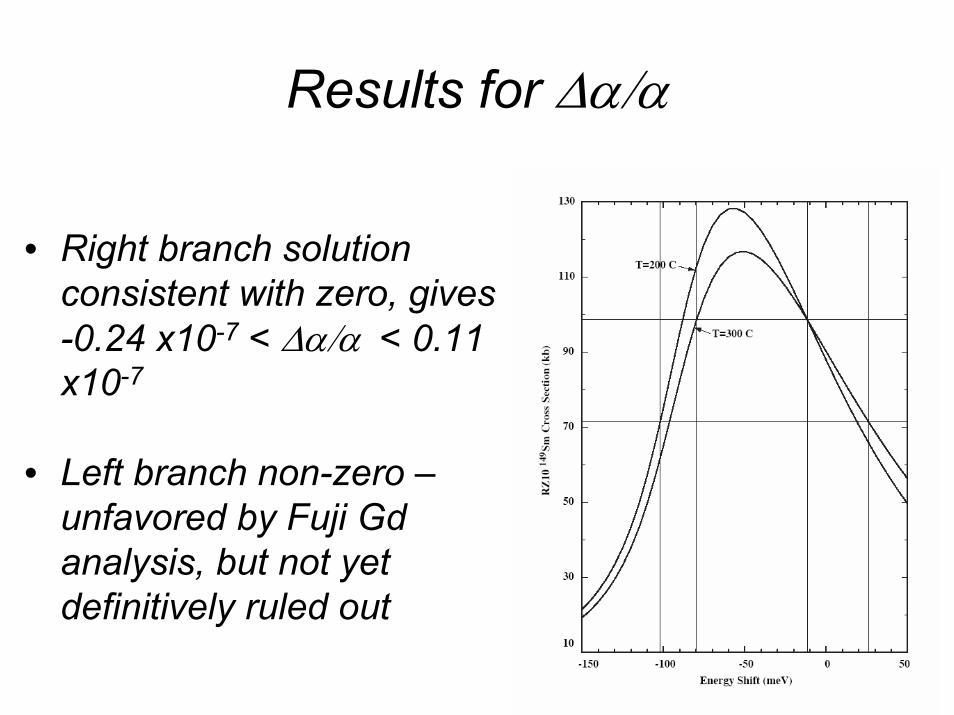
Results for ∆α/α
• Right branch solution consistent with zero, gives -0.24 x10⁻⁷ < ∆α/α < 0.11 x10⁻⁷
• Left branch non-zero –unfavored by Fuji Gdanalysis, but not yet definitively ruled out
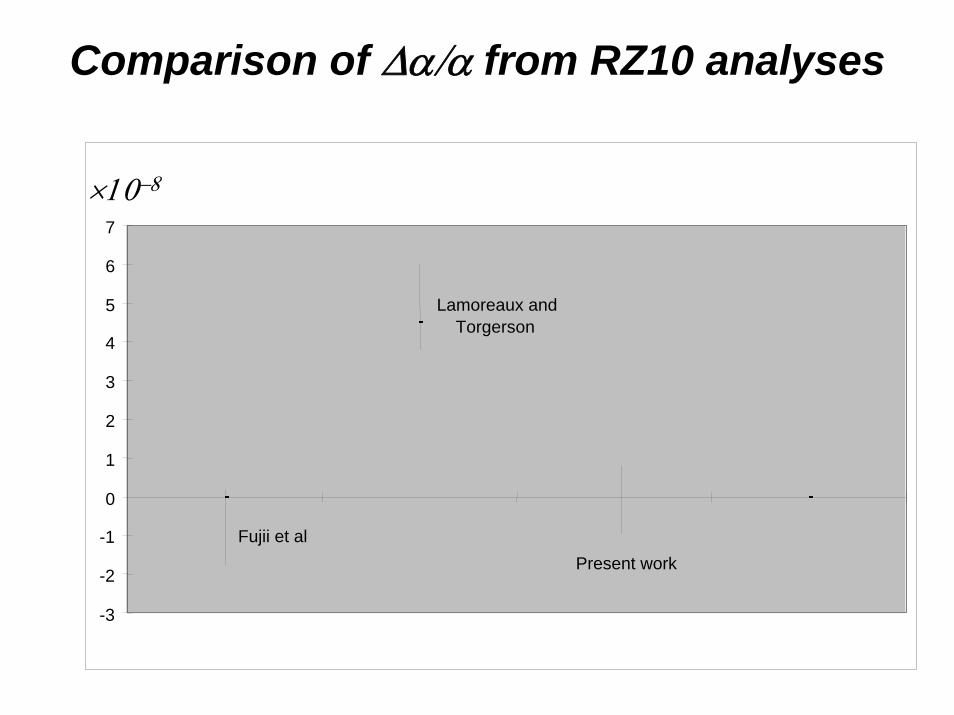
Comparison of ∆α/α from RZ10 analyses
-3
-2
-1
0
1
2
3
4
5
6
7
Fujii et al
Lamoreaux andTorgerson
Present work
×10−8
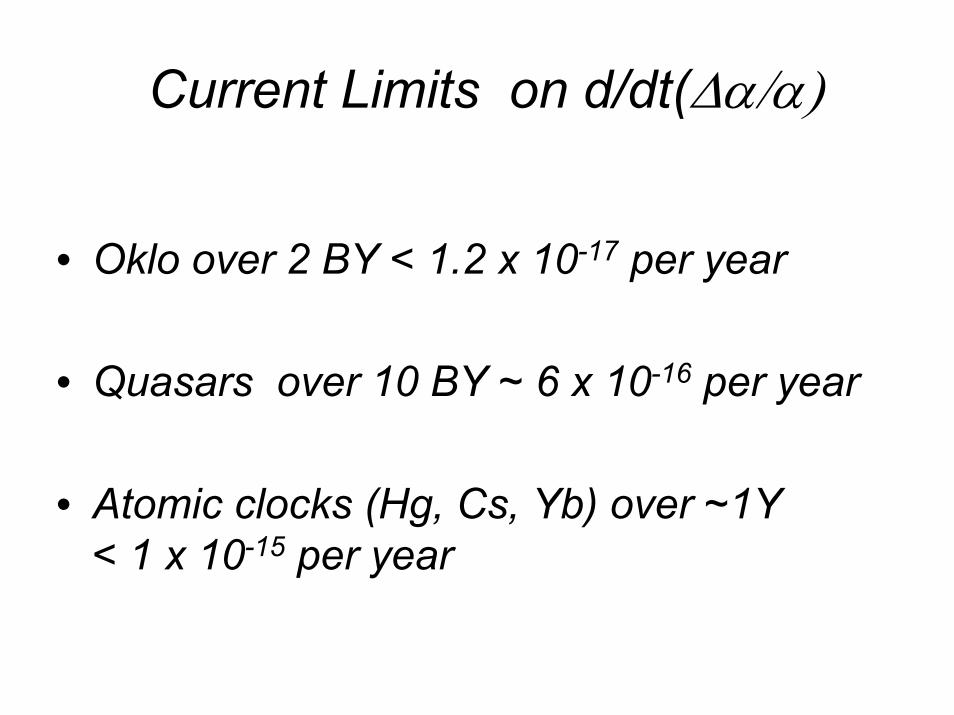
Current Limits on d/dt(∆α/α)
• Oklo over 2 BY < 1.2 x 10⁻¹⁷ per year
• Quasars over 10 BY ~ 6 x 10-16 per year
• Atomic clocks (Hg, Cs, Yb) over ~1Y < 1 x 10-15 per year
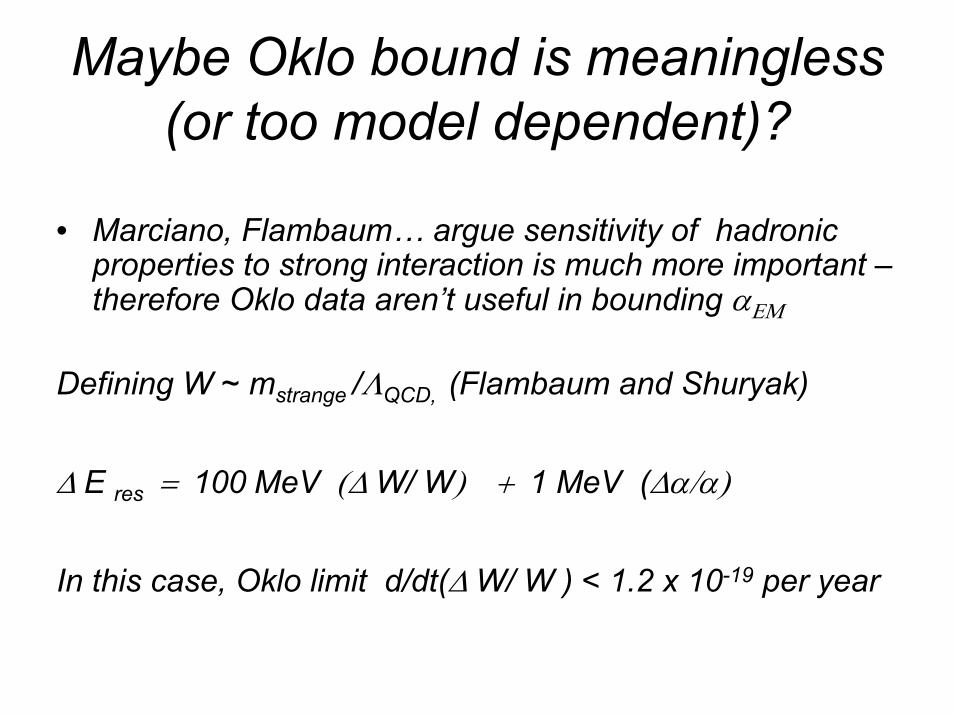
Maybe Oklo bound is meaningless (or too model dependent)?
• Marciano, Flambaum… argue sensitivity of hadronicproperties to strong interaction is much more important –therefore Oklo data aren’t useful in bounding αΕΜ
Defining W ~ mstrange /ΛQCD, (Flambaum and Shuryak)
∆ E res = 100 MeV (∆ W/ W) + 1 MeV (∆α/α)
In this case, Oklo limit d/dt(∆ W/ W ) < 1.2 x 10⁻¹⁹ per year
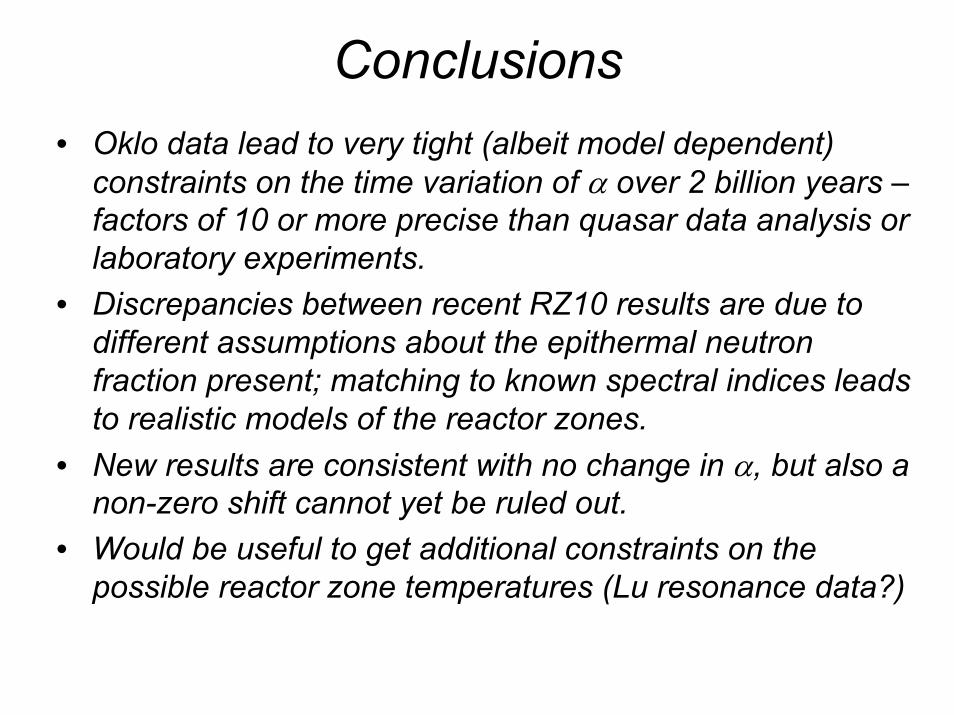
Conclusions• Oklo data lead to very tight (albeit model dependent)
constraints on the time variation of α over 2 billion years –factors of 10 or more precise than quasar data analysis or laboratory experiments.
• Discrepancies between recent RZ10 results are due to different assumptions about the epithermal neutron fraction present; matching to known spectral indices leads to realistic models of the reactor zones.
• New results are consistent with no change in α, but also a non-zero shift cannot yet be ruled out.
• Would be useful to get additional constraints on the possible reactor zone temperatures (Lu resonance data?)


![Best Constant in Sobolev Inequality (*). GIORGIO …js/Math646/talenti.sobolev.pdfGIOR~IO TALE~I: Best constant in Sobolev inequality 355 ftu']dx must be interpreted as the total variation](https://img.pdfslide.us/doc/110x75/5ad07ddf7f8b9aca598dbd7e/best-constant-in-sobolev-inequality-giorgio-jsmath646-io-talei-best.jpg)