Embed Size (px)
Citation preview
2015 UNDP Human Development Report Office
BACKGROUND PAPER
Time Use Across the World: Findings of
a World Compilation of
Time Use Surveys
Jacques Charmes
Time Use Across the World: Findings of a World Compilation of Time Use Surveys
2015 Human Development Report Office
2 BACKGROUND PAPER
Jacques Charmes is an economist and statistician. Currently emeritus research director at the French
Scientific Research Institute for Development (IRD, formerly ORSTOM), he was until recently director of
the Department of Social and Health Sciences at this institute, and professor of economics at the
University of Versailles and at the Institute for Political Science (Sciences Po) in Paris. He has been
involved in the design and analysis of many labour force, living standards, informal sector and time-use
surveys in North and sub-Saharan Africa, and has written extensively on the measurement of informal
labour and National Accounts, with special emphasis on women. He is one of the founding members of
the international network WIEGO (Women in the Informal Economy: Globalizing and Organizing).
ABSTRACT
This paper is based on 102 time use surveys carried out in 65 countries. Reports of the surveys were
mostly found on the websites of national statistical agencies or other official institutions. Access to
micro-data was not necessary.
Survey data have been gathered in a single database and used for in-depth comparative analysis. Such a
compilation did not take care of the fact that age groups differ from country to country, but only
retained the surveys for analysis based on: a) use of a diary as a survey instrument, or the record of all
activities performed during a 24-hour day (with the exception of Latin American countries where none
used a diary), b) a sufficiently detailed classification of activities (these first two criteria excluded all
living standards surveys) and c) national level coverage (with a few exceptions, such as China, India, the
Islamic Republic of Iran and Panama).
One of the major difficulties of the exercise was the precise identification of certain groups of activities,
because there is still much progress needed in harmonization of classifications. The compilation
provides interesting regional and subregional profiles, with a gender perspective, for two major
categories (paid and unpaid work) as well as for learning, social life and leisure, personal care and
maintenance. For a few countries, especially those using the new International Classification for Time-
Use Statistics (ICATUS), more detailed information is made available on informal and formal work time,
or time dedicated to water and firewood fetching.
Time Use Across the World: Findings of a World Compilation of Time Use Surveys
2015 Human Development Report Office
BACKGROUND PAPER 3
Introduction
Since the early 1970s, time use surveys have been carried out at national level and with some
attempts to standardize instruments of data collection, firstly in Europe (Norway) and other
developed countries. They were designed to assess progress in lifestyles, focussing on time spent for
leisure, and on transport and commuting, and also to compare paid and unpaid work. In the late
1990s, after the 1995 Beijing Fourth World Conference on Women, the first time use surveys were
implemented in developing and transition countries, with the main objective being to measure the
gender gap in paid and unpaid work, and tentatively to establish satellite accounts of household
production.
To date, nearly a hundred surveys for 65 countries are available for in-depth comparative
analyses. These have been gathered for the present exercise, with the stipulation that access to micro-
data was not necessary. More countries and surveys have undertaken time use data collection, but the
related information was not accessible for this exercise, which has been limited to countries for which
survey reports are freely available on the websites of national institutions (mainly, national statistical
offices). The few exceptions to this rule are Latvia and Lithuania (accessed through the Harmonised
European Time Use Survey or HETUS website) and Australia, Germany, Hungary, Poland and
Slovenia (accessed through the Organisation for Economic Co-operation and Development or OECD
website). These websites, as well as those of the International Association of Time Use Research
(IATUR), the Centre for Time Use Research (CTUR, University of Oxford) and the United Nations
Statistics Division are rich sources of time use data. All national and international sources can be
found in the references at the end of this report.
Conditions of the study
The present study1 was undertaken as part of the preparation of the Human Development Report
2015. It gathers as many time use survey data and metadata as possible, and builds synthetic
indicators on time use across the world, based on this data set.
In order to facilitate cross-country comparisons and ensure a certain degree of quality and
relevance, this exercise deals only with:
1 This paper was updated in February 2016 by adding time use surveys for two countries—the Republic of Moldova
(2011-2012) and the former Yugoslav Republic of Macedonia (2014-2015). Two new surveys were added for the
United Republic of Tanzania (2014) and the United States of America (2014). These surveys were not publicly
available at the time of writing the Human Development Report 2015.
Time Use Across the World: Findings of a World Compilation of Time Use Surveys
2015 Human Development Report Office
4 BACKGROUND PAPER
Surveys conducted at national level, or at least on large samples of different regions in the
country (China, India) or at the urban level (Islamic Republic of Iran, Panama), and not surveys
covering only the capital city.
Surveys based on a diary, i.e., a questionnaire designed for defining time spent on various
activities, per time slots of—at most—one hour (and more usually 10, 15 or 30 minute slots) along the
24 hours of a day.
Surveys using a detailed classification of time use activities, i.e., one of the
international classifications (ICATUS or HETUS) or national classifications based on a systematic
classification of the activities. Data collection based on a too short list of activities (less than 10 items)
have not been taken into account. Therefore, living standards surveys collecting data for a limited list
of activities (usually less than 10) and for a reference period of a week or a month have not been
considered.
In other words, the time use surveys gathered and analysed here are nationwide, based on
diaries, and provide data that allow distinguishing between various components of paid work (formal,
informal, subsistence) and unpaid work (unpaid domestic services, care work, voluntary), as well as
various components of leisure and cultural activities (sports, hobbies, culture, mass media), and
finally time spent for satisfying physiological needs (sleeping, eating, self-care, etc.). The database
built for this work does not contain surveys restricted to a town (capital or not) or small region; pilot
surveys limited to small, non-representative samples; or surveys using a methodology not based on
diary questionnaires and a detailed classification of activities.
There is, however, an exception for Latin America. None of the seven Latin American countries
included in the database used a diary for data collection on time use. They have developed a detailed
questionnaire for each eligible household member asking the number of hours spent weekly (on
weekdays, on the one hand, on weekend days, on the other hand) according to a detailed list of
activities (from 16 broad categories for the least detailed, to more than 80 subcategories for the most
detailed). The national reports published their results in numbers of hours and minutes per week
rather than in hours and minutes per day.
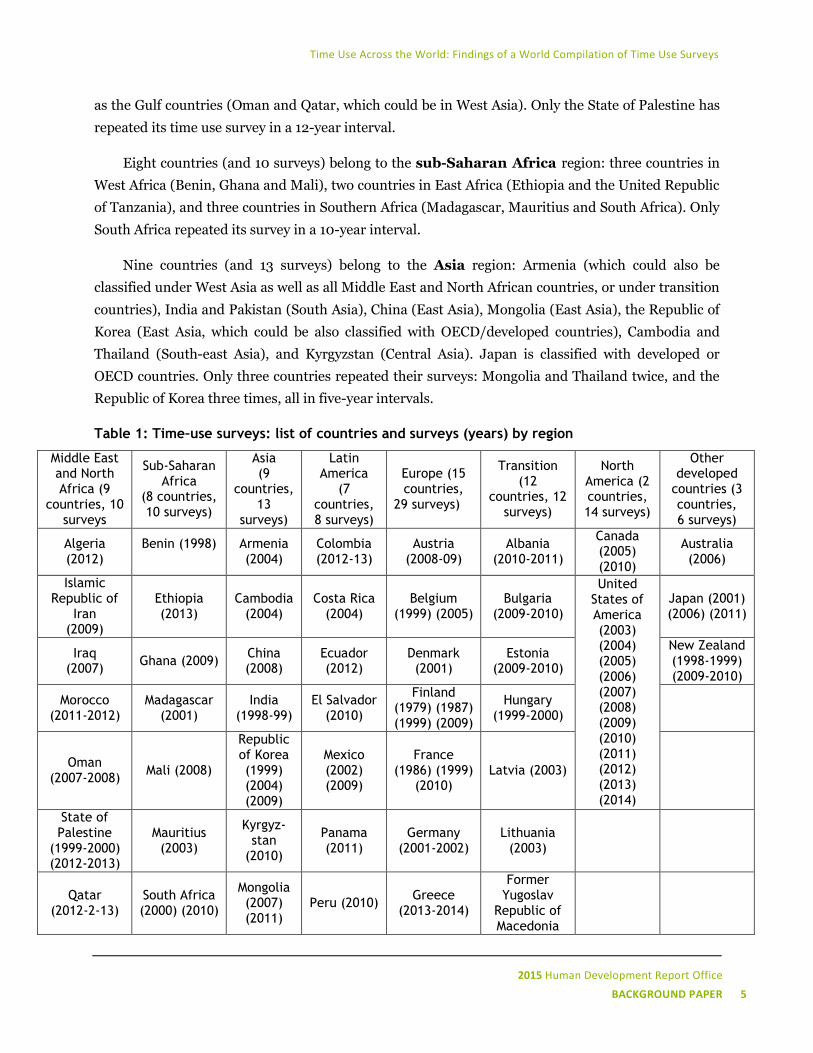
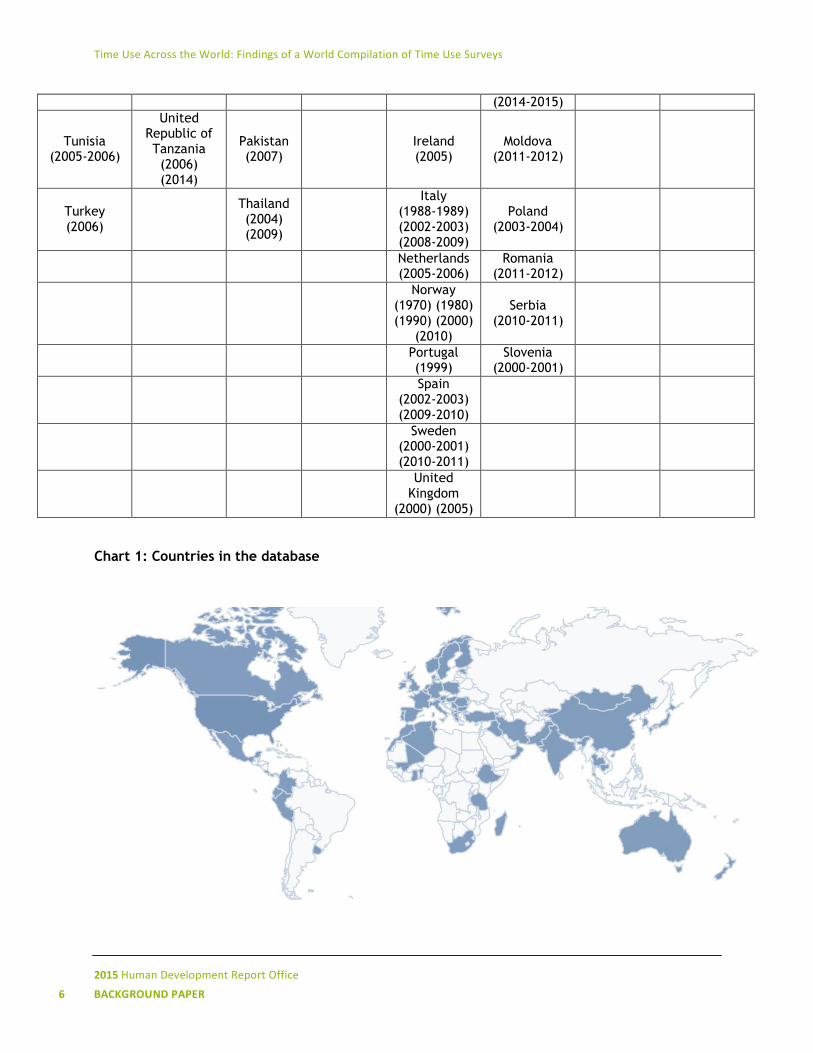
Table 1 and Chart 1 list the 65 countries and 102 surveys included in the database, with the
following classification of countries.
Nine countries (and 10 surveys) belong to the Middle East and North Africa region, which
includes Turkey (which could be classified under West Asia or OECD countries), the Islamic Republic
of Iran (which could be classified in Central Asia), the three Maghreb countries (Algeria, Morocco and
Tunisia, which could be classified in North Africa), Iraq and the State of Palestine (West Asia), as well
Time Use Across the World: Findings of a World Compilation of Time Use Surveys
2015 Human Development Report Office
BACKGROUND PAPER 5
as the Gulf countries (Oman and Qatar, which could be in West Asia). Only the State of Palestine has
repeated its time use survey in a 12-year interval.
Eight countries (and 10 surveys) belong to the sub-Saharan Africa region: three countries in
West Africa (Benin, Ghana and Mali), two countries in East Africa (Ethiopia and the United Republic
of Tanzania), and three countries in Southern Africa (Madagascar, Mauritius and South Africa). Only
South Africa repeated its survey in a 10-year interval.
Nine countries (and 13 surveys) belong to the Asia region: Armenia (which could also be
classified under West Asia as well as all Middle East and North African countries, or under transition
countries), India and Pakistan (South Asia), China (East Asia), Mongolia (East Asia), the Republic of
Korea (East Asia, which could be also classified with OECD/developed countries), Cambodia and
Thailand (South-east Asia), and Kyrgyzstan (Central Asia). Japan is classified with developed or
OECD countries. Only three countries repeated their surveys: Mongolia and Thailand twice, and the
Republic of Korea three times, all in five-year intervals.
Table 1: Time–use surveys: list of countries and surveys (years) by region
Middle East and North Africa (9
countries, 10 surveys
Sub-Saharan Africa
(8 countries, 10 surveys)
Asia (9
countries,13
surveys)
Latin America
(7 countries, 8 surveys)
Europe (15 countries,
29 surveys)
Transition (12
countries, 12 surveys)
North America (2 countries, 14 surveys)
Other developed
countries (3 countries, 6 surveys)
Algeria (2012)
Benin (1998)
Armenia (2004)
Colombia (2012-13)
Austria (2008-09)
Albania (2010-2011)
Canada (2005) (2010)
Australia (2006)
Islamic Republic of
Iran (2009)
Ethiopia (2013)
Cambodia (2004)
Costa Rica (2004)
Belgium (1999) (2005)
Bulgaria (2009-2010)
United States of America (2003) (2004) (2005) (2006) (2007) (2008) (2009) (2010) (2011) (2012) (2013) (2014)
Japan (2001) (2006) (2011)
Iraq (2007)
Ghana (2009) China (2008)
Ecuador (2012)
Denmark (2001)
Estonia (2009-2010)
New Zealand (1998-1999) (2009-2010)
Morocco (2011-2012)
Madagascar (2001)
India (1998-99)
El Salvador (2010)
Finland (1979) (1987) (1999) (2009)
Hungary (1999-2000)
Oman (2007-2008)
Mali (2008)
Republic of Korea (1999) (2004) (2009)
Mexico (2002) (2009)
France (1986) (1999)
(2010) Latvia (2003)
State of Palestine
(1999-2000) (2012-2013)
Mauritius (2003)
Kyrgyz-stan
(2010)
Panama (2011)
Germany (2001-2002)
Lithuania (2003)
Qatar (2012-2-13)
South Africa (2000) (2010)
Mongolia (2007) (2011)
Peru (2010) Greece
(2013-2014)
Former Yugoslav
Republic of Macedonia
Time Use Across the World: Findings of a World Compilation of Time Use Surveys
2015 Human Development Report Office
6 BACKGROUND PAPER
(2014-2015)
Tunisia (2005-2006)
United Republic of Tanzania (2006) (2014)
Pakistan (2007)
Ireland (2005)
Moldova (2011-2012)
Turkey (2006)
Thailand (2004) (2009)
Italy (1988-1989) (2002-2003) (2008-2009)
Poland (2003-2004)
Netherlands (2005-2006)
Romania (2011-2012)
Norway (1970) (1980) (1990) (2000)
(2010)
Serbia (2010-2011)
Portugal (1999)
Slovenia (2000-2001)
Spain
(2002-2003) (2009-2010)
Sweden
(2000-2001) (2010-2011)
United
Kingdom (2000) (2005)
Chart 1: Countries in the database
Time Use Across the World: Findings of a World Compilation of Time Use Surveys
2015 Human Development Report Office
BACKGROUND PAPER 7
Seven countries (and eight surveys) belong to Latin America: five countries could also be
classified under Central America (Costa Rica, El Salvador, Honduras, Mexico and Panama) and three
countries under the South America region (Colombia, Ecuador and Peru). Only Mexico repeated its
survey in a seven-year interval.
With 15 countries (and 29 surveys), Europe has the richest dataset, and even more if we add the
10 transition countries of Eastern Europe. Five belong to Western Europe (Austria, Belgium, France,
Germany and the Netherlands), four to Southern Europe (Greece, Italy, Portugal, Spain, and possibly
Albania, Serbia and Slovenia), six to Northern Europe (Denmark, Finland, Norway, Sweden, Ireland
and the United Kingdom, and possibly Estonia, Latvia and Lithuania), and four to Eastern Europe,
including transition countries (Bulgaria, Hungary, Poland and Romania). Except for transition
countries, most European countries have repeated their surveys, but only eight are in the database)
with various time intervals (5 to 10 years in general). Surveys for Luxemburg and Switzerland could
not be accessed from the websites.
The transition countries do not constitute a geographical category, although they are all located
in Eastern Europe, including the Baltic countries. Armenia and Kyrgyzstan could also be included in
this broad category, but they probably have fewer common characteristics with the others, which
justifies leaving them with other Asian countries. The reason for a specific category for transition
countries lies in the fact that, as former socialist economies, they were characterized by high female
economic participation rates, high rates of wage-employment and large facilities for childcare
provided by the State, all features that could explain strong specificities in time use. Twelve countries
belong to this category of transition countries (with possibly two more in Asia). None of them have
repeated their surveys yet.
In North America, Canada and the United States have repeated their surveys, and in the latter,
the American Time Use Survey (ATUS) has been conducted on a yearly basis since 2003.
Finally, in the last category of other developed countries, one can find three countries:
Australia, Japan and New Zealand, all OECD countries. Two have repeated their surveys in a 5-year
(Japan) or 10-year (New Zealand) interval.
Two more countries have carried out a time use survey based on a diary: Cuba (2001) and
Bangladesh (2012), but they did not make their results available in a way that allows international
comparisons. Data for Cuba are only available disaggregated by urban and rural areas, and for
Bangladesh disaggregated by working/not working. Also, data have been collected in Djibouti (2012),
Benin (2015, repeated survey) and Cameroon (2015), but they have not been analysed and published.
It is the first time that such a worldwide comparison has been attempted. Some earlier efforts
exist at the aggregate or regional level: for instance, at the European or OECD country level (see, for
Time Use Across the World: Findings of a World Compilation of Time Use Surveys
2015 Human Development Report Office
8 BACKGROUND PAPER
example, OECD 2014, the gender data portal) or at the Asia regional level (OECD 2012). These
comparisons pay significant attention to harmonizing age groups (15-64 years, 18-64 years or 15-74
years) and categories of activity (regrouping work and education, for example, travel and commuting
related to these activities being included). In this report, harmonizing the age group has not been
attempted. That would have required access to micro-data. But we have tried to make the categories
of activities consistent, in particular with regard to the inclusion or not of travel related to work,
education, leisure, etc., and with regard to the definition of paid and unpaid work.
Objectives of the study
How women and men spend their time is a question with important implications and impacts on our
knowledge of human behaviours related to work for earning a living, the different degrees of
involvement in domestic and care work, as well as voluntary work. The lengthening time spent in
commuting correlated with the rate of urbanization and the spatial expansion of cities greatly impacts
time devoted to leisure that the civilization of leisure was supposed to increase (see Friedmann 1960,
Dumazedier 1960). The role and importance of socializing compared to time spent alone in individual
leisure activities vary across regions and over time, as well as the time spent using (listening,
watching or using) the mass media. All these issues make time use a very sensitive indicator of social
change, social resistance and social resilience, in close relation with progress in human development.
This study was expected to provide sound indicators of time use regarding:
Paid work, distinguishing—where possible and depending on the type of classification used—
between work in establishments in the formal sector, work for the household in the informal sector or
for subsistence.
Unpaid work defined as comprised of:
Domestic work,
Care work (care of children, of adults),
Voluntary work (care of other households, work for the community) and
Education (at school and at home).
Social life and leisure, distinguishing between:
Socializing (with others, family, relatives, friends),
Leisure (hobbies, sports, culture) and
Time Use Across the World: Findings of a World Compilation of Time Use Surveys
2015 Human Development Report Office
BACKGROUND PAPER 9
Mass media (including reading).
Personal care and maintenance (sleeping, eating, self-care).
The usual indicators published by time use surveys are of three types:
The average daily time spent in a given activity of the classification by the population
engaged (or involved) in the activity;
The participation rate (the number of people engaged in the activity divided by the total
population—engaged or not—of the sample); and
The average daily time spent in a given activity by the total population, engaged or not in
the activity.
In this report, all tables refer to the third of these three indicators.
Some surveys restrict their publications to the two first indicators, and it has been necessary to
calculate the third indicator on the basis of the first two. Tables of the results are generally presented
by sex and age groups, matrimonial status, family size, activity status, weekdays and weekend days,
geographical location, etc.
Assessment of the survey methodologies
Table A1 synthesizes the main characteristics of time use survey methodologies, in terms of period
(length of data collection), type of survey, minimum age, sample size, type of sample, type of survey
instrument, mode of data collection and classification used.
Europe has the longest tradition of time use surveys. These surveys have been carried out as
stand-alone surveys since the early 1970s. Among the 15 European countries, only two (Belgium and
the United Kingdom in 2005) have carried out their time use survey as a module of a household
survey. Time use surveys are generally conducted over an entire year (with rotating samples: an equal
part of the sample is surveyed each month or each quarter) in order to take seasonal variations into
account, except in Portugal, where the survey was carried out over two months, and in the United
Kingdom in 2005, where it was carried out in four months across the year. The minimum age varies
from 8 (United Kingdom in 2000) and 9 (Norway since 2000) to 20 (Sweden), and there is a
maximum age in these last two countries (74 before 2000 and 79 since 2000 for Norway, 84 for
Sweden). Italy uses a special module for the age group 3-14, and France collects data for ages 11 and
over, but publishes basic tables for 15 and over. Sample size varies from 1,023 individuals (Ireland) to
50,968 individuals (Italy). All countries have collected time use survey data on all eligible members of
Time Use Across the World: Findings of a World Compilation of Time Use Surveys
2015 Human Development Report Office
10 BACKGROUND PAPER
selected households, except the United Kingdom in 2005, where the survey involved a random
selection of one household member. The survey instrument is the diary in all countries, and
systematically two diaries (one for weekdays and one for weekend days), except in Austria, Italy,
Portugal and Spain, where the days of the week are spread across the sample. Except in Portugal and
the United Kingdom in 2005, the mode of data collection is mixed. This means that individuals fill
the diaries, while interviewers fill the household and individual questionnaires. Each country has
developed its own ad hoc detailed classification of time use activities. The HETUS classification is the
result of a harmonization process that attempted to reconcile countries’ classifications.
The 10 transition countries of Europe have benefitted from this harmonization process, and
all use HETUS as their time use classification. All surveys are stand-alone surveys conducted over the
year (Latvia over eight months). The minimum age is generally 10 (except Serbia at 15), with
standardization (or publication) for the age group 20-74 or 15-74 or 15-64. All countries use two
diaries as a survey instrument, and the mixed method as the mode of data collection (self-filled diary
and interview). All eligible members of households are part of the sample. The sample size varies
from 2,384 individuals in Lithuania to 7,225 in Estonia.
The two countries of North America, Canada and the United States of America, use the
computer-assisted telephone interview for their time use surveys. The American time use survey has
been an annual stand-alone survey since 2003, with a sample of 2,190 individuals aged 15+ (one
person randomly selected in each household) per month, and a single diary, using its own
classification (ATUS). Canada carries out its time use survey every five years as a module of the
rotating sample of a household survey. The sample size is 25,000 individuals with one diary.
Among the three other developed countries, Japan carries out a time use survey every 5
years and New Zealand every 10 years, both stand-alone surveys conducted in a month in Japan, and
over the year in New Zealand. The minimum age is 10 in Japan, 12 in New Zealand and 15 in
Australia, with self-recorded diaries (one diary in Japan, two diaries in New Zealand) and ad hoc
detailed classification, Activity Classification for Time Use Surveys (ACTUS) for New Zealand.
In the nine Middle East North Africa countries, 10 surveys have been conducted during the
past 15 years with one repetition in the State of Palestine. Turkey and the three Maghreb countries
have used the HETUS classification (or a variant of it), while the Islamic Republic of Iran and the
State of Palestine used ICATUS, and Iraq, Oman and Qatar a pre-listing of more than 20 activities. In
Iraq (2007), the time use survey was a module of a household survey. The other countries conducted
stand-alone surveys (as a subsample of an existing household survey in Oman and Tunisia). The
period of data collection is the entire year, except in Algeria and Iraq (two consecutive months). Iran
collected data on three quarters (winter, autumn and summer). The minimum age varies from 7
(Morocco) to 15, and the sample size from 4,605 individuals (the State of Palestine in 2012) to 22,138
Time Use Across the World: Findings of a World Compilation of Time Use Surveys
2015 Human Development Report Office
BACKGROUND PAPER 11
(Algeria), with one diary (except in Tunisia and Turkey with two diaries). All eligible individuals are
surveyed except in the State of Palestine (two adults, one male, one female, randomly selected) and
Morocco (two adults, one male, one female, randomly selected, and one child in every five
households). The technique of the self-recorded diary was used in the Islamic Republic of Iran (urban
areas), Morocco and Tunisia.
In the eight countries of sub-Saharan Africa, where illiteracy is more widespread, the
interview technique is systematic, and data are collected with a single diary over a month or two
months except in South Africa (three rounds in 2000) and the United Republic of Tanzania (four
quarters). The minimum age ranges from 5 (United Republic of Tanzania) and 6 (Benin, Madagascar
and Mali, which also used a maximum age of 65) to 10. Three countries have conducted their time use
survey as a module of a household survey (Benin, Mauritius and United Republic of Tanzania) and
one as a subsample of a household survey (Madagascar). The sample size ranges from 2,249
individuals (Mali) to 52,262 (Ethiopia), with all eligible members selected except in Mali (two
individuals randomly selected in three age groups) and South Africa (two individuals). Most
countries use ICATUS or a pre-listing of more than 60 activities inspired by ICATUS. Only South
Africa repeated its survey.
In Asia, three countries used ICATUS (Mongolia, Pakistan and Thailand), China used a mix of
HETUS and ICATUS, Armenia applied the HETUS classification, and the others used a list of
activities (Cambodia and India) or an ad hoc detailed classification (Republic of Korea). Only two
countries (Republic of Korea and Thailand) have repeated their surveys every five years. All surveys
are stand-alone except in Cambodia, which used a module in a household survey. The sample size
ranges from 1,342 individuals in Armenia to 83,880 households/individuals in Thailand, and the
minimum age from 5 (Cambodia, but data are published for ages 15-64) and 6 (India) to 15 (Armenia
and China). A maximum age is used in China (74) and Armenia (80). The survey instrument is a
single diary in Cambodia, Kyrgyzstan, Mongolia, Pakistan and Thailand, two diaries in Armenia and
China, and three diaries in India (a normal day, an abnormal day and a weekly variant of the past
week). All eligible members are interviewed except in Pakistan (where two members are randomly
selected) and in Thailand (one member). Only the Republic of Korea and Thailand use a self-recorded
diary. China and India carried out their surveys in several states, but not at the national level.
In Latin America, none of the seven countries used a diary (as already explained, an exception
to the rule applied in this report), turning instead to a questionnaire with a series of questions on
various activities. Consequently, the data collected are not strictly comparable with the other regions.
Three countries carried out a stand-alone survey and four a module in a household survey. Only two
countries conducted the survey over a year (Colombia and El Salvador). The minimum age ranges
from 10 (Colombia and El Salvador) to 15 (Panama), and the sample size from 3,305 households (El
Salvador) to 148,492 individuals in Colombia. All household members were interviewed for weekdays
Time Use Across the World: Findings of a World Compilation of Time Use Surveys
2015 Human Development Report Office
12 BACKGROUND PAPER
and for weekend days (except in Colombia and Costa Rica). The classifications used are detailed and
ad hoc, but close to CAUTAL (Clasificación de Actividades de Uso del Tiempo para América Latina y
el Caribe in the 9-28-82 categories). Only Mexico has repeated its survey at a seven-year interval.
Difficulties and limits of international comparisons
The above description of survey methodologies across the world highlights the limits of international
comparisons. The two main factors that analysts (in particular at the European Union and OECD)
have been dealing with are age groups and the classification of activities. European Union
comparisons (EUROSTAT 2004), including transition countries, have standardized the age group at
20-74, while OECD comparisons have standardized the age group at 15-84 (OECD 2014).
Age groups: Table A1 shows the diversity of age groups used for data collection on time use:
from a minimum age of 5 and 6 (and even 3) to 15, 18 and even 20. Some countries use a maximum
age of 65 or 74. In this report, the age groups are those used in national official publications.
Classification of activities: ICATUS is mainly used in developing countries in Africa and
Asia. HETUS has the privilege of anteriority and is a means of harmonization in Europe and in
transition countries. Attempts have been made to disseminate it in North Africa and other regions.
Many countries use their own classifications, based on HETUS or ICATUS. The main issues to tackle
are the exact content and meaning of the main concepts in use and how they are interpreted: paid
work, unpaid work, voluntary work, leisure, personal care, travel and commuting. We comment on
this issue in the next section of this paper.
Capture of weekly and annual (seasonal) variations in time use: Many surveys,
especially in developing countries, do not capture seasonal variations in time use, limiting the data
collection to a duration of one or two months. Others organize the data collection in two, three or four
rounds. Most countries organize a rotating sample over the year (an equal share of the total sample is
surveyed each month). Regarding the weekly variations of time use, two solutions prevail: either the
data are collected with two (or more) diaries, one for a weekday and one for a weekend day, or the
data collection methodology is organized to make sure that there will be diaries for each day of the
week.
Finally, another issue that is too rarely addressed in the survey methodologies is the
representativeness of the sample, especially with regard to non-responses. Of course, all surveys
apply the rules of household sampling that ensure the representativeness of households. But there is
not often required information about the representativeness of individuals who fill the diaries Most
surveys consulted for this study have not published such non-response rates for individuals. There
are two categories of surveys: either all eligible (that is, all members above the minimum age) are
Time Use Across the World: Findings of a World Compilation of Time Use Surveys
2015 Human Development Report Office
BACKGROUND PAPER 13
interviewed (or fill the diary) or only one, two or three members, randomly selected. The
methodology of the time use survey in Mongolia was the only one that clearly specified that the
eligibility criteria for being interviewed were age and presence at home at the time of the visit of the
interviewer. But in both cases, the number of non-responses may be high (especially in the case of
interviews, because the persons are not present at the time when the interviewer visits the
households. As a consequence, persons who are often absent from home (at work or at school, for
example) will be more difficult to interview. It is therefore necessary to adjust the sample before
extrapolating the results to the whole population. This issue is of particular importance when one
wants to analyse global indicators of time use for the whole population of a country, and not only for
a subcategory of population.
Notwithstanding these difficulties, the main issue lies in the definition of concepts.
The concepts used for time use analysis
Paid work and unpaid work: The definitions of these two categories are of major importance in
the determination of gender gaps, and they should not be ambiguous, given that they are defined by
international concepts of the labour force (International Labour Organization or ILO) and of national
accounts (SNA 2008). Work is basically defined as any human activity that can be delegated to a
third person for the production of goods and services destined to satisfy a person’s needs: education
(in the sense of going to school) or playing a game or watching television are not work because they
cannot be delegated to a third person, but preparing meals or caring for children are work because it
is possible to hire somebody to do it.
The production of goods and services measured in gross domestic product (GDP) by national
accounts is the basis for the definition of the labour force and employment (by the ILO). It defines the
boundaries of ‘paid work’ (the production boundary under the System of National Accounts or SNA)
as the work that produces goods and services destined for the market (in addition to government and
non-profit services), as well as all goods (but not services) produced by households for their own final
use. ‘Unpaid work’ (corresponding to the general production boundary) is therefore defined as
household work that produces services for their own final use, such as domestic services and care of
children and adults within households or for other households (voluntary work). ‘Voluntary work’
also comprises unpaid work for the community.
If these definitions seem rather clear, they are not devoid of ambiguities. For instance, ‘paid
work’ is not necessarily paid (or for profit) and the former ‘unpaid family workers’ (a category of the
international classification of status in employment) have nowadays been replaced by the
‘contributing family workers’, whose work, though unpaid, contributes to the formation of GDP and
Time Use Across the World: Findings of a World Compilation of Time Use Surveys
2015 Human Development Report Office
14 BACKGROUND PAPER
is part of ‘paid work’. Similarly, activities such as water or firewood fetching, or collection of fuel, are
considered by the SNA, since its early revision in 1968, as extraction of goods and consequently as
‘paid work’. But feminist economists may rightfully raise the question why these activities are
classified as such even though national accounts fail to measure them (Elson 2000, Budlender 2004).
Certainly, national accounts that take such activities into account are not many, due to a lack of data,
but insufficient practice does not justify a change in definitions and rules of measurement.
Another example that illustrates the subtleties of classifications involves care of domestic
animals. In HETUS and developed countries, pet care is definitely ‘unpaid work’, while in developing
countries and subsistence economies, care of domestic animals such as cows, sheep, goats or poultry
are productive activities of animal husbandry. Milking the cow or feeding the poultry is an economic
activity that should be measured in GDP. In this report, adjustments have been made to include these
activities in ‘paid work’.
This contradiction in definitions of production by national accounts and of the labour force by
the ILO has resulted in increasing discrepancies in the statistics of employment or in difficulties in
international or time comparisons. While many countries continue to ignore large shares of women’s
productive work in agriculture (especially in the Middle East and North Africa, and in South Asia: see
Charmes and Remaoun 2014), those that decide to collect data through a strict application of the
definition (the United Republic of Tanzania, for example, see National Bureau of Statistics, United
Republic of Tanzania 2007) have generated global figures that are not comparable with those of
neighbouring countries. This explains why feminist economists insist on measuring ‘unpaid work’,
including some components of ‘paid work’. It also explains why ICATUS uses a very detailed list of
categories for paid work, distinguishing ‘work in establishments’ (in the first trial ICATUS) as now
‘work for the formal sector’ (in the most recent revision: work for corporations, quasi-corporations,
non-profit institutions and government), on the one hand. On the other hand, there is ‘work for
household in primary activities’, ‘work for household in non-primary production activities’, ‘work for
household in construction activities’ and ‘work for household providing services for income’, all of
which delineate work in the informal economy. Only four countries in the database (Ghana, Ethiopia,
the State of Palestine and Thailand) have provided such detailed data, and to a certain extent (with
fewer details) a few other developing countries of sub-Saharan Africa and Asia (Pakistan and
Mongolia). In countries where labour force surveys fail to fully capture women’s work because it is
often confounded with household work, time use surveys have an important role to play in order to
improve data collection on the labour force (Charmes and Hirway 2006).
The issue of ‘unpaid work’ and its measurement in national accounts and the labour force has
been widely discussed in the literature since the issue arose at the Beijing Conference. The SNA 1993
(and 2008) recommended building satellite accounts of household production in order to capture its
Time Use Across the World: Findings of a World Compilation of Time Use Surveys
2015 Human Development Report Office
BACKGROUND PAPER 15
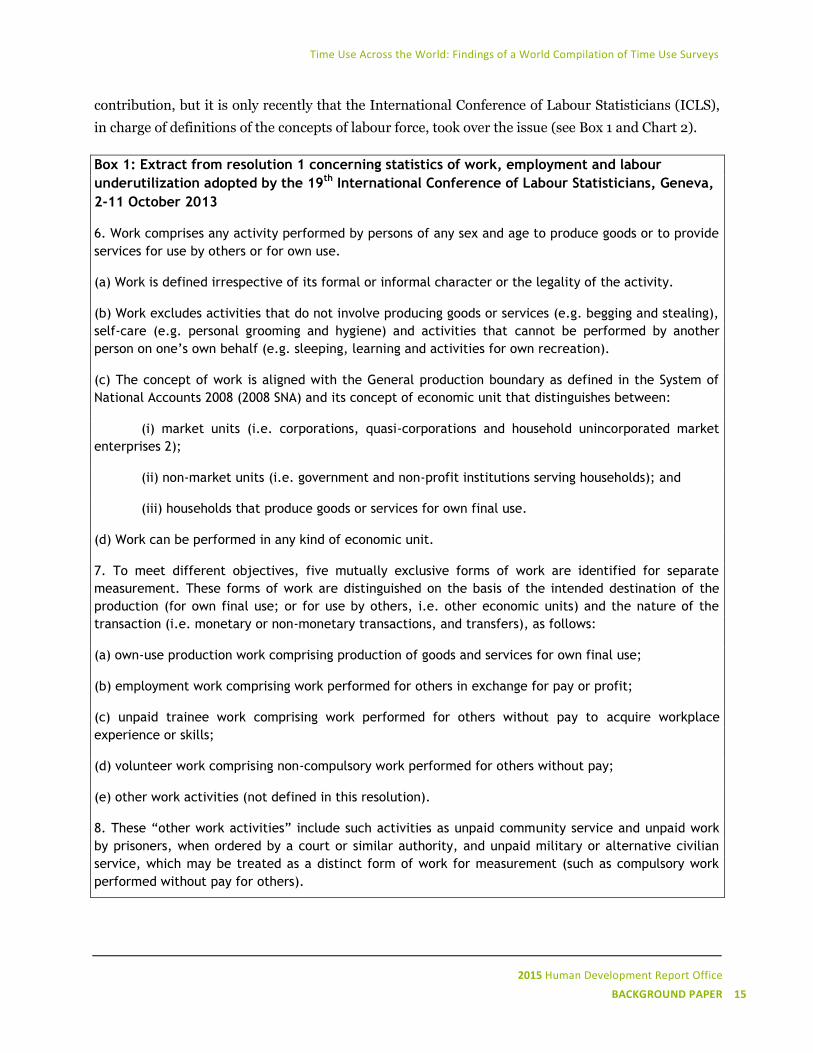
contribution, but it is only recently that the International Conference of Labour Statisticians (ICLS),
in charge of definitions of the concepts of labour force, took over the issue (see Box 1 and Chart 2).
Box 1: Extract from resolution 1 concerning statistics of work, employment and labour
underutilization adopted by the 19th
International Conference of Labour Statisticians, Geneva,
2-11 October 2013
6. Work comprises any activity performed by persons of any sex and age to produce goods or to provide
services for use by others or for own use.
(a) Work is defined irrespective of its formal or informal character or the legality of the activity.
(b) Work excludes activities that do not involve producing goods or services (e.g. begging and stealing),
self-care (e.g. personal grooming and hygiene) and activities that cannot be performed by another
person on one’s own behalf (e.g. sleeping, learning and activities for own recreation).
(c) The concept of work is aligned with the General production boundary as defined in the System of
National Accounts 2008 (2008 SNA) and its concept of economic unit that distinguishes between:
(i) market units (i.e. corporations, quasi-corporations and household unincorporated market
enterprises 2);
(ii) non-market units (i.e. government and non-profit institutions serving households); and
(iii) households that produce goods or services for own final use.
(d) Work can be performed in any kind of economic unit.
7. To meet different objectives, five mutually exclusive forms of work are identified for separate
measurement. These forms of work are distinguished on the basis of the intended destination of the
production (for own final use; or for use by others, i.e. other economic units) and the nature of the
transaction (i.e. monetary or non-monetary transactions, and transfers), as follows:
(a) own-use production work comprising production of goods and services for own final use;
(b) employment work comprising work performed for others in exchange for pay or profit;
(c) unpaid trainee work comprising work performed for others without pay to acquire workplace
experience or skills;
(d) volunteer work comprising non-compulsory work performed for others without pay;
(e) other work activities (not defined in this resolution).
8. These “other work activities” include such activities as unpaid community service and unpaid work
by prisoners, when ordered by a court or similar authority, and unpaid military or alternative civilian
service, which may be treated as a distinct form of work for measurement (such as compulsory work
performed without pay for others).
Time Use Across the World: Findings of a World Compilation of Time Use Surveys
2015 Human Development Report Office
16 BACKGROUND PAPER
9. Persons may engage in one or more forms of work in parallel or consecutively, i.e. persons may be
employed, be volunteering, doing unpaid trainee work and/or producing for own use, in any
combination.
10. Own-use production of goods, employment, unpaid trainee work, a part of volunteer work and
“other work activities” form the basis for the preparation of national production accounts within the
2008 SNA production boundary. Own-use provision of services and the remaining part of volunteer work
complete the national production accounts i.e. beyond the 2008 SNA production boundary but inside
the General production boundary.
11. The form of work identified as employment sets the reference scope of activities for labour force
statistics. The concept labour force refers to the current supply of labour for the production of goods
and services in exchange for pay or profit.
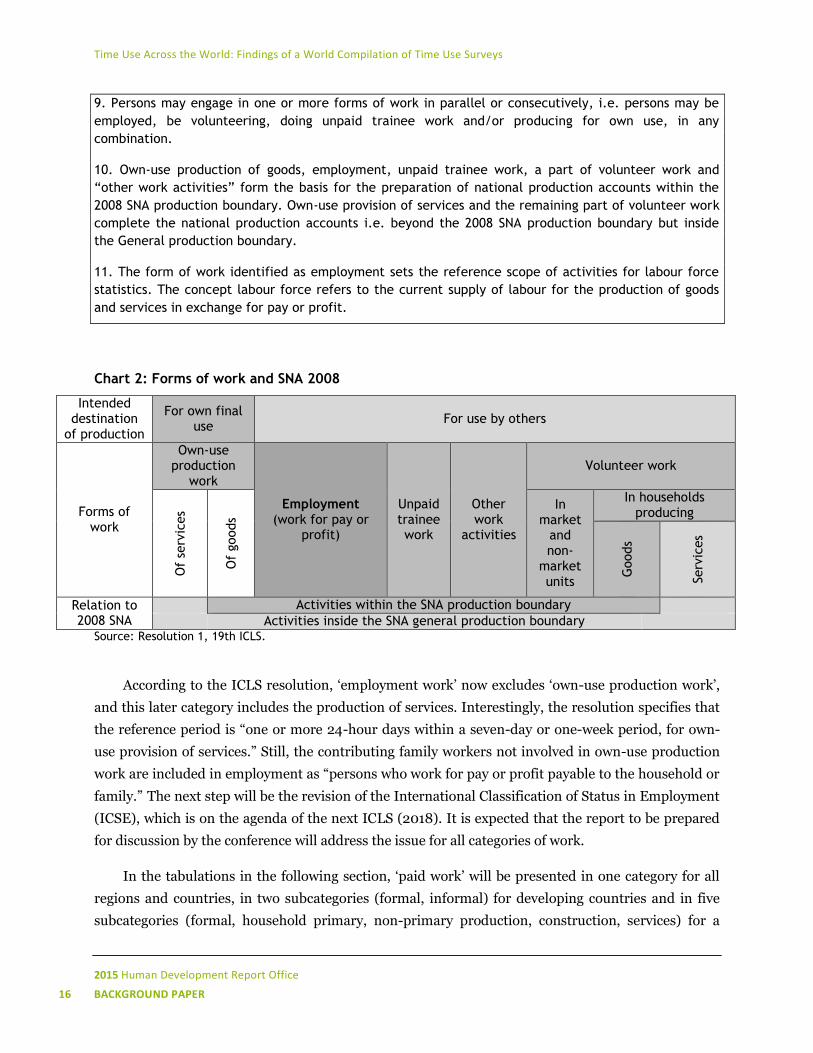
Chart 2: Forms of work and SNA 2008
Intended destination
of production
For own final use
For use by others
Forms of work
Own-use production
work
Employment (work for pay or
profit)
Unpaid trainee work
Other work
activities
Volunteer work
Of
serv
ices
Of
goods
In market
and non-
market units
In households producing
Goods
Serv
ices
Relation to 2008 SNA
Activities within the SNA production boundary
Activities inside the SNA general production boundary Source: Resolution 1, 19th ICLS.
According to the ICLS resolution, ‘employment work’ now excludes ‘own-use production work’,
and this later category includes the production of services. Interestingly, the resolution specifies that
the reference period is “one or more 24-hour days within a seven-day or one-week period, for own-
use provision of services.” Still, the contributing family workers not involved in own-use production
work are included in employment as “persons who work for pay or profit payable to the household or
family.” The next step will be the revision of the International Classification of Status in Employment
(ICSE), which is on the agenda of the next ICLS (2018). It is expected that the report to be prepared
for discussion by the conference will address the issue for all categories of work.
In the tabulations in the following section, ‘paid work’ will be presented in one category for all
regions and countries, in two subcategories (formal, informal) for developing countries and in five
subcategories (formal, household primary, non-primary production, construction, services) for a
Time Use Across the World: Findings of a World Compilation of Time Use Surveys
2015 Human Development Report Office
BACKGROUND PAPER 17
small set of developing countries. ‘Unpaid work’ will also be presented in one aggregate category for
all countries and regions, and in three subcategories (domestic services, caregiving services,
volunteering activities). Developed countries and more generally all countries using HETUS often
merge paid work and education, and focus on, and specify, several subcategories of unpaid household
work/domestic services such as: food preparation, household upkeep, construction and repairs,
shopping, etc.
Learning or education or study comprises time spent at school, time spent studying at
home and travel related. As explained above, many European countries (using HETUS) merge the
category with paid work at the aggregate level. Where the school-age population is part of the
targeted population, that is, where the minimum age is less than 15, the average time spent in this
activity is much more important than in countries where the minimum age is more than 15. This
must be kept in mind for international comparisons. Learning has clearly been distinguished from
work in this report.
Travel and commuting is an important category of time use activities because it is often
related to all other activities. Data are collected by purpose: paid work, unpaid work, education,
leisure and personal care. In many surveys, the category is disaggregated by each time use activity,
but in some surveys it is captured as a whole so that it is not always possible to know what share is
related to paid work and to unpaid work. Consequently, it is preferable to analyse paid and unpaid
work without travel related to them.
Social life or leisure is the next broad category of time use. It comprises several
subcategories: ‘socializing’ (with others: family, relatives, friends, but also community participation),
‘attending cultural and entertainment events’, ‘hobbies, games and other past-times’, ‘indoor and
outdoor sports participation’ and ‘mass media’. There are several causes of disharmony between
ICATUS on the one hand and HETUS and similar classifications on the other hand. Religious
activities may be considered ‘community participation’, but in some countries (France, for instance)
they are classified with ‘personal care and maintenance’ whereas in other countries (in the Maghreb,
for instance), time devoted to ‘prayer’ has been clearly distinguished. On the contrary, ‘resting’ is
classified (in France, for example) as ‘other free time’ and leisure, and not under ‘personal care and
maintenance’: these divergences could not be corrected in all surveys and may explain some
discrepancies in time spent in ‘personal care and maintenance’. Among other areas of discrepancies,
‘using computer technology’ is classified under ‘mass media’ although it has not always been possible
to distinguish between the uses of this technology for games or for information. ‘Travel related to
leisure’ or social life is most often merged in the general category ‘travel’.
Personal care and maintenance should be, in theory and across countries, the most stable
category of the classification. This is not entirely true for the reasons explained above, depending on
Time Use Across the World: Findings of a World Compilation of Time Use Surveys
2015 Human Development Report Office
18 BACKGROUND PAPER
where ‘resting’ is classified (under ‘other free-time’ or ‘time out’ and leisure, or under ‘personal care
and maintenance’), as well as ‘religious activities’, which are classified under ‘participatory activities’
and ‘voluntary work and meetings’ in HETUS and under ‘personal care and maintenance’ in ICATUS.
The classification of ‘religious activities’ by HETUS does not fit with the definition of volunteering
work as unpaid work.
Data analysis: how women and men spend their time across the world
When analysing the data and figures on time use, it should be remembered that they are averages for
all days of the week (workdays and weekends) and for all people (occupied, unoccupied and inactive)
for a whole age group. All figures presented in this section are extracted from the database prepared
by the author.
For each region, we will present first an overall picture of a 24-hour average day, then focus on
paid work and unpaid care and domestic work, and enter into the details of these activities each time
data are available in a comparative perspective.
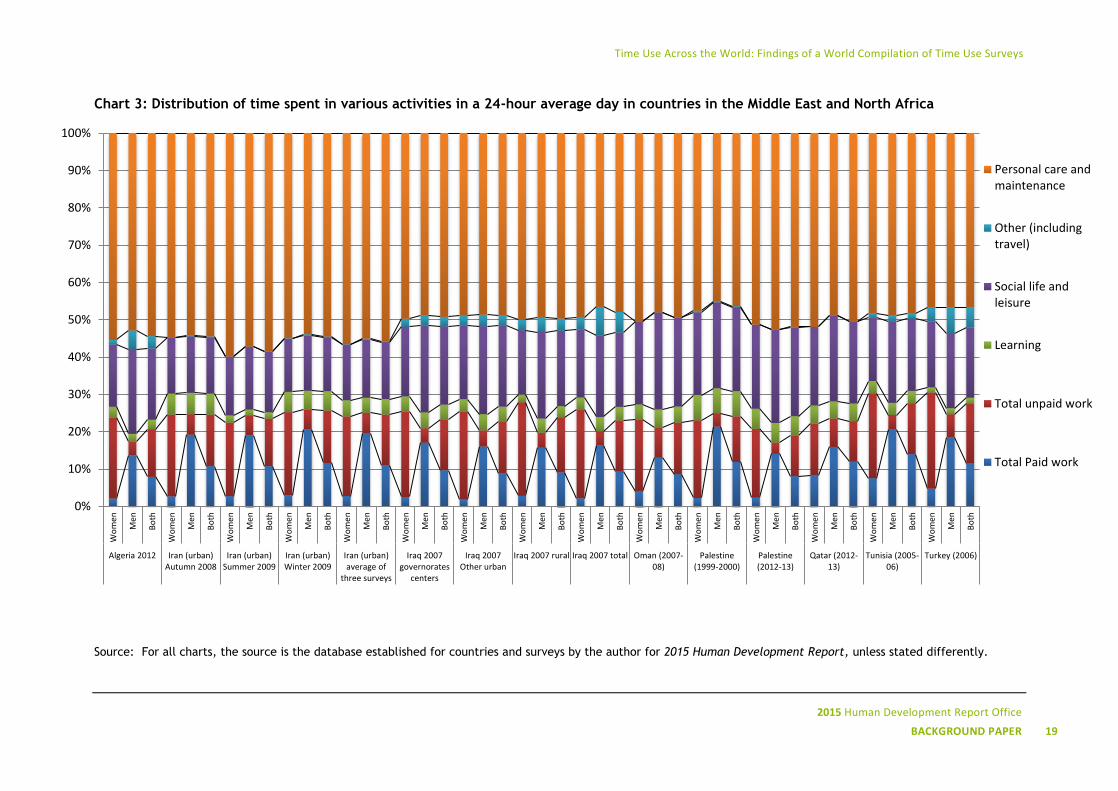
For the Middle East and North Africa region, where gender gaps in paid work and unpaid
work are among the most pronounced, Chart 3 provides a picture of a 24-hour average day, with the
distribution of time by the main categories of activities in the classification. Personal care and
maintenance occupies approximately half of the day, from a minimum of 46.7 percent in Turkey and
48.3 percent in Tunisia to a maximum of 60 percent for women in urban Islamic Republic of Iran (in
summer). The winding curves (impacted by gender disparities) of paid work and unpaid work,
partially compensated for when cumulated, show that work occupies between more or less 16 percent
of the day for women in Algeria and men in the State of Palestine (2013), and more or less 30 percent
of the day for rural women in Iraq, and women in Tunisia and Turkey. If we add learning to work,
these proportions are raised to 20-22 percent for the minimum and up to 30-32 percent for the
maximum. The remaining time for social life, entertainment and other free time ranges from 15
percent in urban Islamic Republic of Iran to 26 percent for men in Oman. In most countries, women
have less time than men to devote to social life and leisure, a gap that tends to diminish in urban
areas.
Time Use Across the World: Findings of a World Compilation of Time Use Surveys
2015 Human Development Report Office
BACKGROUND PAPER 19
Chart 3: Distribution of time spent in various activities in a 24-hour average day in countries in the Middle East and North Africa
Source: For all charts, the source is the database established for countries and surveys by the author for 2015 Human Development Report, unless stated differently.
0%
10%
20%
30%
40%
50%
60%
70%
80%
90%
100%
Wo
men
Men
Bo
th
Wo
men
Men
Bo
th
Wo
men
Men
Bo
th
Wo
men
Men
Bo
th
Wo
men
Men
Bo
th
Wo
men
Men
Bo
th
Wo
men
Men
Bo
th
Wo
men
Men
Bo
th
Wo
men
Men
Bo
th
Wo
men
Men
Bo
th
Wo
men
Men
Bo
th
Wo
men
Men
Bo
th
Wo
men
Men
Bo
th
Wo
men
Men
Bo
th
Wo
men
Men
Bo
th
Algeria 2012 Iran (urban)Autumn 2008
Iran (urban)Summer 2009
Iran (urban)Winter 2009
Iran (urban)average of
three surveys
Iraq 2007governorates
centers
Iraq 2007Other urban
Iraq 2007 rural Iraq 2007 total Oman (2007-08)
Palestine(1999-2000)
Palestine(2012-13)
Qatar (2012-13)
Tunisia (2005-06)
Turkey (2006)
Personal care andmaintenance
Other (includingtravel)
Social life andleisure
Learning
Total unpaid work
Total Paid work
Time Use Across the World: Findings of a World Compilation of Time Use Surveys
2015 Human Development Report Office
20 BACKGROUND PAPER
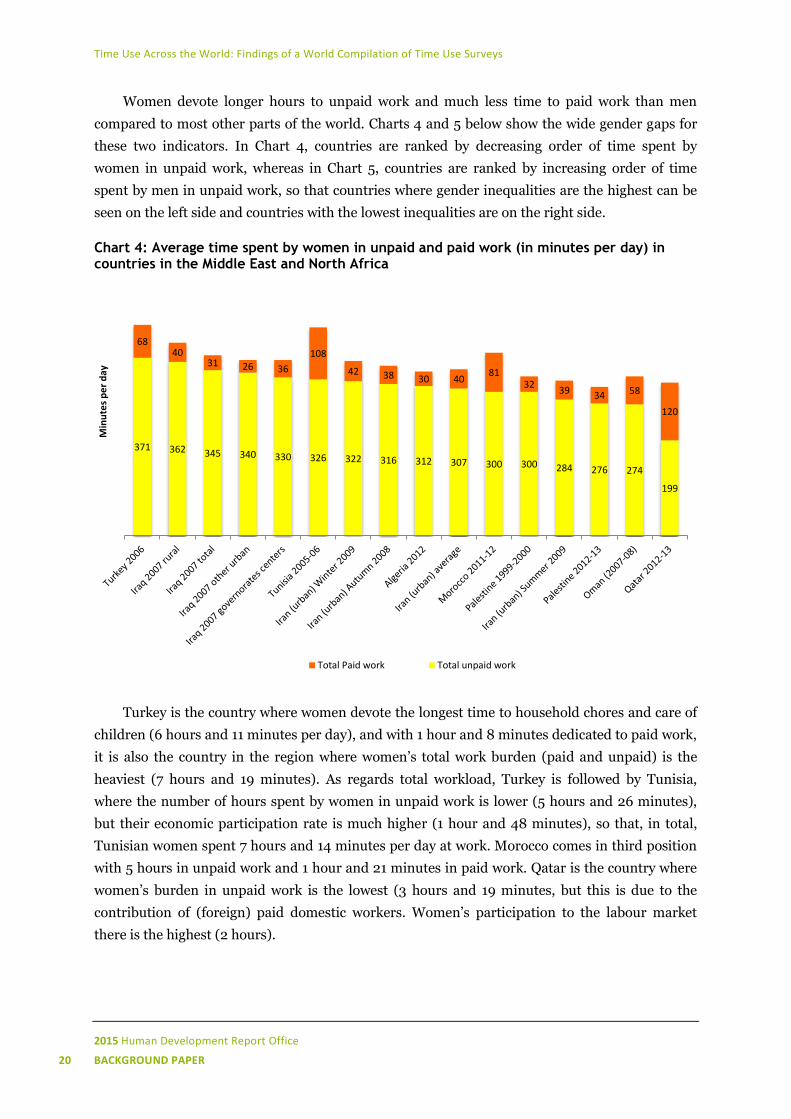
Women devote longer hours to unpaid work and much less time to paid work than men
compared to most other parts of the world. Charts 4 and 5 below show the wide gender gaps for
these two indicators. In Chart 4, countries are ranked by decreasing order of time spent by
women in unpaid work, whereas in Chart 5, countries are ranked by increasing order of time
spent by men in unpaid work, so that countries where gender inequalities are the highest can be
seen on the left side and countries with the lowest inequalities are on the right side.
Chart 4: Average time spent by women in unpaid and paid work (in minutes per day) in countries in the Middle East and North Africa
Turkey is the country where women devote the longest time to household chores and care of
children (6 hours and 11 minutes per day), and with 1 hour and 8 minutes dedicated to paid work,
it is also the country in the region where women’s total work burden (paid and unpaid) is the
heaviest (7 hours and 19 minutes). As regards total workload, Turkey is followed by Tunisia,
where the number of hours spent by women in unpaid work is lower (5 hours and 26 minutes),
but their economic participation rate is much higher (1 hour and 48 minutes), so that, in total,
Tunisian women spent 7 hours and 14 minutes per day at work. Morocco comes in third position
with 5 hours in unpaid work and 1 hour and 21 minutes in paid work. Qatar is the country where
women’s burden in unpaid work is the lowest (3 hours and 19 minutes, but this is due to the
contribution of (foreign) paid domestic workers. Women’s participation to the labour market
there is the highest (2 hours).
371 362 345 340 330 326 322 316 312 307 300 300 284 276 274
199
68 40
31 26 36
108
42 38 30 40 81
32 39 34 58
120
Min
ute
s p
er
day
Total Paid work Total unpaid work
Time Use Across the World: Findings of a World Compilation of Time Use Surveys
2015 Human Development Report Office
BACKGROUND PAPER 21
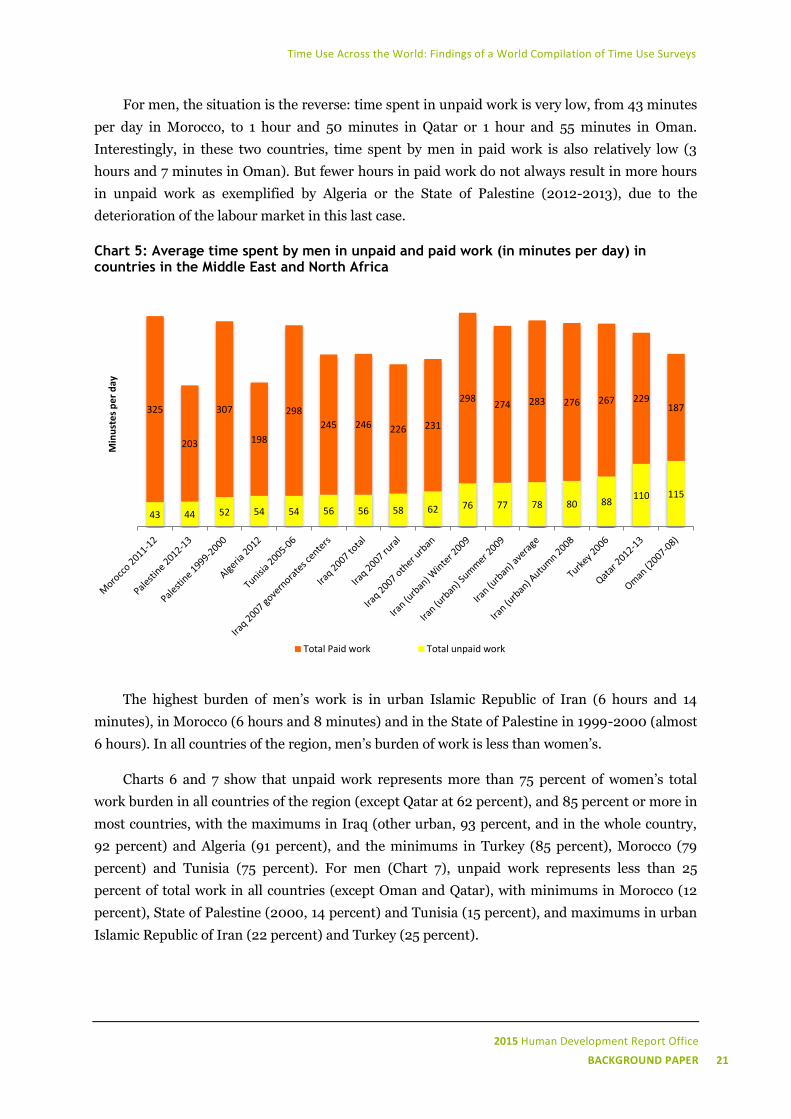
For men, the situation is the reverse: time spent in unpaid work is very low, from 43 minutes
per day in Morocco, to 1 hour and 50 minutes in Qatar or 1 hour and 55 minutes in Oman.
Interestingly, in these two countries, time spent by men in paid work is also relatively low (3
hours and 7 minutes in Oman). But fewer hours in paid work do not always result in more hours
in unpaid work as exemplified by Algeria or the State of Palestine (2012-2013), due to the
deterioration of the labour market in this last case.
Chart 5: Average time spent by men in unpaid and paid work (in minutes per day) in countries in the Middle East and North Africa
The highest burden of men’s work is in urban Islamic Republic of Iran (6 hours and 14
minutes), in Morocco (6 hours and 8 minutes) and in the State of Palestine in 1999-2000 (almost
6 hours). In all countries of the region, men’s burden of work is less than women’s.
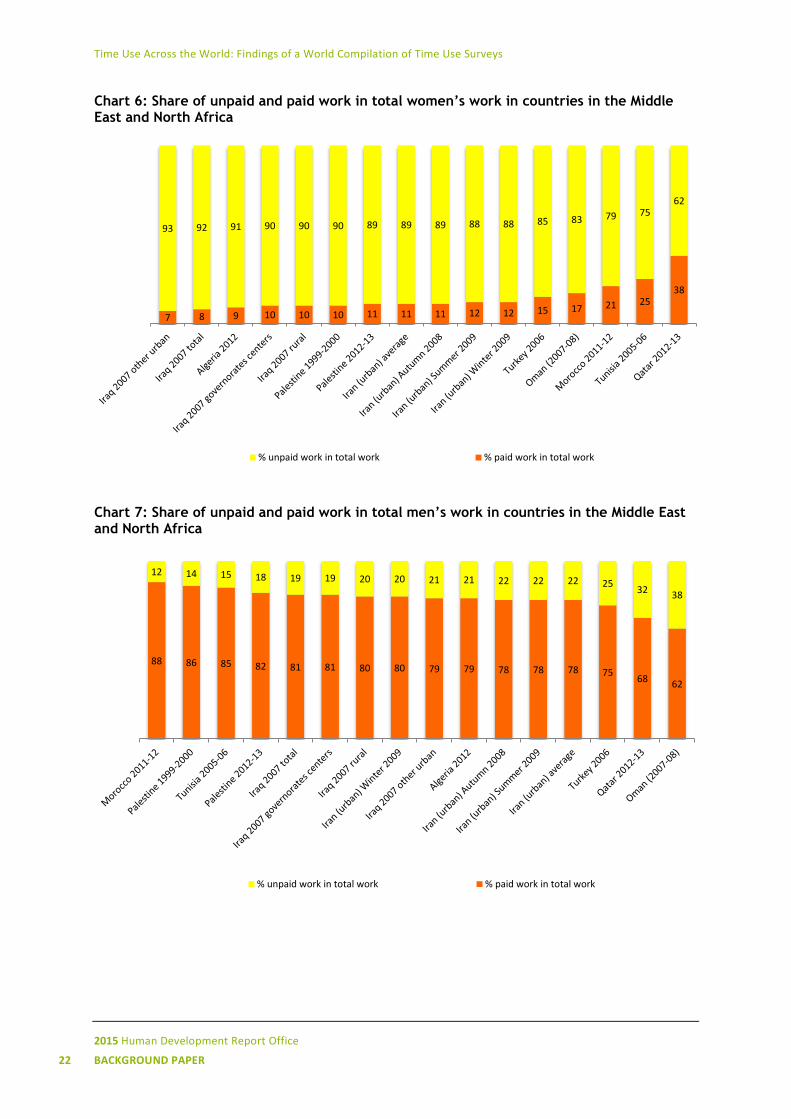
Charts 6 and 7 show that unpaid work represents more than 75 percent of women’s total
work burden in all countries of the region (except Qatar at 62 percent), and 85 percent or more in
most countries, with the maximums in Iraq (other urban, 93 percent, and in the whole country,
92 percent) and Algeria (91 percent), and the minimums in Turkey (85 percent), Morocco (79
percent) and Tunisia (75 percent). For men (Chart 7), unpaid work represents less than 25
percent of total work in all countries (except Oman and Qatar), with minimums in Morocco (12
percent), State of Palestine (2000, 14 percent) and Tunisia (15 percent), and maximums in urban
Islamic Republic of Iran (22 percent) and Turkey (25 percent).
43 44 52 54 54 56 56 58 62 76 77 78 80 88 110 115
325
203
307
198
298
245 246 226 231
298 274 283 276 267 229
187
Min
ust
es
pe
r d
ay
Total Paid work Total unpaid work
Time Use Across the World: Findings of a World Compilation of Time Use Surveys
2015 Human Development Report Office
22 BACKGROUND PAPER
Chart 6: Share of unpaid and paid work in total women’s work in countries in the Middle East and North Africa
Chart 7: Share of unpaid and paid work in total men’s work in countries in the Middle East and North Africa
7 8 9 10 10 10 11 11 11 12 12 15 17 21 25 38
93 92 91 90 90 90 89 89 89 88 88 85 83 79 75 62
% unpaid work in total work % paid work in total work
88 86 85 82 81 81 80 80 79 79 78 78 78 75 68 62
12 14 15 18 19 19 20 20 21 21 22 22 22 25 32 38
% unpaid work in total work % paid work in total work
Time Use Across the World: Findings of a World Compilation of Time Use Surveys
2015 Human Development Report Office
BACKGROUND PAPER 23
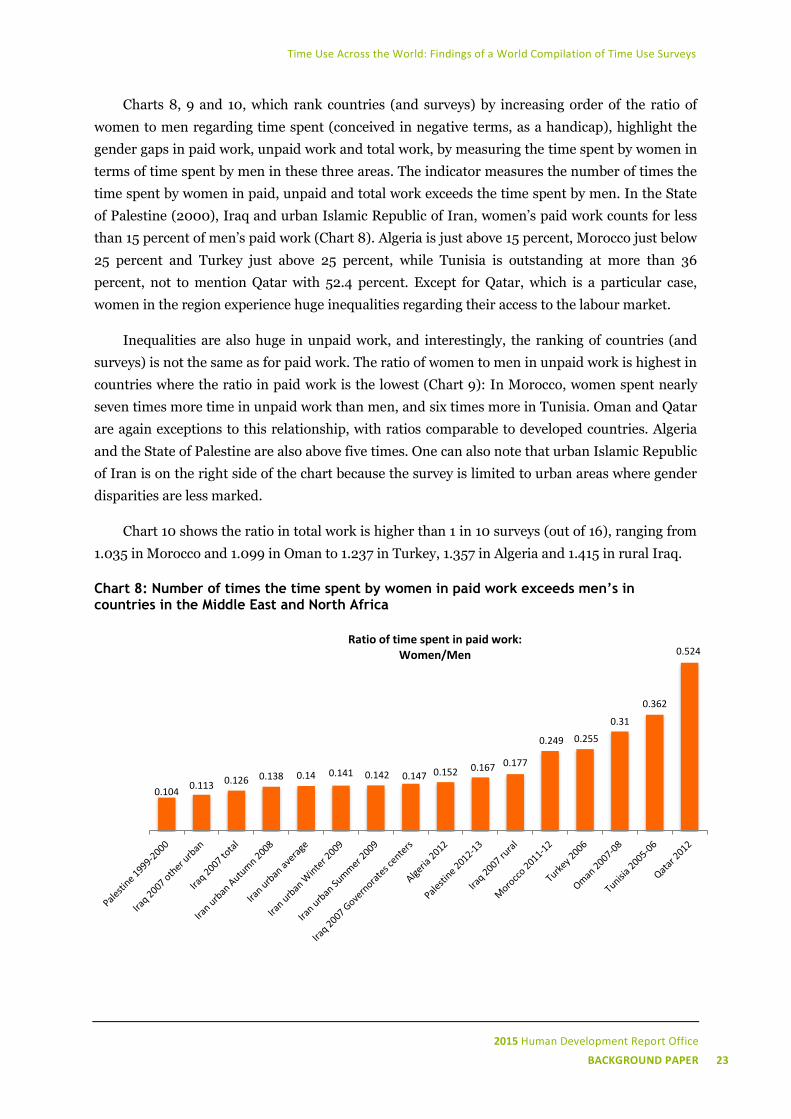
Charts 8, 9 and 10, which rank countries (and surveys) by increasing order of the ratio of
women to men regarding time spent (conceived in negative terms, as a handicap), highlight the
gender gaps in paid work, unpaid work and total work, by measuring the time spent by women in
terms of time spent by men in these three areas. The indicator measures the number of times the
time spent by women in paid, unpaid and total work exceeds the time spent by men. In the State
of Palestine (2000), Iraq and urban Islamic Republic of Iran, women’s paid work counts for less
than 15 percent of men’s paid work (Chart 8). Algeria is just above 15 percent, Morocco just below
25 percent and Turkey just above 25 percent, while Tunisia is outstanding at more than 36
percent, not to mention Qatar with 52.4 percent. Except for Qatar, which is a particular case,
women in the region experience huge inequalities regarding their access to the labour market.
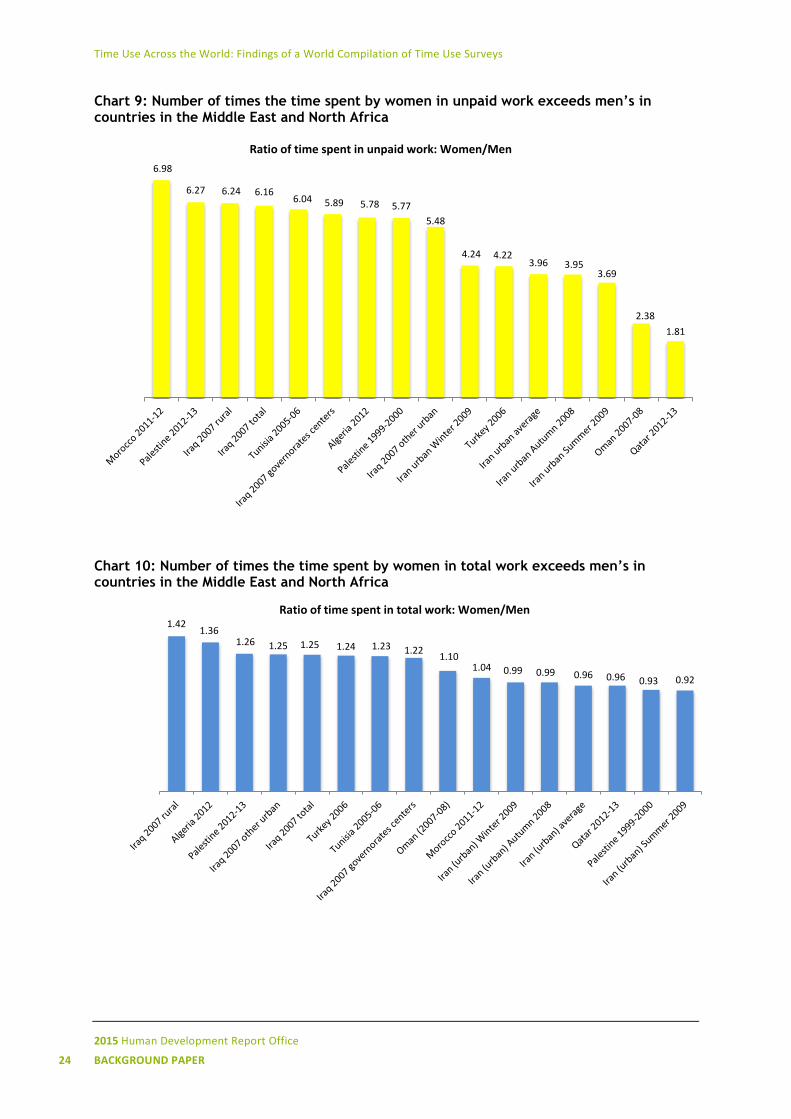
Inequalities are also huge in unpaid work, and interestingly, the ranking of countries (and
surveys) is not the same as for paid work. The ratio of women to men in unpaid work is highest in
countries where the ratio in paid work is the lowest (Chart 9): In Morocco, women spent nearly
seven times more time in unpaid work than men, and six times more in Tunisia. Oman and Qatar
are again exceptions to this relationship, with ratios comparable to developed countries. Algeria
and the State of Palestine are also above five times. One can also note that urban Islamic Republic
of Iran is on the right side of the chart because the survey is limited to urban areas where gender
disparities are less marked.
Chart 10 shows the ratio in total work is higher than 1 in 10 surveys (out of 16), ranging from
1.035 in Morocco and 1.099 in Oman to 1.237 in Turkey, 1.357 in Algeria and 1.415 in rural Iraq.
Chart 8: Number of times the time spent by women in paid work exceeds men’s in countries in the Middle East and North Africa
0.104 0.113 0.126 0.138 0.14 0.141 0.142 0.147 0.152 0.167 0.177
0.249 0.255
0.31
0.362
0.524 Ratio of time spent in paid work:
Women/Men
Time Use Across the World: Findings of a World Compilation of Time Use Surveys
2015 Human Development Report Office
24 BACKGROUND PAPER
Chart 9: Number of times the time spent by women in unpaid work exceeds men’s in countries in the Middle East and North Africa
Chart 10: Number of times the time spent by women in total work exceeds men’s in countries in the Middle East and North Africa
6.98
6.27 6.24 6.16 6.04 5.89 5.78 5.77
5.48
4.24 4.22 3.96 3.95
3.69
2.38
1.81
Ratio of time spent in unpaid work: Women/Men
1.42 1.36
1.26 1.25 1.25 1.24 1.23 1.22 1.10
1.04 0.99 0.99 0.96 0.96 0.93 0.92
Ratio of time spent in total work: Women/Men
Time Use Across the World: Findings of a World Compilation of Time Use Surveys
2015 Human Development Report Office
BACKGROUND PAPER 25
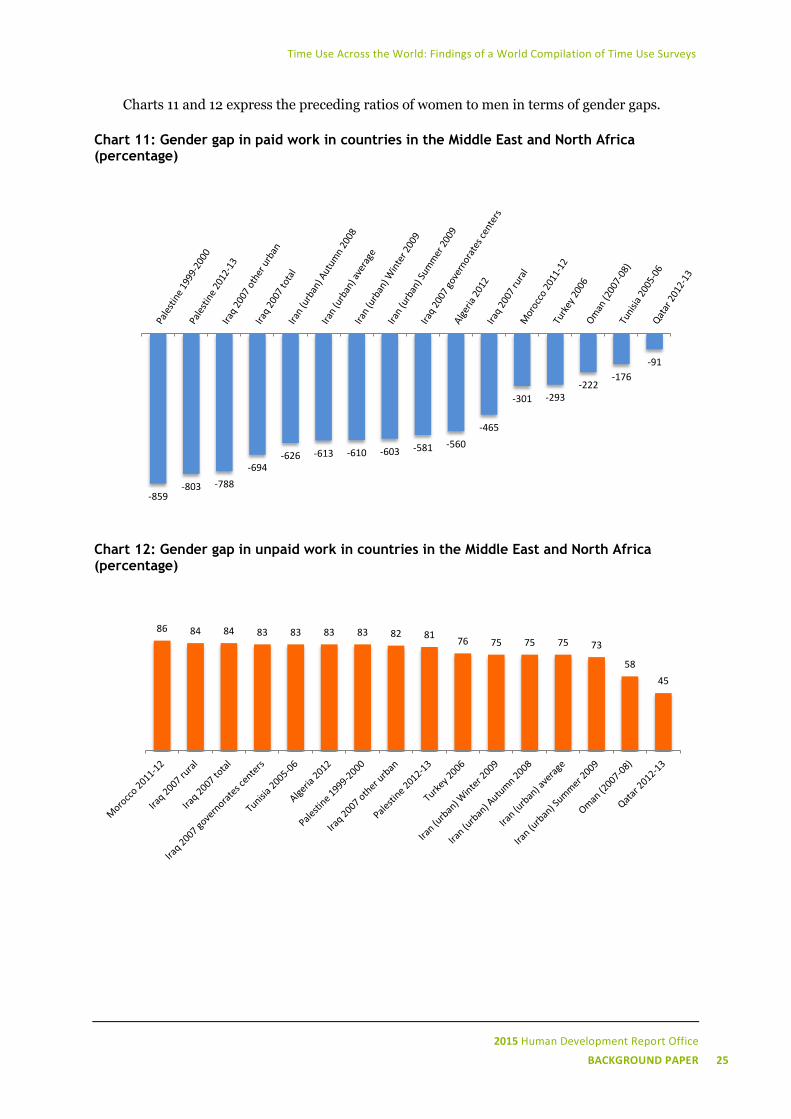
Charts 11 and 12 express the preceding ratios of women to men in terms of gender gaps.
Chart 11: Gender gap in paid work in countries in the Middle East and North Africa (percentage)
Chart 12: Gender gap in unpaid work in countries in the Middle East and North Africa (percentage)
-859 -803 -788
-694 -626 -613 -610 -603 -581 -560
-465
-301 -293 -222
-176
-91
86 84 84 83 83 83 83 82 81 76 75 75 75 73
58
45
Time Use Across the World: Findings of a World Compilation of Time Use Surveys
2015 Human Development Report Office
26 BACKGROUND PAPER
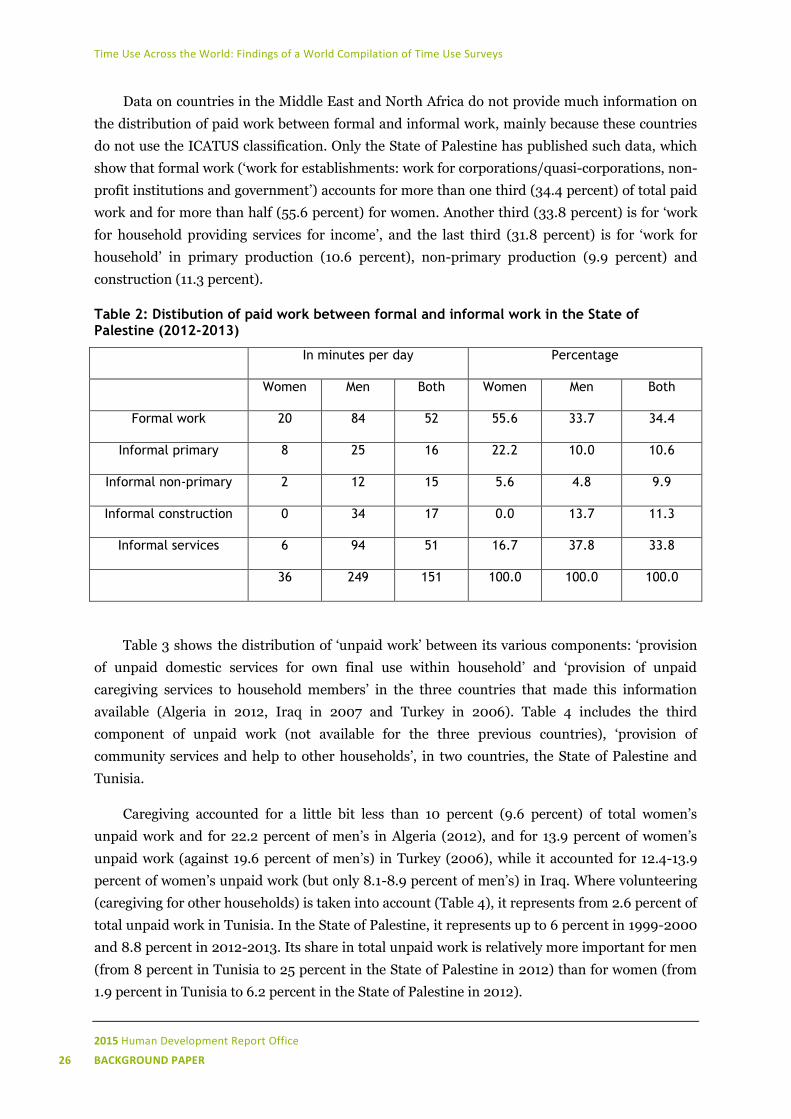
Data on countries in the Middle East and North Africa do not provide much information on
the distribution of paid work between formal and informal work, mainly because these countries
do not use the ICATUS classification. Only the State of Palestine has published such data, which
show that formal work (‘work for establishments: work for corporations/quasi-corporations, non-
profit institutions and government’) accounts for more than one third (34.4 percent) of total paid
work and for more than half (55.6 percent) for women. Another third (33.8 percent) is for ‘work
for household providing services for income’, and the last third (31.8 percent) is for ‘work for
household’ in primary production (10.6 percent), non-primary production (9.9 percent) and
construction (11.3 percent).
Table 2: Distibution of paid work between formal and informal work in the State of Palestine (2012-2013)
In minutes per day Percentage
Women Men Both Women Men Both
Formal work 20 84 52 55.6 33.7 34.4
Informal primary 8 25 16 22.2 10.0 10.6
Informal non-primary 2 12 15 5.6 4.8 9.9
Informal construction 0 34 17 0.0 13.7 11.3
Informal services 6 94 51 16.7 37.8 33.8
36 249 151 100.0 100.0 100.0
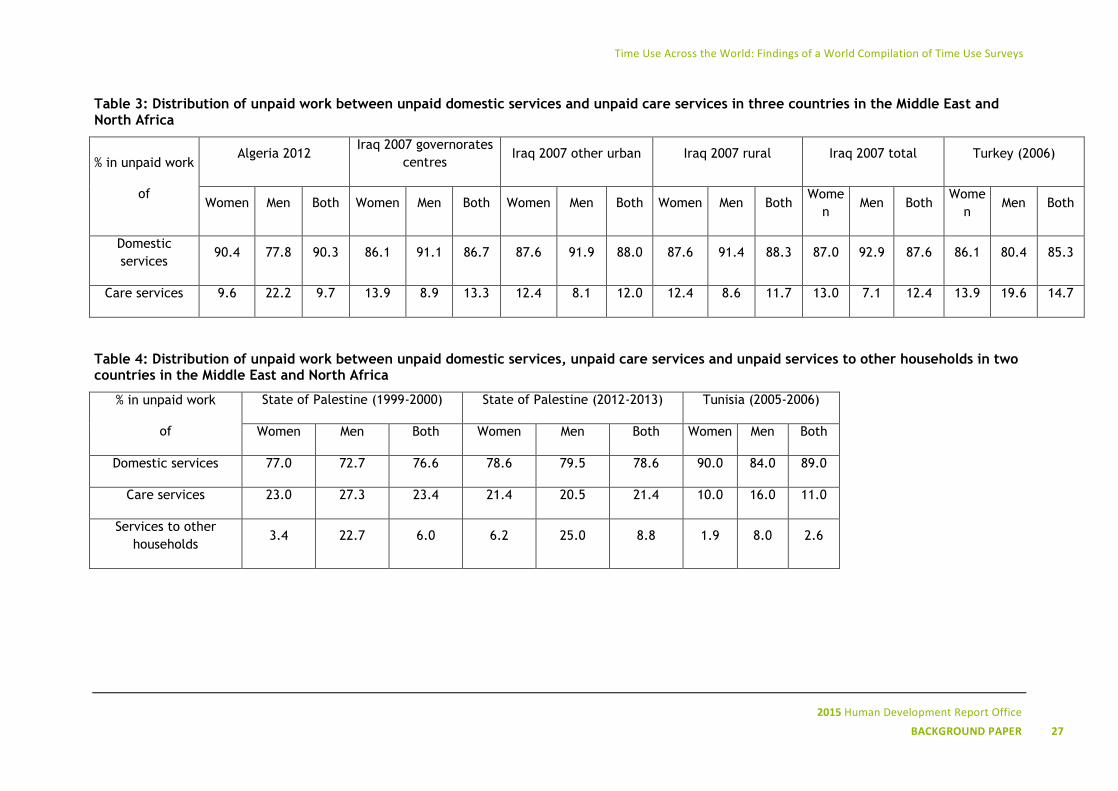
Table 3 shows the distribution of ‘unpaid work’ between its various components: ‘provision
of unpaid domestic services for own final use within household’ and ‘provision of unpaid
caregiving services to household members’ in the three countries that made this information
available (Algeria in 2012, Iraq in 2007 and Turkey in 2006). Table 4 includes the third
component of unpaid work (not available for the three previous countries), ‘provision of
community services and help to other households’, in two countries, the State of Palestine and
Tunisia.
Caregiving accounted for a little bit less than 10 percent (9.6 percent) of total women’s
unpaid work and for 22.2 percent of men’s in Algeria (2012), and for 13.9 percent of women’s
unpaid work (against 19.6 percent of men’s) in Turkey (2006), while it accounted for 12.4-13.9
percent of women’s unpaid work (but only 8.1-8.9 percent of men’s) in Iraq. Where volunteering
(caregiving for other households) is taken into account (Table 4), it represents from 2.6 percent of
total unpaid work in Tunisia. In the State of Palestine, it represents up to 6 percent in 1999-2000
and 8.8 percent in 2012-2013. Its share in total unpaid work is relatively more important for men
(from 8 percent in Tunisia to 25 percent in the State of Palestine in 2012) than for women (from
1.9 percent in Tunisia to 6.2 percent in the State of Palestine in 2012).
Time Use Across the World: Findings of a World Compilation of Time Use Surveys
2015 Human Development Report Office
BACKGROUND PAPER 27
Table 3: Distribution of unpaid work between unpaid domestic services and unpaid care services in three countries in the Middle East and North Africa
% in unpaid work
of
Algeria 2012 Iraq 2007 governorates
centres Iraq 2007 other urban Iraq 2007 rural Iraq 2007 total Turkey (2006)
Women Men Both Women Men Both Women Men Both Women Men Both Wome
n Men Both
Wome
n Men Both
Domestic
services 90.4 77.8 90.3 86.1 91.1 86.7 87.6 91.9 88.0 87.6 91.4 88.3 87.0 92.9 87.6 86.1 80.4 85.3
Care services 9.6 22.2 9.7 13.9 8.9 13.3 12.4 8.1 12.0 12.4 8.6 11.7 13.0 7.1 12.4 13.9 19.6 14.7
Table 4: Distribution of unpaid work between unpaid domestic services, unpaid care services and unpaid services to other households in two countries in the Middle East and North Africa
% in unpaid work
of
State of Palestine (1999-2000) State of Palestine (2012-2013) Tunisia (2005-2006)
Women Men Both Women Men Both Women Men Both
Domestic services 77.0 72.7 76.6 78.6 79.5 78.6 90.0 84.0 89.0
Care services 23.0 27.3 23.4 21.4 20.5 21.4 10.0 16.0 11.0
Services to other
households 3.4 22.7 6.0 6.2 25.0 8.8 1.9 8.0 2.6
Time Use Across the World: Findings of a World Compilation of Time Use Surveys
2015 Human Development Report Office
28 BACKGROUND PAPER
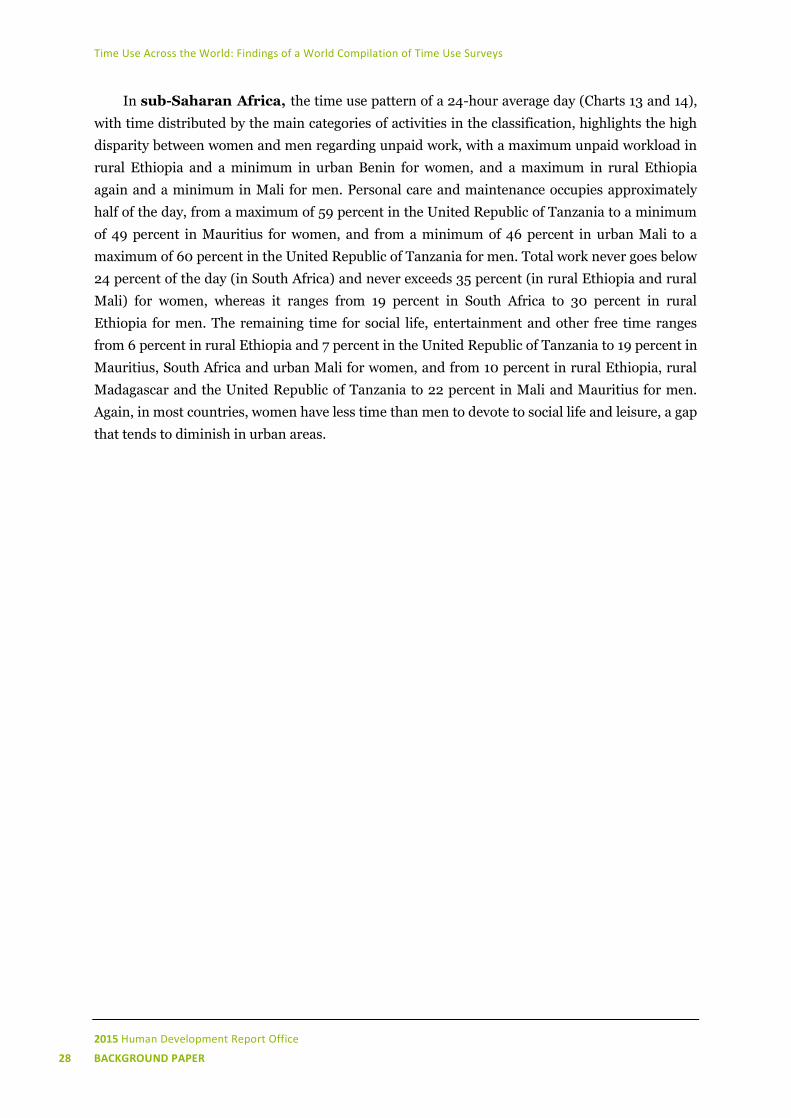
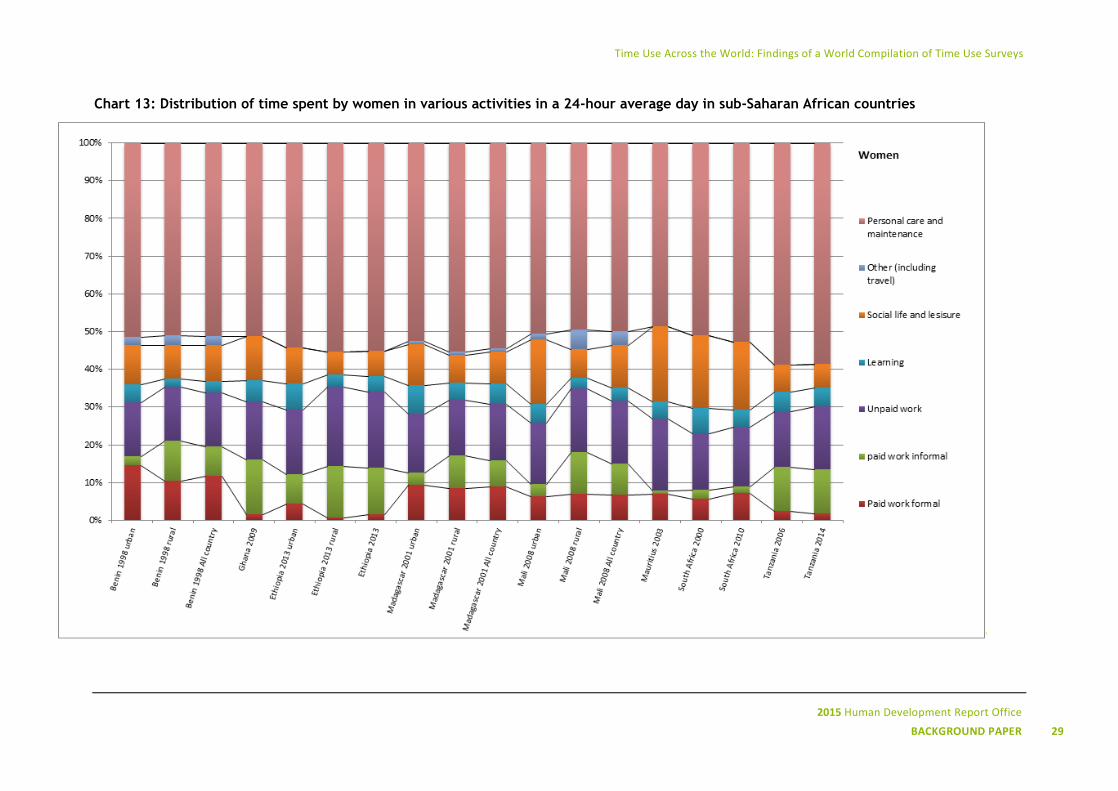
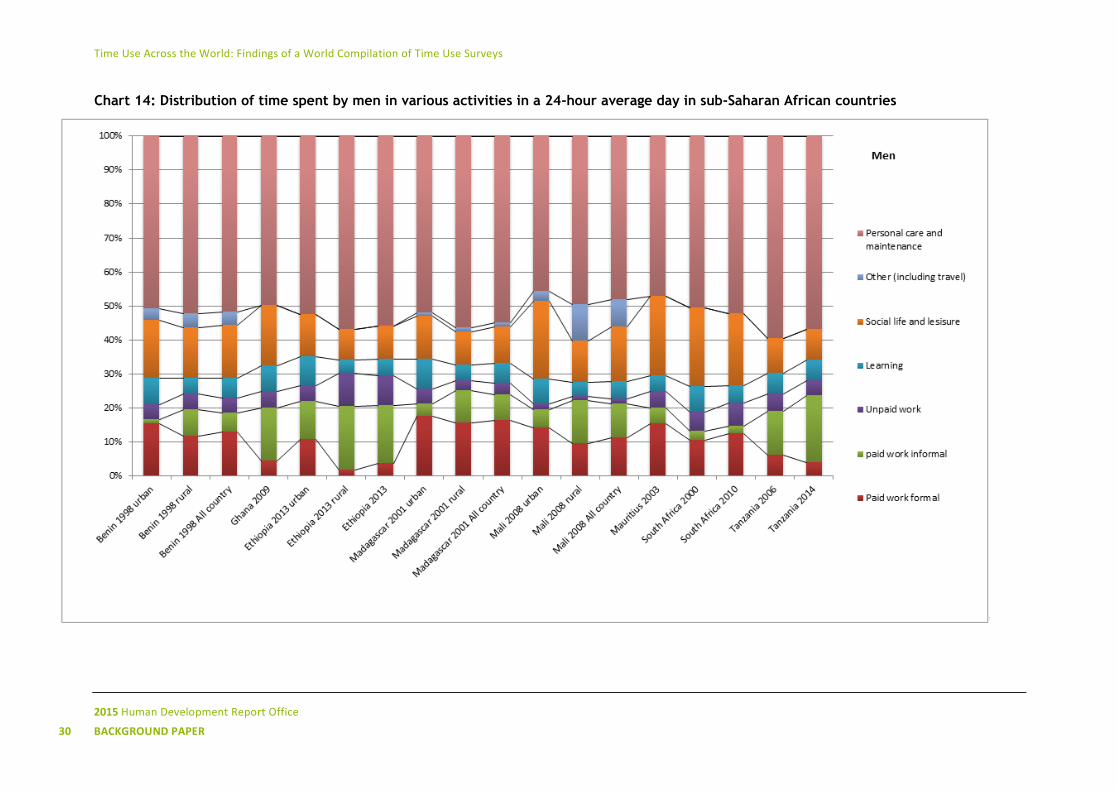
In sub-Saharan Africa, the time use pattern of a 24-hour average day (Charts 13 and 14),
with time distributed by the main categories of activities in the classification, highlights the high
disparity between women and men regarding unpaid work, with a maximum unpaid workload in
rural Ethiopia and a minimum in urban Benin for women, and a maximum in rural Ethiopia
again and a minimum in Mali for men. Personal care and maintenance occupies approximately
half of the day, from a maximum of 59 percent in the United Republic of Tanzania to a minimum
of 49 percent in Mauritius for women, and from a minimum of 46 percent in urban Mali to a
maximum of 60 percent in the United Republic of Tanzania for men. Total work never goes below
24 percent of the day (in South Africa) and never exceeds 35 percent (in rural Ethiopia and rural
Mali) for women, whereas it ranges from 19 percent in South Africa to 30 percent in rural
Ethiopia for men. The remaining time for social life, entertainment and other free time ranges
from 6 percent in rural Ethiopia and 7 percent in the United Republic of Tanzania to 19 percent in
Mauritius, South Africa and urban Mali for women, and from 10 percent in rural Ethiopia, rural
Madagascar and the United Republic of Tanzania to 22 percent in Mali and Mauritius for men.
Again, in most countries, women have less time than men to devote to social life and leisure, a gap
that tends to diminish in urban areas.
Time Use Across the World: Findings of a World Compilation of Time Use Surveys
2015 Human Development Report Office
BACKGROUND PAPER 29
Chart 13: Distribution of time spent by women in various activities in a 24-hour average day in sub-Saharan African countries
Time Use Across the World: Findings of a World Compilation of Time Use Surveys
2015 Human Development Report Office
30 BACKGROUND PAPER
Chart 14: Distribution of time spent by men in various activities in a 24-hour average day in sub-Saharan African countries
Time Use Across the World: Findings of a World Compilation of Time Use Surveys
2015 Human Development Report Office
BACKGROUND PAPER 31
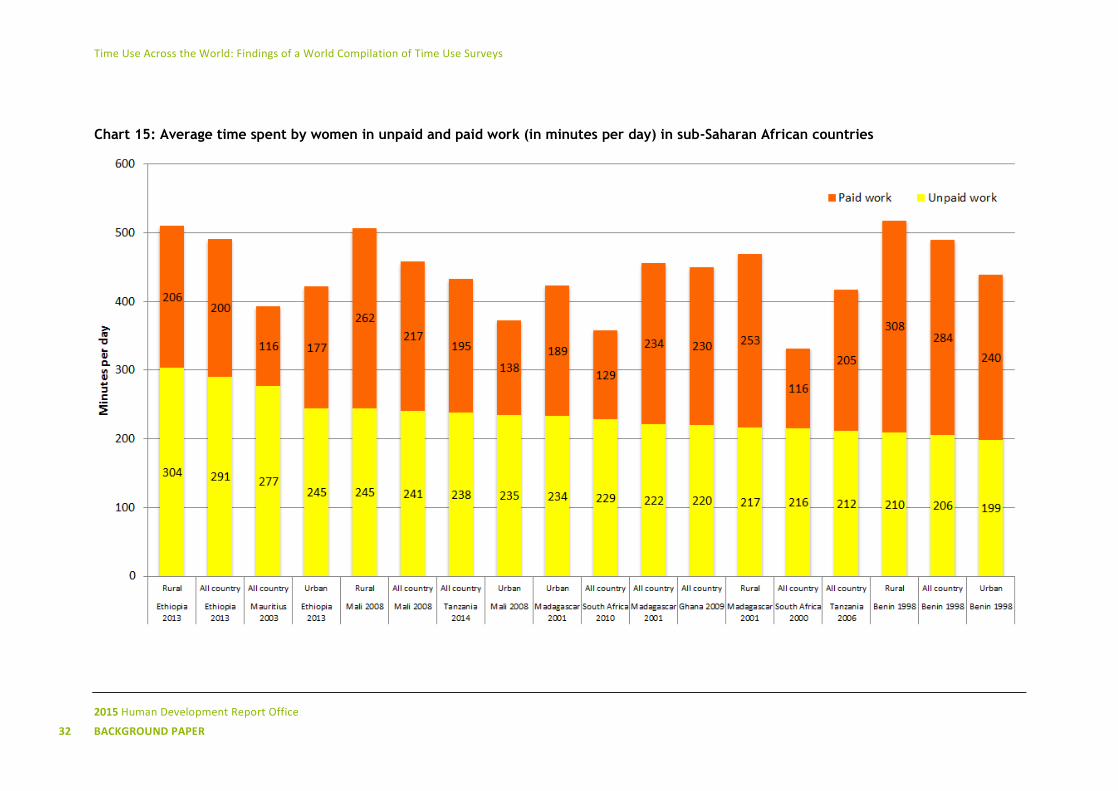
In the region, disparities among countries are the highest and the total workload for women
is also the highest, particularly in rural areas. Women spent 8 hours and 38 minutes per average
day in paid and unpaid work in Benin, 8 hours and 30 minutes in rural Ethiopia and 8 hours and
27 minutes in rural Mali (Chart 15), or one to three hours more than their male counterparts
(Chart 16).
In contrast with the Middle East and North Africa, sub-Saharan African women devote much
more time to paid work: in Benin, Ghana, Madagascar and Mali, their number of hours in paid
work is longer than in unpaid work, especially in rural areas. In Mauritius, South Africa and also
in urban Mali, on the contrary, the number of hours women devote to paid work is much lower
than to unpaid work, but still remains much higher than in Middle East and North African
countries. The time spent by women in total work exceeds 6 hours and 40 minutes (400 minutes)
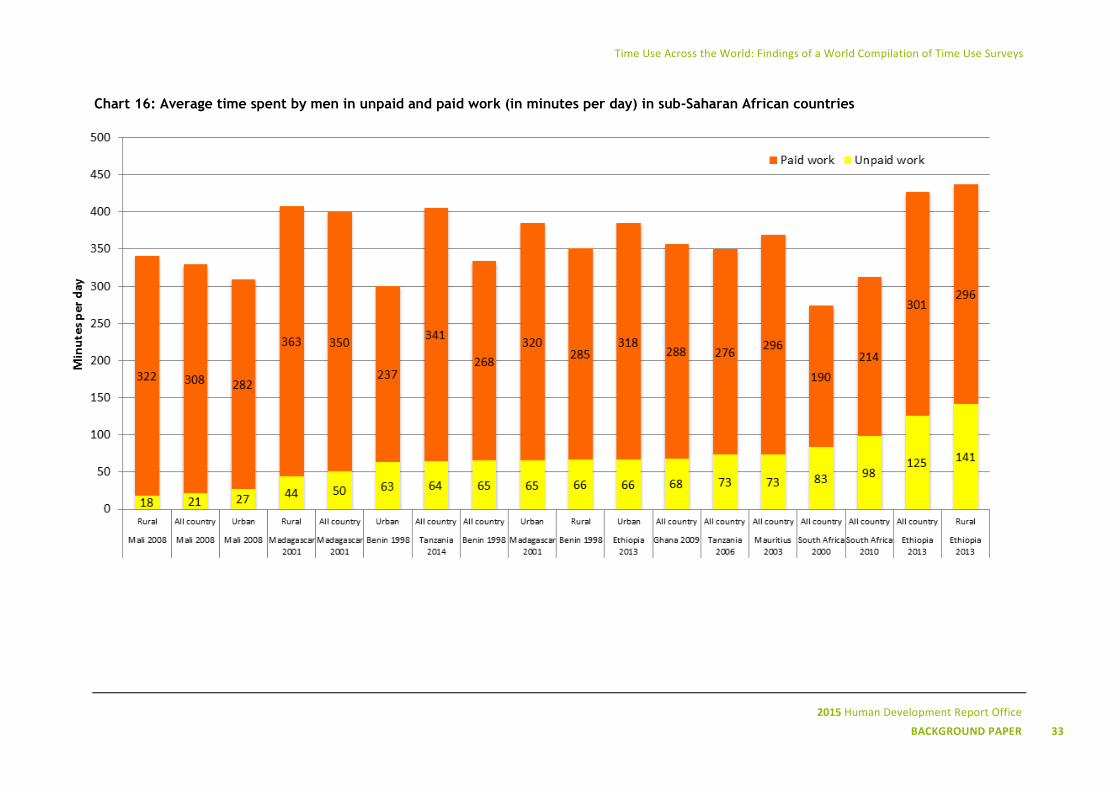
per day in 13 surveys (out of 18), against 3 surveys (out of 16) in the Middle East and North Africa.
Comparatively (Chart 12), time spent in total work by men is above this same line (400 minutes
per day) in 4 surveys only (rural Ethiopia, Madagascar and the United Republic of Tanzania, and
nationally for Ethiopia).
In sub-Saharan Africa, women spend fewer hours in unpaid work than in the Middle East
and North Africa and men more hours, except in Mali.
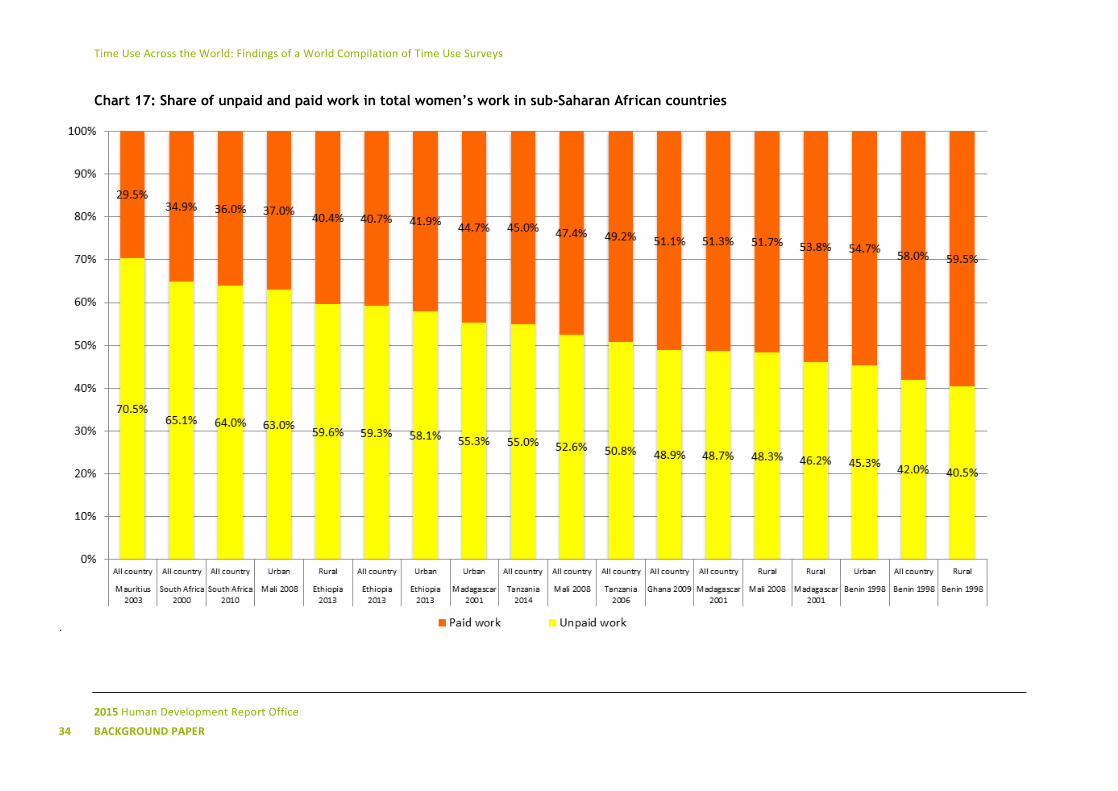
The share of unpaid work in total work is nearly equal to 70 percent in one country
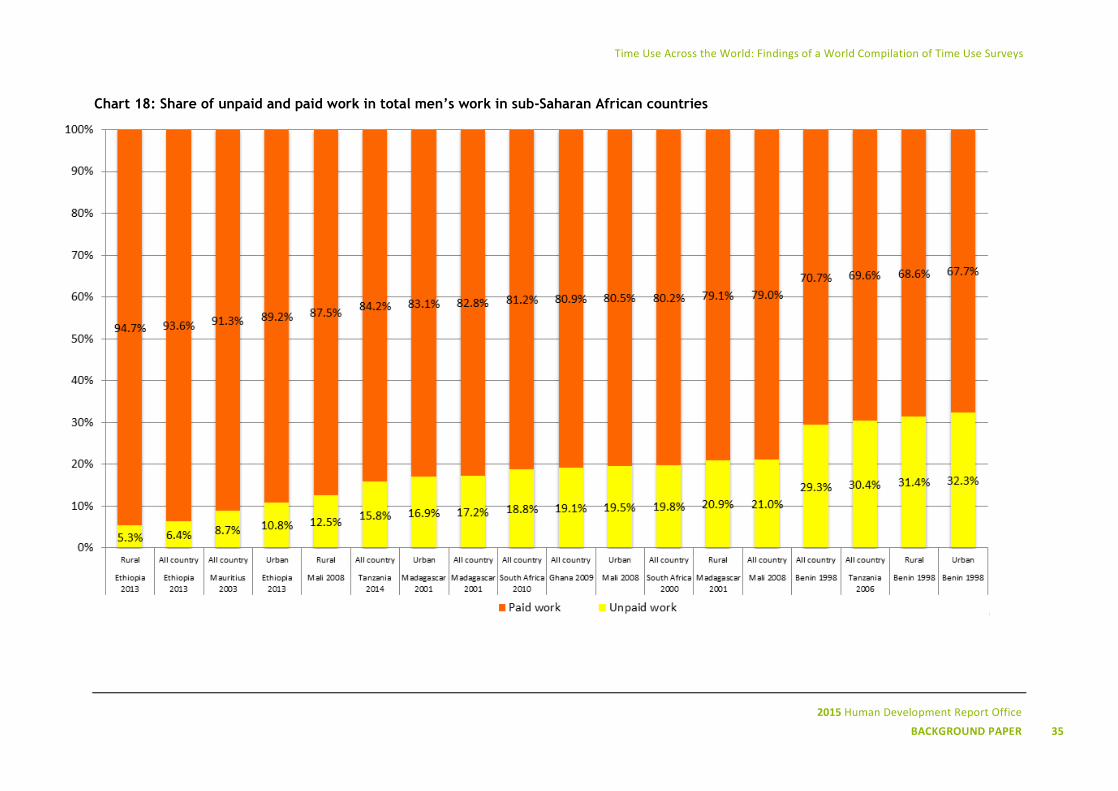
(Mauritius) and less in all other surveys, down to a minimum of 40.5 percent in rural Benin. For
men, this share ranges from 5.3 percent in rural Ethiopia to 32.3 percent in urban Benin, slightly
below the levels of Middle East and North African countries (Charts 17 and 18).
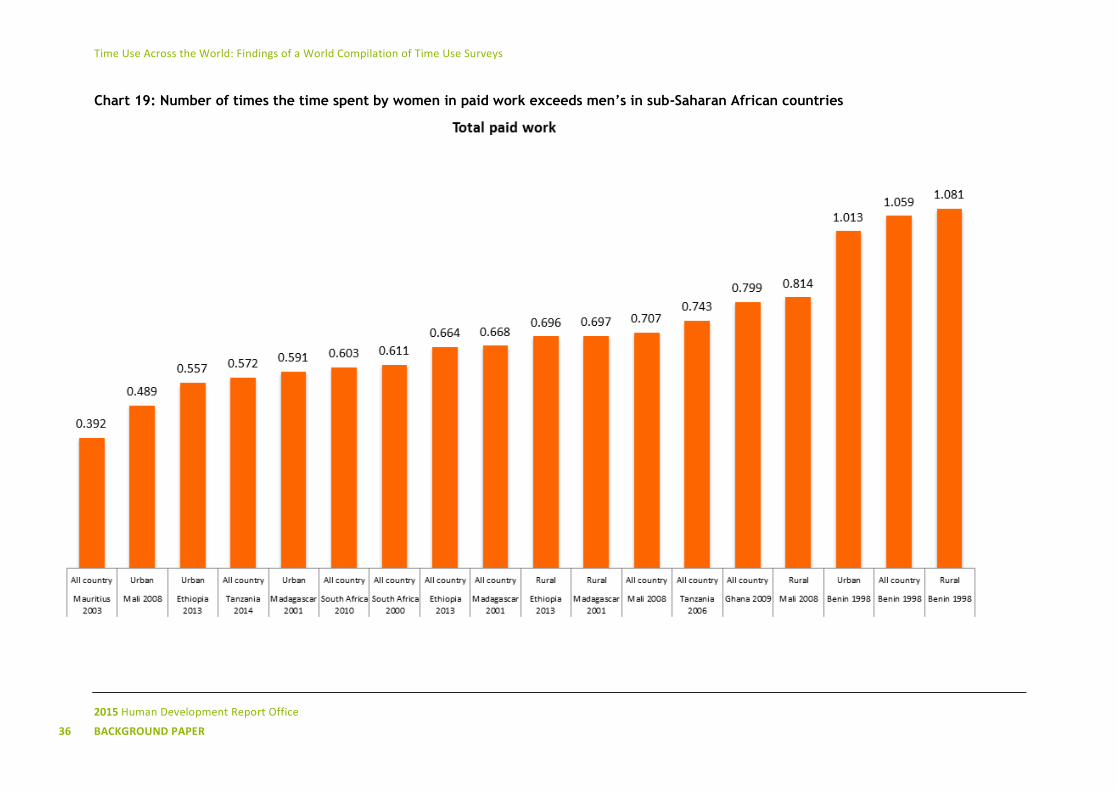
The ratio of time spent in paid work by women and men (Chart 19) is above parity in Benin
(urban, rural and national), with an indicator above 1, and it is above 0.5 in all surveys except
Mauritius (0.392) and urban Mali (0.489), reflecting the fact that African women’s economic
participation is generally quite high, even if they operate in subsistence agriculture and more
generally as contributing family workers or own-account workers in informal activities.
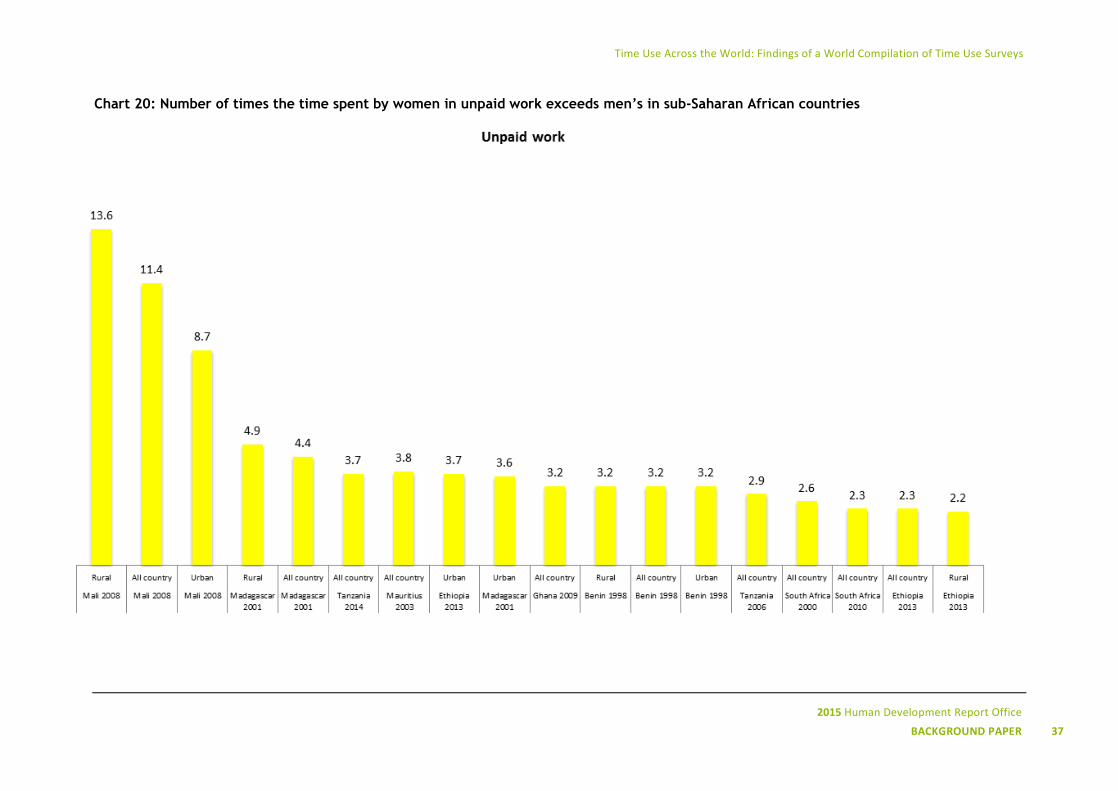
The ratio of time spent in unpaid work by women and men (Chart 20) is in all surveys more
than double parity. It ranges from a minimum of 2.2-2.3 (in Ethiopia, rural and national, and
South Africa 2010) to more than 8 and even 13 in Mali (urban at 8.7, national at 11.4 and rural at
13.6), meaning that in rural Mali, women spent over 13 times more time than men in household
chores and care of children. Except for Mali, the gender gaps in unpaid work are generally below
the levels observed in the Middle East and North Africa.
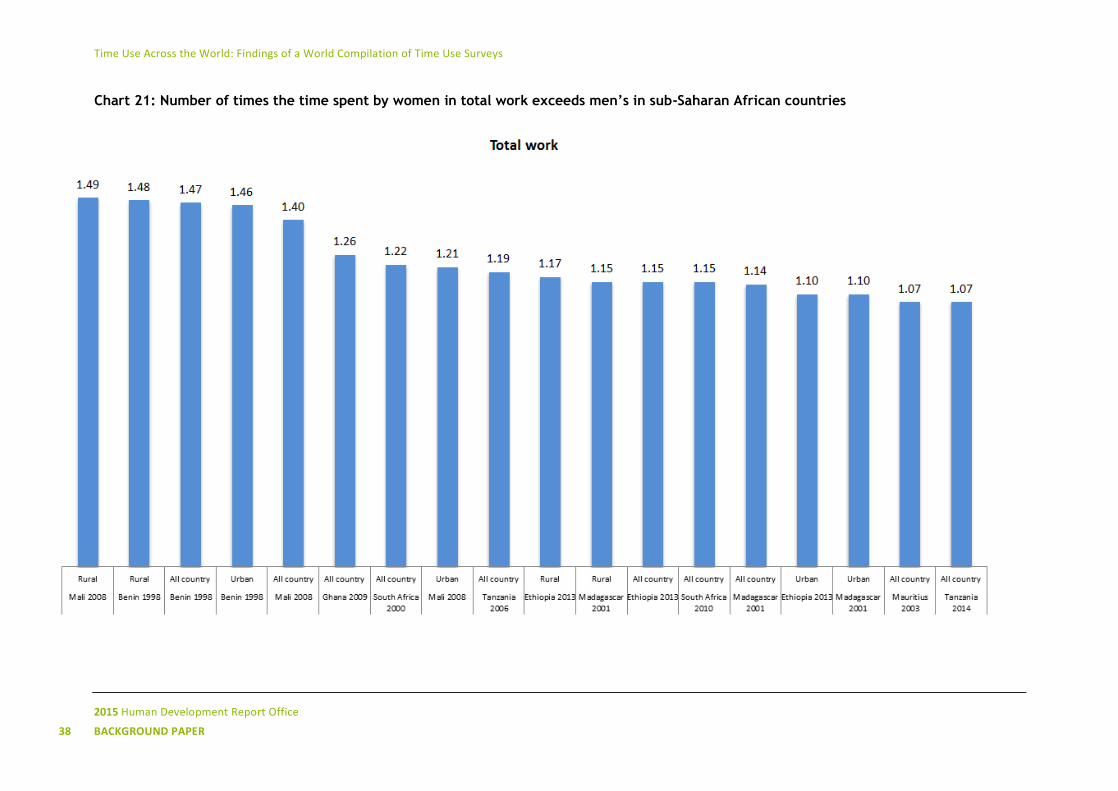
Cumulating paid and unpaid work results in ratios of total work by women and men (Chart
21) ranging from a minimum of 1.07-1.1 (United Republic of Tanzania 2014, Mauritius, urban
Madagascar and urban Ethiopia) to a maximum of 1.46-1.49 (from urban Benin to rural Mali). All
countries are above parity, meaning that in sub-Saharan Africa, women work more than men.
Time Use Across the World: Findings of a World Compilation of Time Use Surveys
2015 Human Development Report Office
32 BACKGROUND PAPER
Chart 15: Average time spent by women in unpaid and paid work (in minutes per day) in sub-Saharan African countries
Time Use Across the World: Findings of a World Compilation of Time Use Surveys
2015 Human Development Report Office
BACKGROUND PAPER 33
Chart 16: Average time spent by men in unpaid and paid work (in minutes per day) in sub-Saharan African countries
Time Use Across the World: Findings of a World Compilation of Time Use Surveys
2015 Human Development Report Office
34 BACKGROUND PAPER
Chart 17: Share of unpaid and paid work in total women’s work in sub-Saharan African countries
Time Use Across the World: Findings of a World Compilation of Time Use Surveys
2015 Human Development Report Office
BACKGROUND PAPER 35
Chart 18: Share of unpaid and paid work in total men’s work in sub-Saharan African countries
Time Use Across the World: Findings of a World Compilation of Time Use Surveys
2015 Human Development Report Office
36 BACKGROUND PAPER
Chart 19: Number of times the time spent by women in paid work exceeds men’s in sub-Saharan African countries
Time Use Across the World: Findings of a World Compilation of Time Use Surveys
2015 Human Development Report Office
BACKGROUND PAPER 37
Chart 20: Number of times the time spent by women in unpaid work exceeds men’s in sub-Saharan African countries
Time Use Across the World: Findings of a World Compilation of Time Use Surveys
2015 Human Development Report Office
38 BACKGROUND PAPER
Chart 21: Number of times the time spent by women in total work exceeds men’s in sub-Saharan African countries
Time Use Across the World: Findings of a World Compilation of Time Use Surveys
2015 Human Development Report Office
BACKGROUND PAPER 39
Although the use of ICATUS as the classification for time use in sub-Saharan Africa allows a
distinction between formal paid work and informal paid work, this is, however, not quite the case.
The first trial ICATUS distinguished between ‘work for establishments’ and ‘work for the household’.
As a matter of fact, many informal activities operate in establishments, whatever the rudimentary
aspects of the premises. The new ICATUS is theoretically closer to the definition of ‘informal sector’
as it distinguishes between ‘work for corporations, quasi-corporations, non-profit institutions and
government’, and four categories of work for the household (primary, non-primary production,
construction, services for income). Application of the classification remains difficult, however.
Surveys results show a gap between countries using the new ICATUS (Ethiopia and Ghana), where
informal activities surpass formal paid work, and countries using the former ICATUS, where formal
paid work is in fact assimilated in ‘work for establishments’. Informal activities include agriculture,
and this is why informal paid work is generally more important in rural than urban areas.
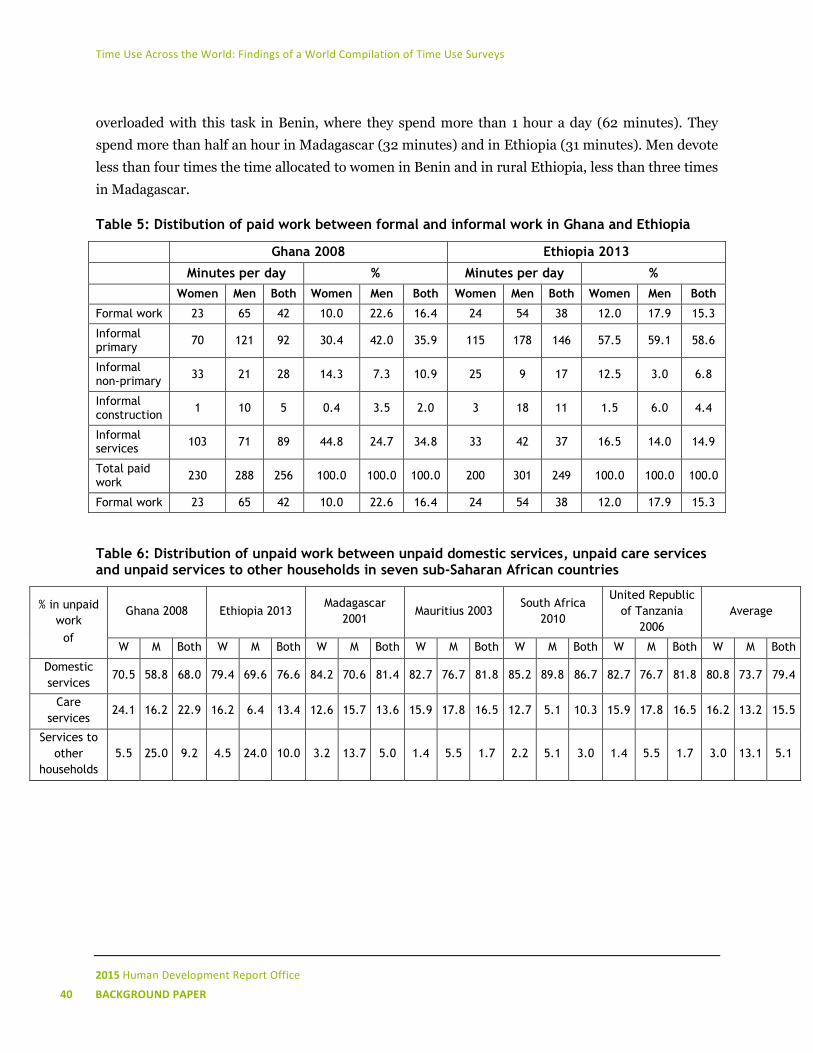
Table 5 shows that time spent by women in formal paid work does not exceed more than 10
percent of total time spent in paid work in Ghana and 12 percent in Ethiopia. And whereas women
spend most of their paid work time in informal services (44.8 percent) and in primary production
(35.9 percent) in Ghana, this shifts mostly to primary production (57.5 percent) and less in informal
services (16.5 percent) in Ethiopia.
Table 6 presents the distribution of ‘unpaid work’ between its various components: ‘provision of
unpaid domestic services for own final use within household’, ‘provision of unpaid caregiving
services to household members’ and ‘provision of community services and help to other households’
in six countries.
Caregiving accounts for more than 24 percent of women’s total unpaid work in Ghana, around
16 percent in Ethiopia, Mauritius and the United Republic of Tanzania and a little bit more than12
percent in Madagascar and South Africa.
Generally, men spend more time than women in volunteering (caregiving for other households),
which represents a higher share of total unpaid work among men (from 5.1 percent in South Africa
up to 25 percent in Ghana) than among women (from 1.4 percent in the United Republic of Tanzania
and Mauritius, up to 5.5 percent in Ghana).
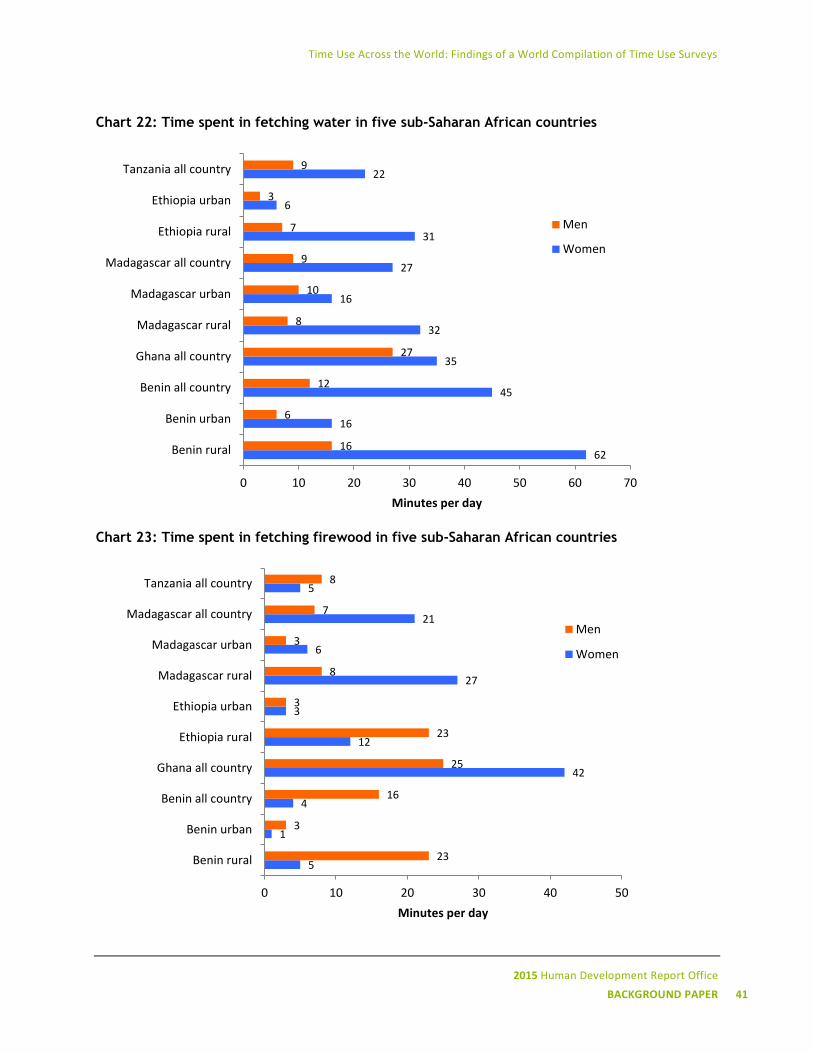
Sub-Saharan Africa is also the region where data on water and firewood fetching—two activities,
at the border between unpaid domestic work and unpaid contributing work, but that are officially
classified within the GDP boundaries—have been more systematically collected. Charts 22 and 23
show the importance of time spent in these activities in five sub-Saharan African countries, in rural
and urban areas. Women spent 45 minutes a day collecting water in Benin, 35 minutes in Ghana, 27
minutes in Madagascar and 22 minutes in the United Republic of Tanzania. Rural women are
Time Use Across the World: Findings of a World Compilation of Time Use Surveys
2015 Human Development Report Office
40 BACKGROUND PAPER
overloaded with this task in Benin, where they spend more than 1 hour a day (62 minutes). They
spend more than half an hour in Madagascar (32 minutes) and in Ethiopia (31 minutes). Men devote
less than four times the time allocated to women in Benin and in rural Ethiopia, less than three times
in Madagascar.
Table 5: Distibution of paid work between formal and informal work in Ghana and Ethiopia
Ghana 2008 Ethiopia 2013
Minutes per day % Minutes per day %
Women Men Both Women Men Both Women Men Both Women Men Both
Formal work 23 65 42 10.0 22.6 16.4 24 54 38 12.0 17.9 15.3
Informal primary
70 121 92 30.4 42.0 35.9 115 178 146 57.5 59.1 58.6
Informal non-primary
33 21 28 14.3 7.3 10.9 25 9 17 12.5 3.0 6.8
Informal construction
1 10 5 0.4 3.5 2.0 3 18 11 1.5 6.0 4.4
Informal services
103 71 89 44.8 24.7 34.8 33 42 37 16.5 14.0 14.9
Total paid work
230 288 256 100.0 100.0 100.0 200 301 249 100.0 100.0 100.0
Formal work 23 65 42 10.0 22.6 16.4 24 54 38 12.0 17.9 15.3
Table 6: Distribution of unpaid work between unpaid domestic services, unpaid care services and unpaid services to other households in seven sub-Saharan African countries
% in unpaid
work
of
Ghana 2008 Ethiopia 2013 Madagascar
2001 Mauritius 2003
South Africa
2010
United Republic
of Tanzania
2006
Average
W M Both W M Both W M Both W M Both W M Both W M Both W M Both
Domestic
services 70.5 58.8 68.0 79.4 69.6 76.6 84.2 70.6 81.4 82.7 76.7 81.8 85.2 89.8 86.7 82.7 76.7 81.8 80.8 73.7 79.4
Care
services 24.1 16.2 22.9 16.2 6.4 13.4 12.6 15.7 13.6 15.9 17.8 16.5 12.7 5.1 10.3 15.9 17.8 16.5 16.2 13.2 15.5
Services to
other
households
5.5 25.0 9.2 4.5 24.0 10.0 3.2 13.7 5.0 1.4 5.5 1.7 2.2 5.1 3.0 1.4 5.5 1.7 3.0 13.1 5.1
Time Use Across the World: Findings of a World Compilation of Time Use Surveys
2015 Human Development Report Office
BACKGROUND PAPER 41
Chart 22: Time spent in fetching water in five sub-Saharan African countries
Chart 23: Time spent in fetching firewood in five sub-Saharan African countries
62
16
45
35
32
16
27
31
6
22
16
6
12
27
8
10
9
7
3
9
0 10 20 30 40 50 60 70
Benin rural
Benin urban
Benin all country
Ghana all country
Madagascar rural
Madagascar urban
Madagascar all country
Ethiopia rural
Ethiopia urban
Tanzania all country
Minutes per day
Men
Women
5
1
4
42
12
3
27
6
21
5
23
3
16
25
23
3
8
3
7
8
0 10 20 30 40 50
Benin rural
Benin urban
Benin all country
Ghana all country
Ethiopia rural
Ethiopia urban
Madagascar rural
Madagascar urban
Madagascar all country
Tanzania all country
Minutes per day
Men
Women
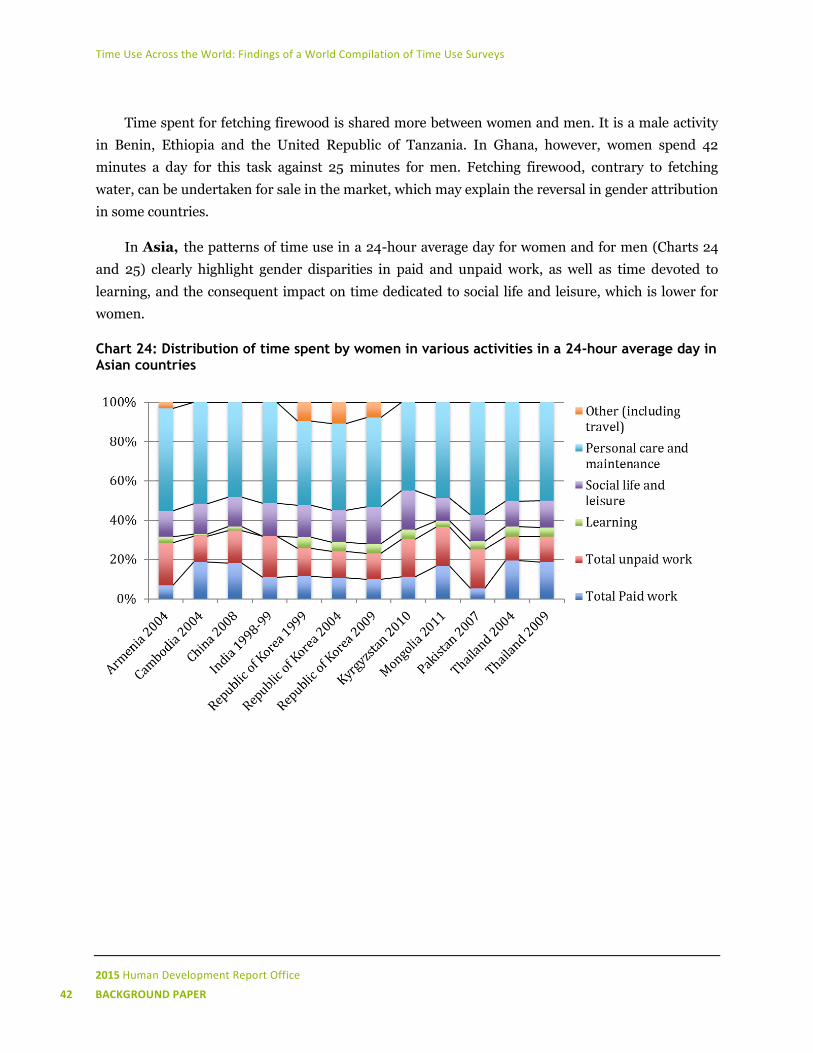
Time Use Across the World: Findings of a World Compilation of Time Use Surveys
2015 Human Development Report Office
42 BACKGROUND PAPER
Time spent for fetching firewood is shared more between women and men. It is a male activity
in Benin, Ethiopia and the United Republic of Tanzania. In Ghana, however, women spend 42
minutes a day for this task against 25 minutes for men. Fetching firewood, contrary to fetching
water, can be undertaken for sale in the market, which may explain the reversal in gender attribution
in some countries.
In Asia, the patterns of time use in a 24-hour average day for women and for men (Charts 24
and 25) clearly highlight gender disparities in paid and unpaid work, as well as time devoted to
learning, and the consequent impact on time dedicated to social life and leisure, which is lower for
women.
Chart 24: Distribution of time spent by women in various activities in a 24-hour average day in Asian countries
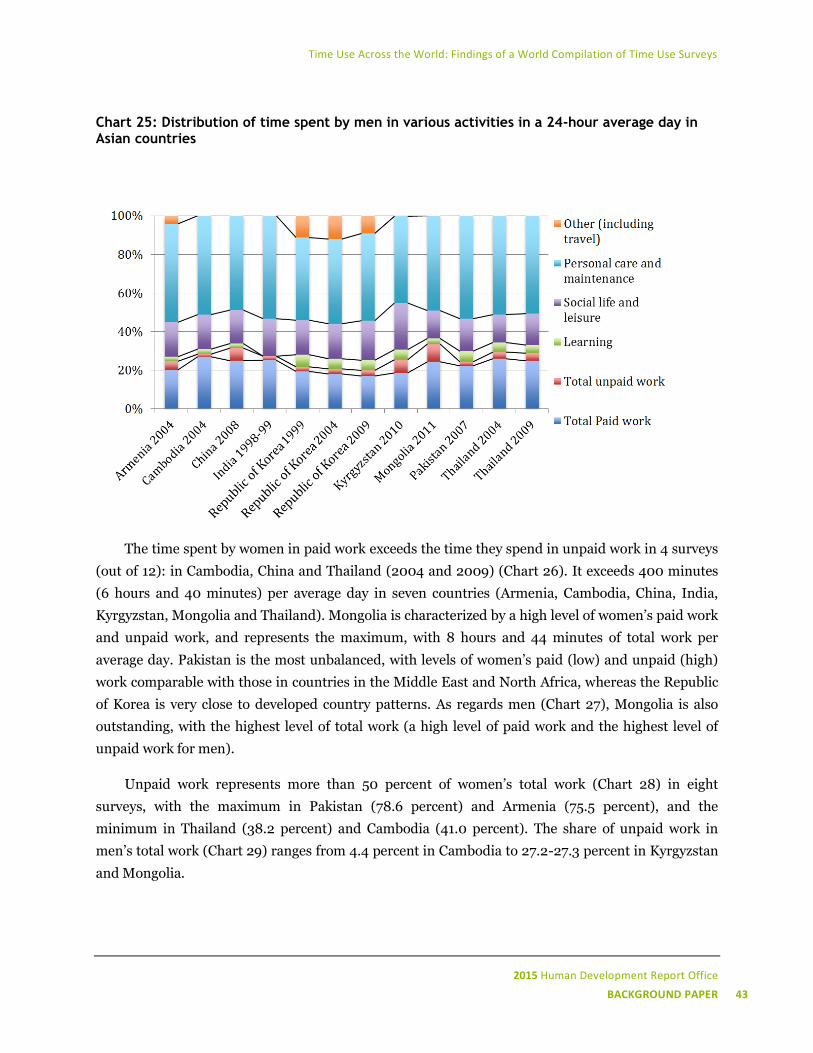
Time Use Across the World: Findings of a World Compilation of Time Use Surveys
2015 Human Development Report Office
BACKGROUND PAPER 43
Chart 25: Distribution of time spent by men in various activities in a 24-hour average day in Asian countries
The time spent by women in paid work exceeds the time they spend in unpaid work in 4 surveys
(out of 12): in Cambodia, China and Thailand (2004 and 2009) (Chart 26). It exceeds 400 minutes
(6 hours and 40 minutes) per average day in seven countries (Armenia, Cambodia, China, India,
Kyrgyzstan, Mongolia and Thailand). Mongolia is characterized by a high level of women’s paid work
and unpaid work, and represents the maximum, with 8 hours and 44 minutes of total work per
average day. Pakistan is the most unbalanced, with levels of women’s paid (low) and unpaid (high)
work comparable with those in countries in the Middle East and North Africa, whereas the Republic
of Korea is very close to developed country patterns. As regards men (Chart 27), Mongolia is also
outstanding, with the highest level of total work (a high level of paid work and the highest level of
unpaid work for men).
Unpaid work represents more than 50 percent of women’s total work (Chart 28) in eight
surveys, with the maximum in Pakistan (78.6 percent) and Armenia (75.5 percent), and the
minimum in Thailand (38.2 percent) and Cambodia (41.0 percent). The share of unpaid work in
men’s total work (Chart 29) ranges from 4.4 percent in Cambodia to 27.2-27.3 percent in Kyrgyzstan
and Mongolia.
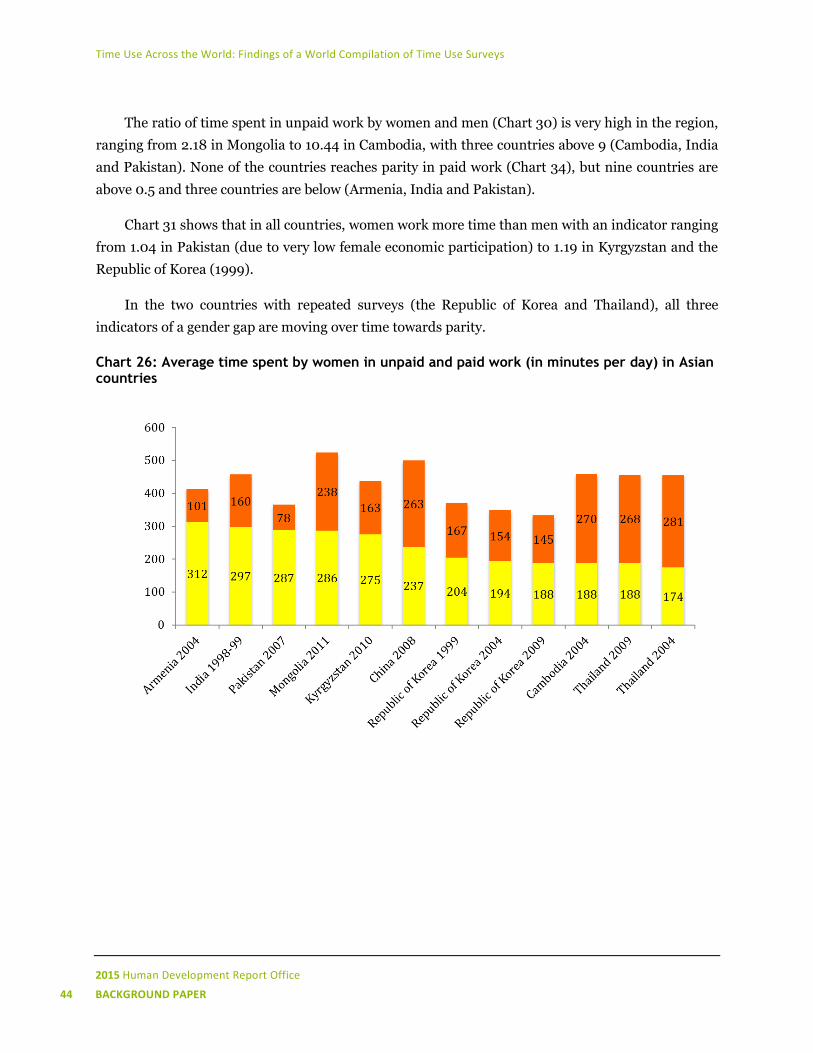
Time Use Across the World: Findings of a World Compilation of Time Use Surveys
2015 Human Development Report Office
44 BACKGROUND PAPER
The ratio of time spent in unpaid work by women and men (Chart 30) is very high in the region,
ranging from 2.18 in Mongolia to 10.44 in Cambodia, with three countries above 9 (Cambodia, India
and Pakistan). None of the countries reaches parity in paid work (Chart 34), but nine countries are
above 0.5 and three countries are below (Armenia, India and Pakistan).
Chart 31 shows that in all countries, women work more time than men with an indicator ranging
from 1.04 in Pakistan (due to very low female economic participation) to 1.19 in Kyrgyzstan and the
Republic of Korea (1999).
In the two countries with repeated surveys (the Republic of Korea and Thailand), all three
indicators of a gender gap are moving over time towards parity.
Chart 26: Average time spent by women in unpaid and paid work (in minutes per day) in Asian countries
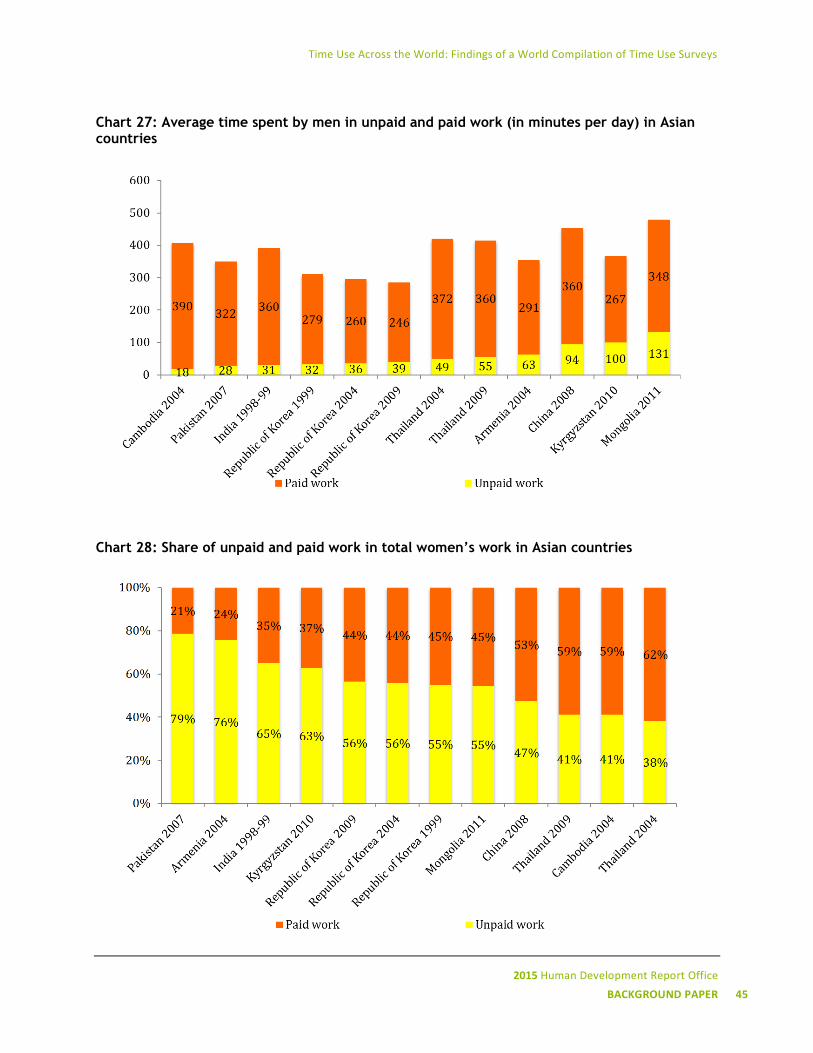
Time Use Across the World: Findings of a World Compilation of Time Use Surveys
2015 Human Development Report Office
BACKGROUND PAPER 45
Chart 27: Average time spent by men in unpaid and paid work (in minutes per day) in Asian countries
Chart 28: Share of unpaid and paid work in total women’s work in Asian countries
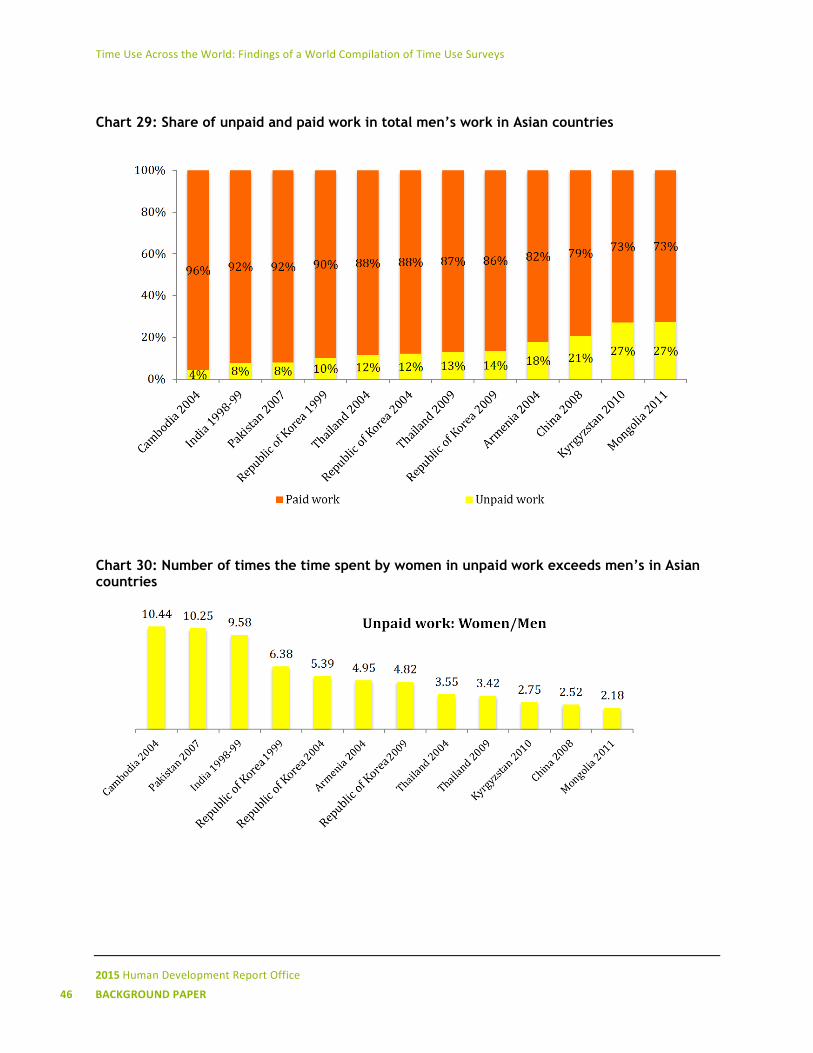
Time Use Across the World: Findings of a World Compilation of Time Use Surveys
2015 Human Development Report Office
46 BACKGROUND PAPER
Chart 29: Share of unpaid and paid work in total men’s work in Asian countries
Chart 30: Number of times the time spent by women in unpaid work exceeds men’s in Asian countries
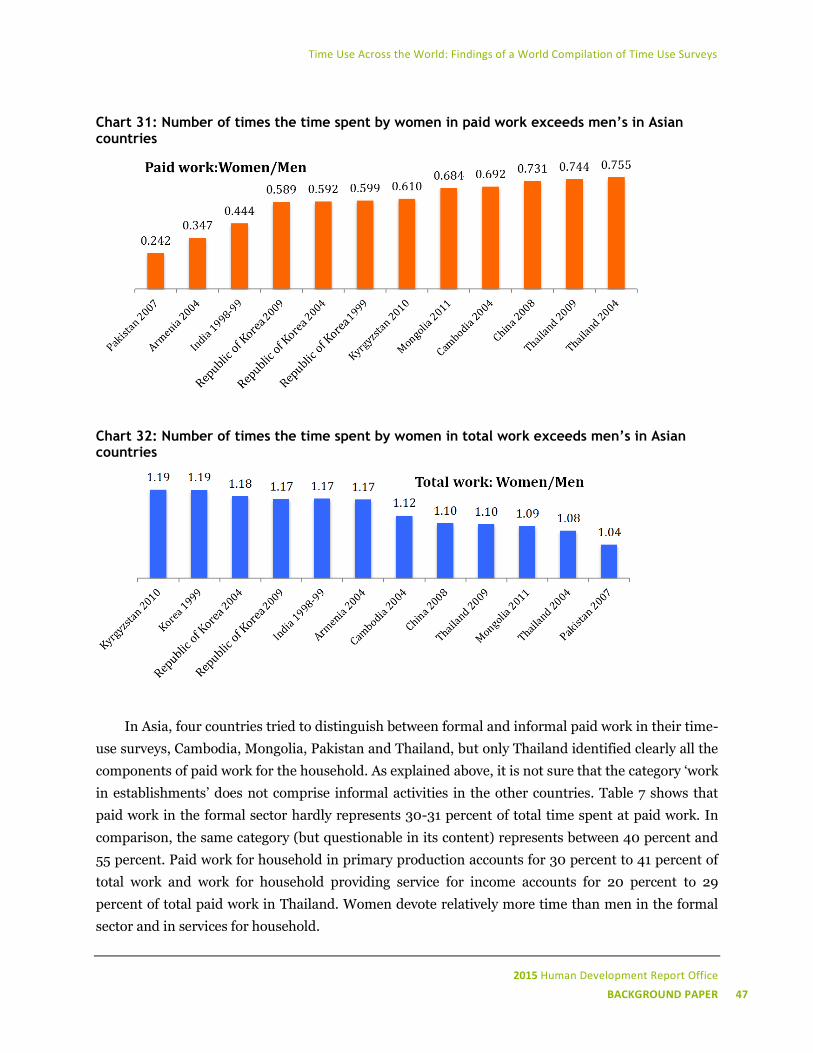
Time Use Across the World: Findings of a World Compilation of Time Use Surveys
2015 Human Development Report Office
BACKGROUND PAPER 47
Chart 31: Number of times the time spent by women in paid work exceeds men’s in Asian countries
Chart 32: Number of times the time spent by women in total work exceeds men’s in Asian countries
In Asia, four countries tried to distinguish between formal and informal paid work in their time-
use surveys, Cambodia, Mongolia, Pakistan and Thailand, but only Thailand identified clearly all the
components of paid work for the household. As explained above, it is not sure that the category ‘work
in establishments’ does not comprise informal activities in the other countries. Table 7 shows that
paid work in the formal sector hardly represents 30-31 percent of total time spent at paid work. In
comparison, the same category (but questionable in its content) represents between 40 percent and
55 percent. Paid work for household in primary production accounts for 30 percent to 41 percent of
total work and work for household providing service for income accounts for 20 percent to 29
percent of total paid work in Thailand. Women devote relatively more time than men in the formal
sector and in services for household.
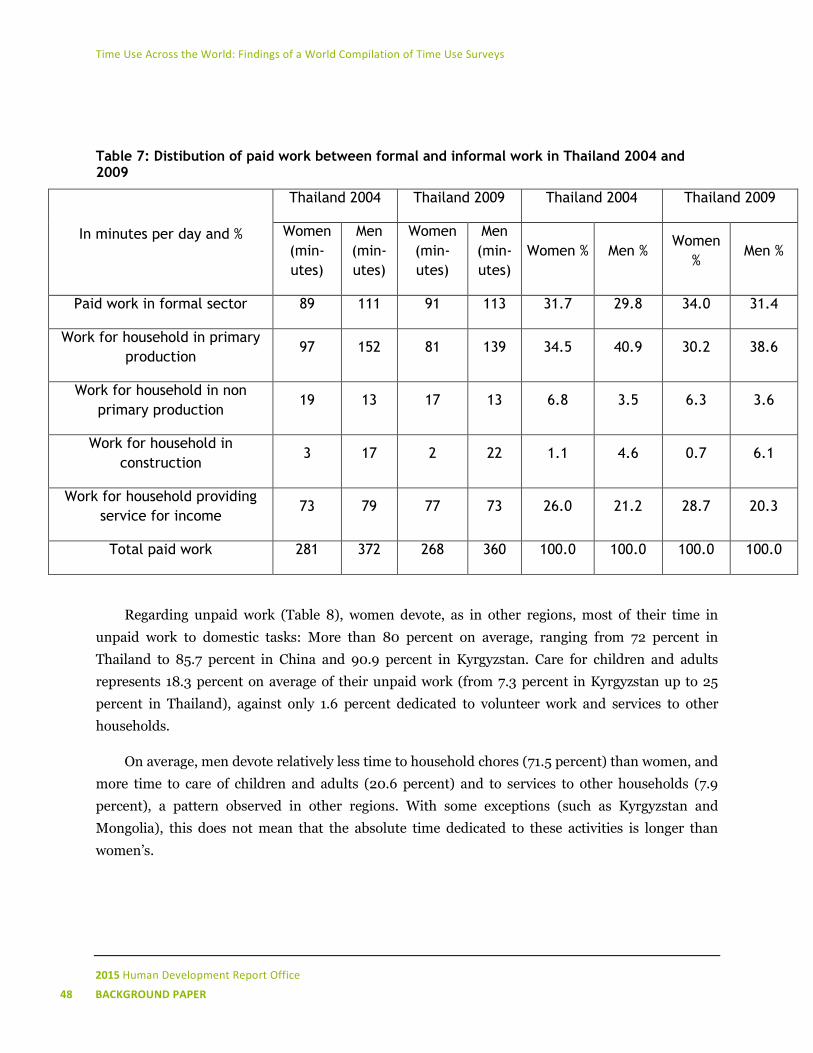
Time Use Across the World: Findings of a World Compilation of Time Use Surveys
2015 Human Development Report Office
48 BACKGROUND PAPER
Table 7: Distibution of paid work between formal and informal work in Thailand 2004 and 2009
In minutes per day and %
Thailand 2004 Thailand 2009 Thailand 2004 Thailand 2009
Women
(min-
utes)
Men
(min-
utes)
Women
(min-
utes)
Men
(min-
utes)
Women % Men % Women
% Men %
Paid work in formal sector 89 111 91 113 31.7 29.8 34.0 31.4
Work for household in primary
production 97 152 81 139 34.5 40.9 30.2 38.6
Work for household in non
primary production 19 13 17 13 6.8 3.5 6.3 3.6
Work for household in
construction 3 17 2 22 1.1 4.6 0.7 6.1
Work for household providing
service for income 73 79 77 73 26.0 21.2 28.7 20.3
Total paid work 281 372 268 360 100.0 100.0 100.0 100.0
Regarding unpaid work (Table 8), women devote, as in other regions, most of their time in
unpaid work to domestic tasks: More than 80 percent on average, ranging from 72 percent in
Thailand to 85.7 percent in China and 90.9 percent in Kyrgyzstan. Care for children and adults
represents 18.3 percent on average of their unpaid work (from 7.3 percent in Kyrgyzstan up to 25
percent in Thailand), against only 1.6 percent dedicated to volunteer work and services to other
households.
On average, men devote relatively less time to household chores (71.5 percent) than women, and
more time to care of children and adults (20.6 percent) and to services to other households (7.9
percent), a pattern observed in other regions. With some exceptions (such as Kyrgyzstan and
Mongolia), this does not mean that the absolute time dedicated to these activities is longer than
women’s.
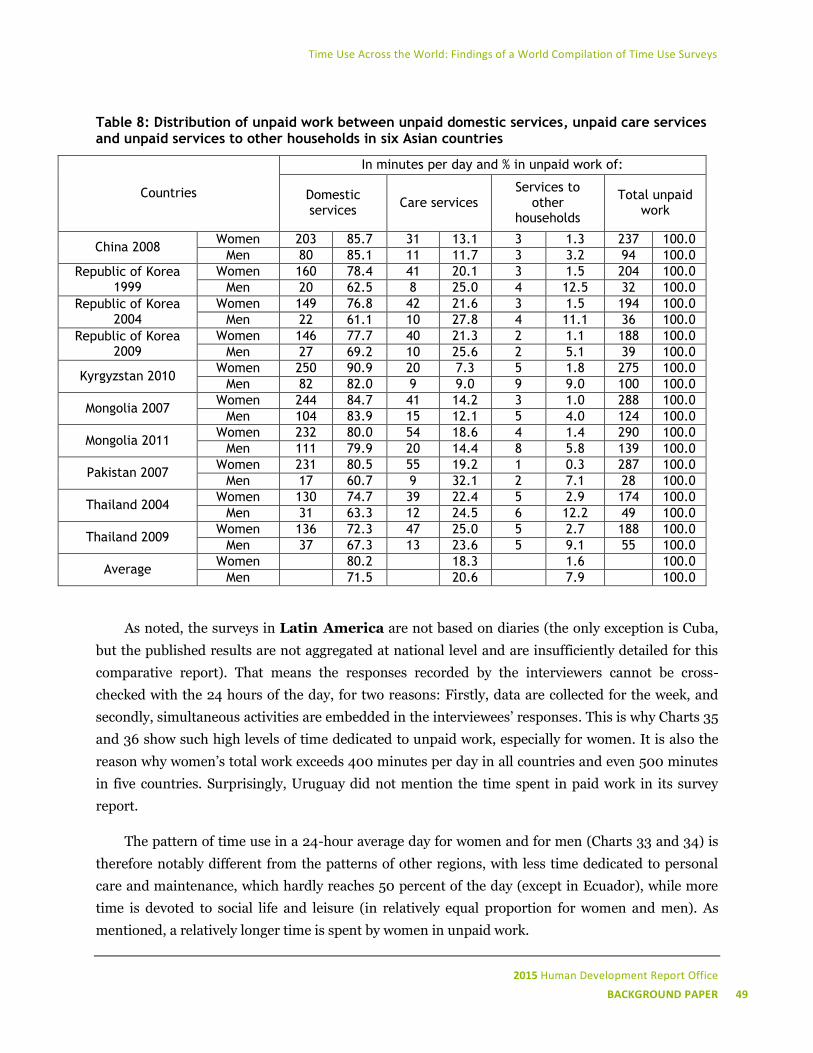
Time Use Across the World: Findings of a World Compilation of Time Use Surveys
2015 Human Development Report Office
BACKGROUND PAPER 49
Table 8: Distribution of unpaid work between unpaid domestic services, unpaid care services and unpaid services to other households in six Asian countries
Countries
In minutes per day and % in unpaid work of:
Domestic services
Care services Services to
other households
Total unpaid work
China 2008 Women 203 85.7 31 13.1 3 1.3 237 100.0
Men 80 85.1 11 11.7 3 3.2 94 100.0
Republic of Korea 1999
Women 160 78.4 41 20.1 3 1.5 204 100.0
Men 20 62.5 8 25.0 4 12.5 32 100.0
Republic of Korea 2004
Women 149 76.8 42 21.6 3 1.5 194 100.0
Men 22 61.1 10 27.8 4 11.1 36 100.0
Republic of Korea 2009
Women 146 77.7 40 21.3 2 1.1 188 100.0
Men 27 69.2 10 25.6 2 5.1 39 100.0
Kyrgyzstan 2010 Women 250 90.9 20 7.3 5 1.8 275 100.0
Men 82 82.0 9 9.0 9 9.0 100 100.0
Mongolia 2007 Women 244 84.7 41 14.2 3 1.0 288 100.0
Men 104 83.9 15 12.1 5 4.0 124 100.0
Mongolia 2011 Women 232 80.0 54 18.6 4 1.4 290 100.0
Men 111 79.9 20 14.4 8 5.8 139 100.0
Pakistan 2007 Women 231 80.5 55 19.2 1 0.3 287 100.0
Men 17 60.7 9 32.1 2 7.1 28 100.0
Thailand 2004 Women 130 74.7 39 22.4 5 2.9 174 100.0
Men 31 63.3 12 24.5 6 12.2 49 100.0
Thailand 2009 Women 136 72.3 47 25.0 5 2.7 188 100.0
Men 37 67.3 13 23.6 5 9.1 55 100.0
Average Women 80.2 18.3 1.6 100.0
Men 71.5 20.6 7.9 100.0
As noted, the surveys in Latin America are not based on diaries (the only exception is Cuba,
but the published results are not aggregated at national level and are insufficiently detailed for this
comparative report). That means the responses recorded by the interviewers cannot be cross-
checked with the 24 hours of the day, for two reasons: Firstly, data are collected for the week, and
secondly, simultaneous activities are embedded in the interviewees’ responses. This is why Charts 35
and 36 show such high levels of time dedicated to unpaid work, especially for women. It is also the
reason why women’s total work exceeds 400 minutes per day in all countries and even 500 minutes
in five countries. Surprisingly, Uruguay did not mention the time spent in paid work in its survey
report.
The pattern of time use in a 24-hour average day for women and for men (Charts 33 and 34) is
therefore notably different from the patterns of other regions, with less time dedicated to personal
care and maintenance, which hardly reaches 50 percent of the day (except in Ecuador), while more
time is devoted to social life and leisure (in relatively equal proportion for women and men). As
mentioned, a relatively longer time is spent by women in unpaid work.
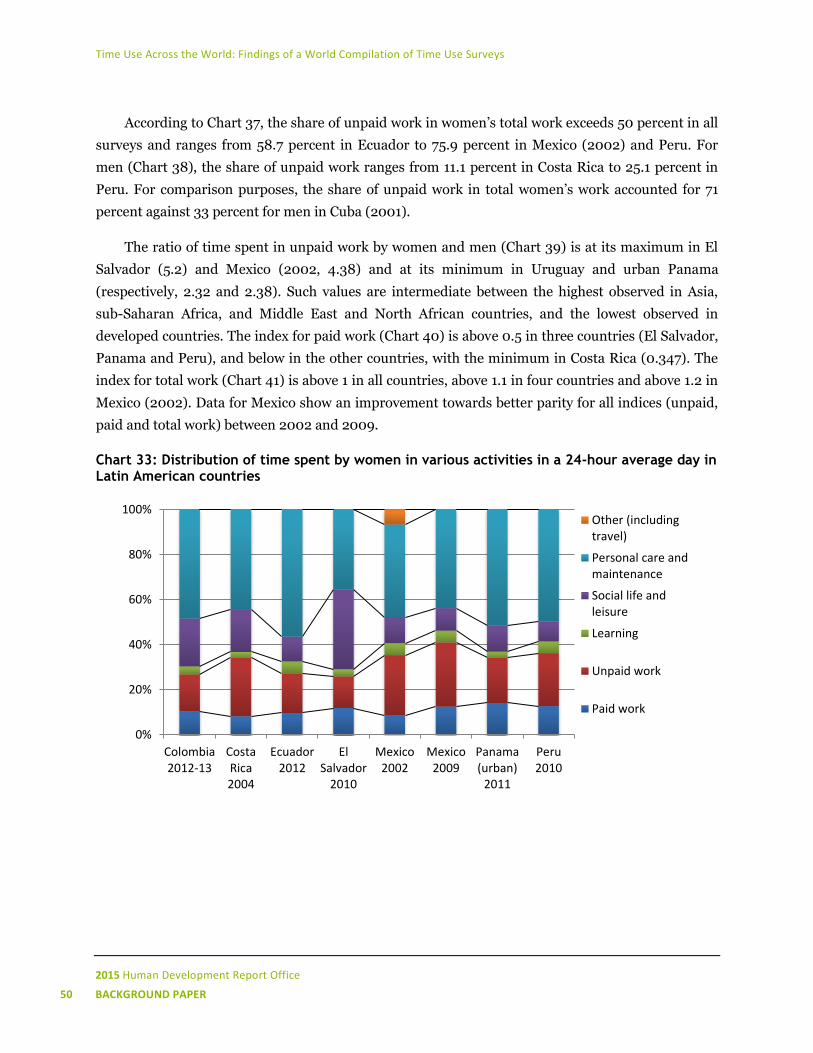
Time Use Across the World: Findings of a World Compilation of Time Use Surveys
2015 Human Development Report Office
50 BACKGROUND PAPER
According to Chart 37, the share of unpaid work in women’s total work exceeds 50 percent in all
surveys and ranges from 58.7 percent in Ecuador to 75.9 percent in Mexico (2002) and Peru. For
men (Chart 38), the share of unpaid work ranges from 11.1 percent in Costa Rica to 25.1 percent in
Peru. For comparison purposes, the share of unpaid work in total women’s work accounted for 71
percent against 33 percent for men in Cuba (2001).
The ratio of time spent in unpaid work by women and men (Chart 39) is at its maximum in El
Salvador (5.2) and Mexico (2002, 4.38) and at its minimum in Uruguay and urban Panama
(respectively, 2.32 and 2.38). Such values are intermediate between the highest observed in Asia,
sub-Saharan Africa, and Middle East and North African countries, and the lowest observed in
developed countries. The index for paid work (Chart 40) is above 0.5 in three countries (El Salvador,
Panama and Peru), and below in the other countries, with the minimum in Costa Rica (0.347). The
index for total work (Chart 41) is above 1 in all countries, above 1.1 in four countries and above 1.2 in
Mexico (2002). Data for Mexico show an improvement towards better parity for all indices (unpaid,
paid and total work) between 2002 and 2009.
Chart 33: Distribution of time spent by women in various activities in a 24-hour average day in Latin American countries
0%
20%
40%
60%
80%
100%
Colombia2012-13
CostaRica2004
Ecuador2012
ElSalvador
2010
Mexico2002
Mexico2009
Panama(urban)
2011
Peru2010
Other (includingtravel)
Personal care andmaintenance
Social life andleisure
Learning
Unpaid work
Paid work
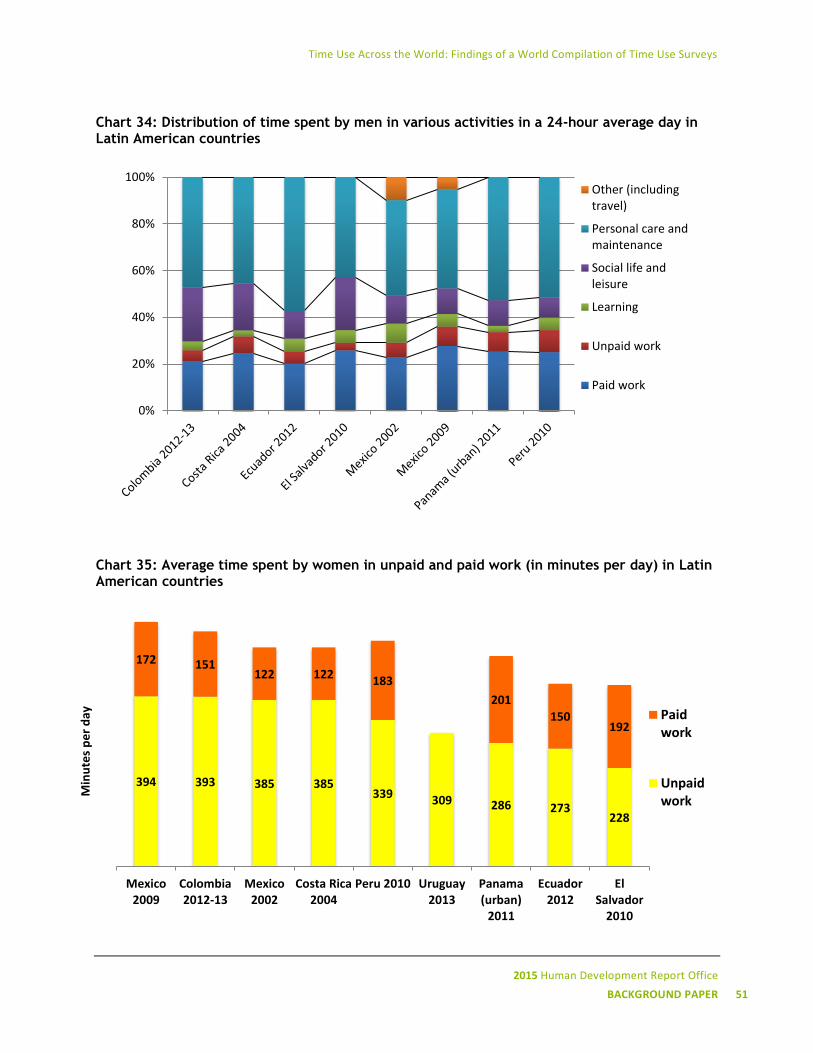
Time Use Across the World: Findings of a World Compilation of Time Use Surveys
2015 Human Development Report Office
BACKGROUND PAPER 51
Chart 34: Distribution of time spent by men in various activities in a 24-hour average day in Latin American countries
Chart 35: Average time spent by women in unpaid and paid work (in minutes per day) in Latin American countries
0%
20%
40%
60%
80%
100%Other (includingtravel)
Personal care andmaintenance
Social life andleisure
Learning
Unpaid work
Paid work
394 393 385 385 339 309 286 273
228
172 151 122 122
183
201
150 192
Mexico2009
Colombia2012-13
Mexico2002
Costa Rica2004
Peru 2010 Uruguay2013
Panama(urban)
2011
Ecuador2012
ElSalvador
2010
Min
ute
s p
er
day
Paidwork
Unpaidwork
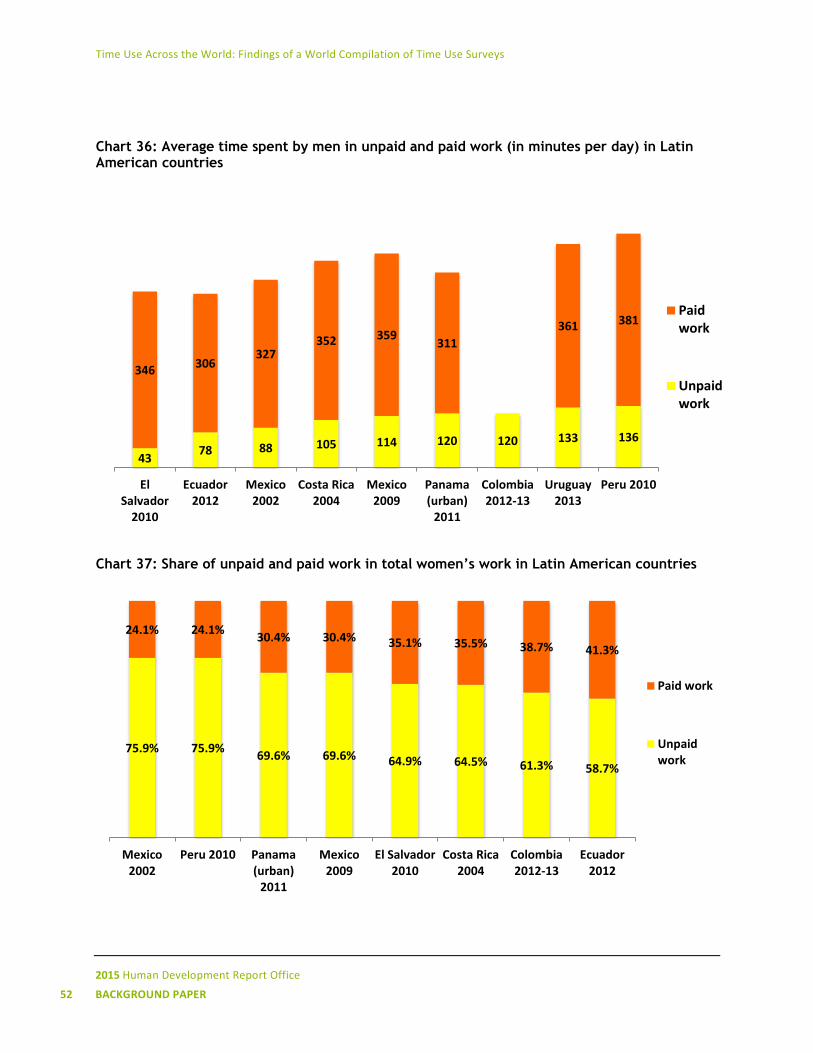
Time Use Across the World: Findings of a World Compilation of Time Use Surveys
2015 Human Development Report Office
52 BACKGROUND PAPER
Chart 36: Average time spent by men in unpaid and paid work (in minutes per day) in Latin American countries
Chart 37: Share of unpaid and paid work in total women’s work in Latin American countries
43 78 88 105 114 120 120 133 136
346 306
327 352 359
311
361 381
ElSalvador
2010
Ecuador2012
Mexico2002
Costa Rica2004
Mexico2009
Panama(urban)
2011
Colombia2012-13
Uruguay2013
Peru 2010
Paidwork
Unpaidwork
75.9% 75.9% 69.6% 69.6% 64.9% 64.5% 61.3% 58.7%
24.1% 24.1% 30.4% 30.4% 35.1% 35.5% 38.7% 41.3%
Mexico2002
Peru 2010 Panama(urban)
2011
Mexico2009
El Salvador2010
Costa Rica2004
Colombia2012-13
Ecuador2012
Paid work
Unpaidwork
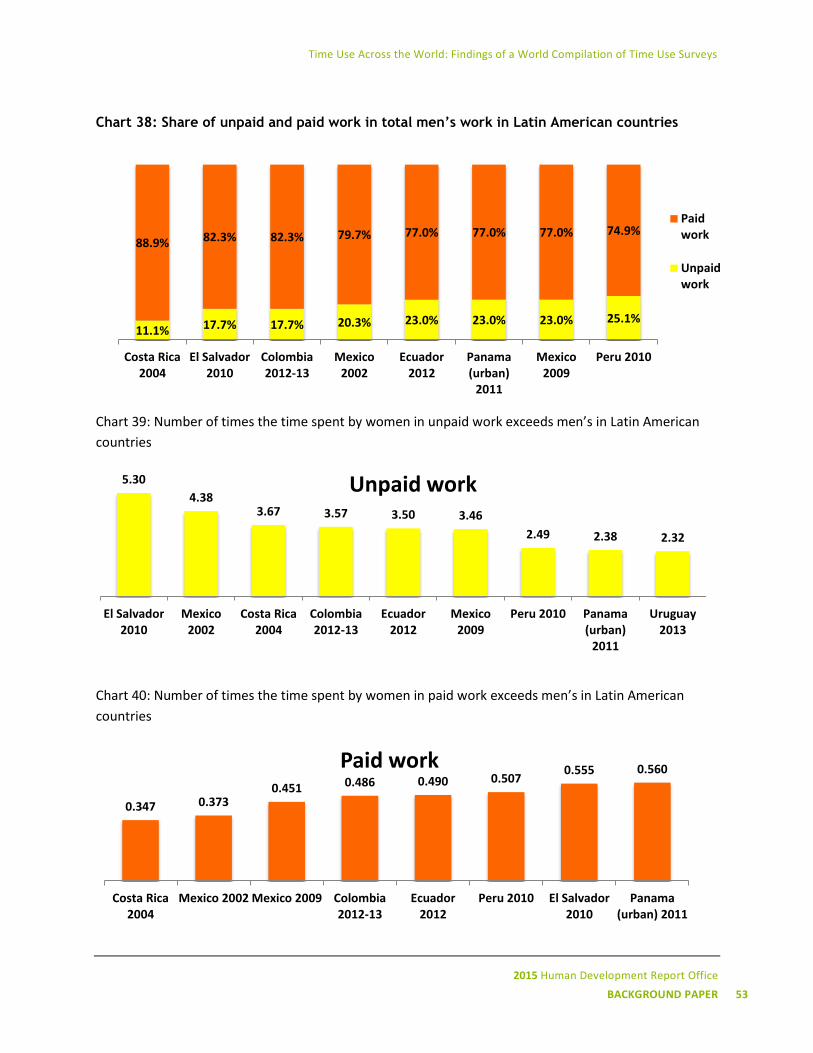
Time Use Across the World: Findings of a World Compilation of Time Use Surveys
2015 Human Development Report Office
BACKGROUND PAPER 53
Chart 38: Share of unpaid and paid work in total men’s work in Latin American countries
Chart 39: Number of times the time spent by women in unpaid work exceeds men’s in Latin American
countries
Chart 40: Number of times the time spent by women in paid work exceeds men’s in Latin American
countries
11.1% 17.7% 17.7% 20.3% 23.0% 23.0% 23.0% 25.1%
88.9% 82.3% 82.3% 79.7% 77.0% 77.0% 77.0% 74.9%
Costa Rica2004
El Salvador2010
Colombia2012-13
Mexico2002
Ecuador2012
Panama(urban)
2011
Mexico2009
Peru 2010
Paidwork
Unpaidwork
5.30
4.38 3.67 3.57 3.50 3.46
2.49 2.38 2.32
El Salvador2010
Mexico2002
Costa Rica2004
Colombia2012-13
Ecuador2012
Mexico2009
Peru 2010 Panama(urban)
2011
Uruguay2013
Unpaid work
0.347 0.373 0.451 0.486 0.490 0.507
0.555 0.560
Costa Rica2004
Mexico 2002 Mexico 2009 Colombia2012-13
Ecuador2012
Peru 2010 El Salvador2010
Panama(urban) 2011
Paid work
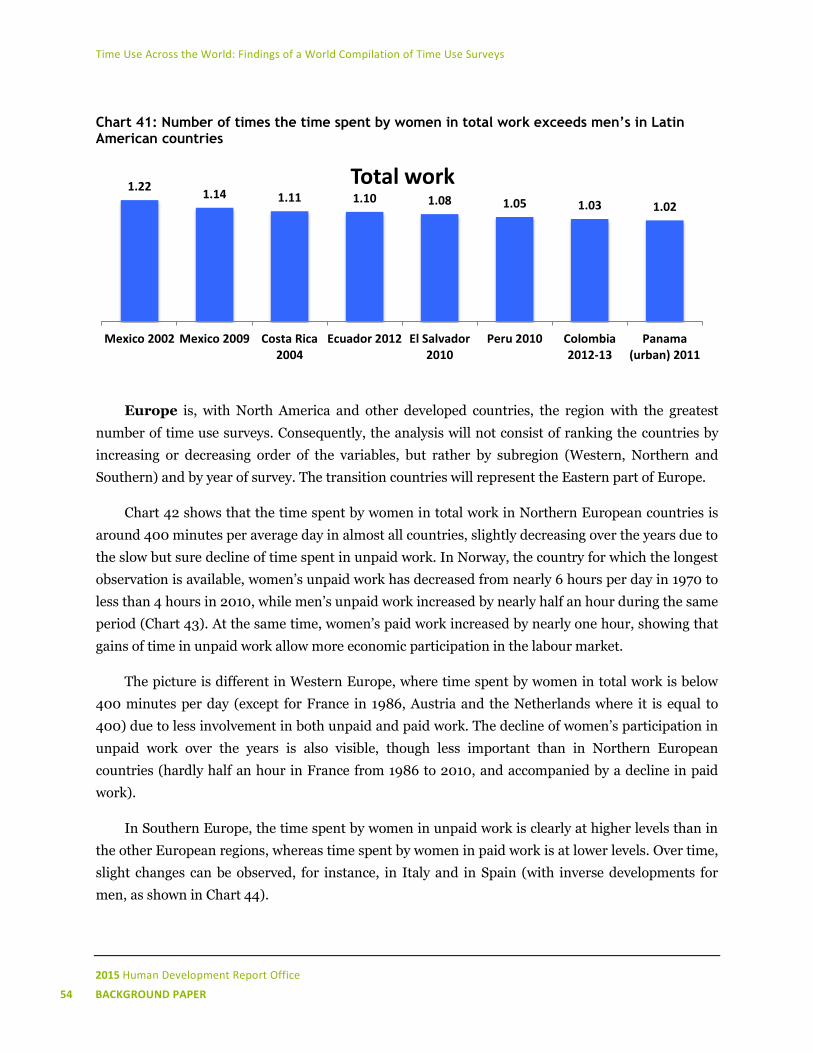
Time Use Across the World: Findings of a World Compilation of Time Use Surveys
2015 Human Development Report Office
54 BACKGROUND PAPER
Chart 41: Number of times the time spent by women in total work exceeds men’s in Latin American countries
Europe is, with North America and other developed countries, the region with the greatest
number of time use surveys. Consequently, the analysis will not consist of ranking the countries by
increasing or decreasing order of the variables, but rather by subregion (Western, Northern and
Southern) and by year of survey. The transition countries will represent the Eastern part of Europe.
Chart 42 shows that the time spent by women in total work in Northern European countries is
around 400 minutes per average day in almost all countries, slightly decreasing over the years due to
the slow but sure decline of time spent in unpaid work. In Norway, the country for which the longest
observation is available, women’s unpaid work has decreased from nearly 6 hours per day in 1970 to
less than 4 hours in 2010, while men’s unpaid work increased by nearly half an hour during the same
period (Chart 43). At the same time, women’s paid work increased by nearly one hour, showing that
gains of time in unpaid work allow more economic participation in the labour market.
The picture is different in Western Europe, where time spent by women in total work is below
400 minutes per day (except for France in 1986, Austria and the Netherlands where it is equal to
400) due to less involvement in both unpaid and paid work. The decline of women’s participation in
unpaid work over the years is also visible, though less important than in Northern European
countries (hardly half an hour in France from 1986 to 2010, and accompanied by a decline in paid
work).
In Southern Europe, the time spent by women in unpaid work is clearly at higher levels than in
the other European regions, whereas time spent by women in paid work is at lower levels. Over time,
slight changes can be observed, for instance, in Italy and in Spain (with inverse developments for
men, as shown in Chart 44).
1.22 1.14 1.11 1.10 1.08 1.05 1.03 1.02
Mexico 2002 Mexico 2009 Costa Rica2004
Ecuador 2012 El Salvador2010
Peru 2010 Colombia2012-13
Panama(urban) 2011
Total work
Time Use Across the World: Findings of a World Compilation of Time Use Surveys
2015 Human Development Report Office
BACKGROUND PAPER 55
In Western Europe (except in Austria and Netherlands) and moreover in Southern Europe,
men’s total work is most often lower than 350 minutes per day and even as low as 250 minutes per
day (Greece).
For the most recent period, the share of women’s unpaid work in total work (Chart 45) is around
60 percent in Northern Europe, against 65 percent in Western Europe and 70 percent in Southern
Europe, whereas men’s (Chart 46) is above 40 percent in Northern Europe and in Western Europe
(except in the Netherlands), and below 40 percent in Southern Europe.
The ratio of time spent in unpaid work by women and men (Chart 47), which was commonly
above 2 in the early 1970s and 1980s, has steadily decreased since then, and is currently and almost
everywhere below 2 in Western and Northern Europe, diminishing from 2.42 to 1.58 in France
between 1986 and 2010, from 1.88 to 1.52 in Finland between 1979 and 2009, and from 2.67 to 1.28
in Norway between 1970 and 2010. It is only in Southern Europe that the indicator remains above 2
and more, although it is diminishing in Spain, from 2.77 to 2.09 between 2003 and 2010, for
example. It increased in Italy from 2.75 to 2.95 between 2003 and 2009, after a dramatic decrease
from 4.49 to 2.75 between 1989 and 2003.
The ratio of time spent in paid work by women and men (Chart 48) is above 0.5 in all regions of
Europe, having increased from 0.354 to 0.723 in Norway, for example, between 1970 and 2010. It
remains under 0.5 only in Italy (2009).
Finally, the ratio of time spent in total work by women and men (Chart 49) remains above 1 in
all countries of Europe except the Netherlands (0.97), but below 1.1 in Western and Northern
Europe, and above 1.1 and more in Southern Europe (the maximum is in Greece, with 1.37). Only
three countries are below 1 in the recent period: the Netherlands, Norway and Denmark
(respectively, 0.97, 0.97 and 0.98), meaning that in these countries women do not work more than
men, which is the case in all other countries of the world (except New Zealand).
Charts 50 and 51 show the time use patterns for women and men.
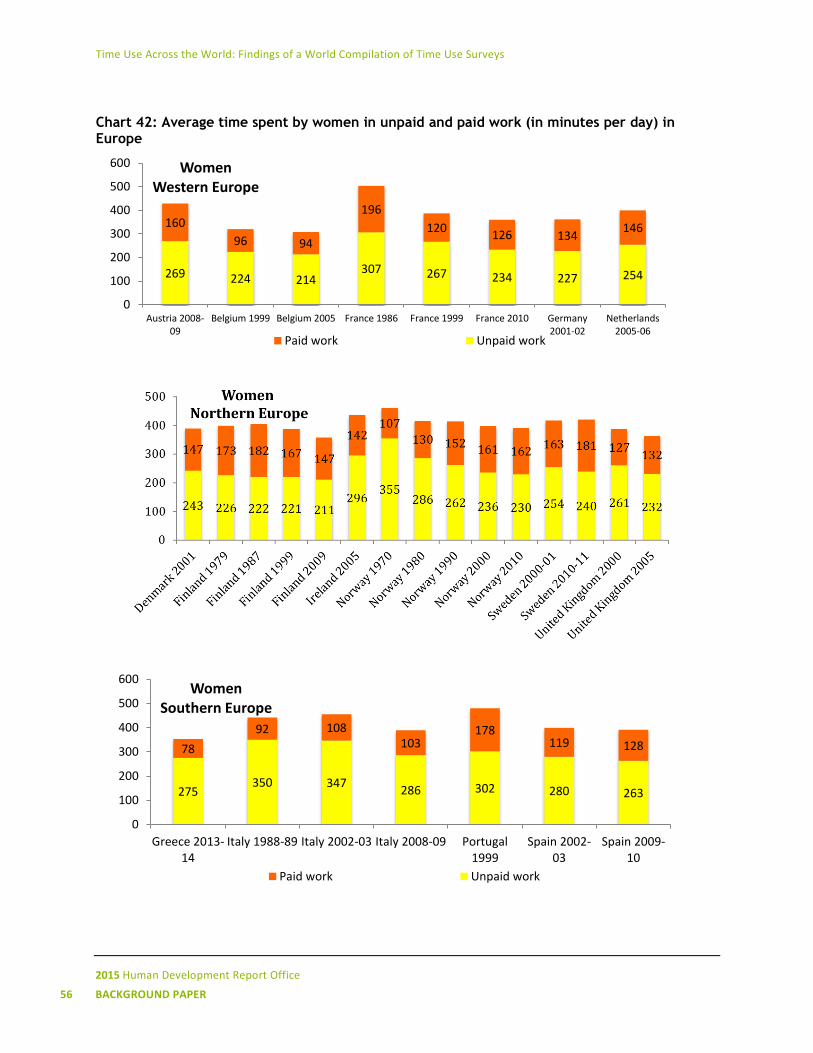
Time Use Across the World: Findings of a World Compilation of Time Use Surveys
2015 Human Development Report Office
56 BACKGROUND PAPER
Chart 42: Average time spent by women in unpaid and paid work (in minutes per day) in Europe
269 224 214 307 267 234 227 254
160
96 94
196
120 126 134
146
0
100
200
300
400
500
600
Austria 2008-09
Belgium 1999 Belgium 2005 France 1986 France 1999 France 2010 Germany2001-02
Netherlands2005-06
Women Western Europe
Paid work Unpaid work
275 350 347
286 302 280 263
78
92 108 103
178 119 128
0
100
200
300
400
500
600
Greece 2013-14
Italy 1988-89 Italy 2002-03 Italy 2008-09 Portugal1999
Spain 2002-03
Spain 2009-10
Women Southern Europe
Paid work Unpaid work
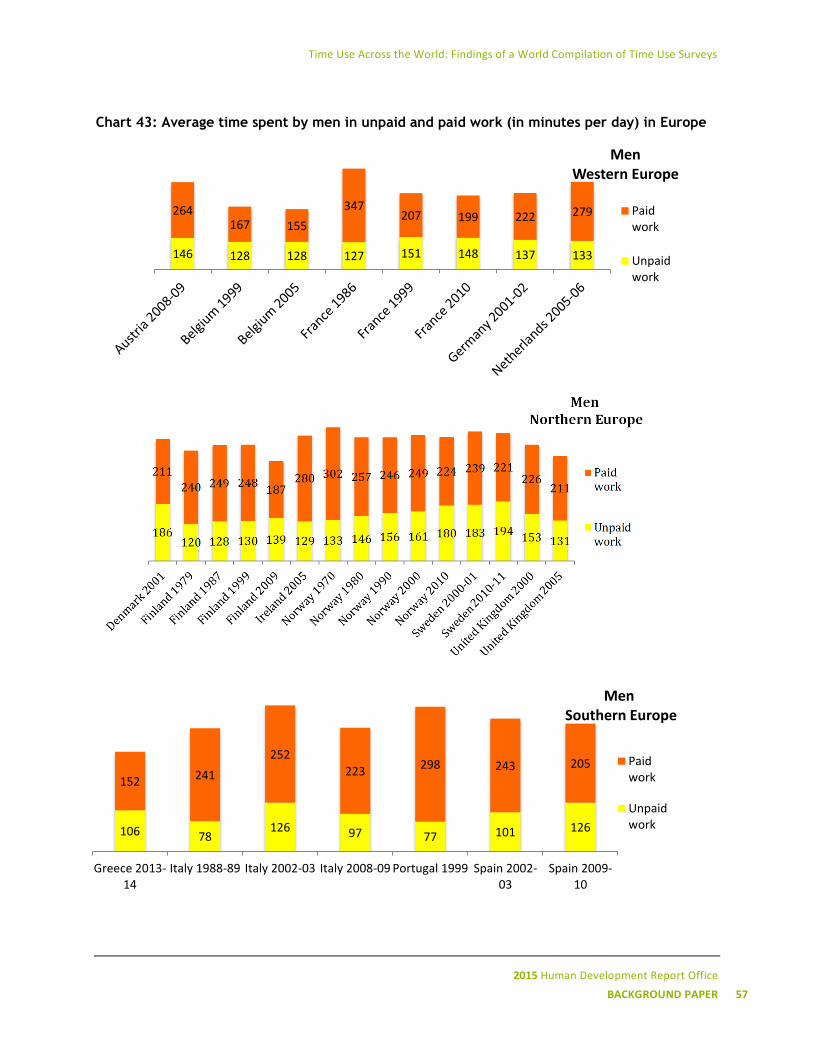
Time Use Across the World: Findings of a World Compilation of Time Use Surveys
2015 Human Development Report Office
BACKGROUND PAPER 57
Chart 43: Average time spent by men in unpaid and paid work (in minutes per day) in Europe
146 128 128 127 151 148 137 133
264 167 155
347 207 199 222 279
Men Western Europe
Paidwork
Unpaidwork
106 78 126 97 77 101 126
152 241
252
223 298 243 205
Greece 2013-14
Italy 1988-89 Italy 2002-03 Italy 2008-09 Portugal 1999 Spain 2002-03
Spain 2009-10
Men Southern Europe
Paidwork
Unpaidwork
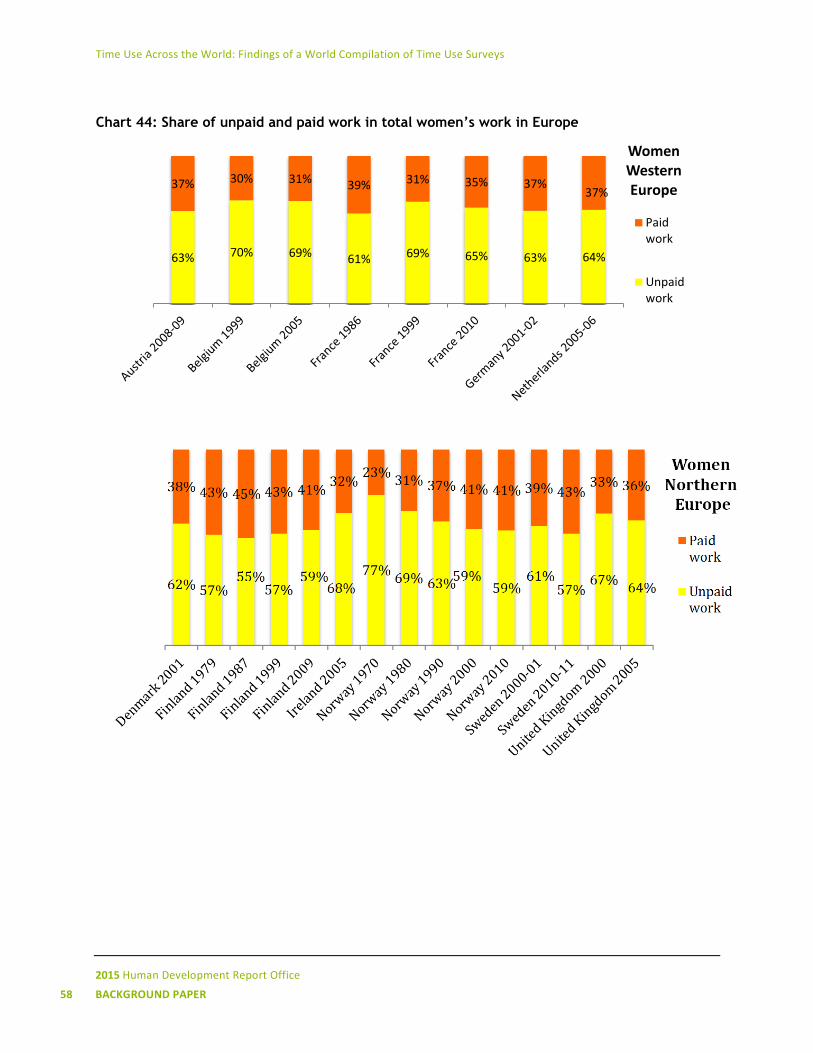
Time Use Across the World: Findings of a World Compilation of Time Use Surveys
2015 Human Development Report Office
58 BACKGROUND PAPER
Chart 44: Share of unpaid and paid work in total women’s work in Europe
63% 70% 69% 61% 69% 65% 63% 64%
37% 30% 31% 39% 31% 35% 37% 37%
Women Western Europe
Paidwork
Unpaidwork
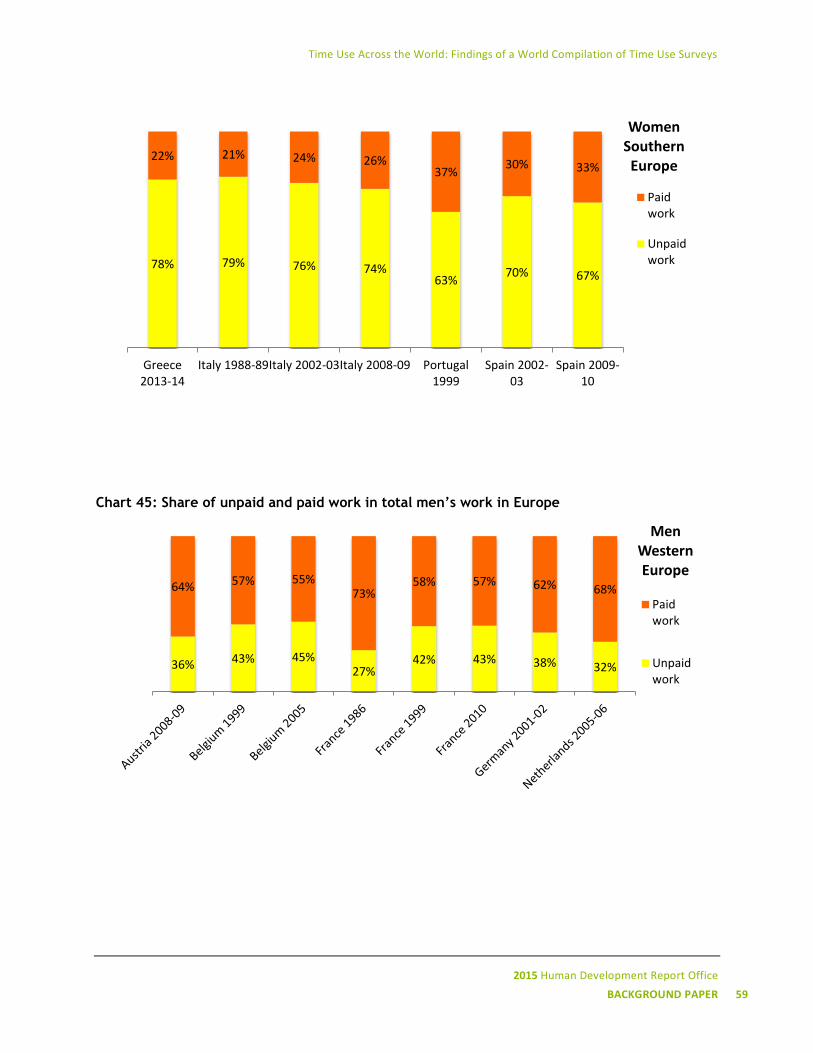
Time Use Across the World: Findings of a World Compilation of Time Use Surveys
2015 Human Development Report Office
BACKGROUND PAPER 59
Chart 45: Share of unpaid and paid work in total men’s work in Europe
78% 79% 76% 74% 63%
70% 67%
22% 21% 24% 26% 37%
30% 33%
Greece2013-14
Italy 1988-89Italy 2002-03Italy 2008-09 Portugal1999
Spain 2002-03
Spain 2009-10
Women Southern Europe
Paidwork
Unpaidwork
36% 43% 45% 27%
42% 43% 38% 32%
64% 57% 55% 73%
58% 57% 62% 68%
Men Western Europe
Paidwork
Unpaidwork
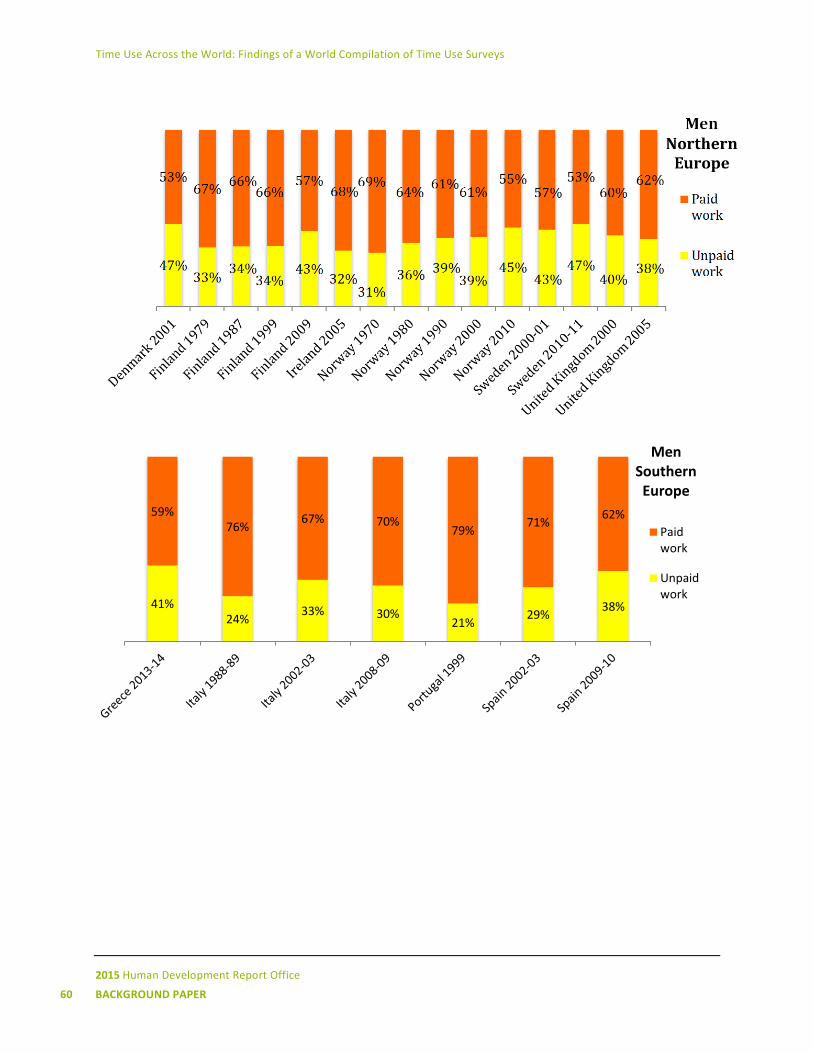
Time Use Across the World: Findings of a World Compilation of Time Use Surveys
2015 Human Development Report Office
60 BACKGROUND PAPER
41% 24%
33% 30% 21%
29% 38%
59% 76%
67% 70% 79%
71% 62%
Men Southern Europe
Paidwork
Unpaidwork
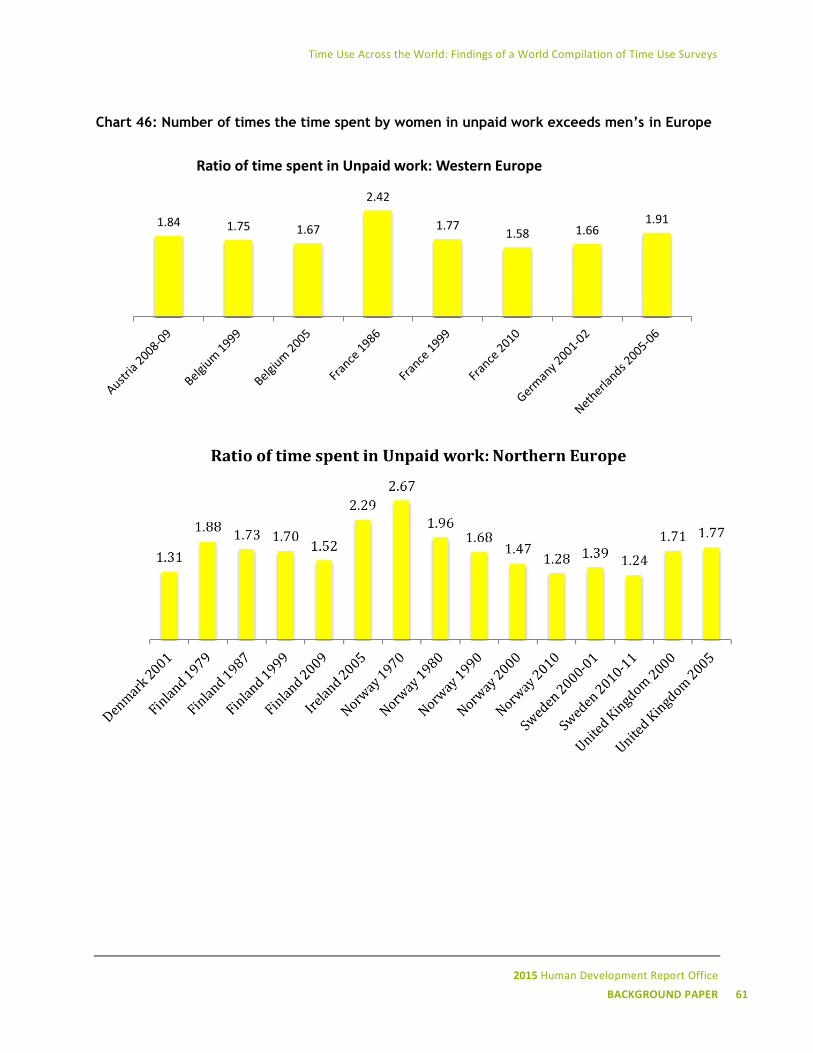
Time Use Across the World: Findings of a World Compilation of Time Use Surveys
2015 Human Development Report Office
BACKGROUND PAPER 61
Chart 46: Number of times the time spent by women in unpaid work exceeds men’s in Europe
1.84 1.75 1.67
2.42
1.77 1.58 1.66
1.91
Ratio of time spent in Unpaid work: Western Europe
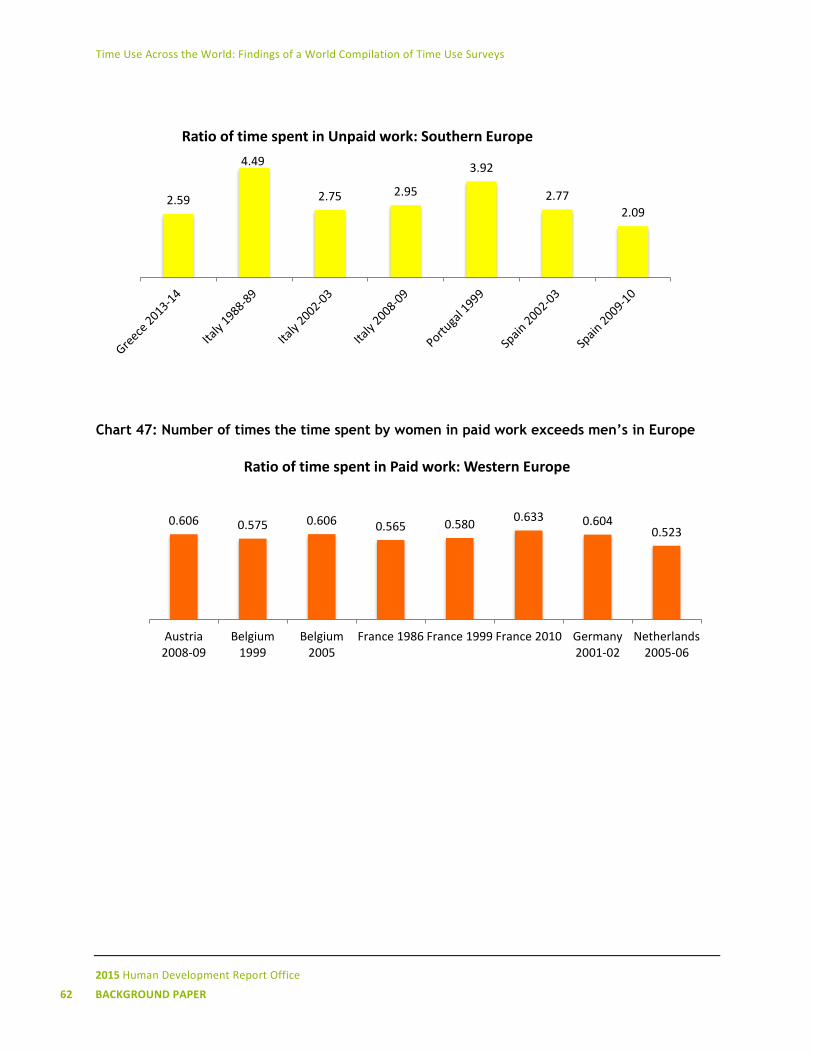
Time Use Across the World: Findings of a World Compilation of Time Use Surveys
2015 Human Development Report Office
62 BACKGROUND PAPER
Chart 47: Number of times the time spent by women in paid work exceeds men’s in Europe
2.59
4.49
2.75 2.95
3.92
2.77
2.09
Ratio of time spent in Unpaid work: Southern Europe
0.606 0.575 0.606 0.565 0.580 0.633 0.604
0.523
Austria2008-09
Belgium1999
Belgium2005
France 1986 France 1999 France 2010 Germany2001-02
Netherlands2005-06
Ratio of time spent in Paid work: Western Europe
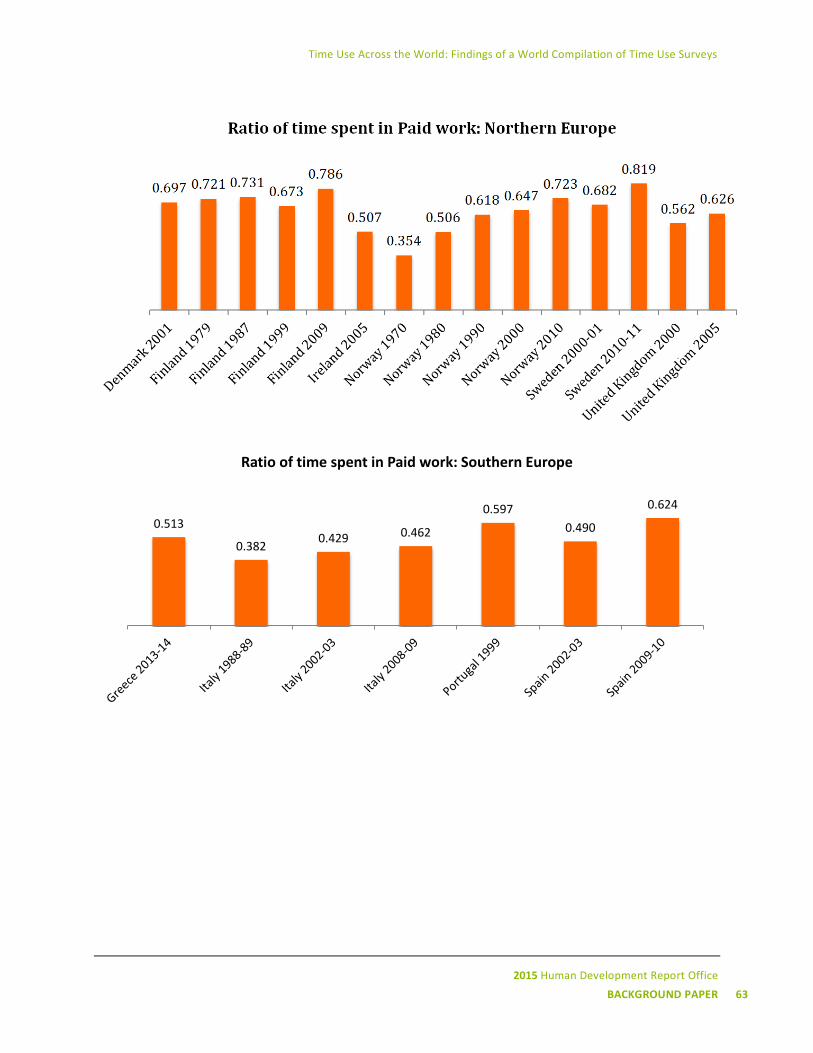
Time Use Across the World: Findings of a World Compilation of Time Use Surveys
2015 Human Development Report Office
BACKGROUND PAPER 63
0.513
0.382 0.429 0.462
0.597
0.490
0.624
Ratio of time spent in Paid work: Southern Europe
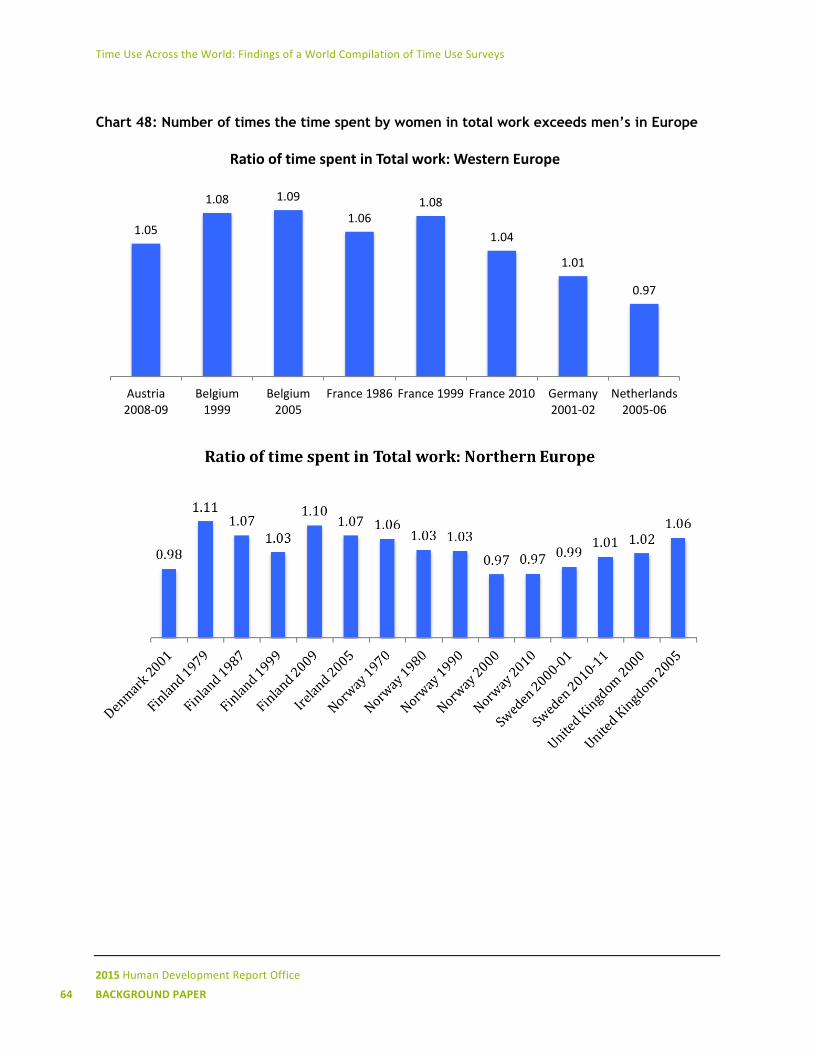
Time Use Across the World: Findings of a World Compilation of Time Use Surveys
2015 Human Development Report Office
64 BACKGROUND PAPER
Chart 48: Number of times the time spent by women in total work exceeds men’s in Europe
1.05
1.08 1.09
1.06 1.08
1.04
1.01
0.97
Austria2008-09
Belgium1999
Belgium2005
France 1986 France 1999 France 2010 Germany2001-02
Netherlands2005-06
Ratio of time spent in Total work: Western Europe
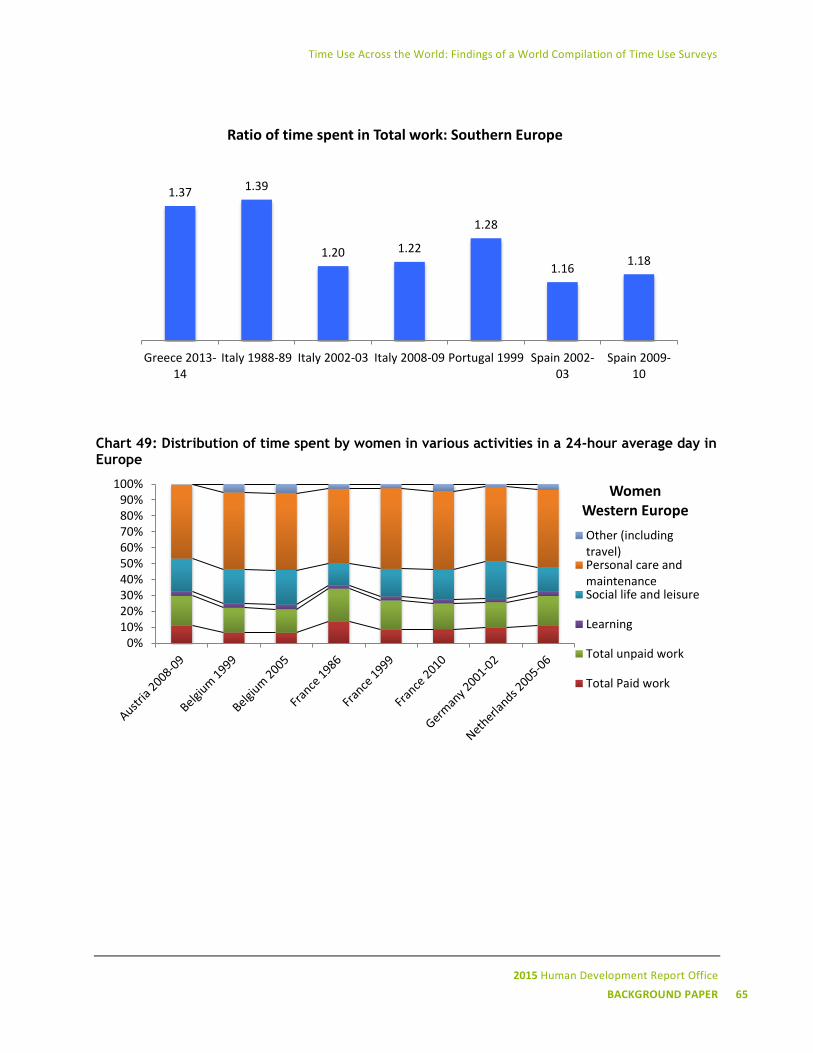
Time Use Across the World: Findings of a World Compilation of Time Use Surveys
2015 Human Development Report Office
BACKGROUND PAPER 65
Chart 49: Distribution of time spent by women in various activities in a 24-hour average day in Europe
1.37 1.39
1.20 1.22
1.28
1.16 1.18
Greece 2013-14
Italy 1988-89 Italy 2002-03 Italy 2008-09 Portugal 1999 Spain 2002-03
Spain 2009-10
Ratio of time spent in Total work: Southern Europe
0%10%20%30%40%50%60%70%80%90%
100% Women Western Europe
Other (includingtravel)Personal care andmaintenanceSocial life and leisure
Learning
Total unpaid work
Total Paid work
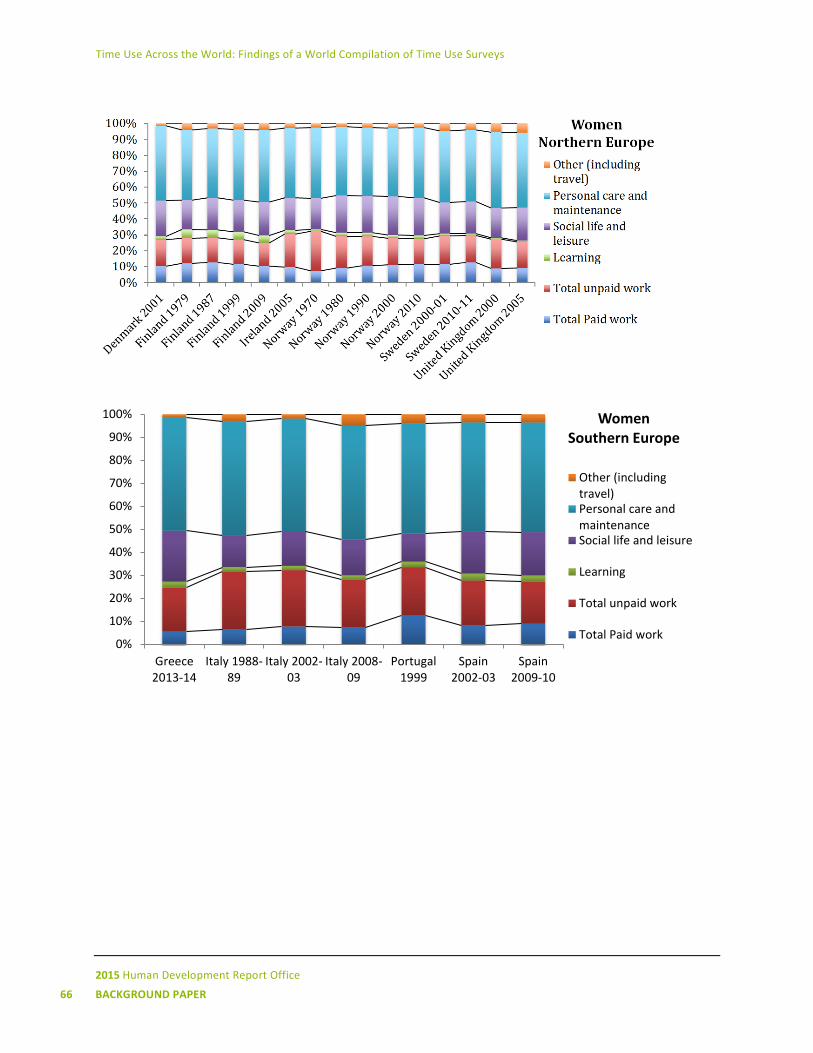
Time Use Across the World: Findings of a World Compilation of Time Use Surveys
2015 Human Development Report Office
66 BACKGROUND PAPER
0%
10%
20%
30%
40%
50%
60%
70%
80%
90%
100%
Greece2013-14
Italy 1988-89
Italy 2002-03
Italy 2008-09
Portugal1999
Spain2002-03
Spain2009-10
Women Southern Europe
Other (includingtravel)Personal care andmaintenanceSocial life and leisure
Learning
Total unpaid work
Total Paid work
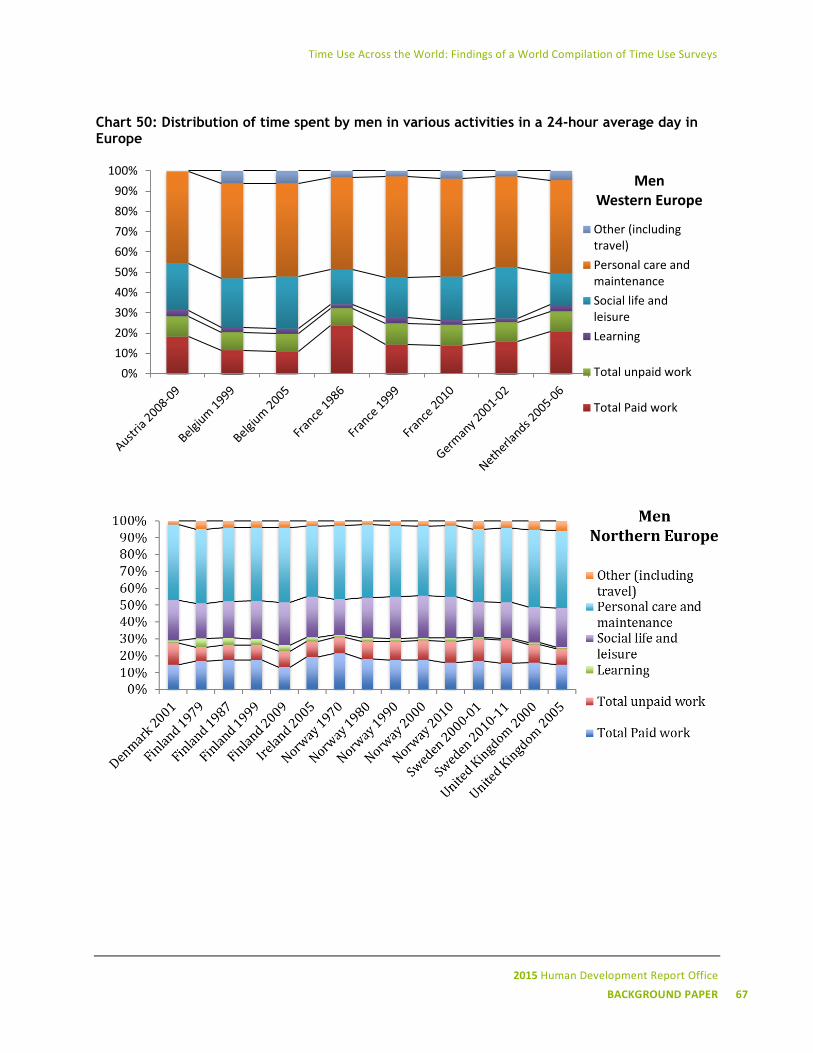
Time Use Across the World: Findings of a World Compilation of Time Use Surveys
2015 Human Development Report Office
BACKGROUND PAPER 67
Chart 50: Distribution of time spent by men in various activities in a 24-hour average day in Europe
0%
10%
20%
30%
40%
50%
60%
70%
80%
90%
100%Men
Western Europe
Other (includingtravel)
Personal care andmaintenance
Social life andleisure
Learning
Total unpaid work
Total Paid work
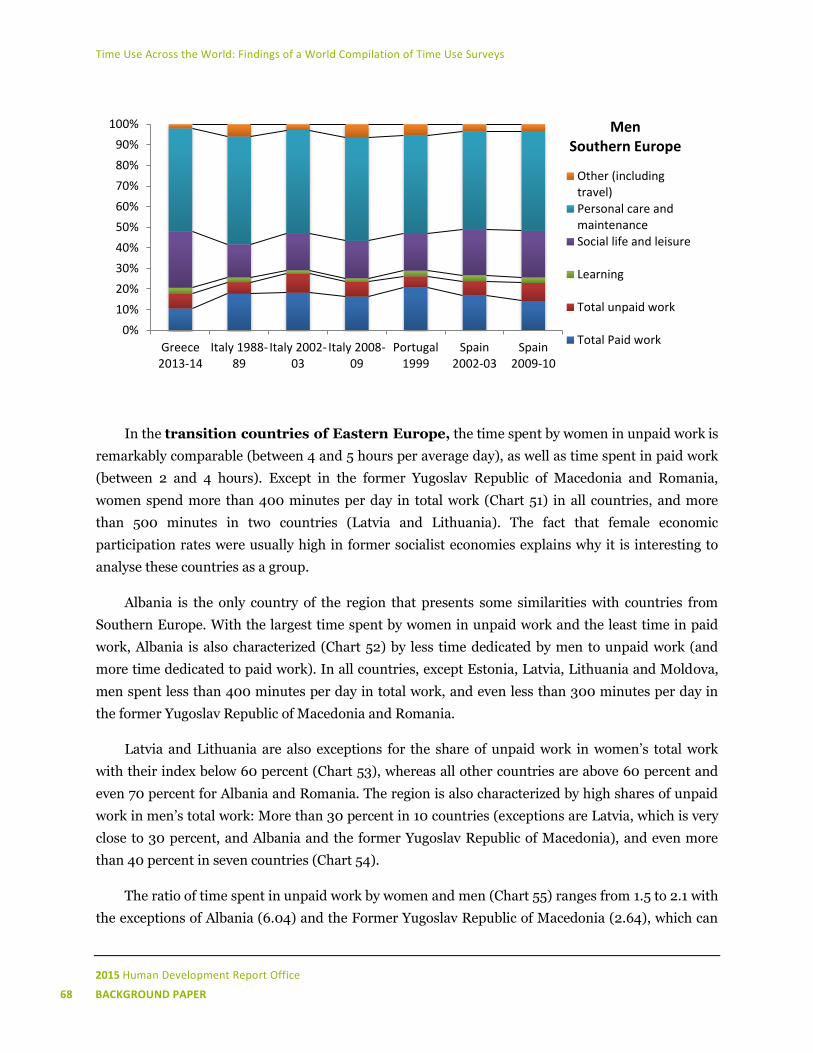
Time Use Across the World: Findings of a World Compilation of Time Use Surveys
2015 Human Development Report Office
68 BACKGROUND PAPER
In the transition countries of Eastern Europe, the time spent by women in unpaid work is
remarkably comparable (between 4 and 5 hours per average day), as well as time spent in paid work
(between 2 and 4 hours). Except in the former Yugoslav Republic of Macedonia and Romania,
women spend more than 400 minutes per day in total work (Chart 51) in all countries, and more
than 500 minutes in two countries (Latvia and Lithuania). The fact that female economic
participation rates were usually high in former socialist economies explains why it is interesting to
analyse these countries as a group.
Albania is the only country of the region that presents some similarities with countries from
Southern Europe. With the largest time spent by women in unpaid work and the least time in paid
work, Albania is also characterized (Chart 52) by less time dedicated by men to unpaid work (and
more time dedicated to paid work). In all countries, except Estonia, Latvia, Lithuania and Moldova,
men spent less than 400 minutes per day in total work, and even less than 300 minutes per day in
the former Yugoslav Republic of Macedonia and Romania.
Latvia and Lithuania are also exceptions for the share of unpaid work in women’s total work
with their index below 60 percent (Chart 53), whereas all other countries are above 60 percent and
even 70 percent for Albania and Romania. The region is also characterized by high shares of unpaid
work in men’s total work: More than 30 percent in 10 countries (exceptions are Latvia, which is very
close to 30 percent, and Albania and the former Yugoslav Republic of Macedonia), and even more
than 40 percent in seven countries (Chart 54).
The ratio of time spent in unpaid work by women and men (Chart 55) ranges from 1.5 to 2.1 with
the exceptions of Albania (6.04) and the Former Yugoslav Republic of Macedonia (2.64), which can
0%
10%
20%
30%
40%
50%
60%
70%
80%
90%
100%
Greece2013-14
Italy 1988-89
Italy 2002-03
Italy 2008-09
Portugal1999
Spain2002-03
Spain2009-10
Men Southern Europe
Other (includingtravel)Personal care andmaintenanceSocial life and leisure
Learning
Total unpaid work
Total Paid work
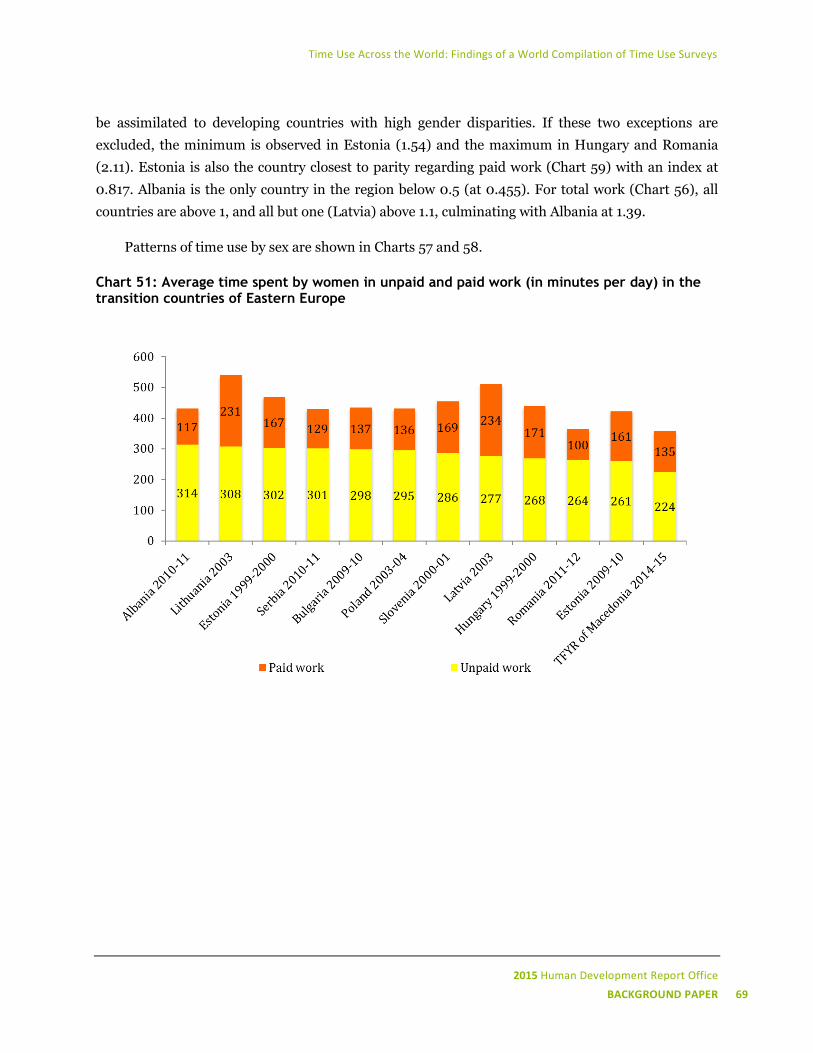
Time Use Across the World: Findings of a World Compilation of Time Use Surveys
2015 Human Development Report Office
BACKGROUND PAPER 69
be assimilated to developing countries with high gender disparities. If these two exceptions are
excluded, the minimum is observed in Estonia (1.54) and the maximum in Hungary and Romania
(2.11). Estonia is also the country closest to parity regarding paid work (Chart 59) with an index at
0.817. Albania is the only country in the region below 0.5 (at 0.455). For total work (Chart 56), all
countries are above 1, and all but one (Latvia) above 1.1, culminating with Albania at 1.39.
Patterns of time use by sex are shown in Charts 57 and 58.
Chart 51: Average time spent by women in unpaid and paid work (in minutes per day) in the transition countries of Eastern Europe
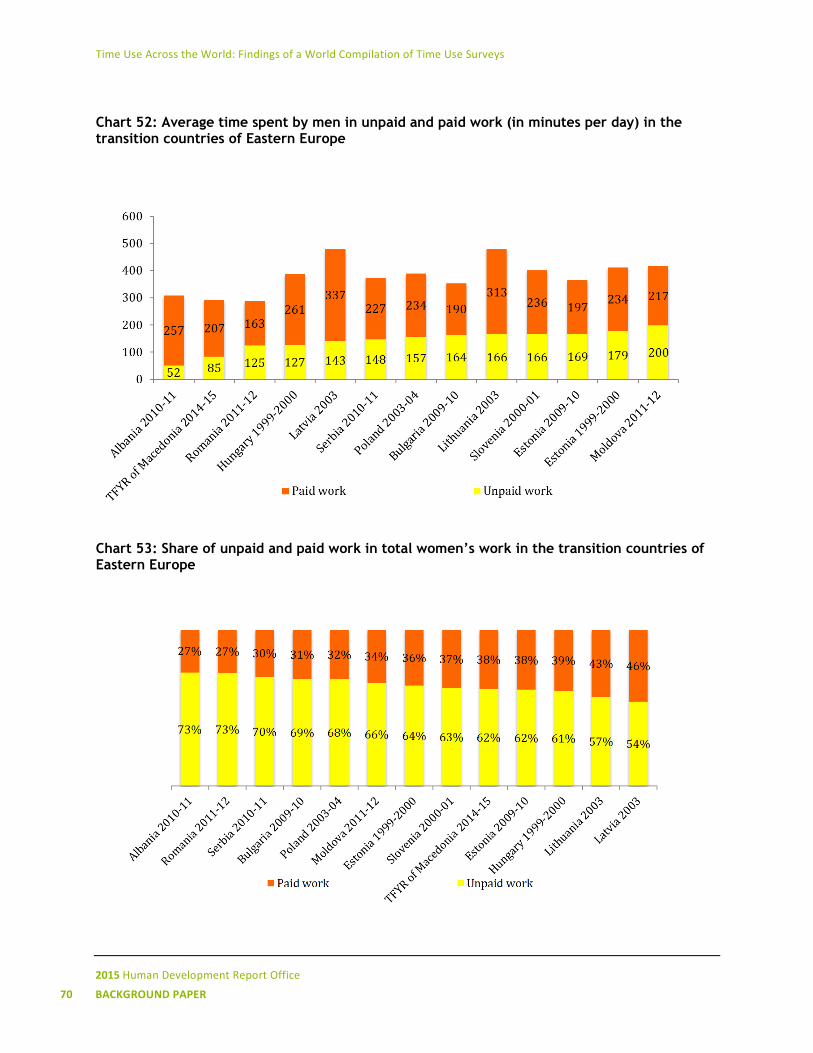
Time Use Across the World: Findings of a World Compilation of Time Use Surveys
2015 Human Development Report Office
70 BACKGROUND PAPER
Chart 52: Average time spent by men in unpaid and paid work (in minutes per day) in the transition countries of Eastern Europe
Chart 53: Share of unpaid and paid work in total women’s work in the transition countries of Eastern Europe
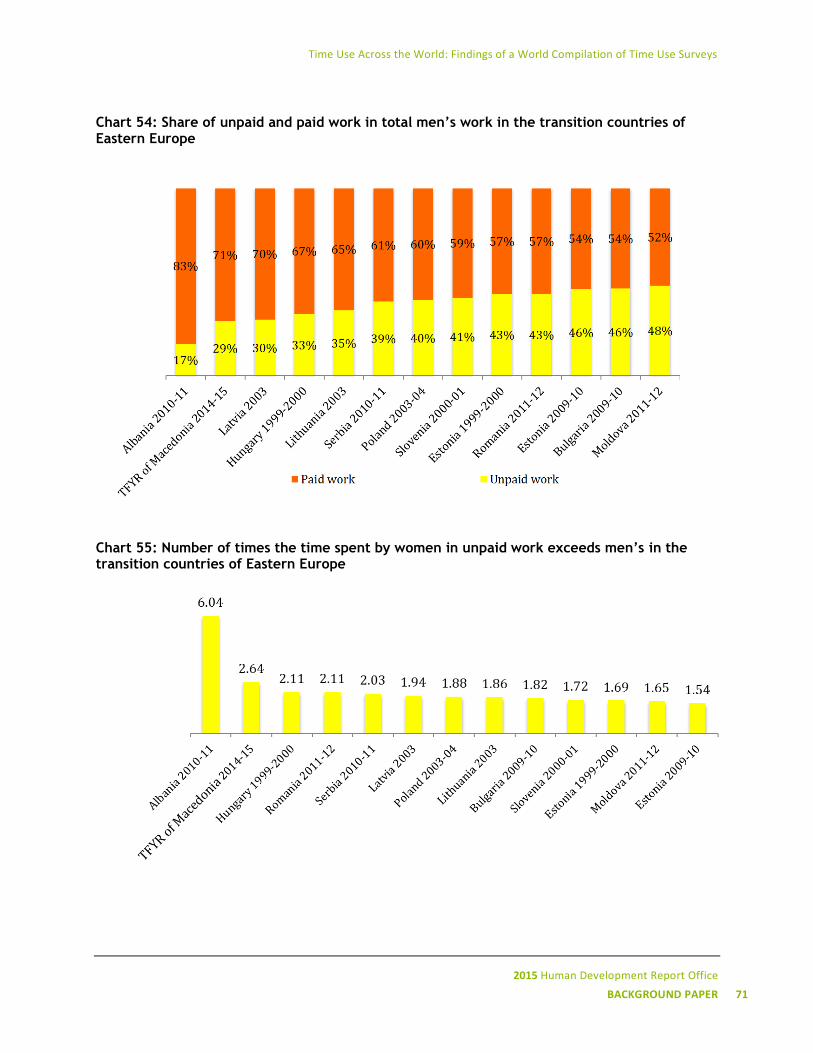
Time Use Across the World: Findings of a World Compilation of Time Use Surveys
2015 Human Development Report Office
BACKGROUND PAPER 71
Chart 54: Share of unpaid and paid work in total men’s work in the transition countries of Eastern Europe
Chart 55: Number of times the time spent by women in unpaid work exceeds men’s in the transition countries of Eastern Europe
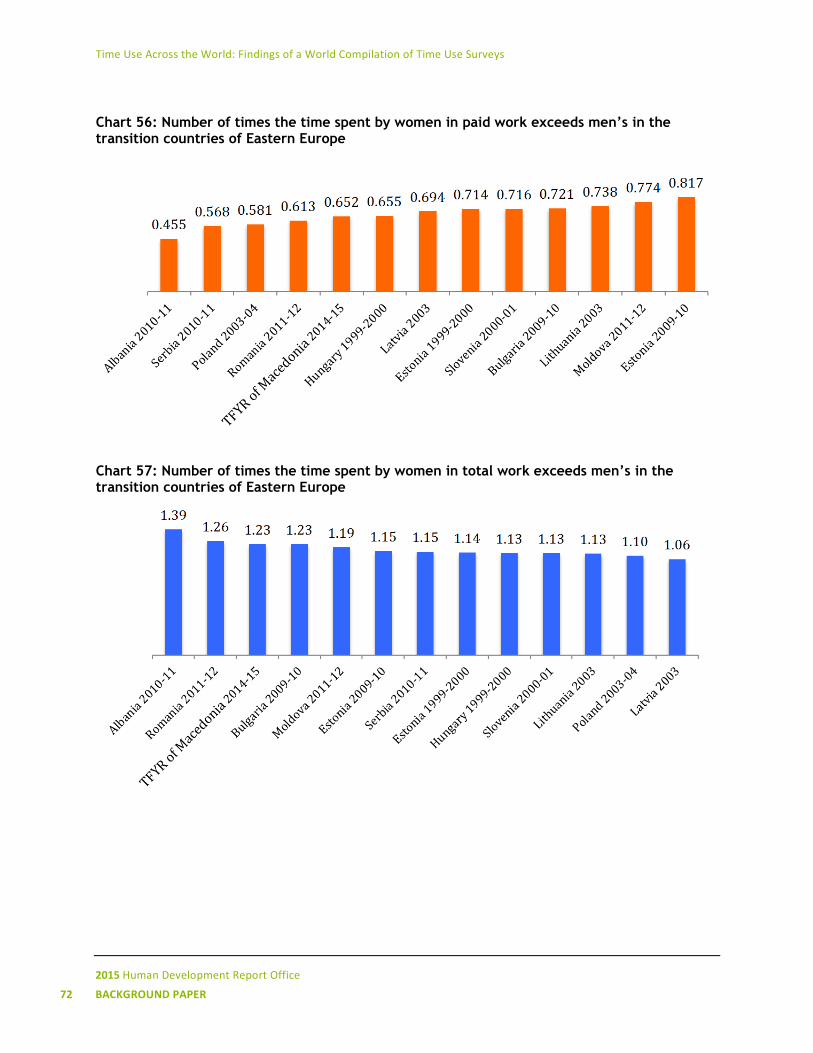
Time Use Across the World: Findings of a World Compilation of Time Use Surveys
2015 Human Development Report Office
72 BACKGROUND PAPER
Chart 56: Number of times the time spent by women in paid work exceeds men’s in the transition countries of Eastern Europe
Chart 57: Number of times the time spent by women in total work exceeds men’s in the transition countries of Eastern Europe
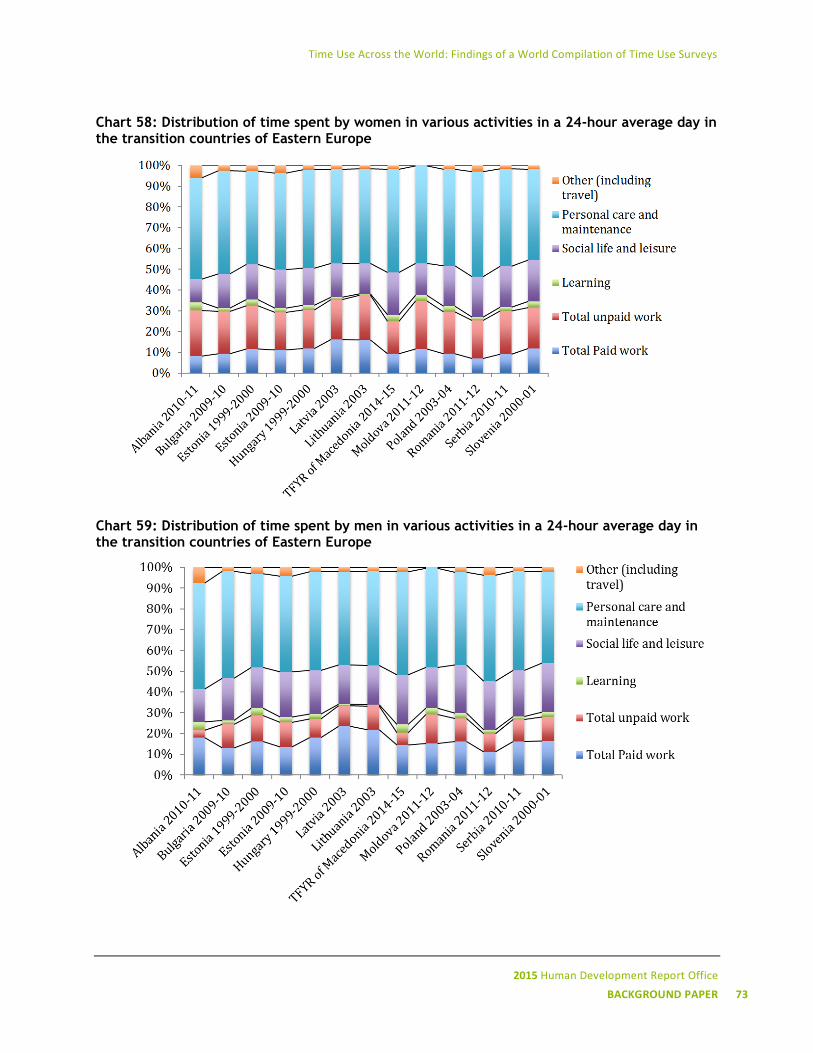
Time Use Across the World: Findings of a World Compilation of Time Use Surveys
2015 Human Development Report Office
BACKGROUND PAPER 73
Chart 58: Distribution of time spent by women in various activities in a 24-hour average day in the transition countries of Eastern Europe
Chart 59: Distribution of time spent by men in various activities in a 24-hour average day in the transition countries of Eastern Europe
Time Use Across the World: Findings of a World Compilation of Time Use Surveys
2015 Human Development Report Office
74 BACKGROUND PAPER
With only two countries, North America offers a picture of remarkable stability in time use
patterns.
Women’s unpaid work accounts for between 4 hours and 10 minutes and 4 hours and 20
minutes in an average day in all surveys (Chart 60). The average day of work is between 7 hours and
7 hours and 30 minutes. Women’ unpaid work slightly increased (by 5 minutes) in Canada between
2005 and 2010, whereas it decreased (by 21 minutes) in the United States of America from 2003 to
2014 (with a recent increase of 3 minutes from 2012 to 2013). During the same period, men’s unpaid
work (Chart 61) increased (by 14 minutes) in Canada, but decreased (by 6 minutes) in the United
States.
The share of unpaid work in total work accounts for 58-60 percent for women and for 38-40
percent for men (Charts 62 and 63).
The ratio of time spent in unpaid work by women and men (Chart 64) is situated between 1.5
and 1.6 in the two countries. The annual observation for the United States shows that the index is
following a cyclical trend. It would be interesting to compare it with the trends in the labour market.
The ratio of time spent in paid work by women and men (Chart 65) follows similar (but not
identical) trends, with values above 0.6 and occasionally 0.7. Finally, the ratio of time spent in total
work (Chart 66) is for all surveys equal to 1 or above, varying between 1 and 1.05, meaning that a
quasi-parity has been reached for this indicator.
Charts 67 and 68 illustrate the stability of time use patterns by sex in the two countries.
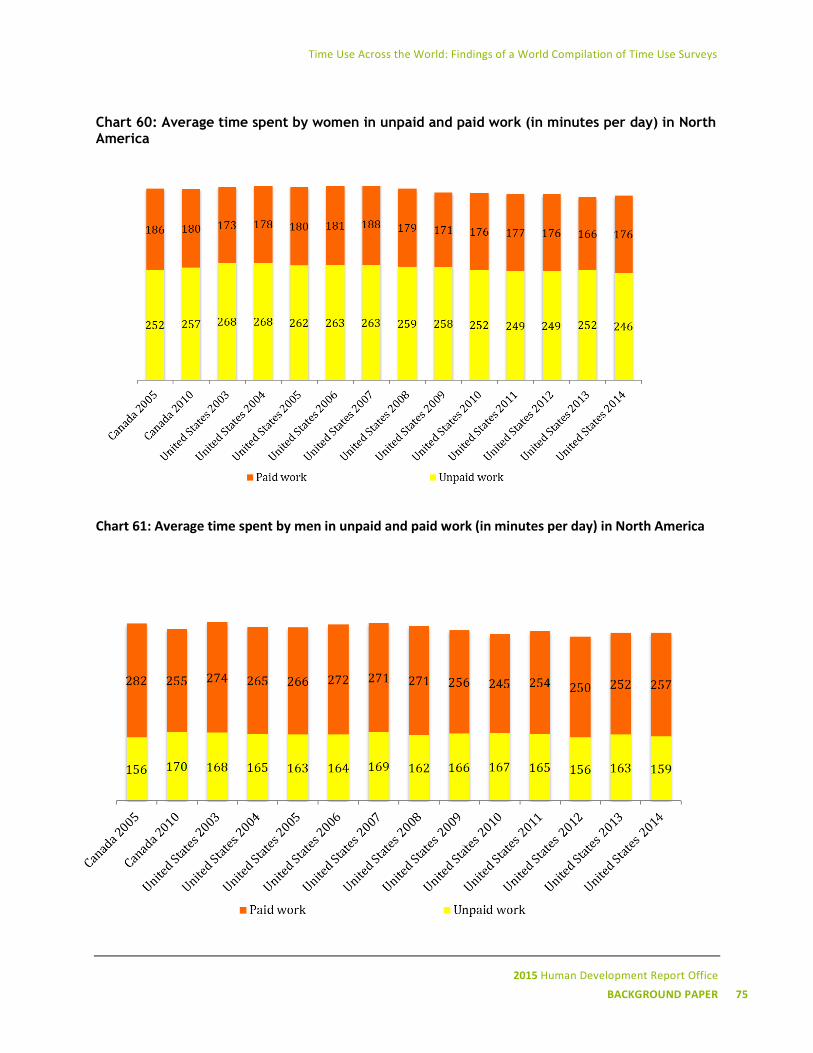
Time Use Across the World: Findings of a World Compilation of Time Use Surveys
2015 Human Development Report Office
BACKGROUND PAPER 75
Chart 60: Average time spent by women in unpaid and paid work (in minutes per day) in North America
Chart 61: Average time spent by men in unpaid and paid work (in minutes per day) in North America
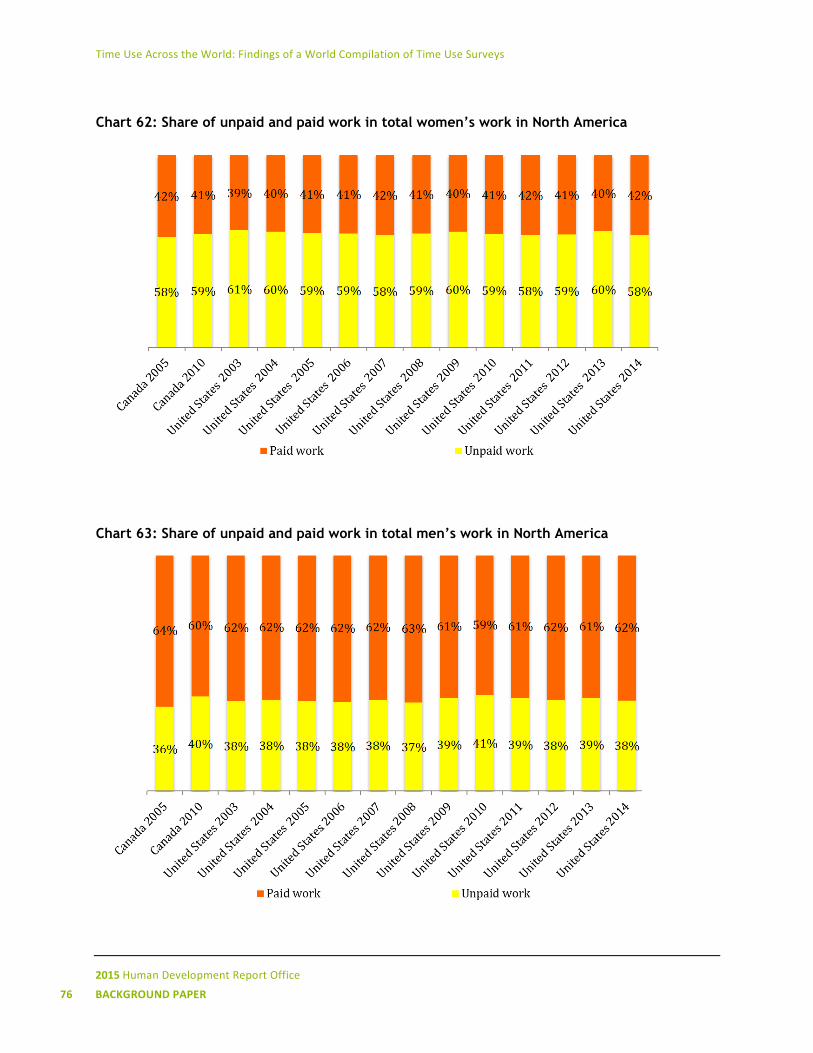
Time Use Across the World: Findings of a World Compilation of Time Use Surveys
2015 Human Development Report Office
76 BACKGROUND PAPER
Chart 62: Share of unpaid and paid work in total women’s work in North America
Chart 63: Share of unpaid and paid work in total men’s work in North America
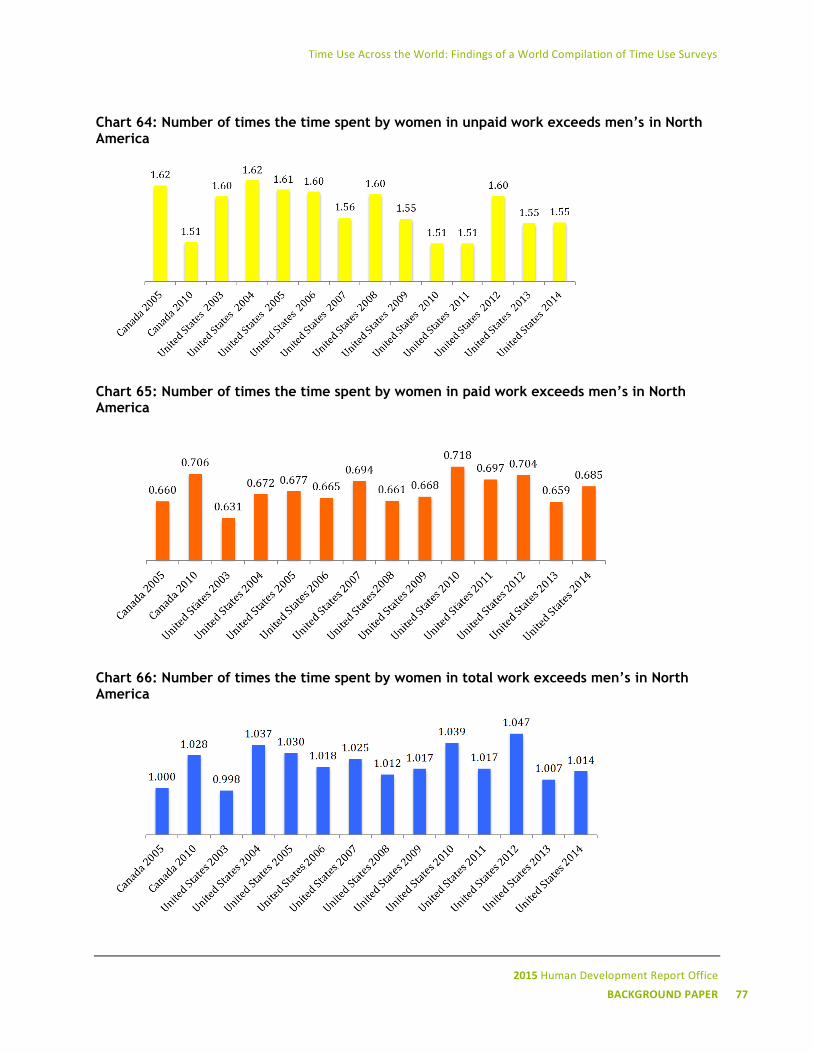
Time Use Across the World: Findings of a World Compilation of Time Use Surveys
2015 Human Development Report Office
BACKGROUND PAPER 77
Chart 64: Number of times the time spent by women in unpaid work exceeds men’s in North America
Chart 65: Number of times the time spent by women in paid work exceeds men’s in North America
Chart 66: Number of times the time spent by women in total work exceeds men’s in North America
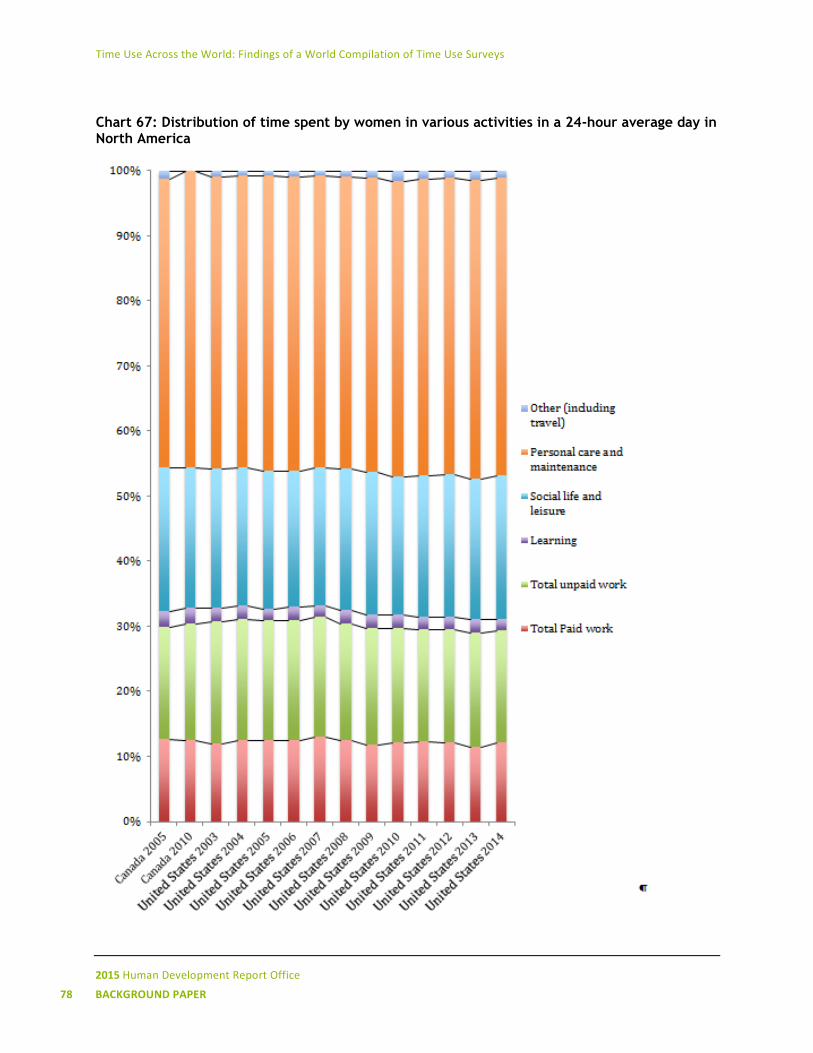
Time Use Across the World: Findings of a World Compilation of Time Use Surveys
2015 Human Development Report Office
78 BACKGROUND PAPER
Chart 67: Distribution of time spent by women in various activities in a 24-hour average day in North America
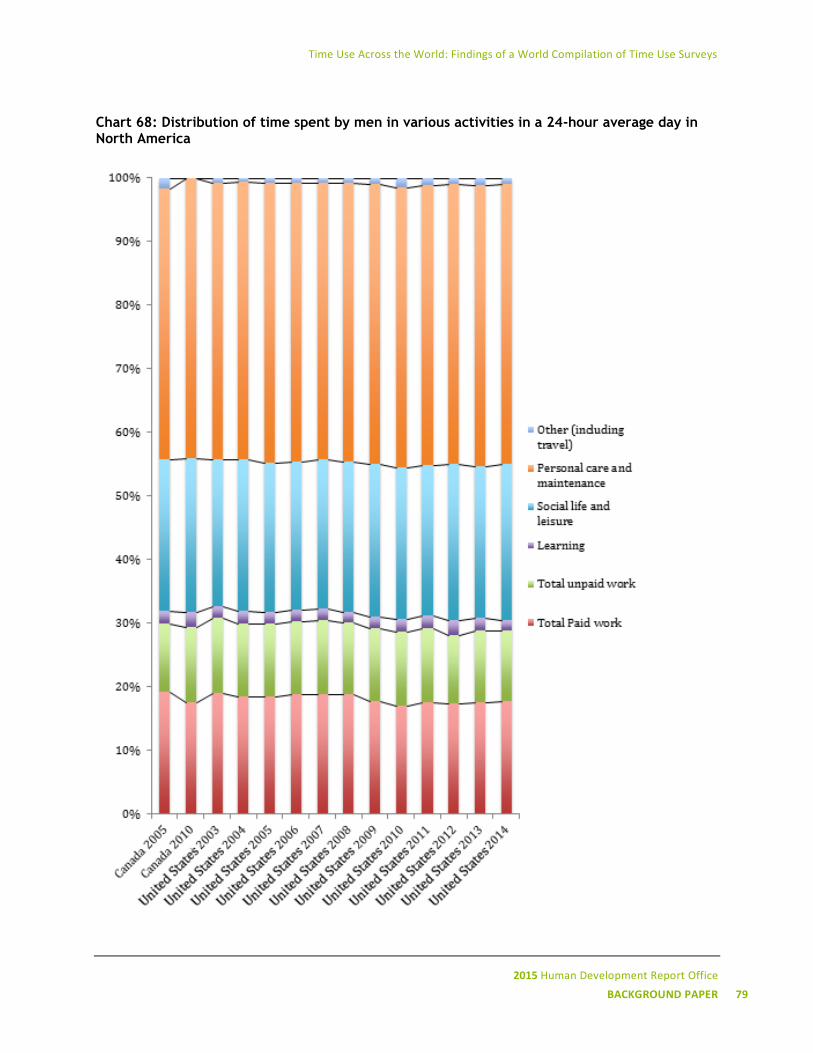
Time Use Across the World: Findings of a World Compilation of Time Use Surveys
2015 Human Development Report Office
BACKGROUND PAPER 79
Chart 68: Distribution of time spent by men in various activities in a 24-hour average day in North America
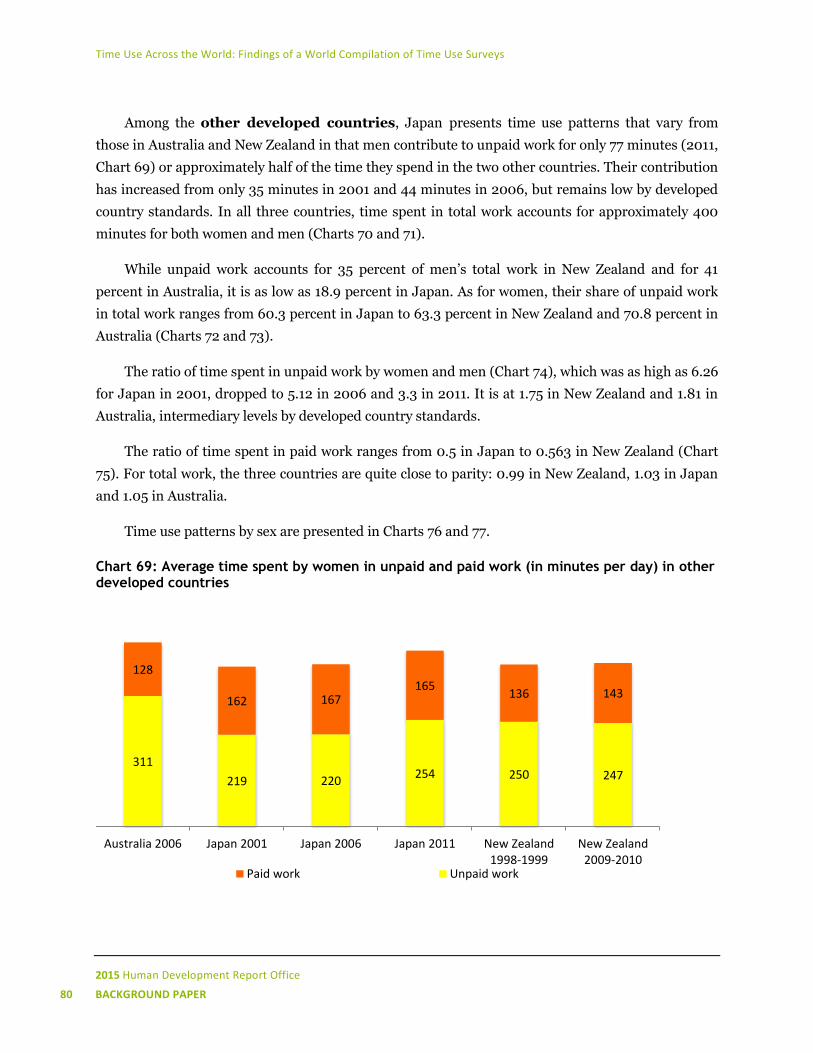
Time Use Across the World: Findings of a World Compilation of Time Use Surveys
2015 Human Development Report Office
80 BACKGROUND PAPER
Among the other developed countries, Japan presents time use patterns that vary from
those in Australia and New Zealand in that men contribute to unpaid work for only 77 minutes (2011,
Chart 69) or approximately half of the time they spend in the two other countries. Their contribution
has increased from only 35 minutes in 2001 and 44 minutes in 2006, but remains low by developed
country standards. In all three countries, time spent in total work accounts for approximately 400
minutes for both women and men (Charts 70 and 71).
While unpaid work accounts for 35 percent of men’s total work in New Zealand and for 41
percent in Australia, it is as low as 18.9 percent in Japan. As for women, their share of unpaid work
in total work ranges from 60.3 percent in Japan to 63.3 percent in New Zealand and 70.8 percent in
Australia (Charts 72 and 73).
The ratio of time spent in unpaid work by women and men (Chart 74), which was as high as 6.26
for Japan in 2001, dropped to 5.12 in 2006 and 3.3 in 2011. It is at 1.75 in New Zealand and 1.81 in
Australia, intermediary levels by developed country standards.
The ratio of time spent in paid work ranges from 0.5 in Japan to 0.563 in New Zealand (Chart
75). For total work, the three countries are quite close to parity: 0.99 in New Zealand, 1.03 in Japan
and 1.05 in Australia.
Time use patterns by sex are presented in Charts 76 and 77.
Chart 69: Average time spent by women in unpaid and paid work (in minutes per day) in other developed countries
311
219 220 254 250 247
128
162 167 165
136 143
Australia 2006 Japan 2001 Japan 2006 Japan 2011 New Zealand1998-1999
New Zealand2009-2010
Paid work Unpaid work
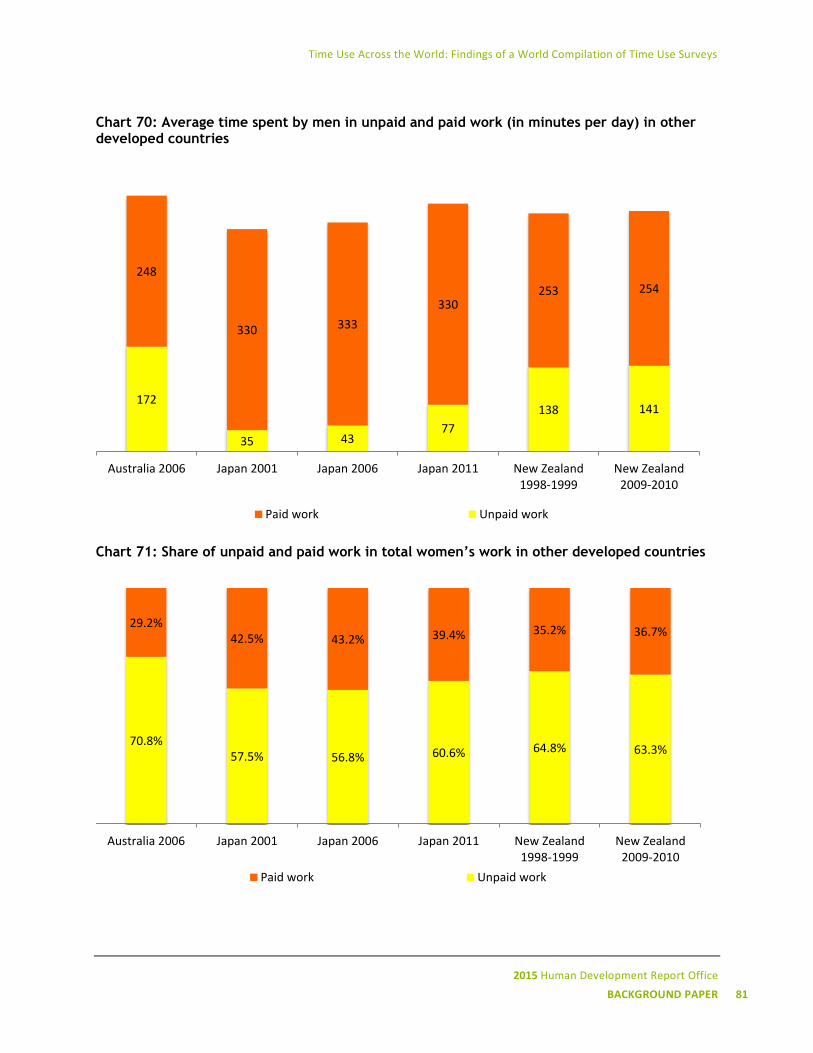
Time Use Across the World: Findings of a World Compilation of Time Use Surveys
2015 Human Development Report Office
BACKGROUND PAPER 81
Chart 70: Average time spent by men in unpaid and paid work (in minutes per day) in other developed countries
Chart 71: Share of unpaid and paid work in total women’s work in other developed countries
172
35 43 77
138 141
248
330 333
330 253 254
Australia 2006 Japan 2001 Japan 2006 Japan 2011 New Zealand1998-1999
New Zealand2009-2010
Paid work Unpaid work
70.8% 57.5% 56.8% 60.6% 64.8% 63.3%
29.2% 42.5% 43.2% 39.4% 35.2% 36.7%
Australia 2006 Japan 2001 Japan 2006 Japan 2011 New Zealand1998-1999
New Zealand2009-2010
Paid work Unpaid work
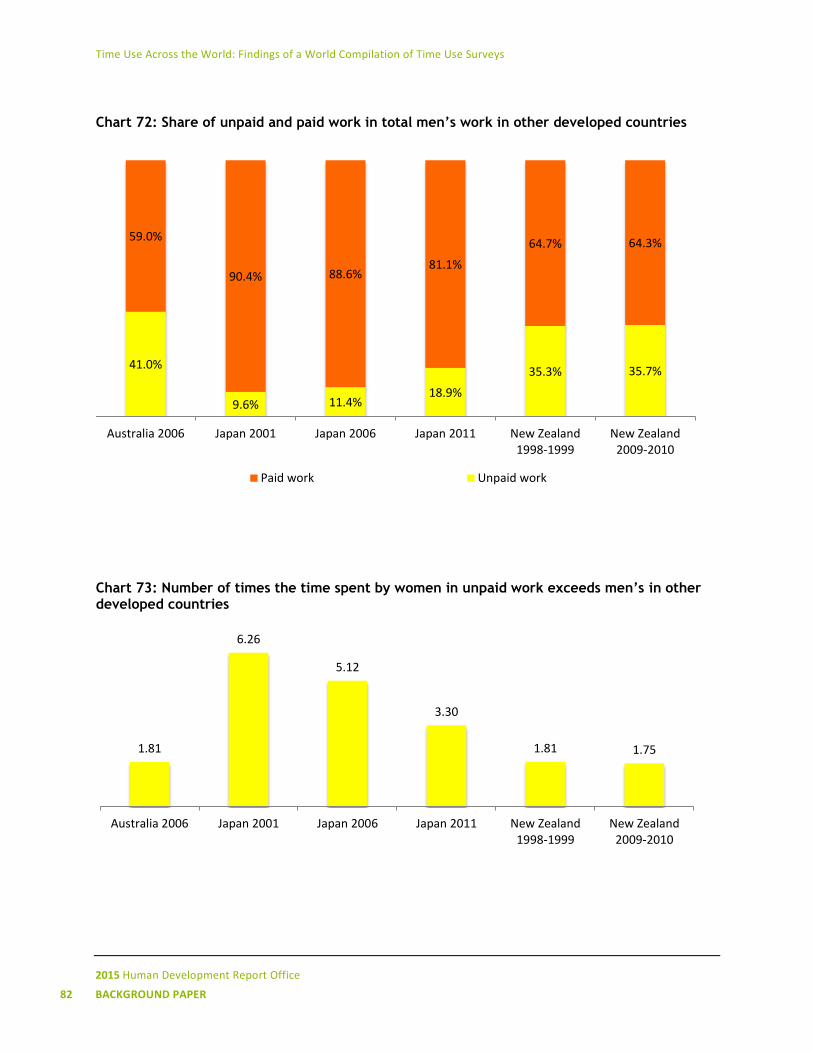
Time Use Across the World: Findings of a World Compilation of Time Use Surveys
2015 Human Development Report Office
82 BACKGROUND PAPER
Chart 72: Share of unpaid and paid work in total men’s work in other developed countries
Chart 73: Number of times the time spent by women in unpaid work exceeds men’s in other developed countries
41.0%
9.6% 11.4% 18.9%
35.3% 35.7%
59.0%
90.4% 88.6% 81.1%
64.7% 64.3%
Australia 2006 Japan 2001 Japan 2006 Japan 2011 New Zealand1998-1999
New Zealand2009-2010
Paid work Unpaid work
1.81
6.26
5.12
3.30
1.81 1.75
Australia 2006 Japan 2001 Japan 2006 Japan 2011 New Zealand1998-1999
New Zealand2009-2010
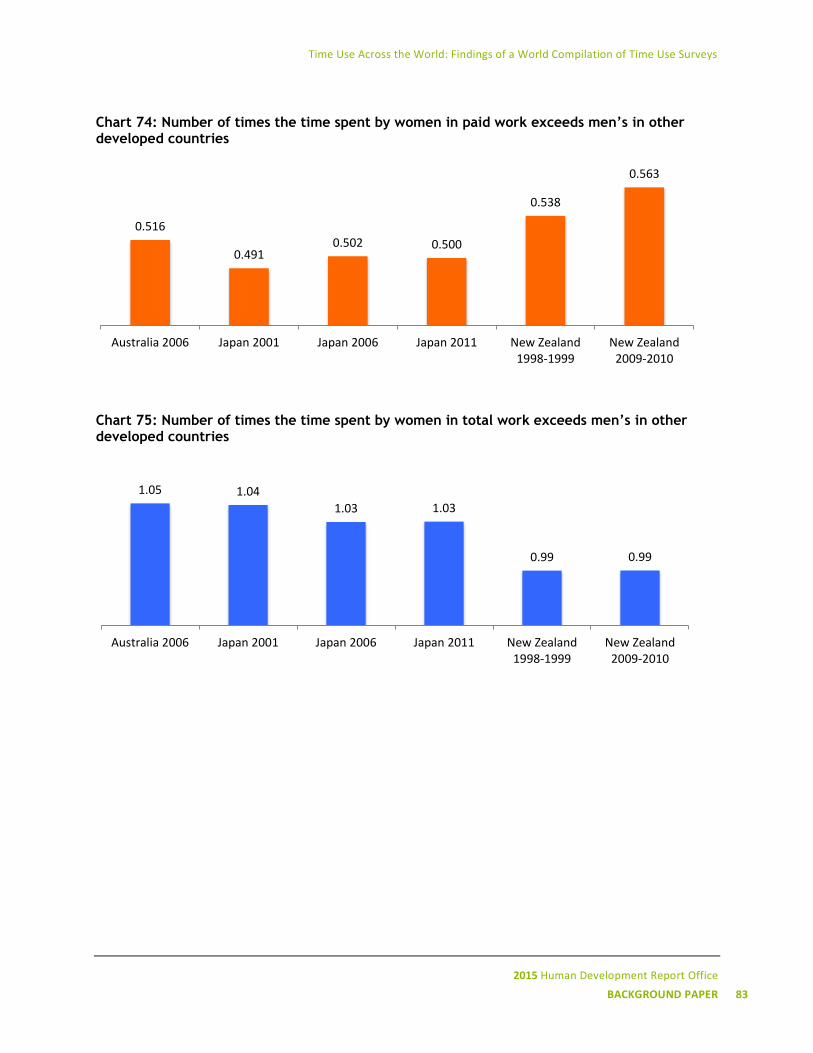
Time Use Across the World: Findings of a World Compilation of Time Use Surveys
2015 Human Development Report Office
BACKGROUND PAPER 83
Chart 74: Number of times the time spent by women in paid work exceeds men’s in other developed countries
Chart 75: Number of times the time spent by women in total work exceeds men’s in other developed countries
0.516
0.491 0.502 0.500
0.538
0.563
Australia 2006 Japan 2001 Japan 2006 Japan 2011 New Zealand1998-1999
New Zealand2009-2010
1.05 1.04
1.03 1.03
0.99 0.99
Australia 2006 Japan 2001 Japan 2006 Japan 2011 New Zealand1998-1999
New Zealand2009-2010
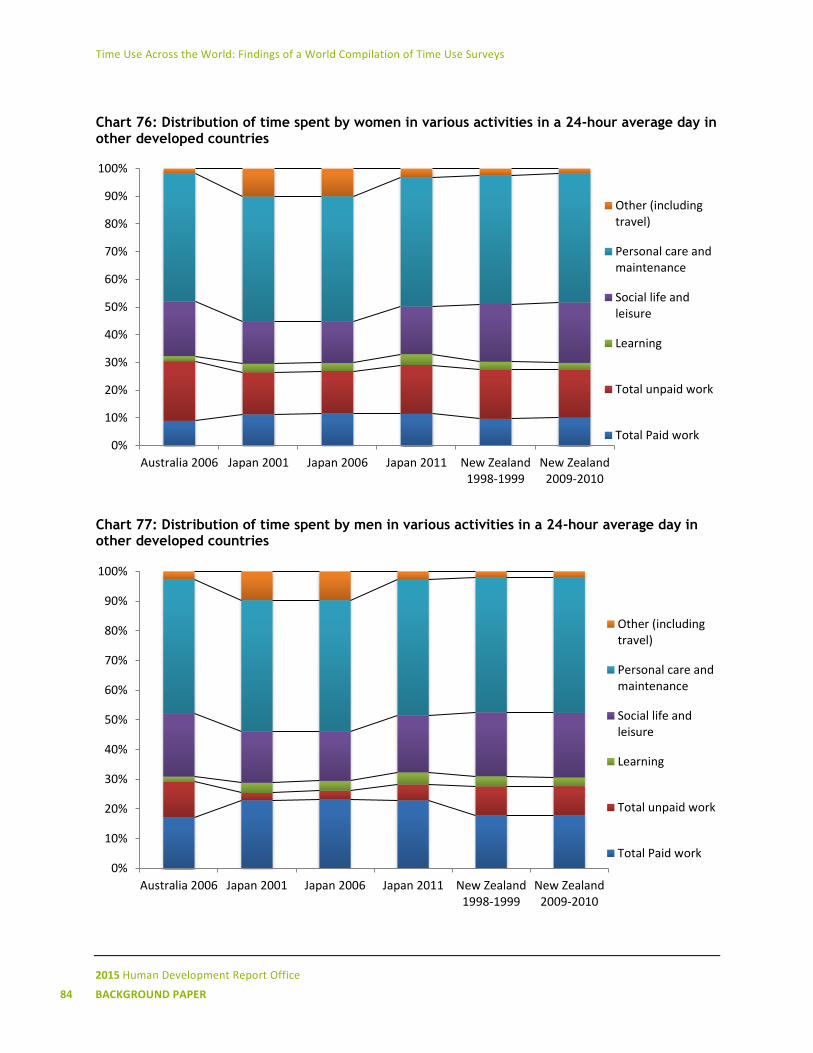
Time Use Across the World: Findings of a World Compilation of Time Use Surveys
2015 Human Development Report Office
84 BACKGROUND PAPER
Chart 76: Distribution of time spent by women in various activities in a 24-hour average day in other developed countries
Chart 77: Distribution of time spent by men in various activities in a 24-hour average day in other developed countries
0%
10%
20%
30%
40%
50%
60%
70%
80%
90%
100%
Australia 2006 Japan 2001 Japan 2006 Japan 2011 New Zealand1998-1999
New Zealand2009-2010
Other (includingtravel)
Personal care andmaintenance
Social life andleisure
Learning
Total unpaid work
Total Paid work
0%
10%
20%
30%
40%
50%
60%
70%
80%
90%
100%
Australia 2006 Japan 2001 Japan 2006 Japan 2011 New Zealand1998-1999
New Zealand2009-2010
Other (includingtravel)
Personal care andmaintenance
Social life andleisure
Learning
Total unpaid work
Total Paid work
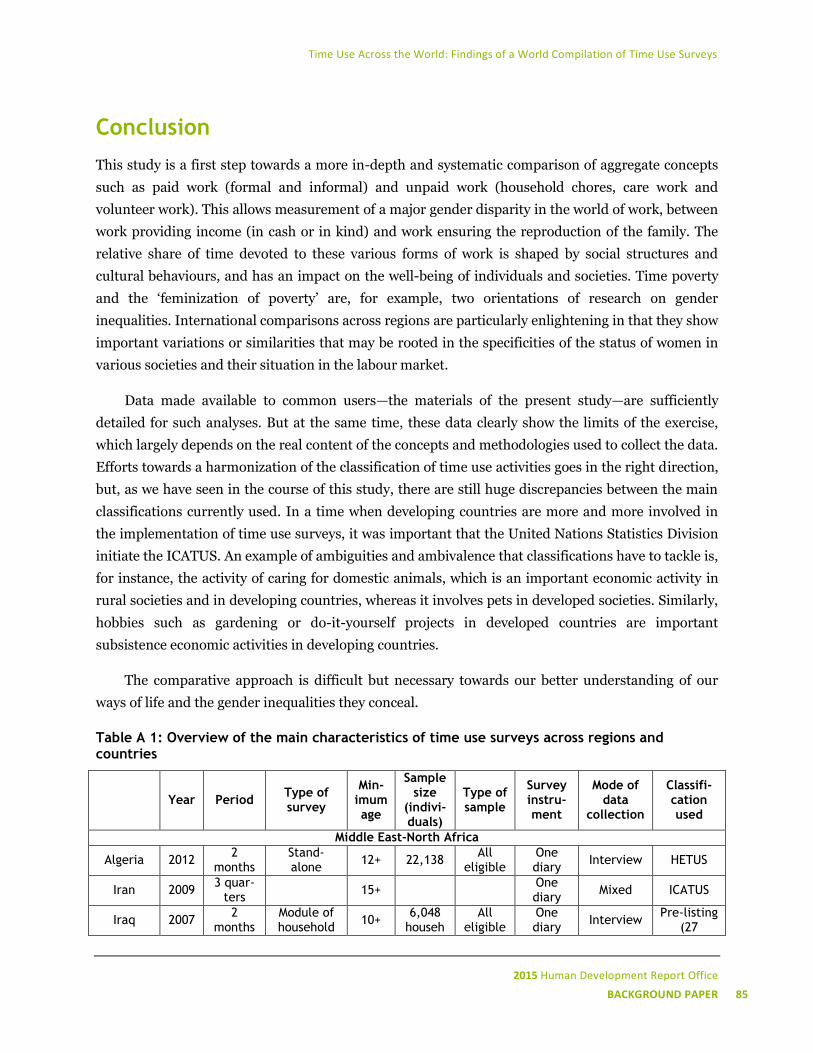
Time Use Across the World: Findings of a World Compilation of Time Use Surveys
2015 Human Development Report Office
BACKGROUND PAPER 85
Conclusion
This study is a first step towards a more in-depth and systematic comparison of aggregate concepts
such as paid work (formal and informal) and unpaid work (household chores, care work and
volunteer work). This allows measurement of a major gender disparity in the world of work, between
work providing income (in cash or in kind) and work ensuring the reproduction of the family. The
relative share of time devoted to these various forms of work is shaped by social structures and
cultural behaviours, and has an impact on the well-being of individuals and societies. Time poverty
and the ‘feminization of poverty’ are, for example, two orientations of research on gender
inequalities. International comparisons across regions are particularly enlightening in that they show
important variations or similarities that may be rooted in the specificities of the status of women in
various societies and their situation in the labour market.
Data made available to common users—the materials of the present study—are sufficiently
detailed for such analyses. But at the same time, these data clearly show the limits of the exercise,
which largely depends on the real content of the concepts and methodologies used to collect the data.
Efforts towards a harmonization of the classification of time use activities goes in the right direction,
but, as we have seen in the course of this study, there are still huge discrepancies between the main
classifications currently used. In a time when developing countries are more and more involved in
the implementation of time use surveys, it was important that the United Nations Statistics Division
initiate the ICATUS. An example of ambiguities and ambivalence that classifications have to tackle is,
for instance, the activity of caring for domestic animals, which is an important economic activity in
rural societies and in developing countries, whereas it involves pets in developed societies. Similarly,
hobbies such as gardening or do-it-yourself projects in developed countries are important
subsistence economic activities in developing countries.
The comparative approach is difficult but necessary towards our better understanding of our
ways of life and the gender inequalities they conceal.
Table A 1: Overview of the main characteristics of time use surveys across regions and countries
Year Period Type of survey
Min-imum age
Sample size
(indivi-duals)
Type of sample
Survey instru-ment
Mode of data
collection
Classifi-cation used
Middle East-North Africa
Algeria 2012 2
months Stand-alone
12+ 22,138 All
eligible One diary
Interview HETUS
Iran 2009 3 quar-
ters 15+
One diary
Mixed ICATUS
Iraq 2007 2
months Module of household
10+ 6,048
househAll
eligible One diary
Interview Pre-listing
(27
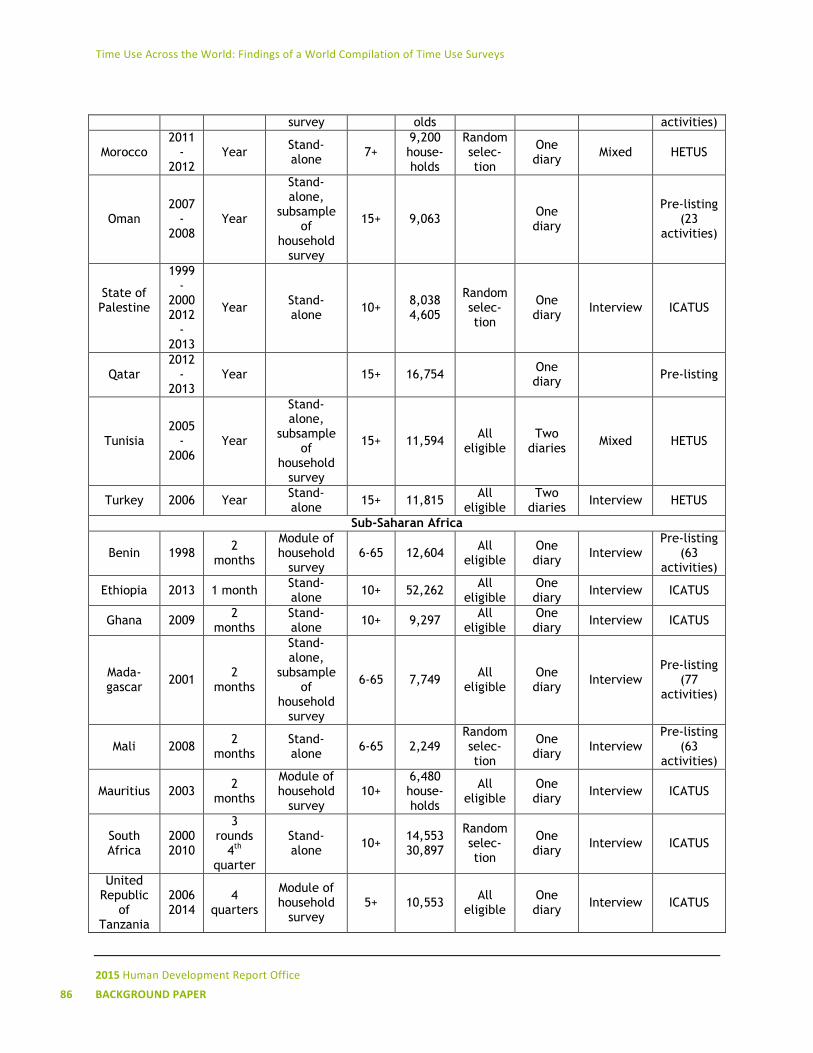
Time Use Across the World: Findings of a World Compilation of Time Use Surveys
2015 Human Development Report Office
86 BACKGROUND PAPER
survey olds activities)
Morocco 2011
-2012
Year Stand-alone
7+ 9,200 house-holds
Random selec-tion
One diary
Mixed HETUS
Oman 2007
-2008
Year
Stand-alone,
subsample of
household survey
15+ 9,063 One diary
Pre-listing
(23 activities)
State of Palestine
1999-
2000 2012
-2013
Year Stand-alone
10+ 8,038 4,605
Random selec-tion
One diary
Interview ICATUS
Qatar 2012
-2013
Year 15+ 16,754 One diary
Pre-listing
Tunisia 2005
-2006
Year
Stand-alone,
subsample of
household survey
15+ 11,594 All
eligible Two
diaries Mixed HETUS
Turkey 2006 Year Stand-alone
15+ 11,815 All
eligible Two
diaries Interview HETUS
Sub-Saharan Africa
Benin 1998 2
months
Module of household
survey 6-65 12,604
All eligible
One diary
Interview Pre-listing
(63 activities)
Ethiopia 2013 1 month Stand-alone
10+ 52,262 All
eligible One diary
Interview ICATUS
Ghana 2009 2
months Stand-alone
10+ 9,297 All
eligible One diary
Interview ICATUS
Mada-gascar
2001 2
months
Stand-alone,
subsample of
household survey
6-65 7,749 All
eligible One diary
Interview Pre-listing
(77 activities)
Mali 2008 2
months Stand-alone
6-65 2,249 Random selec-tion
One diary
Interview Pre-listing
(63 activities)
Mauritius 2003 2
months
Module of household
survey 10+
6,480 house-holds
All eligible
One diary
Interview ICATUS
South Africa
2000 2010
3 rounds
4th
quarter
Stand-alone
10+ 14,553 30,897
Random selec-tion
One diary
Interview ICATUS
United Republic
of Tanzania
2006 2014
4 quarters
Module of household
survey 5+ 10,553
All eligible
One diary
Interview ICATUS
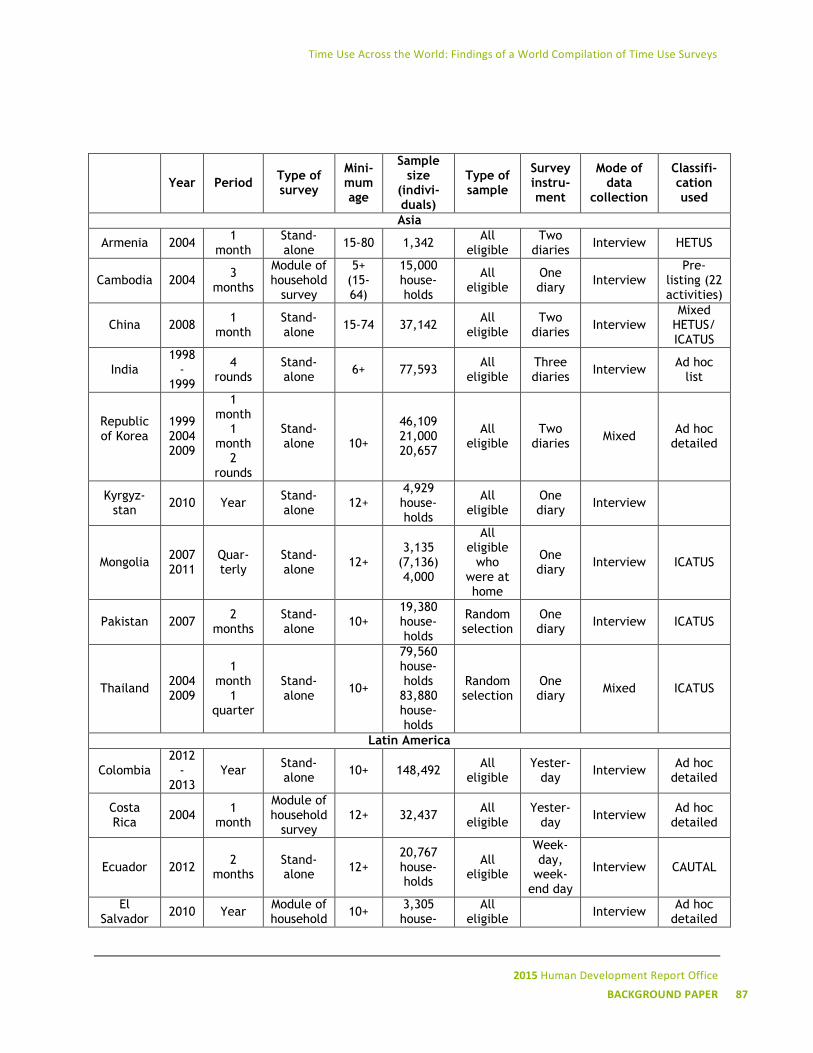
Time Use Across the World: Findings of a World Compilation of Time Use Surveys
2015 Human Development Report Office
BACKGROUND PAPER 87
Year Period Type of survey
Mini-mum age
Sample size
(indivi-duals)
Type of sample
Survey instru-ment
Mode of data
collection
Classifi-cation used
Asia
Armenia 2004 1
month Stand-alone
15-80 1,342 All
eligible Two
diaries Interview HETUS
Cambodia 2004 3
months
Module of household
survey
5+ (15-64)
15,000 house-holds
All eligible
One diary
Interview Pre-
listing (22 activities)
China 2008 1
month Stand-alone
15-74 37,142 All
eligible Two
diaries Interview
Mixed HETUS/ ICATUS
India 1998
-1999
4 rounds
Stand-alone
6+ 77,593 All
eligible Three diaries
Interview Ad hoc
list
Republic of Korea
1999 2004 2009
1 month
1 month
2 rounds
Stand-alone
10+
46,109 21,000 20,657
All eligible
Two diaries
Mixed Ad hoc
detailed
Kyrgyz-stan
2010 Year Stand-alone
12+ 4,929 house-holds
All eligible
One diary
Interview
Mongolia 2007 2011
Quar-terly
Stand-alone
12+ 3,135
(7,136) 4,000
All eligible
who were at home
One diary
Interview ICATUS
Pakistan 2007 2
months Stand-alone
10+ 19,380 house-holds
Random selection
One diary
Interview ICATUS
Thailand 2004 2009
1 month
1 quarter
Stand-alone
10+
79,560 house-holds
83,880 house-holds
Random selection
One diary
Mixed ICATUS
Latin America
Colombia 2012
-2013
Year Stand-alone
10+ 148,492 All
eligible Yester-
day Interview
Ad hoc detailed
Costa Rica
2004 1
month
Module of household
survey 12+ 32,437
All eligible
Yester-day
Interview Ad hoc
detailed
Ecuador 2012 2
months Stand-alone
12+ 20,767 house-holds
All eligible
Week-day,
week-end day
Interview CAUTAL
El Salvador
2010 Year Module of household
10+ 3,305 house-
All eligible
Interview Ad hoc
detailed
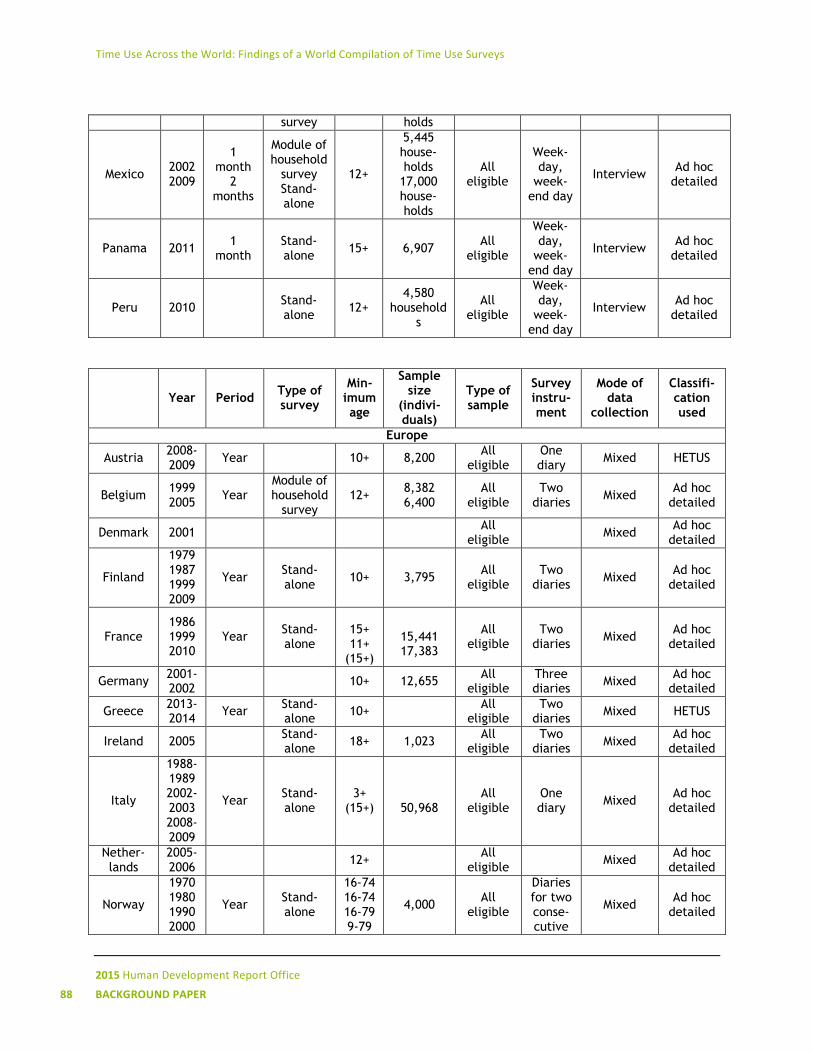
Time Use Across the World: Findings of a World Compilation of Time Use Surveys
2015 Human Development Report Office
88 BACKGROUND PAPER
survey holds
Mexico 2002 2009
1 month
2 months
Module of household
survey Stand-alone
12+
5,445 house-holds
17,000 house-holds
All eligible
Week-day,
week-end day
Interview Ad hoc
detailed
Panama 2011 1
month Stand-alone
15+ 6,907 All
eligible
Week-day,
week-end day
Interview Ad hoc
detailed
Peru 2010 Stand-alone
12+ 4,580
households
All eligible
Week-day,
week-end day
Interview Ad hoc
detailed
Year Period Type of survey
Min-imum age
Sample size
(indivi-duals)
Type of sample
Survey instru-ment
Mode of data
collection
Classifi-cation used
Europe
Austria 2008-2009
Year 10+ 8,200 All
eligible One diary
Mixed HETUS
Belgium 1999 2005
Year Module of household
survey 12+
8,382 6,400
All eligible
Two diaries
Mixed Ad hoc
detailed
Denmark 2001 All
eligible Mixed
Ad hoc detailed
Finland
1979 1987 1999 2009
Year Stand-alone
10+ 3,795 All
eligible Two
diaries Mixed
Ad hoc detailed
France 1986 1999 2010
Year Stand-alone
15+ 11+
(15+)
15,441 17,383
All eligible
Two diaries
Mixed Ad hoc
detailed
Germany 2001-2002
10+ 12,655 All
eligible Three diaries
Mixed Ad hoc
detailed
Greece 2013-2014
Year Stand-alone
10+ All
eligible Two
diaries Mixed HETUS
Ireland 2005 Stand-alone
18+ 1,023 All
eligible Two
diaries Mixed
Ad hoc detailed
Italy
1988-1989 2002-2003 2008-2009
Year Stand-alone
3+ (15+)
50,968
All eligible
One diary
Mixed Ad hoc
detailed
Nether-lands
2005-2006
12+ All
eligible Mixed
Ad hoc detailed
Norway
1970 1980 1990 2000
Year Stand-alone
16-74 16-74 16-79 9-79
4,000 All
eligible
Diaries for two conse-cutive
Mixed Ad hoc
detailed
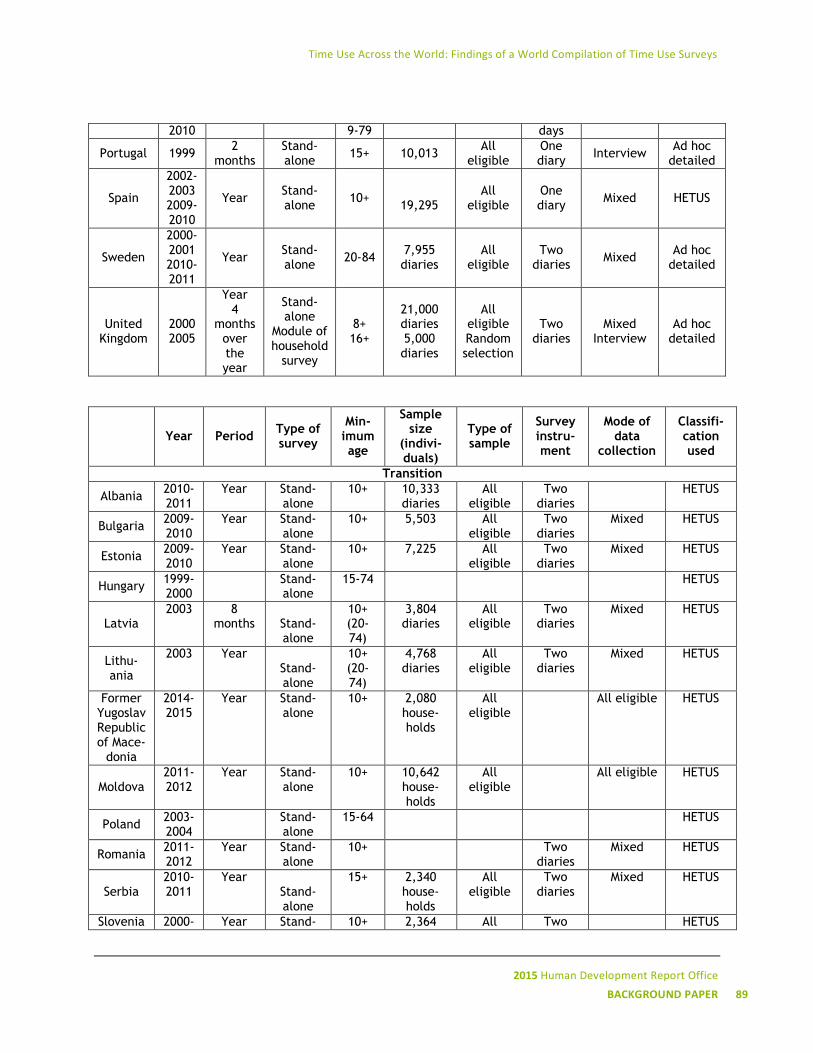
Time Use Across the World: Findings of a World Compilation of Time Use Surveys
2015 Human Development Report Office
BACKGROUND PAPER 89
2010 9-79 days
Portugal 1999 2
months Stand-alone
15+ 10,013 All
eligible One diary
Interview Ad hoc
detailed
Spain
2002-2003 2009-2010
Year Stand-alone
10+
19,295 All
eligible One diary
Mixed HETUS
Sweden
2000-2001 2010-2011
Year Stand-alone
20-84 7,955 diaries
All eligible
Two diaries
Mixed Ad hoc
detailed
United Kingdom
2000 2005
Year 4
months over the year
Stand-alone
Module of household
survey
8+ 16+
21,000 diaries 5,000 diaries
All eligible Random selection
Two diaries
Mixed Interview
Ad hoc detailed
Year Period Type of survey
Min-imum age
Sample size
(indivi-duals)
Type of sample
Survey instru-ment
Mode of data
collection
Classifi-cation used
Transition
Albania 2010-2011
Year Stand-alone
10+ 10,333 diaries
All eligible
Two diaries
HETUS
Bulgaria 2009-2010
Year Stand-alone
10+ 5,503 All eligible
Two diaries
Mixed HETUS
Estonia 2009-2010
Year Stand-alone
10+ 7,225 All eligible
Two diaries
Mixed HETUS
Hungary 1999-2000
Stand-alone
15-74 HETUS
Latvia 2003 8
months Stand-alone
10+ (20-74)
3,804 diaries
All eligible
Two diaries
Mixed HETUS
Lithu-ania
2003 Year Stand-alone
10+ (20-74)
4,768 diaries
All eligible
Two diaries
Mixed HETUS
Former Yugoslav Republic of Mace-
donia
2014-2015
Year Stand-alone
10+ 2,080 house-holds
All eligible
All eligible HETUS
Moldova 2011-2012
Year Stand-alone
10+ 10,642 house-holds
All eligible
All eligible HETUS
Poland 2003-2004
Stand-alone
15-64 HETUS
Romania 2011-2012
Year Stand-alone
10+ Two diaries
Mixed HETUS
Serbia 2010-2011
Year Stand-alone
15+ 2,340 house-holds
All eligible
Two diaries
Mixed HETUS
Slovenia 2000- Year Stand- 10+ 2,364 All Two HETUS
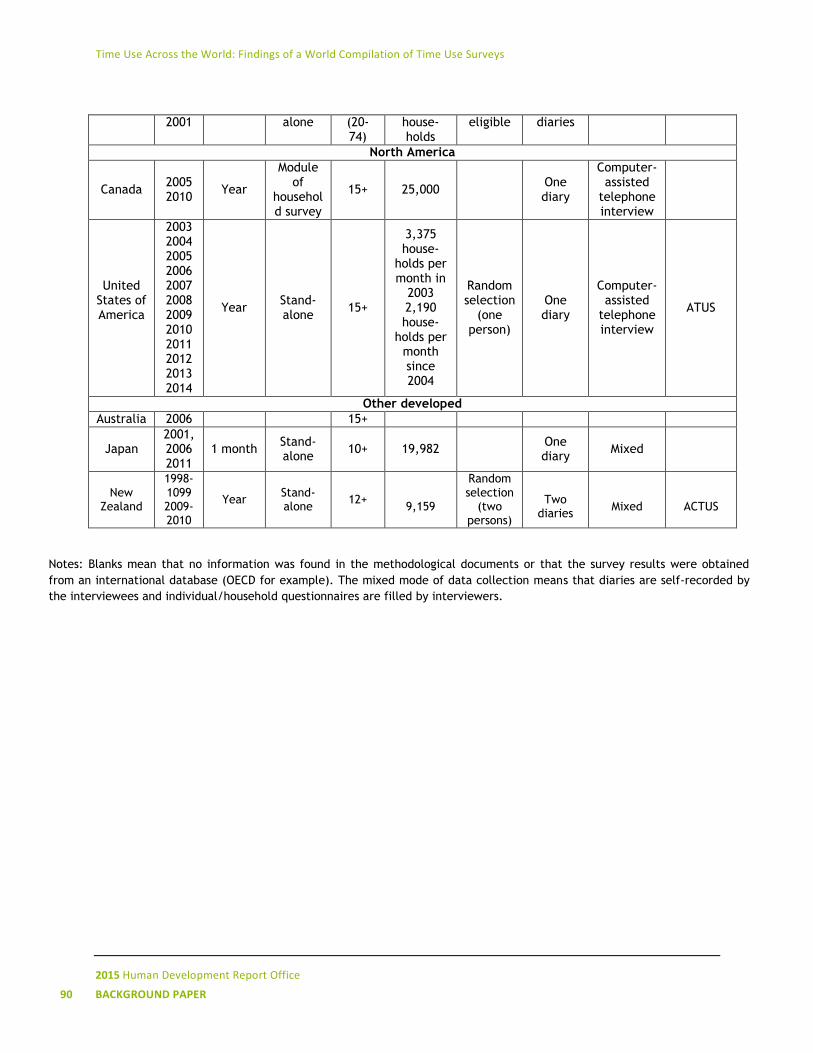
Time Use Across the World: Findings of a World Compilation of Time Use Surveys
2015 Human Development Report Office
90 BACKGROUND PAPER
2001 alone (20-74)
house-holds
eligible diaries
North America
Canada 2005 2010
Year
Module of
household survey
15+ 25,000 One diary
Computer-assisted
telephone interview
United States of America
2003 2004 2005 2006 2007 2008 2009 2010 2011 2012 2013 2014
Year Stand-alone
15+
3,375 house-
holds per month in
2003 2,190 house-
holds per month since 2004
Random selection
(one person)
One diary
Computer-assisted
telephone interview
ATUS
Other developed
Australia 2006 15+
Japan 2001, 2006 2011
1 month Stand-alone
10+ 19,982 One diary
Mixed
New Zealand
1998-1099 2009-2010
Year Stand-alone
12+
9,159
Random selection
(two persons)
Two
diaries
Mixed
ACTUS
Notes: Blanks mean that no information was found in the methodological documents or that the survey results were obtained
from an international database (OECD for example). The mixed mode of data collection means that diaries are self-recorded by
the interviewees and individual/household questionnaires are filled by interviewers.
Time Use Across the World: Findings of a World Compilation of Time Use Surveys
2015 Human Development Report Office
91 BACKGROUND PAPER
GENERAL
Budlender, D. 2004. Why should we care about unpaid carework? New York: UNIFEM.
Charmes, J. 2005. “Gender and time poverty in Sub-Saharan Africa: A review of empirical evidence.” In M. Blackden and Q. Woddon, eds., Gender, time-use and poverty in sub-Saharan Africa, pp. 39-72. World Bank Working Paper No. 73. Washington, DC: World Bank.
Charmes, J. and I. Hirway. 2006. “Estimating and Understanding Informal Employment Through Time Use Studies.” Paper presented at the 9
th meeting of the
Delhi Group on Informal Sector Statistics. New Delhi, 11-12 May.
Charmes, J. and M. Remaoun. 2014. L’emploi des Femmes en Algérie: contraintes et opportunités. BIT Alger.
Dumazedier, J. 1960. “Current problems of the sociology of leisure.” International Social Science Journal XII(4): 522-531.
Elson, D. 2000. Progress of the World’s Women 2000. New York: UNIFEM.
EUROSTAT. 2009. “Harmonised European time use surveys, 2008 guidelines.” Luxemburg: European Communities.
Friedmann, G. 1960. “Leisure and Technical Civilization.” International Social Science Journal XII(4): 509-521.
National Bureau of Statistics, United Republic of Tanzania. 2007. “Analytical Report for Integrated Labour Force Survey ILFS 2006.” Dar es Salaam.
SNA (System of National Accounts). 1993. System of National Accounts. New York: Commission of the European Communities, IMF, OECD, United Nations, World Bank.
____. 2008. System of National Accounts. New York: Commission of the European Communities, IMF, OECD, United Nations, World Bank.
REFERENCES FOR TIME USE SURVEYS
SUB-SAHARAN AFRICA
Benin
INSEA/PNUD (Institut Nationale de la Statistique et de l'Analyse Economique et Programme des Nations Unies pour le Développement). 1998. Enquête emploi du temps au Bénin, Méthodologie et résultats. Cotonou
Ethiopia
Central Statistical Agency. 2014. How Women and Men Spend Their Time, Ethiopian Time Use Survey 2013, Main Report. Addis Ababa.
Ghana
Ghana Statistical Service. 2012. How Ghanaian women and men spend their time, Ghana Time-Use Survey 2009, Main Report. Accra: GSS-UNECA.
Madagascar
INSTAT (Institut national de la statistique) 2001. EPM 2001—Module Emploi du Temps. INSTAT-DSM/PNUD-MAG/97/007. Antananarivo.
Mali
INSTAT (Institut national de la statistique). 2009. Rapport de l’enquête malienne sur l’utilisation du temps. EMUT 2008. Bamako.
Mauritius
Republic of Mauritius, Central Statistics Office. 2004. Continuous Multi-Purpose Household Survey 2003, Main results of the time-use study.
South Africa
Statistics South Africa. 2001. How South African Women and Men Spend Their Time, A survey of time use. Pretoria.
____. 2013. A survey of time use 2010. Pretoria.
United Republic of Tanzania
Time Use Across the World: Findings of a World Compilation of Time Use Surveys
2015 Human Development Report Office
92 BACKGROUND PAPER
Fontana, M., and L. Natali. 2008. “Gendered Patterns of Time Use in Tanzania: Public Investment in Infrastructure Can Help.” Paper prepared for the International Food Policy Research Institute project on Evaluating the Long-Term Impact of Gender-focussed Policy Interventions.
National Bureau of Statistics, United Republic of Tanzania. 2007. Analytical Report for Integrated Labour Force Survey ILFS 2006. Dar es Salaam.
____. 2015. Analytical Report for Integrated Labour Force Survey 2014, Tanzania mainland. Dar es Salaam.
MIDDLE EAST AND NORTH AFRICA
Algeria
Office National des Statistiques. 2013. Enquête Nationale Emploi du Temps ENET 2012. Alger.
Islamic Republic of Iran
Statistical Centre of the Islamic Republic of Iran. 2012a. Summary findings of time use survey in urban areas, Autumn 2008 (23 September 2008-22 December 2008).
____. 2012b. Summary findings of time use survey in urban areas, Summer 2009 (22 June-22 September).
____. 2012c. Summary findings of time use survey in urban areas, Winter 2009 (22 December 2008-20 March 2009).
Iraq
COSIT (Central Organization for Statistics and Information Technology) of Iraq, KRSO (Kurdistan Region Statistics Organization) and World Bank. 2008. Iraq Household Socio-Economic Survey IHSES 2007. Volumes I-III. Baghdad.
UNESCWA (United Nations Economic and Social Commission for West Asia) and COSIT (Central Organization for Statistics and Information Technology). 2010. Time use in gender statistics in Iraq. Amman.
Morocco
Royaume du Maroc, Haut Commissariat au Plan. 2014a. Le Budget temps ou l’Enquête Nationale sur l’Emploi du Temps au Maroc 2011-12, Presentation des premiers resultats par Monsieur Ahmed LAHLIMI ALAMI, Haut-Commissaire au Plan. Rabat.
____. 2014b. Le Budget temps ou l’Enquête Nationale sur l’Emploi du Temps au Maroc 2011-12, Principaux résultats. Rabat.
Oman
Sultanate of Oman. 2011. Time use survey for the period 20/05/2007-19/05/2008. Presented at the Arab Time Use statistics workshop, Amman, 25-28 April.
State of Palestine
Palestinian Bureau of Statistics. 2000. Time Use in the Palestinian Territory: Main Findings of Survey 1999-2000. Ramallah.
Palestinian Bureau of Statistics. 2014. Main Findings of Time Use Survey 2012/13. Ramallah.
Tunisia
République Tunisienne, Ministère des Affaires de la Femme. 2011. Budget temps des femmes et des hommes en Tunisie, 2005-06. Tunis.
Turkey
Turkstat. 2007. “Results of the Time Use Survey 2006.” Press Release No. 119, 25 July. Ankara. See tables for more details.
ASIA
Armenia
National Statistical Service of the Republic of Armenia. 2005. Armenia time use pilot survey, 2004 July 1-31. Yerevan.
____. 2009. Report on Time Use Sample Survey in the Republic of Armenia, 2008 October 1-31. Yerevan.
Time Use Across the World: Findings of a World Compilation of Time Use Surveys
2015 Human Development Report Office
BACKGROUND PAPER 93
Cambodia
Hang Lina. 2013. “2004 time use survey in Cambodia.” International seminar on gender statistics, Incheon, Republic of Korea, 12-14 November.
Uy Bossadine. 2005. “Time Use Profile of Cambodia 2004.” Workshop of final statistical analyses of CSES 2003-04, Phnom Penh Hotel, 16-17 June.
China
Liu Wei. 2010a. “2008 time use survey in China.” International Workshop on Social Statistics, Beijing, China, 22-24 November.
____. 2010b. “Unpaid Housework, Women Burden More.” Global Forum on Gender Statistics, Manila, Philippines, 11-13 October.
National Bureau of Statistics. 2009. Time Use Patterns in China: Abstract of the 2008 Time Use Survey. China Statistics Press.
Xiao-Yuan Dong and Xinli An. 2012. Gender Patterns and Value of Unpaid Work, Findings from China’s First Large-Scale Time Use Survey. UNRISD Research Paper. Geneva.
India
Gupta, P. 2007. Time Use Survey in India.
Ministry of Statistics and Programme Implementation. 2000. Report of the India Time Use Survey 1998. New Delhi.
Narasimhan, R. L., and R. N. Pandey. 1999. Some main results of the pilot time use survey in India and their policy implications. New Delhi.
Pandey, R. N. 1999. Operational Issues in Conducting the Pilot Time Use Survey in India. Delhi.
Rajivan, A. 1999. “Policy Implication for Gender Equity: The India Time Use Survey 1998-1999.” International Seminar on Time Use Surveys, Ahmedabad, 7-10 December.
Republic of Korea
Jonghee Choi. 2009. “New Approaches of the 2009 Korean Time Use Survey.” Paper presented at the IATUR Conference.
Tables for time use surveys 2001, 2004 and 2009.
Kyrgyzstan
National Statistics Committee. 2014. Results of the time use survey in Kyrgyzstan, 2010. Presented at the Time Use Survey Data Analysis Workshop, Bangkok, 11-15 October.
Mongolia
NSO (National Statistical Office of Mongolia). 2009. Report of the time-use survey 2007. Ulanbaatar: NSO and UNDP.
____. 2014. Time Use Survey Mongolia. Presented at the Time Use Survey Data Analysis Workshop, Bangkok, 11-15 October.
Pakistan
Federal Bureau of Statistics. 2009. Time Wse Survey 2007. Islamabad.
Thailand
National Statistical Office. 2014. The time use survey in Thailand. Presented at the Time Use Survey Data Analysis Workshop, Bangkok, 11-15 October.
Tables for time use surveys 2001, 2004 and 2009.
General references
OECD (Organisation for Economic Co-operation and Development). 2012. “How Do People in the Asia/Pacific Region Spend their Time?” In Society at a Glance: Asia/Pacific 2011. Paris: OECD Publishing.
____. 2014. “Time use across the world.” Gender data portal.
LATIN AMERICA
Brazil
Time Use Across the World: Findings of a World Compilation of Time Use Surveys
2015 Human Development Report Office
94 BACKGROUND PAPER
IBGE (Instituto Brasileiro de Geografia e Estadistica). 2014. First Results of the Brazilian Pilot Time Use Survey 2009. Presented at the 5th Forum on Gender Statistics, Aguascalientes, Mexico, 3-5 November.
Colombia
DANE (Departamento Administrativo Nacional de Estadistica). 2013. “Encuesta nacional de uso del tiempo (ENUT), Año 2012-2013 Datos definitivos.” Diciembre 5 de 2013, Boletin de Prensa, Bogota.
____. 2014. Medición de la Economía del Cuidado. Bogota.
Data are available at the DANE website.
Costa Rica
Comisión Técnica Interinstitucional de Contabilización del Trabajo Femenino. 2008. ¿2 + 2 = 6? El trabajo que hacen mujeres y hombres en Costa Rica no se cuenta igual. Principales Resultados del Módulo de Uso del Tiempo 2004. San José.
Cuba
Oficina Nacional de Estadísticas. 2002. Encuesta sobre el uso del tiempo. La Habana.
Ecuador
INEC (Instituto Nacional de Estadistica y Census). 2013a. Metodologia de la Encuesta Especefica de Uso del Tiempo 2013. Quito.
____. 2013b. Plan de tabulados EUT.
____. 2014. Encuesta de Uso del Tiempo. Quito.
El Salvador
Dirección General de Estadística y Censos. 2012. Principales Resultados de Encuesta del Uso del Tiempo.
Mexico
INEGI (Instituto Nacional de Estadistica y Geografia). 2005. Encuesta Nacional sobre el Uso del Tiempo ENUT 2002, Tabulados básicos definitivos. Aguascalientes.
____. 2010a. Clasificación mexicana de actividades de uso del tiempo CMAUT. Aguascalientes.
____. 2010b. Encuesta Nacional sobre el Uso del Tiempo ENUT 2009, Metodología y tabulados básicos. Aguascalientes.
Tables are available at the INEGI website.
Panama
INEC (Instituto Nacional de Estadistica y Censo). 2013a. Encuesta De Uso Del Tiempo, Commentarios.
____. 2013b. Encuesta De Uso Del Tiempo, Sintesis metodologica y indicadores generados.
____. 2013c. Informe Sobre La Planificación Y Ejecución De La Encuesta De Uso Del Tiempo.
Tables are available at the INEC website.
Peru
INEI (Instituto Nacional de Estadistica e Informatica). 2011. Encuesta Nacional De Uso Del Tiempo 2010, Principales Resultados. Lima.
Uruguay
INE (Instituto Nacional de Estadistica). 2008. Uso del tiempo y trabajo no remunerado en el Uruguay, Módulo de la Encuesta Continua de Hogares. Septiembre 2007. Montevideo.
____. 2014. Uso Del Tiempo Y Trabajo No Remunerado En Uruguay 2013.
EUROPE
Several countries offer the opportunity for creating tables on their website. Links are listed by country name.
Belgium
Estonia
Finland
Netherlands
Norway
Portugal
Spain
Sweden
Multinational websites
Time Use Across the World: Findings of a World Compilation of Time Use Surveys
2015 Human Development Report Office
BACKGROUND PAPER 95
Time use and lifestyle
HETUS
OECD
OECD gender data portal
Centre for Time Use Research, University of Oxford
UN Statistics Division
Austria
Statistik Austria. 2009. Zeitverwendung 2008/09, Ein Überblick über geschlechtsspezifische Unterschiede. Wien.
Belgium
Glorieux, I., J. Minnen and T. P. van Tienoven. 2008. Une semaine en Belgique. Résultats de l’enquête 2005 sur l’emploi du temps en Belgique EET’05. Brussels: Vrije Universiteit.
France
Dumontier, F., et J. L. Pan Ké Shon. 2000. Enquête emploi du temps 1998-99, Description des activités quotidiennes. INSEE Résultats. Paris.
Ricroch, L., et B. Roumier. 2011. Depuis 11 ans, moins de tâches ménagères, plus d’Internet. INSEE Première, No. 1377. See tables for more details.
Greece
ELSTAT (Hellenic Statistical Authority). 2014. Time Use Survey 2013-14. Press release. Athens.
Ireland
Mc Ginnity, F., H. Russell, J. Williams and S. Blackwell. 2005. Time Use in Ireland 2005, Survey Report. Dublin.
Italy
Istat (Italian National Institut of Statistics). 2007. L'uso del tempo, Indagine multiscopo sulle famiglie "Uso del tempo" Anni 2002-2003. Tables and survey 2008-2009.
Norway
Tables online at SSB Norway.
Portugal
Instituto National de Estatistica. 2001. Inquérito à Ocupação do Tempo, Principais Resultados 1999. Lisboa.
Spain
Instituto Nacional de Estadistica. 2004. Encuesta de Empleo del Tiempo 2002-2003, Tomo
I.Resultados Nacionales. Madrid.
Sweden
Statistics Sweden. 2003. Tid förvardagsliv, Kvinnors och mäns tidsanvändning 1990/91 och 2000/01 (Time for everyday life, Women s and men s time use 1990/91 and 2000/01). Living Conditions Report No. 99.
____. 2012. Nu för tiden, En undersökning om svenska folkets tidsanvändning år 2010/11 (Swedish Time Use Survey 2010/11). Living Conditions Report No. 123.
United Kingdom
Lader, D., S. Short and J. Gershuny. 2006. The Time Use Survey 2000, How we spend our time. London: Office for National Statistics.
General
EUROSTAT. 2004. How Europeans spend their time, Everyday life of women and men 1998-2002. Luxemburg.
TRANSITION COUNTRIES
Albania
Institute of Statistics. 2011. Albania Time Use Survey 2010-2011. Tirana.
Bulgaria
National Statistical Institute. 2011. 2009-2010 Time Use Survey, Basic Results. Sofia.
For more information, see online tables
Estonia
Tables can be created online.
Former Yugoslave Republic of Macedonia
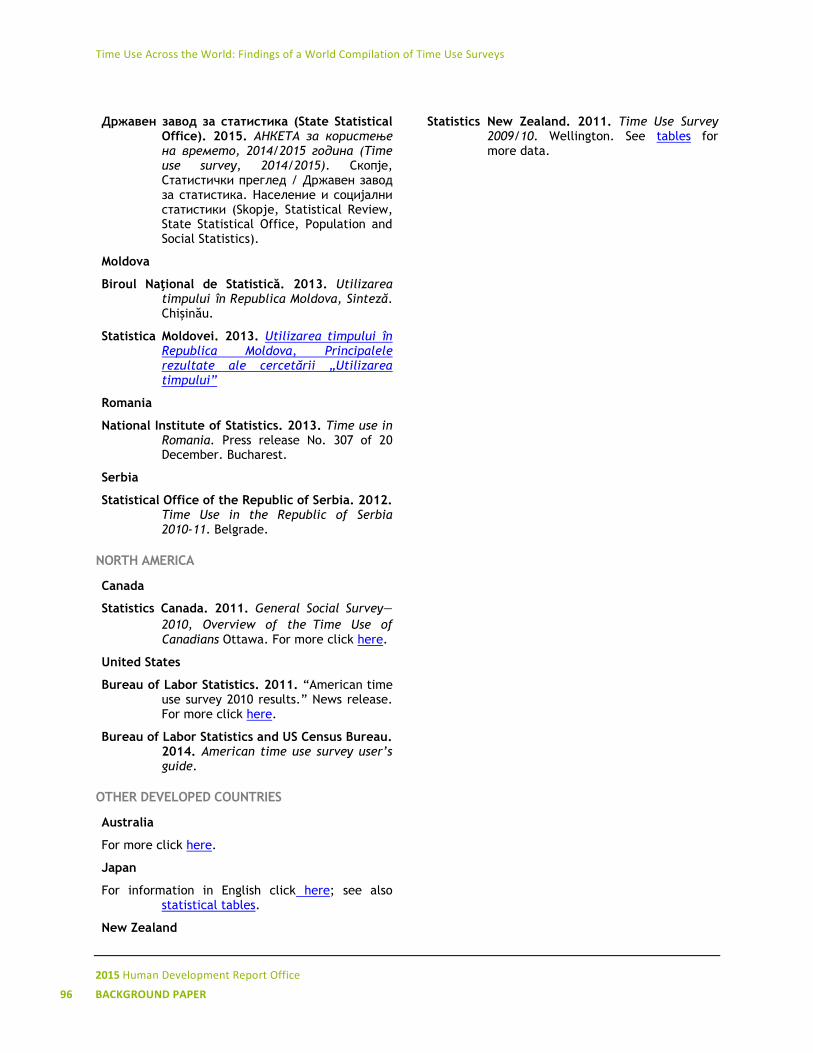
Time Use Across the World: Findings of a World Compilation of Time Use Surveys
2015 Human Development Report Office
96 BACKGROUND PAPER
Државен завод за статистика (State Statistical Office). 2015. АНКЕТА за користење на времето, 2014/2015 година (Time use survey, 2014/2015). Скопје, Статистички преглед / Државен завод за статистика. Население и социјални статистики (Skopje, Statistical Review, State Statistical Office, Population and Social Statistics).
Moldova
Biroul Naţional de Statistică. 2013. Utilizarea timpului în Republica Moldova, Sinteză. Chişinău.
Statistica Moldovei. 2013. Utilizarea timpului în Republica Moldova, Principalele rezultate ale cercetării „Utilizarea timpului”
Romania
National Institute of Statistics. 2013. Time use in Romania. Press release No. 307 of 20 December. Bucharest.
Serbia
Statistical Office of the Republic of Serbia. 2012. Time Use in the Republic of Serbia 2010-11. Belgrade.
NORTH AMERICA
Canada
Statistics Canada. 2011. General Social Survey—
2010, Overview of theTime Use of Canadians Ottawa. For more click here.
United States
Bureau of Labor Statistics. 2011. “American time use survey 2010 results.” News release. For more click here.
Bureau of Labor Statistics and US Census Bureau. 2014. American time use survey user’s guide.
OTHER DEVELOPED COUNTRIES
Australia
For more click here.
Japan
For information in English click here; see also statistical tables.
New Zealand
Statistics New Zealand. 2011. Time Use Survey 2009/10. Wellington. See tables for more data.
UNDP Human Development Report Office 304 E. 45th Street, 12th Floor New York, NY 10017, USA Tel: +1 212-906-3661 Fax: +1 212-906-5161 http://hdr.undp.org/ Copyright © 2015 by the United Nations Development Programme 1 UN Plaza, New York, NY 10017, USA All rights reserved. No part of this publication may be reproduced, stored in a retrieval system or transmitted, in any form or by any means, electronic, mechanical, photocopying, recording or otherwise without prior permission. This paper does not represent the official views of the United Nations Development Programme, and any errors or omissions are the authors’ own.