Embed Size (px)
Citation preview

11
Sept
embe
r 20
16
Time to Degree:A National View of the
Time Enrolled and Elapsed for Associate and Bachelor’s Degree Earners

© 2016 National Student Clearinghouse. All rights reserved. 1
Time to Degree: A National View of the Time Enrolled and Elapsed for Associate and Bachelor’s Degree Earners
This report examines time to degree completion for a cohort of students who earned an associate degree as their
first and only postsecondary degree or a bachelor’s degree as their first four-year degree between July 1, 2014, and
June 30, 2015. Overall, the average time enrolled for associate and bachelor’s degree earners was 3.3 years and
5.1 years, respectively. However, as the report shows, the time required for successful degree attainment could be
influenced by the pathway the student followed as well as by factors, such as stop outs and less than full-time
enrollment status.
Suggested Citation: Shapiro, D., Dundar, A., Wakhungu, P.K., Yuan, X., Nathan, A, & Hwang, Y. (2016,
September). Time to Degree: A National View of the Time Enrolled and Elapsed for Associate and Bachelor’s
Degree Earners (Signature Report No. 11). Herndon, VA: National Student Clearinghouse Research Center.
Table of Contents
About This Report Introduction and Purpose of the Report
o Literature Review o A Note on the Data
Data Source Time-to-Degree Definition
Results o Overall Patterns o Average Time to Degree with/without an Associate Degree o Average Time to Degree with/without Prior Dual Enrollment o Total Enrolled Time and Number of Institutions Attended o Total Time Enrolled and Number of Stop Outs
Discussion o Major Findings
Enrolled Time to Degree Elapsed Time to Degree Differences in Time to Degree by Age Time to Degree for Bachelor’s Degree Earners with/without a Prior Associate Degree or
Prior Enrollments in Two-Year Institutions Time to Degree for Degree Earners with/without Dual Enrollment Enrolled Time to Degree by Elapsed Time
NOTE: Please ignore the “Click
to Enlarge” instructions next to
the figures. This option only
works in the online version of
the report, which is available at
http://nscresearchcenter.org/.

© 2016 National Student Clearinghouse. All rights reserved. 2
Time to Degree and Number of Institutions Attended Time to Degree and Number of Stop Outs Final Thoughts and Implications
References Appendix A: Methodological Notes Appendix B: Coverage Tables.
Download from https://nscresearchcenter.org/wp-content/uploads/Signature11AppendixB.xlsx Appendix C: Results Tables.
Download from https://nscresearchcenter.org/wp-content/uploads/Signature-11AppendixC.xlsx
About This Report
AUTHORS
National Student Clearinghouse Research Center Doug Shapiro
Afet Dundar
Project on Academic Success, Indiana University Phoebe Khasiala Wakhungu
Xin Yuan
Angel Nathan
Youngsik Hwang
ACKNOWLEDGEMENTS
The authors would like to thank Victor Borden, director of Project on Academic Success and Professor of Higher
Education and Student Affairs at Indiana University Bloomington for his thoughtful comments and suggestions;
and the team members of the National Student Clearinghouse Research Center, Faye Huie for her assistance
with editing sections of the report and Joe Bloom for his work to make the Clearinghouse data analysis ready.
SPONSOR
This report was supported by a grant from the Lumina Foundation. Lumina Foundation, an Indianapolis-based
private foundation, is committed to enrolling and graduating more students from college — especially 21st century
students: low-income students, students of color, first-generation students and adult learners. Lumina’s goal is to
increase the percentage of Americans who hold high-quality degrees and credentials to 60 percent by 2025.
Lumina pursues this goal in three ways: by identifying and supporting effective practice, through public policy
advocacy, and by using our communications and convening power to build public will for change. For more
information, log on to www.luminafoundation.org.

© 2016 National Student Clearinghouse. All rights reserved. 3
Introduction and Purpose of the Report
The time between initial enrollment in a postsecondary institution and graduation with a college degree is
considered to be an important indicator of student success (California Postsecondary Education Commission,
2006). Traditionally, students were considered successful when they graduated “on time,” which meant within two
years or four years at a two- or four-year degree-granting institution, respectively. However, for a majority of
postsecondary students, time-to-degree completion has increased over the past 30 years (Bound, Lovenheim, &
Turner, 2012; Knight, 2002, 2004). Trends in the late 1970s highlighted higher education students’ increased time
to degree (California Postsecondary Education Commission, 1988). In fact, the Complete College America (2014)
report revealed that less than 50 percent of full-time students graduate within four years at public four-year
institutions. The proportion of “on time” graduation at community colleges was even lower, with only 5 percent of
students who started out with full-time course loads graduating with an associate degree within two years.
The change in traditional timelines for college completion can become expensive when viewed in terms of college
costs, taxpayers’ subsidies, and the wages students forfeit with each additional semester of enrollment
(DesJardins, Ahlburg, & McCall., 2002; Gilmore & Hoffman, 1997). Although the majority of postsecondary
students are now taking longer to complete college, extended periods of enrollment are even more common for
students who are academically unprepared at the start (Bound, Lovenheim, & Turner, 2012).
Previous research highlighted various complex factors linked to increases in time to degree. They include reduced
institutional resources available to students; rising college costs (Bound, Lovenheim, & Turner, 2012); remediation
requirements (Bettinger, 2008; Ishitani, 2006; The Campaign for College Opportunity, 2014); taking more courses
than is required, enrolling in non-degree classes, and difficulty in getting required courses (The Campaign for
College Opportunity 2014); changing majors (California Postsecondary Education Commission, 1988); need for
employment (Bound, Lovenheim, & Turner, 2012; California Postsecondary Education Commission, 1988; The
Campaign for College Opportunity, 2014); and reduced course loads (Knight, 2002, 2004); among other factors.
This report builds upon the previous findings and expands them to include enrollments across multiple institutions
(as opposed to considering only terms from the same school where the degree was earned) and provides the
outcomes for different subgroups of students by age, gender, and enrollment intensity. Overall, a number of goals
guided this report: 1) explore the various enrollment pathways of students who received a bachelor’s and/or an
associate degree, as growing numbers of students transfer and graduate elsewhere; 2) determine how these
pathways influenced the time required for successful degree attainment; and 3) examine the effects of the
growing prevalence of student enrollment behaviors that include periods of stop out and enrollments at less than
full-time status.
Using student-level data from the National Student Clearinghouse (NSC), we measured time to degree with two
different metrics: 1) the time that elapsed between students’ first term date and degree award date and 2) the total
time of active enrollment. Understanding enrollment pathways can help administrators develop interventions to
help students more successfully and quickly complete a degree. Reducing time to degree will likely increase
graduation rates, as well as other costs related to extended time in college (Attewell & Monaghan, 2016; Jones,
2015). However, we also recognize that a longer time to degree may not be solely in control of the institutions or
policymakers. It may also be an effect of the changing economic, social, and cultural circumstances of students.

© 2016 National Student Clearinghouse. All rights reserved. 4
For this reason, our hope is that the potential impact of the report is not limited to developing measures to reduce
time to degree. We would also like it to provide a means by which policymakers gain insight into better serving the
needs of students who are not on the traditional path and avoid considering them to be “failures” simply because
they took a longer time to finish.
LITERATURE REVIEW
Various studies have identified factors that contribute to increased time-to-degree completion. One of these
factors includes the increased need for remedial education programs (Bettinger & Long 2009; Ishitani, 2006). At
community colleges, about 60 percent of incoming freshmen are placed into at least one remedial course, with
many having multiple areas of remediation needs (Bailey & Cho, 2010). Although remediation plays an important
role in addressing the needs of underprepared students, the additional curricular requirements will likely increase
time to degree while decreasing the likelihood of college completion (Bettinger & Long, 2009). This issue is
especially impactful on community college students, who are already graduating at lower rates than their
counterparts at four-year institutions (Bailey & Cho, 2010; Complete College America, 2014; Proudfit, 2014).
Furthermore, the dissonance between community college and four-year institutions’ curricular offerings results not
only in a loss of credits, but also highlights the transitional issues between academic environments and cultures in
higher education (Johnson, 2011).
Other studies have shown that students who began postsecondary education at less selective public universities
and community colleges and those with a greater financial need had the longest time to degree (Astin, 2006;
Bound, Lovenheim, & Turner, 2012., 2012; Messer & Wolter, 2010; Oseguera, 2006; Runyan, 2011; Wei & Horn,
2009). Specifically, students may have difficulty affording a full course load due to increasing college costs and
limited federal and state financial assistance (Lau, 2003). To ameliorate financial hardships, students seek paid
employment to pay their way through college (Bound, Lovenheim, & Turner, 2012, Johnson, 2011), which can
increase time-to-college completion as well as distract students from college studies. Although factors, such as
financial aid, have been examined to determine whether they affect time to degree, the findings have been
inconclusive. For instance, Lam (1999) found that students who took loans to pay for their educational expenses,
but had no employment, took less time to graduate than those who took loans and were employed. However,
Knight and Arnold (2000) found that receiving need-based and non-need-based loans slightly increased
semesters enrolled to degree, but decreased semesters elapsed.
In terms of enrollment intensity, researchers generally agree that full-time continuously enrolled students are more
likely to graduate than part-time discontinuously enrolled students (Belcheir, 2000; Camara, 2003; Jones, 2015;
O’Toole, Stratton, & Wetzel, 2003). However, there are also variations within full-time status that differentially
impact time to degree. For instance, Volkwein and Lorang (1996) found that full-time students who enrolled in less
than 15 credits took more than four years to graduate than those full-time students with heavier course loads.
Some of the reasons for extended time to degree were linked to outside employment and family responsibilities.
Equally, for the increasing number of postsecondary students who transfer between institutions before earning a
degree such mobility, due to course and credit transferability issues, can increase time to degree (Anderson,
2015; Borden, 2004; Bradburn, Beger, Xiaojile, Katharin, & Rooney, 2003; Friedel & Wilson, 2015; Hossler et al.,
2012; Marling, 2013; Shapiro et al., 2015). In fact, a little over a third of first-time freshmen enroll in more than one
institution before finishing their degree within six years (Shapiro et al., 2015).
In an effort to limit time to degree, some states and institutions have restructured institutional and legislative
policies (Contomichalos, 2014; Johnson, 2011). Florida has attempted to address these issues by passing
legislation to standardize degree requirements, in an effort to increase the transferability of credits across state
institutions (LeMon & Pitter, 1996). With over 600 degree programs requiring different credit hours to degree

© 2016 National Student Clearinghouse. All rights reserved. 5
completion, Florida has also reduced the requirements in most bachelor’s degree programs to 120 credit hours to
help students avoid accumulating unnecessary credits (Pitter, LeMon & Lanham, 1996). Indiana has created an
online library that provides a list of courses that transfer among all Indiana public colleges (Indiana Core Transfer
Library, 2016). In addition to legislative policy changes, institutions are beginning to provide course selection
resources, such as program maps, to help students determine which courses count towards their degree and
which do not (Degree Road Maps, 2016). Others have outreach programs targeting student populations with
lower persistence and graduation rates (California Postsecondary Education Commission, 2006).
In general, researchers and institutional leaders agree that time to degree is an important topic to address as an
indicator of student success. In line with the completion agenda, understanding the average time to degree and
the pathways that students pursue may help institutional leaders and policymakers reevaluate present policies in
place to facilitate the U.S.’s progress toward the goal of achieving the highest proportion of college graduates in
the world by 2020 (Obama, 2009).
A NOTE ON THE DATA
The report describes students’ pathways to degree completion for a cohort of students who earned an associate
degree as their first and only postsecondary degree or a bachelor’s degree as their first four-year degree between
July 1, 2014, and June 30, 2015. Only degrees from schools for which the Clearinghouse had enrollment records
for at least the prior 10 years were retained in the cohort.
Data Source
The data for this report were drawn from the StudentTracker® and DegreeVerifySM services, administered by the
National Student Clearinghouse® (the Clearinghouse), which tracks college enrollments nationwide across all
postsecondary institutions, including all institution types: two-year and four-year institutions, public and private
institutions, and nonprofit and for-profit institutions. The National Student Clearinghouse® (the Clearinghouse) is a
unique and trusted source for higher education enrollment and degree verification. Currently, Clearinghouse data
include more than 3,600 postsecondary institutions and 96.5 percent of U.S. postsecondary enrollments. The
Clearinghouse has a 23-year track record of providing automated student enrollment and degree verifications.
Due to the Clearinghouse’s unique student-level record approach to data collection, the Clearinghouse data
provides opportunities for robust analysis not afforded by the more commonly used institution-level national
databases.
Time-to-Degree Definition
Time to degree was defined in two different ways:
1. Time elapsed was defined as the total time, in calendar years, between initial enrollment in a
postsecondary institution and subsequent degree attainment, regardless of whether or not the student
was actually enrolled.
2. Time enrolled was defined in terms of the number of weeks that are equivalent to one academic year (30
weeks) of active, full-time enrollment. For example, four semesters of full-time enrollment are equivalent
to two academic years of enrollment whereas four semesters of half-time enrollment are equivalent to one
year of enrollment. See Appendix A for more on the advantages and limitations of defining the enrolled
time in terms of academic years.

© 2016 National Student Clearinghouse. All rights reserved. 6
Dual enrollments, which are enrollments before the student was 18 years old, were not included in either
definition. (For a full discussion of data, definitions, and limitations, please see Appendix A.)
Figure I1 shows the distribution of associate and bachelor’s degrees among the degree earners included in the
cohort.
Figure I2 shows the distribution of degree earners by degree level and institution type.
Figure I3 shows the distribution of associate and bachelor’s degree earners by age at first entry.
For a full description of the cohort, please see Appendix C.
Results
OVERALL SIX-YEAR OUTCOMES
OVERALL PATTERNS
The results are reported for students who received their first associate and/or bachelor’s degrees between July 1,
2014, and June 30, 2015 (N = 2,047,696). Time-to-degree analyses on associate (N = 573,014) and bachelor’s (N
= 1,474,682) degree recipients were conducted separately.
Two strategies were used to define time to degree: time enrolled (number of academic years defined as 30 weeks
of full-time or full-time equivalent enrollment) and time elapsed (number of calendar years between the first term
begin date and the date of degree completion). More on data definitions can be found in Appendix A.
Figures 1 through 5 show outcomes for degree earners by:
Institution type
Age and institution type
Gender and institution type
Overall, analysis showed that the average time enrolled for associate and bachelor’s degree earners was 3.3
years and 5.1 years, respectively. The average elapsed time was 5.5 years for associate and 5.7 years for
bachelor’s degree earners (see Figure 1 for average time to degree for specific institution types). All associate
and bachelor’s degree earners, except those at four-year private nonprofit institutions, remained enrolled for an
average of one year or more on top of the prescribed “on time graduation” definition of two or four year
institutions. In fact, among associate degree earners from two-year public institutions, only 14.7 percent received
their degrees in two calendar years and only 7.4 percent had two academic years of full-time or full-time
equivalent enrollment. Among bachelors’ degree earners from four-year public institutions, 37.5 percent received
their degrees in four calendar years and only 10.1 percent had four academic years of full-time or full-time

© 2016 National Student Clearinghouse. All rights reserved. 7
equivalent enrollment (for selected results, see Tables R1 and R2 below; for complete results, see Tables 7-10 in
Appendix C).
Table R1. Distribution of Associate Degree Earners from Two-Year Public Institutions by Total Time Elapsed (N=419,317)
n %
2 Years 61,623 14.7%
3 Years 85,832 20.5%
4 Years 64,561 15.4%
5-6 Years 77,011 18.4%
More than 6 Years 130,290 31.1%
Table R2. Distribution of Bachelor’s Degree Earners from Four-Year Public Institutions by Total Time Elapsed (N=1,020,430)
n %
4 Years 382,565 37.5%
5 Years 264,678 25.9%
6 Years 121,960 12.0%
7-8 Years 105,896 10.4%
More than 8 Years 145,331 14.2%
Among four-year institutions, those at four-year private for-profit institutions, showed the highest average elapsed
time in calendar years (8.8 years) and average enrolled time in academic years (5.8 years) to degree (Figure 1).
At four-year public and four-year private nonprofit institutions, both traditional-age students and students 20 or
older at first entry, were enrolled for an average of 4.8 academic years. At four-year private for-profit institutions,
younger students had the highest average elapsed time (10.2 years), in comparison to those at four-year public or
private nonprofit institutions. Interestingly, average time enrolled was similar to average elapsed time for students
age 20 or younger who attended four-year public or four-year private nonprofit institutions (Figure 2). In general,
regardless of institution type, men and women had similar average enrolled and elapsed time suggesting little
gender differences in time-to-degree (Figure 3).

© 2016 National Student Clearinghouse. All rights reserved. 8
In general, associate and bachelor’s degree earners’ average time enrolled increased as the elapsed time in
calendar years increased, regardless of the institution type (Figures 4 and 5). When the elapsed time increased
from four calendar years to five calendar years, the average enrolled time also increased from slightly over four
academic years to slightly over five academic years. The increase in the average enrolled time was not as
dramatic when the elapsed time increased from five to six or more calendar years.
Figure 1. Time to Degree for Associate (N=573,014) and Bachelor’s (N=1,474,682) Degree Earners by Type of Institution where Degree was Received*
*This figure is based on data shown in Appendix C, Table 1a and Table 2a.

© 2016 National Student Clearinghouse. All rights reserved. 9
Figure 2. Time to Degree for Associate (N=564,263) and Bachelor’s (N=1,470,652) Degree Earners by Age and Type of Institution where Degree was Received*
*This figure is based on data shown in Appendix C, Table 1b and Table 2b.
Note: Students with missing age data were excluded from the above figure.
Figure 3. Time to Degree for Associate (N=540,117) and Bachelor’s (N=1,384,497) Degree Earners by Gender and Type of Institution where Degree was Received*
*This figure is based on data shown in Appendix C, Table 1c and Table 2c.
Note: Students with missing gender data were excluded from the above figure.

© 2016 National Student Clearinghouse. All rights reserved. 10
Figure 4. Average Enrolled Time by Total Elapsed Time for Two-Year Public Associate Degree Earners (N=419,317)*
*This figure is based on data shown in Appendix C, Table 22a.
Figure 5. Average Enrolled Time by Total Elapsed Time for Bachelor’s Degree Earners (N=1,474,536)*
*This figure is based on data shown in Appendix C, Table 22b.

© 2016 National Student Clearinghouse. All rights reserved. 11
AVERAGE TIME TO DEGREE WITH/WITHOUT AN ASSOCIATE DEGREE
On average, time to degree was extended for students who had an associate degree prior to receiving their
bachelor’s, both in terms of time enrolled and time elapsed regardless of the institution type (Figure 6). The
average time of active enrollment was higher for those who graduated with an associate degree than without one
(5.7 years and 5.0 years, respectively). The difference in average time elapsed was even more dramatic: students
with an associate degree took 8.2 years to graduate with a bachelor’s degree, whereas students without an
associate degree took 5.1 years, resulting in a 3.1 year difference between those with and without an associate
degree.
It should be noted, however, that the bachelor’s degree earners who had no prior associate degree may or may
not have been transfer students in this report. Bachelor’s degree earners in this study might have been native
students to the four-year institution where they received their degree. For this reason, we also examined time to
degree separately for those bachelor’s degree earners with and without prior enrollment in two-year institutions, if
they had no prior associate degree.
For bachelor’s degree earners without a prior associate degree but with prior two-year enrollments, the average
time of active enrollment was 5.3 academic years completed in 6.0 calendar years while for their peers without
any prior two-year enrollments, the average enrolled time was 4.8 academic years completed in 4.5 calendar
years (see Table 3b.2, Appendix C) .
Figure 6. Time to Degree for Bachelor’s Degree Earners with/without an Associate Degree by Type of Institution where Bachelor’s Degree was Received (N=1,474,682)*
*This figure is based on data shown in Appendix C, Table 3a.1.

© 2016 National Student Clearinghouse. All rights reserved. 12
Figure 7. Time to Degree for Bachelor’s Degree Earners with/without an Associate Degree by Age and Type of Institution where Bachelor’s Degree was Received (N=1,470,652)*
*This figure is based on data shown in Appendix C, Table 3b.
Note: Students with missing age data were excluded from the above figure.
When results were disaggregated by age, degree earners who were at traditional age at first entry and without an
associate degree were, on average, enrolled for a shorter time than those with an associate degree, regardless of
the institution type (Figure 7). In general, for both age groups, the average time elapsed was higher among
students with an associate degree than those without. The two highest elapsed times were among bachelor’s
degree recipients from four-year private for-profit institutions who entered college at a traditional college age (10.9
calendar years to degree) and bachelor’s degree recipients from four-year public institutions entering college later
in life (9.5 calendar years to degree) (Figure 7).
AVERAGE TIME TO DEGREE WITH/WITHOUT PRIOR DUAL ENROLLMENT
Figures 8 and 9 present the time-to-degree findings for associate and bachelor’s degree earners with or without
prior dual enrollment. Overall, results indicated that former dual enrolled students had a shorter time to degree,
both in terms of average years enrolled and elapsed, than students who were not dually enrolled. This was an
expected result given that dual enrolled students earn some college credits prior to entering a postsecondary
institution. For associate degree earners, on average, time enrolled was shorter for those who had prior dual
enrollment (3.0 years) than those without (3.5 years, Figure 8). Average elapsed time in calendar years, was
longer for associate degree earners without dual enrollment (6.0 years) than those with dual enrollment (4.2
years) (Figure 8).
When the relationship between dual enrollment and time to degree was examined by institution type (Figure 9),
the average enrolled time was higher among degree earners from private for-profit institutions, both with and
without prior dual enrollment (6.0 and 5.8 years, respectively), compared to those who had completed their
degree at a public or private nonprofit institution, regardless of dual enrollment status (i.e., 4.6 to a maximum of
5.3 years). Further, the average time elapsed showed the same trend among bachelor’s degree earners from
four-year institutions. For example, students with and without prior dual enrollment from four-year private for-profit
institutions had on average much higher elapsed time (8.6 years and 8.9 years, respectively), than students who

© 2016 National Student Clearinghouse. All rights reserved. 13
earned their degrees from four-year public or four-year private nonprofit institutions (i.e., from 4.5 to a maximum
of 5.9 average years).
Figure 8. Time to Degree for Two-Year Public Associate Degree Earners with/without Dual Enrollment (N=420,539)*
*This figure is based on data shown in Appendix C, Table 5a.
Figure 9. Time to Degree for Bachelor’s Degree Earners with/without Dual Enrollment by Type of Institution where Degree was Received (N=1,472,405)*
*This figure is based on data shown in Appendix C, Table 5f.

© 2016 National Student Clearinghouse. All rights reserved. 14
TOTAL ENROLLED TIME AND NUMBER OF INSTITUTIONS ATTENDED
Figures 10 through 15 show the number of institutions attended by associate and bachelor’s degree earners
from two-year public, four-year public and four-year private institutions for different categories of enrolled time.
The results consistently show a multiple-institution attendance pattern for all degree earners. For example, even
among those associate degree earners who had two academic years of enrollment, more than one in four
attended two or more institutions (Figure 10). Fewer than half of bachelor’s degree earners from four-year public
institutions attended only one institution (43.4 percent) (Figure 12).
While the pattern of multiple institution attendance holds regardless of age at first entry or institution type, there
are many differences in the proportion of degree earners who attended one versus more than one institution,
depending on the age at first entry (Figures 11 and 13).
Figure 10. Percentage of Associate Degree Earners from Two-Year Public Institutions by Total Enrolled Time and Number of Institutions Attended (N=420,209)*
*This figure is based on data shown in Appendix C, Table 6a.

© 2016 National Student Clearinghouse. All rights reserved. 15
Figure 11. Percentage of Associate Degree Earners from Two-Year Public Institutions by Total Enrolled Time, Number of Institutions Attended and Age (N=416,992)*
*This figure is based on data shown in Appendix C, Table 6b.
Note: Students with missing age data were excluded from the above figure.
Figure 12. Percentage of Bachelor’s Degree Earners from Four-Year Public Institutions by Total Enrolled Time and Number of Institutions Attended (N=1,022,446)*
*This figure is based on data shown in Appendix C, Table 8a.

© 2016 National Student Clearinghouse. All rights reserved. 16
Figure 13. Percentage of Bachelor’s Degree Earners from Four-Year Public Institutions by Total Enrolled Time, Number of Institutions Attended and Age (N=1,019,991)*
*This figure is based on data shown in Appendix C, Table 8b.
Note: Students with missing age data were excluded from the above figure.
Figure 14. Percentage of Bachelor’s Degree Earners from Four-Year Private Nonprofit Institutions by Total Enrolled Time and Number of Institutions Attended (N=380,428)*
*This figure is based on data shown in Appendix C, Table 10a.

© 2016 National Student Clearinghouse. All rights reserved. 17
Figure 15. Percentage of Bachelor’s Degree Earners from Four-Year Private For Profit Institutions by Total Enrolled Time and Number of Institutions Attended (N=71,420)*
*This figure is based on data shown in Appendix C, Table 12a.
TOTAL TIME ENROLLED AND NUMBER OF STOP OUTS
Figures 16 through 23 are in reference to the percentage of degree earners by total time enrolled and number of
stop outs for associate and bachelor’s degree earners. Overall, regardless of age and institution type, number of
stop outs and time to degree were positively related, where a higher number of stop outs resulted in a higher time
to degree. For example, out of all bachelor’s degree earners from four-year public institutions with five academic
years of total enrolled time 73.1 percent did not stop out at all whereas 3.7 percent had at least three or more stop
outs. In contrast, among those with eight or more academic years of enrolled time, fewer than a quarter (23.9
percent) had no stop outs, while slightly over half (51.3 percent) had two or more stop outs (Figure 18 below, also
see Tables 14-21, Appendix C for further details).
Disaggregating the total time enrolled and number of stop outs by age at first entry into college shows that among
bachelor’s degree earners from four-year public or private nonprofit institutions, a higher proportion of traditional-
age students completed their degree without any stop outs than students who started college later in life,
regardless of the time of active enrollment. For example, among bachelor’s degree earners from four-year public
institutions who had four academic years of active enrollment, 63.6 percent of those who started college at a
traditional age had no stop outs versus 48.8 percent of those who were over 20 when they started (Figure 21).
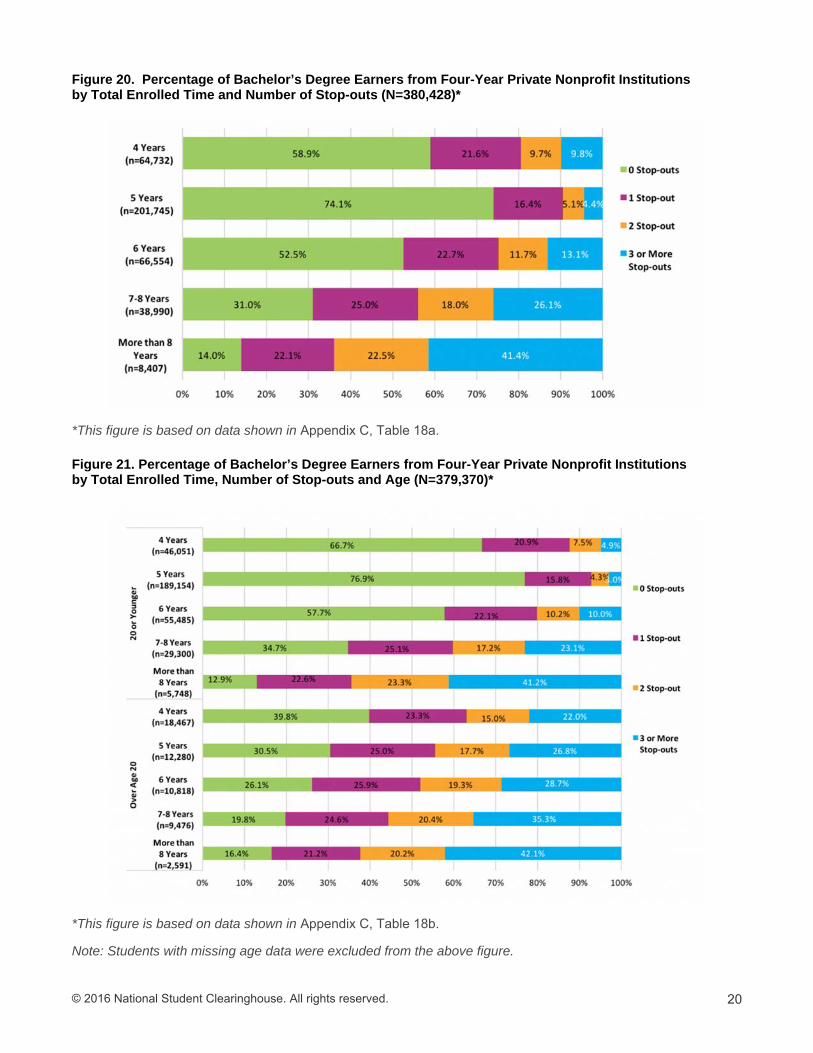
This pattern was reversed among bachelor’s degree earners from four-year private for-profit institutions:
specifically, a higher proportion of students over age 20 had no stop outs in each category of total time enrolled
(whether it was four academic years, five academic years, etc.) than those students who were of a traditional age
at first entry (see this report’s Discussion and Appendix C for more on stop outs by elapsed time).

© 2016 National Student Clearinghouse. All rights reserved. 18
Figure 16. Percentage of Associate Degree Earners from Two-Year Public Institutions by Total Enrolled Time and Number of Stop-outs (N=420,209)*
This figure is based on data shown in Appendix C, Table 14a.
Figure 17. Percentage of Associate Degree Earners from Two-Year Public Institutions by Total Enrolled Time, Number of Stop-outs and Age (N=416,992)*
*This figure is based on data shown in Appendix C, Table 14b.
Note: Students with missing age data were excluded from the above figure.
© 2016 National Student Clearinghouse. All rights reserved. 19
Figure 18. Percentage of Bachelor’s Degree Earners from Four-Year Public Institutions by Total Enrolled Time and Number of Stop-outs (N=1,022,446)*
*This figure is based on data shown in Appendix C, Table 16a.
Figure 19. Percentage of Bachelor’s Degree Earners from Four-Year Public Institutions by Total Enrolled Time, Number of Stop-outs and Age (N=1,019,991)*
*This figure is based on data shown in Appendix C, Table 16b.
© 2016 National Student Clearinghouse. All rights reserved. 20
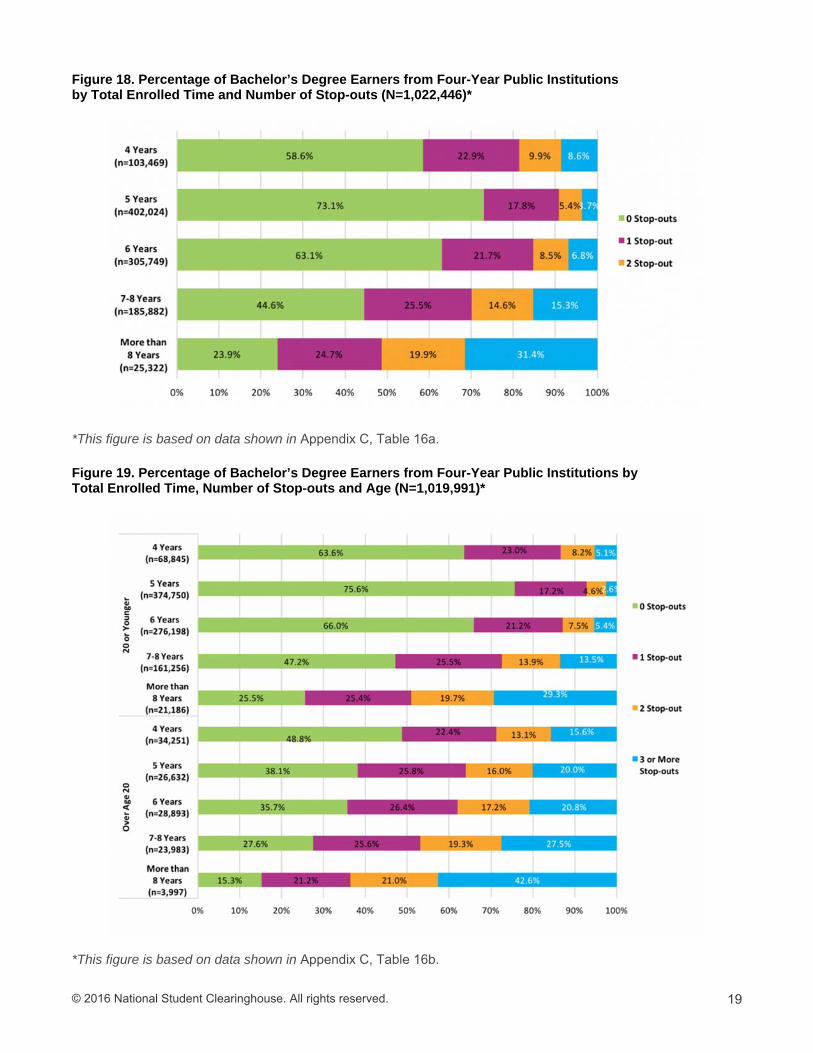
Figure 20. Percentage of Bachelor’s Degree Earners from Four-Year Private Nonprofit Institutions by Total Enrolled Time and Number of Stop-outs (N=380,428)*
*This figure is based on data shown in Appendix C, Table 18a.
Figure 21. Percentage of Bachelor’s Degree Earners from Four-Year Private Nonprofit Institutions by Total Enrolled Time, Number of Stop-outs and Age (N=379,370)*
*This figure is based on data shown in Appendix C, Table 18b.
Note: Students with missing age data were excluded from the above figure.

© 2016 National Student Clearinghouse. All rights reserved. 21
Figure 22. Percentage of Bachelor’s Degree Earners from Four-Year Private For-Profit Institutions by Total Enrolled Time and Number of Stop-outs (N=71,420)*
*This figure is based on data shown in Appendix C, Table 20a.
Figure 23. Percentage of Bachelor’s Degree Earners from Four-Year Private For-Profit Institutions by Total Enrolled Time, Number of Stop-outs and Age (N=71,051)*
*This figure is based on data shown in Appendix C, Table 20b.
Note: Students with missing age data were excluded from the above figure.
© 2016 National Student Clearinghouse. All rights reserved. 22
Discussion
Time to degree has long been viewed as an important outcome for research and policy. It is an important
consideration for students, parents, institutions, and states because of the financial implications the length of
enrollment can have on each of these stakeholders. While the emergence of massive open online courses
(MOOC) and the flexibility offered by online programs has expanded how postsecondary credentials are defined,
for the most part, there is still a certain length of time perceived as the norm for receiving an associate or
bachelor’s degree. This expectation not only determines the length of time institutions are allowed to use to
measure student success (typically, 150 percent of “normal” time), it also limits our understanding of time to
degree thereby rendering students who take longer to finish invisible. As a result, when student completion rates
decline, for example, it is difficult to know whether more students are actually dropping out or simply taking longer
to graduate than the standard data measurement allows. This report captures all degree earners within a given
year, regardless of how long it took them, providing a more complete picture of student success overall and, in
particular, that of non-traditional students.
MAJOR FINDINGS
Enrolled Time to Degree
Today’s students take more than two years to earn an associate degree: 3.3 academic years of full-time or full-
time equivalent enrollment, on average. Bachelor’s degree earners take more than four years to finish: 5.1
academic years, on average. The average length of enrollment for bachelor’s degree earners from four-year
public institutions, 5.2 academic years, is slightly longer than that of their peers from four-year private nonprofit
institutions (4.8 academic years), but shorter than the 5.8 academic years for students who received a bachelor’s
degree from four-year private for-profit institutions.
Only 7.4 percent of associate degree earners from two-year public institutions, fewer than one in 13, finished their
degree within two academic years of full-time or full-time equivalent enrollment. Another 35.2 percent finished within
three academic years of enrollment. More than half of associate degree earners finished their degree within four or
more academic years of enrollment.
Just 10 percent of bachelor’s degree earners from four-year public institutions finished their degree within four
academic years of full-time or full-time equivalent enrollment and 39.3 percent finished within five academic years.
Half of all bachelor’s degree earners from four-year public institutions finished their degree within six or more
academic years of enrollment.
Caution is warranted in interpreting the small proportions of associate degree earners finishing in two academic
years and bachelor’s degree earners in four academic years because of the way the academic year was defined.
Schools with academic calendars of more than 30 weeks of instruction in a normal year will automatically have
very few students graduating within exactly two or four academic years. Although this sort of variability averages
out in the national numbers, we also considered using a more conservative cutoff of 4.5 academic years for a
bachelor’s degree. Just over a quarter of graduates at four-year public institutions finished under this threshold

© 2016 National Student Clearinghouse. All rights reserved. 23
(27.3%), compared to almost half (48.8%) at four-year private non-profits and just under a quarter (23.6%) at four-
year private for-profits (see Table 9.2 in Appendix C).
See Appendix A for more on the advantages and limitations of defining the enrolled time in terms of academic years.
Elapsed Time to Degree
The length of the active enrollment time is important because each additional term of enrollment has the potential
to increase the cost to the student, both through foregone earnings and additional tuition expenses. The picture
becomes more complex, however, when the total time elapsed between the student’s first enrollment and receipt
of degree is considered, including stop outs. The average time elapsed for associate degree earners from two-
year public institutions was 5.6 calendar years, the same as or longer than the average time elapsed for
bachelor’s degree earners from four-year public institutions (5.6 calendar years) and four-year private nonprofit
institutions (5.4 years). The elapsed time was much longer for bachelor’s degree earners from private for-profit
institutions (8.8 calendar years).
We found no differences in the average enrolled or elapsed time by gender, but differences emerged when we
further disaggregated the results by age and gender, which we discuss below.
Differences in Time to Degree by Age
Among associate degree earners from two-year public institutions, the average time enrolled for traditional-age
students and students who started college when they were older than 20 was the same, 3.4 academic years.
However, those who started college later in life spent far more calendar years to earn an associate degree than
traditional-age students, 6.9 and 5.1 calendar years, respectively. In both cases the marked difference between
enrolled and elapsed time represents a mix of more part-time enrollments and numerous and/or extended stop
out periods.
For bachelor’s degree earners who entered college at traditional age, the average enrolled time and the average
elapsed time were almost the same: 5.2 academic years of active enrollment within 5.3 calendar years for
graduates of four-year public institutions, and 4.8 academic years of active enrollment within 4.8 calendar years
for bachelor’s degree earners from four-year private nonprofit institutions. The two metrics diverged dramatically
for older students, however. Those who started college over age 20 enrolled 4.9 academic years to receive a
bachelor’s degree, and had enrollments spanning 8.4 calendar years. The pattern we observed for associate
degree earners holds here: the active enrollment time is not different by age at first entry to college. However,
older students’ enrollments span a much longer time period, reflecting greater likelihood of being enrolled at less
than full-time as well as taking time off from school.
When disaggregating by both age and gender we found that women who were older than 20 when they started
college took the longest to receive an associate degree from two-year public institutions. On average, 7.2
calendar years elapsed between first enrollment and degree. The same pattern appeared among bachelor’s
degree earners from four-year public institutions. Female bachelor’s degree earners who started college when
they were older than 20 had the longest elapsed time, 8.8 calendar years. For their male peers, the number was
8.1 calendar years.

© 2016 National Student Clearinghouse. All rights reserved. 24
Time to Degree for Bachelor’s Degree Earners with/without a Prior Associate Degree or Prior Enrollments in Two-Year Institutions
When we examined the different pathways students took to earn a bachelor’s degree, we found that the average
time enrolled was longer for bachelor’s degree earners with a prior associate degree than for those without one
(5.7 and 5.0 academic years, respectively). This was true regardless of the type of four-year institution from which
the bachelor’s degree was received. The gap was the largest (nearly one academic year, on average) for
bachelor’s degree earners from four-year private nonprofit institutions. Students earning bachelor’s degrees from
four-year public institutions who already had an associate degree took 0.6 academic years longer to complete
than those without one; the difference was 0.5 academic years for bachelor’s degree from four-year private for-
profit institutions.
Of course, in this report, bachelor’s degree earners without a prior associate degree may or may not have been
transfer students. In other words, they may have had enrollments in two-year institutions or may have been native
students to the four-year institution where they received their degree. For this reason, we also examined time to
degree for bachelor’s degree earners who had no prior associate degree and for bachelor’s degree earners who had
prior enrollments in two-year institutions.
For bachelor’s degree earners who did not have an associate degree, but had prior two-year enrollments, the
average time of active enrollment was 5.3 academic years and the elapsed time was 6.0 calendar years. For their
peers without prior two-year enrollments, the average enrolled time was 4.8 academic years, which was
completed in 4.5 calendar years.
When disaggregated by age, the differences were less striking between students who were over age 20 when
they started college versus those who entered college at a traditional age. For example, among those who started
at 20 or younger, the average enrolled time for bachelor’s degree earners with and without prior associate degree
was 5.9 and 5.0 academic years. For those who entered college later in life, it was 5.3 and 4.8 academic years.
Time to Degree for Degree Earners with/without Dual Enrollment
Previous research showed that, after graduating from high school, students with prior dual enrollment progress
toward a degree faster than those without dual enrollment (Radunzel, Noble, and Wheeler, 2014). Our findings
support this. On average, associate degree earners from two-year public institutions without prior dual enrollment
spent 0.5 more academic years in college than those with prior dual enrollment (3.5 and 3 academic years,
respectively). The difference in elapsed time was even greater (6.0 and 4.2 calendar years, respectively). Similar
patterns exist among bachelor’s degree earners. For example, on average, bachelor’s degree earners from four-
year public institutions with prior dual enrollment had 5.0 academic years of enrollment in 4.9 calendar years. By
comparison, their peers without prior dual enrollment had 5.3 academic years of enrollment in 5.9 calendar years.
Of course, with only a descriptive study, we are unable to attribute these differences solely to prior dual
enrollment. It is possible that those who had dual enrollment in high school were also more highly motivated and
academically well-prepared. Nonetheless, dual enrollment can smooth the transition from high school to college
and, if credits from such enrollment are counted toward a degree, save students time and money.

© 2016 National Student Clearinghouse. All rights reserved. 25
Enrolled Time to Degree by Elapsed Time
We compared students’ enrolled time with their elapsed time to find out how much the actual enrolled time grew
as the number of calendar years between the first enrollment and the degree increased. For associate degree
earners, when the total elapsed time increased from two to three calendar years, the enrolled time increased from
2.1 to 2.9 academic years. In other words, for the first additional year of elapsed time, the enrolled time increased
almost one academic year. Each subsequent additional year that was added to the elapsed time increased the
enrolled time by less than half an academic year (0.4 academic years or 12 weeks of full-time or full-time
equivalent enrollment).
Time to Degree and Number of Institutions Attended
Previous research found that as the number of institutions attended increases so does the time to degree
(Gillmore & Hoffman, 1997; Runyan, 2011). Our findings confirm this. For both associate and bachelor’s degree
earners, the time of active enrollment and the elapsed time increase with each additional institution attended. It
should be noted, however, that each additional institution increases the average elapsed time to degree more
dramatically than it does the average enrolled time. For example, for associate degree earners from two-year
public institutions, attending two institutions increases the average time enrolled from 3.0 to 3.6 academic years
while the average elapsed time increases from 4.2 to 6.5 calendar years. For bachelor’s degree earners from
four-year public institutions, attending two institutions increases the average time enrolled by 0.4 academic years
(12 weeks of full-time or full-time equivalent enrollment) while the average elapsed time increases from 4.4 to 5.5
calendar years.
As these findings evidence, multiple-institution attendance is common. Simply recommending to students that
they not change institutions and promoting the benefits of single institution attendance does not seem to be useful
any longer. Instead, institutions should look for ways to make such transitions smoother. Support is important both
in terms of academic integration (e.g., preventing loss of credits) and social integration (e.g., orientation and
activities geared toward transfer students).
Time to Degree and Number of Stop Outs
Overall, fewer than half of associate degree earners (48 percent) from two-year public institutions had no stop outs,
which is defined in this report as having no enrollment for more than four months (or for 123 days; this is to avoid
having students who were not enrolled between May 1 and August 31 of any given year as being considered as
having stopped out). One in four associate degree earners had only one stop out and 26.7 percent had two or more
stop outs. The number of stop outs was positively related to the number of years enrolled or elapsed.
When disaggregated by age, a higher proportion of associate degree earners who started at a traditional age finished
their degree without any stop outs versus those who started later in life (50.0 percent and 42.8 percent, respectively).
Among bachelor’s degree earners from four-year public institutions, 62.2 percent finished their degree without any
stop out. Slightly over one in five had one stop out (21 percent) and 16.7 percent had two or more stop outs.
A similar proportion of those who received their bachelor’s degree from four-year private nonprofit institutions
finished without any stop outs (62.0 percent). In contrast, only 26.8 percent of bachelor’s degree earners from
four-year private for-profit institutions had no stop outs.

© 2016 National Student Clearinghouse. All rights reserved. 26
Final Thoughts and Implications
Throughout the report we differentiated enrolled time and elapsed time for a reason. Extended active enrollment
may mean excessive credit, which has financial implications for students (e.g., poor academic planning, changing
a major, enrolling in courses that do not count toward a degree, etc.). While additional years of elapsed time likely
means enrolling part time or taking time off from work, family obligations, military service or, in some cases, travel
for experience.
As our results demonstrate, very few students finish their degree in what is perceived as a normal time to degree,
whether it is measured in enrolled or elapsed time. It is important, therefore, that institutions and policymakers
continue to take measures to minimize the cases where inadequate guidance or academic advising results in
excessive credit or having insufficient financial resources causes stop outs and part-time enrollment. The results
also challenge the notion of “normal time” to degree. In fact, they clearly demonstrate the need for the higher
education community and policymakers to acknowledge the new normal and the fact that traditional time frames
will not work for every college student. For example, average elapsed time is much longer for older students,
which is most likely due to life choices related to family or work responsibilities.
While it is generally well acknowledged that today’s student population is different, expectations still persist that
these students adhere to enrollment pathways traditionally considered “normal” or “successful.” This has
implications for both students and institutions. Students who change institutions and/or take longer to finish are
increasingly labeled as failures, according to the traditional measures of success. Institutions may be blamed for
the longer times to degree that arise from serving a more non-traditional student population. Public policies
affecting both students and institutions may end up penalizing those who do not fit the traditional mold, rather than
finding ways to serve their needs. Acknowledging and accepting the reality of today’s students and their non-
traditional pathways can lead to better policies both at the national and institutional levels, leading to greater
student success.
References
Alexander, F. K. (1998). The endless pursuit of efficiency: The international movement to increase accountability
and performance in higher education. ASHE Annual Meeting Paper. Retrieved from
http://files.eric.ed.gov/fulltext/ED427585.pdf
Anderson, L. (2015). Reverse transfer: The path less traveled. Retrieved from
http://www.ecs.org/clearinghouse/01/18/77/11877.pdf (03/24/16)
Astin, A. (2006). Making sense out of degree completion rates. Journal of College Student Retention: Research,
Theory & Practice, 7(1-2), 5-17. doi: 10.2190/7PV9-KHR7-C2F6-UPK5
Attewell, P., & Monaghan, D. (2016). How many credits should an undergraduate take? Research in Higher
Education, 1-32. doi:10.1007/s11162-015-9401-z

© 2016 National Student Clearinghouse. All rights reserved. 27
Bailey, T., & Cho, S. (2010). Developmental education in community colleges (Issue Brief prepared for The White
House Summit on Community College). New York, NY: Community College Research Center, Teachers College
Columbia University. Retrieved from http://www2.ed.gov/PDFDocs/college-completion/07-developmental-
education-in-community-colleges.pdf.
Belcheir, M. (2000). Predicting the probability of graduating after four, six, and ten years (Research Report).
Boise, ID: Boise State University. Retrieved from http://eric.ed.gov/?id=ED443339
Bettinger, E. P., & Long, B. T. (2009). Addressing the Needs of Underprepared Students in Higher Education:
Does College Remediation Work? Journal of Human Resources, 44(3), 736-771. doi: 10.3368/jhr.44.3.736
Borden, V. (2004). Accommodating Student Swirl: When Traditional Students are No Longer the Tradition.
CHANGE: The Magazine of Higher Education Learning, 36 (2), 10-17.
Bound, J., Lovenheim, M., & Turner, S. (2012). Increasing time to baccalaureate degree in the United States.
Education Finance and Policy, 7(4), 375-424. doi: 10.1162/EDFP_a_00074
Bradburn, E., Berger, R., Xiaojile, L., Katharin, P., & Rooney, K. (2003). A descriptive summary of 1999-2000
bachelor’s degree recipients 1 year later: With an analysis of time to degree (Statistical Analysis Report).
Retrieved from http://nces.ed.gov/pubs2003/2003165.pdf
California State Postsecondary Education Commission. (1988). Time to Degree in California’s Public Universities:
Factors Contributing to the Length of Time Undergraduates Take To Earn Their Bachelor’s Degree (Report 88-
12). Sacramento, CA. Retrieved from http://files.eric.ed.gov/fulltext/ED297660.pdf
California Postsecondary Education Commission. (2006, December). California Higher Education Accountability:
Goal – Student success, Measure: Time-to-Degree (Commission Report 06-20). Sacramento, CA. Retrieved
From http://eric.ed.gov/?id=ED495007
Camara, W. J. (2003). College persistence, graduation, and remediation.
Complete College America. (2014). Four-year myth [Reports]. Washington, DC: Complete College America.
Retrieved from http://completecollege.org/wp-content/uploads/2014/11/4-Year-Myth.pdf
Contomichalos, S. K. (2014). Issues and obstacles for lateral transfer students to selective colleges. Journal of
College Admission (225), 4-5.
Complete College America. Retrieved from
http://www.completecollege.org/docs/Three%20Policies%20to%20Reduce%20Time%20to%20Degree%20-
%20Nate%20Johnson.pdf
Degree Road Maps. (n.d.). Retrieved April 21, 2016, from http://www.csun.edu/catalog/plan/
DesJardins, S. L., Ahlburg, A. A., & McCall, B. P. (2002). A temporal investigation of factors related to timely
degree completion. Journal of Higher Education, 73(5), 555-581. Retrieved from
http://www.jstor.org/stable/1558433

© 2016 National Student Clearinghouse. All rights reserved. 28
Friedel, J. N., & Wilson, S. L. (2015). The new reverse transfer: A national landscape. Community College Journal
of Research and Practice, 39(1), 70-86. doi: 10.1080/10668926.2014.882805
Gillmore, G. M., & Hoffman, P. H. (1997). The graduation efficiency index: Validity and use as an accountability
and research measure. Research in Higher Education, 38(6), 677-697. Retrieved from
http://www.jstor.org/stable/40196283
Hossler, D., Shapiro, D., Dundar, A., Ziskin, M., Chen, J., Zerquera, D., & Torres, V. (2012, February). Transfer
and mobility: A national view of pre-degree student movement in postsecondary institutions (Signature Report
No.2). Herndon, VA: National Student Clearinghouse Research Center.
Indiana Core Transfer Library. (n.d.). Retrieved April 21, 2016, from http://www.transferin.net/ctl.aspx
Ishitani, T. T. (2006). Studying attrition and degree completion behavior among first-generation college students in
the United States. The Journal of Higher Education, 77(5), 861-885. Retrieved from
http://muse.jhu.edu/journals/journal_of_higher_education/v077/77.5ishitani.html
Jaschik, S. (2010). 3-Year degrees? Not so fast. Inside Higher Education. Retrieved from
https://www.insidehighered.com/news/2010/06/03/aacu
Johnson, N. (2011). Three policies to reduce time to degree [Reports]. Washington, DC:
Jones, S. (2015). The game changers: Strategies to boost college completion and close attainment gaps.
Change: The Magazine of Higher Learning, 47(2), 24-29. doi 10.1080/00091383.2015.1018085
Knight, W. (2004). Time to bachelor’s degree attainment: An application of descriptive, bivariate, and multiple
regression techniques. IR Applications, 2, Sept. 8, 2004. Retrieved from http://eric.ed.gov/?id=ED504365
Knight, W. (2002). Toward a comprehensive model of influences upon time to bachelor’s degree attainment. AIR
Professional File, 2002, 85 (Winter).
Knight, W. E., & Arnold, W. (2000, May). Towards a comprehensive predictive model of time to bachelor’s degree
attainment. Paper presented at the annual forum of the Association for Institutional Research, Cincinnati, OH.
Lam, L.T. (1999 May 30-June 2). Assessing financial aid impacts on time-to-degree for nontransfer
undergraduate students at a large urban public university. The 39th Annual Forum Paper. Paper presented at the
Association for Institutional Research. Retrieved from
http://www.asu.edu/provost/spiada/uoia/pubs/papers/lam.pdf
Lau, L. (2003). Institutional factors affecting student retention. Education, 124(1) 126. Retrieved from
http://www.uccs.edu/Documents/retention/2003%20Institutional%20Factors%20Affecting%20Student%20Retenti
on.pdf
LeMon, R.E., & Pitter, G.W. (1996). Standardizing across institutions: Now that we look alike, what do we look
like? (Research Report).
© 2016 National Student Clearinghouse. All rights reserved. 29
Mangan, K. (2016, April 11). Streamline the path to program completion. The Chronicle of Higher Education.
Retrieved from http://chronicle.com/article/Streamlining-the-Path-to/236053
Marcy, M. B. (2010). The three-year degree: An idea whose time will pass. Liberal Education, 96(4), 52-56.
Retrieved from http://www.aacu.org/publications-research/periodicals/three-year-degree-idea-whose-time-will-
pass
Marling, J. L. (2013). Navigating the new normal: Transfer trends, issues, and recommendations. New Directions
for Higher Education, 162, 77-87. doi: 10.1002/he.20059
Messer, D., & Wolter, S. C. (2010). Time-to-degree and the business cycle. Education Economics, 18(1), 111-
123. doi:10.1080/09645290903102860
Obama, B. (2009, February 24). Remarks of President Barack Obama as prepared for delivery. Address to joint
session of Congress, Tuesday, February 24, 2009 [Website post]. Retrieved from
http://www.whitehouse.gov/the_press_office/Remarks‐of‐President‐Barack‐Obama‐Address‐to‐Joint‐Session‐of‐Congress/
Oseguera, L. (2006). Four and six-year baccalaureate degree completion by institutional characteristics and
racial/ethnic Groups. Journal of College Student Retention: Research, Theory & Practice, 7(1-2), 19-59. Retrieved
from http://csr.sagepub.com/content/7/1/19.full.pdf+html
O’Toole, D. M., Stratton, L. S., & Wetzel, J. N. (2003). A longitudinal analysis of the frequency of part-time
enrollment and the persistence of students who enroll part time. Research in Higher Education, 44(5), 519-537.
Retrieved from http://www.jstor.org/stable/40197320
Pitter, G., LeMon, R., & Landham, C. (1996). Hours to graduation: A national survey of credit hours required for
the baccalaureate degree (Research Report). State University System of Florida, 1996. Retrieved from
http://files.eric.ed.gov/fulltext/ED409776.pdf
Proudfit, A. H. (2014). A national longitudinal study of the influence of federal student aid on time to associate-
degree attainment (Doctoral dissertation). Retrieved from
https://etd.ohiolink.edu/!etd.send_file?accession=toledo1396480366&disposition=inline
Radunzel, J., Noble, J. & Wheeler, S. (2014). Dual-Credit/Dual-Enrollment Coursework and Long-Term College
Success in Texas. Iowa City, IA: ACT.
Runyan, L. M. (2011). Undergraduate degree completion: A study of time and efficiency to degree. (Doctoral
Dissertation). Retrieved from http://search.proquest.com/docview/1024564383
Shapiro, D., Dundar, A., Wakhungu, P.K, Yuan, X., & Harrell, A. (2015, July). Transfer and mobility: A national
view of student movement in postsecondary institutions, fall 2008 cohort (Signature Report No. 9). Herndon, VA:
National Student Clearinghouse Research Center. https://nscresearchcenter.org/signaturereport9
The Campaign for College Opportunity (2014). The Real Cost of College: Time & Credits to Degree at California
State University. Retrieved from http://realcostofcollegeinca.org/wp-content/uploads/2014/06/Real-Cost-of-
College_Full-Report_CSU.pdf

© 2016 National Student Clearinghouse. All rights reserved. 30
Volkwein, J. F., & Lorang, W. G. (1996). Characteristics of extenders: Full-time students who take light credit
loads and graduate in more than four years. Research in Higher Education, (1). 43. Retrieved from
http://www.jstor.org/stable/40196210
Wei, C. C., & Horn, L. (2009). A profile of successful Pell Grant recipients: Time to bachelor’s degree and early
graduate school enrollment (Statistical Analysis Report). NCES 2009-15 6: National Center for Education
Statistics. Retrieved from http://nces.ed.gov/pubs2009/2009156.pdf
Appendix A: Methodological Notes
OVERVIEW
The report describes students’ pathways to degree completion for a cohort of students who received an associate
degree as their first and only postsecondary degree or a bachelor’s degree as their first four-year degree between
July 1, 2014, and June 30, 2015. All available enrollment records for the students, going as far back as the
Clearinghouse data show, were included in the study. Only degrees from schools for which the Clearinghouse
had enrollment records for at least the prior 10 years were retained in the cohort. The results presented in this
report center on students’ pathways through their first enrollment to degree completion, providing the average
time enrolled, average time elapsed, number of institutions attended, and number of stop outs. This report
focuses on students’ primary degree (i.e., the highest degree received within the study period), but also reports
bachelor’s degree recipients with a prior associate degree. Details regarding data, sample selection, and the
definition of constructs examined in the report are included in the discussion below.
National Coverage of Clearinghouse Data
The National Student Clearinghouse® (the Clearinghouse) is a unique and trusted source for higher education
enrollment and degree verification. Since its creation in 1993, the participation of institutions nationwide in
Clearinghouse data collection programs has steadily increased. Currently, Clearinghouse data include more than
3,600 postsecondary institutions and 96.5 percent of U.S. postsecondary enrollments. The Clearinghouse has a
23-year track record of providing automated student enrollment and degree verifications. Due to the
Clearinghouse’s unique student-level record approach to data collection, the Clearinghouse data provides
opportunities for robust analysis not afforded by the more commonly used institution-level national databases.
The enrollment data used in this report provide an unduplicated headcount of students enrolled in postsecondary
education. Clearinghouse data track enrollments nationally and are not limited by institutional and state
boundaries. Moreover, because the data are student-level, researchers can use it to link concurrent as well as
consecutive enrollments of individual students at multiple institutions − a capability that distinguishes the
Clearinghouse data from national databases built with institution-level data. For instance, in the National Center
for Education Statistics (NCES) and the Integrated Postsecondary Education Data System (IPEDS) − one of the
most widely used national data sets in postsecondary education research − concurrent enrollments remain
unlinked and, therefore, are counted as representing separate individuals, which creates duplication.

© 2016 National Student Clearinghouse. All rights reserved. 31
There are nationally representative samples (e.g., National Education Longitudinal Study, NELS:88/2000;
Beginning Postsecondary Students Longitudinal Study, Educational Longitudinal Study, ELS:02; etc.) that are
based on student-level data. However, by definition samples have their limitations in terms of the currency of the
data as well as its uses. For example, a nationally representative sample cannot be used to produce regional or
state-level results. The Clearinghouse data do not have those limitations because of the frequency of the data
collection and the near-census national coverage.
Cohort Identification, Data Cut, and Definitions
The study focused on the cohort of students who received their first degree (associate and/or bachelor’s degree)
between July 1, 2014, and June 30, 2015. All available enrollment records for the students, going as far back as
the Clearinghouse data show, were included in the study. In summary, the study cohort included students who
fulfilled both of the following conditions:
1. Received an associate degree as their first-ever degree or a bachelor’s degree as their first four-year
degree between July 1, 2014, and June 30, 2015.
2. Had at least one associate or bachelor’s degree from an institution that had at least 10 years of
enrollment records with the National Student Clearinghouse.
Data Coverage
Analysis in this report is based exclusively on degrees reported to the National Student Clearinghouse through its
DegreeVerifySM service. Results were not adjusted to account for DegreeVerifySM participation rates, which was
92 percent at the time of data extraction. In addition, a set of rules applied to the initial cohort for this report’s
purposes (e.g., only students who received an associate degree as their first and only postsecondary degree or a
bachelor’s degree as their first four-year degree were retained in the cohort; only students with degrees from
schools for which the Clearinghouse had enrollment records for at least the prior 10 years were retained in the
cohort, etc.). Thus, the cohort included 59 percent of students who received an associate degree in that year and
79 percent of those who received a bachelor’s degree.
Time to Degree
Time to degree was defined in two different ways:
1. Time elapsed was defined as the total time, in calendar years, between initial enrollment in a
postsecondary institution and subsequent degree attainment, regardless of whether or not the student
was actually enrolled. Note that one effect of this definition is that students who graduate in “normal time”
will take less than two calendar years to complete an associate degree. The total elapsed time between
September 1, 2013, and May 30, 2015, for example, is 1.75 calendar years.
2. Time enrolled was defined in terms of the number of weeks that are equivalent to one academic year (30
weeks) of active, full-time enrollment. For example, four 15-week semesters of full-time enrollment are
equivalent to two academic years of enrollment whereas four 15-week semesters of half-time enrollment
are equivalent to one academic year of enrollment.
Dual enrollments, which are enrollments before the student was 18 years old, were not included in either
definition.
We chose to express enrolled time in terms of academic years, defining one academic year as 30 weeks of full-
time or full-time equivalent enrollment representing two 15-week semesters or three 10-week trimesters. We

© 2016 National Student Clearinghouse. All rights reserved. 32
understand that it is an imperfect measure in today’s academic environment when many schools offer shorter,
four- to six-week terms on a rolling basis and even the schools that are still on a traditional semester or trimester
calendar also have shorter intersessions and course offerings in modules.
Regular academic calendars, whether semester, quarter, trimester or other, vary widely by institution and can be
anywhere from 28 to 34 total weeks per year (not counting summer or intersessions). That is, by our metric,
anywhere from 0.93 to 1.13 academic years. This academic year metric is particularly arbitrary for many for-profit
institutions and online programs, which do not follow traditional academic calendars.
The effect of this definition on institutions with longer terms is to increase the number of academic years needed
to graduate in “normal time.” For example, at an institution with a calendar of two slightly longer semesters, each
15 weeks and 5 days, bachelor’s degree students who finished in the “normal” eight terms would be measured at
4.2 academic years of enrolled time to degree.
That said, a simple, standard measure makes it possible to capture enrollments consistently across all types of
institutions and combine them when calculating time to degree for students who attend more than one school.
This is particularly important because of the prevalence of multiple-institution attendance patterns, among both
associate and bachelor’s degree earners.
Time Elapsed
Time elapsed is the number of calendar years (1 year=365 days) divided into five categories for each degree
type, associate and bachelor’s. Categories for bachelor’s degree earners were:
4 years: Up to 4 years,
5 years: Over 4 and up to 5 years,
6 years: Over 5 and up to 6 years,
7-8 years: Over 6 and up to 8 years, and
More than 8 years.
Categories for associate degree earners included:
2 years: Up to 2 years,
3 years: Over 2 and up to 3 years,
4 years: Over 3 and up to 4 years,
5-6 years: Over 4 and up to 6 years, and
More than 6 years.
Time Enrolled
Time enrolled was a measure of academic progress or a proxy for credit load. We used a standardized definition
of a “full-time week” (FTW) equivalent to create units by which we calculated students’ accrued enrollment across
institutional contexts.
One week of full-time enrollment was considered one full-time week (FTW) equivalent
One week of quarter-time enrollment was calculated as .75 FTW equivalent
One week of half-time enrollment was calculated as .5 FTW equivalent.
One week of less than half-time enrollment was translated as .25 FTW equivalent.

© 2016 National Student Clearinghouse. All rights reserved. 33
For the purposes of these analyses, one academic year was defined as the completion of 30 FTWs, which was
equivalent to two 15-week semesters. All enrollment records, except for dual enrollments, were included when
calculating progress by FTW equivalent. Time enrolled was categorized into five categories for each degree type,
associate and bachelor’s. The five categories for bachelor’s degree earners were:
4 years: Up to 4 academic years,
5 years: Over 4 and up to 5 academic years,
6 years: Over 5 and up to 6 academic years,
7-8 years: Over 6 and up to 8 academic years, and
More than 8 academic years.
The five categories for associate degree earners were:
2 years: Up to 2 academic years,
3 years: Over 2 and up to 3 academic years,
4 years: Over 3 and up to 4 academic years,
5-6 years: Over 4 and up to 6 academic years, and
More than 6 academic years.
Dual Enrollment Students
Many students in the cohort may have had dual enrollment records in their enrollment history. We excluded them
in calculations of the time enrolled and time elapsed. Dual enrollment record was defined as enrollments before
the student turned 18 years old.
Age at First Entry
Age at first entry was defined as the number of years between the student’s birth date and first enrollment
(excluding dual enrollment records). Student age was categorized into two groups:
“20 or younger,” defined to approximate initial enrollment in college immediately after high school, and
“Age over 20,” which captured adult learners who were over age of 20 at the time of first entry into
college.
First Enrollment Record
The first enrollment record was identified for each student included in the study. It was defined as the enrollment
record with the earliest term begin-date (excluding dual enrollment records). Where this criterion did not result in
the selection of a single enrollment record (i.e., when two or more enrollment records began on the same date,
and where these records preceded all other records), we selected the record with the highest enrollment intensity
(e.g., full-time enrollment over quarter-time enrollment). In cases where the first two criteria still did not result in a
single first record, we selected the term with the longest term length. If all the preceding steps still did not identify
a unique first enrollment record, we randomly selected the first enrollment record within the student’s remaining
sequence of enrollment records.
Concurrent Enrollment
Concurrent enrollments, defined as two or more enrollment records whose dates overlap by 30 days or more,
were included in the analyses. In this report, up to three concurrent enrollments of a student were considered. If a
student had more than three concurrent enrollment records at different institutions, we selected three using the
following decision criteria steps:

© 2016 National Student Clearinghouse. All rights reserved. 34
1. The 1st concurrent enrollment record was selected by choosing the records with the highest enrollment
status and, then among them, identifying the records with the longest term. If this yielded more than one
record, then one record was randomly selected.
2. The 2nd concurrent enrollment record was selected from the rest of the records using the same criteria in
step one.
3. The 3rd concurrent enrollment record was selected from the rest of the records using the same criteria in
step one.
Number of Institutions Attended
This study also reported the number of institutions each student attended before degree completion. The number
of institutions attended was categorized into three groups: one institution, two institutions, and three or more
institutions.
Stop Outs
For this report, we reported the number of stop outs included in each student’s enrollment pathway. A discrete
“stop out” was defined as a period longer than 123 days between one enrollment record’s end date and the begin
date of the next enrollment record. Students’ stop out was categorized into four groups:
0 stop-outs,
1 stop-out,
2 stop-outs, and
3 or more stop-outs.
Enrollment Intensity
For this report, enrollment intensity was classified as exclusively full-time, exclusively part-time, and mixed
enrollment throughout the study period, based on students’ enrollments across all terms through to degree
completion. In establishing students’ enrollment intensity, enrollments during summer terms (defined as terms
with start and end dates that fell between May 1 and August 31 in any given year) and short terms (defined as
terms of fewer than 21 days) were excluded. The “exclusively full-time enrollment” designation was assigned to
students who were in full-time status for all enrolled terms. The “exclusively part-time enrollment” designation was
assigned to students who had a combination of enrollment statuses, other than full-time, across the terms before
degree completion. While “mixed enrollment” designation was assigned to students who had a combination of full-
time and other enrollment statuses across the terms under consideration. Stop outs were not considered in
defining enrollment intensity categories (e.g., a student who had one or more stop outs, but was enrolled full-time
during all enrolled terms was still included in the exclusively full-time enrollment category).
Imputation of Values for Gender
The Clearinghouse’s coverage of student gender has increased in recent years. However, for at least half of
enrollment records, imputation of gender value is still necessary for the purposes of research studies. To meet
this need, the Research Center developed an imputation process in which previously submitted name‐gender
pairs are used to determine the probability of any first name being associated with either gender. To increase the
accuracy of the imputation process, the Research Center also draws on name‐gender data from the Social
Security Administration (SSA) and the U.S. Census Bureau. Because the Clearinghouse collects transactional
data, its data contain many more unique first names than the other sources. International students may also
© 2016 National Student Clearinghouse. All rights reserved. 35
contribute to the large variety of first names submitted to the Clearinghouse. The imputation used only those pairs
in which the name occurred in at least two instances and was associated with a single gender in at least 95
percent of the instances. The SSA and Census data sets were used to ensure that name‐gender pairs were
consistent across every data set in which they occurred and to enhance the imputation process by contributing
name‐gender pairs that did not occur in the Clearinghouse data. Institutions reported student gender to the
Clearinghouse for approximately half of all students included in this report. This approach enabled gender (either
school-provided or imputed) to be reported for 94 percent of all students.
Data Limitations
The data limitations for this report center mainly on the data coverage, the methods used for cohort identification,
and the definition of key constructs, as outlined above. The Clearinghouse can accept course and credit
information through its Reverse Transfer service. However, the coverage is incomplete for those data elements.
For this reason, a combination of the number of weeks enrolled and enrollment status were used to calculate the
student’s progress, meaning: the total time enrolled does not take into account the actual number of attempted or
accumulated credits. Dual enrollment information is not available in the Clearinghouse data. For this study, we
used the criteria of enrollment before the age of 18 to select dual enrollment records. Because some students
enter college before turning 18 years old, a small number of enrollment records may have been incorrectly
defined as dual enrollment. As a result, for these students, the total time elapsed and total time enrolled may have
been slightly underestimated. Data limitations resulting from the cohort identification methods used in preparing
this report also should be noted. Because of the undercoverage of degree data, students who had a degree from
a non-Clearinghouse participating institution were not included in this report. In addition, a small number of
degrees defined as the student’s first degree within the study period may not be the first degree, if the student’s
prior degree was from an institution that does not participate with the Clearinghouse. Finally, although
Clearinghouse data contain some demographic information on students, historical coverage rates for the
demographic data elements are uneven. Consequently, the results summarized in this report do not break out
enrollments by race/ethnicity and results on gender are based partially on imputed values, as described above.
Appendix B: Coverage Tables > Download at https://nscresearchcenter.org/wp-
content/uploads/Signature11AppendixB.xlsx
Appendix C: Results Tables > Download at https://nscresearchcenter.org/wp-
content/uploads/Signature-11AppendixC.xlsx