Embed Size (px)
Citation preview

Contents lists available at ScienceDirect
Journal of the Mechanics and Physics of Solids
Journal of the Mechanics and Physics of Solids 94 (2016) 191–206
http://d0022-50
n CorrE-m1 Th
journal homepage: www.elsevier.com/locate/jmps
Time-, stress-, and temperature-dependent deformation innanostructured copper: Creep tests and simulations
Xu-Sheng Yang a,c,1, Yun-Jiang Wang b,1, Hui-Ru Zhai c, Guo-Yong Wang d,Yan-Jing Su e, L.H. Dai b, Shigenobu Ogata f,g, Tong-Yi Zhang a,n
a Shanghai University Materials Genome Institute and Shanghai Materials Genome Institute, Shanghai University, 99 Shangda Road,Shanghai 200444, Chinab State Key Laboratory of Nonlinear Mechanics, Institute of Mechanics, Chinese Academy of Sciences, Beijing 100190, Chinac Department of Mechanical and Aerospace Engineering, The Hong Kong University of Science and Technology, Clear Water Bay, Kowloon,Hong Kong, Chinad Key Laboratory of Automobile Materials, Department of Materials Science and Engineering, Jilin University, No. 5988 Renmin Street,Changchun 130025, Chinae Univ Sci & Technol Beijing, Key Lab Environm Fracture MOE, Corros & Protect Ctr, Beijing 100083, Chinaf Department of Mechanical Science and Bioengineering, Graduate School of Engineering Science, Osaka University, Osaka 560-8531, Japang Elements Strategy Initiative for Structural Materials, Kyoto University, Kyoto 606-8501, Japan
a r t i c l e i n f o
Article history:Received 26 February 2016Received in revised form11 April 2016Accepted 15 April 2016Available online 22 April 2016
Keywords:CreepNanotwinActivation parametersHRTEMAtomistic simulations
x.doi.org/10.1016/j.jmps.2016.04.02196/& 2016 Elsevier Ltd. All rights reserved.
esponding author.ail address: [email protected] (T.-Y. Zhangese authors contributed equally to this wor
a b s t r a c t
In the present work, we performed experiments, atomistic simulations, and high-re-solution electron microscopy (HREM) to study the creep behaviors of the nanotwinned(nt) and nanograined (ng) copper at temperatures of 22 °C (RT), 40 °C, 50 °C, 60 °C, and70 °C. The experimental data at various temperatures and different sustained stress levelsprovide sufficient information, which allows one to extract the deformation parametersreliably. The determined activation parameters and microscopic observations indicatetransition of creep mechanisms with variation in stress level in the nt-Cu, i.e., from theCoble creep to the twin boundary (TB) migration and eventually to the perfect dislocationnucleation and activities. The experimental and simulation results imply that nanotwin-ning could be an effective approach to enhance the creep resistance of twin-free ng-Cu.The experimental creep results further verify the newly developed formula (Yang et al.,2016) that describes the time-, stress-, and temperature-dependent plastic deformation inpolycrystalline copper.
& 2016 Elsevier Ltd. All rights reserved.
1. Introduction
Creep behaviors, the plastic deformation under sustained stress at elevated temperatures, of metallic materials arecomplex and essential to their applications in industries. The creep behaviors depend highly on the external conditions oftime, stress, and temperature and the dependency comes from the response of the materials' micro/nano-structures. Thecreep deformation in polycrystalline metals can be mediated by lattice or grain boundary (GB) diffusion, GB and twinboundary (TB) movements, and dislocation activities. In coarse-grained (cg) metals, creep is mainly caused by the lattice
).k.

X.-S. Yang et al. / J. Mech. Phys. Solids 94 (2016) 191–206192
diffusion (Nabarro–Herring creep) (Herring, 1950) or GB diffusion (Coble creep) (Coble, 1963) under low sustained stress,and dislocation activities, such as moving dislocations interacting with “forest” dislocations, under high sustained stress. Innanograined (ng) metals, dislocation multiplication and motion are severely suppressed by the tiny lattice geometries andthe constraint of GBs. Thus, GB diffusion (Coble creep) and possible GB movements (GB sliding and migration, grain rotation,etc.) are dominant creep mechanisms in ng metals under low and medium stress level (Cai et al., 2001, 2000; Millett et al.,2008; Yang and Wang, 2004). Under high stress level, GBs related dislocation activity usually governs the creep deformationin ng metals (Cao et al., 2012; Huang et al., 2010; Jiang et al., 2006; Wang et al., 2011). The rate of diffusion-governed creepincreases monotonically with decreasing grain size, as decreasing grain size significantly increases the volume fraction ofGBs and thus the fast diffusion path (Wang et al., 2013a, 2012). Therefore, creep in ng metals presents considerably sizeeffect, that is, the smaller the grain size is, the higher the creep rate will be (Sanders et al., 1997). This fact indicates thatreducing grain size will considerably damage the creep resistance of ng metals, which has become the bottleneck problemfor the application of ng metals, especially at extreme conditions. The TB resistance against dislocation motion is much moremoderated, thereby both the strength and ductility of metals have been significantly optimized (Lu et al., 2004). Moreover,the nanotwinned (nt) structures show superior thermal stability compared with their ng counterparts (Zhang and Misra,2012; Zheng et al., 2013; Li et al., 2016), implying a potential applications of nt metals at elevated temperatures. The si-mulations revealed that the nt-Cu exhibits greater creep resistance with decreasing TB spacing (Jiao and Kulkarni, 2015).However, so far no comprehensively experimental creep tests on nt-metals have been reported in the literature to providesufficient and reliable information on the creep behaviors and associated mechanisms. This stimulates us to conductcomprehensive investigations, including creep tests at various temperatures, atomistic simulations, and high-resolutionelectron microscopy (HREM), on the creep behaviors of nt-Cu.
Deformation activation energy, activation volume, and stress exponent are micro/nanostructure-related parameters incharacterizing the time-, stress-, and temperature-dependent creep behaviors. The steady state creep rate (SSCR) εss hasbeen widely described by the well-known Mukherjee–Bird–Dorn (MBD) equation (Mukherjee et al., 1969):
ε σ = − Δ( )
⎛⎝⎜
⎞⎠⎟A
Gk T
exp ,1
ssn
B
where A is a micro/nanostructure-dependent constant; σ , kB and T are the applied sustained stress, Boltzmann's constantand temperature, respectively; ΔG is the nominal activation energy, and n is the stress exponent. According to Eq. (1), the ΔGcan be extracted once one has the experimental data of the creep rate under a sustained stress at various temperatures. TheΔG might depend on the applied sustained stress. For example, the impression creep tests on as-cast and -aged Mg-4wt%Znalloy at 423–523 K (Alizadeh et al., 2013) were illustrated in curves of the logarithmic SSCR versus the logarithmic punchingstress and these curves showed two distinct features called the high and low-stress regimes. The zero-stress activationenergies extended from nominal activation energy values were 135 kJ/mol and 92 kJ/mol, respectively, under high and lowstress regimes, which were consistent correspondingly with the activation energies of stress-assisted dislocation climbcontrolled by the lattice diffusion and pipe diffusion, respectively, thereby illustrating the dominant creep mechanisms.
In thermodynamic analysis, the mechanical work (σ σV ) reduces the nominal activation energy, where σ denotes tensile
stress and σV is called the tensile stress conjugated activation volume defined by = −σ σ∂Δ∂V G (Yang et al., 2016). Since the
plastic deformation in metals is usually caused by shear stress, a shear stress conjugated activation volume may be in-troduced. In the previous work (Yang et al., 2016), von Mises shear stress τvM for macroscopically isotropic solids was used
and its value was τ σ= / 3vM for uniaxial tension. Then the von Mises shear stress conjugated activation volume can be
defined by = − =τ τ σ∂Δ∂V V3G
vM vM. The von Mises shear stress conjugated activation volume, called the apparent activation
volume (Zhu and Li, 2010; Zhu et al., 2007), is widely adopted (Dao et al., 2007; Lu et al., 2005; Wang et al., 2005, 2006) andalso used in the previous work (Yang et al., 2016) for the convenience in comparison. In materials community, resolved shearstress τr is usually employed and the value of τr is linked to the uniaxial tensile stress by Taylor factor M, i.e., τ σ= M/r . Forpolycrystalline fcc metals, the Taylor factor is about 3.1 and usually approximated as 3 (Stoller and Zinkle, 2000). The
resolved shear stress conjugated activation volume = −τ τ∂Δ∂V G
r rcan be introduced and thus =τ σV MVr . To be consistent with
previous work, the von Mises shear stress conjugated activation volume is determined in the present work and hereafter itis called the activation volume and denoted by V for brevity. To experimentally determine the activation volume, one shouldhave many values of nominal activation energy and each value is determined from the SSCRs at various temperatures undera given sustained stress. Then, one can obtain the activation volume from the experimentally determined relationshipbetween nominal activation energy and sustained stress. In the literature, however, some researchers were trying to de-termine the activation volume from creep tests under various sustained stresses at only one temperature, usually roomtemperature (RT) (Cao et al., 2012; Elmustafa and Stone, 2002; Raj and Langdon, 1989; Wang et al., 2009a, 2009b, 2011). Thisapproach is called one-temperature approach hereafter. On one hand, it was assumed in the one-temperature approach thatthe effect of the applied sustained stress on the creep rate was only via the activation volume by ignoring obviously thepower-law relation expressed in the MBD Eq. (1) such that the activation volume could be obtained from the data curve
slope with = εσ
∂ ∂V k T3 B
T
ln ss . This assumption was supported by the experimental results that experimental data of

X.-S. Yang et al. / J. Mech. Phys. Solids 94 (2016) 191–206 193
logarithmic SSCR versus sustained stress seemed to be approximately linear (Cao et al., 2012; Elmustafa and Stone, 2002; Rajand Langdon, 1989; Wang et al., 2009a, 2009b, 2011). On the other hand, a pure power-law relation of ε σ ∝ss
n was alsoassumed in the one-temperature approach. This assumption was supported by experimental data of logarithmic SSCR versuslogarithmic stress at a given temperature often appeared approximately linear (Ma et al., 2002; Ranganath and Mishra,1996; Wang et al., 2009b, 2011) and thus the slope of the linearly curves was commonly treated to be the stress exponent n.As pointed out in our previous work (Yang et al., 2016), it was experimental errors, which always existed in the creep andstress relaxation tests, that made the same experimental data be expressed by two linear functions, logarithmic SSCR versusstress and logarithmic SSCR versus logarithmic stress. Obviously, the theoretical basis in the one-temperature approach isinconsistent in mathematics. The one-temperature approach might lead to that the higher the temperature was, the lowerthe determined activation volume and stress exponent would be (Alizadeh et al., 2013; Ma et al., 2002; Ranganath andMishra, 1996; Wang et al., 2009a). For example, the indentation creep tests on the ng-Ni with grain size of 14 nm undersustained load of 1 mN at temperatures of 348 K, 398 K and 448 K (Wang et al., 2009a), respectively, gave the stress ex-ponent and activation volume to be 14.81 and 3.78b3, 7.14 and 2.74b3, and 4.91 and 2.48b3, where b denoted the magnitudeof Burgers vector. The mathematic inconsistency in the one-temperature approach might be avoided if the dependency ofthe nominal activation energy on stress was expressed unambiguously in the MDB Eq. (1). We did it when investigating thestress relaxation behaviors of cg, ng, and nt copper (Yang et al., 2016).
In our previous work (Yang et al., 2016), stress relaxation tests were conducted at five temperatures of 22 °C (RT), 30 °C,40 °C, 50 °C, and 75 °C. Starting from the Arrhenius equation: ( )ε σ ε σ ( ) = ( ) − σΔ ( )T, exp ,p
Gk T0
BYang et al. (2016) assumed that
the pre-factor ε σ ( )0 and the nominal activation energy σΔ ( )G be independent of temperature over a certain temperaturerange of interest. The pre-factor ε σ ( )0 might have the 1/T temperature dependency (Dieter, 1986), which is much weakerthan the exponential dependency on temperature of the Arrhenius equation, especially at temperatures above RT. Within anarrow temperature range of interest, the pre-factor ε σ ( )0 can approximately be treated to be temperature-independent.Using the experimental data at the five temperatures, Yang et al. (2016) initially determined the values of ε σ ( )0 and σΔ ( )Gfrom the Arrhenius plots under a certain stress level. The nominal activation energy was treated as the stress-independentintrinsic activation energy ΔG0 minus the mechanical work of stress times the activation volume, as mentioned above. Thepre-factor ε σ ( )0 was regarded to have a power-law relationship with applied stress with stress exponent n. Thus, a novelArrhenius equation was built-up based on the experimental data of stress relaxation at various temperatures (Yang et al.,2016):
ε σ ε σσ
σ ( ) = − Δ +( )
⎛⎝⎜
⎞⎠⎟
⎛⎝⎜
⎞⎠⎟T
Gk T
Vk T
, exp3
,2
p
n
000
0
B B
where ε00 is a stress-independent parameter. The influence of grain size and twin spacing on the plastic deformation ratewas absorbed by the factor ε00. Comparing Eq. (2) to Eq. (1) indicates that Eq. (2) is the revised MDB equation with clear
expression of the activation volume. From Eq. (2), the strain rate sensitivity parameter m, defined by = =σε
σε
∂∂
∂∂ m
T T
loglog
lnlnp p
(Dieter, 1986), has the following relationship with the stress exponent n and the activation volume V, = + σnm
V
k T T
13 B
. The
stress contribution to the plastic strain rate could go through two channels, (a) lowering the intrinsic activation energy bydoing the mechanical work with its thermodynamic conjugate of activation volume and (b) varying the athermal stressfunction by changing the value of stress-dependent pre-factor ε0. Eq. (2) has been verified by the experimental data of stressrelaxation. The present work demonstrates that Eq. (2) is also powerful in the analysis of experimental creep data.
This paper is organized as follows. Section 2 gives the experimental methods that include the synthesis methods of theused copper specimens with different microstructures, the procedure of creep tests, conducted at temperatures of RT, 40 °C,50 °C, 60 °C, and 70 °C to investigate the time-, stress-, and temperature-dependent creep deformation, and the simulationmethodology. Section 3 summarizes experimental and simulation results of creep tests, which confirm the theoreticalformula of Eq. (2) to describe the time-, stress-, and temperature-dependent deformation. The relationship between thestrain rate sensitivity parameter, stress exponent, and activation volume is also discussed in Section 3. Based on the de-termined activation parameters, and the evidences from the HRTEM and MD simulation observations, Section 4 mainlydiscusses the transition in the deformation mechanism from the low stress level to high stress level in the specimens.Finally, concluding remarks are given in Section 5 to summarize the academic contributions of the present work and toemphasize that nanotwinning is a novel engineering approach to improve the creep resistance of the nanostructuredmetals.
2. Methods
The direct current electro-deposition method was used to synthesize ng and nt sheets with �500 μm thickness (Wanget al., 2008a, 2008b). Creep specimens were cut by electro-discharge machine from the as-deposited sheets and had dog-bone shape with 8 mm gauge length, 2.5 mm gauge width and 33 mm overall length. Double surfaces of specimens werepolished with SiC papers of 400 to 1200 grits and alumina suspensions of 0.1 μm. The microstructures of the as-deposited

X.-S. Yang et al. / J. Mech. Phys. Solids 94 (2016) 191–206194
and crept specimens were characterized by transmission electron microscopy (TEM, JEOL 2010F) operated at 200 kV. Thefracture surface morphologies of the crept specimens were observed by scanning electron microscopy (SEM, JSM-6300,JEOL) with operation voltage of 20 kV.
Uniaxial tensile creep tests were performed on a SEM-servo testing machine, which was a specially designed servo-hydraulic testing system with pulsating loads (sine wave) at 10 Hz and a maximum capacity of 71 kN. In the creep tests, astrain rate of 10�2 s�1 was adopted during the initial loading to a designed sustained stress level, and then creep strain wasrecorded with creep time. When the creep test in the steady state lasted for sufficient time (around 8 h), the stress wasincreased with the loading rate of 10�2 s�1 to another sustained level. Then, the creep test was carried on for �8 h againand after that the stress level was increased again. This procedure was continuously repeated until creep fracture occurredin the tested specimen. This mode of creep tests was called the stress-jump-creep tests, which was able to accelerate theexperiment procedure. The stress-jump-creep test on each specimen was isothermally conducted at a designed temperatureand the highest test temperature was 70 °C, at which no evidence of grain and twin growth was observed.
The MD simulations were carried out with LAMMPS code (Plimpton, 1995) on fully dense three-dimensional (3D) ng-and nt-Cu which contains 27 Voronoi grains with random orientations and similar grain diameter of �10 nm (see thegeometry in Fig. 5(a and b)). Coherent Σ3{ }111 TBs of the same length as the grain size were inserted into each of the grainswith random twin plane orientations and the TB spacing varied from 0.63 nm to 5.00 nm in order to explore the twin sizeeffect. A widely accepted embedded-atom method potential was used to describe the interatomic interactions of Cu (Mishinet al., 2001). Before loading, all the simulated samples were initially thermally equilibrated for 200 ps within a Nosé–Hooverthermostat after structural optimization (Hoover, 1985; Nosé, 1984). A constant strain rate of 2�108 s�1 was imposed foruniaxial tensile tests at 300 K. While for the creep tests, a series of sustained uniaxial tensile stresses with different mag-nitudes were applied to the samples. MD was conducted with an NrT ensemble, here r was the stress tensor. During thetensile and creep simulations, stresses were controlled by the Parrinello–Rahman technique (Parrinello and Rahman, 1981)and allowed to relax to negligible value along all directions except of the loading direction. Lattice defects in the
Fig. 1. (a) The tensile stress–strain curves of the ng- and nt-Cu at room temperature (RT), showing that nanotwins enhance simultaneously the strengthand ductility of the ng-Cu. (b) The developed stress-jump-creep tests on the ng-Cu and nt-Cu specimens under sustained stresses of 100 MPa, 150 MPa,200 MPa and 250 MPa at temperature of 40 °C. The creep fracture occurs in the ng-Cu specimen under sustained stress 250 MPa. (c) Creep strain versustime and associated strain rate versus time from the creep test on the nt-Cu specimen under 100 MPa at 40 °C, which shows that the secondary creep stage,i.e., steady state creep stage, with nearly constant creep strain rate has been reached after around eight-hours creep. (d) Steady state strain rates (SSCRs) ofthe ng-Cu and nt-Cu specimens crept at temperature of 40 °C under sustained stresses 100–250 MPa, showing that the nt-Cu possess a higher creepdeformation resistance than the ng-Cu.
X.-S. Yang et al. / J. Mech. Phys. Solids 94 (2016) 191–206 195
nanostructures were recognized by the common neighbor analysis (CNA) (Honeycutt and Andersen, 1987) or/and cen-trosymmetry parameter (CSP) (Kelchner et al., 1998), and the visualization was done by ATOMEYE (Li, 2003).
3. Results
3.1. Creep tests
As indicated in the previous work (Yang et al., 2016), the grain size of the twin-free ng-Cu is �70 nm. In the nt-Cu themean grain size is �65 nm and the twin lamellar thickness is �50 nm. Fig. 1(a) shows the RT stress–strain curves, in-dicating that compared to the ng-Cu counterpart, the nt-Cu enhances the ultimate tensile strength from �450 MPa to�650 MPa and the ductility from �4.5% to �11.5%. The results are consistent with the reported ones (Lu et al., 2009, 2004).Fig. 1(b) displays experimental data (curves) of the stress-jump-creep strain versus time obtained from the ng- and nt-Cu attemperature of 40 °C under sustained stresses of 100 MPa, 150 MPa, 200 MPa, and 250 MPa, respectively. The stress jumpcreep strain–time curves show apparently the stress jump and periodical fluctuation under a given sustained stress. Thefluctuation was caused by sinusoid noise in the used SEM-servo-hydraulic testing machine, which was trying to maintainthe preset load with a feed-back control system. Thus, the measured curves of creep strain versus time were combined bycreep curves plus the sinusoid noise, which made each of the measured creep data with two enveloping curves, an upperand a lower, as shown in Fig. 1(c). The noise influence was removed out by taking the mean of the upper and lowerenveloping curves as the creep curve. As an example, Fig. 1(c) presents the creep strain–time curve and the two envelopingcurves of the nt-Cu specimen under the sustained stress of 100 MPa at temperature of 40 °C. The original creep data of Fig. 1(b) shows clearly that under a given sustained stress, the creep strains in the ng-Cu are always higher than the corre-sponding strains in the nt-Cu. Noticeably, the creep rupture occurs in the ng-Cu under stress of 250 MPa with a ductility of�4.5%, whereas under the same stress level, the creep strain in the nt-Cu is lower than 3.5%, far smaller than the RT ultimatetensile ductility. In the first two hours-creep, the strain rate is high and drops very quickly, which might be called theprimary (transient) creep stage. After the primary stage, the strain rate still decreases with time within a narrow range from4.12�10�8 s�1 to 1.91�10�8 s�1 within the creep time period from 2 to 8.8 h. Considering the slow deceleration, wemight approximately regard the creep reaches the secondary creep stage, i.e., steady state creep stage, after total � 8 hcreep and the strain rate at � 8 h might be roughly treated as SSCR εss. Fig. 1(d) shows the SSCRs of the ng- and nt-Cu creptat temperature of 40 °C with the sustained stresses of 100 MPa, 150 MPa, 200 MPa, and 250 MPa, illustrating that the SSCRincreases with the increase of the sustained stress for both the ng and nt-Cu. At a given stress level, the SSCR is considerablylower in the nt-Cu than that in the ng-Cu. For instance, the SSCR in the nt-Cu under sustained stress of 250 MPa is almosttwo orders in magnitude lower than that in the ng-Cu. Obviously, the creep behavior depends highly on the micro/na-nostructure of the specimens and nanotwins increase the creep resistance of the nanostructured metals.
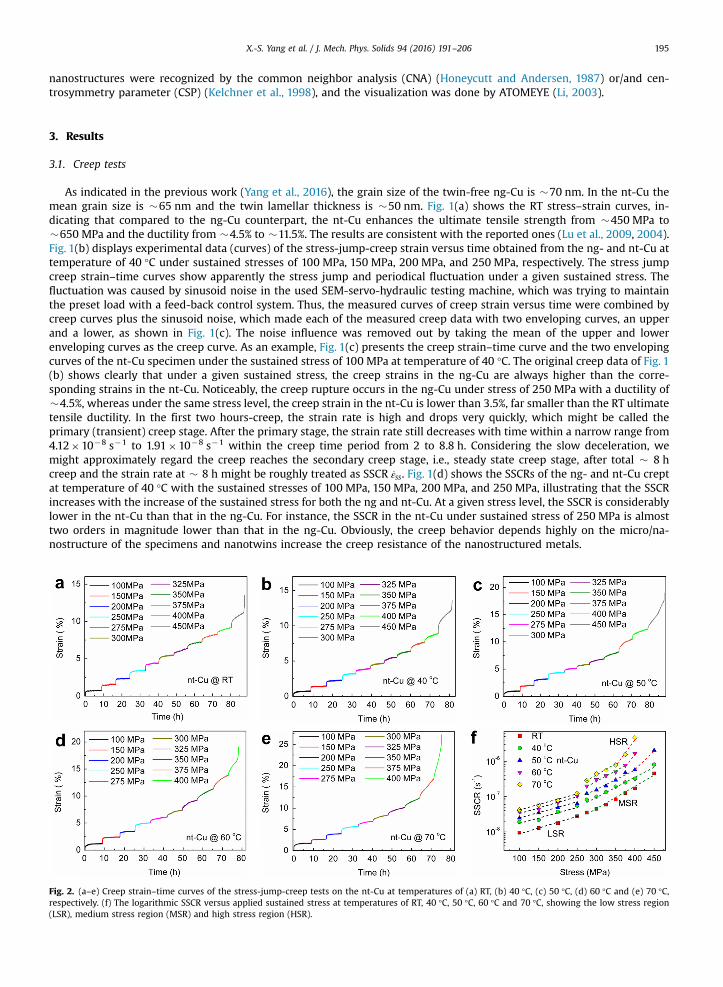
Fig. 2. (a–e) Creep strain–time curves of the stress-jump-creep tests on the nt-Cu at temperatures of (a) RT, (b) 40 °C, (c) 50 °C, (d) 60 °C and (e) 70 °C,respectively. (f) The logarithmic SSCR versus applied sustained stress at temperatures of RT, 40 °C, 50 °C, 60 °C and 70 °C, showing the low stress region(LSR), medium stress region (MSR) and high stress region (HSR).

X.-S. Yang et al. / J. Mech. Phys. Solids 94 (2016) 191–206196
As mentioned above, creep tests at various temperatures must be conducted to extract the values of creep characteristicsincluding the intrinsic activation energy, activation volume, and stress exponent. Fig. 2(a–e) correspondingly shows thecurves of stress-jump-creep strain versus time of the nt-Cu with a series of sustained stress jumped from 100 MPa to thefracture occurrence at temperatures of RT, 40 °C, 50 °C, 60 °C, and 70 °C, respectively. It is noted that fracture occurs underthe sustained stress of 450 MPa at temperatures of RT, 40 °C and 50 °C, whereas the fracture sustained stress is 400 MPa athigher temperatures of 60 °C and 70 °C. This result is expected because creep damage is a thermally activated failureprocedure. Under a given sustained stress, the higher the creep temperature is, the shorter the creep life will be. For acertain creep life, the higher the creep temperature is, the lower the applied sustained stress will be. Fig. 2(a–e) also indicatethat the ultimate strain at creep fracture continually increases with the increase of creep temperature, e.g., increasing from�11.5% at RT to �25% at 70 °C. Fig. 2(f) shows the plots of the logarithmic SSCR versus sustained stress in the nt-Cu attemperatures of RT-70 °C. For a given temperature, the magnitude of the SSCR increases with the increase of the sustainedstress. For example, the SSCR at RT increases from 9.56�10�9 s�1 under stress 100 MPa to 4.57�10�7 s�1 under stress450 MPa. And for a given sustained stress, the magnitude of the SSCR increases with increasing creep temperature. Forinstance, the SSCR under stress 100 MPa increases from 9.56�10�9 s�1 at RT to 4.25�10�8 s�1 at 70 °C. Fig. 2(f) impliesthat the creep behavior depends greatly on the creep temperature and the applied sustained stress. The curves of loga-rithmic SSCR versus stress might be divided into three characteristic linear regions. The first linear region occurs with lowstresses (LSR) ranging from 100 MPa to 250 MPa, in which the SSCR increases very slowly with stress. The second linearregion is featured by a higher slope in logarithmic strain rate versus sustained stress in comparison with that in the LSR. Thesecond linear region might be called the medium stress region (MSR), which starts from stress 275 MPa for all creeptemperatures, but the upper limit stress is 450 MPa at RT and 40 °C, 400 MPa at 50 °C, 375 MPa at 60 °C, and 350 MPa at70 °C. Beyond the upper limit stress of MSR, the third linear region happens with relatively high stresses (HSR) and tem-peratures, in which the SSCR jumps from the corresponding value under the ending stress of MSR and the jump magnitudedepends on the ending stress of MSR and temperature. The change from LSR, to MSR and to HSR might imply a switch in thecreep mechanisms.
The SSCR εss may also be expressed by Eq. (2), which is re-written here with minor revision of the notations,
ε σ ε σ σ ε σσ
σ ( ) = ( ) − Δ ( ) = − Δ −( )
⎛⎝⎜
⎞⎠⎟
⎛⎝⎜
⎞⎠⎟
⎛⎝⎜
⎞⎠⎟T
Gk T
G Vk T
, exp exp/ 3
3ss ss ss
n
0B
000
0
B
where σ is the sustained tensile stress; ε σ ( )ss0 and σΔ ( )G are the temperature-independent creep rate and the stress-de-pendent nominal activation energy, respectively; ΔG0 is the intrinsic activation energy at zero stress; V is called the acti-vation volume; εss00, σ0 and n are respectively the stress-independent parameter, reference stress and stress exponent. Usingthe experimental data in Fig. 2(f), we plot and linearly fit logarithmic SSCR versus reciprocal temperature under each of the
Fig. 3. (a–c) Arrhenius plots of logarithmic SSCR against the reciprocal temperature in the (a) LSR, (b) MSR and (c) HSR to determine the stress-dependentactivation energy and the stress-dependent plastic deformation rate. (d) The stress-dependent activation energy versus stress with linear fitting to de-termine the stress-independent activation energy and the activation volume in the LSR and MSR. (e, f) The logarithmic stress-dependent plastic de-formation rate versus logarithmic stress for the (e) LSR and (f) MSR with linear fitting to determine the stress exponent.

Fig. 4. (a, d) Logarithmic SSCR versus logarithmic stress at temperatures of RT, 40 °C, 50 °C, 60 °C and 70 °C to determine the strain rate sensitivityparameter m in the (a) nt-Cu and (d) ng-Cu. (b, c) The reciprocal of strain rate sensitivity parameter versus the term of σ
kBTat various temperatures in the
(b) LSR and (c) MSR for the nt-Cu.
X.-S. Yang et al. / J. Mech. Phys. Solids 94 (2016) 191–206 197
applied sustained stresses, as shown in Fig. 3(a and b). The linear fitting indicates that the Arrhenius relation of Eq. (3) holdsfor the creep process in the LSR and MSR over the entire range of creep temperatures. The values of σΔ ( )G and ε σ( ( ))ln ss0 arerespectively determined from the slope and the intercept of the linear fitting. Then, the determined σΔ ( )G is plotted againstthe sustained stress in Fig. 3(d), showing clearly that the σΔ ( )G decreases almost linearly with increasing stress for eachregion of LSR and MSR. Fig. 3(d) illustrates that there is a jump in the σΔ ( )G when the sustained stress is increased from
Table1
The determined reciprocal strain rate sensitivity 1/m, stress exponent n, and the term σV
kBT3in the LSR and the MSR in the nt-Cu at temperatures of RT,
40 °C, 50 °C, 60 °C and 70 °C, where the average stress σ is taken from the stress range in Fig. 4.
RT 40 °C 50 °C 60 °C 70 °C
Low stress region (LSR)1/m 1.112 1.183 1.018 1.096 1.118n 0.877 0.877 0.877 0.877 0.877
σV
kBT30.267 0.252 0.244 0.237 0.230
σ (MPa) 175 175 175 175 175
Medium stress region (MSR)1/m 5.082 4.532 4.371 4.141 4.150n 1.716 1.716 1.716 1.716 1.716
σV
kBT33.072 2.895 2.677 2.501 2.335
σ (MPa) 353.6 353.6 337.5 325 312.5

X.-S. Yang et al. / J. Mech. Phys. Solids 94 (2016) 191–206198
250 MPa to 300 MPa, which might imply a change in the creep mechanism. Linear fitting the data of σΔ ( )G versus stress ineach region of LSR and MSR gives the values of ΔG0 and V to be Δ =G I0 0.282 eV and =VI 0.65 b3 in the LSR, and Δ =G II0
0.487 eV and =VII 3.67 b3 in the MSR, where =b 2.56 Å is the magnitude of Burgers vector of a perfect ¯ { }110 11112
dis-location in fcc-Cu. Fig. 3(e and f) shows the almost linear relationship between ε σ( ( ))ln ss0 and σ( )ln in the LSR and MSR,respectively, and the linear fitting yields the stress exponent n¼0.877 in the LSR and n¼1.72 in the MSR. As mentionedabove, the creep mechanism might change with temperature under a given sustained stress. Fig. 3(c) shows the logarithmicSSCR versus reciprocal temperature under the sustained stress of 400 MPa, indicating two linear regions of temperatures.When the creep temperature is lower than 40 °C, the σΔ ( )G is extracted to be 0.344 eV, while when the creep temperature ishigher than 40 °C, the σΔ ( )G is increased to 0.992 eV.
According to the definition of strain rate sensitivity parameter m, Fig. 4(a) plots the curves of logarithmic SSCR versuslogarithmic stress at various temperatures, indicating again that the curves can be divided into three linear regions, similarto the corresponding curves in Fig. 2(f). The two corresponding linear curves shown respectively in Figs. 4(a) and 2(f) arebased on one set of experimental data, demonstrating that the same experimental data can be approximately expressed bytwo different functions, which must be caused by experimental errors. The determined m values exhibit distinct dropsbetween the stress regions and they are mL¼0.895–0.982 in the LSR, mM¼0.197–0.242 in the MSR, and mH¼0.076–0.094 inthe HSR. Clearly, this approach treats them as a constant at a given temperature and over a certain stress range. Based on Eq.
(3), however, we shall have = + σn ,m
V
k T T
13 B
which indicates that the m is not a constant within a stress range, rather varies
linearly with stress. The experimental errors make the m approximately be a constant within a narrow stress range. Thus, a
mean or representative stress in the stress range might be used to validate the relationship of = + σn ,m
V
k T T
13 B
where σ is the
mean stress in each linear region. Using all values of the reciprocal of strain rate sensitivity 1/m, stress exponent n, the
calculated value of σV
kT3and the associated σ in the LSR and MSR at temperatures of RT-70 °C listed in Table 1 for the nt-Cu,
we validate this relationship of = + σnm
V
k T T
13 B
. For example, we have ( ) ≈ ( ) + ( )σn1.118 0.877 0.23m
V
k T
13 70 CB o
with
σ = 175 MPa in the LSR, and ( ) ≈ ( ) + ( )σn4.15 1.716 2.335m
V
k T
13 70 CB o
with σ = 312.5 MPa in the MSR at temperature of 70 °C
for the nt-Cu. Moreover, based on the relationship of = + σnm
V
k T T
13 B
and the σ value listed in Table 1, we plot 1/m versus σk TB
in Fig. 4(b) for the LSR and in Fig. 4(c) for the MSR to estimate the activation volume V and stress exponent n. The de-termined values of V and n are 0.55 b3 and 0.891 in the LSR, and 4.45 b3 and 1.186 in the MSR, all of which are consistent
Fig. 5. (a, b) Micro/nanostructures of the simulated nt-Cu samples with grain size =d 10 nm, in each of the grains twins are inserted with TB spacing λranging from 0.63 nm to 5.00 nm. (c) Stress–strain curves of the simulated nt-Cu with various values of λ. (d) Flow stress as a function of λ. (e) Creep strainversus time curves of the MD simulations on the ng-Cu and the nt-Cu with TB spacing ranging from 0.63 nm to 4.38 nm. (f) Creep strain rate versus TBspacing ranging λ.

X.-S. Yang et al. / J. Mech. Phys. Solids 94 (2016) 191–206 199
with those determined in Fig. 3(e and f). Those self-consistent analyses of the experimental data verify the relationshipbetween the m, n and the V. Fig. 4(d) shows the logarithmic SSCR versus logarithmic stress for the ng-Cu at 40 °C, exhibitingclearly two linear regions. The linear fitting gives mng-I¼0.465 in the first linear region (100–200 MPa), which is smallerthan mL but larger than mM in the nt-Cu. While mng-II is 0.102 in the second linear region (200–250 MPa), which is smallerthan mM and close to the mH in the nt-Cu. In other words, under the same level of applied sustained stress, the strain ratesensitivities in the ng-Cu specimens are always smaller than those in the nt-Cu specimens, which should be attributed totheir differences in the microstructure. As statistically evented in our previous work (Yang et al., 2016) and indicated in Fig. 1(a), the nt-Cu possesses the average grain size of �65 nm and twin spacing of �50 nm, which are both smaller than theaverage grain size of �70 nm in the ng-Cu. Many experiments have revealed the m values of m¼0.01–0.03 in ultrafinegrained metals (Dalla Torre et al., 2002; Wei et al., 2004) and m¼0.02–0.1 in ng and nt metals (Chen et al., 2006; Lu et al.,2001, 2005; Wei et al., 2004), obviously different from the value of m¼0.002–0.007 in the cg counterparts (Follansbee andKocks, 1988; Follansbee et al., 1984). That is, with decreases in the characteristic of grain size or twin spacing, an increase inm has been found to be common for fcc metals. In addition, experimental results also show that the m value increases withTB density. For example, the m of Cu with a high density of twin lamellar spacing of 20 nmwas shown to be 0.035, which isobviously larger than m¼0.025 of the Cu with lower twin density and about seven times higher than that of ultrafinegrained Cu without twins (Lu et al., 2005). The value of the strain rate sensitivity parameter is highly dependent on thematerial microstructure and then creep mechanism, which will be discussed in detail later by combing with other de-termined deformation parameters, HRTEM observations, and MD simulation results.
3.2. Atomistic simulated creep tests
Fig. 5(c) shows the stress–strain curves from the uniaxial tensile test simulations at 300 K on the nt-Cu with variousvalues of TB spacing λ, where each curve is averaged on three stress–strain curves obtained on three MD models with thesame grain size and λ, but different initial distributions of grain and twin orientations. This approach reduces the fluctuationin estimation of the flow stress. Fig. 5(d) shows the flow stress as a function of λ, where the flow stresses and the associatederror bars are deduced from the curves shown in Fig. 5(c) in the strain range between 8% and 15%. It is noteworthy that theflow stresses of all the nt structures are larger than that of their twin-free counterpart. With decreasing λ, the flow stressexperiences a Hall–Petch relationship to an inverse Hall–Petch relationship and the highest flow stress appears atλ = 1.25 nm, which agrees qualitatively with both existing experiments (Lu et al., 2009) and atomistic simulations (Li et al.,2010). Once the simulated flow stress behavior is known, the creep performance of the nt-Cu is investigated by the MDsimulations. As an example, Fig. 5(e) shows typical creep curves of the nt-Cu under sustained stress of 2.00 GPa at tem-perature of 600 K, indicating that the creep strain decreases with the decrease of λ until λ = 1.25 nm and then increases withλ. This phenomenon is consistent with the combined Hall–Petch and inverse Hall–Petch relationship observed in the flowstress. Fig. 5(f) shows the SSCR εss which are determined empirically from the regime of the steady-state of Fig. 5(e) as afunction of λ. Note that we apply very high stress in order to creep the samples within the finite MD time window, thesteady states are pretty short as compared with experiments (Wang et al., 2011, 2013b; Wolf et al., 2005). As anticipated, allthe nt samples creep more slowly than their twin-free counterpart and the creep rate is considerably decelerated by na-notwins with the decrease of the λ until λ = 1.25 nm. The simulation results are consistent with the experimental findingsthat the nt-Cu creep slower than that of the corresponding ng-Cu. The slowest creep rate appears at λ = 1.25 nm. Actually,the twin-free, and λ = 1.25 nm nanotwinned samples set up the upper and lower bounds of creep deformation rate,
Fig. 6. Activation energy and strain rate sensitivity parameter from the MD simulations of creep. (a) Arrhenius plot of creep rate against reciprocaltemperature under applied sustained stress of 2 GPa. The slopes of the linear fitting lines indicate the nominal activation energies at stress 2 GPa. Na-notwinned sample presents larger norminal activation energy. (b) Log–log plot of creep strain rate versus stress at the creep temperature of 600 K. Theinverse strain rate sensitivity parameters are determined from the slopes of these linear fitting lines.

X.-S. Yang et al. / J. Mech. Phys. Solids 94 (2016) 191–206200
respectively. Here the trend of creep rate versus λ appears to be completely reversed to the flow stress versus λ, therebyillustrating that the higher the flow stress is, the slower the creep rate will be.
Fig. 6(a) shows the logarithmic εss against temperature under sustained stress of σ = 2.0 GPa for the simulated ng and nt-Cu. The linear fitting gives the σΔ ( )G to be 0.42 eV in the nt-Cu ( =d 10 nm, λ = 1.25 nm), which is larger than that of 0.32 eVin the twin-free counterpart, meaning that nanotwins enhance the σΔ ( )G and thus make the creep difficult. The MD derived
σΔ ( )G in the nt-Cu is of the same order as that observed in the experiment. Fig. 6(b) illustrates the logarithmic SSCR versuslogarithmic stress at temperature of 600 K for the simulated ng- and nt-Cu, in which the slope gives the reciprocal of strainrate sensitivity. We find m¼0.076 for the nt-Cu and m¼0.085 for the ng-Cu. The order of the m is comparable with thatdetermined in the HSR of the experimental creep (see Fig. 4). The results also match previous experiments on creep of anng-Cu with grain size of 9 nm, in which the m¼0.07–0.12 under applied sustained indentation hardness between 1.7 GPaand 2.1 GPa (Huang et al., 2010). Because of the limited calculation capacity, the simulated creep samples were smaller insize, at higher temperature, and under higher stress, which lead to higher strain rate, in comparison with those in the creepexperiments, as shown in Figs. 5(e and f) and 6(b). It might be due to the simultaneous increase in stress and strain rate thatthe estimated strain rate sensitivities from both experiments and simulations were comparable (Zhu and Li, 2010; Zhu et al.,2007).
4. Discussion
4.1. Deformation parameters
The deformation parameters, e.g., the activation energy, activation volume, strain rate sensitivity parameter, and stressexponent, could shed light on the mechanism of the time-, stress-, and temperature-dependent creep deformation. Therevised MBD equation of Eq. (3) indicates that sufficient data of creep rates at various temperatures under a certain stressare required to initially determine the pre-factor ε σ ( )ss0 and the stress-dependent nominal activation energy σΔ ( )G , whichare approximately treated as temperature-independent constants over a certain temperature range of interest. From theε σ ( )ss0 and σΔ ( )G , respectively, one can determine the stress exponent, the stress-independent activation energy and theactivation volume. The three parameters are temperature- and stress-independent intrinsic properties over certain ranges oftemperature and stress. The determined creep activation parameters are all extracted from the experimental data andmeanwhile verifying the revised MBD equation.
Once having the values of key deformation parameters, we are able to uncover the competing creep mechanisms. Thevalues of V/ΔG0/n/m for the nt-Cu are 0.65 b3/0.282 eV/0.877/(0.895–0.982) in the LSR, while 3.67 b3/0.487 eV/1.716/(0.197–0.242) in the MSR. The activation volume may represent a generalized area swept by a perfect dislocation during thethermally activated deformation process. Provided that the perfect dislocation sweep mechanism could be valid in all stressregions, the swept area in the LSR is 0.04 (nm)2 and increases to 0.24 (nm)2 in the MSR, which are too small to believe theperfect dislocation sweep mechanism. Alternately, these small swept areas suggest the deformation mechanisms of atomicdiffusion, GB/TB movement, or/and partial dislocation activity. It is widely accepted that dislocation-mediated plastic de-formation possesses a large activation volume, at the order of several hundred b3 and above, while an extreme smallactivation volume, e.g., less than 1 b3, denotes the GB diffusion mediated creep (Coble creep) or lattice diffusion mediatedcreep (Nabarro–Herring creep), while the former dominates diffusive creep of the ng metals. The activation volume rangingfrom several b3 to 100 b3 might be related to the dislocation cross-slip or/and dislocation nucleation (Dao et al., 2007, 2006;Lu et al., 2005; Wang et al., 2009b, 2011). On the other hand, dislocation-mediated plastic deformation entails an activationenergy larger than 1 eV, while the activation energy for GB diffusion is smaller than 1 eV (Caillard and Martin, 2003). Forexample, the activation energy in the ng-Ni is 1.1 eV for dislocation-mediated stress relaxation (Wang et al., 2006) and 0.2–0.7 eV for the GB diffusion (Van Swygenhoven and Caro, 1998). The activation energy for GB diffusion in the ng-Cu rangesfrom 0.3 eV to 0.72 eV (Cai et al., 2000; Dickenscheid et al., 1991; Horváth et al., 1987). Moreover, the stress exponent ofn¼1, n¼1–2, and n¼4–9 might indicate the diffusion creep (Coble, 1963; Herring, 1950), GB-associated creep (Wang et al.,2011), and dislocation-mediated creep (Kassner, 2009), respectively. A highly strain rate sensitive material is expected to beductile and even superplastic (Hutchinson and Neale, 1977). It is reported (Coble, 1963; Lüthy et al., 1979) that the dis-location-mediated plasticity results in the low strain rate sensitivity parameter (mo0.1), while a stain rate sensitivityparameter around unity (m�1.0) denotes the GB diffusion creep (Coble creep). The m values ranging from 0.1 to 1 might berelated to the GB sliding or/and grain rotation. The above determined values of stress-independent activation energy, ac-tivation volume, stress exponent, and strain rate sensitivity parameter may indicate the transition in the predominant creepmechanism in the nt-Cu, i.e., from the GB diffusion creep in the LSR to the dislocation activity-dominated deformation in theHSR. In details, the Coble creep is predominant in the LSR, as characterized by the lowest value of the intrinsic activationenergy ΔG0 of 0.282 eV and the smallest activation volume less than 1 b3. In the MSR, the values of ΔG0/V/n¼0.487 eV/3.67b3/1.76 and the m values of 0.197–0.242 might be the signs of the GB sliding or/and grain rotation mediated creep. As thetwin planes are coherent in nature, the TB rotation is rarely to occur (Li et al., 2010), while the nucleation and motion ofpartial dislocations parallel to TBs, i.e., TB migration mechanism, is a deformation mechanism in nt-metals (Li et al., 2010; Luet al., 2009). The TB migration mechanism has been proposed for the nt-Cu with the values of the deformation parameters(Yang et al., 2016), which suggests that the TB migration is the predominating mechanism in the MSR. As indicated in Fig. 3

Fig. 7. A creep map is constructed for the nt-Cu specimens in the LSR, MSR and HSR regions.
X.-S. Yang et al. / J. Mech. Phys. Solids 94 (2016) 191–206 201
(c), the experimental data in the HSR were only enough to determine the nominal activation energy ΔG(s¼400 MPa), notsufficient to the stress-independent activation energy ΔG0 and activation volume. The determined apparent/nominal acti-vation energy ΔG(s¼400 MPa) might also suggest the creep mechanisms in the HSR. Fig. 3(c) shows two linear regions ofthe Arrhenius plot under stress of 400 MPa. When the creep temperature is lower than 40 °C, the extracted σΔ ( )G of0.344 eV is very close to the value representing the TB migration mechanism. When the creep temperature is higher than
Fig. 8. Nanotwins impede diffusion-induced GB movement in the simulated ng-Cu. (a) The mean-squared displacement (MSD) versus time at tempera-tures ranging 700–1000 K, where the solid and dashed lines represent the nt-Cu and ng-Cu samples, respectively. (b) Arrhenius plot of diffusion coefficientagainst reciprocal temperature. (c, d) MD snapshot of the (c) ng-Cu and (d) nt-Cu samples after 1 ns diffusion at 1000 K, where atoms are colored by theircentrosymmetry parameter and the white contours indicate the original GB positions.

X.-S. Yang et al. / J. Mech. Phys. Solids 94 (2016) 191–206202
40 °C, the extracted σΔ ( )G is increased to 0.992 eV, which might be related to the dislocation-TB interaction. The TB mi-gration in the MSR and the dislocation interaction with TBs in the HSR are further verified by the HRTEM and MD ob-servations, which will be described later. For the ng-Cu specimens, the predominant creep mechanism might transit fromthe GB sliding or/and grain rotation in the LSR with stresses of 100–200 MPa to the dislocation-GB interaction in the MSRwith stresses of 200–250 MPa. The Coble creep might predominate in the stress region lowering than 100 MPa in the ng-Cu,as the smallest mechanical driving force is needed there.
Fig. 7 shows that a creep map with deformation strain rate contours of dashed lines is constructed for the nt-Cu spe-cimens based on the modified MBD equation of Eq. (3) and the determined activation parameters in the LSR, MSR and HSRregions. The present work suggests several mechanisms of the time-, stress-, and temperature-dependent creep de-formation in the nt-Cu specimens, which are (1) Coble creep diffusion in the LSR, (2) TB migration mechanism in the MSR,(3) dislocation mediated plasticity plus TB migration mechanisms in the HSR, and (4) the mixed mechanisms in the stresstransition region between the LSR and MSR. Since the HSR did not show up at creep temperatures of RT and 30 °C, thelowest stresses in the HSR are estimated, as indicated by red dash line in the figure. The creep map indicates a general trendthat under high sustained stress and at low creep temperature, the dislocation mediated plasticity dominates the creepdeformation and yields high strain rates, whereas low sustained stress and high creep temperature favor the TB migrationand Coble diffusion mechanisms.
4.2. Resistance of nanotwins against creep deformation
The present experiments and simulations all show that nanotwins are able to effectively slow down the creep de-formation. The high symmetry/coherent and low energy of TBs make the TBs very stable. As discussed above, the Coblecreep, GB sliding or/and GB rotation mechanisms are dominated in the ng-Cu creep only under sustained stress lower than200 MPa, while the Coble creep and the TB migrations might occur in the nt-Cu creep under higher sustained stress of375 MPa. Fig. 8(a) displays the mean-squared displacement (MSD) versus time within 700–1000 K, where the MSD iscalculated by tracing the time-dependent positions of all atoms and regarded as the ensemble average of a simulated systemin MD. The MSD versus time is obviously the indicator of diffusion. Note the activation energy of lattice diffusion (�2 eV) ismuch larger than that of GB diffusion in Cu (�0.6 eV) (Wang et al., 2013a) and thus GB diffusion must be dominant in theng-Cu and nt-Cu. Fig. 8(a) shows that the solid lines for the nt samples are always below the dashed lines for the ngcounterpart, thereby indicating that TBs effectively suppress the diffusion process. The diffusion coefficient
( )= − ΔD D exp Gk Tb b0
diff
Bcould be given by the Einstein equation via =
( ) − ( )D
r rt
tb0
6
2
, where Db0 is a diffusion pre-exponential
factor, ΔGdiff is the activation energy of diffusion, and ( )r t and ( )r 0 are the positions of atoms at time t , and =t 0, respec-tively, and t¼1 ns is used in the present work. Fig. 8(b) shows the Arrhenius plot of diffusion coefficient against reciprocaltemperature. The GB diffusion activation energy is the same of 0.50 eV for both ng and nt-Cu, while the nt structure presentsobviously a smaller diffusion pre-exponential factor (7.75�10�10 m2/s) than that of twin-free sample (4.65�10�9 m2/s).The MD observation is in agreement with a recent in situ TEM observation which concludes that the TBs-modified GBs slowdown the atomic transport along the GBs by one order of magnitude (Chen et al., 2008). Therefore, nanotwins reduce thediffusional creep damage of nanostructured metals. Fig. 8(c and d) represents the morphologic snapshots of the MD samplesafter 1 ns creep, where the white profiles indicate the original positions of GBs before creep. Note that each of the simulatedsystems is thermally equilibrated for 200 ps before tracing diffusion, which might result in a slightly difference in theoriginal morphologies of the samples. Compared with the ng-Cu, TBs in the nt-Cu effectively suppress the GB movement,
Fig. 9. Typical SEM images of the fracture surfaces, where the insets are of lower magnitude, of (a) the ng-Cu specimen stress-jump-creep fractured under250 MPa at 40 °C and (b) the nt-Cu specimen stress-jump-creep fractured under 400 MPa at 70 °C.

X.-S. Yang et al. / J. Mech. Phys. Solids 94 (2016) 191–206 203
i.e., suppress the GB migration and sliding, which improve the creep property and enhance the thermal stability of ng metals(Zhang and Misra, 2012).
Although nanotwins greatly suppress the GB movement, nanotwins promote the dislocation-mediated plasticity andthus delay the creep fracture. As shown in the present work, the creep fracture occurs under the sustained stress of 250 MPain the ng-Cu, while in the nt-Cu, the creep fracture happens under the sustained stress of 450 MPa. In addition, the creepfracture strain in the ng-Cu is �4.5% at 40 °C, obviously less than that of �12.5% in the nt-Cu. The dislocation-GB interactionis the predominant mechanism in the plastic behavior of ng metals, because dislocations are very difficult to accumulate andpile-up in the interior of nanometer size grains. On and near GBs, wide-awake of dislocation sources might be existed toallow dislocations to nucleate readily. However, these dislocation sources are not regenerative and might be exhaustedinstantly upon straining (Dalla Torre et al., 2005; Koch, 2003; Wang et al., 2005), which leads to the absence of work-hardening and thus the limited ductility in ng metals. Fig. 9(a) and its inset show the typical SEM images of the creepfracture surfaces of the ng-Cu stress-jump-crept from 100 MPa to 250 MPa at temperature of 40 °C, exhibiting a “void-like”structure with low density and small size of dimples. The cups and cones (marked by yellow and white arrows), named asnano-concave and nano-convex, respectively, could be widely found with size lowering than 100 nm, which is close to thegrain size of the ng-Cu. The fracture surface morphology of the ng-Cu implies that the GB diffusion/sliding is along GBs anddislocation activities are confined by GBs, which causes the stress concentrations at GBs, hence forming voids and inducingthe intergranular fracture. In contrast, the TB-mediated dislocation nucleation and slip transfer reaction promote effectivelydislocation-mediated plasticity in the nt-Cu. The coherent TBs resistance against dislocation motion is much more mod-erated in comparison with the GB-dislocation interaction. In nt metals, lattice dislocations can be readily trapped andabsorbed by TBs. Besides, TBs could work as the dislocation sources as well. Depending upon the nature of the incomingreactant dislocations, the dislocation-TB interaction in nt metals may result in glissile dislocations along TBs (i.e. twinningpartials), sessile dislocations or locks at TBs, and/or outgoing dislocations or stacking faults in the neighboring twin planes(Christian and Mahajan, 1995; Jin et al., 2008, 2006; Lu et al., 2005; Mahajan et al., 1970; Zhu et al., 2007). Those dis-locations/faults accumulated on TBs remain mobile or/and become dislocation sources because of the TB coherency. Fig. 9(b) and its inset show the typical SEM images of the fracture surface in the nt-Cu stress-jump-crept from 100 MPa to400 MPa at temperature 70 °C, displaying that high density of fracture dimples spread uniformly and extend across most ofthe specimen cross-section. The dimple size is 2 μm in average, which is two orders of magnitude larger than the averagetwin thickness, thereby indicating that local plastic deformation is not confined by the size of nanotwins but develops to agreater scale (Zhang et al., 2008). In the nt specimens, partial and perfect dislocations can easily be emitted from the TB–GBintersections and other locations with high stress concentrations, which has been reported by the in-situ HRTEM ob-servation on nt-Cu during mechanical tests (Lu et al., 2015). The stress concentration on TB–GB intersection has been clearlyshown in our previous work (Yang et al., 2016). Moreover, a critical twin spacing was reported for the transition of
Fig. 10. HRTEM and atomistic configurations fromMD simulations about TBs migration and dislocation activities-mediated mechanisms of creep. (a, b) and(d, e) Bright-field TEM and associated HRTEM images of the nt-Cu specimen stress-jump-crept at 70 °C under (a, b) 300 MPa and (d, e) 400 MPa. (c, f)Atomistic configurations from MD simulations of (c) parallel and (f) inclined dislocation nucleation with respect to the TB (111) planes. The former leads toTB migration, while the latter induces full dislocation slip if the twin spacing is wide enough. Defective atoms are recognized by the centrosymmetricparameter.

X.-S. Yang et al. / J. Mech. Phys. Solids 94 (2016) 191–206204
dislocation nucleation from steps on TBs to TB/GB junctions. The moderate resistance of TBs means that dislocations easilycut through TBs, thereby resulting in high ductility. Plasticity-induced voids are finally formed with high density, giving thefracture morphology of dimples, which size could be significantly larger than the individual grains and the rim of thesedimples on the fracture surface do not necessarily coincide with GBs (Kumar et al., 2003).
4.3. HRTEM and MD simulation evidences on the creep mechanisms
Fig. 10(a and b) shows respectively the bright-field TEM and its associated HRTEM images of the nt-Cu stress-jump-creptat temperature 70 °C under the sustained stress of 300 MPa for �8 h, i.e., in the MSR. The TEM images in Fig. 10(a) and itsinset show that a large amount of defects debris accumulates near the TBs, making the TBs severely strained. Fig. 10(b) givesthe Fourier filtered atomic-scale image enlarged from rectangle of the inset in Fig. 10(a). The indexed Burgers circuit inFig. 10(b) shows clearly that the accumulated defect is a Shockley partial dislocation with Burgers vector of = [¯ ¯ ]b a/6 121 ,moving along the TB. The movement of Shockley partial dislocations along TBs results in TB migration and may change theoriginal width of a twin, thereby termed as twining or detwinning (Li et al., 2010; Wei, 2011). Fig. 10(d and e) showsrespectively the bright-field TEM and the associated HRTEM images of the nt-Cu stress-jump-crept at temperature 70 °Cunder sustained stress of 400 MPa for �8 h, i.e., in the HSR. The high stress creep generates high densities of tangles andnetworks of dislocations inside the nt-Cu, as illustrated in Fig. 10(d), and these dislocations widely pile-up and cut-off thetwin lamellas. As a result, the twin is strained intensively and a low-angle GB is generated with misorientation of �9°, asshown in the inset. Fig. 10(e) shows a Fourier filtered HRTEM image of the rectangle region in Fig. 10(d). The low-angle GB iscomposed by two sets of inclined perfect dislocations with Burgers vectors of = ¯⎡⎣ ⎤⎦b a1 /2 101 on ( )111 planes and
= [ ]b a2 /2 101 on ( ¯ )111 planes, respectively, as shown in Fig. 10(e), which causes the geometrical misorientation (Yang et al.,2014, 2015). The discovered stress-dependent creep mechanisms are also shown by the MD snapshots in Fig. 10 (c and f).When the applied sustained stress is relatively low, as shown in Fig. 10(c), the dominating creep mechanism is the partialdislocation nucleation from the intersection line between GB and TB and the partial dislocation propagation on { }111 planesparallel to or/and within the twin plane. When the applied stress is high, the inclined dislocation nucleation governs thedeformation mode, as demonstrated in Fig. 10(f). The findings of both inclined and parallel dislocations from the MD si-mulations and HRTEM observations are in perfect agreement with a recently proposed theory about the dislocation nu-cleation governed strengthening and softening in nt metals (Li et al., 2010) and MD simulations on nt-Cu creep (Jiao andKulkarni, 2015).
5. Concluding remarks
In summary, the present work reports a comprehensive investigation on creep of the ng-Cu and nt-Cu, including creeptests at various temperatures with the developed stress-jump-creep test, theoretical analysis on activation parameters,HREM observations, and atomistic simulations. The comprehensive investigation indicates that the time-, stress-, andtemperature-dependent creep behavior can be analytically described by the modified MDB equation, which has beenverified by the experimental creep and stress-relaxation results. The present work gives the relationship between the ac-tivation volume, stress exponent, and strain rate sensitivity parameter, thereby clarifying the inconsistency in the one-temperature approach to creep data obtained under various sustained stresses but at only one temperature. The values ofthe deformation parameters are determined from the comprehensive investigation and the determined deformationparameters suggest the stress- and temperature-dependent mechanisms in the ng-Cu and nt-Cu creep. The results of thecomprehensive investigation demonstrate that nanotwins make the ng-Cu more thermally stable and improve greatly thecreep property of ng-Cu.
Acknowledgments
This work was supported by the General Research Fund (No. 622911) from the Hong Kong Research Grants Council andthe National Basic Research Program of China (No. 2012CB937502). T.Y.Z. is grateful for the financial support by the ResearchGrant (No.14DZ2261200) from the Science and Technology Commission of Shanghai Municipality. Y.J.W and L.H.D ac-knowledge the financial supports from the NSFC (Nos. 11132011, 11402269, 11472287), the National Key Basic ResearchProgram of China (No. 2012CB937500), and the CAS/SAFEA International Partnership Program for Creative Research Teams.G.Y. W thanks the National Natural Science Foundation (No. 51401083).
References
Alizadeh, R., Mahmudi, R., Langdon, T.G., 2013. Creep mechanisms in an Mg–4Zn alloy in the as-cast and aged conditions. Mater. Sci. Eng.: A 564, 423–430.Cai, B., Kong, Q.P., Cui, P., Lu, L., Lu, K., 2001. Creep behavior of cold-rolled nanocrystalline pure copper. Scr. Mater. 45, 1407–1413.Cai, B., Kong, Q.P., Lu, L., Lu, K., 2000. Low temperature creep of nanocrystalline pure copper. Mater. Sci. Eng.: A 286, 188–192.Caillard, D., Martin, J.-L., 2003. Thermally Activated Mechanisms in Crystal Plasticity. Elsevier, Pergamon.

X.-S. Yang et al. / J. Mech. Phys. Solids 94 (2016) 191–206 205
Cao, Z.H., Wang, L., Hu, K., Huang, Y.L., Meng, X.K., 2012. Microstructural evolution and its influence on creep and stress relaxation in nanocrystalline Ni.Acta Mater. 60, 6742–6754.
Chen, J., Lu, L., Lu, K., 2006. Hardness and strain rate sensitivity of nanocrystalline Cu. Scr. Mater. 54, 1913–1918.Chen, K.-C., Wu, W.-W., Liao, C.-N., Chen, L.-J., Tu, K., 2008. Observation of atomic diffusion at twin-modified grain boundaries in copper. Science 321,
1066–1069.Christian, J.W., Mahajan, S., 1995. Deformation twinning. Prog. Mater. Sci. 39, 1–157.Coble, R.L., 1963. A model for boundary diffusion controlled creep in polycrystalline materials. J. Appl. Phys. 34, 1679–1682.Dalla Torre, F., Spätig, P., Schäublin, R., Victoria, M., 2005. Deformation behaviour and microstructure of nanocrystalline electrodeposited and high pressure
torsioned nickel. Acta Mater. 53, 2337–2349.Dalla Torre, F., Van Swygenhoven, H., Victoria, M., 2002. Nanocrystalline electrodeposited Ni: microstructure and tensile properties. Acta Mater. 50,
3957–3970.Dao, M., Lu, L., Asaro, R.J., De Hosson, J.T.M., Ma, E., 2007. Toward a quantitative understanding of mechanical behavior of nanocrystalline metals. Acta
Mater. 55, 4041–4065.Dao, M., Lu, L., Shen, Y.F., Suresh, S., 2006. Strength, strain-rate sensitivity and ductility of copper with nanoscale twins. Acta Mater. 54, 5421–5432.Dickenscheid, W., Birringer, R., Gleiter, H., Kanert, O., Michel, B., Günther, B., 1991. Investigation of self-diffusion in nanocrystalline copper by NMR. Solid
State Commun. 79, 683–686.Dieter, G.E., 1986. Mechanical Metallurgy, 3rd ed. McGraw-Hill, Boston (MA).Elmustafa, A.A., Stone, D.S., 2002. Indentation size effect in polycrystalline F.C.C. metals. Acta Mater. 50, 3641–3650.Follansbee, P.S., Kocks, U.F., 1988. A constitutive description of the deformation of copper based on the use of the mechanical threshold stress as an internal
state variable. Acta Met. 36, 81–93.Follansbee, P.S., Regazzoni, G., Kocks, U.F., 1984. Transition to drag-controlled deformation in copper at high strain rates. Inst. Phys. Conf. Ser. 70, 71–80.Herring, C., 1950. Diffusional viscosity of a polycrystalline solid. J. Appl. Phys. 21, 437–445.Honeycutt, J.D., Andersen, H.C., 1987. Molecular dynamics study of melting and freezing of small Lennard-Jones clusters. J. Phys. Chem. 91, 4950–4963.Hoover, W.G., 1985. Canonical dynamics: equilibrium phase-space distributions. Phys. Rev. A 31, 1695–1697.Horváth, J., Birringer, R., Gleiter, H., 1987. Diffusion in nanocrystalline material. Solid State Commun. 62, 319–322.Huang, P., Wang, F., Xu, M., Xu, K.W., Lu, T.J., 2010. Dependence of strain rate sensitivity upon deformed microstructures in nanocrystalline Cu. Acta Mater.
58, 5196–5205.Hutchinson, J., Neale, K., 1977. Influence of strain-rate sensitivity on necking under uniaxial tension. Acta Met. 25, 839–846.Jiang, Z., Liu, X., Li, G., Jiang, Q., Lian, J., 2006. Strain rate sensitivity of a nanocrystalline Cu synthesized by electric brush plating. Appl. Phys. Lett. 88, 143115.Jiao, S., Kulkarni, Y., 2015. Molecular dynamics study of creep mechanisms in nanotwinned metals. Comput. Mater. Sci. 110, 254–260.Jin, Z.H., Gumbsch, P., Albe, K., Ma, E., Lu, K., Gleiter, H., Hahn, H., 2008. Interactions between non-screw lattice dislocations and coherent twin boundaries
in face-centered cubic metals. Acta Mater. 56, 1126–1135.Jin, Z.H., Gumbsch, P., Ma, E., Albe, K., Lu, K., Hahn, H., Gleiter, H., 2006. The interaction mechanism of screw dislocations with coherent twin boundaries in
different face-centred cubic metals. Scr. Mater. 54, 1163–1168.Kassner, M.E., 2009. Fundamentals of Creep in Metals and Alloys. Elsevier, Amsterdam.Kelchner, C.L., Plimpton, S., Hamilton, J., 1998. Dislocation nucleation and defect structure during surface indentation. Phys. Rev. B 58, 11085.Koch, C.C., 2003. Optimization of strength and ductility in nanocrystalline and ultrafine grained metals. Scr. Mater. 49, 657–662.Kumar, K.S., Van Swygenhoven, H., Suresh, S., 2003. Mechanical behavior of nanocrystalline metals and alloys. Acta Mater. 51, 5743–5774.Li, J., 2003. AtomEye: an efficient atomistic configuration viewer. Model. Simul. Mater. Sci. Eng. 11, 173.Li, X., Wei, Y., Lu, L., Lu, K., Gao, H., 2010. Dislocation nucleation governed softening and maximum strength in nano-twinned metals. Nature 464, 877–880.Li, X., Dao, M., Eberl, C., Hodge, A.M., Gao, H., 2016. Fracture, fatigue, and creep of nanotwinned metals. MRS Bull. 41, 298–304.Lu, L., Chen, X., Huang, X., Lu, K., 2009. Revealing the Maximum Strength in Nanotwinned Copper. Science 323, 607–610.Lu, L., Li, S.X., Lu, K., 2001. An abnormal strain rate effect on tensile behavior in nanocrystalline copper. Scr. Mater. 45, 1163–1169.Lu, L., Schwaiger, R., Shan, Z.W., Dao, M., Lu, K., Suresh, S., 2005. Nano-sized twins induce high rate sensitivity of flow stress in pure copper. Acta Mater. 53,
2169–2179.Lu, L., Shen, Y., Chen, X., Qian, L., Lu, K., 2004. Ultrahigh strength and high electrical conductivity in copper. Science 304, 422–426.Lu, N., Du, K., Lu, L., Ye, H.Q., 2015. Transition of dislocation nucleation induced by local stress concentration in nanotwinned copper. Nat. Commun. 6, 7648.Lüthy, H., White, R.A., Sherby, O.D., 1979. Grain boundary sliding and deformation mechanism maps. Mater. Sci. Eng. 39, 211–216.Ma, Z.Y., Mishra, R.S., Tjong, S.C., 2002. High-temperature creep behavior of TiC particulate reinforced Ti–6Al–4V alloy composite. Acta Mater. 50,
4293–4302.Mahajan, S., Barry, D.E., Eyre, B.L., 1970. A thin twin and its interaction with a coherent twin boundary in copper. Philos. Mag. 21, 43–52.Millett, P.C., Desai, T., Yamakov, V., Wolf, D., 2008. Atomistic simulations of diffusional creep in a nanocrystalline body-centered cubic material. Acta Mater.
56, 3688–3698.Mishin, Y., Mehl, M.J., Papaconstantopoulos, D.A., Voter, A.F., Kress, J.D., 2001. Structural stability and lattice defects in copper: Ab initio, tight-binding, and
embedded-atom calculations. Phys. Rev. B 63, 224106.Mukherjee, A.K., Bird, J.E., Dorn, J.E., 1969. Experimental correlations for high-temperature creep. Trans. Am. Soc. Met. 62, 155–179.Nosé, S., 1984. A molecular dynamics method for simulations in the canonical ensemble. Mol. Phys. 52, 255–268.Parrinello, M., Rahman, A., 1981. Polymorphic transitions in single crystals: a new molecular dynamics method. J. Appl. Phys. 52, 7182–7190.Plimpton, S., 1995. Fast parallel algorithms for short-range molecular dynamics. J. Comput. Phys. 117, 1–19.Raj, S.V., Langdon, T.G., 1989. Creep behavior of copper at intermediate temperatures-I. Mechanical characteristics. Acta Met. 37, 843–852.Ranganath, S., Mishra, R.S., 1996. Steady state creep behaviour of particulate-reinforced titanium matrix composites. Acta Mater. 44, 927–935.Sanders, P.G., Fougere, G.E., Thompson, L.J., Eastman, J.A., Weertman, J.R., 1997. Improvements in the synthesis and compaction of nanocrystalline materials.
Nanostruct. Mater. 8, 243–252.Stoller, R.E., Zinkle, S.J., 2000. On the relationship between uniaxial yield strength and resolved shear stress in polycrystalline materials. J. Nucl. Mater. 283–
287, 349–352.Van Swygenhoven, H., Caro, A., 1998. Plastic behavior of nanophase metals studied by molecular dynamics. Phys. Rev. B 58, 11246–11251.Wang, C.L., Zhang, M., Nieh, T.G., 2009a. Nanoindentation creep of nanocrystalline nickel at elevated temperatures. J. Phys. D: Appl. Phys. 42, 115405.Wang, G., Jiang, Z., Jiang, Q., Lian, J., 2008a. Mechanical behavior of an electrodeposited nanostructured Cu with a mixture of nanocrystalline grains and
nanoscale growth twins in submicrometer grains. J. Appl. Phys. 104, 084305.Wang, G., Jiang, Z., Zhang, H., Lian, J., 2008b. Enhanced tensile ductility in an electrodeposited nanocrystalline copper. J. Mater. Res. 23, 2238–2244.Wang, G., Lian, J., Jiang, Z., Qin, L., Jiang, Q., 2009b. Compressive creep behavior of an electric brush-plated nanocrystalline Cu at room temperature. J. Appl.
Phys. 106, 086105.Wang, Y.-J., Gao, G.-J.J., Ogata, S., 2013a. Atomistic understanding of diffusion kinetics in nanocrystals frommolecular dynamics simulations. Phys. Rev. B 88,
115413.Wang, Y.-J., Ishii, A., Ogata, S., 2011. Transition of creep mechanism in nanocrystalline metals. Phys. Rev. B 84, 224102.Wang, Y.-J., Ishii, A., Ogata, S., 2012. Grain size dependence of creep in nanocrystalline copper by molecular dynamics. Mater. Trans. 53, 156–160.Wang, Y.-J., Ishii, A., Ogata, S., 2013b. Entropic effect on creep in nanocrystalline metals. Acta Mater. 61, 3866–3871.Wang, Y.M., Hamza, A.V., Ma, E., 2005. Activation volume and density of mobile dislocations in plastically deforming nanocrystalline Ni. Appl. Phys. Lett. 86,
1–3.Wang, Y.M., Hamza, A.V., Ma, E., 2006. Temperature-dependent strain rate sensitivity and activation volume of nanocrystalline Ni. Acta Mater. 54,
2715–2726.Wei, Q., Cheng, S., Ramesh, K.T., Ma, E., 2004. Effect of nanocrystalline and ultrafine grain sizes on the strain rate sensitivity and activation volume: fcc
versus bcc metals. Mater. Sci. Eng. A 381, 71–79.

X.-S. Yang et al. / J. Mech. Phys. Solids 94 (2016) 191–206206
Wei, Y., 2011. Scaling of maximum strength with grain size in nanotwinned fcc metals. Phys. Rev. B 83, 132104.Wolf, D., Yamakov, V., Phillpot, S.R., Mukherjee, A., Gleiter, H., 2005. Deformation of nanocrystalline materials by molecular-dynamics simulation: re-
lationship to experiments? Acta Mater. 53, 1–40.Yang, W., Wang, H., 2004. Mechanics modeling for deformation of nano-grained metals. J. Mech. Phys. Solids 52, 875–889.Yang, X.-S., Sun, S., Wu, X.-L., Ma, E., Zhang, T.-Y., 2014. Dissecting the mechanism of martensitic transformation via atomic-scale observations. Sci. Rep. 4,
6141.Yang, X.-S., Sun, S., Zhang, T.-Y., 2015. The mechanism of bcc α′ nucleation in single hcp ε laths in the fcc γ-hcp ε-bcc α′ martensitic phase transfor-
mation. Acta Mater. 95, 264–273.Yang, X.-S., Wang, Y.-J., Wang, G.-Y., Zhai, H.-R., Dai, L.H., Zhang, T.-Y., 2016. Time, stress, and temperature-dependent deformation in nanostructured
copper: stress relaxation tests and simulations. Acta Mater. 108, 252–263.Zhang, H., Jiang, Z., Lian, J., Jiang, Q., 2008. Strain rate dependence of tensile ductility in an electrodeposited Cu with ultrafine grain size. Mater. Sci. Eng.: A
479, 136–141.Zhang, X., Misra, A., 2012. Superior thermal stability of coherent twin boundaries in nanotwinned metals. Scr. Mater. 66, 860–865.Zheng, S., Beyerlein, I.J., Carpenter, J.S., Kang, K., Wang, J., Han, W., Mara, N.A., 2013. High-strength and thermally stable bulk nanolayered composites due to
twin-induced interfaces. Nat. Commun. 4, 1696.Zhu, T., Li, J., 2010. Ultra-strength materials. Prog. Mater. Sci. 55, 710–757.Zhu, T., Li, J., Samantha, A., Kim, H.G., Suresh, S., 2007. Interfacial plasticity governs strain rate sensitivity and ductility in nanostructured metals. Proc. Natl.
Acad. Sci. 104, 3031–3036.