Embed Size (px)
Citation preview

Time Spent at School and Inequality in Students’Learning Outcomes
Giulia Bovini 1 Marta De Philippis 2 Paolo Sestito 2
1LSE
2Bank of Italy
Human Capital WorkshopBank of Italy, 29 November 2016
Motivation
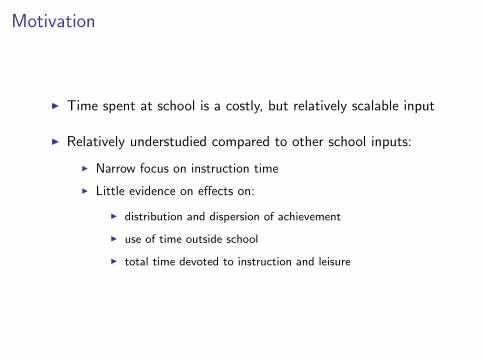
I Time spent at school is a costly, but relatively scalable input
I Relatively understudied compared to other school inputs:
I Narrow focus on instruction time
I Little evidence on effects on:
I distribution and dispersion of achievement
I use of time outside school
I total time devoted to instruction and leisure
Research question
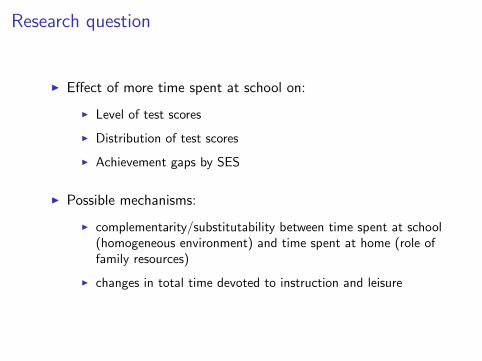
I Effect of more time spent at school on:
I Level of test scores
I Distribution of test scores
I Achievement gaps by SES
I Possible mechanisms:
I complementarity/substitutability between time spent at school(homogeneous environment) and time spent at home (role offamily resources)
I changes in total time devoted to instruction and leisure
Setting: TN and TP
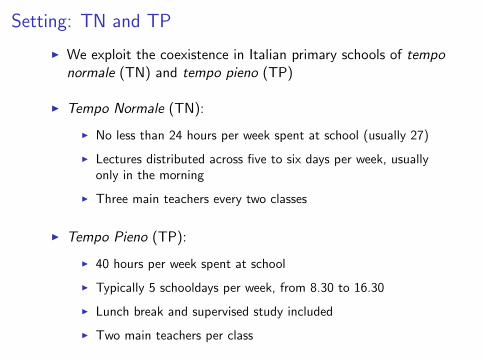
I We exploit the coexistence in Italian primary schools of temponormale (TN) and tempo pieno (TP)
I Tempo Normale (TN):
I No less than 24 hours per week spent at school (usually 27)
I Lectures distributed across five to six days per week, usuallyonly in the morning
I Three main teachers every two classes
I Tempo Pieno (TP):
I 40 hours per week spent at school
I Typically 5 schooldays per week, from 8.30 to 16.30
I Lunch break and supervised study included
I Two main teachers per class
Preview
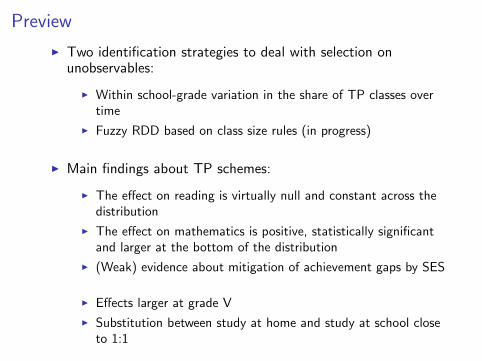
I Two identification strategies to deal with selection onunobservables:
I Within school-grade variation in the share of TP classes overtime
I Fuzzy RDD based on class size rules (in progress)
I Main findings about TP schemes:
I The effect on reading is virtually null and constant across thedistribution
I The effect on mathematics is positive, statistically significantand larger at the bottom of the distribution
I (Weak) evidence about mitigation of achievement gaps by SES
I Effects larger at grade V
I Substitution between study at home and study at school closeto 1:1
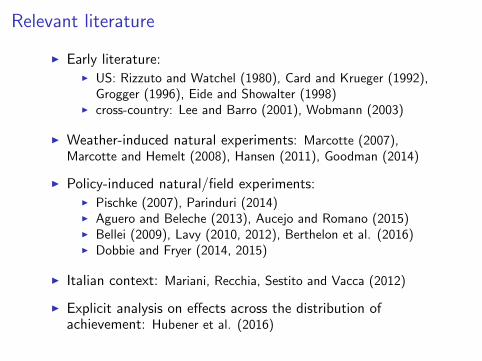
Relevant literature
I Early literature:I US: Rizzuto and Watchel (1980), Card and Krueger (1992),
Grogger (1996), Eide and Showalter (1998)I cross-country: Lee and Barro (2001), Wobmann (2003)
I Weather-induced natural experiments: Marcotte (2007),Marcotte and Hemelt (2008), Hansen (2011), Goodman (2014)
I Policy-induced natural/field experiments:I Pischke (2007), Parinduri (2014)I Aguero and Beleche (2013), Aucejo and Romano (2015)I Bellei (2009), Lavy (2010, 2012), Berthelon et al. (2016)I Dobbie and Fryer (2014, 2015)
I Italian context: Mariani, Recchia, Sestito and Vacca (2012)
I Explicit analysis on effects across the distribution ofachievement: Hubener et al. (2016)
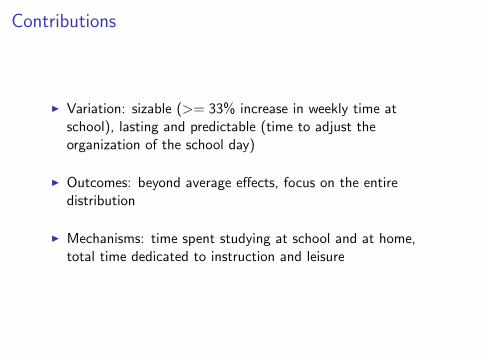
Contributions
I Variation: sizable (>= 33% increase in weekly time atschool), lasting and predictable (time to adjust theorganization of the school day)
I Outcomes: beyond average effects, focus on the entiredistribution
I Mechanisms: time spent studying at school and at home,total time dedicated to instruction and leisure
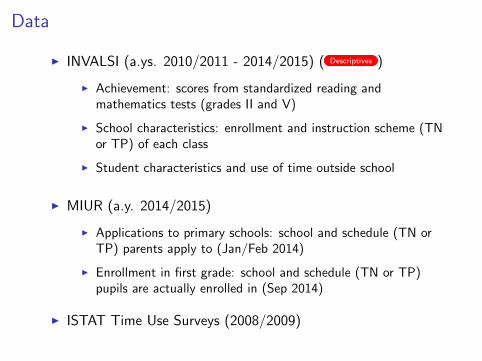
Data
I INVALSI (a.ys. 2010/2011 - 2014/2015) ( Descriptives )
I Achievement: scores from standardized reading andmathematics tests (grades II and V)
I School characteristics: enrollment and instruction scheme (TNor TP) of each class
I Student characteristics and use of time outside school
I MIUR (a.y. 2014/2015)
I Applications to primary schools: school and schedule (TN orTP) parents apply to (Jan/Feb 2014)
I Enrollment in first grade: school and schedule (TN or TP)pupils are actually enrolled in (Sep 2014)
I ISTAT Time Use Surveys (2008/2009)
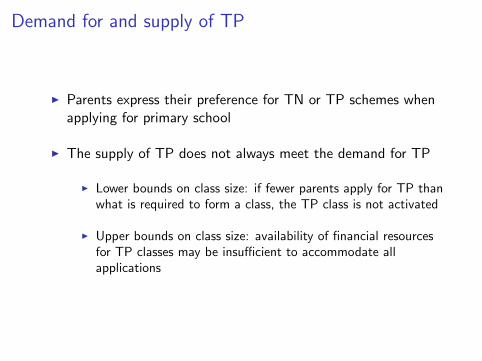
Demand for and supply of TP
I Parents express their preference for TN or TP schemes whenapplying for primary school
I The supply of TP does not always meet the demand for TP
I Lower bounds on class size: if fewer parents apply for TP thanwhat is required to form a class, the TP class is not activated
I Upper bounds on class size: availability of financial resourcesfor TP classes may be insufficient to accommodate allapplications
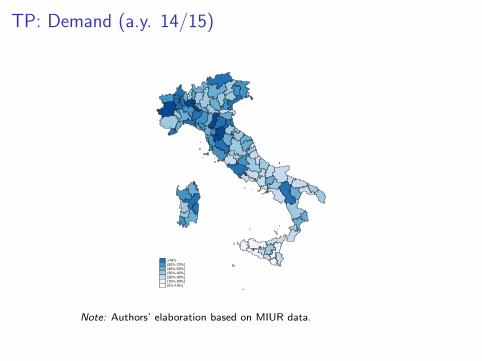
TP: Demand (a.y. 14/15)
>70%(50%-70%](40%-50%](30%-40%](20%-30%](10%-20%](0%-10%]
Note: Authors’ elaboration based on MIUR data.
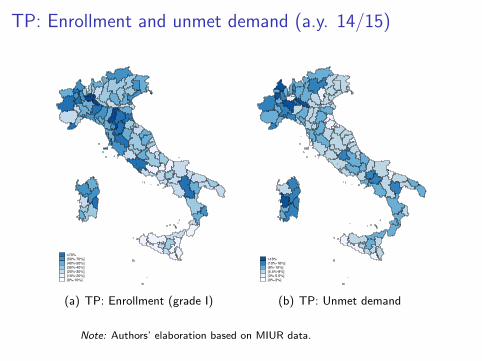
TP: Enrollment and unmet demand (a.y. 14/15)
>70%(50%-70%](40%-50%](30%-40%](20%-30%](10%-20%](0%-10%]
(a) TP: Enrollment (grade I)
>16%(10%-16%](8%-10%](5.5%-8%](3%-5.5%](0%-3%]
(b) TP: Unmet demand
Note: Authors’ elaboration based on MIUR data.
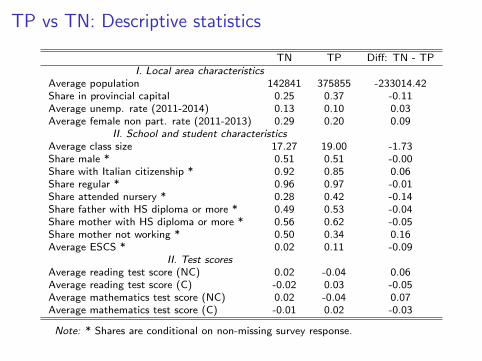
TP vs TN: Descriptive statistics
TN TP Diff: TN - TPI. Local area characteristics
Average population 142841 375855 -233014.42Share in provincial capital 0.25 0.37 -0.11Average unemp. rate (2011-2014) 0.13 0.10 0.03Average female non part. rate (2011-2013) 0.29 0.20 0.09
II. School and student characteristicsAverage class size 17.27 19.00 -1.73Share male * 0.51 0.51 -0.00Share with Italian citizenship * 0.92 0.85 0.06Share regular * 0.96 0.97 -0.01Share attended nursery * 0.28 0.42 -0.14Share father with HS diploma or more * 0.49 0.53 -0.04Share mother with HS diploma or more * 0.56 0.62 -0.05Share mother not working * 0.50 0.34 0.16Average ESCS * 0.02 0.11 -0.09
II. Test scoresAverage reading test score (NC) 0.02 -0.04 0.06Average reading test score (C) -0.02 0.03 -0.05Average mathematics test score (NC) 0.02 -0.04 0.07Average mathematics test score (C) -0.01 0.02 -0.03
Note: * Shares are conditional on non-missing survey response.
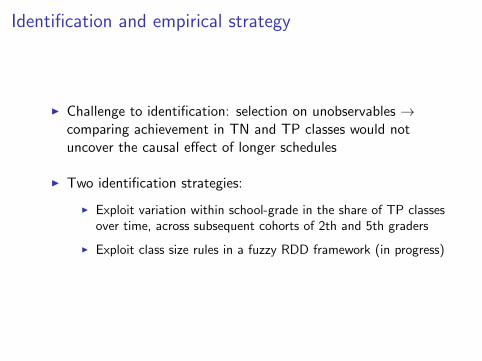
Identification and empirical strategy
I Challenge to identification: selection on unobservables →comparing achievement in TN and TP classes would notuncover the causal effect of longer schedules
I Two identification strategies:
I Exploit variation within school-grade in the share of TP classesover time, across subsequent cohorts of 2th and 5th graders
I Exploit class size rules in a fuzzy RDD framework (in progress)
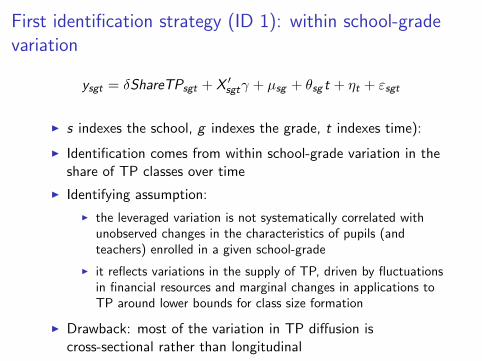
First identification strategy (ID 1): within school-gradevariation
ysgt = δShareTPsgt + X ′sgtγ + µsg + θsg t + ηt + εsgt
I s indexes the school, g indexes the grade, t indexes time):
I Identification comes from within school-grade variation in theshare of TP classes over time
I Identifying assumption:
I the leveraged variation is not systematically correlated withunobserved changes in the characteristics of pupils (andteachers) enrolled in a given school-grade
I it reflects variations in the supply of TP, driven by fluctuationsin financial resources and marginal changes in applications toTP around lower bounds for class size formation
I Drawback: most of the variation in TP diffusion iscross-sectional rather than longitudinal
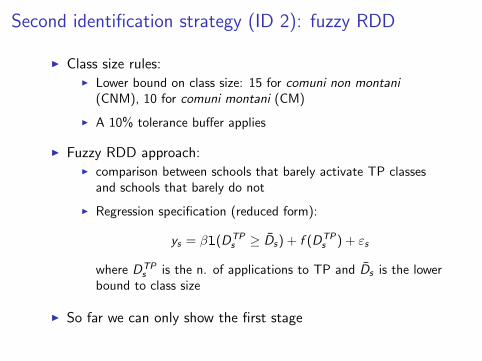
Second identification strategy (ID 2): fuzzy RDD
I Class size rules:I Lower bound on class size: 15 for comuni non montani
(CNM), 10 for comuni montani (CM)
I A 10% tolerance buffer applies
I Fuzzy RDD approach:I comparison between schools that barely activate TP classes
and schools that barely do not
I Regression specification (reduced form):
ys = β1(DTPs ≥ D̄s) + f (DTP
s ) + εs
where DTPs is the n. of applications to TP and D̄s is the lower
bound to class size
I So far we can only show the first stage
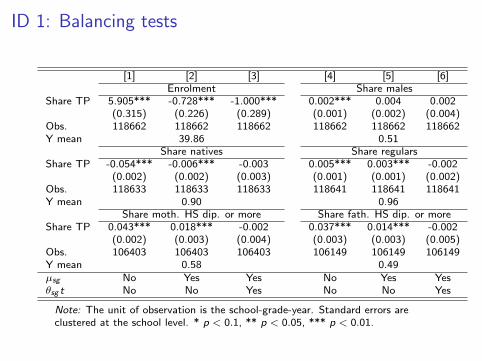
ID 1: Balancing tests
[1] [2] [3] [4] [5] [6]Enrolment Share males
Share TP 5.905*** -0.728*** -1.000*** 0.002*** 0.004 0.002(0.315) (0.226) (0.289) (0.001) (0.002) (0.004)
Obs. 118662 118662 118662 118662 118662 118662Y mean 39.86 0.51
Share natives Share regularsShare TP -0.054*** -0.006*** -0.003 0.005*** 0.003*** -0.002
(0.002) (0.002) (0.003) (0.001) (0.001) (0.002)Obs. 118633 118633 118633 118641 118641 118641Y mean 0.90 0.96
Share moth. HS dip. or more Share fath. HS dip. or moreShare TP 0.043*** 0.018*** -0.002 0.037*** 0.014*** -0.002
(0.002) (0.003) (0.004) (0.003) (0.003) (0.005)Obs. 106403 106403 106403 106149 106149 106149Y mean 0.58 0.49µsg No Yes Yes No Yes Yesθsg t No No Yes No No Yes
Note: The unit of observation is the school-grade-year. Standard errors areclustered at the school level. * p < 0.1, ** p < 0.05, *** p < 0.01.
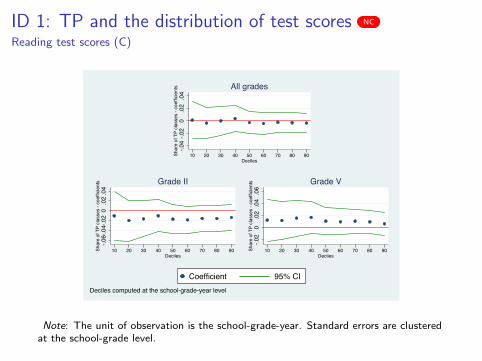
ID 1: TP and the distribution of test scores NC
Reading test scores (C)
-.04
-.02
0.0
2.0
4Sh
are
of T
P cl
asse
s - c
oeffi
cien
ts
10 20 30 40 50 60 70 80 90Deciles
All grades
-.06-
.04-
.02
0.0
2.0
4Sh
are
of T
P cl
asse
s - c
oeffi
cien
ts
10 20 30 40 50 60 70 80 90Deciles
Grade II
-.02
0.0
2.0
4.0
6Sh
are
of T
P cl
asse
s - c
oeffi
cien
ts10 20 30 40 50 60 70 80 90
Deciles
Grade V
Deciles computed at the school-grade-year level
Coefficient 95% CI
Note: The unit of observation is the school-grade-year. Standard errors are clusteredat the school-grade level.

ID 1: TP and the distribution of test scores NC
Mathematics test scores (C)
0.0
2.0
4.0
6.0
8Sh
are
of T
P cl
asse
s - c
oeffi
cien
ts
10 20 30 40 50 60 70 80 90Deciles
All grades
-.04-
.02
0.0
2.0
4.0
6Sh
are
of T
P cl
asse
s - c
oeffi
cien
ts
10 20 30 40 50 60 70 80 90Deciles
Grade II
0.0
2.0
4.0
6.0
8.1
Shar
e of
TP
clas
ses
- coe
ffici
ents
10 20 30 40 50 60 70 80 90Deciles
Grade V
Deciles computed at the school-grade-year level
Coefficient 95% CI
Note: The unit of observation is the school-grade-year. Standard errors are clusteredat the school-grade level.
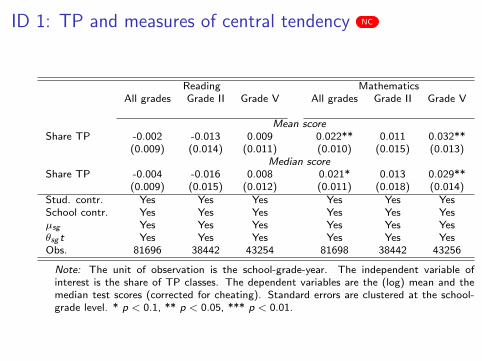
ID 1: TP and measures of central tendency NC
Reading MathematicsAll grades Grade II Grade V All grades Grade II Grade V
Mean scoreShare TP -0.002 -0.013 0.009 0.022** 0.011 0.032**
(0.009) (0.014) (0.011) (0.010) (0.015) (0.013)Median score
Share TP -0.004 -0.016 0.008 0.021* 0.013 0.029**(0.009) (0.015) (0.012) (0.011) (0.018) (0.014)
Stud. contr. Yes Yes Yes Yes Yes YesSchool contr. Yes Yes Yes Yes Yes Yesµsg Yes Yes Yes Yes Yes Yesθsg t Yes Yes Yes Yes Yes YesObs. 81696 38442 43254 81698 38442 43256
Note: The unit of observation is the school-grade-year. The independent variable ofinterest is the share of TP classes. The dependent variables are the (log) mean and themedian test scores (corrected for cheating). Standard errors are clustered at the school-grade level. * p < 0.1, ** p < 0.05, *** p < 0.01.
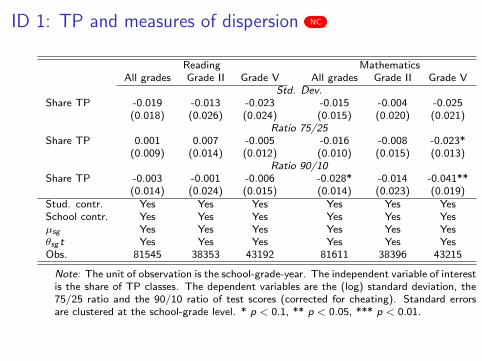
ID 1: TP and measures of dispersion NC
Reading MathematicsAll grades Grade II Grade V All grades Grade II Grade V
Std. Dev.Share TP -0.019 -0.013 -0.023 -0.015 -0.004 -0.025
(0.018) (0.026) (0.024) (0.015) (0.020) (0.021)Ratio 75/25
Share TP 0.001 0.007 -0.005 -0.016 -0.008 -0.023*(0.009) (0.014) (0.012) (0.010) (0.015) (0.013)
Ratio 90/10Share TP -0.003 -0.001 -0.006 -0.028* -0.014 -0.041**
(0.014) (0.024) (0.015) (0.014) (0.023) (0.019)Stud. contr. Yes Yes Yes Yes Yes YesSchool contr. Yes Yes Yes Yes Yes Yesµsg Yes Yes Yes Yes Yes Yesθsg t Yes Yes Yes Yes Yes YesObs. 81545 38353 43192 81611 38396 43215
Note: The unit of observation is the school-grade-year. The independent variable of interestis the share of TP classes. The dependent variables are the (log) standard deviation, the75/25 ratio and the 90/10 ratio of test scores (corrected for cheating). Standard errorsare clustered at the school-grade level. * p < 0.1, ** p < 0.05, *** p < 0.01.
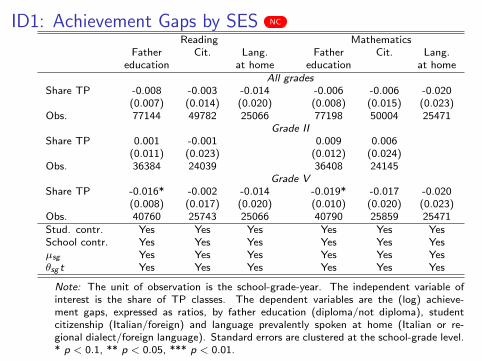
ID1: Achievement Gaps by SES NC
Reading MathematicsFather Cit. Lang. Father Cit. Lang.
education at home education at homeAll grades
Share TP -0.008 -0.003 -0.014 -0.006 -0.006 -0.020(0.007) (0.014) (0.020) (0.008) (0.015) (0.023)
Obs. 77144 49782 25066 77198 50004 25471Grade II
Share TP 0.001 -0.001 0.009 0.006(0.011) (0.023) (0.012) (0.024)
Obs. 36384 24039 36408 24145Grade V
Share TP -0.016* -0.002 -0.014 -0.019* -0.017 -0.020(0.008) (0.017) (0.020) (0.010) (0.020) (0.023)
Obs. 40760 25743 25066 40790 25859 25471Stud. contr. Yes Yes Yes Yes Yes YesSchool contr. Yes Yes Yes Yes Yes Yesµsg Yes Yes Yes Yes Yes Yesθsg t Yes Yes Yes Yes Yes Yes
Note: The unit of observation is the school-grade-year. The independent variable ofinterest is the share of TP classes. The dependent variables are the (log) achieve-ment gaps, expressed as ratios, by father education (diploma/not diploma), studentcitizenship (Italian/foreign) and language prevalently spoken at home (Italian or re-gional dialect/foreign language). Standard errors are clustered at the school-grade level.* p < 0.1, ** p < 0.05, *** p < 0.01.
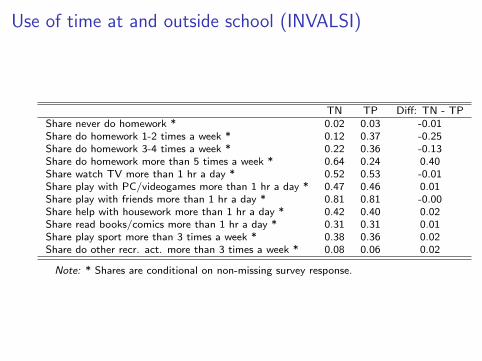
Use of time at and outside school (INVALSI)
TN TP Diff: TN - TPShare never do homework * 0.02 0.03 -0.01Share do homework 1-2 times a week * 0.12 0.37 -0.25Share do homework 3-4 times a week * 0.22 0.36 -0.13Share do homework more than 5 times a week * 0.64 0.24 0.40Share watch TV more than 1 hr a day * 0.52 0.53 -0.01Share play with PC/videogames more than 1 hr a day * 0.47 0.46 0.01Share play with friends more than 1 hr a day * 0.81 0.81 -0.00Share help with housework more than 1 hr a day * 0.42 0.40 0.02Share read books/comics more than 1 hr a day * 0.31 0.31 0.01Share play sport more than 3 times a week * 0.38 0.36 0.02Share do other recr. act. more than 3 times a week * 0.08 0.06 0.02
Note: * Shares are conditional on non-missing survey response.
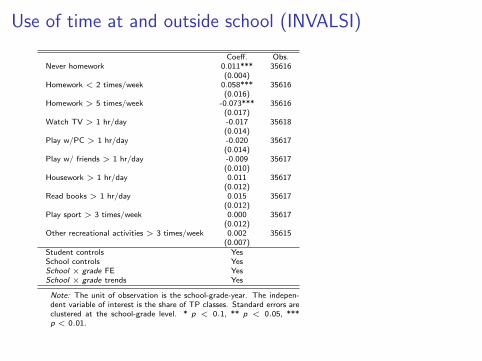
Use of time at and outside school (INVALSI)
Coeff. Obs.Never homework 0.011*** 35616
(0.004)Homework < 2 times/week 0.058*** 35616
(0.016)Homework > 5 times/week -0.073*** 35616
(0.017)Watch TV > 1 hr/day -0.017 35618
(0.014)Play w/PC > 1 hr/day -0.020 35617
(0.014)Play w/ friends > 1 hr/day -0.009 35617
(0.010)Housework > 1 hr/day 0.011 35617
(0.012)Read books > 1 hr/day 0.015 35617
(0.012)Play sport > 3 times/week 0.000 35617
(0.012)Other recreational activities > 3 times/week 0.002 35615
(0.007)Student controls YesSchool controls YesSchool × grade FE YesSchool × grade trends Yes
Note: The unit of observation is the school-grade-year. The indepen-dent variable of interest is the share of TP classes. Standard errors areclustered at the school-grade level. * p < 0.1, ** p < 0.05, ***p < 0.01.
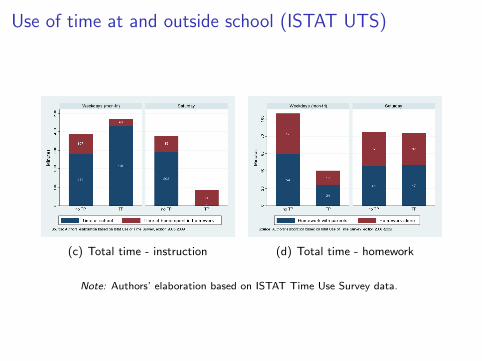
Use of time at and outside school (ISTAT UTS)
(c) Total time - instruction (d) Total time - homework
Note: Authors’ elaboration based on ISTAT Time Use Survey data.
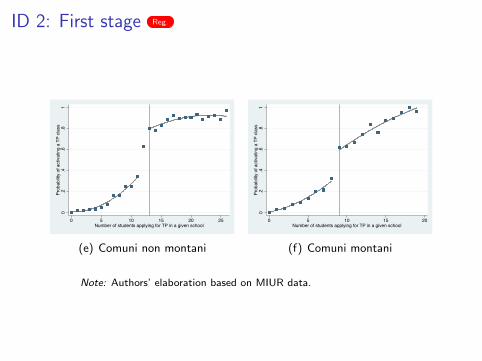
ID 2: First stage Reg.
0.2
.4.6
.81
Prob
abilit
y of
act
ivat
ing
a TP
cla
ss
0 5 10 15 20 25Number of students applying for TP in a given school
(e) Comuni non montani0
.2.4
.6.8
1Pr
obab
ility
of a
ctiv
atin
g a
TP c
lass
0 5 10 15 20Number of students applying for TP in a given school
(f) Comuni montani
Note: Authors’ elaboration based on MIUR data.
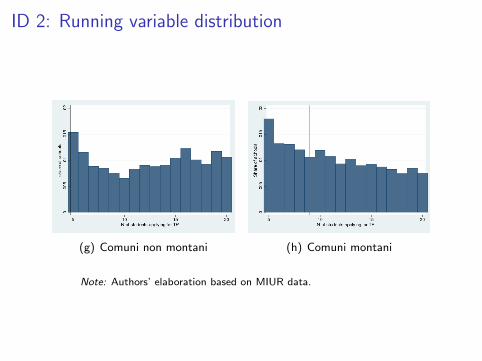
ID 2: Running variable distribution
(g) Comuni non montani (h) Comuni montani
Note: Authors’ elaboration based on MIUR data.
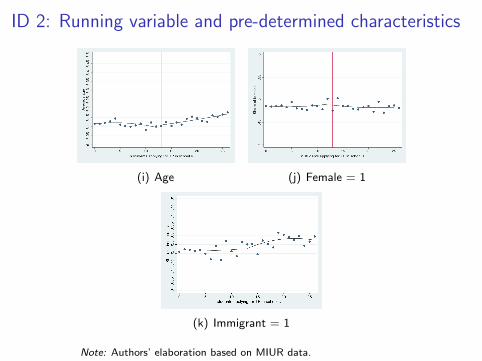
ID 2: Running variable and pre-determined characteristics
(i) Age (j) Female = 1
(k) Immigrant = 1
Note: Authors’ elaboration based on MIUR data.
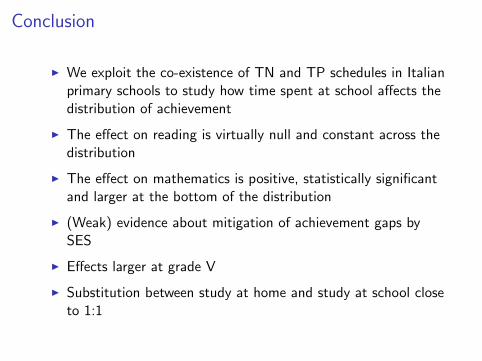
Conclusion
I We exploit the co-existence of TN and TP schedules in Italianprimary schools to study how time spent at school affects thedistribution of achievement
I The effect on reading is virtually null and constant across thedistribution
I The effect on mathematics is positive, statistically significantand larger at the bottom of the distribution
I (Weak) evidence about mitigation of achievement gaps bySES
I Effects larger at grade V
I Substitution between study at home and study at school closeto 1:1
Appendix
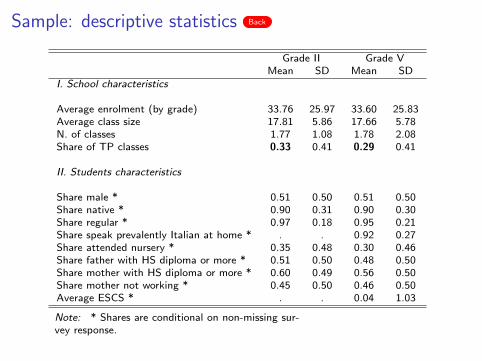
Sample: descriptive statistics Back
Grade II Grade VMean SD Mean SD
I. School characteristics
Average enrolment (by grade) 33.76 25.97 33.60 25.83Average class size 17.81 5.86 17.66 5.78N. of classes 1.77 1.08 1.78 2.08Share of TP classes 0.33 0.41 0.29 0.41
II. Students characteristics
Share male * 0.51 0.50 0.51 0.50Share native * 0.90 0.31 0.90 0.30Share regular * 0.97 0.18 0.95 0.21Share speak prevalently Italian at home * . . 0.92 0.27Share attended nursery * 0.35 0.48 0.30 0.46Share father with HS diploma or more * 0.51 0.50 0.48 0.50Share mother with HS diploma or more * 0.60 0.49 0.56 0.50Share mother not working * 0.45 0.50 0.46 0.50Average ESCS * . . 0.04 1.03
Note: * Shares are conditional on non-missing sur-vey response.
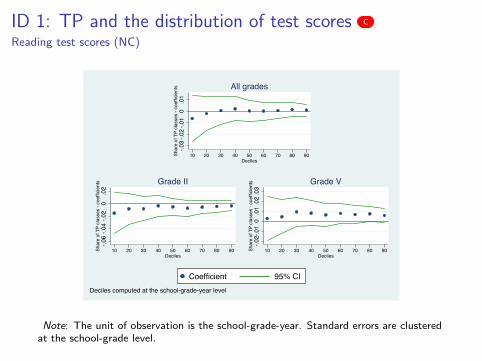
ID 1: TP and the distribution of test scores C
Reading test scores (NC)
-.03
-.02
-.01
0.0
1Sh
are
of T
P cl
asse
s - c
oeffi
cien
ts
10 20 30 40 50 60 70 80 90Deciles
All grades
-.06
-.04
-.02
0.0
2Sh
are
of T
P cl
asse
s - c
oeffi
cien
ts
10 20 30 40 50 60 70 80 90Deciles
Grade II
-.02-
.01
0.0
1.0
2.0
3Sh
are
of T
P cl
asse
s - c
oeffi
cien
ts10 20 30 40 50 60 70 80 90
Deciles
Grade V
Deciles computed at the school-grade-year level
Coefficient 95% CI
Note: The unit of observation is the school-grade-year. Standard errors are clusteredat the school-grade level.
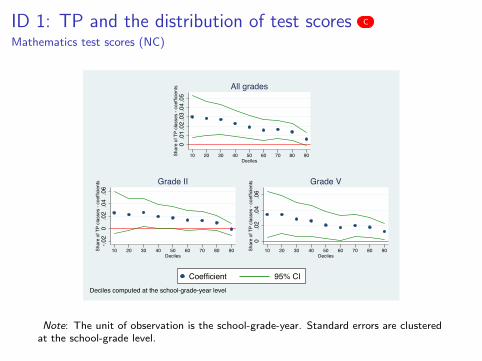
ID 1: TP and the distribution of test scores C
Mathematics test scores (NC)
0.0
1.0
2.0
3.0
4.0
5Sh
are
of T
P cl
asse
s - c
oeffi
cien
ts
10 20 30 40 50 60 70 80 90Deciles
All grades
-.02
0.0
2.0
4.0
6Sh
are
of T
P cl
asse
s - c
oeffi
cien
ts
10 20 30 40 50 60 70 80 90Deciles
Grade II
0.0
2.0
4.0
6Sh
are
of T
P cl
asse
s - c
oeffi
cien
ts10 20 30 40 50 60 70 80 90
Deciles
Grade V
Deciles computed at the school-grade-year level
Coefficient 95% CI
Note: The unit of observation is the school-grade-year. Standard errors are clusteredat the school-grade level.
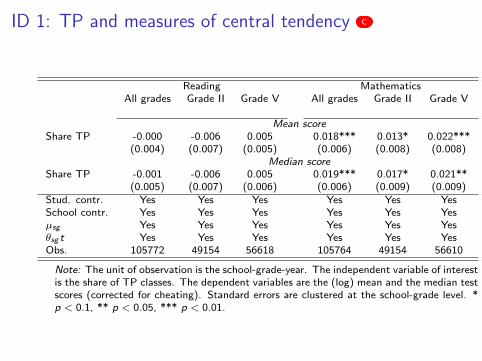
ID 1: TP and measures of central tendency C
Reading MathematicsAll grades Grade II Grade V All grades Grade II Grade V
Mean scoreShare TP -0.000 -0.006 0.005 0.018*** 0.013* 0.022***
(0.004) (0.007) (0.005) (0.006) (0.008) (0.008)Median score
Share TP -0.001 -0.006 0.005 0.019*** 0.017* 0.021**(0.005) (0.007) (0.006) (0.006) (0.009) (0.009)
Stud. contr. Yes Yes Yes Yes Yes YesSchool contr. Yes Yes Yes Yes Yes Yesµsg Yes Yes Yes Yes Yes Yesθsg t Yes Yes Yes Yes Yes YesObs. 105772 49154 56618 105764 49154 56610
Note: The unit of observation is the school-grade-year. The independent variable of interestis the share of TP classes. The dependent variables are the (log) mean and the median testscores (corrected for cheating). Standard errors are clustered at the school-grade level. *p < 0.1, ** p < 0.05, *** p < 0.01.
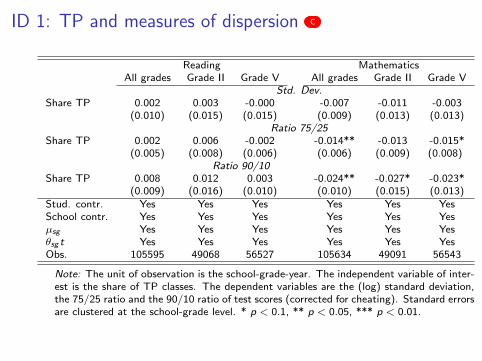
ID 1: TP and measures of dispersion C
Reading MathematicsAll grades Grade II Grade V All grades Grade II Grade V
Std. Dev.Share TP 0.002 0.003 -0.000 -0.007 -0.011 -0.003
(0.010) (0.015) (0.015) (0.009) (0.013) (0.013)Ratio 75/25
Share TP 0.002 0.006 -0.002 -0.014** -0.013 -0.015*(0.005) (0.008) (0.006) (0.006) (0.009) (0.008)
Ratio 90/10Share TP 0.008 0.012 0.003 -0.024** -0.027* -0.023*
(0.009) (0.016) (0.010) (0.010) (0.015) (0.013)Stud. contr. Yes Yes Yes Yes Yes YesSchool contr. Yes Yes Yes Yes Yes Yesµsg Yes Yes Yes Yes Yes Yesθsg t Yes Yes Yes Yes Yes YesObs. 105595 49068 56527 105634 49091 56543
Note: The unit of observation is the school-grade-year. The independent variable of inter-est is the share of TP classes. The dependent variables are the (log) standard deviation,the 75/25 ratio and the 90/10 ratio of test scores (corrected for cheating). Standard errorsare clustered at the school-grade level. * p < 0.1, ** p < 0.05, *** p < 0.01.
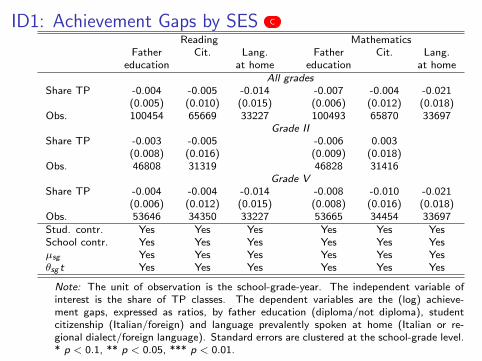
ID1: Achievement Gaps by SES C
Reading MathematicsFather Cit. Lang. Father Cit. Lang.
education at home education at homeAll grades
Share TP -0.004 -0.005 -0.014 -0.007 -0.004 -0.021(0.005) (0.010) (0.015) (0.006) (0.012) (0.018)
Obs. 100454 65669 33227 100493 65870 33697Grade II
Share TP -0.003 -0.005 -0.006 0.003(0.008) (0.016) (0.009) (0.018)
Obs. 46808 31319 46828 31416Grade V
Share TP -0.004 -0.004 -0.014 -0.008 -0.010 -0.021(0.006) (0.012) (0.015) (0.008) (0.016) (0.018)
Obs. 53646 34350 33227 53665 34454 33697Stud. contr. Yes Yes Yes Yes Yes YesSchool contr. Yes Yes Yes Yes Yes Yesµsg Yes Yes Yes Yes Yes Yesθsg t Yes Yes Yes Yes Yes Yes
Note: The unit of observation is the school-grade-year. The independent variable ofinterest is the share of TP classes. The dependent variables are the (log) achieve-ment gaps, expressed as ratios, by father education (diploma/not diploma), studentcitizenship (Italian/foreign) and language prevalently spoken at home (Italian or re-gional dialect/foreign language). Standard errors are clustered at the school-grade level.* p < 0.1, ** p < 0.05, *** p < 0.01.
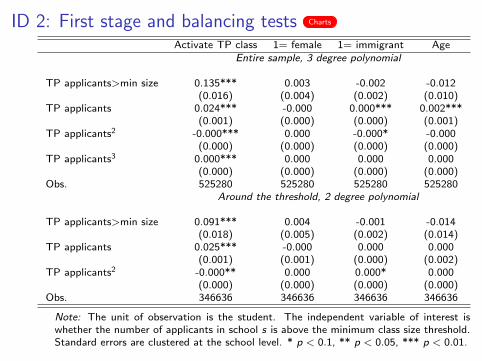
ID 2: First stage and balancing tests Charts
Activate TP class 1= female 1= immigrant AgeEntire sample, 3 degree polynomial
TP applicants>min size 0.135*** 0.003 -0.002 -0.012(0.016) (0.004) (0.002) (0.010)
TP applicants 0.024*** -0.000 0.000*** 0.002***(0.001) (0.000) (0.000) (0.001)
TP applicants2 -0.000*** 0.000 -0.000* -0.000(0.000) (0.000) (0.000) (0.000)
TP applicants3 0.000*** 0.000 0.000 0.000(0.000) (0.000) (0.000) (0.000)
Obs. 525280 525280 525280 525280Around the threshold, 2 degree polynomial
TP applicants>min size 0.091*** 0.004 -0.001 -0.014(0.018) (0.005) (0.002) (0.014)
TP applicants 0.025*** -0.000 0.000 0.000(0.001) (0.001) (0.000) (0.002)
TP applicants2 -0.000** 0.000 0.000* 0.000(0.000) (0.000) (0.000) (0.000)
Obs. 346636 346636 346636 346636
Note: The unit of observation is the student. The independent variable of interest iswhether the number of applicants in school s is above the minimum class size threshold.Standard errors are clustered at the school level. * p < 0.1, ** p < 0.05, *** p < 0.01.