Embed Size (px)
Citation preview

RESEARCH Open Access
Time series livestock diet optimization:cost-effective broiler feed substitutionusing the commodity price spreadapproachOthman Alqaisi1* , Oghaiki Asaah Ndambi2 and Ryan Blake Williams3
* Correspondence:[email protected] of Animal andVeterinary Sciencs, College ofAgricultural and Marine Sciences,Sultan Qaboos University, P.O. Box34, 123 Al khoudh, Sultanate ofOmanFull list of author information isavailable at the end of the article
Abstract
Sustainable feed formulation (defined here as nutritional and economic feed optimization)is substantial in feed chain production from crop farmers to livestock producers. Dietformulation employing a static linear programming (LP) approach, which is widely used intrading firms and feed production facilities, does not allow for intertemporal flexibility. Ourapproach allows the interaction between feed components over time, considering thevolatile global feed prices, thereby improving sustainability in feed formulation and feedavailability. The objectives of this study were to (1) develop a multi-stage LP feed model, (2)demonstrate its potential use in broiler feeding, and (3) illustrate the impact of feed inputprice spread (variation) on the composition of broiler diets. Modeling resulted in reciprocalrelationships between conventional feeds and byproducts at different rates. Based on theprice spreads expressed as a percentage of DDGS (distiller’s dried grains with solubles) pricecompared to corn price, three positions of dietary switch were identified; corn-DDGS pricespreads of higher than 94%, between 76 and 94%, and lower than 76% corresponding tolimited/no inclusion, partial inclusion, and maximum replacement of corn by DDGS,respectively. Rapeseed meal inclusion was 4, 5, and 6% in the corn-based starter, grower,and finisher diets, respectively, and its potential to replace soybean meal was limited by itshigher fiber content. Based on the simulated compound feed prices, the global broiler feedindustry could gain 1.7 billion USD through improved resources planning.
Keywords: Multi-stage linear-programming, Broiler diet, Feed industry, Trading, Pricespread, Byproducts
BackgroundThe global compound feed industry production is estimated at 996 million metric tons
and is valued at 450 billion USD in 2015. The poultry compound feed industry itself
accounts for 463 million metric tons or 47% of the global industrial feed production
(Alltech 2016). In the last 10 years, feed prices have been very volatile, with a peak in
2008 (FAO 2011), mostly linked to increasing demand from developing countries and
competition with renewable energy production from biofuels (Godfray et al. 2010).
Feed costs account for up to 70% of total costs in typical livestock production systems
(i.e., intensive dairy farming, (Alqaisi et al. 2011) and up to 69% in intensive poultry
production systems (Donohue and Cunningham 2009). Studies show that the
Agricultural and FoodEconomics
© The Author(s). 2018 Open Access This article is distributed under the terms of the Creative Commons Attribution 4.0 InternationalLicense (http://creativecommons.org/licenses/by/4.0/), which permits unrestricted use, distribution, and reproduction in any medium,provided you give appropriate credit to the original author(s) and the source, provide a link to the Creative Commons license, andindicate if changes were made.
Alqaisi et al. Agricultural and Food Economics (2017) 5:25 DOI 10.1186/s40100-017-0094-9
replacement of some feed ingredients with agro-industrial byproducts would lead to a
reduction in feed costs and lower greenhouse gas emissions per unit of output (Alqaisi
et al. 2014). However, the rate of inclusion of these byproducts should also depend on
their market prices and the price difference between the conventional feeds and the
byproducts. Whatever the inclusion rates of various feed ingredients in the poultry diet,
a lower cost diet will significantly reduce the cost of poultry production and/or more
profitability of feed producers.
Diet optimization is another effective means of cutting costs in the poultry feed
industry, and linear programming models have been widely used for this purpose.
These models have traditionally focused on maximizing producer profits in the short
run, but such models do not provide producers with information about how to
optimally substitute between feed ingredients as their relative prices change. Makkar
and Ankers (2014) suggested that the focus needs to shift from profit maximization
toward feed and other input use optimization. The most common application of linear
programming (LP) models in solving the diet problem has been to formulate diets
using a static approach and for a short term (i.e., per ration formulation or per animal
life cycle in other cases).
These models have been commonly used for over a century and in a similarly
restrictive fashion, taking information on the target animal species and its require-
ments, feed ingredients, and market feed prices as given. These parameters are used in
the LP model to minimize the feed cost, considering nutritional limitations (Peric and
Babic 2009, Saxena 2011; Žgajnar et al. 2010). The biggest challenges in LP modeling
in the 1980s were the absence of information about the biological restrictions of
animals and the varying quality of feed ingredients (Saxena and Chandra 2011;
Beckman et al. 2011). This has greatly improved over the years as LP modeling has in-
creasingly considered aspects such as the physiological stage of animals (Saxena and
Chandra 2011; Singh and Saxena 2015). The current LP models in the feed industry, as
well as at the farm level, do not allow the user to simulate time series scenarios, which
could capture the fluctuating market prices for feed inputs. Therefore, the validity of
their solutions is weakened by daily, weekly, and monthly variations in feed prices.
Hence, this creates economic pressure on decision-makers and firms, which rely on
these results for strategic planning, since the model outcomes become irrelevant
shortly after they are derived.
In the feed industry, there is a common classification of feeds into energy-rich
and protein-rich feeds, whereby feed ingredients within each group could be
substituted for each other at different percentages without necessarily affecting the
animals being fed. Therefore, in a fluctuating price situation, a multi-stage LP offers
the advantage of determining the price spread—for instance, between corn and
wheat or between distiller’s dried grains with solubles (DDGS) and corn at which it
is important to replace part or all of one feed ingredient with the other. Previous
works utilizing multi-period LP models have tended to focus on issues such as the
variation in feed supply, the quality of feedstuffs, and animal requirements to
optimize diets to achieve productivity goals (Reynoso-Campos et al. 2004; Nicholson
et al. 1994). However, the issue of commodity price spread and dietary dynamics
over time, and its relationship with dietary feeds and substitution rates, has not
been adequately evaluated.
Alqaisi et al. Agricultural and Food Economics (2017) 5:25 Page 2 of 19

In many applications of linear programming to a real trading or feed production
situation, time is not taken as a specific variable factor. Furthermore, the multi-stage
LP approach provides time series estimates on the “price limits,” which are important
in examining the stability of the diet over a period of time. This approach, which adds
an extra time series dimension to the diet problem, allows the interaction between feed
components over time. It also allows the possibility of using agro-industrial byproducts,
which are only available and/or are very cheap during particular seasons of the year, as
animal feeds. The multi-stage LP modeling approach is useful in providing answers for
decision-makers concerning the price spread between commodities and the rates at
which commodities could replace one another under volatile price situations. Further-
more, typical static LP models may provide per time price spreads between feeds, but
they do not provide comprehensive information on the feed substitution rates related
to changes in price spreads.
Defined in this way, the problem requires developing a general multi-stage LP model
for optimization of a feeding diet. Consequently, the objectives of this study are:
To develop the multi-stage LP model that produces time series least cost results for
different livestock species,
To apply a multi-stage LP method in solving two modeled examples of broiler feed
formulation,
Present and analyze programming results and extract conclusions from the developed
method.
MethodsFeed production process
Compound feed production and commodity trading are a continuous process based on
daily, weekly, and monthly activities. Monthly commodity prices in feed trading and
production are used in the current analysis due to the availability of the data.
The supply chain of feed materials, which begins with producers and ends with
consumers, is illustrated in Fig. 1. Within the chain, farmers produce grains and oil
crops and sell them either directly to trading companies in the case of feed grains or to
crushing plants in the case of oil-rich seeds such as soybeans and sunflower seeds.
Thereafter, the meals are purchased by trading companies. Alternatively, trading
Cropping farmers
Trading companies
Compound feed
producers
Livestock farms
- Own assets in crops producing countries,
- May own assets for primary processing of oil crops,
- Purchase crops and sell directly to compound feed producers or local traders,
- A daily operation process- There are situation in which
crops (i.e. corn) are sold for primary processing, and feedstocks are produced (i.e. DDGS).
- Owned by farmers (i.e. in Latin America)
- Land preparation,- Fertilization and
irrigation,- Seasonal harvesting,- Storage grain stocks.
- Feed compounding - Feed mixing (i.e. with - additives)- Feed packaging, quality
optimization, labeling and transportation,
- Feed storage on farm,- Feed consumption.
Fig. 1 A simple illustration of the feed production process from producer to end users
Alqaisi et al. Agricultural and Food Economics (2017) 5:25 Page 3 of 19

companies may own crushing plants and trade in feed meals. In the second part of the
chain, trading companies sell grains and meals to feed producers. The current analysis
is designed to mimic a production process in a feed mill acquiring feed materials from
a trading company. The method under investigation is that of monthly analysis of a
multi-stage linear programming model (multi-stage LP) output.
Multi-stage LP model
The objective of the multi-stage linear programming model is to produce a feed blend
at minimum cost in different periods (defined here as a month). The model selects the
optimal proportion of feed ingredients to produce a least cost diet given feed
nutritional composition, animal nutritional requirements, and feed prices.
The problem of determining the commodity of interest in the produced feed blend
emerges when the price gap between two protein or energy sources is small. This
situation arises regularly because feed prices are volatile. The challenge is exacerbated
when designing a commodity trade without knowing the optimal price spread between
two commodities, which is a well-known problem for feed commodities trading
companies. Consequently, this study examines the price commodity spread in compari-
son with the commodity trading alternative (i.e., corn versus wheat).
To determine the time (defined by the month) when a diet adjustment is required,
and the proportion of an alternative feed commodity to be included to the new diet, a
multi-stage LP model was developed for broiler chicken feeding in two modeled cases.
The multi-stage LP model in this study is a quick and time efficient approach to
optimize diets. Unlike static LP models, this multi-stage LP model minimizes a
sequence of decision variables and provides time series relationships between decision
variables and constraints via simulated solutions. The resulting relationships are
estimated using the open source R programming software (R Core Team 2016). The
model is based on mixed integer linear programming packages. It provides pure linear,
integer or binary, semi-continuous, and special-order set models based on the simplex
algorithm method. The model provides—but is not limited to—a sequence of multi-
stage results by retrieving values from a sequence of successfully solved single-period
LP models. The results produced by this model allow the decision-maker to investigate
the relationships between objective function values, values of the decision variables, values
of the constraints, dual variables (the reduced costs), and the sensitivity of the objective
function. In many respects, the model serves to provide an efficient sensitivity analysis of
optimal feed mixes under alternative input prices and animal nutritional requirements.
Model structure
The general structure of the multi-stage LP is described as follows:
minx TC ¼XT
t
Xn
i
citxit
subject to
Xn
i
aijxi ⋛ bj ∀ j∈ J
X it ≥ 0:
Alqaisi et al. Agricultural and Food Economics (2017) 5:25 Page 4 of 19

where TC is the total cost of the feed ration, t is the time period (month), ci is the per
unit cost of feed ingredient i¸ and xi is the quantity of feed ingredient i in the feed
ration. J is the set of nutrients that must be considered in the feed ration, with j being
one of the nutrients of the set of J, aij is the quantity of nutrient j in feed ingredient i,
and bj is the required amount of each nutrient j in the feed ration. The sign of the rela-
tionship for each of the nutrients depends on the particular nutrient and the nutrient
balance that must exist in the ration.
Monthly commodity feed prices were collected from the World Bank (2016) and the
USDA (2016). The general structure of the model for a single month is shown in
Tables 1 and 2. Each table is divided into two parts. The upper part of the table
includes multi-period price data for the objective function, namely, the monthly feed
commodity prices. The monthly feed commodity prices are saved in external text
format file and linked to the LP model in the R console with the apply function to
repeat optimization for each individual monthly set of prices, subject to the model
parameters. The lower part of the table consists of information relevant to the feed
composition and the model right-hand side constraints and boundaries.
Three main factors were considered for the diet optimization simulation: the deci-
sion variables (feed composition), the objective function (feed prices), and the
model constraints (feed requirements). The nutritional requirements for broiler
chicken and the feed composition were taken from the NRC (1994) and Leeson and
Summers (2005).
The non-zero and non-negative constraints were considered in both equality and
non-equality forms. The minimization of the objective function in each period is
subject to a set of constraints. These are the feed requirement variables which are
composed of the weight of total formulated diet in kilogram or percentage,
metabolizable energy (ME) in kilocalorie, and the dietary percentages of crude protein
(CP), calcium, phosphorus, arginine, fiber, lysine, and methionine and cysteine (Meth.
Cyst.). Furthermore, no upper or lower bounds were set in the model for the feed
inclusion rate. Ultimately, the optimized feed results are given in percentages.
Modeled examples
Taking, as a basis, the model structure described herein, two simulation models were
defined which could represent a potential long-term feed production strategy in an
enterprise and in a region. To our knowledge, the capabilities of such a multi-stage LP
model in long-term trade and animal feed production have not previously been evalu-
ated for its efficacy in a particular industry. We aim to evaluate the historical monthly
optimal dietary feed composition in two different broiler feeding problems. Two cases
were modeled with three formulation strategies in each model which simulate the life
cycle of a commercial broiler chicken. This included a starter phase of 0 to 18 days,
grower phase between 19 and 30 days, and finisher stage between 31 and 41 days. The
formulated diets are considered to be nutritionally satisfactory to produce chickens
with a final body weight of about 2.5 kg/bird at age 41 days with ending feed conver-
sion of 1.7 kg feed/kg gain (Leeson and Summers 2005).
For feed producers, this is justified by the short life cycle of broiler production on
farm. However, for trading companies which provide commodities to feed producers,
Alqaisi et al. Agricultural and Food Economics (2017) 5:25 Page 5 of 19

Table
1CSD
LPmod
elstructurein
Rwith
decision
variables,RHSconstraints,andtheob
jectivefunctio
n
Objfn1
OB1P1
OB2P1
OB3P1
OB4P1
OB5P1
OB6P1
OB7P1
OB8P1
Objfn2
OB1P2
OB2P2
OB3P2
OB4P2
OB5P2
OB6P2
OB7P2
OB8P2
Objfn3
……
……
……
……
Objfn4
……
……
……
……
Objfn5
……
……
……
……
Objfn6
……
……
……
……
Objfnn
OB1Pn
OB2Pn
OB3Pn
OB4Pn
OB5Pn
OB6Pn
OB7Pn
OB8Pn
Con
straints
Item/unit
DV1
DV2
DV3
DV4
DV5
DV6
DV7
DV8
SG
F
Con
straint
W(kg)
1.00
1.00
1.00
1.00
1.00
1.00
1.00
1.00
=1
11
Con
straint
ME(M
cal/kg)
3.35
2.44
2.48
0.00
0.00
3.61
3.61
8.20
≥3.05
3.10
3.15
Con
straint
Protein(%)
8.50
48.50
27.40
0.00
0.00
57.52
94.40
0.00
≥22
2018
Con
straint
Calcium
(%)
0.02
0.27
0.17
38.00
22.00
0.00
0.00
0.00
≥0.95
0.92
0.89
Con
straint
Availablep.
(%)
0.08
0.22
0.39
0.00
18.65
0.00
0.00
0.00
≥0.475
0.460
0.445
Con
straint
Arginine(%)
0.38
3.48
0.98
0.00
0.00
0.00
0.00
0.00
≥1.377
1.252
1.127
Con
straint
Lysine
(%)
0.26
2.96
0.75
0.00
0.00
0.00
74.42
0.00
≥1.148
1.044
0.940
Con
straint
Meth.Cyst.(%)
0.36
1.39
1.00
0.00
0.00
98.00
0.00
0.00
≥0.889
0.808
0.727
Con
straint
Crude
fiber
(%)
2.20
3.90
9.10
0.00
0.00
0.00
0.00
0.00
≤3
33
Upp
erbo
und
inf
inf
inf
inf
inf
inf
inf
inf
Lower
boun
d0.00
0.00
0.00
0.00
0.00
0.00
0.00
0.00
Con
straints:S
deno
testhestarterdiet,G
forthegrow
erdiet,and
Fforthefin
ishe
rdiet.A
rginin,lysine,
andMeth.
Cyst.requ
iremen
tswerecalculated
asprop
ortio
nof
crud
eproteinaccordingto
Pestia
ndMiller
(199
3)OBob
jectivefunctio
n,P1
pricede
cision
varia
ble1,
Wweigh
t,MEmetab
olizab
leen
ergy
,Pph
osph
orus,M
eth.
Cyst.m
ethion
inean
dcysteine
,DVde
cision
varia
ble,
DV1
corn,D
V2SB
M,D
V3DDGS,DV4
limestone
,DV5
dicalcium
phosph
ate,
DV6
DL-methion
ine,
DV7
L-lysine
,DV8
soyb
eanoil
Alqaisi et al. Agricultural and Food Economics (2017) 5:25 Page 6 of 19

Table
2CWSR
LPmod
elstructurein
Rwith
decision
variables,RHSconstraints,andtheob
jectivefunctio
n
Objfn1
OB1P1
OB2P1
OB3P1
OB4P1
OB5P1
OB6P1
OB7P1
OB8P1
OB9P1
Objfn2
OB1P2
OB2P2
OB3P2
OB4P2
OB5P2
OB6P2
OB7P2
OB8P2
OB9P2
Objfn3
……
……
……
……
…
Objfn4
……
……
……
……
…
Objfn5
……
……
……
……
…
Objfn6
……
……
……
……
…
Objfnn
OB1Pn
OB2Pn
OB3Pn
OB4Pn
OB5Pn
OB6Pn
OB7Pn
OB8Pn
OB9Pn
Con
straints
Item/unit
DV1
DV2
DV3
DV4
DV5
DV6
DV7
DV8
DV9
SG
F
Con
straint
W(kg)
1.00
1.00
1.00
1.00
1.00
1.00
1.00
1.00
1.00
=1
11
Con
straint
ME(M
cal/kg)
3.12
3.35
2.44
2.00
8.20
3.61
3.61
0.00
0.00
≥3.05
3.10
3.15
Con
straint
Protein(%)
11.50
8.50
48.50
38.00
0.00
57.52
94.40
0.00
0.00
≥22
2018
Con
straint
Calcium
(%)
0.05
0.02
0.27
0.68
0.00
0.00
0.00
38.00
22.00
≥0.95
0.92
0.89
Con
straint
Availablep.
(%)
0.00
0.08
0.22
0.30
0.00
0.00
0.00
0.00
18.65
≥0.475
0.460
0.445
Con
straint
Arginine(%)
0.40
0.38
3.48
2.08
0.00
0.00
0.00
0.00
0.00
≥1.377
1.252
1.127
Con
straint
Lysine
(%)
0.31
0.26
2.96
1.94
0.00
0.00
74.42
0.00
0.00
≥1.148
1.044
0.940
Con
straint
Meth.Cyst.(%)
0.37
0.36
1.39
1.58
0.00
98.00
0.00
0.00
0.00
≥0.889
0.808
0.727
Con
straint
Crude
fiber
(%)
3.00
2.20
3.90
12.00
0.00
0.00
0.00
0.00
0.00
≤3
33
Upp
erbo
und
inf
inf
inf
inf
inf
inf
inf
inf
inf
Lower
boun
d0.00
0.00
0.00
0.00
0.00
0.00
0.00
0.00
0.00
Con
straints:S
deno
testhestarterdiet,G
forthegrow
erdiet,and
Fforthefin
ishe
rdiet.A
rginin,lysine,
andMeth.
Cyst.requ
iremen
tswerecalculated
asprop
ortio
nof
crud
eproteinaccordingto
Pestia
ndMiller
(199
3)OBob
jectivefunctio
n,P1
pricede
cision
varia
ble1,
Wweigh
t,MEmetab
olizab
leen
ergy
,Pph
osph
orus,M
eth.
Cyst.m
ethion
inean
dcysteine
,DVde
cision
varia
ble,
DV1
whe
atgrain,
DV2
corn
grain,
DV3
SBM,D
V4RS
M,
DV5
soyb
eanoil,DV6
DL-methion
ine,
DV7
L-lysine
,DV8
limestone
,DV9
dicalcium
phosph
ate
Alqaisi et al. Agricultural and Food Economics (2017) 5:25 Page 7 of 19

assuming the availability of resources and the activities undertaken (i.e., purchasing and
selling commodities from producing to importing countries) using the static approach
may not be efficient, given that feed prices change daily. Therefore, the least cost
formulation procedure needs to consider the time dimension and the potential for
change in the preference of one input over another.
Feed commodities of corn, DDGS, and soybean meal (SBM) were used in the “CSD”
model. Monthly market feed prices were available between 2009 and 2016. Further-
more, feed additives of methionine and cysteine (Meth. Cyst.), lysine, dicalcium
phosphate (DCP), limestone, and soy oil were included in the modeled diets to mimic
feed formulation and production processes. The “CWSR” model was designed with feed
commodities of corn, wheat, rapeseed meal (RSM), and SBM in the diet simulation, in
addition to the feed additives as described in the CSD model. Monthly market feed
prices were available between 2004 and 2016.These commodities are globally available
and extensively used and are satisfactory to formulate nutritional broiler diets. The
reasons for suggesting these two particular models are that (i) DDGS is a commonly
used byproduct in US broiler feed production (Hoffmann et al. 2011) and used to
substitute for corn and SBM, and (ii) corn and wheat are used in EU broiler feed
production as energy sources, and SBM and RSM are used as protein sources (de
Visser et al. 2014). In each of these cases, it is not clear at which price and inclusion
rate one commodity would be substituted for the other.
Results and discussionsThe multi-stage LP model was implemented in R software version 0.99.892.0. The solu-
tion time varied depending on the instance being solved but was within the range of
0.5 and 1 second. The solutions of the LP model for each of the solved problems are
given by the optimal inclusion rate in percentage that minimizes the total formulated
feed cost.
CSD model
Figures 2 and 3 provide a graphical representation of the simulated inclusion rates of
DDGS, corn, and SBM in different broiler life cycle diets. The simulated feed formula-
tion shows a reciprocal relation between DDGS and both corn and SBM dietary inclu-
sion rates. The simulated inclusion rate of feeds was stable between late 2008 and
2011, except for one period in which SBM and corn replaced DDGS. The figure further
illustrates that from late 2011 onward, the optimal solution would require an increased
incidence of substitution between inputs.
Maximum corn inclusion rates were 58, 65, and 70% for the starter, grower, and
finisher diets, respectively. In the starter diet, the DDGS inclusion rate varied between
4.3 and 5.5%. The inclusion rate of DDGS was higher in the grower diet and varied
between 1.2 and 6.8% (Table 3). The highest DDGS inclusion rate was observed in the
finisher diet at 8%. DDGS was a substitute for both corn and SBM at different rates.
This result is due to the high protein and energy content of DDGS. However, the
maximum inclusion rate indicates that crude fiber in this byproduct is a limiting factor
for further inclusion, regardless of its price. The increase in DDGS inclusion rate—from
starter to grower and finisher diets—is driven by the changes in energy, protein, and
Alqaisi et al. Agricultural and Food Economics (2017) 5:25 Page 8 of 19

lysine requirements in the formulated diets. This result corresponds with those of the
study by Loar (2012) and Walugembe et al. (2014) who formulated 8% dietary DDGS
in broiler diets, in which their diets substituted both corn and SBM. Since DDGS
quality varies greatly in the literature, the simulated DDGS inclusion rate suggested in
our study may differ depending on the composition of the byproduct and the fiber
constraints employed here. Furthermore, the results obtained herein may be different
if additional feed sources had been used in the model. Therefore, the DDGS inclu-
sion rates suggested by the current study are particular to the model parameters
used here within.
The magnitude with which DDGS replaces corn is significantly higher than it is for
replacing SBM, indicating its importance as an energy feed source. For instance, in the
starter diet, an increase in DDGS inclusion from 4.3 to 5.5% replaced 1.1% corn and
a
b
c
Fig. 2 Simulated optimal inclusion rates of corn and DDGS based on nutritional requirements and monthlyfeed prices from 2008 to 2016. a Starter, b Grower, and c Finisher broiler diets
a
b
c
Fig. 3 Simulated optimal inclusion rates of soybean meal and DDGS based on nutritional requirements andmonthly feed prices from 2008 to 2016. a Starter, b Grower, and c Finisher broiler diets
Alqaisi et al. Agricultural and Food Economics (2017) 5:25 Page 9 of 19

only 0.2% SBM. The substitution of both corn and SBM by DDGS further affected soy
oil and lysine inclusion rates, which increased by 0.2% and by 0.0004%, respectively.
The inclusion rate of DDGS in both grower and finisher diets was more evident. In
the simulated grower diets, the increase in DDGS inclusion rate between months at
5.6% was used to substitute 5.4% corn and 1% SBM. However, soy oil was increased by
0.8%, and lysine inclusion was increased at 0.002%. Similarly, in the simulated finisher
diet, an increase in DDGS inclusion rate of 8% combined with 1.1% soy oil and
0.0025% lysine was used to substitute 7.5% corn and 1.4% SBM. Loar et al. (2012)
suggested an upper inclusion limit of DDGS in finisher diets of 14%. The difference
found in the current study could be due to the differences in feeds included in the
diets, as well as the constraint of fiber set at 3% in the current study. However, a DDGS
inclusion rate of about 14% was possible in our model when the total fiber limit was
set at 4%. Therefore, 1% of DDGS combined with 0.00032% lysine and 0.14% soy oil in
broiler diets could replace 0.95% corn and 0.2% SBM. This means that, when using
DDGS in the diet formulation, it should be considered that additional oil and lysine
sources are required. This analysis demonstrates the viability of the proposed method
to evaluate feed resources, particularly feed byproducts which are used to substitute
typical feeds such as corn, wheat, and SBM.
Figure 4 shows the ranked percentage price spread expressed as the ratio between
SBM and DDGS (i.e., DDGS/SBM), between DDGS and corn (i.e., DDGS/corn), and
the corresponding DDGS inclusion rate. Ranked as such, this method is important to
find the price spread which corresponds to the switch between feeds in the historical
diet simulation. In the simulated starter and grower diets, DDGS substituted for corn
and SBM at any SBM and corn price spread, but with a greater amount and frequency
in the starter diet. However, in the simulated finisher diet, DDGS had a higher substitu-
tion rate in terms of quantity, but at a lower frequency of substitution over the study
period compared to the starter and grower diets. Figure 4 clearly illustrates three distinct
levels of price spread. A price spread of less than 76% (i.e., DDGS = 76% of corn price), in
which DDGS inclusion was at its maximum level, ; a price spread ranging between 76%
Table 3 Minimum, maximum and mean percentage (%) values of feed ingredients for the CSDmulti stage LP model in starter, grower and finisher broiler diets
Corn SBM DDGS Soy oil Meth Lys Lime DCP
Starter
Min 57.1 31.9 4.3 2.5 0.2 0.022 0.9 1.8
Max 58.2 32.1 5.5 2.6 0.2 0.023 0.9 1.8
Mean 57.4 31.9 5.1 2.6 0.2 0.023 0.9 1.8
Grower
Min 59.4 27.6 1.2 2.4 0.1 0.028 1.2 1.7
Max 64.7 28.6 6.8 3.2 0.2 0.03 1.2 1.8
Mean 61 27.9 5 3 0.2 0.029 1.2 1.7
Finisher
Min 62.2 23.4 0 2.5 0.1 0.034 1.1 1.6
Max 69.7 24.8 7.9 3.6 0.1 0.036 1.2 1.7
Mean 64.6 23.8 5.4 3.2 0.1 0.036 1.2 1.6
Alqaisi et al. Agricultural and Food Economics (2017) 5:25 Page 10 of 19
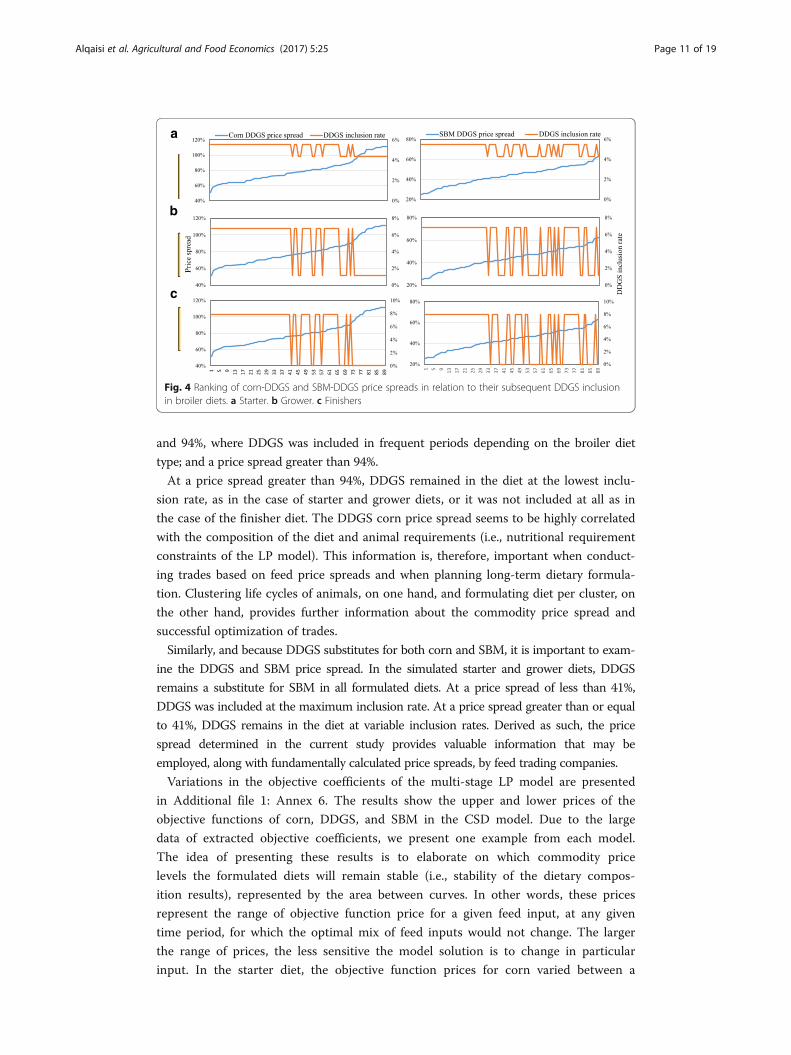
and 94%, where DDGS was included in frequent periods depending on the broiler diet
type; and a price spread greater than 94%.
At a price spread greater than 94%, DDGS remained in the diet at the lowest inclu-
sion rate, as in the case of starter and grower diets, or it was not included at all as in
the case of the finisher diet. The DDGS corn price spread seems to be highly correlated
with the composition of the diet and animal requirements (i.e., nutritional requirement
constraints of the LP model). This information is, therefore, important when conduct-
ing trades based on feed price spreads and when planning long-term dietary formula-
tion. Clustering life cycles of animals, on one hand, and formulating diet per cluster, on
the other hand, provides further information about the commodity price spread and
successful optimization of trades.
Similarly, and because DDGS substitutes for both corn and SBM, it is important to exam-
ine the DDGS and SBM price spread. In the simulated starter and grower diets, DDGS
remains a substitute for SBM in all formulated diets. At a price spread of less than 41%,
DDGS was included at the maximum inclusion rate. At a price spread greater than or equal
to 41%, DDGS remains in the diet at variable inclusion rates. Derived as such, the price
spread determined in the current study provides valuable information that may be
employed, along with fundamentally calculated price spreads, by feed trading companies.
Variations in the objective coefficients of the multi-stage LP model are presented
in Additional file 1: Annex 6. The results show the upper and lower prices of the
objective functions of corn, DDGS, and SBM in the CSD model. Due to the large
data of extracted objective coefficients, we present one example from each model.
The idea of presenting these results is to elaborate on which commodity price
levels the formulated diets will remain stable (i.e., stability of the dietary compos-
ition results), represented by the area between curves. In other words, these prices
represent the range of objective function price for a given feed input, at any given
time period, for which the optimal mix of feed inputs would not change. The larger
the range of prices, the less sensitive the model solution is to change in particular
input. In the starter diet, the objective function prices for corn varied between a
a
b
c
Fig. 4 Ranking of corn-DDGS and SBM-DDGS price spreads in relation to their subsequent DDGS inclusionin broiler diets. a Starter. b Grower. c Finishers
Alqaisi et al. Agricultural and Food Economics (2017) 5:25 Page 11 of 19

minimum limit of 59 and a maximum of 324 USD, and between − 937 and 280
USD for DDGS. The structure of the formulated diets is more sensitive to DDGS
price as compared to SBM and corn prices.
CWSR model
Figure 5 provides a graphical representation of the historical simulation for corn and wheat
inclusion rates in starter, grower, and finisher broiler diets in the CWSR model. In the
starter diet, the maximum inclusion rate of wheat was 51%, versus 60% for corn. The inclu-
sion rate of both corn and wheat increased, with a maximum for corn of 62% and 65% in
the grower diet, and 66 and 70% in the finisher diets (Table 4). The minimum inclusion
rate of corn versus wheat in the starter and grower diets indicates that corn could not be
completely replaced by wheat. This could be due to the fiber and energy composition dif-
ferences in both feeds, since wheat contains 36% more fiber and 7% less ME com-
pared to corn. Therefore, formulating starter diets solely based on wheat did not
provide the theoretical nutrient requirement considered in the current study.
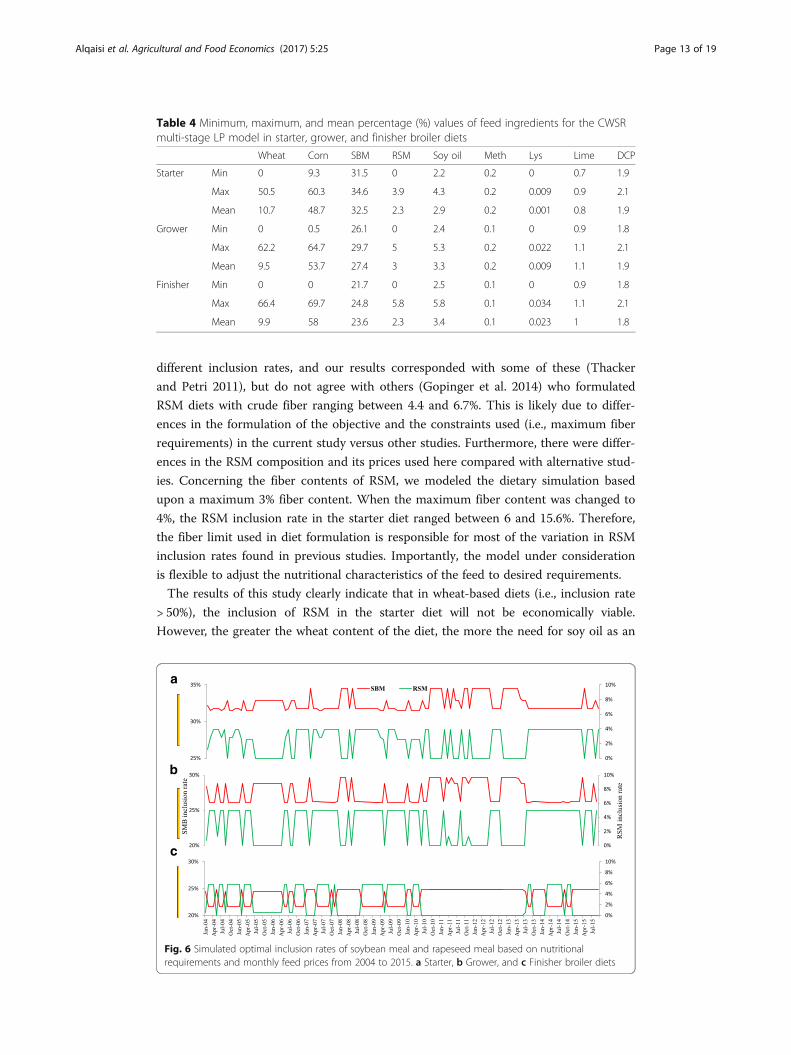
The inclusion rate of SBM (Fig. 6) varied between 31 and 35% in the starter diet, 26
and 30% in the grower diet, and between 22 and 25% in the finisher diet. RSM
substituted SBM partially in all dietary types. The proportion of RSM inclusion
increased progressively in the starter, grower, and finisher diets from 4 to 5% and 6%,
respectively. The simulated SBM inclusion rates over time varied depending on the
corn and wheat inclusion rates. For instance, at 50% wheat inclusion in the starter diet,
SBM inclusion was 33% and 0% for RSM. However, at 59% corn inclusion rate, SBM
was included at 32% and RSM at 4%. The analysis shows that in the corn-based diet,
1% of RSM could replace 0.7% SBM and 0.4% corn, in addition to reducing soy oil by
0.14% and Meth. Cyst. by 0.0046% (Fig. 7).
RSM is an important source for Meth. Cyst.; however, its inclusion rate is limited by
its high fiber content. The literature indicates the use of RSM in broiler diets at
a
b
c
Fig. 5 Simulated optimal inclusion rates of corn and wheat based on nutritional requirements and monthlyfeed prices from 2004 to 2015. a Starter, b Grower, and c Finisher broiler diets
Alqaisi et al. Agricultural and Food Economics (2017) 5:25 Page 12 of 19
different inclusion rates, and our results corresponded with some of these (Thacker
and Petri 2011), but do not agree with others (Gopinger et al. 2014) who formulated
RSM diets with crude fiber ranging between 4.4 and 6.7%. This is likely due to differ-
ences in the formulation of the objective and the constraints used (i.e., maximum fiber
requirements) in the current study versus other studies. Furthermore, there were differ-
ences in the RSM composition and its prices used here compared with alternative stud-
ies. Concerning the fiber contents of RSM, we modeled the dietary simulation based
upon a maximum 3% fiber content. When the maximum fiber content was changed to
4%, the RSM inclusion rate in the starter diet ranged between 6 and 15.6%. Therefore,
the fiber limit used in diet formulation is responsible for most of the variation in RSM
inclusion rates found in previous studies. Importantly, the model under consideration
is flexible to adjust the nutritional characteristics of the feed to desired requirements.
The results of this study clearly indicate that in wheat-based diets (i.e., inclusion rate
> 50%), the inclusion of RSM in the starter diet will not be economically viable.
However, the greater the wheat content of the diet, the more the need for soy oil as an
Table 4 Minimum, maximum, and mean percentage (%) values of feed ingredients for the CWSRmulti-stage LP model in starter, grower, and finisher broiler diets
Wheat Corn SBM RSM Soy oil Meth Lys Lime DCP
Starter Min 0 9.3 31.5 0 2.2 0.2 0 0.7 1.9
Max 50.5 60.3 34.6 3.9 4.3 0.2 0.009 0.9 2.1
Mean 10.7 48.7 32.5 2.3 2.9 0.2 0.001 0.8 1.9
Grower Min 0 0.5 26.1 0 2.4 0.1 0 0.9 1.8
Max 62.2 64.7 29.7 5 5.3 0.2 0.022 1.1 2.1
Mean 9.5 53.7 27.4 3 3.3 0.2 0.009 1.1 1.9
Finisher Min 0 0 21.7 0 2.5 0.1 0 0.9 1.8
Max 66.4 69.7 24.8 5.8 5.8 0.1 0.034 1.1 2.1
Mean 9.9 58 23.6 2.3 3.4 0.1 0.023 1 1.8
a
b
c
Fig. 6 Simulated optimal inclusion rates of soybean meal and rapeseed meal based on nutritionalrequirements and monthly feed prices from 2004 to 2015. a Starter, b Grower, and c Finisher broiler diets
Alqaisi et al. Agricultural and Food Economics (2017) 5:25 Page 13 of 19

additional energy source (also indicated by the correlation matrix in Additional file 1:
Annex 3, of 0.95 between dietary wheat and soy oil). For instance, in the starter diet,
and at 50% wheat inclusion rate, soy oil was included at 4.3%. Meanwhile, at a 60%
corn inclusion rate, soy oil was only 2.2% of the feed ration. Figure 7 provides an ex-
ample of simulated starter broiler diets in four consecutive months in 2009 as a re-
sponse to an increasing price spread between corn and wheat and its impact on the
RSM inclusion rate.
Unlike the grains substitution relationship, meal substitution rates showed different
patterns and appear to exhibit weak correlations with the price spread of meal inputs.
Additional file 1: Annexes 1 and 2 show the ranked price spread between corn and
wheat (i.e., wheat price/corn price) and between SBM and RSM. It further shows the
inclusion rate corresponding to the ranked price spread. In the simulated starter and
grower diets, at a price spread of less than 79%, diets were based on wheat with
minimal corn inclusion. At price spreads greater than or equal to 92%, corn remained
in the diet at the maximum inclusion rate and substituted for wheat completely. With
a price spread between 79 and 92%, the substitution between corn and wheat was dis-
connected; however, corn appeared more frequently in the starter diet than in the other
diets. The disconnection between corn and wheat at this stage was also influenced by
the price of other feed additives. Similar results were obtained from the simulated fin-
isher diet; however, at a price spread of 86%, corn remained in the diet at the maximum
inclusion rate and replaced wheat completely. The first position for dietary switch from
wheat to corn occurred when the wheat price was 80% of the corn price. At this price
spread, the results show two levels of substitution rate—one in the starter diet where
corn substituted 70% of wheat and the second in the grower and finisher diets where
corn substituted 100% of wheat. Nevertheless, the price spread borders found in our
study could diverge slightly depending on the physical objective function prices used.
Three levels of SBM and RSM (RSM/SBM) price spread can be identified. First,
in the starter and the grower diets, with a price spread lower than 48%, RSM
remained in the formulated diets. Second is the price spread of greater than 70%
in which inclusion of RSM becomes least important and appears very rarely in the
Fig. 7 Illustration of multi stage LP model (CWSR) starter diet formulation results for four consecutive monthsbetween Feb and May 2009 at increasing corn wheat price spread above 10 USD/ton, and its impact on RSMand other input substitutions. The price spread (wheat/corn) was estimated at 96% in Feb-09 and went down to83% in May-09
Alqaisi et al. Agricultural and Food Economics (2017) 5:25 Page 14 of 19

formulated diets (i.e., only one time). Third, there exists a price spread of boundar-
ies between 48 and 70%, in which RSM appeared frequently in the formulated di-
ets. The price spread differed slightly in the finisher formulated diets. With a price
spread of less than 53%, RSM remained in all formulated diets. At a price spread
range between 53 and 69%, RSM appeared frequently in the diets. At a price
spread greater than 69%, the inclusion of RSM in the diet became less advanta-
geous, and it appeared only one time in the formulated diets.
The upper and lower objective coefficients for feeds used in the CWSR model are
shown in Additional file 1: Annex 7. The figure shows clearly that the upper price for
wheat is unbounded in most of the studied periods compared to a narrow price range
for corn. The composition of the simulated diets is most sensitive to corn price, but
that the optimal mix of feeds is ultimately not very stable and highly dependent upon
the relative price of feed inputs at any given time.
Additional file 1: Annexes 4 and 5 provide the correlation matrix between the
simulated dietary feed components in the grower and finisher diets of the CWSR
model. This chart is presented to show the importance of the multi-stage LP mod-
eling process in developing the relationship between dietary components in dietary
simulation analyses. The figure clearly indicates that wheat inclusion is correlated
with soy oil inclusion rates (corr. = 0.95 and R2 = 0.90). On the other hand, there is
a negative correlation between the inclusion of corn and that of soy oil (corr. = −0.96 and R2 = 0.92). A similar correlation trend was found between these feeds in
the grower and finisher diets. This is attributed to the low energy content in wheat
versus corn grains, and therefore, additional dietary energy sources were provided
by soy oil. Furthermore, the inclusion of wheat was negatively correlated with the
inclusion of corn (− 1.00), which is expected since in most cases the formulated di-
ets where composed of one of these energy feeds. Furthermore, wheat inclusion
Table 5 Minimum, maximum, mean, and RMSE of ME, protein, and lysine in starter, grower, andfinisher formulated broiler diets
ME (Mcal/kg feed) Protein (%) Lysine (%)
Starter Grower Finisher Starter Grower Finisher Starter Grower Finisher
CSD model
Min 3.05 3.1 3.15 22 20 18.26 1.15 1.04 0.94
Max 3.05 3.1 3.15 22.12 20.57 19.06 1.15 1.04 0.94
Mean 3.05 3.1 3.15 22.08 20.39 18.81 1.15 1.04 0.94
STDEV 0 0 0 0.06 0.27 0.38 0 0 0
RMSE absolute 0 0 0 0.1 0.48 0.89 0 0 0
RMSE % 0 0 0 0.45 2.33 4.74 0.17 0 0.043
CWSR model
Min 3.05 3.1 3.15 22 20 18.05 1.15 1.04 0.94
Max 3.05 3.1 3.15 22.65 21.26 19.75 1.18 1.05 0.94
Mean 3.05 3.1 3.15 22.09 20.19 18.43 1.17 1.04 0.94
STDEV 0 0 0 0.23 0.45 0.58 0.01 0 0
RMSE 0 0 0 0.25 0.48 0.72 0.02 0 0
RMSE % 0 0 0 1.11 2.23 3.91 1.77 0.15 0
Alqaisi et al. Agricultural and Food Economics (2017) 5:25 Page 15 of 19

had a negative correlation with RSM of − 0.53 and a positive correlation found
with Meth. Cyst. (0.88 in the starter diet and 0.75 in the grower diet) and a low
correlation of 0.37 found in the finisher diet. These results indicate that in wheat-
based diets, additional synthetic Meth. Cyst. is needed to meet the requirements
when RSM is not used in the formulation. A similar conclusion can be drawn
when testing the correlation between SBM and methionine. However, the negative
correlation between RSM and Meth. Cyst. indicates that this byproduct is an inter-
esting source to reduce expensive synthetic amino acids in diets. Simulated com-
pound feed prices are presented in Additional file 1: Annex 8. These prices will
differ by location as they do not represent the farm gate feed price due to the
omission of transportation and retailer costs, which are regionally dependent. Com-
pared to a static and standard ration (corn and SBM based diet), using a multi-
stage LP model, it is possible to generate a feed ration which, when looking at the
year 2014, could give an average cost reduction of 8.8 USD per ton of starter feed,
4.6 USD per ton of grower feed, and 1.3 USD per ton of finisher feed (CSD
model). This results in an average price reduction of 5.9 USD per ton of formu-
lated feed. If we apply this price reduction for the year 2014, it results in a
total cost reduction of 1.74 billion USD for starter, grower, and finisher feed com-
bined, meaning that the broiler sector would have gained over 1.74 billion USD in
2014 benifiting from a monthly feed formulation and from inclusion of bypro-
ducts. Assuming a similar price reduction in layer chicken feed production, the
magnitude of global poultry industry gain will increase up to 2.57 billion USD. The
gain could be more than double if other livestock species are included in the ana-
lysis, given that the byproducts inclusion rate is of greater importance for rumi-
nants. Using local byproducts may result in lower production costs and reduced
greenhouse gas emissions, mainly associated with reduced transportation distances
for feed inputs (Hristov et al. 2013).
In a broader sense, optimization of a life cycle animal diet, in a multi-stage
approach, would most likely affect other parts of the supply chain. This could in-
clude commodity transportation between producing and importing countries, since
feed demand would vary widely.
Model evaluation
Table 5 provides information about the optimization errors of ME, protein, and lysine.
The model evaluation is based on the calculated root mean squared error (RMSE), given
in absolute value and percentage of ration. In relation to the multiple formulation data ob-
tained from successfully solved LPs, the error level caused by the proposed model was cal-
culated. The major optimization errors are caused by the deviation of crude protein
results from the nutritional requirement constraints. It is observed that the error level in-
creases with reducing CP requirements from the starter to finisher diets, with RMSE ran-
ging between 0.1 and 0.89 in the CSD model versus lower error level observed in the
CWSR model which ranged between 0.1 and 0.70. This could be partially explained by
the higher number of feed ingredients used in the CWSR model (i.e., two energy sources
and two protein sources). With more feed items included in the formulation, the comple-
mentary nature of nutrients in different ingredients promotes the reduction of nutrient
Alqaisi et al. Agricultural and Food Economics (2017) 5:25 Page 16 of 19

variation as reported by Zhang and Roush (2002). However, in our study, the CP and ly-
sine standard deviations were lower than, or similar to, those found in their study with a
single cost minimization objective. Furthermore, minimizing CP and amino acid nutrients
requires a multiple objective optimization, which is not the objective of the current study.
Most likely, additional feeds need to be included in the formulation to minimize errors;
however, this depends on the availability of historical feed and byproduct prices.
ConclusionsTime series diet formulation can provide insights for both feed commodity traders and
feed producers to formulate cheaper diets, which would still meet the nutrient require-
ments for animals. Additionally, time series diet formulations provide the option to
periodically include inexpensive agro-industrial byproducts, which are often sourced
locally. Furthermore, when future commodity prices are known, the application of the
model can be of particular importance for medium- and long-term feed producers’ re-
sources planning and estimation of the future sustainable dietary composition. It is im-
portant, however, to also consider the diversity of feed resources that are available in a
region and to consider the variation between feed prices in order to extract representa-
tive results. In particular cases, since not all companies own least cost formulation ana-
lysis tools, the model outputs obtained from our analysis could be further utilized to
extrapolate major feed inclusion rates (however, not the feed additives) based on mar-
ket feed prices without referring to LP models (i.e., modeling price impact on DDGS
dietary inclusion rate).
This study addressed the nutritional and economic benefits of using a multi-stage LP
optimization model in broiler feed formulation. The model provides information to
feed producers and traders to determine potential switch points between commodities
based on the price spread level. There are two primary limitations of the approach
presented in this paper. First, the constraints are linear, thereby forcing corner solutions
and discrete jumps between feed inputs. This may, however, be a realistic interpretation
of the behavior of firms when considering contracting and transportation costs. Second,
this model only examines the cost of inputs in feed mix and dietary requirements,
while profit-maximizing behavior likely includes additional objectives and constraints.
However, by examining the dietary feed commodity switch between months, we dem-
onstrate variations in feeding strategies and opportunities to minimize feed cost—of
primary significance in the livestock production profit function—over a given time
period. Our model is built on an open source environment and can be broadly imple-
mented by decision-makers to explore and test further modeling scenarios which suit
the production objectives. Furthermore, if feed price forecasts are available, the model
can also be automated to predict the least cost dietary dynamics and price spread.
Additional file
Additional file 1: Annex 1: Corn and wheat inclusion rates in broiler diets as a function of corn-wheat pricespread in the CSD model. a Starter. b Grower. c Finishers. Annex 2: SBM and RSM inclusion rates in broiler diets asa function of SBM-RSM price spread in the CWSR model. a Starter. b Grower. c Finishers. Annex 3: Correlationmatrix of optimized feed composition in the simulated starter diet of the CWSR model. Annex 4: Correlation matrixof optimized feed composition in the simulated grower diet of the CWSR model. Annex 5: Correlation matrix ofoptimized feed composition in the simulated finisher diet of the CWSR model. Annex 6: Upper and lower simulatedprice boundaries of feeds in the CSD LP model between 2008 and 2016. Annex 7: Upper and lower simulated price
Alqaisi et al. Agricultural and Food Economics (2017) 5:25 Page 17 of 19
boundaries of feeds in the CWSR LP model between 2004 and 2015. Annex 8: Simulated compound feed price forstarter, grower, and finisher broiler diets in the CWSR and CSD models. (DOCX 2340 kb)
Authors’ contributionsOA developed the model, collected data, analyzed the results and graphics, and drafted the earlier manuscript versions.AN provided inputs on the literature review, extracted the results, and contributed to discussions. RBW edited the draftedmanuscript and provided inputs to the discussions. All authors have read and approved the final manuscript.
Competing interestsThe authors declare that they have no competing interests.
Publisher’s NoteSpringer Nature remains neutral with regard to jurisdictional claims in published maps and institutional affiliations.
Author details1Department of Animal and Veterinary Sciencs, College of Agricultural and Marine Sciences, Sultan Qaboos University,P.O. Box 34, 123 Al khoudh, Sultanate of Oman. 2Wageningen Livestock Research, Wageningen University andResearch, P.O. Box 338, 6700 AB Wageningen, The Netherlands. 3Department of Agricultural and Applied Economics,Texas Tech University, Lubbock, TX 79409; Texas AgriLife Research -Lubbock, Lubbock, TX 79403, USA.
Received: 18 April 2017 Accepted: 20 November 2017
ReferencesAlltech. (2016). Presentation on: Global feed tonnage, available under the link: https://cdn2.hubspot.net/hubfs/745395/
PDFs/2016_Global_Feed_Survey_FINAL_Slides.pdf, visited on Nov. 2016Alqaisi O, Hemme T, Latacz-Lohmann U, Susenbeth A (2014) Evaluation of food industry by-products as feed in semi-arid
dairy farming systems: the case of Jordan. Sust Sci J 9:361–377Alqaisi O, Ndambi OA, Hemme T (2011) Global view on feed cost and feed efficiency on dairy farms. All About Feed
magazine. 2 nr. 4Beckman J, Keeney R, Tyner W (2011) Feed demands and coproduct substitution in the biofuel era. Agribusiness 27:1–18.
https://doi.org/10.1002/agr.20247de Visser, CLM, Schreuder R, Stoddar R (2014) The EU’s dependency on soya bean import for the animal feed industry
and potential for EU produced alternatives OCL–Ol Corps Gras Li 21 p. D407Donohue M, Cunningham DL (2009) Effects of grain and oilseed prices on the costs of US poultry production. J Appl
Poult Res 18(2):325–337FAO, IFPRI (International Food Policy Research Institute), IFAD, IMF (International Monetary Fund), OECD (Organization
of Economic Cooperation and Development), UNCTAD (United Nations Conference on Trade and Development),World Bank, World Food Programme, WTO (World Trade Organization), and the United Nations High-Level TaskForce (2011) Price volatility in food and agricultural markets: policy responses, policy report
Godfray HCJ, Beddington JR, Crute IR, Haddad L, Lawrence D, Muir JF, Pretty J, Robinson S, Thomas SM, Toulmin C(2010) Food security: the challenge of feeding 9 billion people. Science 327:812–818
Gopinger E, Xavier EG, Elias MC, Catalan AAS, Castro MLS, Nunes AP, Roll VFB (2014) The effect of different dietary levelsof canola meal on growth performance, nutrient digestibility, and gut morphology of broiler chickens. J Appl PoultRes 93:1130–1136
Hoffmann LA, Baker A (2011) Estimating the substitution of distillers’ grains for corn and soy bean meal in the U.S. feedcomplex/FDS-11-I-01, Washington D.C. Economic Research Service/USDA. https://www.ers.usda.gov/webdocs/publications/36471/12563_fds11i01_2_.pdf?v=42426
Hristov AN, Oh J, Lee C, Meinen R, Montes F, Ott T, Firkins J, Rotz A, Dell C, Adesogan A, Yang W, Tricarico J, Kebreab E,Waghorn G, Dijkstra J, Oosting S (2013) Mitigation of greenhouse gas emissions. In Gerber, PJ, Henderson, B andMakkar, HPS. Eds. Livestock production – a review of technical options for non-CO2 emissions. FAO animalproduction and health paper no. 177. FAO, Rome, Italy
Leeson S, Summers JD (2005) Commercial poultry nutrition, 3rd edn. Nottingham University Press, NottinghamLoar RE, Donaldson JR, Corzo A (2012) Effects of feeding distillers dried grains with solubles to broilers from 0 to 42
days posthatch on broiler performance, carcass characteristics, and selected intestinal characteristics. J Appl PoultRes 21:48–62
Makkar HPS, Ankers P (2014) Towards sustainable animal diets: a survey-based study. Anim Feed Sci Technol198:309–322
Nicholson CF, Lee DR, Boisvert R, Blake RW, Urbina CI (1994) An optimization model of dual purpose cattle productionin the humid lowlands of Venezuela. Agric Syst 46:311–334
NRC (1994) Nutrient requirements of poultry. Ninth revised edition, 1994. National Academy Press, Washington D.CPeric T, Babic Z (2009) Optimization of industrial production of feed blends as multiple criteria programming problem,
recent advances in technologies. Maurizio AS (Ed.), Available from: https://cdn.intechopen.com/pdfs-wm/9278.pdfPesti, G.M., Miller, B.R. 1993. Animal feed formulation, economics and computer applications. AVI book, van nonstrand
Reinhold. Georgia, USAR Core Team (2016) R: a language and environment for statistical computing. R Foundation for Statistical Computing,
Vienna URL https://www.R-project.org/.
Alqaisi et al. Agricultural and Food Economics (2017) 5:25 Page 18 of 19

Reynoso-Campos O, Fox DG, Blake RW, Barry MC, Tedeschi LO, Nicholson CF, Kaiser HM, Oltenacu PA (2004)Predicting nutritional requirements and lactation performance of dual-purpose cows using a dynamic model.Agric Syst 80:67–83
Saxena P, Chandra M (2011) Animal diet formulation: a review (1950–2010). Anim Sci Rev 6(57):1–9 (CAB Reviews:Perspectives in Agriculture, Veterinary Science, Nutrition and Natural Resources, UK)
Saxena P (2011) Comparison of linear and nonlinear programming techniques for animal diet. Appl Math 1:106–108.https://doi.org/10.5923/j.am.20110102.17
Singh D, Saxena P (2015) Optimization of livestock feed by blend of linear programming and SOMGA. In: Das KN et al(eds) Proceedings of fourth international conference on soft computing for problem solving, advances inintelligent systems and computing, vol 336. https://doi.org/10.1007/978-81-322-2220-0_27
Thacker PA, Petri D (2011) Nutritional evaluation of canola protein concentrate for broiler chickens. Asian-Australas J ofAnim Sci 24:1607–1614
USDA (2016). Biofuel feedstock and coproduct market Data. http://www.ers.usda.gov/topics/farm-economy/bioenergy/biofuel-feedstock-coproduct-market-data/. visited on Oct. 2016.
Walugembe M, Rothschild MF, Persia ME (2014) Effects of high fiber ingredients on the performance, metabolizableenergy and fiber digestibility of broiler and layer chicks. Anim Feed Sci Technol 188:46–52
World bank (2016) monthly commodity feed prices. http://www.worldbank.org/en/research/commodity-markets. visitedon Dec. 2016.
Žgajnar J, Erjavec E, Kavčič S (2010) Multi-step beef ration optimisation: application of linear and weighted goalprogramming with a penalty function. Agri and Food Sci 19:193–206
Zhang Z, Roush WB (2002) Multiple-objective (goal) programming model for feed formulation: an example forreducing nutrient variation. Poultr Sci 81:182–192
Alqaisi et al. Agricultural and Food Economics (2017) 5:25 Page 19 of 19