Embed Size (px)
Citation preview

Global and Planetary Change 122 (2014) 89–106
Contents lists available at ScienceDirect
Global and Planetary Change
j ourna l homepage: www.e lsev ie r .com/ locate /g lop lacha
Time-scale and astronomical forcing of Serbian loess–paleosol sequences
Biljana Basarin a,⁎, Bjoern Buggle b, Ulrich Hambach c, Slobodan B. Marković a, Ken O’Hara Dhand d,Andjelka Kovačević e, Thomas Stevens f, Zhengtang Guo g, Tin Lukić a
a Chair of Physical Geography, Department of Geography, Faculty of Sciences, University of Novi Sad, Trg D. Obradovića 3, 21000 Novi Sad, Serbiab Geological Institute, ETH Zürich, Sonneggstr. 5, 8092 Zürich, Switzerlandc Chair of Geomorphology, University of Bayreuth, D-95440 Bayreuth, Germanyd Giotto Loess Research Group, Geography Department, Leicester University, Leicester LE1 7RH, UKe Department of Astronomy, Faculty of Mathematics, University of Belgrade, Studentski trg 16, Belgrade, Serbiaf Centre for Quaternary Research, Department of Geography, Royal Holloway, University of London, Egham, Surrey TW20 0EX, UKg Institute of Geology and Geophysics, Chinese Academy of Sciences, P.O. Box 9825, Beijing 100029, China
⁎ Corresponding author.E-mail address: [email protected] (B. Basarin
http://dx.doi.org/10.1016/j.gloplacha.2014.08.0070921-8181/© 2014 Elsevier B.V. All rights reserved.
a b s t r a c t
a r t i c l e i n f oArticle history:Received 27 February 2014Received in revised form 20 July 2014Accepted 11 August 2014Available online 19 August 2014
Keywords:paleoclimatePannonian Basinloessastronomical time scale
The loess in Vojvodina region in Northern Serbia is regarded as one of the thickest and most completepaleoclimate archives in Europe. Recent studies showed that loess in Vojvodina spans the last million years.Based on the interprofile correlation between two most important loess–paleosol sequences Stari Slankamenand Titel Loess Plateau a synthetic profile was formed regarded as Stratotype Record of Serbian loess (SRSL).The synthetic profile has a total thickness of 62 m and is comprised of 10 loess layers intercalated with ninepedocomplexes. A new astronomically tuned agemodel is proposed based on correlating peakmagnetic suscep-tibility (χ) responses with the timing of June perihelia. This target curve is derived from analysis of regional cli-mate proxy responses during the last interglacial and independently dated last glacial–interglacial cycle ofSerbian loess–paleosol sequence. The use of a precession index target as the only tuning target presents the re-quirement of minimal tuning approach, which means that only the precession frequencies of the record willbe manipulated.Spectral and wavelet analyses of tuned magnetic susceptibility record reveal the presence of frequencies corre-sponding to 139 kyr, 94 kyr, 65 kyr and small amplitude cycles of 43 and 23 kyr in χ record. Spectral analysisof frequency dependent magnetic susceptibility (χfd) has spectral content concentrated around 100 kyr and77 kyr, while higher frequency cycles are below significance level. There is a strong 245 kyr peak in spectral re-sults of both χ and χfd records that needs additional attention.Around 800 kyr in SRSLχ time scale and between 900 kyr and 600 kyr in SRSLχfd series the 100 kyr cycles becomedominant, which could be identified as the period of Mid-Pleistocene Transition. This is the first record of thispaleoclimate transition in the Pannonian basin. The results presented in this study highlight the potential ofSerbian loess–paleosol sequences for investigation of detailed and long-term climate reconstruction over conti-nental Eurasian extent.
© 2014 Elsevier B.V. All rights reserved.
1. Introduction
1.1. Loess as paleoenvironmental archives
Detailed archives of Cenozoic paleoclimatic change are found in theocean, ice and on land. Variations in oxygen isotopes measured in rela-tively undisturbed deep-sea sediments enable the reconstruction of thepast climates going back tens of millions of years. These reconstructionsallow tests of numerous hypotheses that dealwith the causes of the gla-cial interglacial cycles, changes in their intensity and frequency, andtheir global impact on sea level. Ever since Hays et al. (1976) unearthed
).
strong evidence for orbital parameters as the driver of glaciations, thepresence of Milankovitch cycles has been demonstrated in deep-seasediments in a myriad of ways.
While deep ocean sediments provide a globally integrated record,they generally do not provide specific evidence of the impact of climatechange in specific regions on land. Long continuous terrestrial se-quences are therefore crucial for the investigation of paleoclimatic andpaleoenvironmental conditions on a scale that impacts specific ecosys-tems and human population. As such, terrestrial loess and lacustrinesediments have been used for the reconstruction of past climates butalso for determining climate forcing mechanisms. Loess deposits com-prising wind-blown dust are regarded as some of the best terrestrialequivalents of marine sedimentary records of long-term global climaticchange as they are relatively continuous and undisturbed (e.g. Porter,

90 B. Basarin et al. / Global and Planetary Change 122 (2014) 89–106
2001). Kukla (1970, 1975, 1977) proposed some of the first attempts tocorrelate paleoclimatic fluctuations recorded in loess deposits with os-cillations recorded in deep-sea sediments. Since then, loess–paleosol se-quences have become very important for reconstructing Pleistoceneenvironmental processes in the terrestrial environment (e.g. Hellerand Evans, 1995; Evans and Heller, 2001). The best studied long andquasi-continuous records are preserved in China, mainly on the ChineseLoess Plateau, where the deposition of aeolian sediments most likelybegan 22 Myr ago (Guo et al., 2002). Numerous proxies have been de-rived from loess and interbedded paleosols to reconstruct climaticchanges, notably magnetic susceptibility (χ), grain size (GS) and geo-chemical indices. Variations in these proxies apparently reflect the glob-al climatic rhythms previously revealed from marine sediments, andthesewere subsequently used for the development of loess depositionaltimescales.
1.2. Astronomical time scale
The history of geological time scale development based on the rec-ognition of orbitally forced rhythms goes back to the 19th century.This approach was most explicitly addressed by Gilbert (1895, 1900a,b) and then further developed by Barrell (1917). However, the calcula-tions of Milutin Milankovitch (1920, 1941) were the major turningpoint, although the idea that changes of orbital parameters drive‘ice ages’ was not well accepted at the time (Petrović and Marković,2012). Milankovitch's theory was subsequently proven by the findingsmade from the Deep Sea Drilling Project and the work of Hays et al.(1976), which ultimately led to the current paradigm of orbitally forcedevolution of paleoclimate and the development of astronomically de-rived time scales for past environmental change. The first loess agemodel that was tuned to the timescale of orbital changes was intro-duced by Ding et al. (1994), tuning grain size variations in the Baojiloess–paleosol sequence to variations of obliquity and precession, theo-retically calculated for the Pleistocene. Subsequently, many authors in-cluding Lu et al. (1999), Ding et al. (2002), Sun et al. (2006) and Hanet al. (2012) have proposed timescales of Chinese loess based on thecorrelation of magnetic susceptibility measurements and grain size var-iations to orbital parameters. The main characteristic of these timescales is the application of phase free digital filters on proxy data inorder to extract the frequencies, obliquity and precession which werethen correlated to Earth's obliquity and precession values. Heslop et al.(2000) used a different approach consecutively to construct the timescale for the Louchuan loess–paleosol sequence. These authors did notutilize phase free digitalfilters on proxy variations. Instead, the chronol-ogy was formulated by directly correlating unfiltered proxy data to pastchanges in insolation as calculated by Laskar (1990) aswell as using theorbitally tuned ODP677 δ18O record as target curve (Shackleton et al.,1990).
In Europe, long, terrestrial records are scarce. Over the last decade,exposures of loess in theMiddle and Lower Danube Basin have becomekey sites for paleoenvironmental research. Paleoenvironmental condi-tions over the last million years have resulted in relatively continuousdeposits uninterrupted by glaciation and tundra conditions, which re-flect oscillations between relatively warm-humid (“interglacial”) andcold-dry (“glacial”) periods. The loess deposits of the Middle andLower Danube Basin extend to the base of the Pleistocene. The sedimen-tation was probably initiated in response to the formation of thePannonian basin, retreat of the large lake systems, which once occupiedit, and the increased sediment supply from the large rivers,whichdevel-oped subsequently. It was during this period that hominins first arrivedon the European continent, although no sites of this age have yet beendiscovered in the region (Fitzsimmons et al., 2012). Particularly loess se-quences in the Vojvodina region of Northern Serbia, which representlong, and quasi-continuous archives of the Late and Middle Pleistoceneclimate evolution (e.g. Buggle et al., 2013, 2014), extend to the earlyPleistocene (Marković et al., 2011, 2012b). These records developed in
loess plateau sites, which is an exceptional depositional setting forEuropean conditions, but similar to the Chinese stratotype sections. Asresearch on the Chinese loess sequences clearly revealed an astronomi-cal influence on climate dynamics (e.g. Ding et al., 1994, 2002; Heslopet al., 2000, 2002; Lu et al., 1999, 2004; Sun et al., 2006), similar patterncan possibly be expected in the loess record from theMiddle and LowerDanube Basin.
Magnetic susceptibility measurements for Mostistea loess–paleosolsection were used to develop an astronomical age model utilizing themethod of Heslop et al. (2000). The authors generated time series formagnetic susceptibility using as the target curves the 65°N summer in-solation (Berger and Loutre, 1991) and the stack of 57 globally distribut-ed benthic δ18O records (Lisiecki and Raymo, 2005). Spectral analysis ofthe obtained time series has shown themainMilankovitch periodicities(Necula and Panaiotu, 2008).
Marković et al. (2012a) were recently able to formulate the firstorbitally tuned astronomical time scale for loess–paleosol sequencesin the Vojvodina region. The time scale was developed using theHeslop et al. (2000) approach of correlation unfilteredmagnetic suscep-tibility record (χ) to the insolation curve for June 65° N (Berger andLoutre, 1991) and the ODP677 δ18O curve (Shackleton et al., 1990). Thetime scale was supplemented by paleomagnetic and aminostratigraphictechniques and provided the first detailed age model for Serbian loess–paleosol sequences. This enabledmore precise correlation to other terres-trial, marine or ice core records.
The present manuscript proposes a new astronomically tuned agemodel based on correlating peak magnetic susceptibility values ofSerbian key sites with the timing of June perihelia. This target is derivedfrom analysis of regional climate proxy responses during the last inter-glacial (Tzedakis, 2005; Tzedakis et al., 2006; Stevens et al., 2011). By re-solving almost every precessional cycle during the Middle and LatePleistocene, the new agemodel represents an improvement of the time-scale for the loess stratigraphy and paleoenvironmental evolution in theMiddle Danube Basin. Spectral andwavelet analyses are used to test thepresence of orbital frequencies in Serbian loess. The results from thisstudy greatly enhance the potential of Vojvodinian loess sites for pre-cisely reconstructing long-term climatic changes as well as climatictransitions over the Late and Middle Pleistocene in this region.
2. Materials and methods
2.1. Loess in Vojvodina: stratigraphy, key sites and the synthetic loess record
About 60% of area in theVojvodina region is covered by loess (Fig. 1).The loess is mainly deposited on six plateaus between the rivers Dan-ube, Tisa, Sava and Tamiš and has a maximum thickness of approxi-mately 55 m. Numerous methods have been used to reconstructpaleoenvironmental and paleoclimatic changes (e.g. Marković et al.,2004, 2005, 2006, 2007, 2009, 2011; Fuchs et al., 2008; Buggle et al.,2008, 2013, 2014; Antoine et al., 2009; Bokhorst et al., 2009, 2011;Bokhorst and Vandenberghe, 2009; Schmidt et al., 2010; Lukić et al.,2014).Marković et al. (2008) developed a stratigraphic labeling schemefollowing the Chinese loess stratigraphic system (e.g. Kukla, 1987;Kukla and An, 1989), in which the loess and paleosol stratigraphicunits were designated as “L” and “S” and numbered in order of increas-ing age. The prefix “V” is used to refer to the standard Pleistocene loess–paleosol stratigraphy of the Vojvodina (Marković et al., 2008).
For the purpose of this study the twomost prominent key sites of theVojvodina regionwere chosen to build a synthetic record of theVojvodinaloess: The Titel loess plateau (45°17′–18′N and 20°12′–15′E, Fig. 1), anisolated loess island, considered to have the highest accumulationrates in the region. It comprises a complete loess paleosol successionrepresenting the last five glacial–interglacial cycles (Bokhorst et al.,2009, 2011; Bokhorst and Vandenberghe, 2009;Marković et al., 2012b).
Completeness of the last five glacial cycles of the Titel loess plateau isevaluated by the correlation of themagnetic susceptibility record to the

Fig. 1. Location of the most important loess exposures in Pannonian (Carpathian) basin with the emphasis on sequences in Vojvodina (North Serbia) and the investigated profiles.
91B. Basarin et al. / Global and Planetary Change 122 (2014) 89–106
δ18O of LR04 stack (Lisiecki and Raymo, 2005) and validated by correla-tions to other profiles of the area (e.g. Marković et al., 2011, 2012a,b)(Fig. 2).
The other sequence is Stari Slankamen (45°07′58″N; 20°18′44″E,Fig. 1), located 20 km south of the Titel loess plateau, on the westernbank of the Danube River, opposite to the Tisa confluence. The profileis approximately 40 m thick and consists of loess intercalated withnine major fossil paleosols. The sequence is regarded as one of themost important Quaternary sections in the Carpathian (Pannonian)basin, covering the time frame of about one million years (Markovićet al., 2011). However, a distinct gravel layer indicates an erosionalevent (Marković et al., 2011). The magnetic susceptibility record andaminostratigraphy data indicate a missing pedocomplex (V-S2)(Fig. 2). Approximately 11 m of the base of the section, from paleosolV-S6 to the basal pedocomplex, is probably the oldest loess depositsfound so far in the region (seeMarković et al., 2011, 2012a for a detaileddescription of the chronostratigraphy).
The composite profile (Fig. 2b) was formed based on interprofilecorrelations of the Titel and Stari Slankamen sections, with the youngerpart from V-S0 to V-S5 deriving from the Titel loess plateau and theolder part fromV-L6 to basal pedocomplex from the Stari Slankamen se-quence. Thus, the synthetic profilewill be regarded as Stratotype Recordof Serbian loess (SRSL). It has a total thickness of 62 m and is comprisedof ten loess layers intercalated with nine pedocomplexes. The base rep-resents the strongly rubified basal pedocomplex of Stari Slankamen(Fig. 2b).
2.2. The magnetic susceptibility as paleoclimatic master curve
Iron bearing minerals such as iron-oxides, iron-sulphates or iron-silicates,are omnipresent in most rocks and clastic sediments, but oftenoccur in minor or trace concentrations. Pedogenetic and diagenetic pro-cesses may result in the enhancement and or transformation of certainminerals or mineral fractions changing the magnetic properties of thesediment. One of the most prominent processes, observed in many soilsand sediments, is the formation of ferrimagneticminerals such asmagne-tite andmaghemite in the course of pedogenesis (Evans andHeller, 2001;Thompson andOldfield, 1986). Its rate aswell as the equilibriumbetweenthe formation of magnetite/maghemite and other Fe mineral phases iscontrolled by conditions in the soil environment such as the temperatureand moisture regime, the pH and content of organic matter (Evans andHeller, 2001). Thompson and Oldfield (1986) as well as Evans andHeller (2001) propose several steps for the pedogenic formation of ferri-magnetic minerals, essentially involving an alternation of reducing andoxidizing conditions. Additional oxidation can produce maghemite(Maher, 1998; Buggle et al., 2009; Marković et al., 2009).
The amount aswell as the grain size distribution of the ferrimagneticminerals magnetite andmaghemite generally exerts the dominant con-trol on the magnetic susceptibility of sediments and soils, althoughthese minerals represent only a relative small fraction of the pedogenicironminerals. The magnetic susceptibility of magnetite andmaghemiteis several magnitudes higher (4–5 ∙ 10−4 kg−1 m3) than that ofhematite and goethite (6–7 ∙ 10−7 kg−1 m3), which are common

92 B. Basarin et al. / Global and Planetary Change 122 (2014) 89–106

93B. Basarin et al. / Global and Planetary Change 122 (2014) 89–106
antiferromagnetic minerals in loess and fossil soils (Thompson andOldfield, 1986). Thus, already relatively small amounts of ferrimagnetica,formed during pedogenesis, significantly lead to amagnetic susceptibilityenhancement in (fossil) soils (Buggle et al., 2009; Marković et al., 2009).
Accordingly, at all Serbian sites studied so far, records of magneticsusceptibility together with paleopedological parameters show pro-nounced climate and environmental changes during the Middle andLate Pleistocene. Magnetic susceptibility records from Serbian loesssequences generally exhibit a strong contrast between loess layersand paleosols (see Marković et al., 2008, 2011, 2012b for reviews ofSerbian magnetic susceptibility records). This implies that the modelof ferrimagnetite formation during pedogenesis as proposed byThompson and Oldfield (1986) and Evans and Heller (2001) is valid inthe study region. While magnetite and maghemite can also be presentas detrital components in the parent material i.e. loess, the pedogeneticorigin of magnetite in fossil soils is additionally confirmed by the recordsof the frequency dependent magnetic susceptibility (χfd) (Buggle et al.,2013; Liu et al., 2013). χfd is a measure for the relative contribution ofsuperparamagnetic ferrimagnetica close to the superparamagnetic/singledomain threshold. This grain size fraction, exclusively representingpedogenetically formed magnetite and maghemite (Banerjee, 1994; Liuet al., 2007), exhibits a significantly increasing relative abundance in thefossil soils of Serbian loess sites (see Buggle et al., 2013; Liu et al., 2013).Buggle et al. (2013) and Liu et al. (2013) confirmed that the processesof magnetic susceptibility enhancement in Serbian loess are similar as inChinese loess sections. This gives an explanation forwhy distinct patternsof the magnetic susceptibility record such as minima in loess units, max-ima in fossil soils and characteristic fingerprints representing individualpedocomplexes can be well correlated between Serbian and Chinesestratotype sections (Liu et al., 2013; Marković et al., 2008, 2011, 2012b).Apparently, the sensitivity of themagnetic susceptibility to record climatechanges is similar in both regions, resulting in typical features of the rockmagnetic record in corresponding stratigraphic units. Hence, as inChineseloess sites, records of magnetic susceptibility and their frequency depen-dence can be regarded as suitable paleoenvironmentalmaster curves alsofor Serbian loess to develop an orbital tuning based time scale.
Therefore, for the present study, the Titel and Stari Slankamen sec-tions were sampled at 5 cm intervals. High-resolution rock magneticanalyses (χ and χfd) and paleomagnetic experiments were done onthe sample material at the Chair of Geomorphology, University of Bay-reuth, following standard procedures. A detailed description of themea-surement procedures is given inMarković et al. (2011) and Buggle et al.(2014). As with the stratigraphic units, the composite SRSL χ and χfdrecords are built from the younger units of the Titel sequence (V-S0 toV-S5 i.e. MIS 0 to MIS 15) and from the units older than MIS 15 (V-L6to basal pedocomplex) of the Stari Slankamen site (Fig. 2b).
2.3. Time series analysis
To obtain a basic framework for the interpretation of the surveyedsequence a Blackman–Tukey (BT) spectral analysis on the SRSLχ andSRSLχfd series in the depth domain was applied. The Blackman–Tukeypower spectra were obtained using the Analyseries 2.0 software pack-age (Paillard et al., 1996). Data sets were equally spaced and lineartrends removed. Gaussian band-pass filters were employed to extractthe main frequencies using the Analyseries 2.0 program (Paillard et al.,1996) with a ±10% bandwidth. Additionally, power spectra in depthand time domain were obtained by using CLEAN transformations
Fig. 2. a. Correlation of magnetic susceptibility (χ) of the Titel loess plateau and Stari Sl(Lisiecki and Raymo, 2005) and other loess sites in the Danube loess area: Paks, HungarRomania (Panaiotu et al., 2001), Batajnica (Marković et al., 2009) and Ruma (Markovićwith Marine Isotope Stages (Lisiecki and Raymo, 2005) across the Danube loess belt.b.synthetic profile. The variations of χ (10−8 kg−1 m3) and χfd (%) were used for correlatilayer; 3. A horizon; 4. Ah horizon; 5. B horizon; 6. Bwt rubified horizon; 7. sand beds;Krotovinas). The red squares indicate the overlap between Titel loess plateau and Staret al., 2011 for details). (For interpretation of the references to color in this figure legend
(Roberts et al., 1987). Errors associated with the frequency spectra ofCLEAN were determined using a Monte Carlo approach (Heslop andDekkers, 2002). Significance level of 95% for the Monte Carlo spectraof SRSLχ and SRSLχfd depth and time series was determined employinga 10%white noise addition, the Clean Gain factor of 0.1, 500 CLEAN iter-ations, the dt value of 0.05 and the value of 1 for depth and time resolu-tion. Depth and time series analyses involved a total number of 1000simulation iterations. Prior to the analysismagnetic susceptibility spikesrelated to tephra layers were removed from the dataset.
Wavelet analysis was used to compute evolutionary spectra in thedepth domain using the Wavelet Script of Torrence and Compo(1998). Wavelet coherence was used for examining relationships intime frequency space between two time series, the newly tuned timescale of Serbian loess and the eccentricity, tilt and precession (ETP)curve (Grinsted et al., 2004).
2.4. Target curve selection and orbital tuning of Serbian loess
In order to establish phase relationships between the χ and χfd re-cords of the investigated loess paleosol sequences and orbital parame-ters for the purpose of orbital tuning, we first compare it with otherpaleoclimate indices from different sites and with independentlydated last glacial–interglacial loess sequences in Serbia.
Luminescence dates for the last glacial loess sites in Serbia provide apossible age control. However, the results of the dating allow only abroad estimate of the time of deposition and formation of loess–paleosol sequences. Accordingly, based on luminescence ages for loessunit V-L1 at the sites Stari Slankamen (Schmidt et al., 2010), Surduk(Antoine et al., 2009), Crvenka (Stevens et al., 2011), Titel and Mošorin(Bokhorst et al., 2011; Bokhorst and Vandenberghe, 2009) could be cor-related toMarine Isotope Stages (MIS) 2–4. Nevertheless, luminescencetechniques have in most cases a high standard deviation, in older sedi-ments up to +/−10%. Due to the limitations of this technique,Stevens et al. (2011) constructed an age model for the last glacialloess of the Crvenka section using, in addition to optically stimulated lu-minescence dating (OSL), direct correlations of major stratigraphicboundaries withMarine Isotope Stage (MIS) transitions. The results ob-tained for this new age model revealed that the magnetic susceptibilityand grain size variations, recorded in Serbian loess, generally match themarine δ18O proxy curve for the global ice volume (Imbrie et al., 1984),especially in the younger part of the sequence, the Pleistocene–Holo-cene transition. In addition, Stevens et al. (2011) could show that thetiming of magnetic susceptibility and grain size variations at Crvenkaand changes in the amount of temperate arboreal pollen at TenaghiPhilippon (Tzedakis et al., 2006) and at Ioannina (Tzedakis et al.,2004), in northern Greece were very similar (Fig. 3).
Similar phase relationships between χ variations and arboreal pollen(AP) and pollen taxa composition, respectively (Tzedakis et al., 2006)have also been observed by Marković et al. (2009) for Middle Pleisto-cene glacial interglacial cycles at other Serbian loess profiles.
For the purpose of tuning long pollen records, Magri and Tzedakis(2000), Tzedakis (2005) Tzedakis et al. (2006) used direct relations be-tween vegetation phases and orbital configurations. These authors identi-fied two types of vegetation changes linked to precessional variations. Onthe one hand, they found that the crash of tree populations correspondingto dry and cold episodes coincidences with times of perihelion passage inMarch and on the other hand the expansion of Mediterranean vegetationcorresponds tomaximum summer temperature and evaporation regimes
ankamen sequences (Marković et al., 2011) with the marine oxygen isotope recordy (Sartori et al., 1999), Koriten, Bulgaria (Jordanova and Petersen, 1999), Mostiştea,et al., 2006). The gray shading denotes the inter-profile correlation of the χ patternStari Slankamen and Titel loess plateau sequences are used for the construction ofon between the profiles and for stacking. (Legend: 1. loess; 2. embryonic pedogenic8. possible tephra layers; 9. hydromorphic features; 10. carbonate concretions; 11.i Slankamen sequences. The * symbols designate sampling in 2005 (see Marković, the reader is referred to the web version of this article.)

Fig. 3.MIS + OSL age model for Crvenka (modified after Stevens et al., 2011) and correlation to AP (%) from Tenaghi Phillipon (Tzedakis et al., 2006) and orbital configurations (Laskaret al., 2004). The dashed line indicates interstadial soil V-L1S1S1.
94 B. Basarin et al. / Global and Planetary Change 122 (2014) 89–106
following times of perihelion passage in June (Magri and Tzedakis, 2000;Tzedakis, 2005; Tzedakis et al., 2006). Hence, Tzedakis et al. (2006) usedthis recurrent pattern to construct tie points for the orbital tuning of theTenaghi Phillipon record.
Taking into account the observationsmade byMarković et al. (2009,2011) and Stevens et al. (2011), the age model for the Serbian site isconstructed as follows: magnetic susceptibility variations were tunedusing the precession index as target curve,minima of SRSLχ and SRSLχfdwere tied to the time points of perihelion passage inMarch – stable coldphase (Kukla and Gavin, 2004) and peaks in SRSLχ and SRSLχfd weretied to time points of perihelion passage in June – warming phase(Kukla and Gavin, 2004) (Fig. 4a and b). March perihelion (MP) andJune perihelion (JP) tie points can be easily picked as precession indexpasses through zero at vernal equinox (ϖ = 0) and at June perihelionthe precession index obtains has maximum values (ϖ = 90°). Orbitalparameters were computed using Analyseries 2.0 (Paillard et al.,1996) with the La2004 solution (Laskar et al., 2004).
In addition to these climostratigraphic phase relationships, the gen-eral correlation of the individual stratigraphic units to Marine IsotopeStages (MIS) that relies on the recently developed chronostratgoraphicmodel for the Stari Slankamen and Titel loess sequencewas used for thetuning (Liu et al., 2013; Marković et al., 2011, 2012a).
3. Results
3.1. The synthetic rock magnetic record of Title and Stari Slankamen
Loess and the interbedded paleosol units display different magneticproperties. Recent studies of loess–paleosol sequences in Vojvodinaindicate thatmagnetic susceptibility enhancement in paleosols is the re-sult of intensive pedogenesis (Marković et al., 2011; Buggle et al., 2014).The paleosols display up to 5 to 10 times higher values of magneticsusceptibility than the parent loesses. This can be also confirmed forthe SRSLχ record (see Fig. 2 and b). Interglacial pedocomplexes (fromV-S1 to basal pedocomplex) exhibit higher χ values (from ~30 to~123 ∙ 10−8 kg−1 m3) than in weakly developed interstadial soils(from ~23 to ~35 ∙ 10−8 kg−1 m3) and parent loess layers (from ~12to ~20 ∙ 10−8 kg−1 m3). Abrupt increases of χ values at ~17.5 m, ~36and ~43.6 m detect fundamental changes in magnetic properties ofthe parent materials, loess, reflecting the presence of tephra layers.Themost prominent one is the χ peak related to tephra layer in the pen-ultimate loess V-L2 and in the base of loess horizon V-L4 (Fig. 2b). Thelatter corresponds to the Bag tephra, which has been widely identified
in Hungarian loess sequences (e.g. Pouchlet et al., 1999; Horvath,2001; Baradák, 2009). Another possible tephra layer is observed at thetop of paleosol V-S5. In the loess layer V-L9 the χ signal displays strongvariations, which are most likely caused by strong bioturbations pro-duced byhigh rooting intensity. Fossil root channelswith humic infiltra-tions still can be identified in the field.
Variations of χfd are shown in Fig. 2b. According to the studies doneon Chinese loess sequences χfd was associated with higher concentra-tions of superparamagnetic grains resulting frompedogenesis. In gener-al, changes in χfd reflect degree of pedogenesis. The difference betweenχfd recorded in loess and pedocomplexes is approximately 5 to 12 times.The highest value is recorded in paleosol V-S1, similar to χ values, aswell as in the upper part of V-S5 that correlates to MIS 13. Comparingthe results of χ and χfd it can be seen that they stand in generally goodcorrelation, except for the lower part of the SRSL from V-S5 to thebasal pedocomplex. The changes in χfd in older loess units are muchhigher than in younger loess, indicating higher degree of pedogenicalternation. Strong variations of χfd in loess V-L9 are analogous to theones observed in χ data, further implying the effects of bioturbations.
3.2. Frequency spectra in the Serbian rock magnetic record
Average sedimentation rates (SR) (6.62 cm/kyr) from loess–paleosol sequence were calculated in the depth domain by dividingthe number of cycles/kyr of one selected orbital parameter by its corre-sponding frequency in cycles/m (Fig. 5a, b, c, d). The filtering of thetuned record was conducted by using Gaussian band-pass filters. Afterremoval of the tephra-related spikes, the Blackman–Tukey spectralanalysis of the SRSLχ and SRSLχfd series in the depth domain revealshigh power at a period of 0.1217 meters−1 (m−1) (Fig. 5a, b). Addition-ally, results of the CLEAN-algorithm in depth domain show high powerat periods 0.1622, 0.328, 0.515 and 0.6407 m−1 (Fig. 5c, d). The extrac-tion of the 0.1217 m−1 frequency in the SRSLχ record provides a basiccyclochronological foundation for the studied interval (Fig. 6). Analyz-ing the filtered series of the 0.1217 m−1 frequency in the depth profile,a total of eight 8.2m periods can be counted. These cycles correspond toapproximately 130 kyr periods based on the average sedimentationrate, and therefore the loess–paleosol sequence spans more than1 Myr. In Fig. 6 it can be seen that during the last glacial interglacialcycle two ~8 m cycles exist. Similar situation could be seen for theolder loess and paleosol units V-L7-V-S7 and V-L8-V-S8, where onlyone ~8 m cycle is visible. These discrepancies are due to the differentsedimentation rates between loess layers and paleosols. Loess has higher

Fig. 4. a. Tuning of SRSLχ. Left: tuned time series of SRSLχ. Right: SRSLχ variations on the depth scale. Dashed lines represent correlations used as tuning tie points. b. Tuning of SRSLχfd. Left:tuned time series of SRSLχfd. Right: SRSLχfd variations on the depth scale. Dashed lines represent correlations used as tuning tie points.
95B. Basarin et al. / Global and Planetary Change 122 (2014) 89–106

Fig. 5. Blackman–Tukey power spectra of a) SRSLχ and c) SRSLχfd calculated in the depthdomain by the Analyseries program (Paillard et al., 1996) using 80% confidence interval.Bandwidth (BW) and confidence limits are based on a Bartlett window with a numberof lags that represents 30% of the length of the data series; results of the CLEAN-algorithm in depth domain for b) SRSLχ and d) SRSLχfd; results of the CLEAN-algorithmin time domain for e) SRSLχ and f) SRSLχfd; the red line indicates the confidence intervalof 95%. (For interpretation of the references to color in this figure legend, the reader is re-ferred to the web version of this article.)
96 B. Basarin et al. / Global and Planetary Change 122 (2014) 89–106
sedimentation rates than paleosols (e.g. Lu et al., 1999; An et al., 1991;Ding et al., 1994). The rates are twice as high in loess than in the underly-ing paleosols. The last glacial loess at the investigated sequence isassumed to have the highest accumulation rate in the region (Markovićet al., 2012a,b). Reduced sedimentation rates for older loess horizonsenhance their affinity to pedogenic alternationswith increasing tempera-ture and precipitation. Similar characteristics can be seen in other
Fig. 6. The extracted ~8 m periodic component against the SRSLχ record.
sequences in the region (Buggle et al., 2013; Jordanova and Petersen,1999). The cycles presented in Fig. 6 indicate broad chronostratigraphicframework.
The wavelet analysis of the SRSLχ record reveals spectral powergreater than the 95% confidence limit confined to a distinct frequencyinterval with a component of ~8 m. However, an additional componentof ~4 m is also revealed (Fig. 7a). Furthermore, the ~2 m componentwith centers of maximal power at 55 m, 45 m and 35 m depth fromthe top of the sequence is clearly visible. The appearance of theseshorter periods reveals the interval of reduced sedimentation rates.
Similarly, wavelet analysis of the SRSLχfd record (Fig. 7b) shows thatspectral power greater than 95% confidence limit is restricted to the fre-quency range between 7 and 11 m centered at ~8 m. Frequencies in therange of 3.7 to 4 m could be clearly identified, between 20 and 40 mdepth from the top of the sequence. The ~2 m component has higherpower in the lower part of the sequence evidently indicating reduced sed-imentation rates.
3.3. The new orbital tuning chronology of Serbian loess
The orbital tuning of the SRSLχ and SRSLχfd records is based on JP andMP timings as single tuning targets, following the observed synchronicitybetween Serbian rock magnetic records (Stevens et al., 2011) and majorenvironmental changes in the long terrestrial pollen records fromGreece (Magri and Tzedakis, 2000; Tzedakis et al., 2004, 2006) (Fig. 4a,b). The “minimal tuning” approach (Muller and MacDonald, 2000), inwhich only one orbital frequency is used for the tuning was applied asprevious studies have shown that even tuning noise to an orbital targetresults in a spectrum showing clear orbital frequencies (Neeman, 1993;Huybers and Wunsch, 2004; Huybers and Aharonson, 2010; Blaauw,2012). Therefore, only the precession frequencies of the record were ma-nipulated. This means that the tuned record's obliquity and 100-ka signalcomponents could be interpreted without the complication of circularreasoning (Prokopenko et al., 2006; Muller and MacDonald, 2000).
Table 1 shows the ages obtained for the boundaries of the majorpaleosol units in Serbian loess when applying this tuning procedure. Acomparisonwith previous agemodels for Serbian loess aswell as differ-ent time scales for the Chinese loess–paleosol succession is given aswell. The M2012 time scale previously presented by Marković et al.(2012a) was developed on the same synthetic profile. This is of greatimportance as it gives an opportunity to test the time model presentedin this study. Marković et al. (2012a) followed the approach of Heslopet al. (2000), and only used the χ record as tuning target. The M2012age model represents the first orbitally tuned timescale for Serbian loess.
A detailed comparison of the Lingtai and Zhaojiachuan time scaleS2006 (Sun et al., 2006), the first astronomical time scale of Serbianloess M2012 (Marković et al., 2012a), the newly proposed time scale,the arboreal pollen record of Tenaghi Phillipon (Tzedakis et al., 2006)and the marine oxygen isotope record LR04 (Lisiecki and Raymo, 2005)is given in Fig. 8. The time scale presented here show clear similaritiesto S2006 age model. Based upon visual comparison of the χ and χfd re-cords and the oxygen isotope curve (Lisiecki and Raymo, 2005), it canbe seen that in the M2012 age model V-S1 was compressed to someextent relative to new age model, S2006 and LR04. This is mainly dueto a relative overestimation of the L1/S1 transition age. Further pro-nounced differences between the time scales, are related to the paleosolrepresentingMIS 9.While in the newagemodel the base of V-S3 includesa small susceptibility peak this feature is indistinguishable in the M2012due to the tuning procedure. Further, in the M2012 model, the top ofthe V-S5 and the onset of the V-L4 loess formation are dated to 479 kyr,and therefore related to the central part of MIS 13. The base of V-S5, ac-cording to M2012, is assigned to 640 kyr. In contrast, the new time scalerepresents a more reasonable improvement as the top of V-S5 coinci-dences with the MIS 13/MIS 12 boundary and the base of V-S5 has anage similar to most Chinese chronologies (e.g. Ding et al., 2002; Sunet al., 2006). In addition, the new age model provides an age for the

Fig. 7.Wavelet analysis of a) SRSLχ variations in depth domain and b) SRSLχfd variations in depth domain. c) The global wavelet power spectrum as the average over all the local waveletspectra. Globalwavelet spectrum is seenas appropriate to provide a usefulmeasure of the background spectrum, againstwhich peaks in the localwavelet spectra could be tested (Torrenceand Compo, 1998).
97B. Basarin et al. / Global and Planetary Change 122 (2014) 89–106
base of V-S8 of 866 kyr, which is well in agreementwith the chronologies(865 kyr) presented byHeslop et al. (2000) andDing et al. (2002) for Chi-nese loess sections, whereas the M2012 relatively overestimates the ageof the V-S8/V-L9 transition (882 kyr). Moreover, the base of the basalpedocomplex extends to 1014 kyr according to M2012, thus producingan age difference of 20 kyr between newmodel andM2012. These differ-ences demonstrate the sensitivity of orbital tuned time scales for differenttuning procedures and the selection of target curves. Hence, the new agemodel proposed here represents a significant improvement, especially forthe last 800 kyr, providing a more accurate match of the timing of loessand soil formation in Serbia to the Marine Isotope Stages and the timescale of loess–paleosol evolution in China.
The BAG tephra identified in unit V-L4 represents an independentage control for the time scale of Serbian loess. Geochemical analysis ofthis layer fromHungary indicates that its probable origin is the volcanicarea of central Italy (Pouclet et al., 1999). Pouclet et al. (1999) specifical-ly suggested the Villa Senni eruption in the Alban Mountains as poten-tial source of the BAG tephra. 40Ar/39Ar dates suggest that the maineruptive phase took place at 355 ± 2 kyr (Giordano et al., 2006), or at365 ± 4 (Karner et al., 2001). Another possible date is 366 ± 7 kyr assuggested by Marra et al. (2009). The calculated age for the tephralayer in the SRSLχ record, signalized by an abrupt increase in the χvalues, is 360 kyr, underlining the accuracy of the newly proposed agemodel for Serbian loess deposits.

Table 1MIS boundaries and ages of major paleosol units according to different time models for Serbian and Chinese loess sites.
Paleosol units (Serbia) Marković et al.(2012a)
Thisstudy
Paleosol units(China)
Lu et al.(1999)
Heslop et al.(2000)
Ding et al.(2002)
Sun et al.(2006)
MIS boundariesLisiecki andRaymo (2005)
Age (kyr) Age (kyr) Age (kyr) Age (kyr) Age (kyr) Age (kyr) MIS Age (kyr)
Top V-S1 80 73 Top S1 71 79 73 69 4/5 71Base V-S1 133 132 Base S1 129 129 128 138 5/6 130Top V-S2 185 188 Top S2 188 196 190 182 6/7 191Base V-S2 249 250 Base S2 254 250 245 263 7/8 243Top V-S3 278 284 Top S3 279 290 307 273 8/9 300BaseV-S3 342 340 Base S3 334 342 336 347 9/10 337Top V-S4 362 376 Top S4 385 386 360 382 10/11 374Base V-S4 421 426 Base S4 428 417 412 438 11/12 424Top V-S5 479 463 Top S5 471 503 479 470 12/13 478Base V-S5 640 624 Base S5 576 625 621 630 15/16 621Top V-S6 686 665 Top S6 658 693 684 697 16/17 676Base V-S6 721 720 Base S6 670 713 710 718 17/18 712Top V-S7 746 758 Top S7 706 765 760 721 18/19 761Base V-S7 794 794 Base S7 748 778 787 754 19/20 790Top V-S8 809 802 Top S8 760 807 819 813 20/21 814Base V-S8 882 866 Base S8 788 865 865 875 21/22 866Top V-S9 949 928 Top S9 853 952 943 936 24/25 936Base V-S9 973 968 Base S9 883 984 989 967 25/26 959Top of the basal pedocomplex 1014 994 Top S10 895 1112 1018 1005 26/27 970
98 B. Basarin et al. / Global and Planetary Change 122 (2014) 89–106
4. Disscusion
The composite Titel and Stari Slankamen sequence provides an op-portunity to extend correlations of European terrestrial and marinepaleoclimate records over the 1 Myr. The sequence comprises the‘100-kyr world’ (b640 kyr) and represents an archive for the MiddlePleistocene Transition (640–920 kyr) in Europe. It even extends intothe final part of the ‘41-kyr world’ of obliquity-dominated cycles(Mudelsee and Schulz, 1997). Hence, the investigated sequence can beseen as a terrestrial key archive in this part of Europe, as it gives the
Fig. 8. Comparison of the tuned SRSLχ record to variations in a) δ18O (Lisiecki and Raymo, 2005);(Tzedakis et al., 2006); d) shaded sequence represents the first time scale of Serbian loess–palescale.
opportunity to study the climate evolution in the Eurasian continentfrom the early Middle Pleistocene to modern times.
4.1. Orbital forcing of paleoclimate in Pannonian basin
4.1.1. Precession and obliquity — the key to deglaciationAs the new age model developed in this study is based only on the
precession index as target curve for tuning, the influence of orbital pa-rameters eccentricity and obliquity can be evaluated independently.The response of the long term proxy records to changes in astronomical
b) Lingtai and Zhaojiachuan time scale (Sun et al., 2006); c) AP (%) fromTenaghi Philipponosol sequence M2012 (Marković et al., 2012a) and the bold line is newly developed time

Fig. 9.The astronomically tuned SRSLχ and SRSLχfd records (black and red line respectively); sedimentation rates (SR) according to thenewSRSL time scale; the previousM2012 time scalefor the SRSL record (Marković et al., 2012a) (shaded); themarine LR04 δ18O record (Lisiecki and Raymo, 2005), orbital parameter variations (bold black line represent eccentricity, red lineobliquity and thin black line precession) and June insolation for 45°N (computed using Analyseries 2.0, Paillard et al., 1996). The investigated period is divided into 450-kyr incrementsfrom a) 0 to 450 kyr and from b) 450 to 1100 kyr. (For interpretation of the references to color in this figure legend, the reader is referred to the web version of this article.)
99B. Basarin et al. / Global and Planetary Change 122 (2014) 89–106
100 B. Basarin et al. / Global and Planetary Change 122 (2014) 89–106
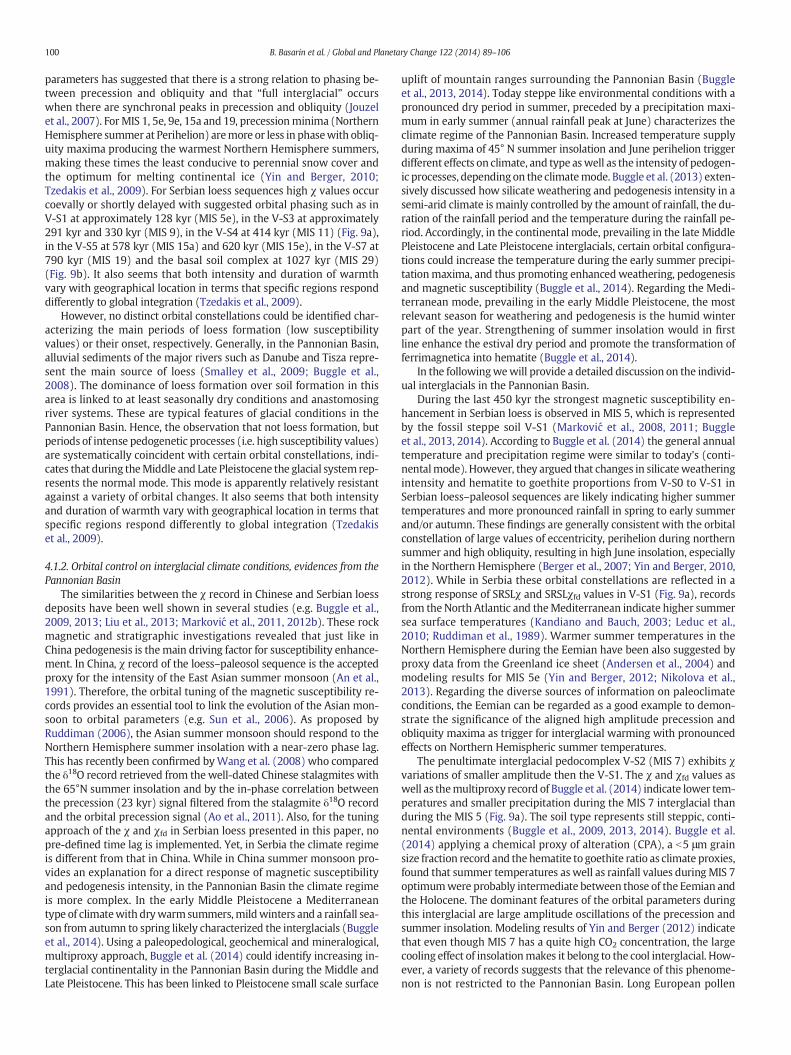
parameters has suggested that there is a strong relation to phasing be-tween precession and obliquity and that “full interglacial” occurswhen there are synchronal peaks in precession and obliquity (Jouzelet al., 2007). ForMIS 1, 5e, 9e, 15a and 19, precessionminima (NorthernHemisphere summer at Perihelion) aremore or less in phasewith obliq-uity maxima producing the warmest Northern Hemisphere summers,making these times the least conducive to perennial snow cover andthe optimum for melting continental ice (Yin and Berger, 2010;Tzedakis et al., 2009). For Serbian loess sequences high χ values occurcoevally or shortly delayed with suggested orbital phasing such as inV-S1 at approximately 128 kyr (MIS 5e), in the V-S3 at approximately291 kyr and 330 kyr (MIS 9), in the V-S4 at 414 kyr (MIS 11) (Fig. 9a),in the V-S5 at 578 kyr (MIS 15a) and 620 kyr (MIS 15e), in the V-S7 at790 kyr (MIS 19) and the basal soil complex at 1027 kyr (MIS 29)(Fig. 9b). It also seems that both intensity and duration of warmthvary with geographical location in terms that specific regions responddifferently to global integration (Tzedakis et al., 2009).
However, no distinct orbital constellations could be identified char-acterizing the main periods of loess formation (low susceptibilityvalues) or their onset, respectively. Generally, in the Pannonian Basin,alluvial sediments of the major rivers such as Danube and Tisza repre-sent the main source of loess (Smalley et al., 2009; Buggle et al.,2008). The dominance of loess formation over soil formation in thisarea is linked to at least seasonally dry conditions and anastomosingriver systems. These are typical features of glacial conditions in thePannonian Basin. Hence, the observation that not loess formation, butperiods of intense pedogenetic processes (i.e. high susceptibility values)are systematically coincident with certain orbital constellations, indi-cates that during theMiddle and Late Pleistocene the glacial system rep-resents the normal mode. This mode is apparently relatively resistantagainst a variety of orbital changes. It also seems that both intensityand duration of warmth vary with geographical location in terms thatspecific regions respond differently to global integration (Tzedakiset al., 2009).
4.1.2. Orbital control on interglacial climate conditions, evidences from thePannonian Basin
The similarities between the χ record in Chinese and Serbian loessdeposits have been well shown in several studies (e.g. Buggle et al.,2009, 2013; Liu et al., 2013; Marković et al., 2011, 2012b). These rockmagnetic and stratigraphic investigations revealed that just like inChina pedogenesis is themain driving factor for susceptibility enhance-ment. In China, χ record of the loess–paleosol sequence is the acceptedproxy for the intensity of the East Asian summer monsoon (An et al.,1991). Therefore, the orbital tuning of the magnetic susceptibility re-cords provides an essential tool to link the evolution of the Asian mon-soon to orbital parameters (e.g. Sun et al., 2006). As proposed byRuddiman (2006), the Asian summer monsoon should respond to theNorthern Hemisphere summer insolation with a near-zero phase lag.This has recently been confirmed byWang et al. (2008) who comparedthe δ18O record retrieved from the well-dated Chinese stalagmites withthe 65°N summer insolation and by the in-phase correlation betweenthe precession (23 kyr) signal filtered from the stalagmite δ18O recordand the orbital precession signal (Ao et al., 2011). Also, for the tuningapproach of the χ and χfd in Serbian loess presented in this paper, nopre-defined time lag is implemented. Yet, in Serbia the climate regimeis different from that in China. While in China summer monsoon pro-vides an explanation for a direct response of magnetic susceptibilityand pedogenesis intensity, in the Pannonian Basin the climate regimeis more complex. In the early Middle Pleistocene a Mediterraneantype of climatewith drywarm summers,mildwinters and a rainfall sea-son from autumn to spring likely characterized the interglacials (Buggleet al., 2014). Using a paleopedological, geochemical and mineralogical,multiproxy approach, Buggle et al. (2014) could identify increasing in-terglacial continentality in the Pannonian Basin during the Middle andLate Pleistocene. This has been linked to Pleistocene small scale surface
uplift of mountain ranges surrounding the Pannonian Basin (Buggleet al., 2013, 2014). Today steppe like environmental conditions with apronounced dry period in summer, preceded by a precipitation maxi-mum in early summer (annual rainfall peak at June) characterizes theclimate regime of the Pannonian Basin. Increased temperature supplyduring maxima of 45° N summer insolation and June perihelion triggerdifferent effects on climate, and type aswell as the intensity of pedogen-ic processes, depending on the climatemode. Buggle et al. (2013) exten-sively discussed how silicate weathering and pedogenesis intensity in asemi-arid climate is mainly controlled by the amount of rainfall, the du-ration of the rainfall period and the temperature during the rainfall pe-riod. Accordingly, in the continental mode, prevailing in the late MiddlePleistocene and Late Pleistocene interglacials, certain orbital configura-tions could increase the temperature during the early summer precipi-tationmaxima, and thus promoting enhancedweathering, pedogenesisand magnetic susceptibility (Buggle et al., 2014). Regarding the Medi-terranean mode, prevailing in the early Middle Pleistocene, the mostrelevant season for weathering and pedogenesis is the humid winterpart of the year. Strengthening of summer insolation would in firstline enhance the estival dry period and promote the transformation offerrimagnetica into hematite (Buggle et al., 2014).
In the followingwewill provide a detailed discussion on the individ-ual interglacials in the Pannonian Basin.
During the last 450 kyr the strongest magnetic susceptibility en-hancement in Serbian loess is observed in MIS 5, which is representedby the fossil steppe soil V-S1 (Marković et al., 2008, 2011; Buggleet al., 2013, 2014). According to Buggle et al. (2014) the general annualtemperature and precipitation regime were similar to today's (conti-nentalmode). However, they argued that changes in silicateweatheringintensity and hematite to goethite proportions from V-S0 to V-S1 inSerbian loess–paleosol sequences are likely indicating higher summertemperatures and more pronounced rainfall in spring to early summerand/or autumn. These findings are generally consistent with the orbitalconstellation of large values of eccentricity, perihelion during northernsummer and high obliquity, resulting in high June insolation, especiallyin the Northern Hemisphere (Berger et al., 2007; Yin and Berger, 2010,2012). While in Serbia these orbital constellations are reflected in astrong response of SRSLχ and SRSLχfd values in V-S1 (Fig. 9a), recordsfrom the North Atlantic and theMediterranean indicate higher summersea surface temperatures (Kandiano and Bauch, 2003; Leduc et al.,2010; Ruddiman et al., 1989). Warmer summer temperatures in theNorthern Hemisphere during the Eemian have been also suggested byproxy data from the Greenland ice sheet (Andersen et al., 2004) andmodeling results for MIS 5e (Yin and Berger, 2012; Nikolova et al.,2013). Regarding the diverse sources of information on paleoclimateconditions, the Eemian can be regarded as a good example to demon-strate the significance of the aligned high amplitude precession andobliquity maxima as trigger for interglacial warming with pronouncedeffects on Northern Hemispheric summer temperatures.
The penultimate interglacial pedocomplex V-S2 (MIS 7) exhibits χvariations of smaller amplitude then the V-S1. The χ and χfd values aswell as themultiproxy record of Buggle et al. (2014) indicate lower tem-peratures and smaller precipitation during the MIS 7 interglacial thanduring the MIS 5 (Fig. 9a). The soil type represents still steppic, conti-nental environments (Buggle et al., 2009, 2013, 2014). Buggle et al.(2014) applying a chemical proxy of alteration (CPA), a b5 μm grainsize fraction record and the hematite to goethite ratio as climate proxies,found that summer temperatures as well as rainfall values during MIS 7optimumwere probably intermediate between those of the Eemian andthe Holocene. The dominant features of the orbital parameters duringthis interglacial are large amplitude oscillations of the precession andsummer insolation. Modeling results of Yin and Berger (2012) indicatethat even though MIS 7 has a quite high CO2 concentration, the largecooling effect of insolationmakes it belong to the cool interglacial. How-ever, a variety of records suggests that the relevance of this phenome-non is not restricted to the Pannonian Basin. Long European pollen

101B. Basarin et al. / Global and Planetary Change 122 (2014) 89–106
records from the Massif Central (France) and Ioannina (Greece) alsogive evidence of relatively cool conditions during MIS 7, as none of thethree individual MIS 7 warm phases exhibits a vegetation successionsequivalent to full interglacial conditions (Reille et al., 2000; Roucouxet al., 2008). Also, on a hemispheric and even global scale, theMIS 7 ap-pears as a relatively cool interglacial, the coolest interglacial over thelast 430 kyr as for example suggested by temperature proxy recordsfrom the Antarctic ice sheet (Jouzel et al., 2007). Marine recordsindicate sea surface temperatures lower than during the Eemianand even lower than during the Holocene in the North Atlantic(Ruddiman et al., 1989). During the last 430 kyr atmospheric CO2
levels were lowest and the insolation contribution was reducedmaking the MIS 7 the coolest pre Mid-Bruhnes Event interglacial(Yin and Berger, 2010, 2012). Also, the global sea level stands duringMIS 7 were lower than during the Holocene (Antonioli et al., 2004;Lüthi et al., 2008), while the δ18O values of benthic foraminifera(Shackleton et al., 1990) suggest a relative high residual ice volumefor this interglacial period. Hence, paleoenvironmental informationinherited in Serbian loess is well suitable to complement informa-tion from well-established long-term terrestrial and marine climatearchives, allowing a better understanding of the climate system onregional as well as global scale (Fig. 9a).
Peak insolation duringMIS 9was lower than duringMIS 7 andMIS 5(Berger et al., 2007). Accordingly, the recorded sea surface temperaturesof the North Atlantic were not as high as during younger interglacials(Kandiano and Bauch, 2003; Ruddiman et al., 1989). In addition toMIS 5 andMIS 11, MIS 9 is found to be the one of the warmest intergla-cials during the last 800 kyr due to warming contribution of both inso-lation and Green Houses Gases concentration (Yin and Berger, 2010,2012; Herold et al., 2012). In Serbia, theMIS 9 is represented by a steppeor forest-steppe environment according to the paleopedological charac-teristics of the V-S3 (Marković et al., 2009, 2011; Buggle et al., 2009,2013, 2014). The χ and χfd in the corresponding V-S3 paleosol of theSerbian loess, however, show amplitudes lower than in the V-S1, buthigher than in V-S2. Based on multiproxy evidences, Buggle et al.(2014) proposed higher summer temperatures and rainfall during MIS9 compared to the Holocene and MIS 7 (Fig. 9a). Thus, the resultsfrom the Serbia loess data are in agreement with the model results ofYin and Berger (2012) and Herold et al. (2012).
Buggle et al. (2013, 2014) could reveal a long-term quasi-lineartrend of increasing continentality and aridization for the PannonianBasin. They argue that this trend could be related to Quaternary surfaceuplift of Europeanmountain ranges, theAlps, Carpathians andDinaridesand ismodulated by orbitally driven global environmental changes. Themain tectonically induced uplift phases of these mountain ranges oc-curred in pre-Pleistocene periods (Kuhlemann, 2007). In the Alps, thequaternary uplift has been mainly related to isostatic rebound causedby glacial erosion, leading to the increase of elevation of the alpinemountain ridges, especially in theMiddle and Late Pleistocene, but con-tinuing today (Meyer et al., 2011; Sternai et al., 2012). For the Dinaridesand Carpathians isostatic rebound has yet to be studied even thoughthey were extensively glaciated during the Middle Pleistocene(Hughes et al., 2011; Buggle et al., 2014). Today's Pannonian Basin isto the east of the Dinarides, east to southeast of the Alps, and west tosouth of the Carpathians. Blocking of the westerlies by these mountainranges is essential in decreasing precipitation and increasing the conti-nental influence. Thus the changes in paleoelevation of Central andEastern Europe may have a strong impact on the climate of this region(Buggle et al., 2014). On the other hand, the evidence from CentralAsia and China suggest increased aridity in both the dust source regionsand the depositional areas since 0.85 Myr. The southward shifts of cli-mate zone boundaries at ~0.85 and ~0.25 Myr identified in Asianloess–paleosol sequences are thought to be causally related to increasesin the northern hemisphere ice volumes (Yang and Ding, 2006; Yanget al., 2006). The trend of the increased northern hemisphere ice seenin the ocean oxygen isotopic record during the past 0.9 Myr could
along with regional tectonic uplift play very important role in the in-creased aridity after the Mid-Pleistocene Transition.
In a global context, MIS 11 is the interglacial with the lowest peaksummer insolation intensity on the Northern Hemisphere during thelast 700 kyr (Berger and Loutre, 1991). However, the pattern of incom-ing solar radiation that occurred during MIS 11 matches that of theHolocene more closely than that of any other interglacial during thelast 500 kyr (Berger and Loutre, 2002; Loutre and Berger, 2003). Dueto the low eccentricity mode at this period, MIS 11 is the longest inter-glacial of the last 500 kyr and it is characterized by a relatively lowmag-nitude of insolation variations (Berger and Loutre 1996, 2002; Loutreand Berger, 2003). The eccentricity modulates the effect of the preces-sion, with low eccentricity dampening the precessional forcing(Berger and Loutre, 2002). The low eccentricity mode follows a413 kyr cycle and hence, a corresponding orbital configuration can befound at MIS 1 and MIS 19 (Berger and Loutre, 2002; Loutre andBerger, 2003; Tzedakis et al., 2009). However, sea surface temperaturesduring MIS 11 recorded in marine sequences from the North Atlanticand Nordic Seas (Kandiano and Bauch, 2007) were slightly cooler thanduring the Holocene. In contrast to that, in the Mediterranean andparts of the mid-latitude North Atlantic summer sea surface tempera-tures (SST) were relatively high. This possibly reflects the extraordinaryduration and stability of this interglacial and suggests strong latitudinaland meridional SST gradients in the North Atlantic during the MIS 11(Kandiano et al., 2012). The terrestrial evidence from Europe pollen re-cords shows that abundance of Mediterranean taxa and thermophiloustree taxa was not higher when compared to younger interglacials(Müller and Pross, 2007; Tzedakis et al., 2009). This is consistent withthe findings in the Serbian loess region, as Buggle et al. (2014) present-ed evidences for relative highwinter precipitation but summer temper-atures similar to MIS 9. Furthermore, the amplitudes of χ and χfdvariations in the V-S4 paleosol of the SRSL record are relatively small(Fig. 9a). Hence, the climate records from Serbia and other archives onthe European continent correspond to low insolation forcing duringMIS 11, which is in agreement with different modeling results (Yinand Berger, 2010, 2012; Herold et al., 2012).
Pedocomplex V-S5 is characterized as fossil Cambisol and Luvisol,respectively (Bronger, 1976; Buggle et al., 2014; Marković et al.,2011). This strongly developed pedocomplex, having relatively high χand χfd values,may represent extremely slow dust accumulation duringa prolonged interglacial from MIS 13 to MIS 15 (Fig. 9b). Terrestrial re-cords from Eastern Eurasia such as the Lake Baikal record in Siberia(Williams et al., 1997; Prokopenko et al., 2006) and records from thecentral Chinese loess plateau loess profiles (Heslop et al., 2000; Sunet al., 2006), as well as marine records from the South China Sea(Clemens et al., 2008), the western Pacific (de Garidel-Thoron et al.,2005), and theMediterranean Sea (Rossignol-Strick et al., 1998) all cor-roborate very prolongedwarm and/or humid conditions in the cold gla-cial stage MIS 14. Hence, the “abnormal” warm and humid MIS 14, inconjunction with its adjacent interglacial isotope stages MIS 13 andMIS 15 forms a “super-interglacial” stage. During MIS 13 and 15 inSerbia, it is likely that Mediterranean conditions with warm and drysummers and mild, but humid winters prevailed (Marković et al.,2011; Buggle et al., 2014). Climate proxy records from the Chineseloess region also suggest higher temperatures and more rainfall duringMIS 13 and 15 when compared to younger interglacials. This indicatesstrengthenedNorthern Hemispheric summermonsoon even though in-solation maxima are lower than during the last interglacial (Guo et al.,1998; Yin and Guo, 2008). The Earth's precession and obliquity varia-tions during MIS 13–15 do not show unusual feature compared toother periods of the past 800 kyr, thus warm and humid conditionsin MIS 13–15, well expressed in terrestrial sequences from mid-latitudinal Eurasia, must be attributed to the factors other than orbitalforcing (see Buggle et al., 2014, for a discussion).
In the Serbian loess, MIS 17 is represented by a fossil Cambisol, V-S6.The amplitude of χ and χfd variations in this unit is small, similar to V-S4,

102 B. Basarin et al. / Global and Planetary Change 122 (2014) 89–106
and the climate reconstruction of Buggle et al. (2014) suggests relatively“cool” interglacial climate in the Pannonian Basin, although the insola-tion values are relatively high (Fig. 9b). However, this feature is typicalalso for other terrestrial records such as Chinese loess sites, which showonly aweak response of χ and χfd variations to orbital parameters. In ad-dition, terrestrial records from Southern Europe (Tzedakis et al., 2009)show that the abundance of the temperate tree pollen is lower than dur-ing the younger interglacials. Moreover, the atmospheric CO2 concen-trations are relatively low suggesting that climate conditions wererelatively cool at least on hemispheric scale (Lüthi et al., 2008). Theproxy data are corroborated bymodeling experiments, showing relativelow annual temperatures in the northern hemisphere during MIS 17(Yin and Berger, 2010, 2012).
The older part of the investigated SRSL sequence has a lower tempo-ral resolution and smaller average sedimentation rates. This is particu-larly true for the pedocomplexes V-S7 and V-S8 representing MIS 19and 21. A very thin loess layer separates the fossil soils probably indicat-ing reduced sedimentation (Fig. 9b). MIS 19 is characterized by loweccentricity peak similar toMIS 1 andMIS 11, and is often seen as an an-alogue for Holocene (Berger and Loutre, 1996; Tzedakis et al., 2009; Yinand Berger, 2012; Herold et al., 2012; Candy et al., 2014). The insolationcharacteristics of these interglacials are remarkably similar. However,the V-S7 exhibits higher χ and χfd amplitudes than the V-S4. The climatesimulations propose that, MIS-19 represents the warmest interglacialbetween 450 kyr and 800 kyr but compared toMIS 11 it has lower glob-al annualmean temperature (Yin and Berger, 2010, 2012)mainly due toits lower CO2 concentration. More detailed multiproxy studies are nec-essary to resolve the climatic differences betweenMIS 19 andMIS 11 inSerbia and to understand the involved changes of rock magneticparameters.
The oldest pedocomplexes V-S9 and the basal pedocomplex repre-sent equivalents of MIS 25 and 27. The pedocomplex V-S9 is seen asweakly developed cambisol with hydromorphic features. Due to thesecharacteristics it is hard to distinguish the local climate influence fromorbitally induced ones (Fig. 9b). Additionally, the underground watertable during the time of the formation of the sequence could greatly im-pact the amplitude of the rock magnetic record of these oldest units.
4.2. Spectral analysis and comparison to other paleoclimate records
Fig. 5 shows the power spectra of the χ and χfd variations in the SRSLrecord as a function of depth (Fig. 5a to d) and as a function of time(Fig. 5e, f). In the χ spectrum peaks are identified at about 245 kyr,139 kyr, 94 kyr, 65 kyr, 43 kyr, 23 kyr. For the χfd the spectral contentis concentrated around 245 kyr, 100 kyr, 77 kyr and 59 kyr, while small-er cycles are below the significance level. The frequencies for the χ spec-trum are close to those of the orbital variations (e.g. ETP spectrum). Thelargest 245 kyr cycle reflects the low χ amplitudes recorded in paleosolsV-S2, V-S4, V-S6 and V-S9. This cycle could be due to the local or region-al climate conditions during the formation of these pedocomplexes. But,as discussed in the previous chapter, a weakened interglacial signal inMIS 7 is consistent with other terrestrial and marine climate recordsand although theweak signal ofMIS 11 and 17 is atypical for marine re-cords, it is generally consistent with other records from the terrestrialrealm Eurasia. This feature could be due to the regional and seasonalcharacteristics of interglacial periods. Seasonal differences in tempera-ture and precipitation during integlacials could lead to the enhancedsoil formation. During June–July–August considerably greater continen-tal warming occurs inMIS 5 and 9 compared toMIS 1, 11 and 19 in highand mid-latitudes. Also loss of sea-ice during this season is more thantwice as large in MIS 9 as in MIS 1, 11 and 19 and more than 50% largerthan MIS 5 (Herold et al., 2012). These differences together with someregional influences could be responsible for 245 kyr cycle.
Low amplitude of the obliquity cycle in the SRSLχ record and com-plete absence of obliquity and precession frequencies in the χfd varia-tions could be due to non-linearity of the time scale. The ways in
which orbital–insolation signal becomes subject to distortion as it spreadsthrough the climate system and into various depositional systems havebeen vastly investigated (Meyers et al., 2008; Schwarzacher, 1993;Weedon, 2003). The implementation of the orbital–insolation signalinto proxy is characterized by a certain transfer function that could mod-ify the original insolation signal. Some of these functions include 1) theprincipal response of the climate system to Milankovitch-forced insola-tion variability, 2) the reliability of the primary proxy (directly influ-enced) response to climate change, 3) the response of the depositionalenvironment to climate, which can distort the relationship betweendepth, 4) the fidelity of the secondary proxy (they record a depositionalsystem's response), 5) diagenetic alteration of the proxy signal,whichdis-torts the relationship between depth and time (compaction) and corruptsthe proxy, 6) sampling of a paleoclimate record, and 7) the analyticalerror associatedwith proxymeasurement (Meyers et al., 2008). The equi-distant sampling rate used in this study for loess with higher sedimenta-tion rates and for paleosol with smaller sedimentation rates as well asdiagenetic alternation of the deposited loess could be the main reasonfor distortion of orbital–insolation signal in the new time scale.
Fig. 10 shows the continuous wavelet transforms (CWT) and wave-let coherence (WTC) between χ and χfd variations and the ETP curve.WTC finds regions in time frequency space where time series co-vary.High power has been binned into the obliquity frequency, which isquite remarkable since this frequency was not manipulated during thetuning process. High power is also observed at the eccentricity frequen-cy of 100 kyr. The results of wavelet analysis indicate that the 100 kyrcycle becomes dominant around 800 kyr in the SRSLχ time series(Fig. 10a) and between 900 kyr and 600 kyr in the SRSLχfd time series(Fig. 10b). Hence, the SRSLχ and SRSLχfd time series represent the firstrecord of the Mid-Pleistocene Transition in the Pannonian basin. TheMid-Pleistocene Transition (MPT) marks the transition from dominant41-kyr cyclicity to the 100-kyr cyclicity and is well documented in theoceanic realm (e.g. Ruddiman et al., 1989; Park and Maasch, 1993;Mudelsee and Schulz, 1997; Rutherford and D'Hondt, 2000; Clarket al., 2006), but only rarely reported in terrestrial records from theEuropean continent (e.g. Tzedakis et al., 2006). However, the waveletanalysis of the Serbian record reveals that a significant 100 kyr responseis already present in the 41 kyr dominated world preceding the Mid-Pleistocene Transition and in turn a significant 41 kyr cycle persists inthe ‘100 kyr world’. Similar to the Serbian record, dominant 100 kyr cy-cles prevailing over the last 1.2Ma have been revealed via spectral anal-ysis from Chinese loess sequences (e.g. Sun et al., 2006; Lu et al., 1999,2004; Han et al., 2012). Similar cycles have also been identified in theTenaghi Philippon AP curve, although strong responses to obliquityand precession cycles have also been detected (Tzedakis et al., 2006).Tzedakis et al. (2006) attributed this to direct influence of insolationon Mediterranean latitudes and argued that in Mediterranean climatesobliquity exerts also forcing on dry–wet oscillations independent ofthe glacial–interglacial changes. The Pleistocene fluvial sequences inthe eastern part of the Middle Danube (Carpathian, Pannonian) basinspanning the last 2.6 Ma also reveal 40 kyr and 100 kyr cycles, whichhas been interpreted as a high-latitudinal forcing (Nádor et al., 2003).The oscillations of 100 kyr cycles are a commonly reported phenome-non in Quaternary time series, especially in the records postdating theMid-Pleistocene revolution. As a kind of paradigm, for a long time, theeccentricity was regarded as the key pacemaker for major environmen-tal changes in the ‘100 kyr world’ succeeding the Mid-Pleistocene evo-lution. This hypothesis, however, was increasingly challenged in thelast years (e.g. Maslin and Ridgwell, 2005; Ruddiman, 2003). AfterMPT, larger ice sheets started to exist during most of the time. Underlower CO2 concentrations, moderate insolation maxima could slightlyreduce the ice volume, but only the largest insolationmaxima, occurringunder high eccentricity, high obliquity and Northern Hemisphere sum-mer at perihelion could lead to significant melting of the ice sheets andtherefore to interglacials. These conditions are thought to be responsiblefor making the ~100 kyr periodicity the most remarkable feature of

Fig. 10. a) The wavelet power spectrum of χ andwavelet coherence (WTC) between SRSLχ variations and ETP curve, computed using Matlab software from Grinsted et al. (2004). b) Thewavelet power spectrum of SRSLχfd and wavelet coherence (WTC) between SRSLχfd variations and ETP curve. The color represents the amplitude of the signal at a given time, spectralperiod (red equals highest power, blue lowest). WTC finds regions in time frequency space where time series co-vary, arrows indicate phase relations (right: in-phase; left:anti-phase; down: SRSLχ or SRSLχfd leading ETP by 90°; up: ETP leading SRSLχ or SRSLχfd by 90°). (For interpretation of the references to color in this figure legend, the reader is referredto the web version of this article.)
103B. Basarin et al. / Global and Planetary Change 122 (2014) 89–106
climate during the last 1 Myr (Berger et al., 1999). Ruddiman (2003)could demonstrate that the 100 kyr cycle of glacial terminations is notproduced by eccentricity but by combined obliquity and precessionforcing. Accordingly, the glacial terminations are amongst other factorsspecifically related to alignedmaxima in high amplitude precession andobliquity. Lisiecki (2010) used cross-wavelet analyses of the untunedbenthic δ18O stack and eccentricity for the past five million years inorder to characterize the link between eccentricity and 100 kyr glacialcycles. These results showed that on the one hand the phase of eccen-tricity and glacial cycles has been stable since 1.2 Myr i.e. that 100 kyrcycles in Quaternary time series are indeed paced by eccentricity. Onthe other hand the study revealed that the 100 kyr cycles were anti-correlated with eccentricity during the last five million years, probablyas a result of strong precessional forcing causing a disruption of internalfeedback of the 100 kyr cycle. Hence, from the study of Lisiecki (2010) itcan be concluded that the 100 kyr cycle of eccentricity (i.e. high ampli-tude precession) paces the development of ice sheets, which does notcontradict the joined orbital and precession forcing on deglaciation.
Orbitally tuned χ and grain size records from Chinese loesssequences indicate that the onset ofMPTwas synchronous inmarine re-cords and loess–paleosol sequences (Heslop et al., 2002), roughlyaround 900 kyr (MIS 22–24). The corresponding L9 loess in China aswell as the benthic δ18O records of the global ice volume indicates a pro-nounced but short term cooling, expansion of ice sheets and intensifica-tion of the Asian winter monsoon around 900 ka, the so called “900 kyrevent” initiated the MPT (Heslop et al., 2002; McClymont et al., 2013).Within the period from MIS 24 to latest MIS 16, the onset of the100 kyr cyclicity dominance can be traced inmostmarine and terrestrialrecords spanning the Middle Pleistocene (e.g Colleoni et al., 2012;Heslop et al., 2002; Mudelsee and Schulz, 1997). However, besides the900 kyr event, the MPT itself in many records is not connected with asudden and sustained increase in the intensity of cold periods. Heslopet al. (2002) emphasized that there is no substantial increase in thema-rine ice volume record from the 900 kyr event (MIS 22) to MIS 16. The
Chinese loess record even indicates a decline of the Asian winter mon-soon from MIS 22 to MIS 16. Indeed, in marine records the beginningor the intensification of a long term Northern Hemispheric coolingtrend has been already recorded from ~1.2 Myr (MIS 36) (McClymontet al., 2013). The χ records from the Chinese loess plateau also indicatea gradual strengthening of the Asian winter monsoon commencing at1.2 Myr, well before the MPT (Heslop et al., 2002). The intensificationof thewintermonsoon can be regarded as a sign of a strengthened Had-ley circulation and therefore of an overall cooling in the high latitudes(see McClymont et al., 2013 and references therein). Meyers andHinnov (2010) argued that the progression from a more stochasticearly Pliocene to a strongly deterministic late Pleistocene is primarilyaccommodated during two transitory phases of Northern Hemisphereice sheet growth. This trend is punctuated by “stochastic events,”whichwere interpreted as evidence for abrupt reorganization of the cli-mate system at the initiation and termination of the Mid‐PleistoceneTransition and at the onset of Northern Hemisphere glaciation.At 1.2 Myr the 100 kyr cycle appears to be present in the marine aswell as in the Chinese climate proxy records (Heslop et al., 2002;McClymont et al., 2013; Sun et al., 2006) and can also be traced in theearliest part of the Serbian record around 1 Myr. From 1.2 Myr coevalwith the early Pleistocene cooling, the 100 kyr cycle evolves to a thresh-old reached in theMPT causing a shift into the 100 kyr world character-ized by high amplitudes of climate variations (Sun et al., 2006).Observations from Serbian loess–paleosol sequences are in good agree-ment with global paleoclimate evolution.
Besides the Chinese loess, other prominent records of the MPT inEurasia are the Lake Baikal sedimentary succession as well as the pollenrecords of Tenaghi Phillipon. At Tenaghi Phillipon, Tzedakis et al. (2006)could identify the period between MIS 22 and 16 as the time intervalduring, which a large number of Tertiary relict species became extirpat-ed. Tzedakis et al. (2006) using pollen grains from Tenaghi Philiponshowed that during the period between MIS 22 and 16 many relicttaxa disappeared and interglacial forests attained modern species

104 B. Basarin et al. / Global and Planetary Change 122 (2014) 89–106
composition. They argued that the extreme glacial conditions either re-lated to the 900 kyr event or succeeding glacialswere responsible for re-ducing their genetic ability to survive the next cold/arid phase (Tzedakiset al., 2006). Hence, in contrast to the marine records and Chinese loessrecords, the Greek pollen record, indeed indicates fundamental andsustained paleoenvironmental changes related to the MPT. Also theSerbian loess–paleosol record gives evidence for a pronounced changein paleoclimatic and paleoenvironmental conditions related to theMPT. Regarding glacial conditions, sedimentation rates of loess unitsolder than ~600 kyr are relatively low. For the younger units the ratesincrease significantly. This finding is consistent to Chinese loess records(Sun et al., 2006) and also to the Lake Baikal sedimentary record of theMPT (Prokopenko et al., 2006), indicating higher aeolian activity andphysical weathering, respectively, as commonly related to cold, season-ally dry and/or glaciated environments. As loess accumulation in theDanube Basin is especially related to river systems, providing theproto-loess material, the Serbian loess record is also the witness of im-plications of theMPT on the fluvial regime of Danube and itsmajor trib-utaries. In particular, it suggests an increasingly anastomosing characterof the river systems in post-MPT cold stages and a pronounced season-ality of discharge (e.g. Matenco et al., 2013).
According to paleopedological, as well as geochemical and mineral-ogical criteria, fundamental changes of interglacial climate conditionsalso occurred during the Middle Pleistocene. While the rubifiedpaleosols V-S5 (MIS 13–15), V-S6 (MIS 17) and older developed undersub-Mediterranean climate conditions, younger paleosols formedunder a gradually dryer, more continental climate (Buggle et al., 2013,2014; Marković et al., 2011). However, this aridization evolved rathergradually in the post-MPT period (MIS 13–15 toMIS 1) and hence is dif-ficult to relate to the MPT. According to the “mountain uplift hypothe-sis” proposed by Buggle et al. (2013, 2014), this trend towards anincreasingly continental climate regime rather reflects a climatic re-sponse to small scale Quaternary surface uplift of surroundingmountainranges. The mountain uplift also occurred before the MPT, however,without any fundamental coeval changes in soil type and climate condi-tions. Overall, the sub-Mediterranean climate mode in pre-MPT periodsappears as relatively stable. One can speculate on either surface upliftapproaching a critical threshold value in the Middle Pleistocene tocause a significant response in the climate of the Pannonian Basin oron the other hand MPT related changes in the climatic boundary con-ditions could have “destabilized” the “Mediterranean mode” and in-creased the vulnerability of the regional environment for climateforcing of tectonic origin. Nevertheless, the presented results such asthe identification of the MPT, simultaneously timed to other well-established Pleistocene records, demonstrate that the Serbian loess–paleosol sequences represent a highly valuable archive for reconstructingthe implications of global environmental changes on the European conti-nent. Insights into peculiarities and processes of the regional climateevolution such as the interaction of tectonic and climatic triggers are pro-vided as well.
5. Conclusion
Serbian loess–paleosol sequences are unique terrestrial paleoclimatearchives. During the last decade, different studies using different analy-ses underlined the importance of Serbian loess–paleosol sequences forpaleoclimate reconstruction. Presented here is the time scale spanningthe last million years. Glacial/interglacial cycles recorded as χ and χfdvariations in the sediments reveal strong power in Milankovitch fre-quency bands.
The χ and χfd records are tied into a regional succession of proxy re-sponses. The χ and χfd records follow a significant rise in regional annualtemperature reflected in palynological records from Tenaghi Phillipon.In terms of orbital configuration, this time corresponds to June perihe-lion as well as for the March perihelion for the low values of χ and χfd.
Tuning results in a robust timescale well confined with other regionaland global paleoclimate reconstructions.
In the tuning process of χ and χfd records, whichmanipulates the re-cord at precession index frequencies only, high signal power is restrict-ed to 139 kyr, 94 kyr and to 100 kyr, 77 kyr respectively, but smallamplitude at the obliquity frequency is also observed in χ record. Inter-esting peaks with highest amplitudes are of 245 kyr which could be dueto the local or regional climate conditions during the formation of thesepedocomplexes. The absence of high frequency spectral peaks is proba-bly due to uniform sampling rates throughout the sequence and differ-ent sedimentation rates in loess and paleosols. The Mid-PleistoceneTransition has been for thefirst time identified in Serbian loess–paleosolsequences and its timing and observed changes, coincides with otherpaleoclimate archives.
Presented results highlight the importance of Serbian loess–paleosolsequences for investigating climate dynamics in this part of Europe. Thecorrelationswith different paleoclimate archives, from different parts ofthe globe, suggest that these sequences could be seen as key continentalor even global paleoclimate reconstruction.
Acknowledgments
This research was supported by project 176020 of the Serbian Minis-try of Education, Science and Technological Development. Biljana Basarinis grateful to The European Science foundation for Short visit grant 5994within the framework of the ESF activity “EARTHTIME — The EuropeanContribution”. The authors would like to thankMaureen Raymo for stim-ulating comments, which greatly improved the manuscript. The authorsare grateful to anonymous reviewers for their very helpful and construc-tive comments.
References
An, Z.S., Kukla, G., Porter, S.C., Xiao, J.L., 1991. Magnetic susceptibility evidence of mon-soon variation on the loess plateau of central China during the last 130 000 years.Quat. Res. 36, 29–36.
Andersen, K.K., Azuma, N., Barnola, J.-M., Bigler, M., Biscaye, P., Caillon, N., Chappellaz, J.,Clausen, H.B., Dahl-Jensen, D., Fischer, H., Flückiger, J., Fritzsche, D., Fujii, Y., Goto-Azuma, K., Grønvold, K., Gundestrup, N.S., Hansson, M., Huber, C., Hvidberg, C.S.,Johnsen, S.J., Jonsell, U., Jouzel, J., Kipfstuhl, S., Landais, A., Leuenberger, M., Lorrain,R., Masson-Delmotte, V., Miller, H., Motoyama, H., Narita, H., Popp, T., Rasmussen, S.O.,Raynaud, D., Rothlisberger, R., Ruth, U., Samyn, D., Schwander, J., Shoji, H., Siggard-Andersen, M.-L., Steffensen, J.P., Stocker, T., Sveinbjörnsdóttir, A.E., Svensson, A., Takata,M., Tison, J.-L., Thorsteinsson, T., Watanabe, O., Wilhelms, F., White, J.W.C., 2004. High-resolution recordofNorthernHemisphere climate extending into the last interglacial pe-riod. Nature 431, 147–151.
Antoine, P., Rousseau, D.D., Fuchs, M., Hatté, C., Gautier, C., Marković, S.B., Jovanović, M.,Gaudenyi, T., Moine, O., Rossignol, J., 2009. High resolution record of the last climaticcycle in the Southern Carpathian basin (Surduk, Vojvodina, Serbia). Quat. Int. 198,19–36.
Antonioli, F., Bard, E., Potter, E.-K., Silenzi, S., Improta, S., 2004. 215-ka history of sea-leveloscillations from marine and continental layers in Argentarola Cave speleothems(Italy). Glob. Planet. Chang. 43, 57–78.
Ao, H., Dekkers, M.J., Qin, L., Xiao, G.Q., 2011. An updated astronomical timescale for thePlio-Pleistocene deposits from South China Sea and new insights into Asian monsoonevolution. Quat. Sci. Rev. 30, 1560–1575.
Banerjee, S.K., 1994. Contributions of fine-particle magnetism to reading the globalpaleoclimate record. J. Appl. Phys. 75 (10), 5925–5930.
Baradák, B., 2009. Application of anisotropy of magnetic susceptibility (AMS) for the de-termination of paleo-wind directions and paleo-environment during the accumula-tion period of Bag Tephra, Hungary. Quat. Int. 198, 77–84.
Barrell, J., 1917. Rhythms and themeasurement of geological time. Bull. Geol. Soc. Am. 28,745–904.
Berger, A., Loutre, M.F., 1991. Insolation values for the climate of the last 10 million years.Quat. Sci. Rev. 4, 297–317.
Berger, A., Loutre, M., 1996. Modelling the climate response to astronomical and CO2 forc-ings, Comptes rendus de l'Académie des sciences. Série 2. Sciences de la terre et desplanètes 323, 1–16.
Berger, A., Loutre, M.F., 2002. An exceptionally long interglacial ahead? Science 297,1287–1288.
Berger, A., Li, X., Loutre, M., 1999. Modelling Northern Hemisphere ice volume over thelast 3 Ma. Quat. Sci. Rev. 18, 1–11.
Berger, A., Loutre, M.F., Kaspar, F., Lorenz, S.J., 2007. Insolation during Interglacial. In:Sirocko, F., Claussen, M., Sánchez Goni, M.F., Litt, T. (Eds.), The Climate of PastInterglacialsDevelopment in Quaternary Science. 8. Elsevier, Amsterdam, pp. 13–27.

105B. Basarin et al. / Global and Planetary Change 122 (2014) 89–106
Blaauw, M., 2012. Out of tune: the dangers of aligning proxy archives. Quat. Sci. Rev. 36,38–49.
Bokhorst, M.P., Vandenberghe, J., 2009. Validation of wiggle matching using amulti-proxyapproach and its palaeoclimatic significance. J. Quat. Sci. 24, 937–947.
Bokhorst, M.P., Beets, C.J., Marković, S.B., Gerasimenko, N.P., Matviishina, Z.N., Frechen, M.,2009. Pedo-chemical climate proxies in Late Pleistocene Serbian–Ukrainian loess se-quences. Quat. Int. 198, 23–33.
Bokhorst, M.P., Vandenberghe, J., Sümegi, P., Łanczont, N.P., Gerasimenko, N.P.,Matviishina, Z.N., Marković, S.B., Frechen, M., 2011. Atmospheric circulation patternsin central and eastern Europe during Weichselian Pleniglacial inferred from loessgrain size records. Quat. Int. 234, 62–74.
Bronger, A., 1976. Zur quartären Klima-und Landschaftsentwicklung des Karpatenbeckensauf paläopedologischer und bodengeogra- phischer Grundlage. Kiel. Geogr. Schriften 45.
Buggle, B., Glaser, B., Zöller, L., Hambach, U., Marković, S., Glaser, I., Gerasimenko, N., 2008.Geochemical characterization and origin of Southeastern and Eastern Europeanloesses (Serbia, Romania, Ukraine). Quat. Sci. Rev. 27, 1058–1075.
Buggle, B., Hambach, U., Glaser, B., Gerasimenko, N., Marković, S., Glaser, I., Zöller, L., 2009.Stratigraphy, and spatial and temporal paleoclimatic trends in Southeastern/EasternEuropean loess–paleosol sequences. Quat. Int. 196, 86–106.
Buggle, B., Hambach, U., Kehl, M., Zöller, L., Marković, S.B., Glaser, B., 2013. The progressiveevolution of a continental climate in SE-Central European lowlands during theMiddle Pleistocene recorded in loess paleosol sequences. Geology 41, 771–774.
Buggle, B., Hambach, U., Müller, K., Zöller, L., Marković, S.B., Glaser, B., 2014. Iron mineral-ogical proxies and Quaternary climate change in SE-European loess–paleosol se-quences. Catena http://dx.doi.org/10.1016/j.catena.2013.06.012.
Candy, I., Schreve, D.C., Sherriff, J., Tye, G.J., 2014. Marine Isotope Stage 11: palaeoclimates,palaeoenvironments and its role as an analogue for the current interglacial. Earth Sci.Rev. 128, 18–51.
Clark, P.U., Archer, D., Pollard, D., Blum, J.D., Rial, J.A., Brovkin, V., Mix, A.C., Pisias, N.G., Roy,M., 2006. The middle Pleistocene transition: characteristics, mechanisms, and impli-cations for long-term changes in atmospheric pCO2. Quat. Sci. Rev. 25, 3150–3184.
Clemens, S.C., Prell, W.L., Sun, Y., Liu, Z., Chen, G., 2008. Southern hemisphere forcing ofPliocene δ18O and the evolution of Indo-Asian monsoons. Paleoceanography 23,PA4210. http://dx.doi.org/10.1029/2008PA001638.
Colleoni, F., Masina, S., Negri, A., Marzocchi, A., 2012. Plio-Pleistocene high–low latitudeclimate interplay: a Mediterranean point of view. Earth Planet. Sci. Lett. 319–320,35–44.
de Garidel-Thoron, T., Rosenthal, Y., Bassinot, F., Beaufort, L., 2005. Stable sea surface tem-peratures in the western Pacific warm pool over the past 1.75 million years. Nature433, 294–298.
Ding, Z., Yu, Z., Rutter, N.W., Liu, T., 1994. Towards an orbital time scale for Chinese loessdeposits. Quat. Sci. Rev. 13, 39–70.
Ding, Z., Derbyshire, E., Yang, S.L., Yu, Z.W., Xiong, S.F., Liu, T.S., 2002. Stacked 2.6-Magrain size record from the Chinese loess based on five sections and correlationwith the deep sea 18O record. Paleoceanography 17 (3). http://dx.doi.org/10.1029/2001pa000725.
Evans, M.E., Heller, F., 2001. Magnetism of loess/palaeosol sequences: recent develop-ments. Earth Sci. Rev. 54, 129–144.
Fitzsimmons, K.E., Marković, S.B., Hambach, U., 2012. Pleistocene environmental dynamicsrecorded in the loess of themiddle and lower Danube basin. Quat. Sci. Rev. 41, 104–118.
Fuchs, M., Rousseau, D.D., Antoine, P., Hattè, C., Gauthier, C., Marković, S., Zöller, L., 2008.Chronology of the last climatic cycle (Upper Pleistocene) of the Surduk loess se-quence, Vojvodina, Serbia. Boreas 37, 66–73.
Gilbert, G.K., 1895. Sedimentary measurement of Cretaceous time. J. Geol. 3, 121–127.Gilbert, G.K., 1900a. Rhythms and geological time. American Association for the Advance-
ment of Science, Proceedings. 49, pp. 1–19.Gilbert, G.K., 1900b. Rhythms and geological time. Science 11, 1001–1012.Giordano, G., De Benedetti, A.A., Diana, A., Diano, G., Gaudioso, F., Marasco, F., Miceli, M.,
Mollo, S., Cas, R.A.F., Funiciello, R., 2006. The Colli Albani mafic caldera(Roma, Italy): stratigraphy, structure and petrology. J. Volcanol. Geotherm. Res. 155,49–80.
Grinsted, A., Moore, J.C., Jevrejeva, S., 2004. Application of the cross wavelet transform andwavelet coherence to geophysical time series. Nonlinear Process. Geophys. 11,561–566.
Guo, Z., Liu, T., Fedoroff, N., Wei, L., Ding, Z., Wu, N., Lu, H., Jiang, W., An, Z., 1998. Climateextremes in loess of China coupled with the strength of deep-water formation in theNorth Atlantic. Glob. Planet. Chang. 18, 113–128.
Guo, Z., Ruddiman, W.F., Hao, Q.Z., Wu, H.B., Qiao, Y.S., Zhu, R.X., Peng, S.Z., Wei, J.J., Yuan,B.Y., Liu, T.S., 2002. Onset of Asian desertification by 22 Myr, ago inferred from loessdeposits in China. Nature 416, 159–163.
Han, W., Fang, F., Berger, A., 2012. Tibet forcing of mid-Pleistocene synchronous enhance-ment of East Asian winter and summer monsoons revealed by Chinese loess record.Quat. Res. http://dx.doi.org/10.1016/j.yqres.2012.05.001.
Hays, J.D., Imbrie, J., Shackleton, N.J., 1976. Variations in the Earth's orbit Pacemaker of theice ages. Science 194, 1121–1132.
Heller, F., Evans, M.E., 1995. Loess magnetism. Rev. Geophys. 33, 211–240.Herold, N., Yin, Q.Z., Karami, M.P., Berger, A., 2012. Modelling the climatic diversity of the
warm interglacials. Quat. Sci. Rev. 56, 126–141.Heslop, D., Dekkers, M.J., 2002. Spectral analysis of unevenly spaced climatic time series
using CLEAN: signal recovery and derivation of significance levels using a MonteCarlo simulation. Phys. Earth Planet. Inter. 130, 103–116.
Heslop, D., Langereis, C.G., Dekkers, M.J., 2000. A new astronomical timescale for the loessdeposits of northern China. Earth Planet. Sci. Lett. 184, 125–139.
Heslop, D., Dekkers, M.J., Langereis, C.G., 2002. Timing and structure of the mid-Pleistocene transition: records from the loess deposits of northern China.Palaeogeogr. Palaeoclimatol. Palaeoecol. 185, 133–143.
Horvath, E., 2001. Marker horizons in the loesses of the Carpathian Basin. Quat. Int. 76(77), 157–163.
Hughes, P.D., Woodward, J.C., van Calsteren, P.C., Thomas, L.E., 2011. The glacial history ofthe Dinaric Alps, Montenegro. Quat. Sci. Rev. 30, 3393–3412. http://dx.doi.org/10.1016/j.quascirev.2011.08.016.
Huybers, P., Aharonson, O., 2010. Orbital tuning, eccentricity, and the frequency modula-tion of climatic precession. Paleoceanography 25. http://dx.doi.org/10.1029/2010PA001952.
Huybers, P., Wunsch, C., 2004. A depth-derived Pleistocene age-model: uncertainty esti-mates, sedimentation variability, and nonlinear climate change. Paleoceanography19 (368), 2004. http://dx.doi.org/10.1029/2002PA000,857.
Imbrie, J., Hays, J.D., Martinson, D.G., McIntyre, A., Mix, A.C., Morley, J.J., Pisias, N.G., Prell,W.L., Shackleton, N.J., 1984. The orbital theory of Pleistocene climate: support from arevised chronology of themarine δ18O record. In: Berger, A., et al. (Eds.), Milankovitchand Climate. D. Reidel, Norwell, Mass, pp. 269–305.
Jordanova, D., Petersen, N., 1999. Paleoclimatic record from a loess-soil profile in north-eastern Bulgaria II. Correlation with global climatic events during the Pleistocene.Geophys. J. Int. 138, 533–540.
Jouzel, J., Masson-Delmotte, V., Cattani, O., Dreyfus, G., Falourd, S., Hoffmann, G., Minster,B., Nouet, J., Barnola, J.M., Chappellaz, J., Fischer, H., Gallet, J.C., Johnsen, S.,Leuenberger, M., Loulergue, L., Luethi, D., Oerter, H., Parrenin, F., Raisbeck, G.,Raynaud, D., Schilt, A., Schwander, J., Selmo, E., Souchez, R., Spahni, R., Stauffer, B.,Steffensen, J.P., Stenni, B., Stocker, T.F., Tison, J.L., Werner, M., Wolff, E.W., 2007. Orbit-al and millennial Antarctic climate variability over the past 800, 000 years. Science317, 793–796.
Kandiano, E.S., Bauch, H., 2003. Surface ocean temperatures in the north-east Atlantic dur-ing the last 500000 years: evidence from foraminiferal census data. Terra Nova 15,265–271.
Kandiano, E.S., Bauch, H.A., 2007. Phase relationship and surface watermass change in theNorth East Atlantic during Marine Isotope Stage 11 (MIS 11). Quat. Res. 68, 445–455.
Kandiano, E.S., Bauch, H.A., Fahl, K., Helmke, J.P., Röhl, U., Pérez-Folgado, M., Cacho, I.,2012. The meridional temperature gradient in the eastern North Atlantic duringMIS 11 and its link to the ocean–atmosphere system. Palaeogeogr. Palaeoclimatol.Palaeoecol. 333–334, 24–39.
Karner, D.B., Marra, F., Renne, P.R., 2001. The history of the Monti Sabatini and Alban Hillsvolcanoes: groundwork for assessing volcanic–tectonic hazards for Rome. J. Volcanol.Geotherm. Res. 107, 185–219.
Kuhlemann, J., 2007. Paleogeographic and paleotopographic evolution of the Swiss andEastern Alps since the Oligocene. Glob. Planet. Chang. 58, 224–236.
Kukla, G.J., 1970. Correlations between loesses and deep-sea sediments. Geol. Foren.Stockh. Forh. 92, 148–180.
Kukla, G.J., 1975. Loess stratigraphy of Central Europe. In: Butzer, K.W., Isaac, L.I. (Eds.),After the Australopithecines. Mouton Publishers, The Hague, pp. 99–187.
Kukla, G.J., 1977. Pleistocene land–sea correlations. Earth-Sci. Rev. 13, 307–374.Kukla, G., 1987. Loess stratigraphy in Central China. Quat. Sci. Rev. 6, 191–219.Kukla, G., An, Z., 1989. Loess stratigraphy in Central China. Palaeogeogr. Palaeoclimatol.
Palaeoecol. 72, 203–225.Kukla, G., Gavin, J., 2004. Milankovitch climate reinforcements. Glob. Planet. Chang. 40,
27–48.Laskar, J., 1990. The chaotic motion of the solar system: a numerical estimate of the size of
the chaotic zones. Icarus 88, 266–291.Laskar, J., Robutel, P., Joutel, F., Gastineau, M., Correia, A.C.M., Levrard, B., 2004. A
long-term numerical solution for the insolation quantities of the Earth. Astron.Astrophys. 428, 261–285.
Leduc, G., Schneider, R., Kim, J.-H., Lohmann, G., 2010. Holocene and Eemian sea surfacetemperature trends as revealed by alkenone and Mg/Ca paleothermometry. Quat.Sci. Rev. 29, 989–1004.
Lisiecki, L., 2010. Links between eccentricity forcing and the 100,000-year glacial cycle.Nat. Geosci. 3, 349–352.
Lisiecki, L.E., Raymo, M.E., 2005. A Plio-Pleistocene stack of 57 globally distributedbenthic δ18O records. Paleoceanography 20, PA1003. http://dx.doi.org/10.1029/2004PA001071.
Liu, Q., Deng, C., Torrent, J., Zhu, R., 2007. Reviews of recent developments inmineral mag-netism of Chinese loess. Quat. Sci. Rev. 26 (3–4), 368–385.
Liu, X.M., Liu, Z., Lü, B., Marković, S.B., Chen, J.S., Guo, H., Ma, M.M., Zhao, G.Y., Feng, H.,2013. The magnetic properties of Serbian loess and its environmental significance.Chin. Sci. Bull. 58 (3), 353–363.
Loutre, M.F., Berger, A., 2003. Marine Isotope Stage 11 as an analogue for the present in-terglacial. Glob. Planet. Chang. 762, 1–9.
Lu, H.Y., Liu, X.M., Zhang, F., An, Z.S., Dodson, J., 1999. Astronomical calibration ofloess–paleosol deposits at Luochuan, central Chinese Loess Plateau. Palaeogeogr.Palaeoclimatol. Palaeoecol. 154, 237–246.
Lu, H., Zhang, F., Liu, X., Duce, R.A., 2004. Periodicities of palaeoclimatic variations record-ed by loess–paleosol sequences in China. Quat. Sci. Rev. 23, 1891–1900.
Lukić, T., Basarin, B., Buggle, B., Marković, S.B., Tomović, V.M., Popov Raljić, J., Hrnjak, I.,Timar-Gabor, A., Hambach, U., Gavrilov, M.B., 2014. A joined rockmagnetic and color-imetric perspective on the Late Pleistocene climate of Orlovat loess site (NorthernSerbia). Quat. Int. 334–335, 179–188.
Lüthi, D., LeFloch, M., Bereiter, B., Blunier, T., Barnola, J.-M., Siegenthaler, U., Raynaud, D.,Jouzel, J., Fischer, H., Kawamura, K., Stocker, T.F., 2008. High-resolution carbon dioxideconcentration record 650,000–800,000 years before present. Nature 453, 379–382.
Magri, D., Tzedakis, P.C., 2000. Orbital signatures and long-term vegetation patterns in theMediterranean. Quat. Int. 73 (74), 69–78.
Maher, B.A., 1998. Magnetic properties of modern soils and Quaternary loessicpaleosols: paleoclimatic implications. Palaeogeogr. Palaeoclimatol. Palaeoecol.137, 25–54.

106 B. Basarin et al. / Global and Planetary Change 122 (2014) 89–106
Marković, S., Oches, E., Gaudenyi, T., Jovanović, M., Hambach, U., Zoeller, L., Sümegi, P.,2004. Paleoclimate record in the Late Pleistocene loess–paleosol sequence at Miseluk(Vojvodina, Srbija). Quaternaire 15–4, 361–368.
Marković, S.B., McCoy, W.D., Oches, E.A., Savić, S., Gaudenyi, T., Jovanović, M., Stevens, T.,Walther, R., Ivanišević, P., Galović, Z., 2005. Paleoclimate record in the Late Pleisto-cene loess–paleosol sequence at Petrovaradin Brickyard (Vojvodina, Serbia). Geol.Carpath. 56, 545–552.
Marković, S.B., Oches, E., Sümegi, P., Jovanović, M., Gaudenyi, T., 2006. An introduction totheUpper andMiddle Pleistocene loess–paleosol sequences of Ruma section (Vojvodina,Yugoslavia). Quat. Int. 149, 80–86.
Marković, S.B., Oches, E.A., McCoy, W.D., Gaudenyi, T., Frechen, M., 2007. Malacologicaland sedimentological evidence for “warm” climate from the Irig loess sequence(Vojvodina, Serbia). Geochem. Geophys. Geosyst. 8, Q09008.
Marković, S.B., Bokhorst, M.P., Vandenberghe, J., McCoy, W.D., Oches, E.A., Hambach, U.,Gaudenyi, T., Jovanović, M., Stevens, T., Zöller, L., Machalett, B., 2008. Late Pleistoceneloess–paleosol sequences in the Vojvodina region, North Serbia. J. Quat. Sci. 23,73–84.
Marković, S.B., Hambach, U., Catto, N., Jovanović, M., Buggle, B., Machalett, B., Zöller, L.,Glaser, B., Frechen, M., 2009. Middle and Late Pleistocene loess sequences atBatajnica, Vojvodina, Serbia. Quat. Int. 198, 255–266.
Marković, S.B., Hambach, U., Stevens, T., Kukla, G.J., Heller, F., McCoy, W.D., Oches, E.A.,Buggle, B., Zöller, L., 2011. The last million years recorded at the Stari Slankamenloess–palaeosol sequence: revised chronostratigraphy and long term environmentaltrends. Quat. Sci. Rev. 9 (1), 1142–1154.
Marković, S.B., Hambach, U., Stevens, T., Basarin, B., O'Hara-Dhand, K., Gavrilov, M.M.,Gavrilov, M.B., Smalley, I., Teofanov, N., 2012a. Relating the astronomical time scaleto the loess–palaeosol sequences in Vojvodina, Northern Serbia. In: Berger, Andre,Mesinger, F., Sijacki, D. (Eds.), Climate Change: Inferences from Paleoclimate and Re-gional Aspects. Springer-Verlag, Vienna.
Marković, S.B., Hambach, U., Stevens, T., Jovanović, M., O'Hara-Dhand, K., Basarin, B., Lu, H.,Smalley, I., Buggle, B., Zech, M., Svirčev, Z., Sumegi, P., Milojković, N., Zoller, L., 2012b.Loess in the Vojvodina region (Northern Serbia): an essential link between Europeanand Asian Pleistocene environments. Neth. J. Geosci. Geol. Mijnb. 91/1–2, 173–188.
Marra, F., Karner, D.B., Freda, C., Gaeta, M., Renne, P., 2009. Large mafic eruptions at AlbanHills Volcanic District (Central Italy): chronostratigraphy, petrography and eruptivebehavior. J. Volcanol. Geotherm. Res. 179, 217–232.
Maslin, M.A., Ridgwell, A.J., 2005. Mid-Pleistocene revolution and the ‘eccentricity myth’.In: Head, M.J., Gibbard, P.L. (Eds.), Early–Middle Pleistocene Transition: The Land–Ocean EvidenceGeol. Soc. Lond., Spec. Publ. 19–34.
Matenco, L., Andriessen, P., the SourceSink Network, 2013. Quantifying the mass transferfrom mountain ranges to deposition in sedimentary basins: source to sink studies inthe Danube Basin–Black Sea system. Glob. Planet. Chang. 103, 1–18.
McClymont, E.L., Sosdian, S.M., Rosell-Melé, A., Rosenthal, Y., 2013. Pleistocene sea-surface temperature evolution: early cooling, delayed glacial intensification, and im-plications for the mid-Pleistocene climate transition. Earth Sci. Rev. 123, 173–193.
Meyer, M.C., Cliff, R.A., Spötl, C., 2011. Speleothems and mountain uplift. Geology 39,447–450. http://dx.doi.org/10.1130/G31881.1.
Meyers, S.R., Hinnov, L.A., 2010. Northern Hemisphere glaciation and the evolution ofPlio-Pleistocene climate noise. Paleoceanography 25, PA3207. http://dx.doi.org/10.1029/2009PA001834.
Meyers, S.R., Sageman, B.B., Pagani, M., 2008. Resolving Milankovitch: consideration ofsignal and noise. Am. J. Sci. 308, 770–786.
Milankovich, M., 1920. Theorie mathématique des phénomenes thermiques produits parla radiation Solaire. Gauthier-Villars, Paris.
Milankovich, M., 1941. Kanon der Erdbestrahlung und seine Anwendung auf dasEiszeitenproblem: Special Publications, v. 132. Section of Mathematics and NaturalSciences. v. 33. Königliche Serbische Akademie, Belgrade.
Mudelsee, M., Schulz, M., 1997. The Mid-Pleistocene climate transition: onset of100 ka cycle lags ice volume build-up by 280 ka. Earth Planet. Sci. Lett. 151, 117–123.
Muller, R.A., MacDonald, G.J., 2000. Ice ages and astronomical causes. Data, Spectral Anal-ysis and MechanismsSpringer, New York, (318 pp.).
Müller, U.C., Pross, J., 2007. Lesson from the past: present insolation minimum holds po-tential for glacial inception. Quat. Sci. Rev. 26, 3025–3029.
Nádor, A., Lantos, M., Tóth-Makk, Á., Thamó-Bozsó, E., 2003. Milankovitch-scale multi-proxy records from fluvial sediments of the last 2.6 Ma, Pannonian Basin, Hungary.Quat. Sci. Rev. 22 (20), 2157–2175.
Necula, C., Panaiotu, C., 2008. Application of dynamic programming to the dating of aloess–paleosol sequence. Rom. Rep. Phys. 60 (1), 157–171.
Neeman, B., 1993. Orbital tuning of paleoclimate records: a reassessment. LawrenceBerkeley 402 Laboratory Report, LBNL-39572.
Nikolova, I., Yin, Q., Berger, A., Singh, U.K., Karami, M.P., 2013. The last interglacial(Eemian) climate simulated by LOVECLIM and CCSM3. Clim. Past 9, 1789–1806.
Paillard, D., Labeyrie, L., Yiou, P., 1996. Macintosh program performs time-series analysis.EOS Trans. AGU 77, 379.
Panaiotu, C.G., Panaiotu, C.E., Grama, A., Necula, C., 2001. Paleoclimatic record from aloess–paleosol profile in southeastern Romania. Phys. Chem. Earth A 26, 893–898.
Park, J., Maasch, K., 1993. Plio-Pleistocene time evolution of the 100-kyr cycle in marinepaleoclimate records. J. Geophys. Res. 98, 447–462.
Petrović, A., Marković, S.B., 2012. The cycles of revolution: how Wegener and Milankovićchanged the earth sciences. Acta Geogr. Slov. 52-2, 259–276.
Porter, S.C., 2001. Chinese loess record of monsoon climate during the last glacial–interglacial cycle. Earth Sci. Rev. 54, 115–128.
Pouclet, A., Horvath, E., Gabris, Gy, Juvigné, E., 1999. The Bag Tephra, a widespreadtephrochronological marker inMiddle Europe: chemical and mineralogical investiga-tions. Bull. Volcanol. 60, 265–272.
Prokopenko, A.A., Hinnov, L.A., Williams, D.F., Kuzmin, M.I., 2006. Orbital forcing of continen-tal climate during the Pleistocene: a complete astronomically tuned climatic recordfrom Lake Baikal, SE Siberia. Quat. Sci. Rev. 25, 3431–3457.
Reille, M., de Beaulieu, J.-L., Svobodova, H., Andrieu-Ponel, V., Goeury, C., 2000. Pollenanalytical biostratigraphy of the last five climatic cycles from a long continental se-quence from the Velay region (Massif Central, France). J. Quat. Sci. 15 (7), 665–685.
Roberts, D.H., Lehar, J., Dreher, J.W., 1987. Time series analysis with CLEAN. Part I. Deriva-tion of a spectrum. Astron. J. 93, 968–989.
Rossignol-Strick, M., Paterne, M., Bassinot, F.C., Emeis, K.-C., De Lange, G., 1998. An unusualmid-Pleistocene monsoon period over Africa and Asia. Nature 392, 269–272.
Roucoux, K.H., Tzedakis, P.C., Frogley, M.R., Lawson, I.T., Preece, R.C., 2008. Vegetation his-tory of the marine isotope stage 7 interglacial complex at Ioannina, NWGreece. Quat.Sci. Rev. 27, 1378–1395.
Ruddiman,W.F., 2003. Orbital insolation, ice volume and greenhouse gases. Quat. Sci. Rev.22, 1597–1629. http://dx.doi.org/10.1016/S0277-3791(03)00087-8.
Ruddiman, W.F., 2006. What is the timing of orbital-scale monsoon changes? Quat. Sci.Rev. 25, 657–658.
Ruddiman, W.F., Raymo, M.E., Martinson, D.G., Clement, B.M., Backman, J., 1989.Pleistocene evolution: Northern Hemisphere ice sheets and North AtlanticOcean. Paleoceanography 4, 353–412.
Rutherford, S., D'Hondt, S., 2000. Early onset and tropical forcing of 100,000-year Pleistoceneglacial cycles. Nature 408, 72–75.
Sartori, M., Heller, F., Forster, T., Borkovec, M., Hammann, J., Vincent, E., 1999. Magneticproperties of loess grain size fractions from the section at Paks (Hungary). Phys.Earth Planet. Inter. 116, 53–64.
Schmidt, E.D., Machalett, B., Marković, S., Tsukamoto, S., Frechen, M., 2010. Luminescencechronology of the upper part of the Stari Slankamen loess sequence (Vojvodina,Serbia). Quat. Geochronol. 5, 137–142.
Schwarzacher, W., 1993. Cyclostratigraphy and the Milankovitch theory. Developmentsin Sedimentology. 52. Elsevier, Amsterdam, The Netherlands.
Shackleton, N.J., Berger, A., Peltier, W.R., 1990. An alternative astronomical calibration ofthe Lower Pleistocene timescale based on ODP Site 677. Trans. R. Soc. Edinb. EarthSci. 81, 251–261.
Smalley, I., O'Hara-Dhand, K., Wint, J., Machalett, B., Jary, Z., Jefferson, I., 2009. Rivers andloess: the significance of long river transportation in the complex event sequenceapproach to loess deposit formation. Quat. Int. 198, 7–18.
Sternai, P., Herman, F., Champagnac, J.-D., Fox, M., Salcher, B., Willett, S.D., 2012. Pre-glacial topography of the European Alps. Geology 40, 1067–1070. http://dx.doi.org/10.1130/G33540.1.
Stevens, T., Marković, S.B., Zech, M., Hambach, U., Sümegi, P., 2011. Dust deposition andclimate in the Carpathian Basin over an independently dated last glacial–interglacialcycle. Quat. Sci. Rev. 30, 662–681.
Sun, Y., Clemens, S.C., An, Z., Yu, Z., 2006. Astronomical timescale and palaeoclimatic im-plication of stacked 3.6-Myr monsoon records from the Chinese Loess Plateau. Quat.Sci. Rev. 25, 33–48.
Thompson, R., Oldfield, F., 1986. Environmental Magnetism. Allen & Unwin Ltd., London.Torrence, C., Compo, G.P., 1998. A practical guide to wavelet analysis. Bull. Am. Meteorol.
Soc. 79, 61–78.Tzedakis, P.C., 2005. Towards an understanding of the response of southern European
vegetation to orbital and suborbital climate variability. Quat. Sci. Rev. 24, 1585–1599.Tzedakis, P.C., Roucoux, K.H., de Abreu, L., Shackleton, N.J., 2004. The duration of forest
stages in southern Europe and interglacial climate variability. Science 306,2231–2235.
Tzedakis, P.C., Hooghiemstra, H., Pälike, H., 2006. The last 1.35 million years at TenaghiPhilippon: revised chronostratigraphy and long term vegetation trends. Quat. Sci.Rev. 25, 3416–3430.
Tzedakis, P.C., Raynaud, D., McManus, J.F., Berger, A., Brovkin, V., Kiefer, T., 2009. Intergla-cial diversity. Nat. Geosci. 2, 751–755.
Wang, Y.J., Cheng, H., Edwards, R.L., Kong, X.G., Shao, X.H., Chen, S.T., Wu, J.Y., Jiang, X.Y.,Wang, X.F., An, Z.S., 2008. Millennial and orbital scale changes in the East Asian mon-soon over the past 224,000 years. Nature 451, 1090–1093.
Weedon, G.P., 2003. Time-series Analysis and Cyclostratigraphy. Cambridge UniversityPress.
Williams, D.F., Peck, J., Karabanov, E.B., Prokopenko, A.A., Kravchinsky, V., King, J., Kuzmin,M.I., 1997. Lake Baikal record of continental climate response to orbital insolationduring the past 5 million years. Science 278, 1114–1117.
Yang, S., Ding, Z., 2006. Winter–spring precipitation as the principal control on predomi-nance of C3 plants in Central Asia over the past 1.77 Myr: evidence from δ13C of loessorganic matter in Tajikistan. Palaeogeogr. Palaeoclimatol. Palaeoecol. 235, 330–339.
Yang, S., Ding, F., Ding, Z., 2006. Pleistocene chemical weathering history of Asian arid andsemi-arid regions recorded in loess deposits of China and Tajikistan. Geochim.Cosmochim. Acta 70, 1695–1709.
Yin, Q.Z., Berger, A., 2010. Insolation and CO2 contribution to the interglacial climatebefore and after the mid-Brunhes event. Nat. Geosci. 3, 243–246.
Yin, Q.Z., Berger, A., 2012. Individual contribution of insolation and CO2 to the interglacialclimates of the past 800,000 years. Clim. Dyn. 38, 709–724.
Yin, Q.Z., Guo, Z.T., 2008. Strong summer monsoon during the cool MIS-13. Clim. Past 4,29–34.