Embed Size (px)
Citation preview
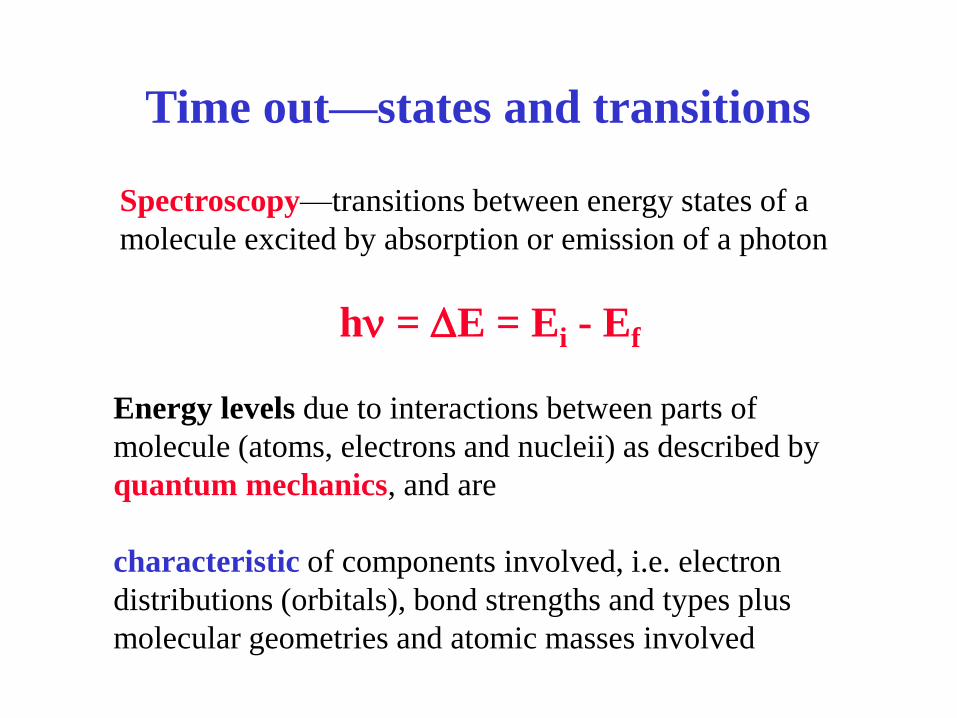
Time out—states and transitions
Spectroscopy—transitions between energy states of a
molecule excited by absorption or emission of a photon
hn = DE = Ei - Ef
Energy levels due to interactions between parts of
molecule (atoms, electrons and nucleii) as described by
quantum mechanics, and are
characteristic of components involved, i.e. electron
distributions (orbitals), bond strengths and types plus
molecular geometries and atomic masses involved
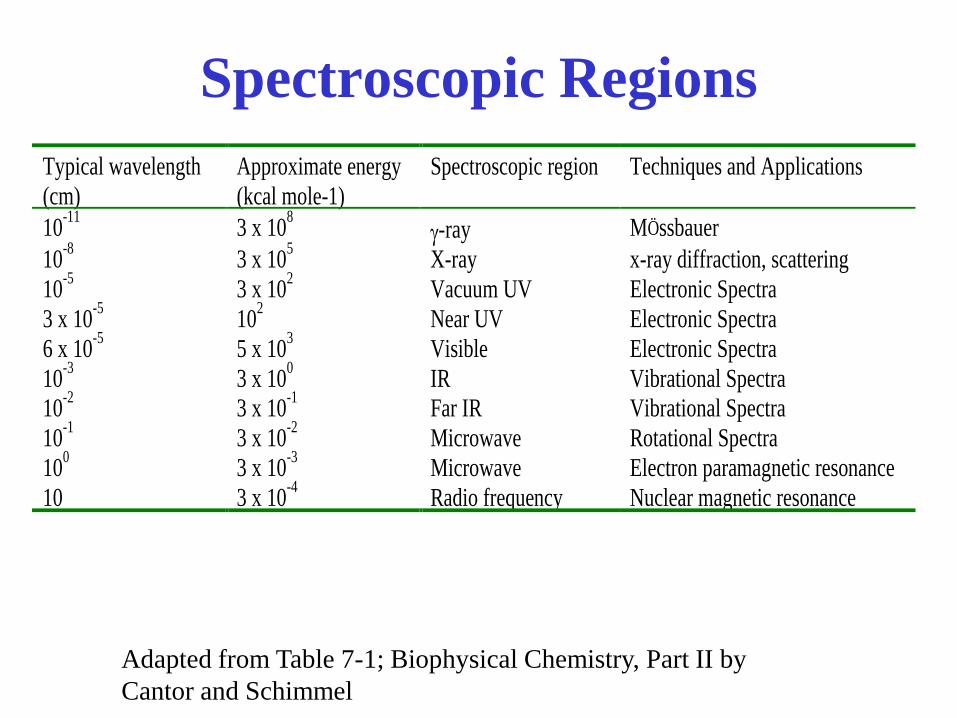
Spectroscopic Regions
Adapted from Table 7-1; Biophysical Chemistry, Part II by
Cantor and Schimmel
Typical wavelength
(cm)
Approximate energy
(kcal mole-1)
Spectroscopic region Techniques and Applications
10-11
3 x 10⁸
-ray MÖssbauer
10-8
3 x 10⁵
X-ray x-ray diffraction, scattering
10-5
3 x 10²
Vacuum UV Electronic Spectra
3 x 10⁻⁵
102
Near UV Electronic Spectra
6 x 10⁻⁵
5 x 10³
Visible Electronic Spectra
10-3
3 x 100
IR Vibrational Spectra
10-2
3 x 10⁻¹
Far IR Vibrational Spectra
10-1
3 x 10⁻²
Microwave Rotational Spectra
100
3 x 10⁻³
Microwave Electron paramagnetic resonance
10 3 x 10⁻⁴
Radio frequency Nuclear magnetic resonance
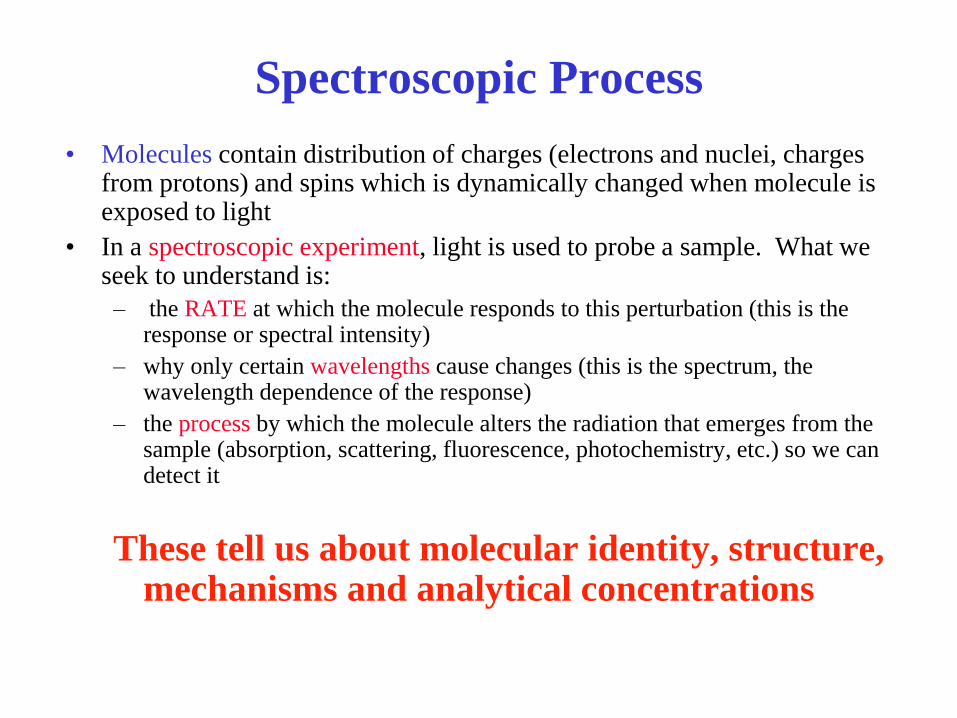
Spectroscopic Process
• Molecules contain distribution of charges (electrons and nuclei, charges from protons) and spins which is dynamically changed when molecule is exposed to light
• In a spectroscopic experiment, light is used to probe a sample. What we seek to understand is:
– the RATE at which the molecule responds to this perturbation (this is the response or spectral intensity)
– why only certain wavelengths cause changes (this is the spectrum, the wavelength dependence of the response)
– the process by which the molecule alters the radiation that emerges from the sample (absorption, scattering, fluorescence, photochemistry, etc.) so we can detect it
These tell us about molecular identity, structure, mechanisms and analytical concentrations
• Long wavelength radiowaves are of low energy that is sufficient to ‘flip’ the spin of nuclei in a magnetic field (NMR). Nuclei interact weakly so spectral transitions between single, well defined energy levels are very sharp and well resolved. NMR is a vital technique for biological structure studies.
• Higher energy microwaves can promote changes in the rotational motions of gas phase molecules, which is the basis of microwave rotational spectroscopy (not a method of biological importance).
• Microwaves are also used for spin-flips of electrons in magnetic fields (ESR or EPR), important for free radicals and transition metal systems (open shell). Magnetic dipole coupling can be used to measure distances between spins—growing importance in peptides and proteins.
Magnetic Resonance—different course
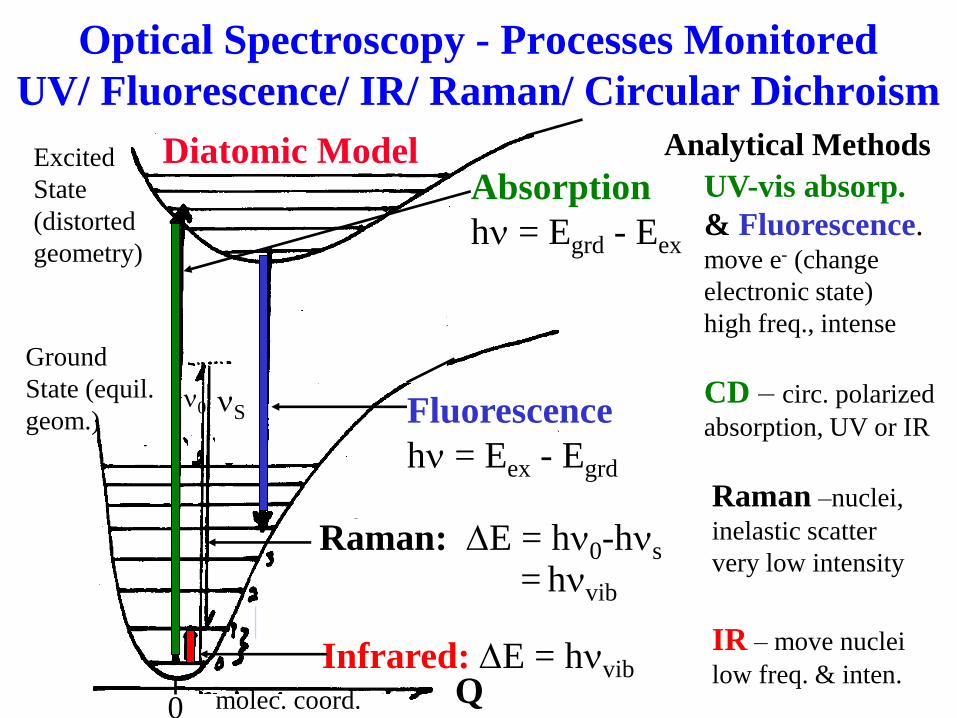
Optical Spectroscopy - Processes Monitored
UV/ Fluorescence/ IR/ Raman/ Circular Dichroism
IR – move nuclei
low freq. & inten.
Raman –nuclei,
inelastic scatter
very low intensity
CD – circ. polarized
absorption, UV or IR
Raman: DE = hn0-hns
Infrared: DE = hnvib
= hnvib
Fluorescence
hn = Eex - Egrd
0
Absorption
hn = Egrd - Eex
Excited
State
(distorted
geometry)
Ground
State (equil.
geom.)
Q
n0 nS
molec. coord.
UV-vis absorp.
& Fluorescence. move e- (change
electronic state)
high freq., intense
Analytical Methods Diatomic Model
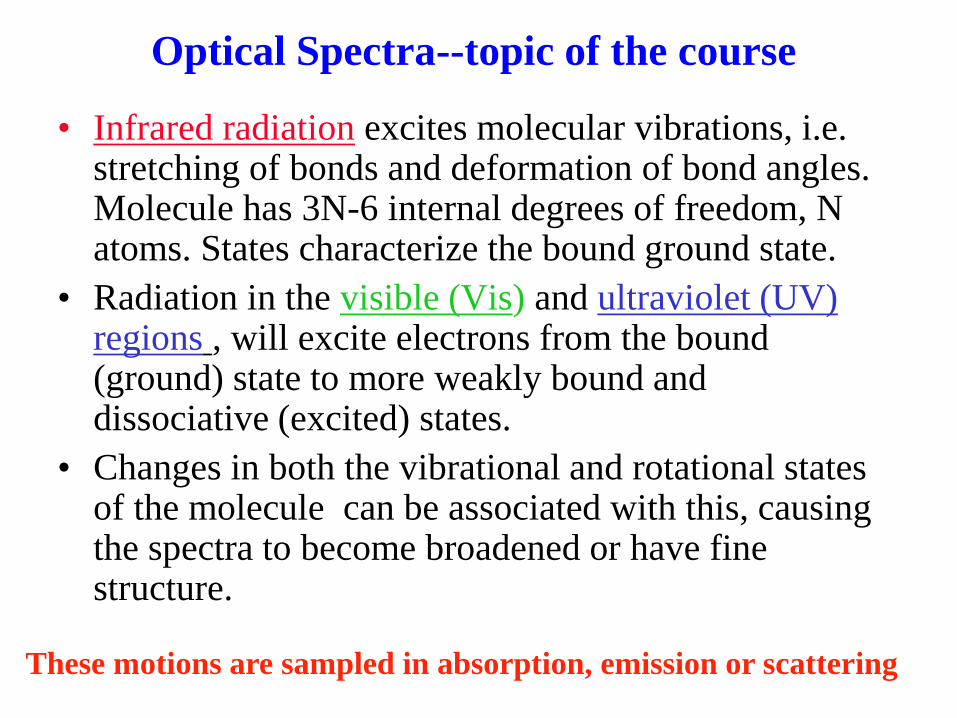
• Infrared radiation excites molecular vibrations, i.e. stretching of bonds and deformation of bond angles. Molecule has 3N-6 internal degrees of freedom, N atoms. States characterize the bound ground state.
• Radiation in the visible (Vis) and ultraviolet (UV) regions , will excite electrons from the bound (ground) state to more weakly bound and dissociative (excited) states.
• Changes in both the vibrational and rotational states of the molecule can be associated with this, causing the spectra to become broadened or have fine structure.
Optical Spectra--topic of the course
These motions are sampled in absorption, emission or scattering
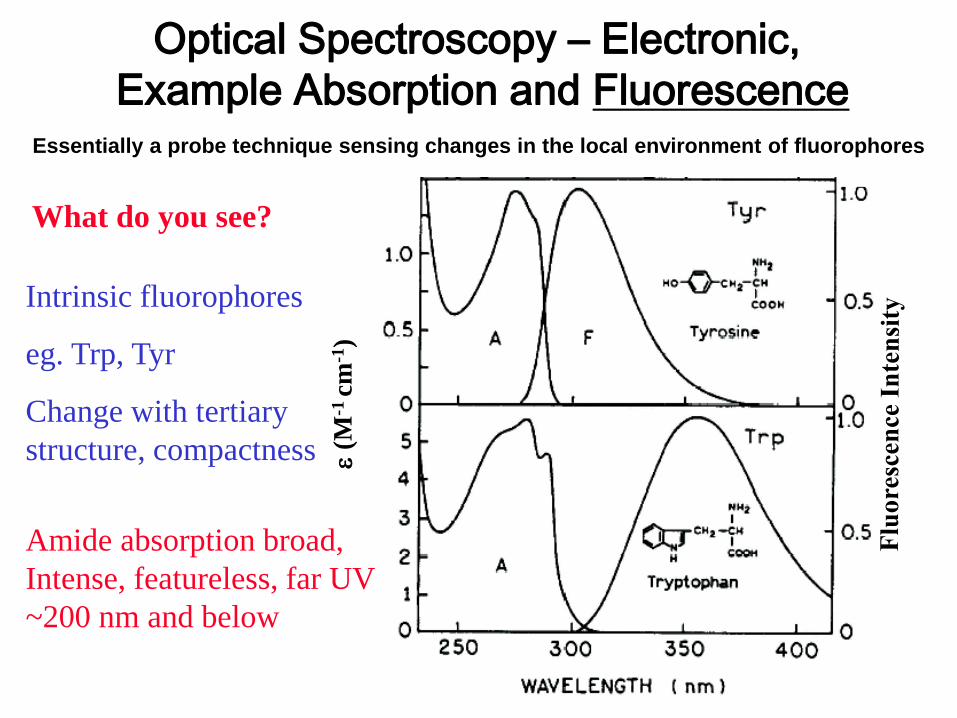
Essentially a probe technique sensing changes in the local environment of fluorophores
Optical Spectroscopy – Electronic,
Example Absorption and Fluorescence
Intrinsic fluorophores
eg. Trp, Tyr
Change with tertiary
structure, compactness (M
-1 c
m-1
)
What do you see?
Amide absorption broad,
Intense, featureless, far UV
~200 nm and below
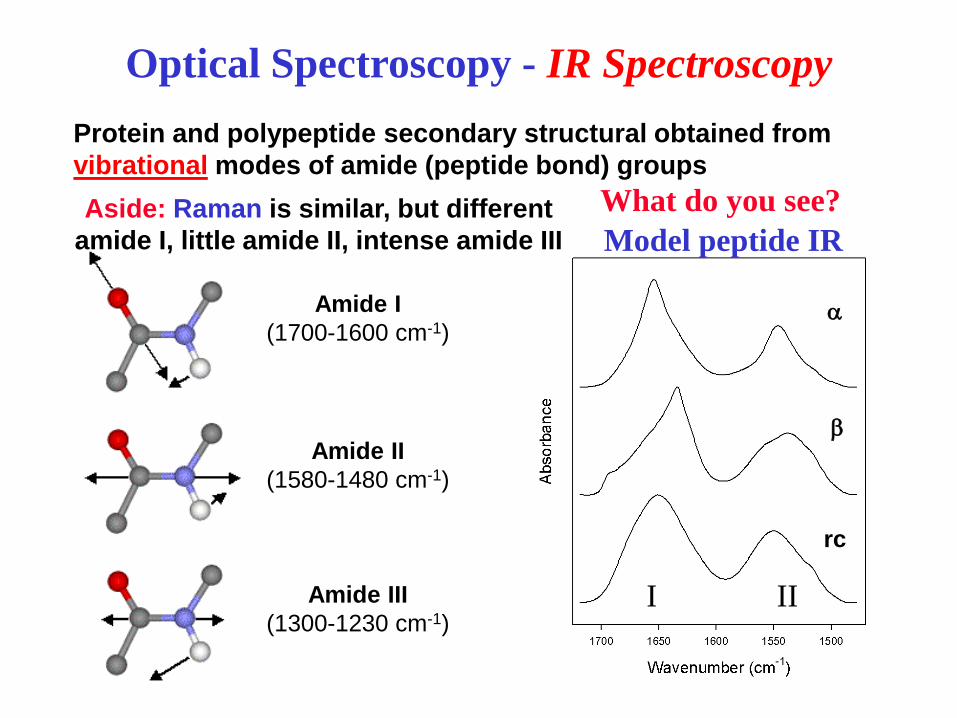
Optical Spectroscopy - IR Spectroscopy
Protein and polypeptide secondary structural obtained from
vibrational modes of amide (peptide bond) groups
Amide I
(1700-1600 cm-1)
Amide II
(1580-1480 cm-1)
Amide III
(1300-1230 cm-1) I II
a
b
rc
Aside: Raman is similar, but different
amide I, little amide II, intense amide III Model peptide IR
What do you see?
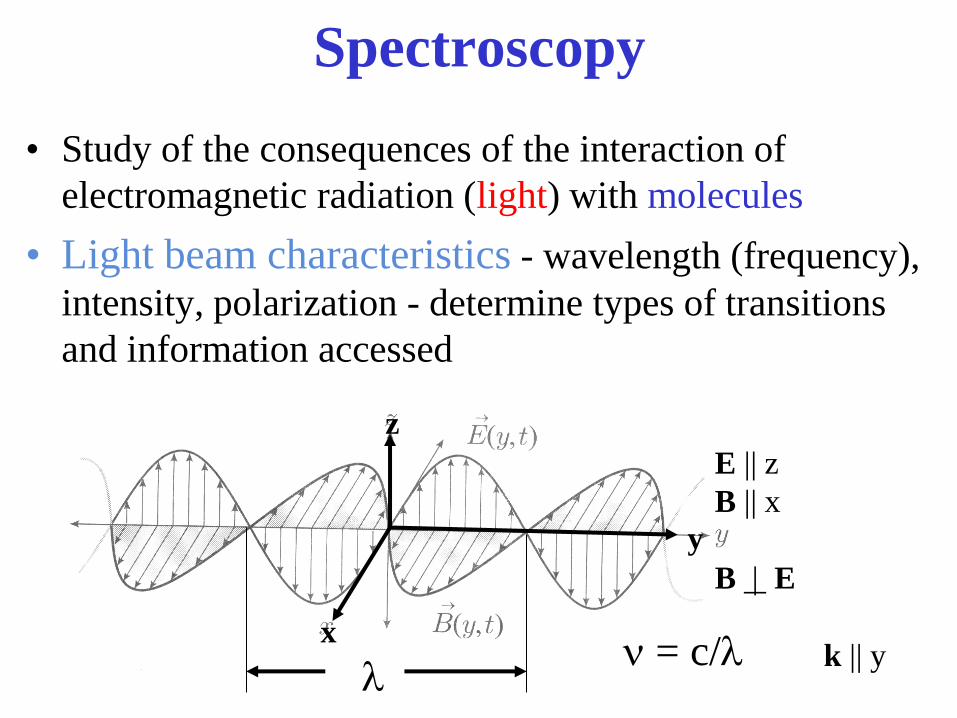
Spectroscopy
• Study of the consequences of the interaction of
electromagnetic radiation (light) with molecules
• Light beam characteristics - wavelength (frequency),
intensity, polarization - determine types of transitions
and information accessed
k || y l
E || z
B || x
B | E
n = c/l x
z
y
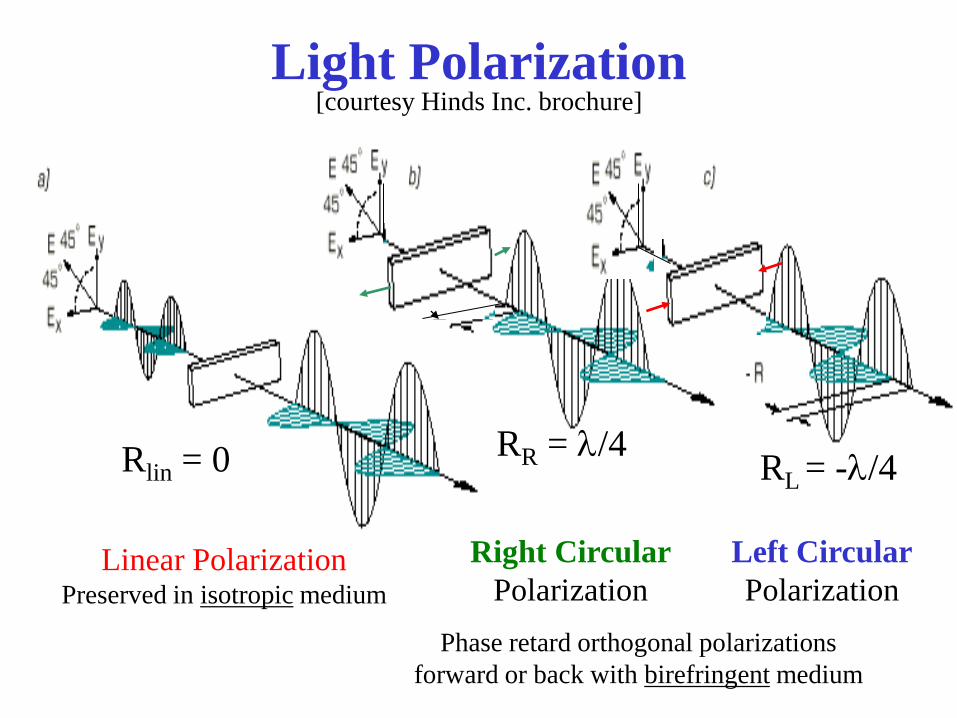
Linear Polarization Preserved in isotropic medium
Right Circular
Polarization
Left Circular
Polarization
Light Polarization
Phase retard orthogonal polarizations
forward or back with birefringent medium
[courtesy Hinds Inc. brochure]
RR = l/4 RL = -l/4 Rlin = 0
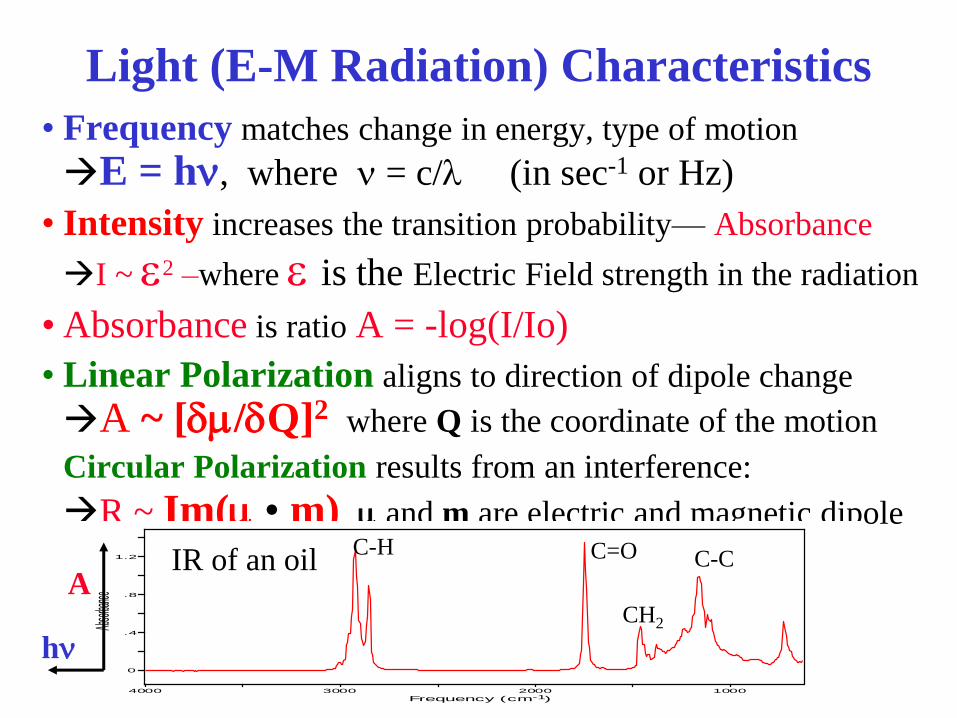
Light (E-M Radiation) Characteristics
• Frequency matches change in energy, type of motion
E = hn, where n = c/l (in sec-1 or Hz)
• Intensity increases the transition probability— Absorbance
I ~ 2 –where is the Electric Field strength in the radiation
• Absorbance is ratio A = -log(I/Io)
• Linear Polarization aligns to direction of dipole change
A ~ [dm/dQ]2 where Q is the coordinate of the motion
Circular Polarization results from an interference: R ~ Im(m • m) m and m are electric and magnetic dipole
0
.4
.8
1.2
4000 3000 2000 1000
Frequency (cm )
Absor
bance
-1
hn
A IR of an oil
C-H C=O
CH2
C-C
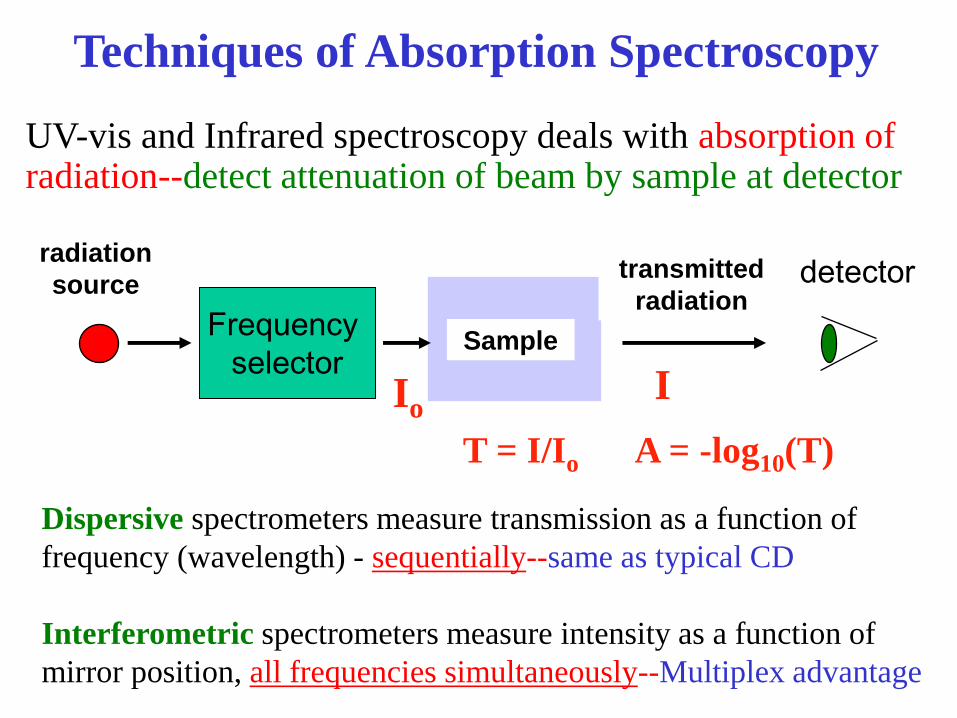
Dispersive spectrometers measure transmission as a function of
frequency (wavelength) - sequentially--same as typical CD
Interferometric spectrometers measure intensity as a function of
mirror position, all frequencies simultaneously--Multiplex advantage
Sample
radiation
source transmitted
radiation
Techniques of Absorption Spectroscopy
UV-vis and Infrared spectroscopy deals with absorption of radiation--detect attenuation of beam by sample at detector
Frequency
selector
detector
Io I
T = I/Io A = -log10(T)
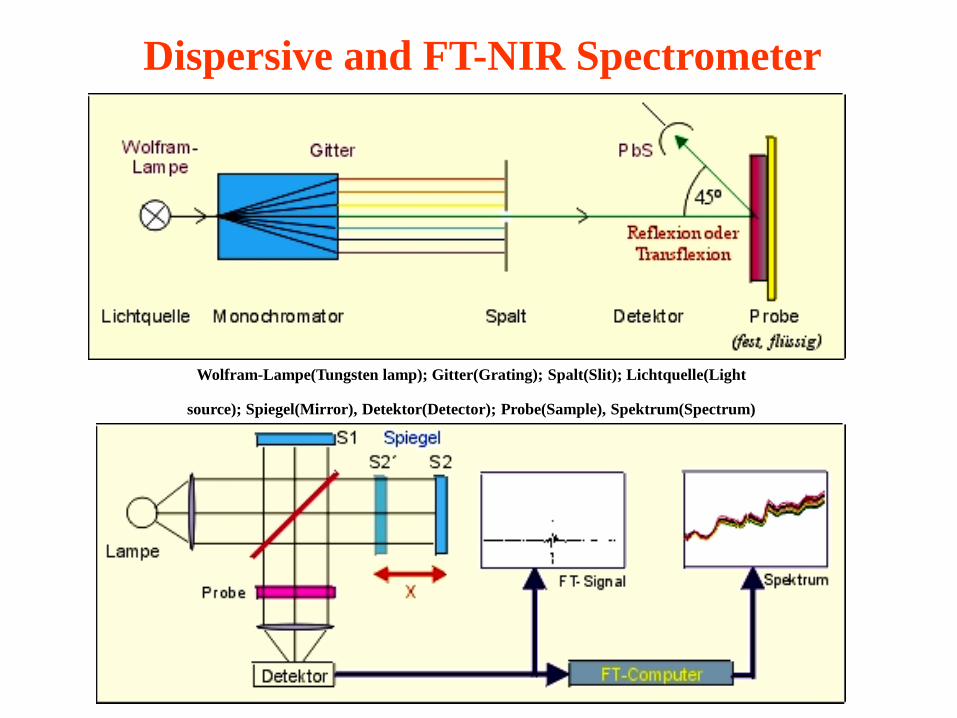
Dispersive and FT-NIR Spectrometer
Wolfram-Lampe(Tungsten lamp); Gitter(Grating); Spalt(Slit); Lichtquelle(Light
source); Spiegel(Mirror), Detektor(Detector); Probe(Sample), Spektrum(Spectrum)
Single, double or
triple monochromator
Detector:
PMT or
CCD for
multiplex
Filter
Lens
Sample
Laser
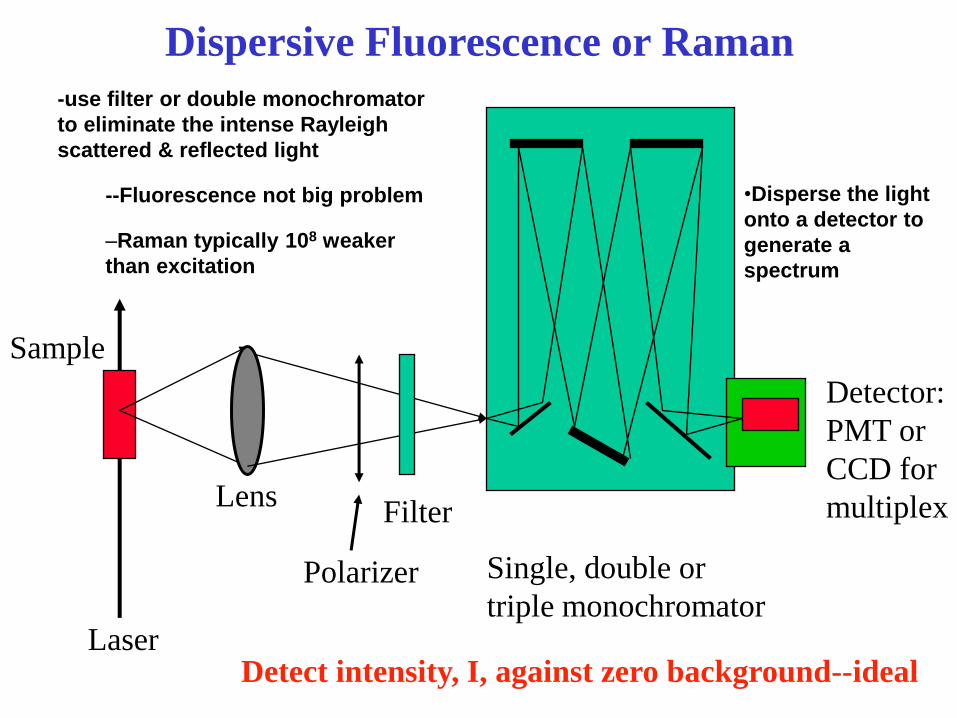
Dispersive Fluorescence or Raman
-use filter or double monochromator
to eliminate the intense Rayleigh
scattered & reflected light
--Fluorescence not big problem
–Raman typically 108 weaker
than excitation
•Disperse the light
onto a detector to
generate a
spectrum
Polarizer
Detect intensity, I, against zero background--ideal
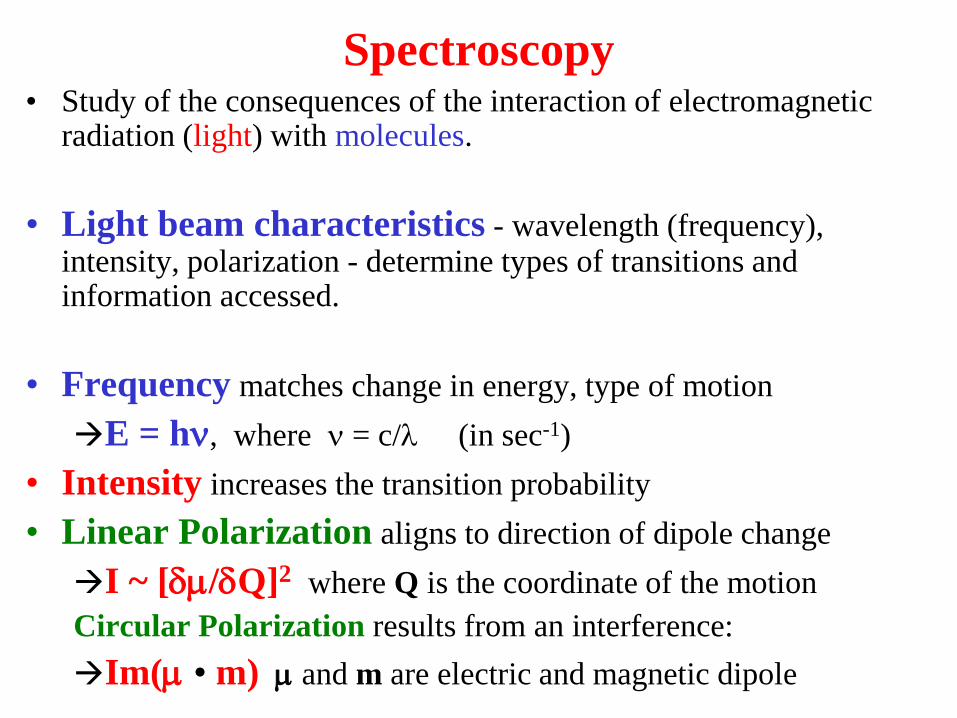
Spectroscopy • Study of the consequences of the interaction of electromagnetic
radiation (light) with molecules.
• Light beam characteristics - wavelength (frequency), intensity, polarization - determine types of transitions and information accessed.
• Frequency matches change in energy, type of motion
E = hn, where n = c/l (in sec-1)
• Intensity increases the transition probability
• Linear Polarization aligns to direction of dipole change
I ~ [dm/dQ]2 where Q is the coordinate of the motion
Circular Polarization results from an interference:
Im(m • m) m and m are electric and magnetic dipole
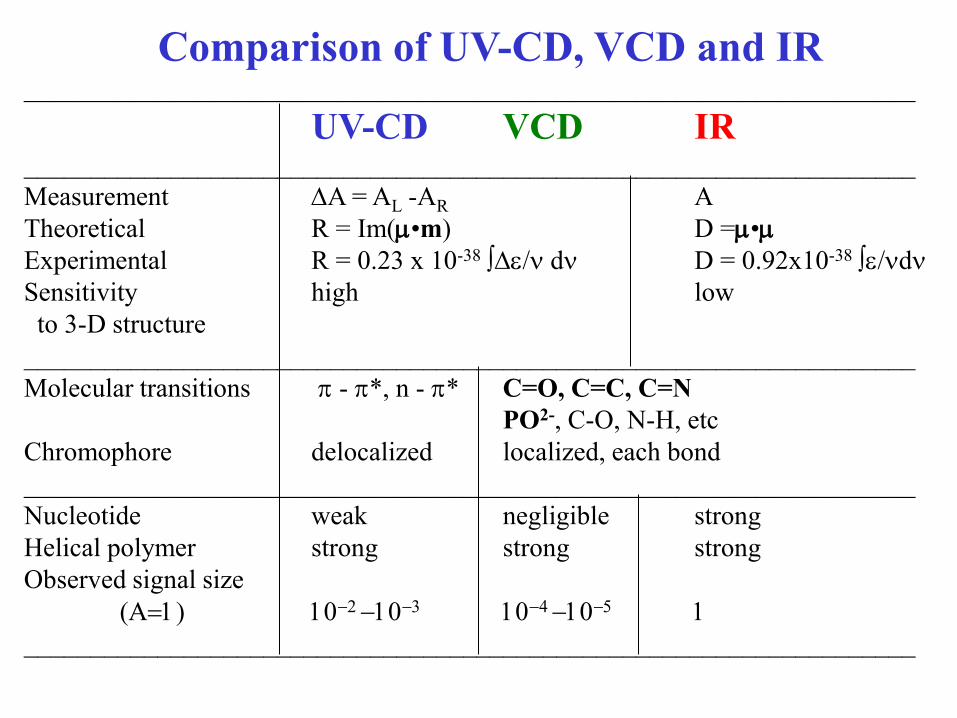
Comparison of UV-CD, VCD and IR ___________________________________________________________________
UV-CD VCD IR ___________________________________________________________________
Measurement DA = AL -AR A
Theoretical R = Im(m•m) D =m•m
Experimental R = 0.23 x 10-38 ∫D/n dn D = 0.92x10-38 ∫/ndn
Sensitivity high low
to 3-D structure
___________________________________________________________________
Molecular transitions p - p*, n - p* C=O, C=C, C=N
PO2-, C-O, N-H, etc
Chromophore delocalized localized, each bond
___________________________________________________________________
Nucleotide weak negligible strong
Helical polymer strong strong strong
Observed signal size
(A=1) 10-2 -10-3 10-4 -10-5 1
___________________________________________________________________