Embed Size (px)
Citation preview
Chapter 6:Project Time Management
Information Technology Project Management,Fourth Edition
2Information Technology Project Management, Fourth Edition
Learning Objectives
Understand the importance of project schedules and good project time management.
Define activities as the basis for developing project schedules.
Describe how project managers use network diagrams and dependencies to assist in activity sequencing.
Understand the relationship between estimating resources and project schedules.
Explain how various tools and techniques help project managers perform activity duration estimating.
3Information Technology Project Management, Fourth Edition
Learning Objectives Use a Gantt chart for planning and tracking schedule
information, find the critical path for a project, and describe how critical chain scheduling and the Program Evaluation and Review Technique (PERT) affect schedule development.
Discuss how reality checks and people issues are involved in controlling and managing changes to the project schedule.
Describe how project management software can assist in project time management and review words of caution before using this software.
4Information Technology Project Management, Fourth Edition
Importance of Project Schedules
Managers often cite delivering projects on time as one of their biggest challenges.
Fifty percent of IT projects were challenged in the 2003 CHAOS study, and their average time overrun increased to 82 percent from a low of 63 percent in 2000.*
Schedule issues are the main reason for conflicts on projects, especially during the second half of projects.
Time has the least amount of flexibility; it passes no matter what happens on a project.
*The Standish Group, “Latest Standish Group CHAOS Report Shows Project Success Rates Have Improved by 50%,” (www.standishgroup.com) (March 25, 2003).
5Information Technology Project Management, Fourth Edition
Individual Work Styles and Cultural Differences Cause
Schedule Conflicts One dimension of the Myers-Briggs Type Indicator
focuses on people’s attitudes toward structure and deadline.
Some people prefer to follow schedules and meet deadlines while others do not.
Different cultures and even entire countries have different attitudes about schedules.
6Information Technology Project Management, Fourth Edition
Project Time Management Processes
Activity definition: Identifying the specific activities that the project team members and stakeholders must perform to produce the project deliverables.
Activity sequencing: Identifying and documenting the relationships between project activities.
Activity resource estimating: Estimating how many resources a project team should use to perform project activities.
Activity duration estimating: Estimating the number of work periods that are needed to complete individual activities.
Schedule development: Analyzing activity sequences, activity resource estimates, and activity duration estimates to create the project schedule.
Schedule control: Controlling and managing changes to the project schedule.
7Information Technology Project Management, Fourth Edition
Activity Definition An activity or task is an element of work normally found
on the WBS that has an expected duration, a cost, and resource requirements.
Project schedules grow out of the basic documents that initiate a project. The project charter includes start and end dates and budget
information. The scope statement and WBS help define what will be done.
Activity definition involves developing a more detailed WBS and supporting explanations to understand all the work to be done, so you can develop realistic cost and duration estimates.
8Information Technology Project Management, Fourth Edition
Activity Lists and Attributes
An activity list is a tabulation of activities to be included on a project schedule. The list should include:
The activity name
An activity identifier or number
A brief description of the activity
Activity attributes provide more information about each activity, such as predecessors, successors, logical relationships, leads and lags, resource requirements, constraints, imposed dates, and assumptions related to the activity.
9Information Technology Project Management, Fourth Edition
Milestones A milestone is a significant event that normally has no
duration.
It often takes several activities and a lot of work to complete a milestone.
Milestones are useful tools for setting schedule goals and monitoring progress.
Examples include completion and customer sign-off on key documents and completion of specific products.
10Information Technology Project Management, Fourth Edition
Activity Sequencing
Involves reviewing activities and determining dependencies.
A dependency or relationship relates to the sequencing of project activities or tasks.
You must determine dependencies in order to use critical path analysis.
11Information Technology Project Management, Fourth Edition
Three Types of Dependencies
Mandatory dependencies: Inherent in the nature of the work being performed on a project; sometimes referred to as hard logic.
Discretionary dependencies: Defined by the project team; sometimes referred to as soft logic and should be used with care because they may limit later scheduling options.
External dependencies: Involve relationships between project and non-project activities.
12Information Technology Project Management, Fourth Edition
Network Diagrams
Network diagrams are the preferred technique for showing activity sequencing.
A network diagram is a schematic display of the logical relationships among, or sequencing of, project activities.
Two main formats are the arrow and precedence diagramming methods.
13Information Technology Project Management, Fourth Edition
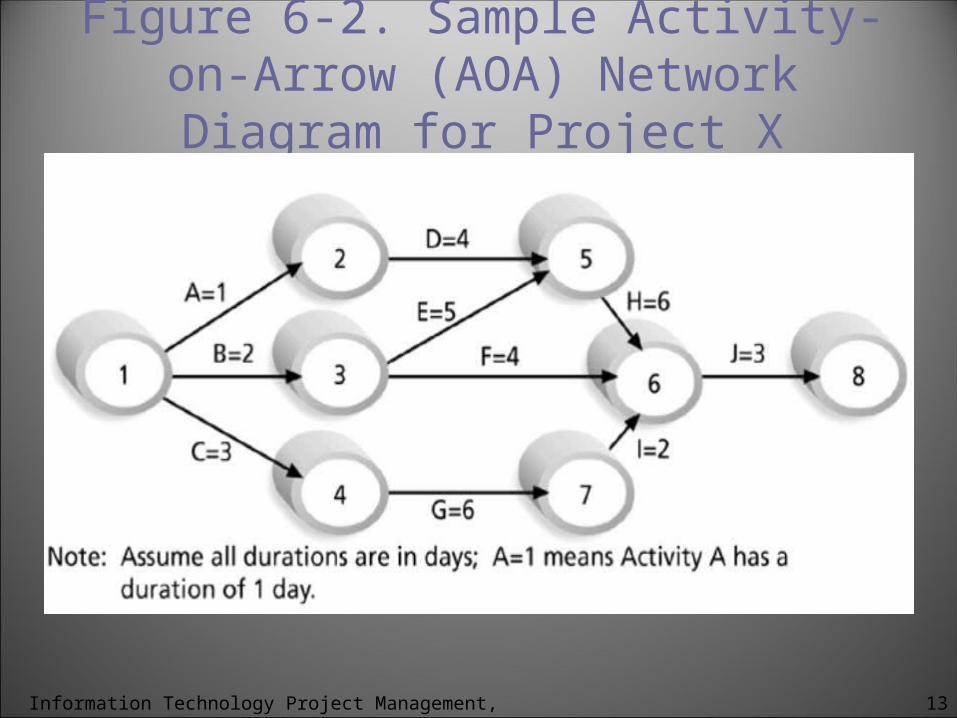
Figure 6-2. Sample Activity-on-Arrow (AOA) Network Diagram for
Project X
14Information Technology Project Management, Fourth Edition
Arrow Diagramming Method (ADM)
Also called activity-on-arrow (AOA) network diagram.
Activities are represented by arrows.
Nodes or circles are the starting and ending points of activities.
Can only show finish-to-start dependencies.
15Information Technology Project Management, Fourth Edition
Process for Creating AOA Diagrams
1. Find all of the activities that start at node 1. Draw their finish nodes and draw arrows between node 1 and those finish nodes. Put the activity letter or name and duration estimate on the associated arrow.
2. Continuing drawing the network diagram, working from left to right. Look for bursts and merges. A burst occurs when a single node is followed by two or more activities. A merge occurs when two or more nodes precede a single node.
3. Continue drawing the project network diagram until all activities that have dependencies are included in the diagram.
4. As a rule of thumb, all arrowheads should face toward the right, and no arrows should cross in an AOA network diagram.
16Information Technology Project Management, Fourth Edition
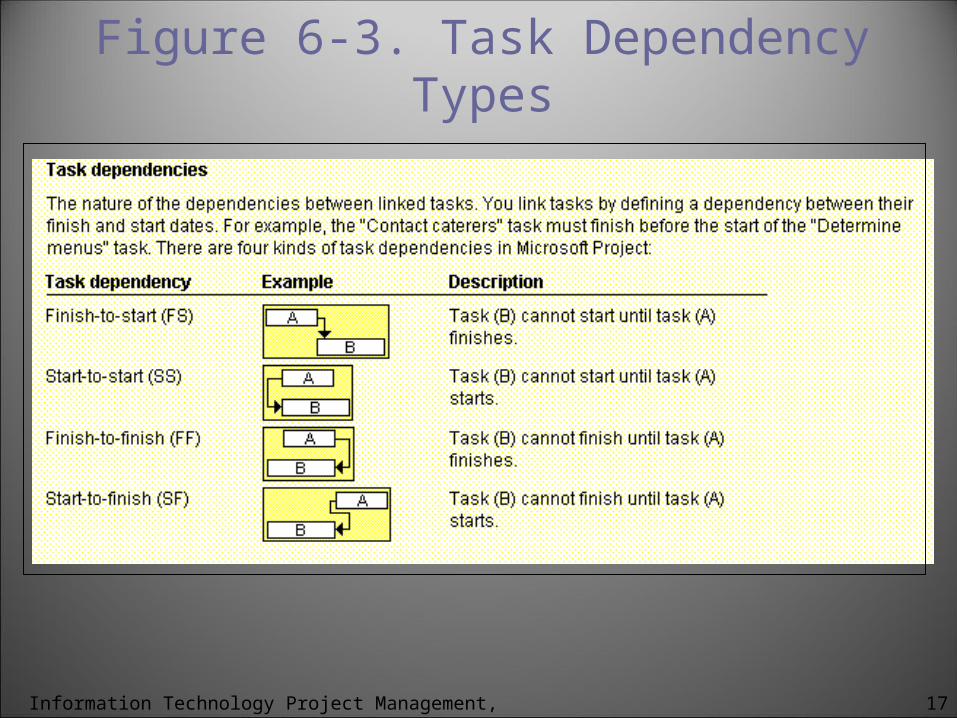
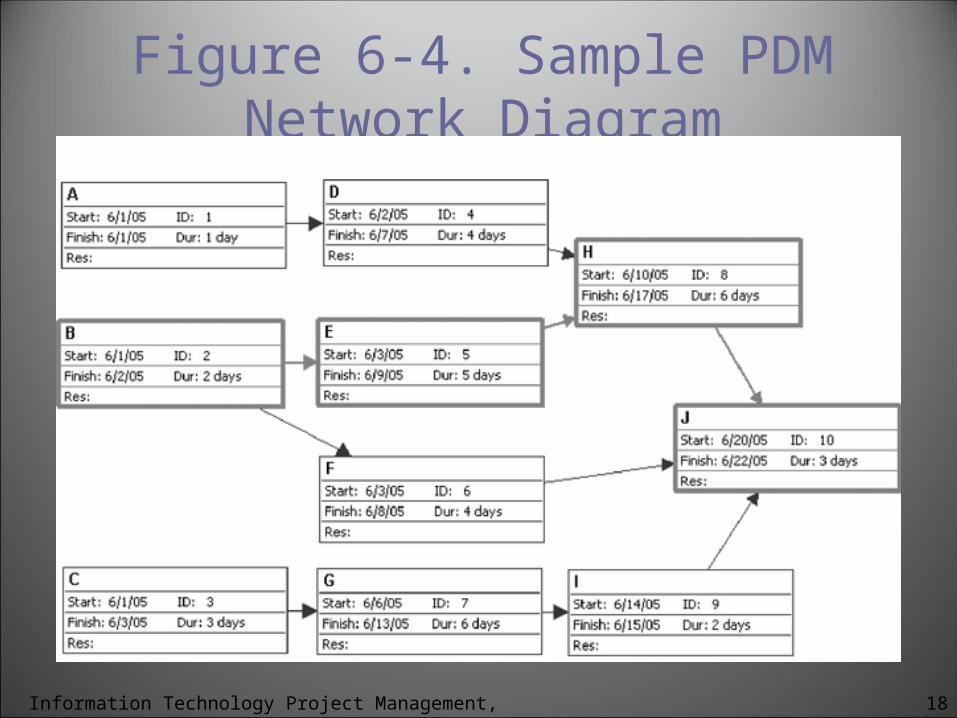
Precedence Diagramming Method (PDM)
Activities are represented by boxes.
Arrows show relationships between activities.
More popular than ADM method and used by project management software.
Better at showing different types of dependencies.
17Information Technology Project Management, Fourth Edition
Figure 6-3. Task Dependency Types
18Information Technology Project Management, Fourth Edition
Figure 6-4. Sample PDM Network Diagram
19Information Technology Project Management, Fourth Edition
Activity Resource Estimating
Before estimating activity durations, you must have a good idea of the quantity and type of resources that will be assigned to each activity.
Consider important issues in estimating resources:
How difficult will it be to complete specific activities on this project?
What is the organization’s history in doing similar activities?
Are the required resources available?
20Information Technology Project Management, Fourth Edition
Activity Duration Estimating
Duration includes the actual amount of time worked on an activity plus the elapsed time.
Effort is the number of workdays or work hours required to complete a task.
Effort does not normally equal duration.
People doing the work should help create estimates, and an expert should review them.
21Information Technology Project Management, Fourth Edition
Schedule Development Uses results of the other time management processes
to determine the start and end dates of the project.
Ultimate goal is to create a realistic project schedule that provides a basis for monitoring project progress for the time dimension of the project.
Important tools and techniques include Gantt charts, critical path analysis, critical chain scheduling, and PERT analysis.
22Information Technology Project Management, Fourth Edition
Gantt Charts
Gantt charts provide a standard format for displaying project schedule information by listing project activities and their corresponding start and finish dates in a calendar format.
Symbols include:
Black diamonds: Milestones
Thick black bars: Summary tasks
Lighter horizontal bars: Durations of tasks
Arrows: Dependencies between tasks
23Information Technology Project Management, Fourth Edition
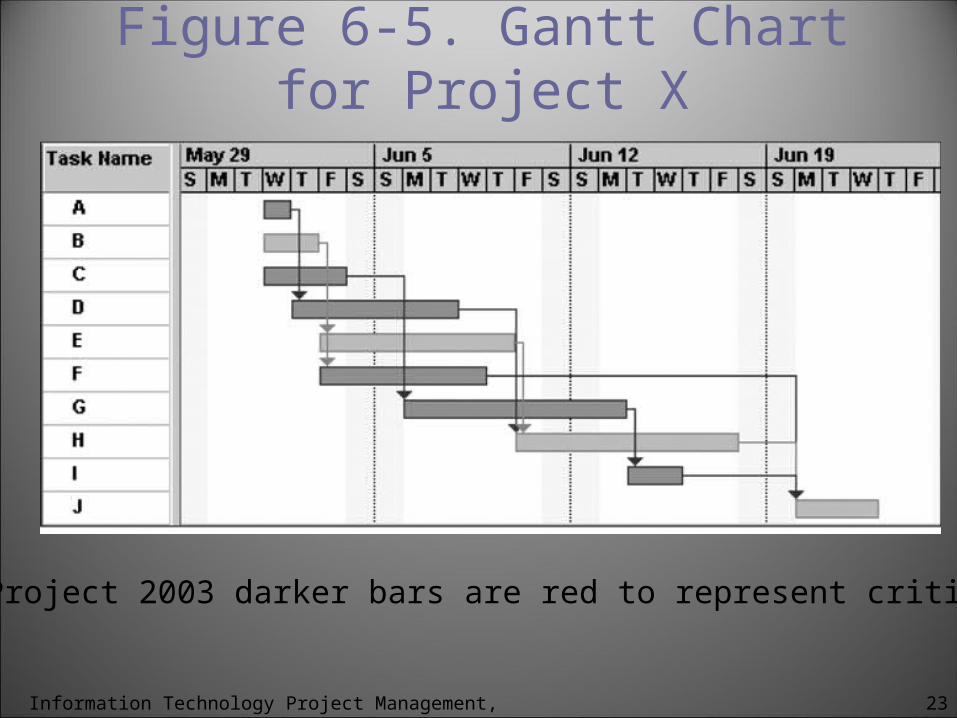
Figure 6-5. Gantt Chart for Project X
Note: In Project 2003 darker bars are red to represent critical tasks.
24Information Technology Project Management, Fourth Edition
SMART Criteria
Milestones should be:
Specific
Measurable
Assignable
Realistic
Time-framed
25Information Technology Project Management, Fourth Edition
Critical Path Method (CPM) CPM is a network diagramming technique used to
predict total project duration.
A critical path for a project is the series of activities that determines the earliest time by which the project can be completed.
The critical path is the longest path through the network diagram and has the least amount of slack or float.
Slack or float is the amount of time an activity can be delayed without delaying a succeeding activity or the project finish date.
26Information Technology Project Management, Fourth Edition
Calculating the Critical Path
Develop a good network diagram.
Add the duration estimates for all activities on each path through the network diagram.
The longest path is the critical path.
If one or more of the activities on the critical path takes longer than planned, the whole project schedule will slip unless the project manager takes corrective action.
27Information Technology Project Management, Fourth Edition
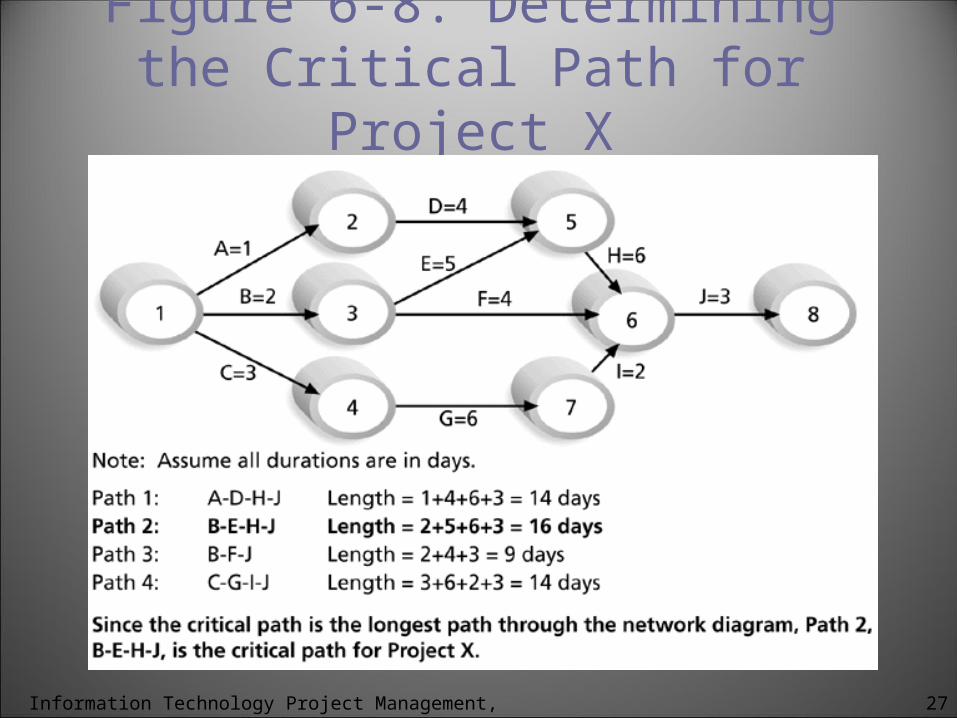
Figure 6-8. Determining the Critical Path for Project X
28Information Technology Project Management, Fourth Edition
Using Critical Path Analysis to Make Schedule Trade-
offs Free slack or free float is the amount of time an
activity can be delayed without delaying the early start of any immediately following activities.
Total slack or total float is the amount of time an activity can be delayed from its early start without delaying the planned project finish date.
A forward pass through the network diagram determines the early start and finish dates.
A backward pass determines the late start and finish dates.
29Information Technology Project Management, Fourth Edition
Using the Critical Path to Shorten a Project Schedule
Three main techniques for shortening schedules:
Shortening the duration of critical activities or tasks by adding more resources or changing their scope.
Crashing activities by obtaining the greatest amount of schedule compression for the least incremental cost.
Fast tracking activities by doing them in parallel or overlapping them.
30Information Technology Project Management, Fourth Edition
Importance of Updating Critical
Path Data It is important to update project schedule information
to meet time goals for a project.
The critical path may change as you enter actual start and finish dates.
If you know the project completion date will slip, negotiate with the project sponsor.
31Information Technology Project Management, Fourth Edition
Critical Chain Scheduling Critical chain scheduling is a method of scheduling
that considers limited resources when creating a project schedule and includes buffers to protect the project completion date.
Uses the Theory of Constraints (TOC), a management philosophy developed by Eliyahu M. Goldratt and introduced in his book The Goal.
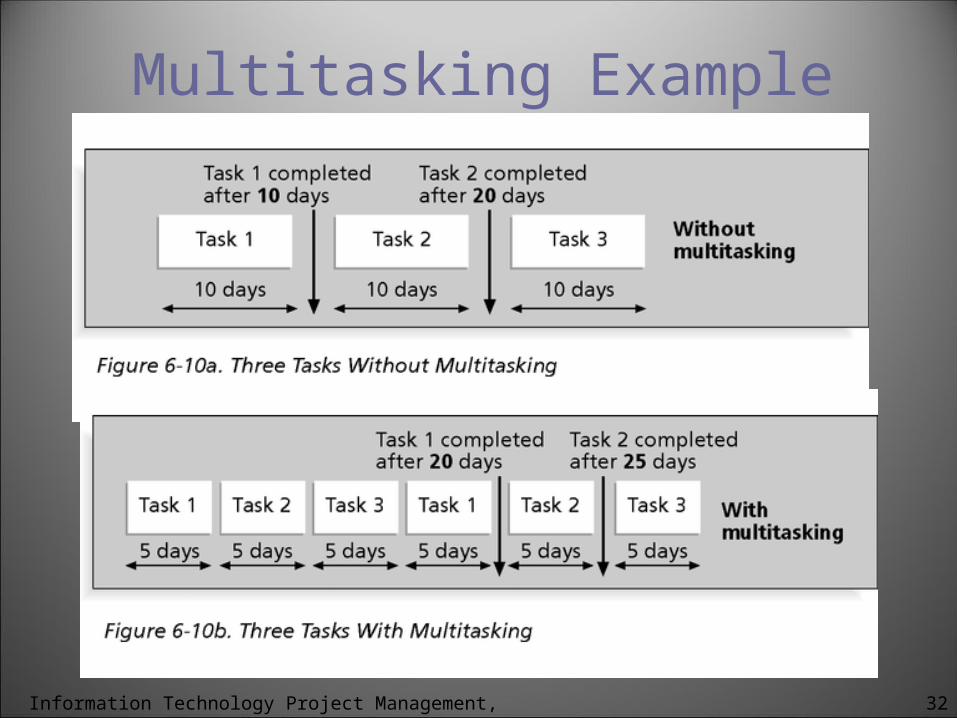
Attempts to minimize multitasking, which occurs when a resource works on more than one task at a time.
32Information Technology Project Management, Fourth Edition
Multitasking Example
33Information Technology Project Management, Fourth Edition
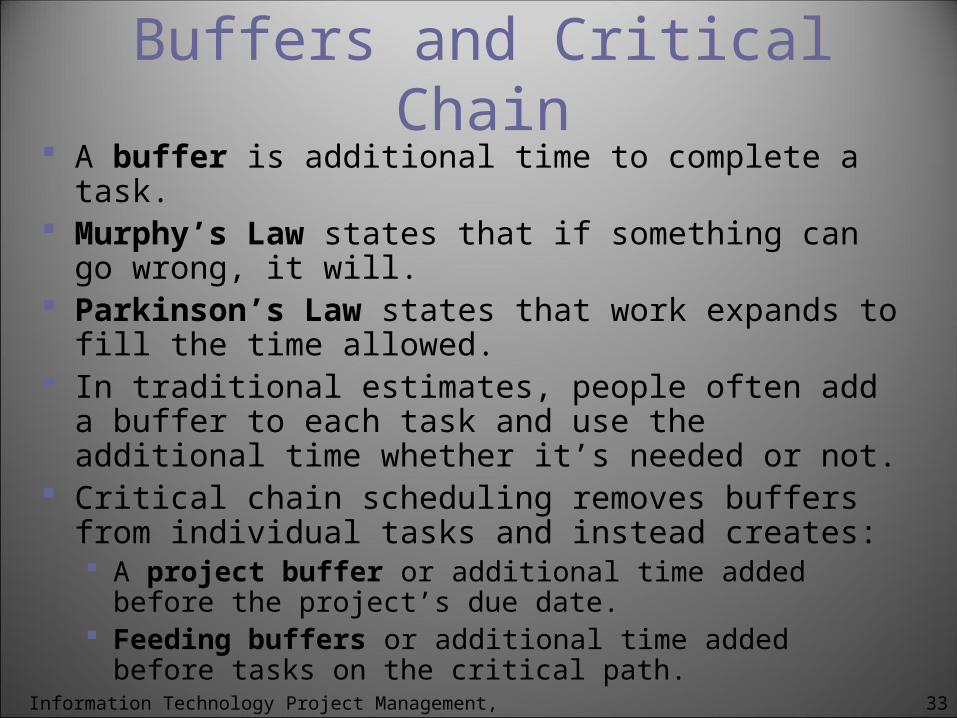
Buffers and Critical Chain A buffer is additional time to complete a task. Murphy’s Law states that if something can go wrong, it
will. Parkinson’s Law states that work expands to fill the time
allowed. In traditional estimates, people often add a buffer to each
task and use the additional time whether it’s needed or not. Critical chain scheduling removes buffers from individual
tasks and instead creates: A project buffer or additional time added before the project’s
due date. Feeding buffers or additional time added before tasks on the
critical path.
34Information Technology Project Management, Fourth Edition
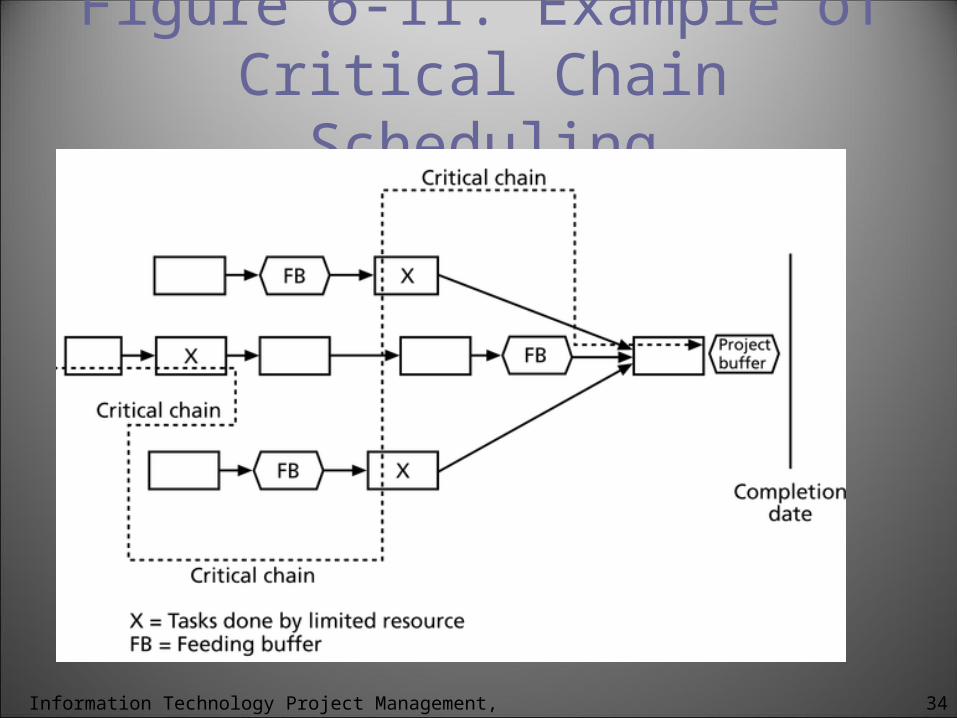
Figure 6-11. Example of Critical Chain Scheduling
35Information Technology Project Management, Fourth Edition
Program Evaluation and Review Technique (PERT)
PERT is a network analysis technique used to estimate project duration when there is a high degree of uncertainty about the individual activity duration estimates.
PERT uses probabilistic time estimates:
Duration estimates based on using optimistic, most likely, and pessimistic estimates of activity durations, or a three-point estimate.
36Information Technology Project Management, Fourth Edition
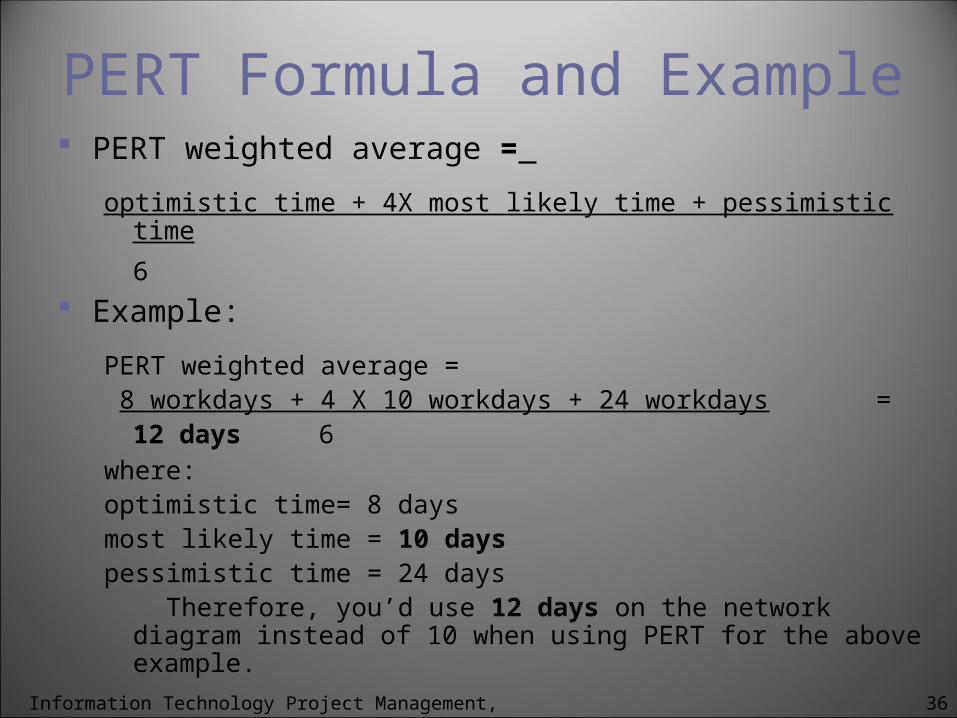
PERT Formula and Example PERT weighted average =
optimistic time + 4X most likely time + pessimistic time
6
Example:
PERT weighted average =
8 workdays + 4 X 10 workdays + 24 workdays = 12 days
6
where: optimistic time= 8 daysmost likely time = 10 dayspessimistic time = 24 days Therefore, you’d use 12 days on the network diagram instead of 10 when
using PERT for the above example.
37Information Technology Project Management, Fourth Edition
Schedule Control Goals are to know the status of the schedule, influence
factors that cause schedule changes, determine that the schedule has changed, and manage changes when they occur.
Tools and techniques include: Progress reports. A schedule change control system. Project management software, including schedule comparison
charts, such as the tracking Gantt chart. Variance analysis, such as analyzing float or slack. Performance management, such as earned value (see Chapter 7).
38Information Technology Project Management, Fourth Edition
Working with People Issues
Strong leadership helps projects succeed more than good PERT charts do.
Project managers should use:
Empowerment
Incentives
Discipline
Negotiation
39Information Technology Project Management, Fourth Edition
Chapter Summary Project time management is often cited as the main
source of conflict on projects, and most IT projects exceed time estimates.
Main processes include: Activity definition Activity sequencing Activity resource estimating Activity duration estimating Schedule development Schedule control
40Information Technology Project Management, Fourth Edition
THANK YOU