Embed Size (px)
Citation preview
Time-Lapse Imagery of the Breaching of Marmot Dam, Oregon, and Subsequent Erosion of Sediment by the Sandy River—October 2007 to May 2008
U.S. Department of the InteriorU.S. Geological Survey
Data Series 521

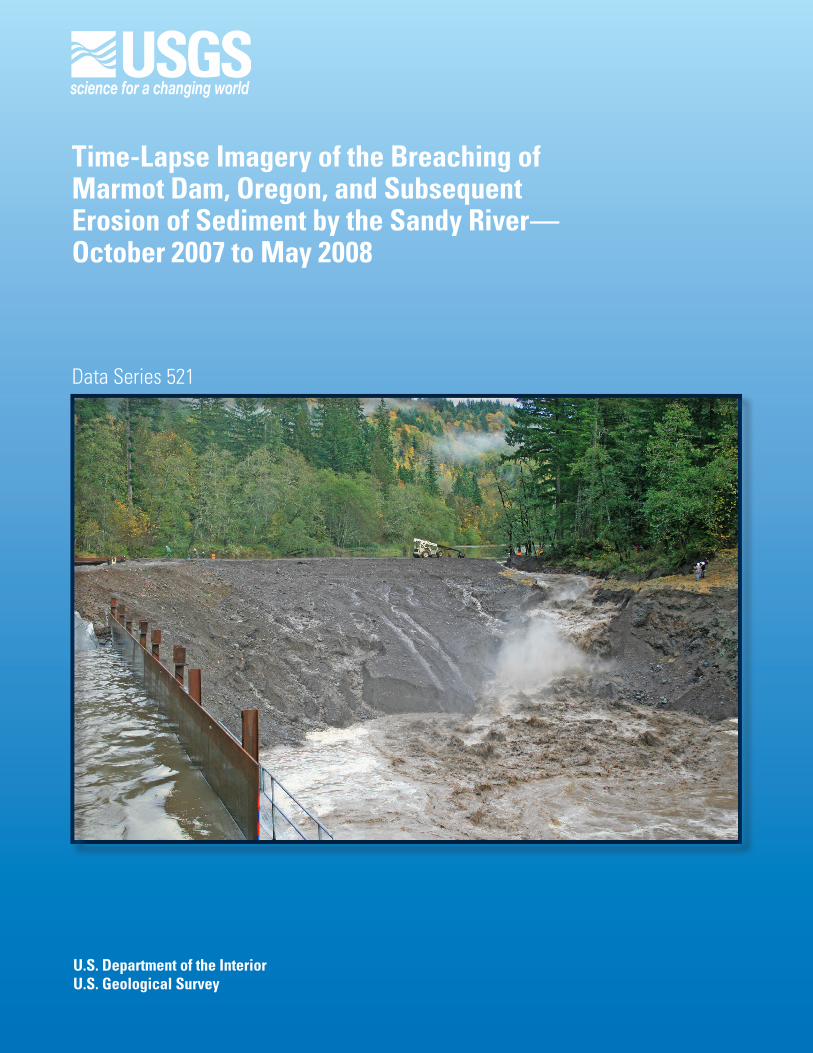
FRONT COVERPhotograph of Marmot Dam, Oregon.
Time-Lapse Imagery of the Breaching of Marmot Dam, Oregon, and Subsequent Erosion of Sediment by the Sandy River—October 2007 to May 2008
By Jon J. Major, Kurt R. Spicer, and Rebecca A. Collins
Data Series 521
U.S. Department of the InteriorU.S. Geological Survey
U.S. Department of the InteriorKEN SALAZAR, Secretary
U.S. Geological SurveyMarcia K. McNutt, Director
U.S. Geological Survey, Reston, Virginia: 2010
For product and ordering information:World Wide Web: http://www.usgs.gov/pubprodTelephone: 1-888-ASK-USGSFor more information on the USGS—the Federal source for science about the Earth,its natural and living resources, natural hazards, and the environment:World Wide Web: http://www.usgs.govTelephone: 1-888-ASK-USGS
Suggested citation:Major, Jon J., Spicer, Kurt R., and Collins, Rebecca A., 2010, Time-lapse imagery of the breaching of Marmot Dam, Oregon, and subsequent erosion of sediment by the Sandy River—October 2007 to May 2008: U.S. Geological Survey Data Series 521, 5 p. Available at http://pubs.usgs.gov/ds/521/
Any use of trade, product, or firm names is for descriptive purposes only and does not imply endorsement by the U.S. Government.
Although this report is in the public domain, permission must be secured from the individual copyright owners to reproduce any copyrighted material contained within this report.
i
Contents
Abstract ...........................................................................................................................................................1Introduction ....................................................................................................................................................1Cameras and Camera Network ...................................................................................................................2
Camera Network ...................................................................................................................................2Cameras..................................................................................................................................................3Photograph Intervals ............................................................................................................................3
Time-Lapse Movies........................................................................................................................................4Description of Time-lapse Movie Content ........................................................................................4
References Cited............................................................................................................................................5
Figures
1. Map of the Sandy River Basin showing the location of Marmot Dam .........................................12. Location of cameras placed around lower Marmot Dam reservoir ....................................................23. Example of camera system used to obtain imagery. ............................................................................2
Tables
1. Installation dates, photograph intervals, and focal lengths of cameras stationed around Marmot Dam reservoir. .........................................................................................................1

ii
This page left intentionally blank.
Time-Lapse Imagery of the Breaching of Marmot Dam, Oregon, and Subsequent Erosion of Sediment by the Sandy River—October 2007 to May 2008
By Jon J. Major, Kurt R. Spicer, and Rebecca A. Collins
AbstractIn 2007, Marmot Dam on the Sandy River, Oregon, was
removed and a temporary cofferdam standing in its place was breached, allowing the river to flow freely along its entire length. Time-lapse imagery obtained from a network of digital single-lens reflex cameras placed around the lower reach of the sediment-filled reservoir behind the dam details rapid erosion of sediment by the Sandy River after breaching of the cofferdam. Within hours of the breaching, the Sandy River eroded much of the nearly 15-m-thick frontal part of the sediment wedge impounded behind the former concrete dam; within 24-60 hours it eroded approximately 125,000 m3 of sediment impounded in the lower 300-meter-reach of the reservoir. The imagery shows that the sediment eroded initially through vertical incision, but that lateral erosion rapidly became an important process.
Introduction On October 19, 2007, a temporary cofferdam standing in
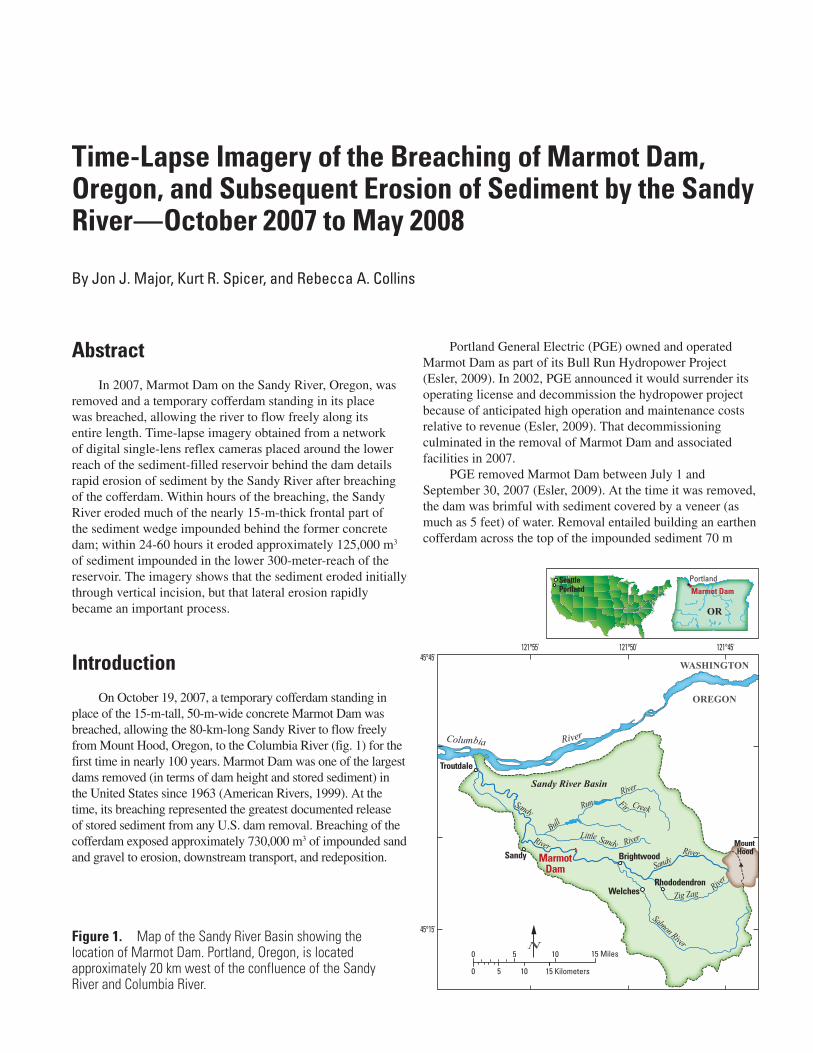
place of the 15-m-tall, 50-m-wide concrete Marmot Dam was breached, allowing the 80-km-long Sandy River to flow freely from Mount Hood, Oregon, to the Columbia River (fig. 1) for the first time in nearly 100 years. Marmot Dam was one of the largest dams removed (in terms of dam height and stored sediment) in the United States since 1963 (American Rivers, 1999). At the time, its breaching represented the greatest documented release of stored sediment from any U.S. dam removal. Breaching of the cofferdam exposed approximately 730,000 m3 of impounded sand and gravel to erosion, downstream transport, and redeposition.
Figure 1. Map of the Sandy River Basin showing the location of Marmot Dam. Portland, Oregon, is located approximately 20 km west of the confluence of the Sandy River and Columbia River.
Portland General Electric (PGE) owned and operated Marmot Dam as part of its Bull Run Hydropower Project (Esler, 2009). In 2002, PGE announced it would surrender its operating license and decommission the hydropower project because of anticipated high operation and maintenance costs relative to revenue (Esler, 2009). That decommissioning culminated in the removal of Marmot Dam and associated facilities in 2007.
PGE removed Marmot Dam between July 1 and September 30, 2007 (Esler, 2009). At the time it was removed, the dam was brimful with sediment covered by a veneer (as much as 5 feet) of water. Removal entailed building an earthen cofferdam across the top of the impounded sediment 70 m
0
Sandy River Basin
WASHINGTON
OREGON
N0 5 10 15 Miles
5 10 15 Kilometers
Columbia River
45°15'
45°45'121°55' 121°50' 121°45'
Troutdale
WelchesRhododendron
Sandy BrightwoodMarmotDam
Mount HoodRiver
RiverRiver
River
Bull
Run
Sandy
Sandy
Sandy
Fir Creek
Little
Zig Zag River
Salmon River
SeattlePortland
PortlandMarmot Dam
OR
2 Time-Lapse Imagery of the Breaching of Mamot Dam, Oregon, and Subsequent Erosion of Sediment by the Sandy River
upstream of the concrete structure, diverting the Sandy River around both the coffer and concrete dams, installing wells and pumps to dewater and stabilize the cofferdam and underlying sediment, removing about 20,000 m3 of sediment between the coffer and concrete dams, and then demolishing and removing the concrete structure. Once the concrete dam was removed, the cofferdam could be breached.
Heavy rainfall, a rising river, and a discharge forecast for 68 m3/s prompted PGE to initiate the breaching process at about 1000 Pacific daylight time (PDT) on October 19, 2007. Pumps dewatering the cofferdam and underlying sediment were shut off and removed beginning about 1200 PDT. At about 1330 PDT, water began seeping through the earthen dam, triggering small but growing mass failures on its downstream face (Major and others, 2008). At about 1700 PDT, with the river flowing at nearly 50 m3/s, the cofferdam crest was intentionally notched and water began spilling. An initial channel about 2 to 3 m wide and 1 m deep developed at the dam crest and on the dam face (Grant and others, 2008). By 1720 the notch was 3 to 4 m wide and about 1 to 2 m deep, and the channel on the dam face had developed multiple 2- to 3-m-high steps. The steps on the dam face migrated upstream at a rate of as much as meters per minute (Grant and others, 2008), but the notch at the dam crest did not actively incise until 1745 PDT, when the steps on the dam face coalesced, intercepted the dam crest, and formed a few-meters-high knickpoint that then migrated rapidly upstream. At that time, flow vigorously enlarged the breach and rapidly released the small volume of impounded water (see Major and others, 2008). By 1800 PDT, the river had incised vertically through the earthen dam; it then began eroding laterally, and by 2330 PDT had removed the dam completely.
The fluvial response of the Sandy River to breaching of the cofferdam and sudden exposure to a large quantity of coarse, unconsolidated sediment was monitored intensively. Part of
the removal and postremoval monitoring effort included time-lapse photographic documentation of erosion of the temporary cofferdam and consequent erosion of the stored sediment. This report provides time-lapse imagery from several cameras placed around the valley reach where the thickest part of the impounded sediment was stored. Detailed discussions of the dam breach and consequent fluvial response can be found in Major and others (2008), O’Connor and others (2008), Grant and others (2008), Wallick and others (2008), Keith and others (2009), Podolak and
Wilcock (2009), and Major and others (2010).
Cameras and Camera Network
Camera Network
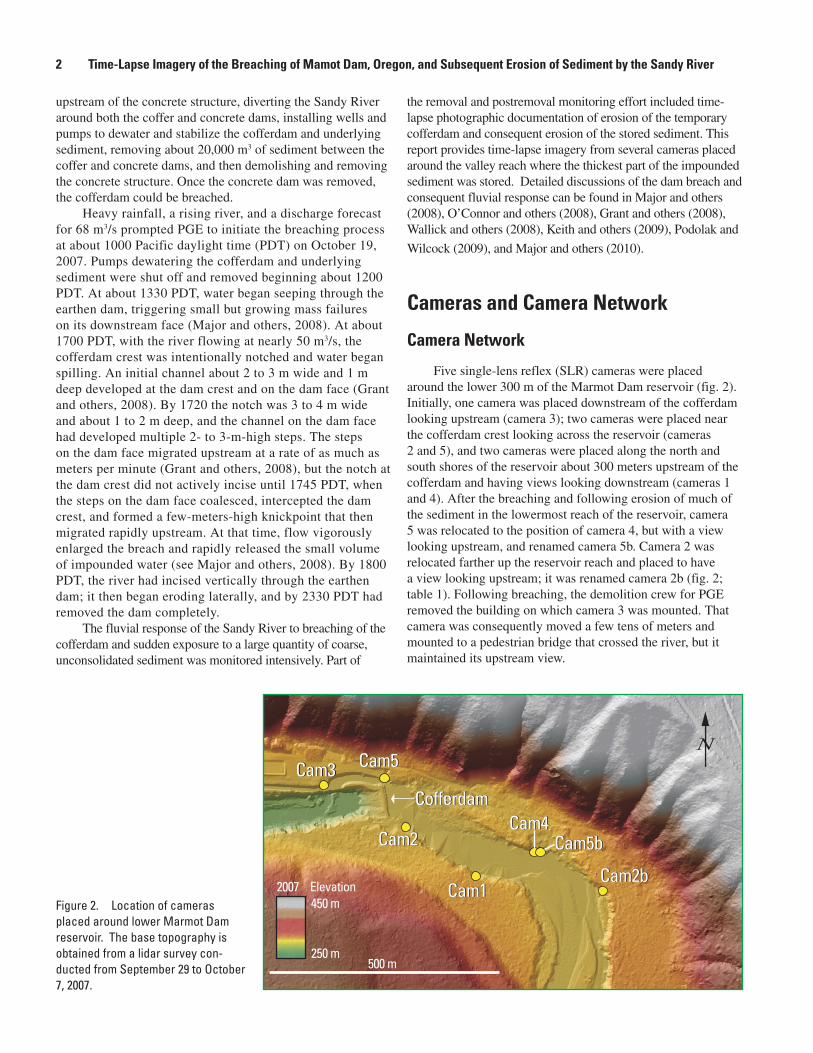
Five single-lens reflex (SLR) cameras were placed around the lower 300 m of the Marmot Dam reservoir (fig. 2). Initially, one camera was placed downstream of the cofferdam looking upstream (camera 3); two cameras were placed near the cofferdam crest looking across the reservoir (cameras 2 and 5), and two cameras were placed along the north and south shores of the reservoir about 300 meters upstream of the cofferdam and having views looking downstream (cameras 1 and 4). After the breaching and following erosion of much of the sediment in the lowermost reach of the reservoir, camera 5 was relocated to the position of camera 4, but with a view looking upstream, and renamed camera 5b. Camera 2 was relocated farther up the reservoir reach and placed to have a view looking upstream; it was renamed camera 2b (fig. 2; table 1). Following breaching, the demolition crew for PGE removed the building on which camera 3 was mounted. That camera was consequently moved a few tens of meters and mounted to a pedestrian bridge that crossed the river, but it maintained its upstream view.
Cofferdam
Cam5
Cam2Cam4
Cam5b
Cam1Cam2b
Cam3 Cam5
Cofferdam
Cam2Cam4
Cam5b
Cam1Cam2b
Cam3N
500 m
2007 Elevation450 m
250 m
Figure 2. Location of cameras placed around lower Marmot Dam reservoir. The base topography is obtained from a lidar survey con-ducted from September 29 to October 7, 2007.
Cameras and Camera Network 3
Table 1. Installation dates, photograph intervals, and focal lengths of cameras stationed around Marmot Dam reservoir.
[All images were captured at 3,888 x 2,592 pixel resolution.]
Station No.
Date(mm-dd-yyyy)
Time(local)
Photograph interval
(minutes)
Camera focal length
(mm)Comments
1 10-01-2007 1320 60 28 installed
10-19-2007 1354 10 28 interval changed
10-20-2007 1550 30 28 interval changed
11-19-2007 1416 30 18 focal length changed
05-18-2008 0449 30 18 last image
2 10-1-2007 1206 60 18 installed
10-19-2007 1349 10 18 interval changed
10-20-2007 1541 30 18 interval changed
11-07-2007 1342 30 18 camera removed
2b 11-08-2007 1541 30 18 installed
06-12-2008 0913 30 18 last image
3 09-28-2007 1204 60 27 installed
10-19-2007 1334 10 27 interval changed
10-20-2007 1530 30 27 interval changed
02-06-2008 1210 30 27 camera moved
05-13-2008 1730 30 27 view changed
05-17-2008 1200 30 27 last image
4 10-05-2007 1218 60 28 installed
10-19-2007 1828 20 28 interval changed
10-20-2007 1512 30 28 interval changed
05-19-2008 1612 30 28 last image
5 09-29-2007 1428 60 28 installed
10-19-2007 1341 10 28 interval changed
10-20-2007 1524 30 28 interval changed
10-26-2007 0954 30 28 camera removed
5b 10-26-2007 1258 30 18 installed
05-29-2008 1028 30 18 last image
Cameras
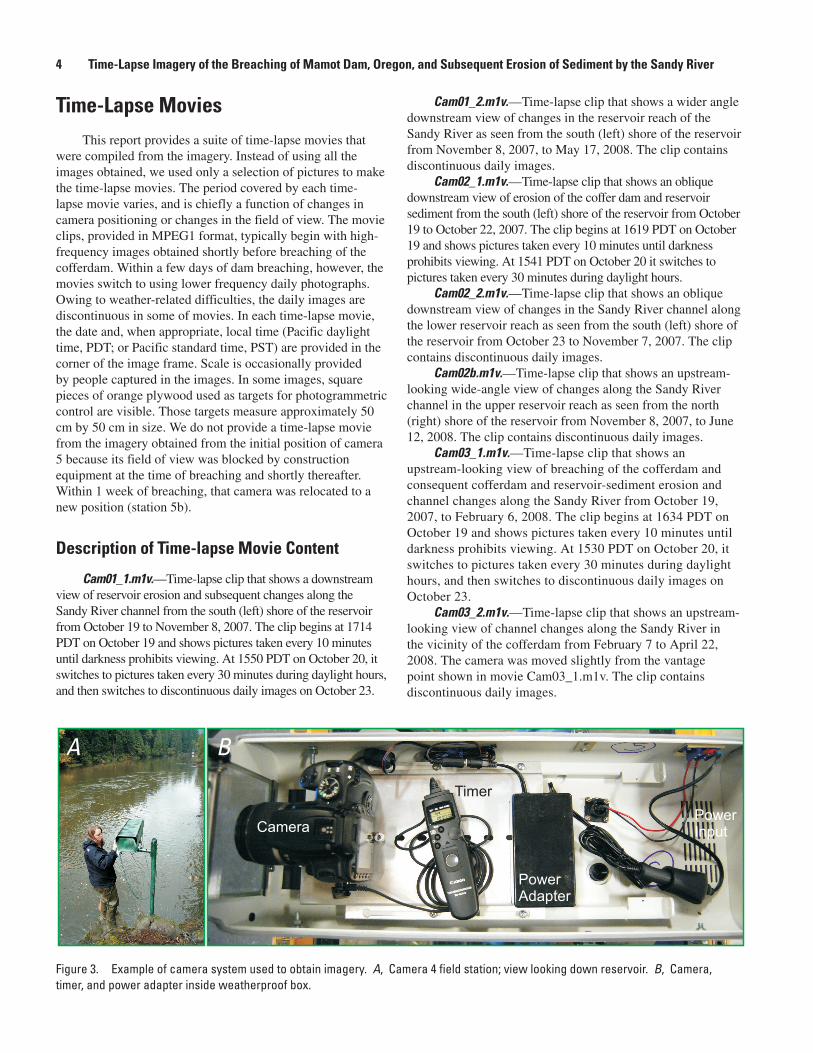
We used Canon Rebel XTi digital SLR cameras having 10-megapixel resolution for this study. Each camera was driven by an external timer (a modified Canon TC-80N3 camera controller) that could be set to take photographs at a desired interval. Each camera was powered by an external 12VDC deep-cycle battery via a 12VDC adapter, and each was enclosed in an environmental housing (fig. 3). Full-resolution images (3,888 x 2,592 pixels) were stored onsite within each camera on 8GB compact flash cards. Depending on the photograph interval chosen, storage cards needed to be changed at intervals ranging from a few weeks to a few months.
Photograph Intervals
Initially, each camera was set to take one photograph per hour. Shortly before the breaching, however, the camera controllers were reset to take pictures more frequently (table 1). Cameras 1, 2, 3, and 5 were set to take pictures every 10 minutes, and camera 4 was set to take pictures every 20 minutes because it was in a less accessible location than were the other cameras. Image acquisition was not synchronized among the cameras, however. On the afternoon of October 20, 2007, the day following the breach, camera controllers were again reset to take pictures every 30 minutes. The cameras continued to take pictures every 30 minutes until they were pulled from the site in May and June 2008.
4 Time-Lapse Imagery of the Breaching of Mamot Dam, Oregon, and Subsequent Erosion of Sediment by the Sandy River
Camera
PowerAdapter
PowerInput
Timer
A B
Figure 3. Example of camera system used to obtain imagery. A, Camera 4 field station; view looking down reservoir. B, Camera, timer, and power adapter inside weatherproof box.
Time-Lapse MoviesThis report provides a suite of time-lapse movies that
were compiled from the imagery. Instead of using all the images obtained, we used only a selection of pictures to make the time-lapse movies. The period covered by each time-lapse movie varies, and is chiefly a function of changes in camera positioning or changes in the field of view. The movie clips, provided in MPEG1 format, typically begin with high-frequency images obtained shortly before breaching of the cofferdam. Within a few days of dam breaching, however, the movies switch to using lower frequency daily photographs. Owing to weather-related difficulties, the daily images are discontinuous in some of movies. In each time-lapse movie, the date and, when appropriate, local time (Pacific daylight time, PDT; or Pacific standard time, PST) are provided in the corner of the image frame. Scale is occasionally provided by people captured in the images. In some images, square pieces of orange plywood used as targets for photogrammetric control are visible. Those targets measure approximately 50 cm by 50 cm in size. We do not provide a time-lapse movie from the imagery obtained from the initial position of camera 5 because its field of view was blocked by construction equipment at the time of breaching and shortly thereafter. Within 1 week of breaching, that camera was relocated to a new position (station 5b).
Description of Time-lapse Movie Content
Cam01_1.m1v.—Time-lapse clip that shows a downstream view of reservoir erosion and subsequent changes along the Sandy River channel from the south (left) shore of the reservoir from October 19 to November 8, 2007. The clip begins at 1714 PDT on October 19 and shows pictures taken every 10 minutes until darkness prohibits viewing. At 1550 PDT on October 20, it switches to pictures taken every 30 minutes during daylight hours, and then switches to discontinuous daily images on October 23.
Cam01_2.m1v.—Time-lapse clip that shows a wider angle downstream view of changes in the reservoir reach of the Sandy River as seen from the south (left) shore of the reservoir from November 8, 2007, to May 17, 2008. The clip contains discontinuous daily images.
Cam02_1.m1v.—Time-lapse clip that shows an oblique downstream view of erosion of the coffer dam and reservoir sediment from the south (left) shore of the reservoir from October 19 to October 22, 2007. The clip begins at 1619 PDT on October 19 and shows pictures taken every 10 minutes until darkness prohibits viewing. At 1541 PDT on October 20 it switches to pictures taken every 30 minutes during daylight hours.
Cam02_2.m1v.—Time-lapse clip that shows an oblique downstream view of changes in the Sandy River channel along the lower reservoir reach as seen from the south (left) shore of the reservoir from October 23 to November 7, 2007. The clip contains discontinuous daily images.
Cam02b.m1v.—Time-lapse clip that shows an upstream-looking wide-angle view of changes along the Sandy River channel in the upper reservoir reach as seen from the north (right) shore of the reservoir from November 8, 2007, to June 12, 2008. The clip contains discontinuous daily images.
Cam03_1.m1v.—Time-lapse clip that shows an upstream-looking view of breaching of the cofferdam and consequent cofferdam and reservoir-sediment erosion and channel changes along the Sandy River from October 19, 2007, to February 6, 2008. The clip begins at 1634 PDT on October 19 and shows pictures taken every 10 minutes until darkness prohibits viewing. At 1530 PDT on October 20, it switches to pictures taken every 30 minutes during daylight hours, and then switches to discontinuous daily images on October 23.
Cam03_2.m1v.—Time-lapse clip that shows an upstream-looking view of channel changes along the Sandy River in the vicinity of the cofferdam from February 7 to April 22, 2008. The camera was moved slightly from the vantage point shown in movie Cam03_1.m1v. The clip contains discontinuous daily images.
References Cited 5
Cam03_3.m1v.—Time-lapse clip that shows an upstream-looking view of channel changes along the Sandy River in the vicinity of the cofferdam from April 23 to May 12, 2008. The camera was apparently bumped and shows a slightly different field of view from that shown in movie Cam03_2.m1v. The clip contains discontinuous daily images.
Cam04.m1v.—Time-lapse clip that shows a downstream-looking view of reservoir erosion and subsequent changes along the Sandy River channel from the north (right) shore of the reservoir from October 19, 2007, to May 19, 2008. The clip begins at 1518 PDT on October 19 and shows pictures taken every 60 minutes. At 1818 PDT it switches to pictures taken every 20 minutes until darkness prohibits viewing. At 1512 PDT on October 20, it switches to pictures taken every 30 minutes during daylight hours, and then switches to discontinuous daily images on October 23.
Cam5b.m1v.—Time-lapse clip that shows an upstream-looking wide-angle view of changes along the Sandy River channel in the upper reservoir reach as seen from the north (right) shore of the reservoir from October 26, 2007, to May 29, 2008. This camera is colocated with camera 4 but looks upstream rather than downstream. The clip contains discontinuous daily images.
AcknowledgmentsFunding for the camera network placed around the
Marmot Dam reservoir was provided by a U.S. Geological Survey Geology Discipline Venture Capital grant. We thank Abbey Rhode for assistance installing the camera stations.
References Cited
American Rivers, 1999, Dam removal success stories—restoring rivers through selective removal of dams that don’t make sense: Washington, D.C., American Rivers, 146 p.
Esler, J., 2009, Going, going, gone—reflections on the retirement of the Bull Run hydroelectric project: Open Spaces, v. 9, no. 4, p. 21–25.
Grant, G.E., Marr, J.D.G., Hill, C., Johnson, S., Campbell, K., Mohseni, O., Wallick, J.R., Lewis, S.L., O’Connor, J.E., Major, J.J., and Burkholder, B.K., 2008, Experimental and field observations of breach dynamics accompanying erosion of Marmot cofferdam, Sandy River, Oregon, in Babcock, R.W., and Walton, R., eds., ASCE Proceedings of the 2008 World Environmental & Water Resources Congress, Honolulu, HI, May 12–16, 2008, 10 p.
Keith, M., Wallick, J.R., Major, J., O’Connor, J., Spicer, K., and Rhode, A., 2009, Comparison of pre- and post-dam attributes of the reservoir reach of the Sandy River following removal of Oregon’s Marmot Dam [abs.]: Geological Society of America Abstracts with Programs, v. 41, no.7, p. 132.
Major, J.J., O’Connor, J.E., Grant, G.E., Spicer, K.R., Bragg, H.M., Rhode, A., Tanner, D.Q., Anderson, C.W., and Wallick, J.R., 2008, Initial fluvial response to the removal of Oregon’s Marmot Dam: Eos (American Geophysical Union Transactions), v. 89, no. 27, p. 241–242.
Major, J.J., O’Connor, J.E., Podolak, C.J., Keith, M.K., Spicer, K.R., Wallick, J.R., Bragg, H.M., Pittman, S., Wilcock, P.R., Rhode, A., and Grant, G.E., 2010, Evolving fluvial response of the Sandy River, Oregon, following removal of Marmot Dam: Proceedings of the 9th Federal Interagency Sedimentation Conference, June 28–July 1, 2010, Las Vegas, Nevada.
O’Connor, J., Major, J., and Grant, G., 2008, The dams come down—unchaining U.S. rivers: Geotimes, v. 53, no. 3, p. 22–28.
Podolak, C.J., and Wilcock, P.R., 2009, The formation and growth of gravel bars in response to increased sediment supply following the Marmot Dam removal [abs.]: Geological Society of America Abstracts with Programs, v. 41, no. 7, p. 573.
Wallick, R., Major, J.J., Spicer, K.R., Rhode, A., Keith, M., O’Connor, J.E., Burkholder, B., Grant, G., Tanner, D.Q., and Saunders, D., 2008, Erosion and redeposition of reservoir sediment in response to removal of Marmot Dam, Sandy River, Oregon: Eos (American Geophysical Union Transactions), v. 89(53), Fall Meeting Supplement, abs. H43B-0995.
Produced in the Western Region, Menlo Park, CaliforniaManuscript approved for publication, August 9, 2010Text edited by Peter H. StaufferLayout and design by Jeanne S. DiLeo

Major and others—
Time-Lapse Im
agery of the Breaching of Marm
ot Dam, Oregon, and Subsequent Erosion of Sedim
ent by the Sandy River—October 2007 to M
ay 2008— Data Series 521


![COFFERDAM [Compatibility Mode]](https://img.pdfslide.us/doc/110x75/577cdecf1a28ab9e78afe28b/cofferdam-compatibility-mode.jpg)
