Embed Size (px)
Citation preview

1. Present address: Lawrence Livermore National Laboratory, Livermore, CA 94550, United States of
America
Time-domain modelling and thermometry of the CH4 𝝂𝟏 Q-
branch using hybrid femtosecond/picosecond coherent anti-
Stokes Raman scattering
Timothy Y. Chena, Christopher J. Kliewerb,*, Benjamin M. Goldbergb,1, Egemen
Kolemena,c, and Yiguang Jua
aDepartment of Mechanical and Aerospace Engineering, Princeton University, Princeton,
NJ 08544, USA bSandia National Laboratories, Livermore, CA 94550, USA cPrinceton Plasma Physics Laboratory, Princeton, NJ 08543, USA
*Corresponding author: [email protected]
Abstract
We present time-domain measurements and modelling of the CH4 𝜈1vibrational Q-branch,
as well as simultaneous temperature acquisition from the CH4 and N2 vibrational Q-
branches using broadband hybrid femtosecond/picosecond coherent anti-Stokes Raman
scattering (fs/ps CARS). Accurate measurements with fs/ps CARS require knowledge of
the time-domain response of the probed molecule at different temperatures and pressures.
In this work, a fs/ps CARS model was developed for the CH4 𝜈1 Q-branch and validated
using time-resolved probe delay scans at pressures between 70 and 600 Torr and
temperatures between 295 and 1000 K. A simplified modified exponential energy gap
model was used to determine the linewidths of the Raman transitions within the Q-branch.
Total Q-branch linewidths for the entire explored parameter space were also determined
from the probe delay scans. This enabled quantitative measurements of CH4 with fs/ps
CARS as well as the temperature through the hot bands of the CH4 𝜈1 Q-branch. With a
broadband fs laser pulse in a two-beam phase matching scheme, the N2 Q-branch and CH4
𝜈1 Q-branch were simultaneously measured in a heated cell, and the temperatures from
each molecule’s spectra was evaluated. The fitted temperatures corresponded well with
differences ranging from 4 to 17%. It was also shown that exchanging 90% of CH4 for N2
or Ar at 295 K and 500 Torr did not significantly impact the normalized time-domain signal
prior to a 100 picosecond probe delay. Spatially resolved one-dimensional (1-D)
thermometry using the CH4 Q-branch was also demonstrated with an imaged spatial
resolution of 40 microns. With the developed model, 1-D quantitative measurements of
CH4 concentration and temperature can be measured with time resolution of tens of
picoseconds.
Keywords: Laser diagnostics, coherent anti-Stokes Raman scattering, thermometry,
femtosecond/picosecond CARS, methane, ultrafast spectroscopy
1. Introduction
Methane is a major component in natural gas and there is significant interest in its
usage for power generation [1], vehicle engines [2], carbon nanomaterials [3], and chemical
reforming [4–7] to more valuable higher hydrocarbons. Furthermore, methane is a potent
greenhouse gas, and further development of efficient chemical or energy conversion of
methane into valuable carbon materials, hydrogen, and chemicals will be important for
limiting global temperature increases to below 1.5°C [8]. Therefore, it is necessary to be
2
able to quantitatively detect the time history of number density and temperature of methane
molecules in non-equilibrium heterogeneous reactive systems with high spatial resolution,
particularly near solid-gas interfaces.
Laser-based in-situ detection of methane and its use as a probe molecule for
thermometry and speciation is well-established, particularly with absorption [9–15] and
Raman techniques [16–24]. Laser absorption spectroscopy of CH4, particularly with
tunable diode lasers in the mid-infrared, have shown high sensitivity even in harsh
environments, such as shock tubes for kinetic studies. For instance, detection sensitivity of
CH4 below 10 parts-per-million was demonstrated in a C3H8 pyrolysis shock tube
experiment, capturing a 1 millisecond time-series with sub-microsecond time resolution
[14]. However, laser absorption is integrated across the line-of-sight, making localized
measurements along the laser propagation direction difficult to achieve. In addition,
pressure-broadening coefficients in mixtures other than air are not well-documented in
databases like HITRAN [25], requiring separate calibration as was done in [14].
Furthermore, thermometry typically requires frequency scanning across at least two
absorption features, which limits the time resolution to the scanning speed [26]. Using a
chirped supercontinuum laser alleviates this issue due to the pulsed nature of the laser, but
the measurement is still path integrated [15]. Spatially resolved spontaneous Raman
scattering measurements simultaneously imaged along the laser propagation direction are
possible and such measurements have been conducted in flames and non-equilibrium
plasmas [27,28]. However, spontaneous Raman scattering is a weak process with cross-
sections over three orders of magnitude smaller than those of Rayleigh scattering [29,30].
This requires the use of high energy lasers for sufficient signal, such as in [24] where four
lasers were employed to achieve 1.4 J of pulse energy across 400 ns without optical
breakdown. Coherently driving the Raman process can overcome limitations from the
small spontaneous Raman cross-sections. One such method is coherent anti-Stokes Raman
scattering (CARS), which can enhance the Raman signal by several orders of magnitude
[31] when using nanosecond pulse width lasers (ns CARS). This enabled acquisition of
spatially resolved one-dimensional Raman images in flames [32,33]. However, a major
challenge for ns CARS is the elimination of the non-resonant background from four wave
mixing and methods for non-resonant background suppression have been developed over
the years [34–36]. However, these methods can reduce the signal by a factor of 2 or more.
In this work, we further develop an ultrafast variant of CARS, hybrid
femtosecond/picosecond coherent anti-Stokes Raman scattering (fs/ps CARS) [37–49], for
detection and thermometry of the CH4 𝜈1 symmetric stretch vibrational Raman Q-branch.
The advantages of fs/ps CARS include simultaneous detection of many Raman transitions
using a broadband femtosecond laser with tens to hundreds of microns of spatial resolution
[41,49]. The non-resonant background is avoided by delaying the spectrally narrow
picosecond probe pulse with respect to the femtosecond pulse such that they do not overlap
in time. With high intensity ultrashort pulses, the nonlinear optical interaction is
significantly enhanced compared to ns CARS. The high peak intensity enables highly
localized near surface measurements with one dimensional spatial resolution normal to the
surface [49–51] or two dimensional images [42] with picosecond temporal resolution . In
addition, methane as a probe molecule is attractive due to its high polarizability and
correspondingly large Raman cross-section for the 𝜈1 Q-branch, which is 8.6 times that of
the N2 Q-branch [52]. For CARS, the signal intensity scales with the square of the Raman

3
cross-section, making CH4 signals more than 70 times stronger than N2 Q-branch signals.
Moreover, in applications like methane reforming, only methane is the major species and
no nitrogen exists.
In the past four decades, the CH4 𝜈1 symmetric stretch Q-branch spectrum has been
successfully characterized with high spectral resolution using stimulated Raman scattering
(SRS) [53], ns CARS [19–21], and continuous wave CARS (CW CARS) [16–18]. For
instance in [17], the rotational structure of the 𝜈1 Q-branch was resolved and assigned with
0.002 cm-1 using CW CARS. However, an in-depth characterization of the CH4 𝜈1 hot band
and validated set of Raman transition frequencies and intensities has only been recently
available for simulating CARS and spontaneous Raman scattering hot CH4 𝜈1 Q-branch
spectra [21–24]. In these works, CARS and spontaneous Raman scattering measurements
of CH4 at different temperatures were used to verify the capability of the CH4 𝜈1 Q-branch
for thermometry. However, to our knowledge, a similar effort for using fs/ps CARS to
perform CH4 thermometry has not been reported.
In fs/ps CARS, the frequency difference of the pump and Stokes photons provided
by the femtosecond laser coherently couples with the ro-vibrational energy levels of the
probed molecules. The time delayed picosecond probe scatters off the established
coherence and produces the anti-Stokes Raman signal photons. Since the probe laser is
delayed, the coherently excited ro-vibrational modes decay depending on the lifetime of
the Raman transitions and their decay rates. For an isolated Raman transition, the
exponential decay time constant, 𝜏, can be related to the Raman Lorentzian linewidth,
Γ, via the relationship: Γ = (2𝜋𝑐𝜏)−1, where c is the speed of light. This can be understood
on the basis that the Fourier transform of a decaying complex exponential function is the
Lorentzian function [54]. On the picosecond time scale of the probe delays, the linewidths
are assumed to be governed by collisional rotational energy transfer [39]. As a result,
accurate models of the decay rates including collisional energy transfer in the time-domain
or the Raman line widths in the frequency-domain are necessary when interpreting fs/ps
CARS spectra. Furthermore, if the pressure dependences of the linewidths are known, they
can be exploited to make simultaneous pressure, concentration, and temperature
measurements [55,56]. A significant portion of the literature focuses on directly measuring
these linewidths in the time domain using time-resolved CARS [40,57–60]. However, only
diatomic molecules like N2 and O2 and some simple triatomic molecules like CO2 have
been measured in detail.
Frequency-resolved point and 1-D fs/ps CARS measurements of CH4 have been
conducted in previous studies [43,47,50], but so far only [47] has performed fs/ps CARS
time-domain measurements. In this work, the CH4 𝜈1 Q-branch was treated as a single
Raman transition and the linewidth was determined for varying mole fractions of CH4
diluted in N2 at atmospheric pressure and ambient temperature. The measured linewidth
was found to be insensitive to the gas mixture composition. However, the time delay scan
was only measured up to 100 ps. Time-domain ps CARS measurements were reported in a
supersonic CH4 jet at rotational temperatures from 25 K to 80 K and a pressure of 5 atm
[61,62]. The Fourier-transform of the simulated frequency-domain spectrum showed good
agreement with the time-domain scan. However, measurements at higher temperatures,
conditions where more rotational lines would be active, have not been conducted.
For ns-CARS measurements of the CH4 𝜈1 Q-branch, the linewidths have been
determined through quantum models [63] and semi-classical calculations [20,21]. Semi-

4
classical calculations require knowledge of the interaction potential between the binary
collision partners and rely on empirical infrared absorption data from the infrared-active
𝜈3 Q-branch for unavailable 𝜈1Q-branch parameters. It would be preferable to construct a
simplified linewidth model using a scaling law directly validated by time-domain data
obtained from the 𝜈1Raman Q-branch across different pressures and temperatures. For the
N2 vibrational Q-branch, the modified exponential gap (MEG) scaling law has been
successfully used for fitting the rotational energy transfer rate matrix from 0-1 atm and 295
K to 2200 K [39]. The MEG scaling parameters were also fitted for pure rotational S-
branch linewidths of N2 and O2 [57,64,65]. In tetrahedral molecules such as SiH4 [66] and
deuterated methane isotopes, CHD3 [67] and CD4 [68], state-to-state rotational energy
transfer rates were measured by infrared double resonance spectroscopy and successfully
fitted using exponential energy gap scaling laws. Therefore, it appears justified to use an
exponential energy gap scaling law as the basis for fitting the linewidths of the ro-
vibrational transitions of the CH4 𝜈1 Q-branch.
In this study, we use the MEG scaling law to approximate the linewidths of the
rotational transitions within the 𝜈1 Q-branch. We use the Raman transition frequencies and
intensities from [23] calculated by the Spherical top data system (STDS) software [69] and
fit measured probe time delay series scanned up to 1.6 ns. These delay scans were
performed at room temperature and pressures ranging from 70 Torr to 500 Torr. This
constrains the pressure dependent terms of the exponential energy gap law. The
temperature dependent terms were determined from high temperature spectra and delay
scans in a tube furnace set to temperatures up to 1000K and pressures from 70 Torr to 600
Torr. The fitted temperatures determined by CH4 were compared against temperatures
determined by simultaneously acquired N2 Q-branch spectra in CH4/N2 mixtures at
temperatures up to 1000 K. Spatially resolved 1-D fs/ps CARS thermometry was also
demonstrated using spectral fits of the CH4 𝜈1 Q-branch. With this set of data, we validate
the CH4 fs/ps CARS model and extend the capabilities of fs/ps CARS to quantitative 1-D
CH4 sensing and thermometry.
2. Computational and experimental methods
2.1 CH4 fs/ps CARS modelling approach
The principles underlying fs/ps CARS modelling in the time and frequency
domains was developed previously [39,49]. Only a brief treatment as well as considerations
for modelling CH4 spectra will be given here. In general, CARS is a third-order optical
nonlinearity, where the pump and Stokes photons match a resonant ro-vibrational energy
level of a molecule. The probe photons scatter off this resonance and the anti-Stokes Raman
photons coherently propagate in the direction determined by the phase-matching conditions
of the experiment. The anti-Stokes photons are then detected as the CARS signal. For fs/ps
CARS, the probe is time-delayed with respect to the pump and Stokes photons. The
intensity of the fs/ps CARS signal can be expressed as a function of time, assuming
instantaneous electronic dephasing [39]:
𝐼𝐶𝐴𝑅𝑆(𝑡) ∝ |𝑃(3)(𝑡)|2
= |(𝑖
ℏ)
3
𝐸𝑝𝑟𝑜𝑏𝑒(𝑡) ∫ 𝑑𝑡2 (𝑅𝐶𝐴𝑅𝑆(𝑡2) × 𝐸𝑆𝑡𝑜𝑘𝑒𝑠∗ (𝑡 + 𝜏23 − 𝑡2) ×
∞
0
𝐸𝑝𝑢𝑚𝑝(𝑡 + 𝜏23 + 𝜏12 − 𝑡2)) |
2
(1)
5
where 𝑃3(𝑡) is the third-order polarization, 𝐸𝑝𝑟𝑜𝑏𝑒 and 𝐸𝑝𝑢𝑚𝑝 are the probe and pump
electric fields, 𝐸𝑆𝑡𝑜𝑘𝑒𝑠∗ is the complex conjugate of the Stokes electric field, 𝜏12 is the time
delay between the pump and Stokes beams, 𝜏23 is the time delay between the Stokes and probe beams, and 𝑡2 is an integration variable representing the coherence time scale between the pump/Stokes and the probe beams. The CARS molecular response, 𝑅𝐶𝐴𝑅𝑆, can
be written as:
𝑅𝐶𝐴𝑅𝑆 (𝑡) = ∑ ∑ 𝐼𝑣,𝐽𝑖→𝑣+1,𝐽𝑓𝐽𝑣 𝑒𝑥𝑝 (𝑡
ℏ(𝑖𝛥𝐸𝑣,𝐽𝑖→𝑣+1,𝐽𝑓
−1
2𝛤𝑣,𝐽𝑖→𝑣+1,𝐽𝑓
)) (2)
where 𝐼𝑣,𝐽𝑖→𝑣+1,𝐽𝑓 is the Boltzmann-weighted Raman transition intensity, Δ𝐸𝑣,𝐽𝑖→𝑣+1,𝐽𝑓
is
the energy level difference of the vibrational Raman Q-branch transition, Γ𝑣,𝐽𝑖→𝑣+1,𝐽𝑓 is the
Raman linewidth, 𝑣 is the vibrational quantum number, 𝐽𝑖 is the initial rotational quantum
number, and 𝐽𝑓 is the final rotational quantum number. The Raman transition intensities
were pre-calculated for different temperatures according to the partition function scaling
method from [23]. Note that while 𝑣 + 1 is written as the final vibrational state, CH4 has
four vibrational modes. The notation refers to the vibrational quantum number increase of
the 𝜈1 symmetric stretch vibrational mode, which produces the 𝜈1 vibrational Q-branch
spectra.
The Raman linewidths are calculated using the modified exponential gap law
[70,71]:
Γ𝑗𝑖 = 𝑝𝛼 (𝑇
𝑇0)
−𝑛
(1+𝑎ℏ𝜔𝑣+1,𝐽𝑖
/𝑘𝐵𝑇𝛿
1+𝑎ℏ𝜔𝑣+1,𝐽𝑖/𝑘𝐵𝑇
)2
× exp (−βℏ(ωv+1,Jj− 𝜔𝑣+1,𝐽,𝑖)/ 𝑘𝐵𝑇) (3)
Γ𝑖𝑗 = Γ𝑗𝑖2𝐽𝑖+1
2𝐽𝑗+1exp (ℏ (𝜔𝑣+1,𝐽𝑗
− 𝜔𝑣+1,𝐽𝑖) /𝑘𝐵𝑇) (4)
Γ𝑗 = ∑ Γ𝑖𝑗𝑖≠𝑗 (5)
where Γ𝑗𝑖 is the upward collisional transition from the ith rotational state Ji to the jth
rotational state Jj, Γ𝑖𝑗is the downward collisional transition of the rotational states from Jj
to Ji, Γ𝑗 is the linewidth of a transition out of rotational energy level Jj, p is the pressure in
Torr, T is the temperature, T0 is the reference temperature set to 295 K, a is a species-
specific constant set to 2, 𝛼, 𝛽, 𝛿 , and 𝑛 are adjustable parameters in the least-squares
fitting, 𝜔𝑣+1 ,𝐽𝑖 and 𝜔𝑣+1,𝐽𝑗 are the frequency terms representing the rotational energy gap.
The rotational energy gap is calculated using the following expression for rotational energy
[17,72]:
𝐸𝐽 = 𝐵𝐽(𝐽 + 1) − 𝐷𝐽2(𝐽 + 1)2 (6)
where B and D are the rotational and centrifugal constants of CH4 taken from [72] and J is
the rotational quantum number. 𝜔𝑣+1,𝐽𝑖 is calculated using the harmonic oscillator
approximation where it is assumed that the ro-vibrational energy is the sum of separable
rotational and vibrational components. The vibrational energy is calculated from the lower
state vibrational quantum numbers multiplied by the J=0 vibrational frequencies, used in

6
[23] and taken from [73]. Several additional approximations are made in constructing this
linewidth model. The linewidths for the same J but different nuclear spin (A, E, or F), are
assumed to be the same. Double infrared resonance measurements [74,75] suggest that the
rotational relaxation rates of CH4 are similar for different nuclear spins, which to first order
justifies our assumption. However, they are not identical, so this effect can be explored in
the future. In addition, the line width parameters for the hot bands are not determined
separately from those of the ground state. The only differences are in the initial energy
levels used when calculating Eq. (3).
In this study, we use fitting in the time-domain to determine the linewidth
parameters from the MEG model. For every experimental probe delay, the intensity of the
CH4 𝜈1 Q-branch is summed and compared to a simulated library of time delay traces. This
is a similar approach to [76]. From Eq. (3), there are four adjustable parameters: 𝛼, 𝛽, 𝛿
and 𝑛. The first two are optimized using room temperature spectra, with 𝛿 = 1 and 𝑛 = 0.
The latter two are optimized with high temperature spectra. This allows us to only vary two
parameters at a time for calculation of the fitting library and reduce the number of simulated
spectra by at least an order of magnitude. However, with this approach, the high
temperature line widths will have a different functional form from the room temperature
line widths and the two models may not converge. Therefore, the trade-off for only needing
to vary two parameters at a time is that there will be two fitted linewidth models: one
validated at 295 K and another validated from 500-1000 K. Efforts to determine a unified
MEG expression using an expanded parameter spectral library are underway. In addition,
the term 𝑝𝛼 is lumped together in the simulations and later separated by dividing by the
pressure. This again reduces the number of variables needed to create the fitting library.
On the top of Fig. 1, a 295 K and a 1000 K CH4 CARS spectrum are plotted. The
bottom sub-plots of Fig. 1 show the intensities of the individual Raman transitions that
were used to calculate the full fs/ps CARS profile in the top sub-plots. At 295 K, only a
single peak can be seen, since nearly all of the molecules are in the vibrational ground state.
At high temperatures, hot bands arise due to CH4 molecules thermally populated in the 𝜈2,
𝜈4, 2𝜈2, 2𝜈4, and 𝜈2 + 𝜈4 vibrational states. These hot bands can be seen to the left of the
ground state peak. The hot bands provide temperature sensitivity to the CH4 Q-branch and
enable thermometry.
Figure 1. Simulated fs/ps CARS spectrum and Raman line intensities of CH4 at 295 K (left)
and 1000 K (right).

7
The major challenge in using the original Raman line list from [23] was the
overwhelming number of transitions, over 1.7 million in total. Such a large number of
transitions is not feasible for calculation and fitting of fs/ps CARS spectra in the time-
domain, even with a computing cluster. To understand why, one can examine the most
time-consuming step of the calculation, the molecular response function in Eq. (2). In the
exponential term, the transition energy differences and linewidths must be multiplied by
time. If we consider a time vector encompassing 1 ns with 1 fs time steps, that is a length
of 1 million elements. Therefore, the corresponding outer product of the time vector and
1.7 million Raman transitions would result in a 1.7 million by 1 million matrix and easily
exceed the memory limits of available computational resources. Therefore, a filter was
used to only include transitions that were at least 0.3% as intense as the strongest transition,
as seen in Fig. 1. This limited the number of considered lines to 336 at 295 K and 5901 at
1000 K. The cut off was chosen to only include transitions from the vibrational ground
state at 295 K. At 1000 K, the difference in normalized spectra between a 0.001% cut off
and a 0.3% cut off was below 1% in the hot band. To further increase the speed of the
computations, all spectra were calculated on the graphics processing unit (GPU) nodes of
the Adroit high-performance computing cluster at Princeton University. Large matrix
operations, specifically in the calculation of Eq. (2), benefitted from GPU computing. A
single time delay series required approximately 1 to 4 minutes on a single GPU node on
the computing cluster, depending on the number of considered Raman transitions. The
room temperature library contained 11,500 time delay series, and the high temperature
library contained 13,000 time delay series.”
2.2 fs/ps CARS experimental setup and methods
The experimental setup was previously described in detail in [51] with minor
changes to the focusing optics shown in Fig. 2. A brief description will be given here. The
fs/ps CARS setup used a 20 Hz picosecond regenerative amplifier with a 65 ps pulse width
and 6 mJ pulse energy whose oscillator was mode-locked to the oscillator of the 1 kHz fs
Ti:Sapphire regenerative amplifier (Legend Elite, Coherent). The delays between the ps
and fs laser pulses were controlled electronically (PDL-100A, Colby Instruments), and the
maximum delay was limited by the CARS signal-to-noise ratio rather than the equipment
itself. A 1.5 mJ portion of the 50 fs pulses of the Ti:Sapphire regenerative amplifier was
focused into a 1 meter long hollow-core fiber filled with 400 Torr of Ar (Femtolasers). The
fs pulse was spectrally broadened by self-phase modulation and compressed by negatively
chirped mirrors to ~7 fs. The bandwidth of the resultant 0.6 mJ beam was sufficient to
measure both the N2 Q-branch at 2330 cm-1 and the CH4 Q-branch at 2916 cm-1
simultaneously. The fs and ps beams were cylindrically focused to the probe region with
an intersection angle of 5° in a two-beam phase matching configuration. The CARS signal
propagated in the phase matching direction nearly collinear with the probe beam and was
separated using a short pass filter (SP01-561RU-25, Semrock). The CARS signal was
imaged in a 1:1 configuration onto the 50 𝜇𝑚 slit of the spectrometer (iHR 550, Horiba).
A 2400 gr/mm grating dispersed the signal and the CARS spectra was detected using a
water-cooled charge-coupled device (CCD) with 13.5 𝜇𝑚 pixels (Newton 940, Andor).
Dark current was minimized by cooling the CCD to -80°C and the exposure time for each
spectrum was 2 seconds, accumulating for 40 laser shots per image. When necessary at
high pressures, a neutral density filter was placed in front of the slit to increase the dynamic

8
range of the measurement. The neutral-density filter was calibrated by measuring a time
delayed spectrum with and without the filter. This gave an intensity calibration factor to
apply to subsequent time delays. All data was acquired in 1-D and summed across a 1 mm
sheet length during post-processing. Prior to fitting, all spectra were background subtracted
and divided by the non-resonant excitation profile measured in 500 Torr of Ar. For room
temperature experiments, the plasma cell from [51] was used with the electrodes removed.
For the high temperature experiments, an 860 mm long quartz tube with a 57 mm inner
diameter was placed in a tube furnace (Carbolite) and sealed with O-rings in custom
window mounts equipped with gas inlets. The windows were made from N-BK7 and were
cooled by flowing compressed air on the window mounts to keep the temperature of the
mounts below the melting point of the O-ringd s. Gas flows were regulated by mass flow
controllers (MKS) and they were set to 500 SCCM. Using flowing gases ensured that
pyrolysis products did not build up and contaminate the CH4 Q-branch spectrum during
the high temperature measurements. A downstream needle valve was used to set the
pressure. At the highest set point temperature and highest pressure, 1000 K and 600 Torr,
approximately 0.001% of the CH4 will thermally decompose within the reactor residence
time of the gas [77]. For the fs/ps CARS measurements, this was negligible and the
presence of interfering hydrocarbons in the 𝜈1 Q-branch region was not detected
Figure 2. Experimental schematic of the fs/ps CARS setup. CM: concave cylindrical mirror
with f= 400 mm. CL: plano-convex cylindrical lens with f = 400 mm, 400 mm, SL:
spherical plano-convex lens with f = 400 mm. SWP: angle-tuned short wave pass filter.
HWP: half-wave plate.
3. Results and Discussion
3.1 Room temperature measurements and modelling
The time delay traces measured for pure CH4 mixtures at 295 K for pressures
ranging from 70 to 500 Torr are shown in Fig. 3 as well as the fitted simulations. The
parameters 𝛽 and 𝑝𝛼 were varied in a least-squares fitting routine. 𝛽 was determined by
the best fit for 300 Torr and fixed for the other pressures. Excellent agreement was obtained
for time delays up to 500 ps for the pressures below 500 Torr. The coherent beat patterns
matched for most of the cases, indicating that the reduced set of included Raman
frequencies was adequate. However, there was some discrepancy in the fitted curve for 500
Torr from 100 ps to 200 ps. This may be due to the simplified MEG model that was

9
employed to fit the room temperature line widths. Either using more sophisticated
linewidth calculations like semi-classical linewidth calculations or adding a third fitting
variable, 𝛿 , in the fitting routine could improve agreement. Artificially increasing 𝑝𝛼
resulted in a time-domain trace that only captures the initial exponential decay and
underpredicted the measurements at time delays beyond 150 ps. Overall, the fits agree
well, indicating that the time-domain traces could be adequately described without
considering the influence of nuclear spin symmetry. Theoretical modelling for high
pressure CH4 𝜈1 Q-branch CARS linewidths also found that this assumption was sufficient
to describe the linewidths [63].
Figure 3. Experimental 295 K probe delay scans fitted with MEG parameters from
pressures of 70 to 500 Torr.
Interestingly, after dividing the fitted 𝑝𝛼 terms by the pressure, 𝑝, in Torr, the
resulting 𝛼 was not constant. For the 150, 300, and 500 Torr fits, the fitted 𝛼 was within
10% of 4 × 10⁻⁴ cm-1/Torr, which was the median fitted 𝛼 for these three pressures.
However, at 70 Torr, the fitted 𝛼 was 5.4 × 10⁻⁴ cm-1/Torr, which was 35% larger than
the median 𝛼 for the other pressures. This indicated that 𝛼 was a function of pressure. This
may be because each time delay trace was fitted separately with respect to 𝑝𝛼 which did
not guarantee the same fitted 𝛼 for a given pressure. However, using an 𝛼 of 4 × 10⁻⁴cm-
1/Torr for the 70 Torr time delay scan showed worse agreement at long probe delays (see
Supplementary Figure S1). As a result, we used the following expression for 𝛼, in cm-
1/Torr, determined by a linear fit to a 𝑝𝛼 vs 𝑝 plot (see Supplementary Figure S2) and
dividing by the pressure:
𝛼 = 5.41 × 10⁻³𝑝−1 + 3.85 × 10⁻⁴ (7)
Equation (7) implies that at the zero-pressure limit, the product 𝑝𝛼 does not become
zero and therefore the linewidths do not become zero. Similar behavior was observed
previously in [20,63] with the total Q-branch linewidth at room temperature having a near
linear dependence on pressure with a non-zero offset if extrapolated to zero pressure. This

10
is a significant difference from MEG linewidth models of diatomic molecules such as N2
and O2 which assume constant 𝛼.
As further confirmation of this phenomenon, as well as to provide useful data for
future CH4 CARS modelling efforts, the first 150-200 ps of the time delays were fitted with
a single exponential function. The time duration that was fitted was chosen to avoid the
first onset of coherent beating from closely spaced probed Raman transitions. The
exponential time decay constants were extracted from the fits and then converted to
linewidths using the expression Γ𝑣1 = 1/(2𝜋𝑐𝜏𝐶𝐴𝑅𝑆), where 𝜏𝐶𝐴𝑅𝑆 is the decay constant.
These linewidths are plotted in Fig. 4 along with a linear fit and the CH4 Q-branch linewidth
determined in [47]. The extrapolated linear fit and the literature value are within 10% and
their respective uncertainty. The relatively large uncertainty in this study was due to the
sparse time steps as compared to [47], since the focus here was on studying long probe
delays rather than the first 100 ps. From Fig. 4, the linear fit to the total Q-branch linewidths
had an R2 > 0.99 and predicted a non-zero linewidth at zero pressure. This is consistent
with a pressure-dependent 𝛼 in the MEG model. However, additional measurements at
pressures lower than 70 Torr are required to completely verify this.
Figure 4. Fitted total Q-branch linewidths from single exponential decays of probe delay
scans as a function of pressure. The atmospheric pressure linewidth from [47] was plotted
along with an extrapolated linear fit.
The effect of the gas mixture was also investigated by substituting 90% of CH4 with
either N2 or Ar at 500 Torr. The time delay traces for these three mixtures are plotted in
Fig. 5. The exponential decays from Fig. 5 were fitted in the same manner as that in Fig.
4. A simulated convolution of the fs pump/Stokes pulse with the 65 ps probe pulse was
plotted as the dashed time profile. The corresponding total Q-branch linewidths are
reported along with the linewidths from Fig. 4 in Table 1. From Table 1, the measured
linewidths of the N2 and Ar mixtures do not vary significantly. Additionally, from Fig. 5,
the influence of the mixture composition is only discernable after a critical probe delay,
approximately 100 ps. At this probe delay, the probe pulse convolution decayed by three
orders of magnitude, indicating that the overlap of the time delay curves at 100 ps was not
dominated by the probe pulse width. This agreed with [47], where the mole fraction of CH4
was varied from 0.1 to 1 in a N2 bath gas and the atmospheric pressure CH4 total Q-branch
linewidth was approximately constant as measured across 100 ps probe delay scans. To
explain this, we need to estimate a time scale that describes the critical probe delay for
collisional partner independence. From gas kinetic theory, the probability of a molecule
not experiencing a collision after time t is exp(−𝑡/𝜏) where 𝜏 is the mean time between
collisions. For instance, at a probe delay of 40 ps in a CH4 gas at 500 Torr, this probability

11
is 25% with a mean time between collisions of 140 ps. From the quadratic scaling of CARS
with number density, such a delay ensures that 90% of the original CARS signal survives
collision-free. However, this time scale is shorter than when the time-domain
measurements start to diverge in Fig. 5. On the other hand, the mean time between
collisions estimates a time scale longer than the measured critical probe delay. If the
probability of collisions is increased to 50%, the estimated time scale would be 97 ps. This
corresponds well with the measured critical probe delay in Fig. 5. Since the measurement
at this probe delay is not “collision-free,” we define this time scale as the “collision
sensitivity time”. This is an indication that the influence of collisional partners on the
CARS dephasing is weak, and the measurement does not need to be strictly “collision-free”
for collisional partner independence in the initial dephasing rates. This corresponds well
with the measured critical probe delay marked in Fig. 5. For the measurements in [47], this
time would correspond to around 60 ps. Therefore, most of their measured probe delays
would not be expected to vary significantly with mixture composition. Whether this simple
estimation works for CH4 mixtures with different gases like O2 and CO2 and different
pressures is unknown and would be worth further investigation. As stated in [47],
insensitivity toward gas mixture composition would be beneficial for future quantitative
measurements of CH4 mole fraction. Specifically, this would be an advantage for
measurements in dynamic environments such as ignition events or pulsed non-equilibrium
plasmas, where the collisional environment changes with time.
Figure 5. Probe delay scan of 500 Torr CH4 mixtures. The measured critical probe delay
for collisional partner independence is shaded in red.
Table 1. Total 295 K CH4 𝜈1 Q-branch linewidth from single exponential fits
Mixture Pressure
(Torr) Γ𝜈1
(cm-1)
Pure CH4
70 0.137 ± .016
150 0.147 ± .016
300 0.175± .012
500 0.21± .02
10% CH4/90%Ar 500 0.158± .02

12
10%CH4/90%N2 500 0.167± .02
3.2 High temperature measurements and modelling
After determining the best fit 𝛽 and 𝛼, these parameters were kept constant while
𝛿 and 𝑛 were varied in Eq. (3) for the high temperature linewidth model. Keeping 𝛿 = 1
like in the room temperature linewidth model and varying only 𝑛 could not fit the
experimental data. The experimental time delay traces as well as the simulated ones are
plotted in Fig. 6. In Fig. 6, the pressure was kept constant but the temperature setpoint of
the furnace was changed from 500 K to 1000 K. Only the ground state Q-branch intensity
was summed for the time-domain fitting. The least squares-fitting routine simultaneously
fit all of the time delay traces by defining the error function as the sum of the residuals
from all three conditions. From Fig. 6, a good fit was achieved for all three temperatures
up to 200 ps and again, the coherence beating was well-matched across longer time scales.
To confirm that the previously determined pressure dependence still held, time delay traces
measured at a fixed setpoint temperature of 1000 K and pressures from 150 Torr and 600
Torr are compared with the simulations in Fig. 7. The simulated time delay series matched
well for delays up to 200 ps and qualitative agreement was achieved with the coherence
beat pattern. Note, these two conditions were not used in the fit. Therefore, the 150 and
600 Torr measurements served as validation of the high temperature time-domain model.
As in the room temperature time-domain measurements, the single exponential time decays
were converted to linewidths and tabulated in Table 2. From Table 2, the hot band
linewidths were not found to be pressure sensitive. This may indicate that collisions do not
dominate the decay of the hot band region at high temperatures.
Figure 6. Experimental and fitted probe delay scans of heated CH4 at 70 Torr with
temperatures varying from 500 to 1000 K along.

13
Figure 7. Probe delay scans of heated CH4 at a 1000 K for pressures of 150 Torr (left) and
600 Torr (right) along with predicted time-domain curves from the MEG fits.
Table 2. Single exponential fits of the CH4 𝜈1 Q-branch at high temperatures.
Pressure
(Torr)
Setpoint
temperature (K) Γ𝜈1
(cm-1) Γℎ𝑜𝑡 𝑏𝑎𝑛𝑑
(cm-1)
70 295 0.137 ± .016 -
70 500 0.11 ± .014 -
70 800 0.088± .012 0.19± .05
70 1000 0.08± .015 0.18± .03
150 1000 .10± .01 0.17± .03
600 1000* 0.136± .02 0.18± .03 *While the setpoint temperature was 1000 K, the actual temperature at the measurement location was likely lower by 14% due to increased heat losses at high pressure. See text for details.
With the linewidth parameters determined for the high temperature model,
frequency-domain thermometry could be performed at various time delays. With the large
bandwidth available from the hollow-core fiber, CH4 𝜈1 Q-branch and N2 Q-branch spectra
were simultaneously acquired and fitted for evaluation of temperature. An example fit of
both spectra are plotted in Fig. 8. At 500 Torr and 1000 K set point, the evaluated
temperature was 860 K for the CH4 fit and 850 K for the N2 Q-branch. The instrument
function of the spectrometer was determined by fitting a Gaussian line shape to the ro-
vibrational Raman transitions of the N2 Q-branch spectrum measured at 500 Torr and a
1000 K setpoint. Once determined, this Gaussian line shape was applied to the CH4 Q-
branch spectrum for each Raman transition considered. Further comparisons between the
evaluated temperatures are plotted in Fig. 9 for temperature set points of 500 K, 800 K, and
1000 K. Each data point for the CH4 Q-branch was measured at either 0 ps or 50 ps delay,
while the N2 Q-branch temperature was the average of the spectra evaluated at 50 ps and
100 ps delays. The delays for the N2 temperature evaluations were chosen to avoid non-
resonant background effects. For CH4, a strong non-resonant background was not observed
even at a delay of 0 ps, possibly due to its relatively large resonant Raman cross-section.
At the highest measured CH4 number density condition, 500 Torr and 295 K, the ratio
between the resonant and non-resonant signals was at most 0.025% (see Supplementary
Figure S3). Additionally, at such a large Raman shift and weak non-resonant background
amplitude, the background would be nearly flat in the frequency domain and would not
significantly impact the thermometry results. However, if the non-resonant background
were strong, then coherent interferences due to phase offsets from the resonant signal
14
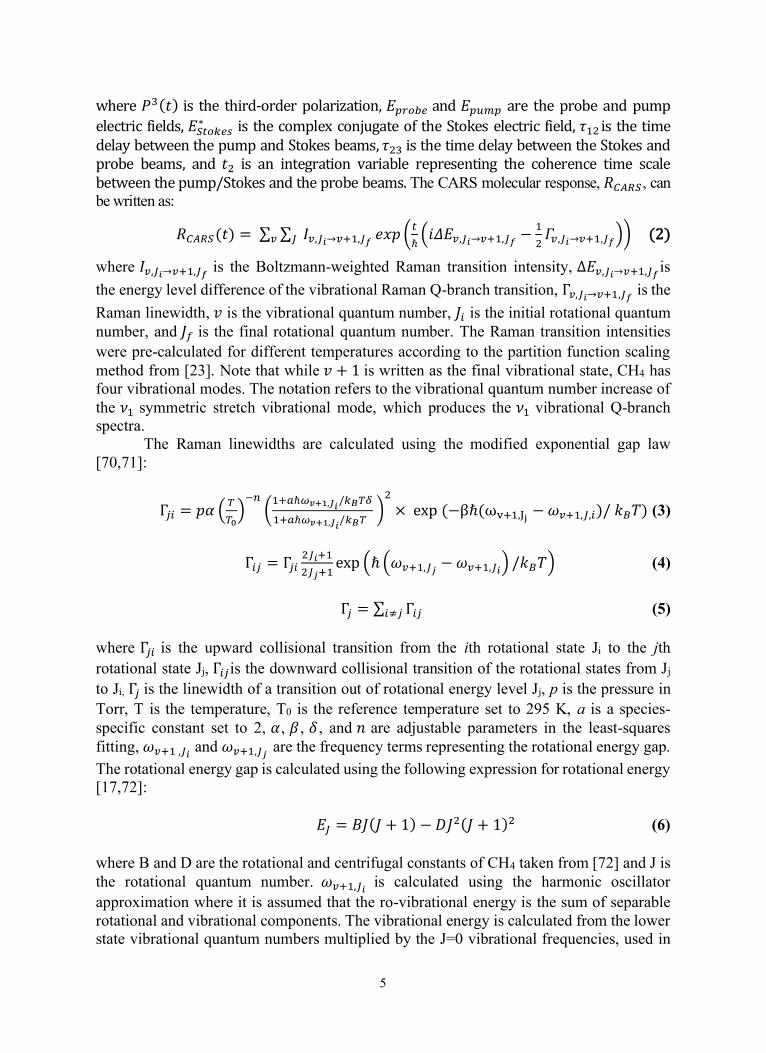
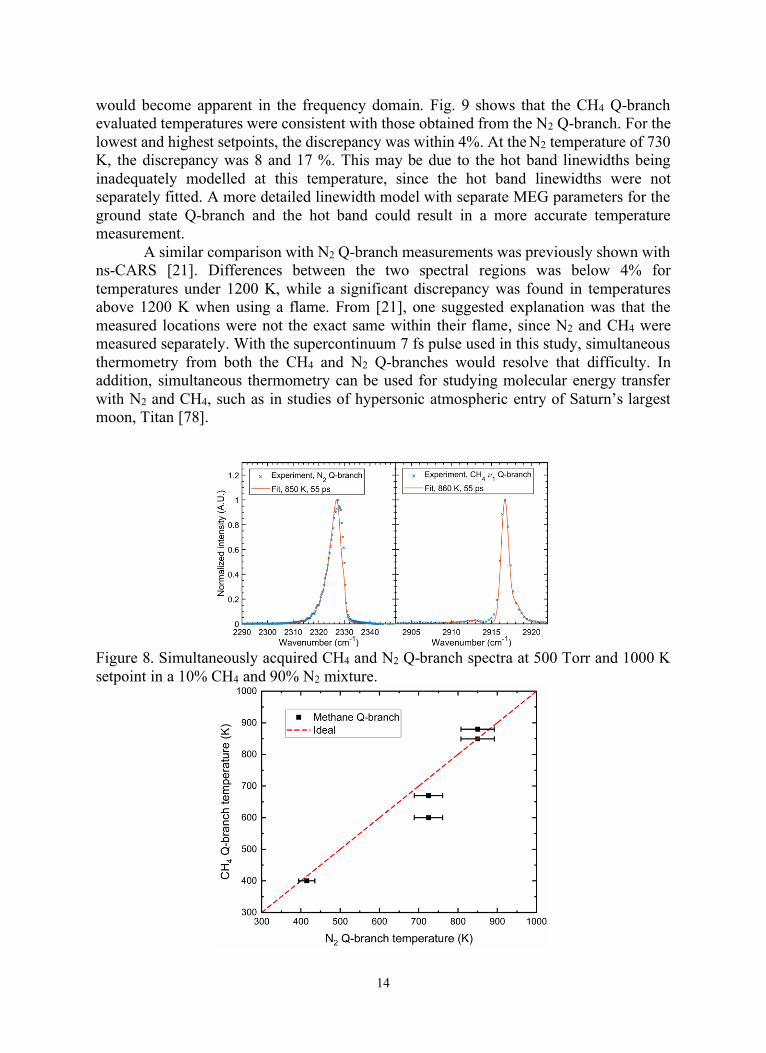
would become apparent in the frequency domain. Fig. 9 shows that the CH4 Q-branch
evaluated temperatures were consistent with those obtained from the N2 Q-branch. For the
lowest and highest setpoints, the discrepancy was within 4%. At the N2 temperature of 730
K, the discrepancy was 8 and 17 %. This may be due to the hot band linewidths being
inadequately modelled at this temperature, since the hot band linewidths were not
separately fitted. A more detailed linewidth model with separate MEG parameters for the
ground state Q-branch and the hot band could result in a more accurate temperature
measurement.
A similar comparison with N2 Q-branch measurements was previously shown with
ns-CARS [21]. Differences between the two spectral regions was below 4% for
temperatures under 1200 K, while a significant discrepancy was found in temperatures
above 1200 K when using a flame. From [21], one suggested explanation was that the
measured locations were not the exact same within their flame, since N2 and CH4 were
measured separately. With the supercontinuum 7 fs pulse used in this study, simultaneous
thermometry from both the CH4 and N2 Q-branches would resolve that difficulty. In
addition, simultaneous thermometry can be used for studying molecular energy transfer
with N2 and CH4, such as in studies of hypersonic atmospheric entry of Saturn’s largest
moon, Titan [78].
Figure 8. Simultaneously acquired CH4 and N2 Q-branch spectra at 500 Torr and 1000 K
setpoint in a 10% CH4 and 90% N2 mixture.

15
Figure 9. Comparison between the evaluated temperatures from the CH4 Q-branch and N2
Q-branch in 500 Torr, 10% CH4 and 90% N2 mixtures. Uncertainties in the N2 Q-branch
temperatures are shown as horizontal error bars.
Figure 10. Example fitted CH4 Q-branch spectra in pure CH4 at 70 Torr and 600 Torr using
a 1000 K furnace setpoint. The intensity axis used log scaling to emphasize the hot band
structure.
The good agreement between the CH4 Q-branch and N2 Q-branch measurements
indicated that the heated cell was not ideal. The evaluated temperatures and the set point
temperatures were different by 10 to 25%. Unfortunately, using the same cylindrical
focusing optics as in [51] meant that the probe volume was not exactly in the center of the
tube furnace and was outside the uniform temperature region specified by the
manufacturer. Therefore, heat loss toward the exposed windows of the cell could have
caused a discrepancy between the set point temperature and the measured temperature.
However, this was only a significant problem at the highest pressures, 500 and 600 Torr,
measured in this study. In Fig. 10, example spectra and fits of the 70 Torr and 600 Torr
pure CH4 mixtures at 1000 K are plotted. To emphasize the hot band structure, the
temperature axis used log scaling. The dip in the intensity around 2914 cm-1 is likely due
to using a Gaussian line shape for the spectrometer instrument function rather than a Voigt
profile. However, since the N2 Q-branch was fit satisfactorily with a Gaussian line shape,
the same instrument function was applied to the CH4 Q-branch spectrum for consistency.
The 70 Torr fitted temperature was 940 K, while the 600 Torr fitted temperature was 860
K. Therefore, at 70 Torr, the difference in measured and setpoint temperature was 6%,
while at 600 Torr it was 14%, more than a factor of two larger. This indicates that the time-
domain fitting using the set point temperatures as the input parameter at 70 Torr was valid,
but some caution should be taken when evaluating the 600 Torr results.
While measurements at atmospheric pressure were not conducted, the pressure
linearity of the linewidths indicate that the current fs/ps CH4 CARS model should be valid
up to atmospheric pressure. However, measurements beyond atmospheric pressure will
likely require the incorporation of line mixing effects [79] as demonstrated in a high
pressure CH4 ns- CARS study [80]. Use of short probe pulses with pulse widths ranging
from 2 to 6 ps like in [57,81] may allow fs/ps CH4 CARS measurements at pressures of 20
atm or more
3.3 Spatially resolved 1-D CH4 𝜈1 Q-branch thermometry

16
The potential for 1-D measurements as well as to illustrate the radial homogeneity
of the heated cell is shown in Fig. 11. In Fig. 11, a spatially resolved 1-D profile of the
temperatures were fit for each spatial location. The camera pixels were summed such that
each binned pixel corresponded to approximately 40 𝜇𝑚 like in [51]. The spatially
averaged temperature measurement is plotted as the dashed line and the 1-D temperature
profile is within ± 5% of the dashed line. The shaded areas in Fig. 11 are the standard
deviations of the temperatures evaluated from each of the 50 measured frames. While this
is not a single-shot histogram, it provides a measure of precision of the 1-D measurement.
The standard deviation is larger near the edges of the laser sheet due to the limited SNR
from the spatial profile of the pump/Stokes beam.
Fig. 11. Spatially resolved 1-D temperature profile within the tube furnace at 600
Torr and 1000 K set point. The shaded error bars are the standard deviations of
temperatures evaluated from 50 single images taken with 2 second exposures. The
dashed line is the mean spatially integrated temperature evaluated from Fig. 10.
The spatial resolution of the fs/ps CARS measurement in this work was
approximately 0.04 mm x 0.04 mm x 0.5 mm with a crossing angle of 5 degrees. In the 600
Torr, 1000 K setpoint measurement, a single frame had 105 counts on the ground state peak
and 4000 counts on the largest hot band peak. Converted to a single shot signal-to-noise
ratio (SNR) by dividing by 40 laser shots results in a single shot SNR of 2500 and 100,
respectively. Detection with an intensified CCD (ICCD) or electron multiplying CCD
(EMCCD) would increase the SNR by up to 1000. The SNR is highly dependent on the
mole fraction of CH4 in the probe region as well as the pressure, temperature, and beam
interaction length. We estimate CH4 thermometry should be possible with an ICCD or
EMCCD at CH4 mole fractions of 1% at atmospheric pressure. However, this is dependent
on the temperature and correspondingly the CH4 hot band intensity. Additional
improvements to the setup such as higher bandwidth femtosecond pulses or higher probe
pulse energies could push this detection limit even further. To achieve spatial resolution
like that of the spontaneous Raman scattering experiments in [27], doubling of the beam
crossing angle would be required. This would reduce the signal by at least a factor of 4 and

17
raise the detection limit by a factor of 2. This trade-off between spatial resolution and signal
level is inherent to the CARS diagnostic. The SNR can be improved by increasing the
interaction path length, limited only by the coherence length in the case of collinear beams
[31].
4. Conclusions and outlook
In this work, we have developed and validated a time dependent CH4 fs/ps CARS
model with experimental probe delay scans for pressures ranging from 70 to 600 Torr and
temperatures ranging from 295 K to 1000 K. To our knowledge, this is the first time-
domain fs/ps CARS model for a hydrocarbon molecule as well as the first model for a
molecule larger than CO2 [82,83]. The experimental and modelled time delay traces
matched well for delays up to 500 ps at 295 K and 200 ps at higher temperatures. At later
delays, the coherence beating was qualitatively matched. Exploration of different linewidth
models such as energy corrected sudden scaling law (ECS) and use of a more detailed MEG
model could improve the fits at later time delays. In addition, fitting the ground state and
hot band linewidths separately could be explored to improve the temperature retrieval
accuracy. The effect of collisional partner was demonstrated to be negligible for early
probe delays before the characteristic molecular collision time. The effect of collisional
partner was demonstrated to be negligible for early probe delays. Differences in pure CH4
and CH4 mixtures with N2 and Ar were found to appear only after 100 ps, and a “collision
sensitivity time” was defined based on the measured time scale. This time scale was found
to be longer than the “collision-free” time but shorter than the mean time between
collisions. All time delay scans measured in this study were fit with a decaying exponential
function and the total Q-branch linewidths was extracted and tabulated to facilitate future
linewidth modelling efforts. Furthermore, we have demonstrated the ability to perform
thermometry in the frequency-domain with the CH4 𝜈1 Q-branch using fs/ps CARS and
found that the fitted temperatures corresponded well with those simultaneously measured
from the N2 Q-branch. However, only three high temperature set points were used.
Additional measurements at different temperatures, particularly at flame temperatures
exceeding 1000 K, would help improve and quantify the accuracy of the CH4 fs/ps CARS
thermometry.
1-D fs/ps CARS thermometry using the CH4 Q-branch was also demonstrated. The
developed model and experimental apparatus described in this work can be readily applied
to situations that require localized spatially resolved 1-D measurements of CH4.
Applications such as catalytic reforming of CH4 could leverage the ability of fs/ps CARS
to measure within 50 𝜇𝑚 of a solid surface [50]. Furthermore, common molecules used
for thermometry such as N2 or O2 may not be in the gas mixture. For instance, chemical
looping oxidation of CH4 does not have any N2 or O2 present in the gas phase for synthesis
of syngas and carbon sequestration [84]. In addition, at high temperatures, the relatively
large Raman cross-section of CH4 could help overcome sensitivity limits from reductions
in density. As a result, probing CH4 for quantification of concentration and temperature
would be both necessary and advantageous. Finally, with this model, non-equilibrium
vibrational distribution functions of CH4 like in [23] may be able to be detected and
quantified with 1-D fs/ps CARS imaging. The role of vibrational excitation in plasma
catalysis is not well-understood [6,85], and future near-surface measurements would be
important for further developments in this area.
18
Acknowledgements
We contribute this paper to celebrate Professor Ronald K. Hanson’s legacy in laser
diagnostics and chemical kinetics. This material is based upon work supported by the U.S.
Department of Energy (DOE), Office of Science, Office of Workforce Development for
Teachers and Scientists, Office of Science Graduate Student Research (SCGSR) program.
The SCGSR program is administered by the Oak Ridge Institute for Science and Education
(ORISE) for the DOE under contract number DE‐SC0014664. CJK and BMG were
supported by the Office of Chemical Sciences, Geosciences, and Biosciences, Office of
Basic Energy Sciences, U.S. Department of Energy. Sandia National Laboratories is a
multi-mission laboratory managed and operated by National Technology and Engineering
Solutions of Sandia, LLC, a wholly owned subsidiary of Honeywell International, Inc., for
the U.S. Department of Energy's National Nuclear Security Administration under Contract
DE-NA0003525. This paper describes objective technical results and analysis. Any
subjective views or opinions that might be expressed in the paper do not necessarily
represent the views of the US DOE or the US Government. YJ would like to thank the
funding support of DOE Plasma Science Center, NETL UCFER, and National Science
Foundation grants. TYC was partially supported by the Program in Plasma Science and
Technology Fellowship (PPST). TYC, EK, and YJ acknowledge the support of
ExxonMobil through its membership in the Princeton E-ffiliates Partnership of the
Andlinger Center for Energy and the Environment. The simulations presented in this article
were performed on computational resources managed and supported by the Princeton
Institute for Computational Science and Engineering and the Office of Information
Technology at Princeton University. We thank Brian D. Patterson for his technical
assistance in setting up the furnace and cell for the heated CH4 measurements. We also
thank Dr. Thomas Butterworth for providing the CH4 Raman transition line list used in this
work.
References
[1] U.S. Energy Information Administration, Annual Energy Outlook 2020, 2020.
[2] M.I. Khan, T. Yasmin, A. Shakoor, Technical overview of compressed natural gas
(CNG) as a transportation fuel, Renewable and Sustainable Energy Reviews. 51
(2015) 785–797.
[3] X. Tu, J.C. Whitehead, Plasma dry reforming of methane in an atmospheric pressure
AC gliding arc discharge: Co-generation of syngas and carbon nanomaterials,
International Journal of Hydrogen Energy. 39 (2014) 9658–9669.
[4] M. Rezaei, S.M. Alavi, S. Sahebdelfar, P. Bai, X. Liu, Z.-F. Yan, CO2 reforming of
CH4 over nanocrystalline zirconia-supported nickel catalysts, Applied Catalysis B:
Environmental. 77 (2008) 346–354.
[5] L. Wang, Y. Yi, C. Wu, H. Guo, X. Tu, One-Step Reforming of CO 2 and CH 4 into
High-Value Liquid Chemicals and Fuels at Room Temperature by Plasma-Driven
Catalysis, Angewandte Chemie International Edition. 56 (2017) 13679–13683.
[6] T. Nozaki, K. Okazaki, Non-thermal plasma catalysis of methane: Principles, energy
efficiency, and applications, Catalysis Today. 211 (2013) 29–38.

19
[7] W.-C. Chung, M.-B. Chang, Review of catalysis and plasma performance on dry
reforming of CH4 and possible synergistic effects, Renewable and Sustainable
Energy Reviews. 62 (2016) 13–31.
[8] H. de Coninck, A. Revi, M. Babiker, P. Bertoldi, M. Buckeridge, A. Cartwright, W.
Dong, J. Ford, S. Fuss, J.-C. Hourcade, Strengthening and implementing the global
response, (2018).
[9] P. Bergamaschi, M. Schupp, G.W. Harris, High-precision direct measurements of 13CH4/
12CH4 and 12CH3D/12CH4 ratios in atmospheric methane sources by means of a
long-path tunable diode laser absorption spectrometer, Appl. Opt., AO. 33 (1994)
7704–7716.
[10] V. Nagali, S.I. Chou, D.S. Baer, R.K. Hanson, J. Segall, Tunable diode-laser
absorption measurements of methane at elevated temperatures, Appl. Opt. 35 (1996)
4026.
[11] S.-I. Chou, D.S. Baer, R.K. Hanson, Diode laser absorption measurements of CH3Cl
and CH4 near 1.65 µm, Appl. Opt., AO. 36 (1997) 3288–3293.
[12] A.A. Kosterev, R.F. Curl, F.K. Tittel, C. Gmachl, F. Capasso, D.L. Sivco, J.N.
Baillargeon, A.L. Hutchinson, A.Y. Cho, Methane concentration and isotopic
composition measurements with a mid-infrared quantum-cascade laser, Opt. Lett. 24
(1999) 1762.
[13] S.H. Pyun, J. Cho, D.F. Davidson, R.K. Hanson, Interference-free mid-IR laser
absorption detection of methane, Meas. Sci. Technol. 22 (2011) 025303.
[14] R. Sur, S. Wang, K. Sun, D.F. Davidson, J.B. Jeffries, R.K. Hanson, High-sensitivity
interference-free diagnostic for measurement of methane in shock tubes, J. Quant.
Spectrosc. Radiat. Transf. 156 (2015) 80–87.
[15] N.G. Blume, V. Ebert, A. Dreizler, S. Wagner, Broadband fitting approach for the
application of supercontinuum broadband laser absorption spectroscopy to
combustion environments, Meas. Sci. Technol. 27 (2016) 015501.
[16] J.J. Barrett, R.F. Begley, Low‐power cw generation of coherent anti‐Stokes Raman
radiation in CH4 gas, Appl. Phys. Lett. 27 (1975) 129–131.
[17] D.N. Kozlov, A.M. Prokhorov, V.V. Smirnov, The methane ν1 (a1) vibrational state
rotational structure obtained from high-resolution CARS-spectra of the Q-branch,
Journal of Molecular Spectroscopy. 77 (1979) 21–28.
[18] H. Frunder, D. Illig, H. Finsterhölzl, H.W. Schrōtter, B. Lavorel, G. Roussel, J.C.
Hilico, J.P. Champion, G. Pierre, G. Poussigue, E. Pascaud, Revised analysis of the
structure of the v1 band of methane, Chemical Physics Letters. 100 (1983) 110–114.
[19] M. Ridder, A.A. Suvernev, T. Dreier, Collision effects in nitrogen and methane
coherent anti‐Stokes Raman isotropic Q ‐branch spectra at high densities, The Journal
of Chemical Physics. 105 (1996) 3376–3386.
[20] D. Pieroni, J.-M. Hartmann, F. Chaussard, X. Michaut, T. Gabard, R. Saint-Loup, H.
Berger, J.-P. Champion, Experimental and theoretical study of line mixing in methane
spectra. III. The Q branch of the Raman ν1 band, The Journal of Chemical Physics.
112 (2000) 1335–1343.
[21] E. Jourdanneau, T. Gabard, F. Chaussard, R. Saint-Loup, H. Berger, E. Bertseva, F.
Grisch, CARS methane spectra: Experiments and simulations for temperature
diagnostic purposes, Journal of Molecular Spectroscopy. 246 (2007) 167–179.

20
[22] E. Jourdanneau, F. Chaussard, R. Saint-Loup, T. Gabard, H. Berger, The methane
Raman spectrum from 1200 to 5500cm−1: A first step toward temperature diagnostic
using methane as a probe molecule in combustion systems, Journal of Molecular
Spectroscopy. 233 (2005) 219–230.
[23] T.D. Butterworth, B. Amyay, D. v. d. Bekerom, A. v. d. Steeg, T. Minea, N. Gatti, Q.
Ong, C. Richard, C. van Kruijsdijk, J.T. Smits, A.P. van Bavel, V. Boudon, G.J. van
Rooij, Quantifying methane vibrational and rotational temperature with Raman
scattering, J. Quant. Spectrosc. Radiat. Transf. 236 (2019) 106562.
[24] G. Magnotti, U. Kc, P.L. Varghese, R.S. Barlow, Raman spectra of methane,
ethylene, ethane, dimethyl ether, formaldehyde and propane for combustion
applications, J. Quant. Spectrosc. Radiat. Transf. 163 (2015) 80–101.
[25] I.E. Gordon, L.S. Rothman, C. Hill, R.V. Kochanov, Y. Tan, P.F. Bernath, M. Birk,
V. Boudon, A. Campargue, K.V. Chance, B.J. Drouin, J.M. Flaud, R.R. Gamache,
J.T. Hodges, D. Jacquemart, V.I. Perevalov, A. Perrin, K.P. Shine, M.A.H. Smith, J.
Tennyson, G.C. Toon, H. Tran, V.G. Tyuterev, A. Barbe, A.G. Császár, V.M. Devi,
T. Furtenbacher, J.J. Harrison, J.M. Hartmann, A. Jolly, T.J. Johnson, T. Karman, I.
Kleiner, A.A. Kyuberis, J. Loos, O.M. Lyulin, S.T. Massie, S.N. Mikhailenko, N.
Moazzen-Ahmadi, H.S.P. Müller, O.V. Naumenko, A.V. Nikitin, O.L. Polyansky, M.
Rey, M. Rotger, S.W. Sharpe, K. Sung, E. Starikova, S.A. Tashkun, J.V. Auwera, G.
Wagner, J. Wilzewski, P. Wcisło, S. Yu, E.J. Zak, The HITRAN2016 molecular
spectroscopic database, J. Quant. Spectrosc. Radiat. Transf. 203 (2017) 3–69.
[26] A. Farooq, J.B. Jeffries, R.K. Hanson, In situcombustion measurements of H2O and
temperature near 2.5 µm using tunable diode laser absorption, Measurement Science
and Technology. 19 (2008).
[27] R.S. Barlow, S. Meares, G. Magnotti, H. Cutcher, A.R. Masri, Local extinction and
near-field structure in piloted turbulent CH4/air jet flames with inhomogeneous inlets,
Combustion and Flame. 162 (2015) 3516–3540.
[28] A. Lo, A. Cessou, P. Vervisch, Space and time analysis of the nanosecond scale
discharges in atmospheric pressure air: II. Energy transfers during the post-discharge,
Journal of Physics D: Applied Physics. 47 (2014) 115202.
[29] M. Sneep, W. Ubachs, Direct measurement of the Rayleigh scattering cross section
in various gases, J. Quant. Spectrosc. Radiat. Transf. 92 (2005) 293–310.
[30] W.R. Fenner, H.A. Hyatt, J.M. Kellam, S.P.S. Porto, Raman cross section of some
simple gases, J. Opt. Soc. Am., JOSA. 63 (1973) 73–77.
[31] W.M. Tolles, J.W. Nibler, J.R. McDonald, A.B. Harvey, A Review of the Theory and
Application of Coherent Anti-Stokes Raman Spectroscopy (CARS), Appl. Spectrosc.,
AS. 31 (1977) 253–271.
[32] J. Jonuscheit, A. Thumann, M. Schenk, T. Seeger, A. Leipertz, One-dimensional
vibrational coherent anti-Stokes Raman-scattering thermometry, Opt. Lett. 21 (1996)
1532.
[33] J.H. Stufflebeam, A.C. Eckbreth, CARS TEMPERATURE AND SPECIES
MEASUREMENTS IN PROPELLANT FLAMES, IJEMCP. 3 (1994).
[34] A.C. ECKBRETH, R.J. HALL, CARS Concentration Sensitivity With and Without
Nonresonant Background Suppression, Combustion Science and Technology. 25
(1981) 175–192.
21
[35] F. Vestin, M. Afzelius, P.-E. Bengtsson, Development of rotational CARS for
combustion diagnostics using a polarization approach, Proc. Combust. Inst. 31 (2007)
833–840.
[36] G. Marowsky, G. Lüpke, CARS-Background suppression by phase-controlled
nonlinear interferometry, Appl. Phys. B. 51 (1990) 49–51.
[37] B.D. Prince, A. Chakraborty, B.M. Prince, H.U. Stauffer, Development of
simultaneous frequency- and time-resolved coherent anti-Stokes Raman scattering for
ultrafast detection of molecular Raman spectra, The Journal of Chemical Physics. 125
(2006) 044502.
[38] D. Pestov, R.K. Murawski, G.O. Ariunbold, X. Wang, M. Zhi, A.V. Sokolov, V.A.
Sautenkov, Y.V. Rostovtsev, A. Dogariu, Y. Huang, M.O. Scully, Optimizing the
Laser-Pulse Configuration for Coherent Raman Spectroscopy, Science. 316 (2007)
265–268.
[39] H.U. Stauffer, J.D. Miller, M.N. Slipchenko, T.R. Meyer, B.D. Prince, S. Roy, J.R.
Gord, Time- and frequency-dependent model of time-resolved coherent anti-Stokes
Raman scattering (CARS) with a picosecond-duration probe pulse, The Journal of
Chemical Physics. 140 (2014) 024316.
[40] W.D. Kulatilaka, P.S. Hsu, H.U. Stauffer, J.R. Gord, S. Roy, Direct measurement of
rotationally resolved H2 Q-branch Raman coherence lifetimes using time-resolved
picosecond coherent anti-Stokes Raman scattering, Appl. Phys. Lett. 97 (2010)
081112.
[41] A. Bohlin, B.D. Patterson, C.J. Kliewer, Communication: Simplified two-beam
rotational CARS signal generation demonstrated in 1D, The Journal of Chemical
Physics. 138 (2013) 081102.
[42] A. Bohlin, C.J. Kliewer, Communication: Two-dimensional gas-phase coherent anti-
Stokes Raman spectroscopy (2D-CARS): Simultaneous planar imaging and multiplex
spectroscopy in a single laser shot, The Journal of Chemical Physics. 138 (2013)
221101.
[43] A. Bohlin, C.J. Kliewer, Two-beam ultrabroadband coherent anti-Stokes Raman
spectroscopy for high resolution gas-phase multiplex imaging, Appl. Phys. Lett. 104
(2014) 031107.
[44] S.P. Kearney, D.J. Scoglietti, Hybrid femtosecond/picosecond rotational coherent
anti-Stokes Raman scattering at flame temperatures using a second-harmonic
bandwidth-compressed probe, Opt. Lett. 38 (2013) 833.
[45] J.D. Miller, S. Roy, J.R. Gord, T.R. Meyer, Communication: Time-domain
measurement of high-pressure N2 and O2 self-broadened linewidths using hybrid
femtosecond/picosecond coherent anti-Stokes Raman scattering, J. Chem. Phys. 135
(2011) 201104.
[46] C.E. Dedic, T.R. Meyer, J.B. Michael, Single-shot ultrafast coherent anti-Stokes
Raman scattering of vibrational/rotational nonequilibrium, Optica. 4 (2017) 563.
[47] S.R. Engel, J.D. Miller, C.E. Dedic, T. Seeger, A. Leipertz, T.R. Meyer, Hybrid
femtosecond/picosecond coherent anti-Stokes Raman scattering for high-speed CH 4
/N 2 measurements in binary gas mixtures: Hybrid fs/ps CARS for high-speed CH 4
/N 2 measurements, J. Raman Spectrosc. 44 (2013) 1336–1343.

22
[48] M. Scherman, M. Nafa, T. Schmid, A. Godard, A. Bresson, B. Attal-Tretout, P.
Joubert, Rovibrational hybrid fs/ps CARS using a volume Bragg grating for N_2
thermometry, Opt. Lett. 41 (2016) 488.
[49] J.E. Retter, G.S. Elliott, S.P. Kearney, Dielectric-barrier-discharge plasma-assisted
hydrogen diffusion flame. Part 1: Temperature, oxygen, and fuel measurements by
one-dimensional fs/ps rotational CARS imaging, Combustion and Flame. 191 (2018)
527–540.
[50] A. Bohlin, C. Jainski, B.D. Patterson, A. Dreizler, C.J. Kliewer, Multiparameter
spatio-thermochemical probing of flame–wall interactions advanced with coherent
Raman imaging, Proceedings of the Combustion Institute. 36 (2017) 4557–4564.
[51] T.Y. Chen, B.M. Goldberg, B.D. Patterson, E. Kolemen, E. Kolemen, Y. Ju, C.J.
Kliewer, 1-D imaging of rotation-vibration non-equilibrium from pure rotational
ultrafast coherent anti-Stokes Raman scattering, Opt. Lett., OL. 45 (2020) 4252–
4255.
[52] J. Kiefer, T. Seeger, S. Steuer, S. Schorsch, M.C. Weikl, A. Leipertz, Design and
characterization of a Raman-scattering-based sensor system for temporally resolved
gas analysis and its application in a gas turbine power plant, Meas. Sci. Technol. 19
(2008) 085408.
[53] D. Bermejo, J. Santos, P. Cancio, High-resolution q-cw SRS spectrum of 12CH4 in
the region of the level crossing between ν1 and ν2 + ν4, Journal of Molecular
Spectroscopy. 156 (1992) 15–21.
[54] A. Bohm, N.L. Harshman, H. Walther, Relating the Lorentzian and exponential:
Fermi’s approximation, the Fourier transform, and causality, Phys. Rev. A. 66 (2002)
012107.
[55] S.P. Kearney, P.M. Danehy, Pressure measurements using hybrid
femtosecond/picosecond rotational coherent anti-Stokes Raman scattering, Opt. Lett.,
OL. 40 (2015) 4082–4085.
[56] D. Escofet-Martin, A.O. Ojo, J. Collins, N.T. Mecker, M. Linne, B. Peterson, Dual-
probe 1D hybrid fs/ps rotational CARS for simultaneous single-shot temperature,
pressure, and O2/N2 measurements, Opt. Lett., OL. 45 (2020) 4758–4761.
[57] J.D. Miller, S. Roy, J.R. Gord, T.R. Meyer, Communication: Time-domain
measurement of high-pressure N2 and O2 self-broadened linewidths using hybrid
femtosecond/picosecond coherent anti-Stokes Raman scattering, J. Chem. Phys. 135
(2011) 201104.
[58] C.J. Kliewer, A. Bohlin, E. Nordström, B.D. Patterson, P.-E. Bengtsson, T.B.
Settersten, Time-domain measurements of S-branch N2–N2 Raman linewidths using
picosecond pure rotational coherent anti-Stokes Raman spectroscopy, Appl. Phys. B.
108 (2012) 419–426.
[59] A. Hosseinnia, M. Ruchkina, P. Ding, P.-E. Bengtsson, J. Bood, Simultaneous
temporally and spectrally resolved Raman coherences with single-shot fs/ns rotational
CARS, Opt. Lett., OL. 45 (2020) 308–311.
[60] S. Roy, P.S. Hsu, N. Jiang, J.R. Gord, W.D. Kulatilaka, H.U. Stauffer, J.R. Gord,
Direct measurements of collisionally broadened Raman linewidths of CO2 S-branch
transitions, J. Chem. Phys. 138 (2013) 024201.
[61] H. Graener, J.W. Nibler, A. Laubereau, Picosecond coherent anti-Stokes Raman
spectroscopy of molecules in free jet expansions, Opt. Lett. 9 (1984) 165.

23
[62] H. Graener, A. Laubereau, High resolution Fourier transform Raman spectroscopy
with ultrashort laser pulses, Optics Communications. 54 (1985) 141–146.
[63] M.L. STREKALOV, Rotational energy relaxation in CH4 and CH4-He, Ar collisions
calculated from coherent and stimulated Raman spectroscopy data, Molecular
Physics. 100 (2002) 1049–1056.
[64] L. Martinsson, P. Bengtsson, M. Aldén, S. Kröll, J. Bonamy, A test of different
rotational Raman linewidth models: Accuracy of rotational coherent anti‐Stokes
Raman scattering thermometry in nitrogen from 295 to 1850 K, The Journal of
Chemical Physics. 99 (1993) 2466–2477.
[65] T. Seeger, F. Beyrau, A. Bräuer, A. Leipertz, High-pressure pure rotational CARS:
comparison of temperature measurements with O 2 , N 2 and synthetic air: High-
pressure pure rotational CARS, J. Raman Spectrosc. 34 (2003) 932–939.
[66] J.R. Hetzler, J.I. Steinfeld, State‐to‐state rotational energy transfer measurements in
silane by infrared double resonance with a tunable diode laser, J. Chem. Phys. 92
(1990) 7135–7155.
[67] J.J. Klaassen, S.L. Coy, J.I. Steinfeld, Ch. Roche, State‐to‐state rotational energy
transfer measurements in methane (CHD3) by infrared double resonance with a
tunable diode laser, J. Chem. Phys. 100 (1994) 5519–5532.
[68] B. Foy, J. Hetzler, G. Millot, J.I. Steinfeld, State‐to‐state rotational energy transfer in
methane (13CD4) from infrared double‐resonance experiments with a tunable diode
laser, J. Chem. Phys. 88 (1988) 6838–6852.
[69] Ch. Wenger, J.P. Champion, Spherical top data system (STDS) software for the
simulation of spherical top spectra, J. Quant. Spectrosc. Radiat. Transf. 59 (1998)
471–480.
[70] L.A. Rahn, R.E. Palmer, Studies of nitrogen self-broadening at high temperature with
inverse Raman spectroscopy, J. Opt. Soc. Am. B. 3 (1986) 1164.
[71] M.L. Koszykowski, L.A. Rahn, R.E. Palmer, M.E. Coltrin, Theoretical and
experimental studies of high-resolution inverse Raman spectra of molecular nitrogen
at 1-10 atm, J. Phys. Chem. 91 (1987) 41–46.
[72] G. Tarrago, M. Dang-Nhu, G. Poussigue, G. Guelachvili, C. Amiot, The ground state
of methane 12CH4 through the forbidden lines of the ν3 band, Journal of Molecular
Spectroscopy. 57 (1975) 246–263.
[73] A. Chakraborty, D.G. Truhlar, J.M. Bowman, S. Carter, Calculation of converged
rovibrational energies and partition function for methane using vibrational–rotational
configuration interaction, J. Chem. Phys. 121 (2004) 2071–2084.
[74] J.J. Klaassen, S.L. Coy, J.I. Steinfeld, B. Abel, Direct measurement of rotational and
vibrational relaxation in methane overtone levels by time‐resolved infrared double‐
resonance spectroscopy, The Journal of Chemical Physics. 101 (1994) 10533–10547.
[75] F. Menard-Bourcin, L. Doyennette, J. Menard, C. Boursier, Time-Resolved IR−IR
Double Resonance Measurements in Methane Excited to 2ν 3 (F 2 ), J. Phys. Chem.
A. 104 (2000) 5444–5450.
[76] T.L. Courtney, C.J. Kliewer, Rotational coherence beating in molecular oxygen:
Coupling between electronic spin and nuclear angular momenta, J. Chem. Phys. 149
(2018) 234201.
[77] C.-J. Chen, M.H. Back, R.A. Back, The Thermal Decomposition of Methane. I.
Kinetics of the Primary Decomposition to C2H6 + H2 ; Rate Constant for the
24
Homogeneous Unimolecular Dissociation of Methane and its Pressure Dependence,
Can. J. Chem. 53 (1975) 3580–3590.
[78] A. Esposito, M. Lappa, G. Zuppardi, C. Allouis, B. Apicella, M. Commodo, P.
Minutolo, C. Russo, On the Formation and Accumulation of Solid Carbon Particles
in High-Enthalpy Flows Mimicking Re-Entry in the Titan Atmosphere, Fluids. 5
(2020) 93.
[79] R.J. Hall, J.F. Verdieck, A.C. Eckbreth, Pressure-induced narrowing of the cars
spectrum of N2, Optics Communications. 35 (1980) 69–75.
[80] F. Grisch, E. Bertseva, M. Habiballah, E. Jourdanneau, F. Chaussard, R. Saint-Loup,
T. Gabard, H. Berger, CARS spectroscopy of CH4 for implication of temperature
measurements in supercritical LOX/CH4 combustion, Aerospace Science and
Technology. 11 (2007) 48–54.
[81] T.L. Courtney, N.T. Mecker, B.D. Patterson, M. Linne, C.J. Kliewer, Hybrid
femtosecond/picosecond pure rotational anti-Stokes Raman spectroscopy of nitrogen
at high pressures (1–70 atm) and temperatures (300–1000 K), Appl. Phys. Lett. 114
(2019) 101107.
[82] M. Kerstan, I. Makos, S. Nolte, A. Tünnermann, R. Ackermann, Two-beam
femtosecond coherent anti-Stokes Raman scattering for thermometry on CO 2, Appl.
Phys. Lett. 110 (2017) 021116.
[83] M. Gu, A. Satija, R.P. Lucht, CO2 chirped-probe-pulse femtosecond CARS
thermometry, Proc. Combust. Inst. (2020).
[84] T. Mattisson, A. Järdnäs, A. Lyngfelt, Reactivity of Some Metal Oxides Supported
on Alumina with Alternating Methane and OxygenApplication for Chemical-Looping
Combustion, Energy Fuels. 17 (2003) 643–651.
[85] P. Mehta, P. Barboun, F.A. Herrera, J. Kim, P. Rumbach, D.B. Go, J.C. Hicks, W.F.
Schneider, Overcoming ammonia synthesis scaling relations with plasma-enabled
catalysis, Nat Catal. 1 (2018) 269–275.