Embed Size (px)
Citation preview

1 | P a g e
2013 Budget Final
December 19, 2012
All Funds
Timberland Regional Library

2 | P a g e
Timberland Regional Library Board of Trustees:
Emmett O’Connell, President
John E. Braun, President-Elect
Edna J. Fund, CRC
Bob Hall
Stephen Hardy
Corby Varness
Judy Weaver
Budget Prepared by:
Gwen Culp, Acting Library Director and Information Technology
Cheryl Heywood, Manager, Public Services
Rich Park, Manager, Human Resources
Jeff Kleingartner, Manager, Communications
Felicia Wilson, Manager, Collection Services
Rick Homchick, Business Manager
With Assistance From:
Ellen Duffy, Youth Services Coordinator
Tim Mallory, Reference and Adult Services Coordinator
Nancy Schutz, Training Coordinator
ACKNOWLEDGEMENTS
3 | P a g e
Timberland Regional Library’s budget can be complex and confusing. To better understand the purpose of the
library’s budget, background information and knowledge of a few assumptions are presented. This section will
attempt to provide the reader with the necessary contextual information to make the Budget document a
meaningful and useful guide to TRL’s 2013 planning and policy goals.
INTRODUCTION
Information to orient the reader on the
2013 Budget including:
A Budget Message
TRL’s Mission and Vision Statements
A description of the annual budget process
A brief glance at the 2013 Budget, including
revenue and expenditure summary statements
An overview of Changes in Fund Balance
Public Service Staffing Summary
Timeline of Major Events
POLICIES/GUIDELINES
This section provides an overview of
budget priorities and financial policies
to ascertain that the budget is meeting
the Library’s planning and policy goals for
programs and services as well as finances.
Budget Priorities
Three-year projections
Library’s Financial Policies for review
REVENUE/EXPENDITURES/FUND BALANCE
Provides a more detailed overview of revenue/
expenditure/fund balance sources and
associated assumptions. This section also
contains historical trends that support
Timberland Regional Library operational
estimates.
BUDGET DEVELOPMENT

4 | P a g e
BUDGET MESSAGE
Timberland Regional Library utilizes priority based
budgeting. Each year TRL identifies the most
important priorities, determines how much revenue
is available and allocates available resources to
those priorities at the appropriate level of
investment. It seems simple unless economic
conditions are such that new resources are flat,
expenditures are rising, and demand for services is
increasing. The 2013 Budget incorporates those
various challenges.
Since 2005 tough decisions have been made
that restructured administrative services,
trimmed open hours, and cut substitute
employees, all prior to the economic
downturn of 2008. Since that time
expenditures have been aggressively
managed as the recession has lasted longer
than anyone expected. However, aggressively
managing expenditures is not a long-term strategy.
The 2013 Budget Priorities were developed with the
idea that 2013 revenue for Timberland Regional
Library will be stable but limited, particularly with
respect to new revenues. Property values are
stagnant or declining and new construction values
are 13.8% less than 2011 values and 20.8% less than
2010 values (preliminary information).
Our experiences over the last several years have
demonstrated the need to think long-term for
strategy. Long-term strategy protects against
unexpected downturns and provides flexibility to
respond to unexpected opportunities when they
arise. The goal is to maintain an adequate fund level
and identify necessary expenditures so that service
levels can remain consistent and additional tax
increases are not needed.
The General Fund Overview
General Fund projected expenditures, comprising
the basic cost elements for essential library services,
are up 5.04% over the 2012 Budget. General Fund
revenues are up 2.82% over last year. In order to
balance the 2013 General Fund $39,210 will need to
come from existing reserves.
Timberland Regional Library’s two biggest
cost drivers are always salaries and wages,
70% of operating expenditures, and books
and materials, 15.9% of operating
expenditures.
Another increase to the Public Employees
Retirement System employer contribution is
proposed for July 2013 from the Pension Funding
Council. The increase, included for the 2013 Budget,
takes the employer rate from 7.21% to 9.19%, an
additional expenditure of $108,000. Washington
State’s Retirement System is secure with Plans 2 and
3 funded above 100%, meaning a plan has assets of
at least $1 for every $1 of earned pension liability.
Many thanks to all staff who completed the LiveWell
incentive program. Timberland Regional Library met
its goal and all employees enrolled in medical
coverage will receive the 4% premium discount.
INTRODUCTION

5 | P a g e
The Building Fund Overview
Timberland Regional Library maintains a Building
Fund to pay for building or remodeling and
maintenance of TRL owned library facilities and for
assistance with the design and planning of new or
remodeled city-owned library facilities.
The 2013 Building Fund Budget continues to move
us towards implementation of a long-term funding
strategy. Consideration for space planning for the
future library service model will begin in addition to
the continued use of the Service Points Analysis for a
full and equitable method to evaluate and prioritize
requests for change to our service points.
Timberland Regional Library recognizes the need to
financially partner with cities for new, enlarged and
remodeled library facilities and will review policy
options more fully in 2013.
The Automated Circulation Fund Overview
Timberland Regional Library maintains an
Automated Circulation Fund for the purchase and
implementation of the library’s integrated library
system, major purchases of computer network and
telecommunications equipment.
The last major initiatives within this fund were the
upgrade of the ILS in 2010 and upgrade to the
telecommunication systems of 2010 and 2011.
Included for 2013 is a firewall replacement.
The Unemployment Compensation Fund Overview
Timberland Regional Library maintains the
Unemployment Compensation Fund for
compensation payments in a self-insurance
program.
The Gift Fund Overview
Timberland Regional Library uses the Gift Fund to
track receipts and disbursements for restricted gifts
and bequests to libraries.
Conclusion
Priority based budgeting allows for strategy within a
context of overall long-term strategic planning. The
over-arching goal of the 2013 Budget is to shape the
highest priority for services as determined by public
and staff input, within the limits of available
resources, and with an eye on the future for long-
term planning needs. Context paired with purpose
is where examination of the 2013 Budget begins.
TRL MISSION STATEMENT
Timberland Regional Library provides:
Information, Resources, Services, and Places
Where all people are free to:
Read, Learn, Connect, and Grow
TRL VISION STATEMENT
For every reader, the best book
For every question, the best answer
For every need, the best resource
For every encounter, the best experience
For every library dollar, the best value
For every person, a place to belong
Approved by the TRL Board of Trustees, March 23, 2005

6 | P a g e
ANNUAL BUDGET PROCESS
The annual budget process involves teamwork and cooperation among many groups, including our communities,
the Board of Trustees, our cities, our bargaining units, the Board Budget and Facilities Committees and staff. The
annual operating budget is prepared on a calendar year basis and consists of the six distinct phases as follows:
1. The PLANNING stage: The Budget Committee provides guidance on how to direct Departments in
developing their budgets for the coming year – what the constraints are and what priorities to focus on.
2. The DEVELOPMENT AND PREPARATION stage: The Departments develop and submit their budget
requests to be reviewed and prioritized. The submitted requests are balanced against projected
revenues and expenses as the Preliminary Budget is developed.
3. The REVIEW AND ADOPTION stage: The Board of Trustees reviews the Preliminary Budget, seeks input
from the public, makes budget adjustments and then adopts the Final Budget for the next calendar year.
4. The IMPLEMENTATION stage: Programs financed by the approved budget are carried out. The budget
year is on a calendar year, January 1 through December 31, 2013. Appropriations lapse at year end.
5. The MONITORINIG stage: Expenditures are monitored by the Director and the management team
throughout the year to ensure that funds are used in an approved manner. Department managers
receive monthly detailed budget reports and are responsible for monitoring expenditures paid from each
line item. These reports indicate approved budgets for each line item and department/program/line of
business. They indicate what has been spent for the month, year-to-date, and what is still unspent.
6. The EVALUATION stage: Audits are conducted and annual financial reports are produced.
ANNUAL BUDGET PROCESS

7 | P a g e
General Building Auto. Circ. Unemp. Gift Total
Fund Fund Fund Fund Fund Funds
ESTIMATED REVENUES:
Property Taxes 18,418,101 0 0 0 0 18,418,101
Other Revenues 2,281,434 63,000 9,500 1,400 80,000 2,435,334
Total Est. Revenues 20,699,535 63,000 9,500 1,400 80,000 20,853,435
Required Beg. Fund Bal. 0 887,000 0 0 25,000 912,000
Operating Transfers-In 0 250,000 24,000 26,000 0 300,000
Total Resources 20,699,535 1,200,000 33,500 27,400 105,000 22,065,435
========================================================================
ESTIMATED EXPENDITURES:
Total Budget 19,745,196 1,200,000 23,142 19,777 105,000 21,093,115
Operating Transfer-Out 300,000 0 0 0 0 300,000
Intergovernmental 0 0 0 0 0 0
Ending Fund Balance 654,338 0 10,358 7,623 0 672,319
Total Uses 20,699,535 1,200,000 33,500 27,400 105,000 22,065,435
========================================================================
PROJECTED FUND BALANCES:
Fund Balance 01/01/12 $8,643,720.80 $1,471,867.62 $622,287.82 $154,935.10 $938,289.17 $11,831,100.51
Fund Balance Use 0.00 (887,000.00) 0.00 0.00 (25,000.00) (912,000.00)
Fund Balance Increase $836,239 $0 $10,358 $7,623 $0 $854,220
Fund Balance 12/31/12 $9,479,959.80 $584,867.62 $632,645.82 $162,558.10 $913,289.17 $11,773,320.51
TIMBERLAND REGIONAL LIBRARY
2012 ESTIMATED REVENUES , EXPENDITURES AND FUND BALANCES
Final - December 19, 2012 - ALL FUNDS
8 | P a g e
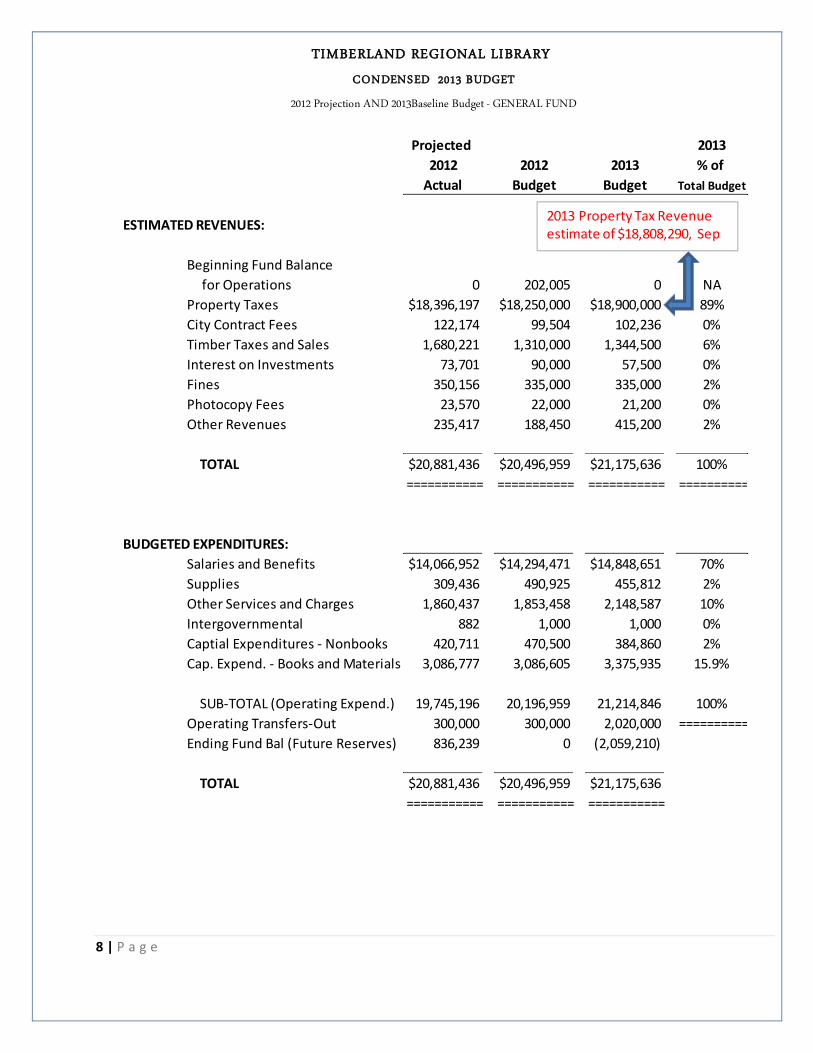
Projected 2013
2012 2012 2013 % of
Actual Budget Budget Total Budget
ESTIMATED REVENUES:
Beginning Fund Balance
for Operations 0 202,005 0 NA
Property Taxes $18,396,197 $18,250,000 $18,900,000 89%
City Contract Fees 122,174 99,504 102,236 0%
Timber Taxes and Sales 1,680,221 1,310,000 1,344,500 6%
Interest on Investments 73,701 90,000 57,500 0%
Fines 350,156 335,000 335,000 2%
Photocopy Fees 23,570 22,000 21,200 0%
Other Revenues 235,417 188,450 415,200 2%
TOTAL $20,881,436 $20,496,959 $21,175,636 100%
=========== =========== =========== ==========
BUDGETED EXPENDITURES:
Salaries and Benefits $14,066,952 $14,294,471 $14,848,651 70%
Supplies 309,436 490,925 455,812 2%
Other Services and Charges 1,860,437 1,853,458 2,148,587 10%
Intergovernmental 882 1,000 1,000 0%
Captial Expenditures - Nonbooks 420,711 470,500 384,860 2%
Cap. Expend. - Books and Materials 3,086,777 3,086,605 3,375,935 15.9%
SUB-TOTAL (Operating Expend.) 19,745,196 20,196,959 21,214,846 100%
Operating Transfers-Out 300,000 300,000 2,020,000 ==========
Ending Fund Bal (Future Reserves) 836,239 0 (2,059,210)
TOTAL $20,881,436 $20,496,959 $21,175,636
=========== =========== ===========
TIMBERLAND REGIONAL LIBRARY
CONDENSED 2013 BUDGET
2012 Projection AND 2013Baseline Budget - GENERAL FUND
2013 Property Tax Revenue estimate of $18,808,290, Sep

9 | P a g e
General Building Auto. Circ. Unemp. Gift Total
Fund Fund Fund Fund Fund Funds
ESTIMATED REVENUES:
Property Taxes 18,900,000 0 0 0 0 18,900,000
Other Revenues 2,275,636 15,000 6,000 1,300 50,000 2,347,936
Total Est. Revenues 21,175,636 15,000 6,000 1,300 50,000 21,247,936
Operating Transfers-In 0 1,700,000 300,000 20,000 0 2,020,000
Total Resources 21,175,636 1,715,000 306,000 21,300 50,000 23,267,936
========================================================================
APPROPRIATIONS:
Total Budget 21,214,846 539,996 130,060 21,000 50,000 21,955,902
Operating Transfer-Out 2,020,000 0 0 0 0 2,020,000
Intergovernmental 0 0 0 0 0 0
Reserve In(De)crease -2,059,210 1,175,004 175,940 300 0 -707,966
Total Uses 21,175,636 1,715,000 306,000 21,300 50,000 23,267,936
========================================================================
PROJECTED FUND BALANCES:
Fund Balance 01/01/13 $9,479,959.80 $584,867.62 $632,645.82 $162,558.10 $938,289.17 $11,798,320.51
Reserve In(De)crease (2,059,210) 1,175,004 175,940 300 0 (707,966)
Fund Balance 12/31/13 $7,420,749.80 $1,759,871.62 $808,585.82 $162,858.10 $938,289.17 $11,090,354.51
TIMBERLAND REGIONAL LIBRARY
2013 Baseline REVENUES AND APPROPRIATIONS
Final - December 19, 2012 - ALL FUNDS

10 | P a g e
Public Service People Resources
Aberdeen
9.875 FTEs
Thurston
78.05 FTEs
(77.25 ‘12) Mason
23.475 FTEs
(22.475 ’12)
Lewis
29.6 FTEs
(30.225 ’12)
Pacific
15.35 FTEs
(15.30 ‘12)
Amanda Park
1.6 FTEs
Elma
3.75 FTEs (4.0 ‘12)
Hoquiam
4.4 FTEs
McCleary
1.7 FTEs
Montesano
3.5 FTEs
Oakville
1.75 FTEs
Centralia
12.75 FTEs (13.375 ’12)
Chehalis
7.5 FTEs
Mt View
2.125 FTEs
Packwood
1.775 FTEs
Salkum
2.15 FTEs
Winlock
3.3 FTEs
Hoodsport
1.8 FTEs
North Mason
6.25 FTEs
Shelton
15.425 FTEs (14.425 ’12)
Ilwaco
3.1 FTEs
Naselle
2.65 FTEs
Ocean Park
3.25 FTEs
Raymond
4.0 FTEs
South Bend
2.35 FTEs (2.30 ’12)
Lacey
24.4 FTEs (23.75 ’12)
Olympia
25.1 FTEs (24.7 ’12)
Tenino
2.7 FTEs (3.2 ‘12)
Tumwater
16.85 FTEs (16.6 ’12)
Yelm
9.0 FTEs
Grays Harbor
29.075 FTEs
(29.325 ’12)
Public Service
175.55 FTEs
(174.575 ’12)
2013 PUBLIC SERVICE PEOPLE RESOURCES
Westport
2.5 FTEs
11 | P a g e
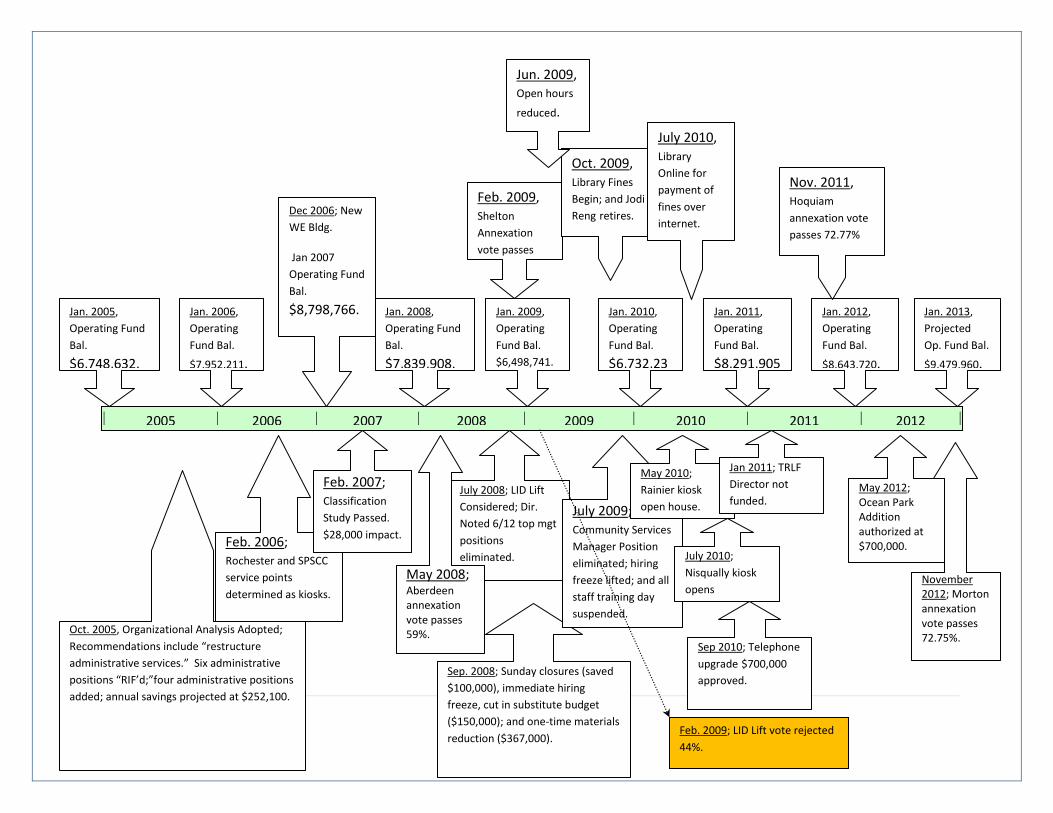
2005 2006 2007 2008 2009 2010 2011 2012
Jan. 2012,
Operating
Fund Bal.
$8,643,720.
Dec 2006; New
WE Bldg.
Jan 2007
Operating Fund
Bal.
$8,798,766. Jan. 2006,
Operating
Fund Bal.
$7,952,211.
Feb. 2006; Rochester and SPSCC
service points
determined as kiosks.
Sep. 2008; Sunday closures (saved
$100,000), immediate hiring
freeze, cut in substitute budget
($150,000); and one-time materials
reduction ($367,000).
Feb. 2007; Classification
Study Passed.
$28,000 impact.
Jan. 2005,
Operating Fund
Bal.
$6,748,632.
Oct. 2005, Organizational Analysis Adopted;
Recommendations include “restructure
administrative services.” Six administrative
positions “RIF’d;”four administrative positions
added; annual savings projected at $252,100.
Jan. 2008,
Operating Fund
Bal.
$7,839,908.
Jan. 2009,
Operating
Fund Bal.
$6,498,741.
Jan. 2010,
Operating
Fund Bal.
$6,732,23
4.
Jan. 2011,
Operating
Fund Bal.
$8,291,905
.
July 2008; LID Lift
Considered; Dir.
Noted 6/12 top mgt
positions
eliminated.
May 2008; Aberdeen annexation vote passes 59%.
July 2009; Community Services
Manager Position
eliminated; hiring freeze lifted; and all
staff training day suspended.
Feb. 2009, Shelton
Annexation
vote passes
88.3%.
Oct. 2009, Library Fines
Begin; and Jodi
Reng retires.
Jun. 2009, Open hours
reduced.
May 2010;
Rainier kiosk
open house.
July 2010;
Nisqually kiosk
opens
.
Sep 2010; Telephone
upgrade $700,000
approved.
Jan 2011; TRLF
Director not
funded. May 2012; Ocean Park Addition authorized at $700,000.
Feb. 2009; LID Lift vote rejected
44%.
Jan. 2013,
Projected
Op. Fund Bal.
$9,479,960.
November 2012; Morton annexation vote passes 72.75%.
Nov. 2011, Hoquiam
annexation vote
passes 72.77%
July 2010, Library
Online for
payment of
fines over
internet.
12 | P a g e
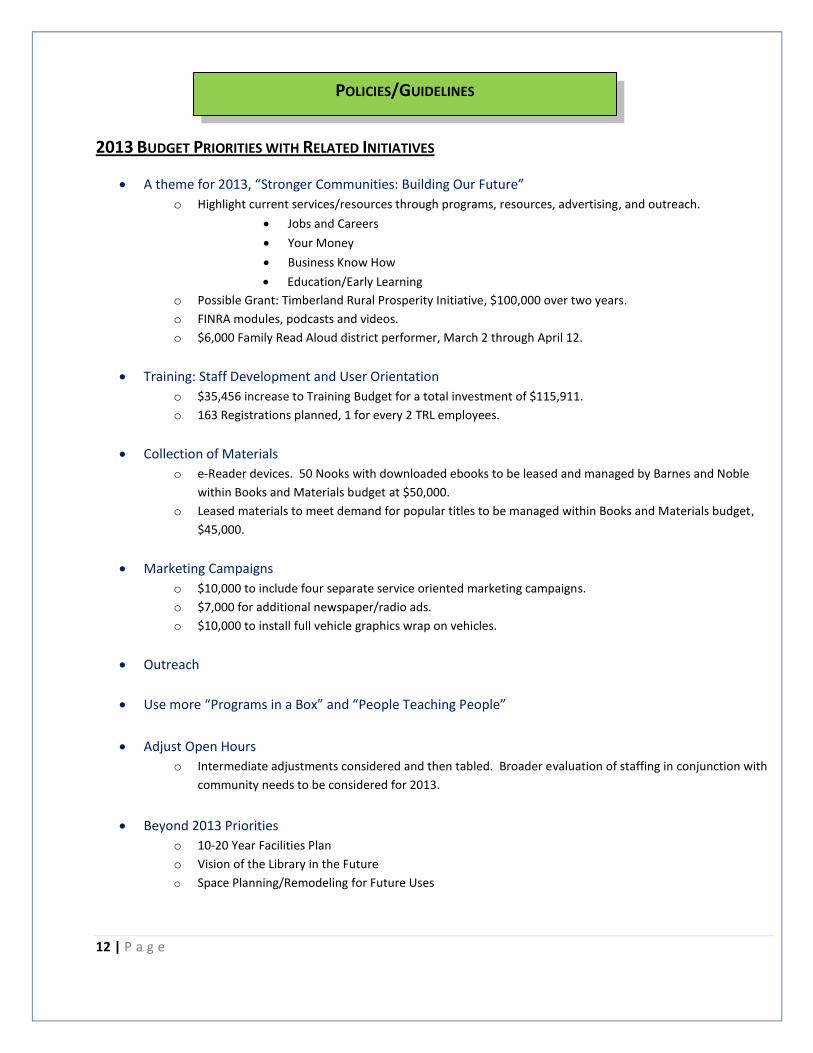
2013 BUDGET PRIORITIES WITH RELATED INITIATIVES
A theme for 2013, “Stronger Communities: Building Our Future”
o Highlight current services/resources through programs, resources, advertising, and outreach.
Jobs and Careers
Your Money
Business Know How
Education/Early Learning
o Possible Grant: Timberland Rural Prosperity Initiative, $100,000 over two years.
o FINRA modules, podcasts and videos.
o $6,000 Family Read Aloud district performer, March 2 through April 12.
Training: Staff Development and User Orientation
o $35,456 increase to Training Budget for a total investment of $115,911.
o 163 Registrations planned, 1 for every 2 TRL employees.
Collection of Materials
o e-Reader devices. 50 Nooks with downloaded ebooks to be leased and managed by Barnes and Noble
within Books and Materials budget at $50,000.
o Leased materials to meet demand for popular titles to be managed within Books and Materials budget,
$45,000.
Marketing Campaigns
o $10,000 to include four separate service oriented marketing campaigns.
o $7,000 for additional newspaper/radio ads.
o $10,000 to install full vehicle graphics wrap on vehicles.
Outreach
Use more “Programs in a Box” and “People Teaching People”
Adjust Open Hours
o Intermediate adjustments considered and then tabled. Broader evaluation of staffing in conjunction with
community needs to be considered for 2013.
Beyond 2013 Priorities
o 10-20 Year Facilities Plan
o Vision of the Library in the Future
o Space Planning/Remodeling for Future Uses
POLICIES/GUIDELINES

13 | P a g e
Projected Projected Projected Projected Projected
2012 2013 2014 2015 2016
--------------- --------------- --------------- --------------- ---------------
Beginning Uncommitted Fund Balance 4,393,721$ 407,947$ -$ -$ -$
Beginning Reserve Commitments:
Operational Needs for first four months 4,000,000$ 7,050,000$ 7,075,000$ 7,100,000$ 7,150,000$
Transfers Out to Special Purpose Funds 250,000$ 2,020,000$ 341,724$ 669,452$ 700,988$
Election Costs, LID, LCFA -$ -$ -$ -$ -$
--------------- --------------- --------------- --------------- ---------------
Beginning Fund & Reserve Commitments: 8,643,721$ 9,477,947$ 7,416,724$ 7,769,452$ 7,850,988$
New Revenue:
Total Tax Revenue (property) 18,418,101$ 18,900,000$ 19,242,681$ 19,589,546$ 19,940,637$
Major Timber Revenue (private & public) 1,680,221$ 1,344,500$ 1,371,390$ 1,405,675$ 1,447,845$
Intergovernmental (City Contracts) 122,174$ 102,236$ 101,214$ 100,202$ 99,199$
Charges and Services (printing & copies) 39,695$ 37,700$ 37,704$ 37,708$ 37,711$
Fines and Fees 350,156$ 335,000$ 328,300$ 321,734$ 315,299$
Other (Loss/Damage, Interest, Excise) 271,089$ 456,200$ 463,043$ 469,989$ 479,388$
--------------- --------------- --------------- --------------- ---------------
Total New Revenue: 20,881,435$ 21,175,636$ 21,544,332$ 21,924,853$ 22,320,080$
Expenditures:
Personnel
Base Wage & Salaries 10,619,275$ 10,805,373$ 10,927,297$ 11,024,648$ 11,179,043$
Steps 98,329$ 99,438$ 100,324$ 101,729$
COLA 190,000$ 109,273$ 110,246$ 111,790$
Additional hours, ExHrs, SubHrs 48,436$ 50,000$ 50,000$ 50,000$
Sunday Pay -$ -$ -$ -$
---------------- ---------------- ---------------- ---------------- ----------------
Subtotal 10,619,275$ 11,142,138$ 11,186,008$ 11,285,219$ 11,442,562$
Benefits
Medical 1,647,941$ 1,779,776$ 1,922,158$ 2,075,931$
Dental, Vision, Life, EAP 236,342$ 243,432$ 250,735$ 258,257$
PERS 898,445$ 988,290$ 998,173$ 1,008,154$
Other (FICA, L&I) 923,784$ 912,778$ 924,259$ 940,579$
---------------- ---------------- ---------------- ---------------- ----------------
Subtotal 3,447,676$ 3,706,512$ 3,924,277$ 4,095,326$ 4,282,921$
--------------- --------------- --------------- --------------- ---------------
Total Personnel Expenditures: 14,066,951$ 14,848,650$ 15,110,285$ 15,380,545$ 15,725,484$
Timberland Regional Library
Projected Cash Flow Summary For the Years 2012-2016
December 19, 2012

14 | P a g e
Projected Projected Projected Projected Projected
2012 2013 2014 2015 2016
--------------- --------------- --------------- --------------- ---------------
Operating Expenditures
Books and Materials 3,086,777$ 3,375,935$ 3,016,206$ 3,069,479$ 3,124,811$
Maintenance & Operation 288,324$ 373,136$ 265,000$ 265,000$ 265,000$
Supplies 313,751$ 455,812$ 477,864$ 451,316$ 251,001$
Professional Services:
Youth Programming 27,300$ 33,300$ 27,300$ 27,300$ 27,300$
Adult Programming 54,000$ 54,000$ 54,000$ 54,000$ 54,000$
Other 546,809$ 570,652$ 502,850$ 502,850$ 502,850$
Communications 474,512$ 532,225$ 370,000$ 375,000$ 378,000$
Other (Utilities, Insurance, Rentals) 466,060$ 586,276$ 699,360$ 696,360$ 692,360$
Capital Expenditures-Non Book
Courier Vehicles 50,000$ 26,000$ 50,000$ 50,000$ 25,000$
Passenger Vehicles -$ 25,000$ 25,000$
Equipment Replace 95,712$ 100,000$ 100,000$ 100,000$ 100,000$
Computer Equipment 275,000$ 258,860$ 150,000$ 200,000$ 250,000$
--------------- --------------- --------------- --------------- ---------------
Total Operating Expenditures: 19,747,209$ 21,216,859$ 20,849,879$ 21,173,865$ 21,422,822$
Transfers Out to Special Purpose Funds: 300,000$ 2,020,000$ 341,724$ 669,452$ 700,988$
Ending Fund Balance: 9,477,947$ 7,416,724$ 7,769,452$ 7,850,988$ 8,047,258$
Ending Reserve Commitments Next Year:
Operational Needs for First Four Months 7,050,000$ 7,075,000$ 7,100,000$ 7,150,000$ 7,200,000$
Transfers Out to Special Purpose Funds 2,020,000$ 341,724$ 669,452$ 700,988$ 847,258$
Election Costs, LID, LCFA -$ -$ -$ -$ -$
--------------- --------------- --------------- --------------- ---------------
Ending Reserve Commitments Next Year: 9,070,000$ 7,416,724$ 7,769,452$ 7,850,988$ 8,047,258$
--------------- --------------- --------------- --------------- ---------------
Ending Uncommitted Reserve Balance: 407,947$ -$ -$ -$ -$
=========== =========== =========== =========== ===========
Timberland Regional Library
Projected Cash Flow Summary For the Years 2012-2016
December 19, 2012
15 | P a g e
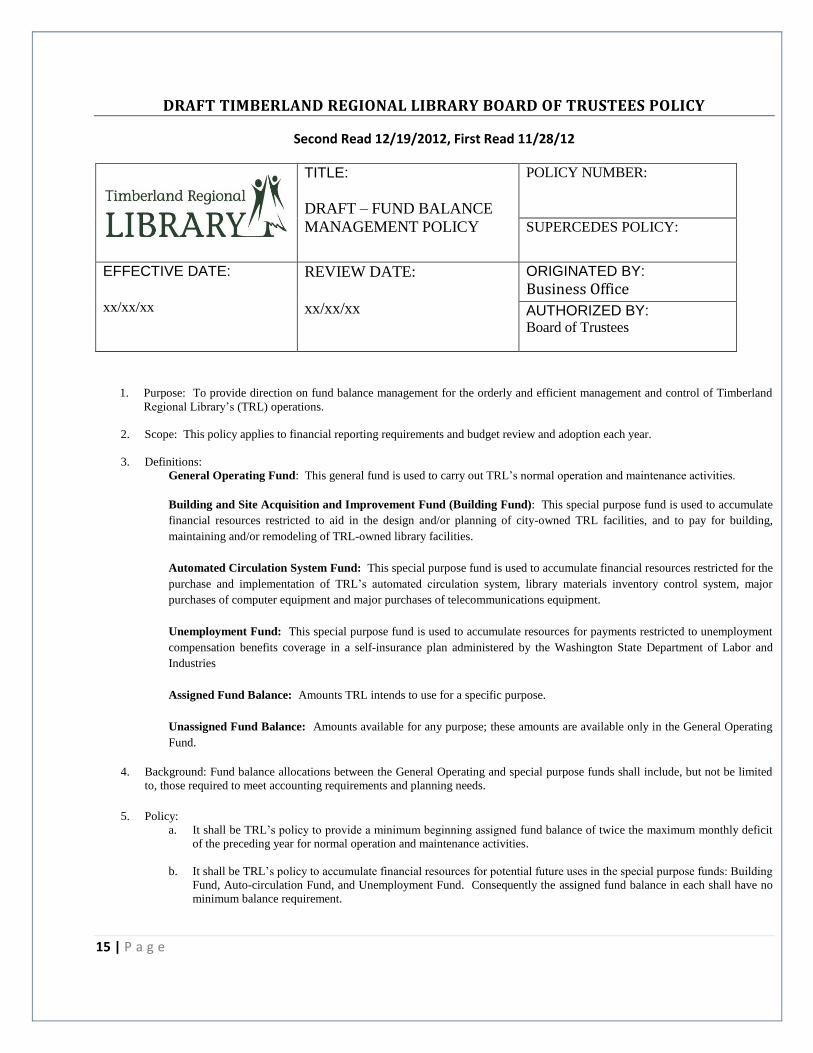
DRAFT TIMBERLAND REGIONAL LIBRARY BOARD OF TRUSTEES POLICY
Second Read 12/19/2012, First Read 11/28/12
TITLE:
DRAFT – FUND BALANCE
MANAGEMENT POLICY
POLICY NUMBER:
SUPERCEDES POLICY:
EFFECTIVE DATE:
xx/xx/xx
REVIEW DATE:
xx/xx/xx
ORIGINATED BY:
Business Office
AUTHORIZED BY: Board of Trustees
1. Purpose: To provide direction on fund balance management for the orderly and efficient management and control of Timberland
Regional Library’s (TRL) operations.
2. Scope: This policy applies to financial reporting requirements and budget review and adoption each year.
3. Definitions:
General Operating Fund: This general fund is used to carry out TRL’s normal operation and maintenance activities.
Building and Site Acquisition and Improvement Fund (Building Fund): This special purpose fund is used to accumulate
financial resources restricted to aid in the design and/or planning of city-owned TRL facilities, and to pay for building,
maintaining and/or remodeling of TRL-owned library facilities.
Automated Circulation System Fund: This special purpose fund is used to accumulate financial resources restricted for the
purchase and implementation of TRL’s automated circulation system, library materials inventory control system, major
purchases of computer equipment and major purchases of telecommunications equipment.
Unemployment Fund: This special purpose fund is used to accumulate resources for payments restricted to unemployment
compensation benefits coverage in a self-insurance plan administered by the Washington State Department of Labor and
Industries
Assigned Fund Balance: Amounts TRL intends to use for a specific purpose.
Unassigned Fund Balance: Amounts available for any purpose; these amounts are available only in the General Operating
Fund.
4. Background: Fund balance allocations between the General Operating and special purpose funds shall include, but not be limited
to, those required to meet accounting requirements and planning needs.
5. Policy:
a. It shall be TRL’s policy to provide a minimum beginning assigned fund balance of twice the maximum monthly deficit
of the preceding year for normal operation and maintenance activities.
b. It shall be TRL’s policy to accumulate financial resources for potential future uses in the special purpose funds: Building
Fund, Auto-circulation Fund, and Unemployment Fund. Consequently the assigned fund balance in each shall have no
minimum balance requirement.

16 | P a g e
c. It shall be TRL’s policy to transfer the unassigned beginning fund balance to TRL’s special purpose funds as part of the
annual budget process.
d. If General Operating Fund reserves are depleted so that a minimum beginning assigned fund balance is not possible, a
plan for restoration shall be developed for the Board of Trustees’ approval in order to restore the balance over time. The
restoration plan may include such recommendations as expenditure adjustments, fee adjustments, and/or transfers from
the special purpose funds into the General Operating Fund as may be appropriate.
6. Citation: None.
7. By the enactment of this policy the Board of Trustees for the Timberland Regional Library concurrently rescinds any prior policies
within the Library that is either in conflict with or expansive of the matters addressed in this policy.
Adopted by the Board of Trustees XXXX XX, XXXX
_____________________________________ __________________
President, Board of Trustees Date
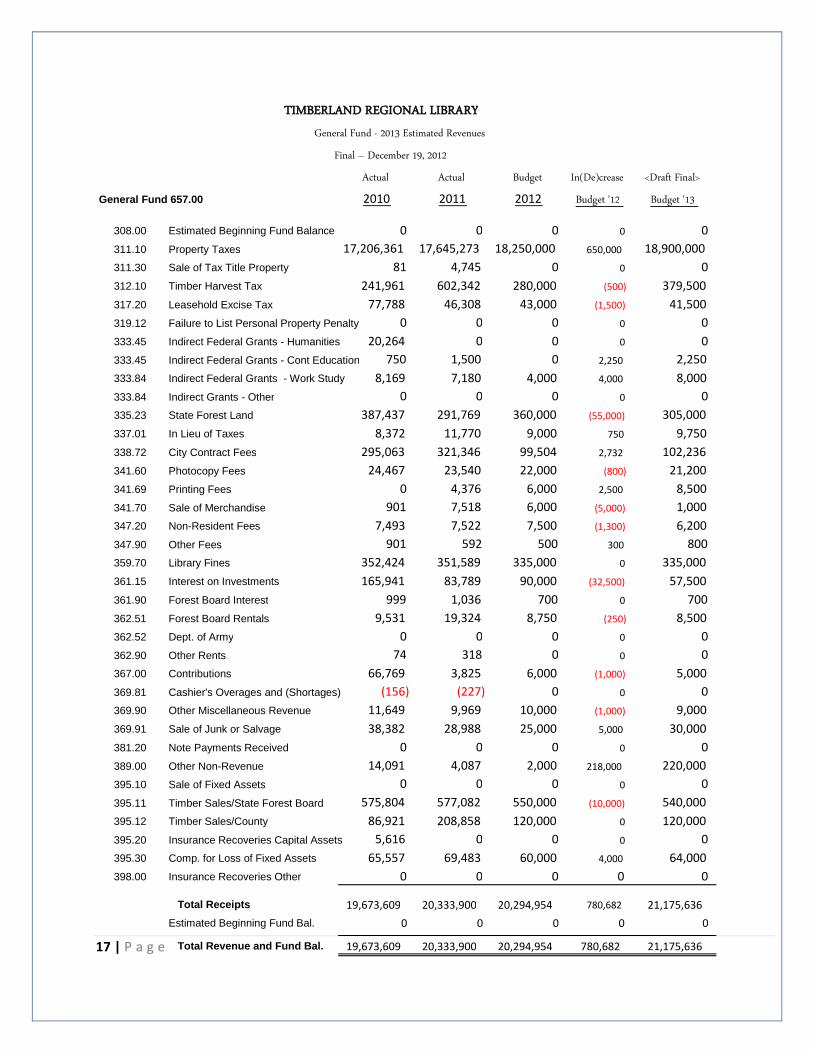
17 | P a g e
Actual Actual Budget In(De)crease <Draft Final>
General Fund 657.00 2010 2011 2012 Budget '12 Budget '13
308.00 Estimated Beginning Fund Balance 0 0 0 0 0
311.10 Property Taxes 17,206,361 17,645,273 18,250,000 650,000 18,900,000
311.30 Sale of Tax Title Property 81 4,745 0 0 0
312.10 Timber Harvest Tax 241,961 602,342 280,000 (500) 379,500
317.20 Leasehold Excise Tax 77,788 46,308 43,000 (1,500) 41,500
319.12 Failure to List Personal Property Penalty 0 0 0 0 0
333.45 Indirect Federal Grants - Humanities 20,264 0 0 0 0
333.45 Indirect Federal Grants - Cont Education 750 1,500 0 2,250 2,250
333.84 Indirect Federal Grants - Work Study 8,169 7,180 4,000 4,000 8,000
333.84 Indirect Grants - Other 0 0 0 0 0
335.23 State Forest Land 387,437 291,769 360,000 (55,000) 305,000
337.01 In Lieu of Taxes 8,372 11,770 9,000 750 9,750
338.72 City Contract Fees 295,063 321,346 99,504 2,732 102,236
341.60 Photocopy Fees 24,467 23,540 22,000 (800) 21,200
341.69 Printing Fees 0 4,376 6,000 2,500 8,500
341.70 Sale of Merchandise 901 7,518 6,000 (5,000) 1,000
347.20 Non-Resident Fees 7,493 7,522 7,500 (1,300) 6,200
347.90 Other Fees 901 592 500 300 800
359.70 Library Fines 352,424 351,589 335,000 0 335,000
361.15 Interest on Investments 165,941 83,789 90,000 (32,500) 57,500
361.90 Forest Board Interest 999 1,036 700 0 700
362.51 Forest Board Rentals 9,531 19,324 8,750 (250) 8,500
362.52 Dept. of Army 0 0 0 0 0
362.90 Other Rents 74 318 0 0 0
367.00 Contributions 66,769 3,825 6,000 (1,000) 5,000
369.81 Cashier's Overages and (Shortages) (156) (227) 0 0 0
369.90 Other Miscellaneous Revenue 11,649 9,969 10,000 (1,000) 9,000
369.91 Sale of Junk or Salvage 38,382 28,988 25,000 5,000 30,000
381.20 Note Payments Received 0 0 0 0 0
389.00 Other Non-Revenue 14,091 4,087 2,000 218,000 220,000
395.10 Sale of Fixed Assets 0 0 0 0 0
395.11 Timber Sales/State Forest Board 575,804 577,082 550,000 (10,000) 540,000
395.12 Timber Sales/County 86,921 208,858 120,000 0 120,000
395.20 Insurance Recoveries Capital Assets 5,616 0 0 0 0
395.30 Comp. for Loss of Fixed Assets 65,557 69,483 60,000 4,000 64,000
398.00 Insurance Recoveries Other 0 0 0 0 0
Total Receipts 19,673,609 20,333,900 20,294,954 780,682 21,175,636 Estimated Beginning Fund Bal.
0 0 0 0 0
Total Revenue and Fund Bal.
19,673,609 20,333,900 20,294,954 780,682 21,175,636
TIMBERLAND REGIONAL LIBRARY
General Fund - 2013 Estimated Revenues
Final – December 19, 2012

18 | P a g e
Actual Actual Budget In(De)crease <Draft Final>
General Fund 657.00 2010 2011 2012 Budget '12 Budget '13
572.XX.00 Reclassification and Cost Allocation (14,091) (4,087) 0 0 0
0.10 Salaries & Wages 10,424,281 10,507,184 10,908,738 233,400 11,142,138
0.20 Personnel Benefits 3,001,349 3,222,143 3,385,733 320,779 3,706,512
0.30 Supplies 298,836 343,482 490,925 (35,113) 455,812
Other Services and Charges:
0.41 Professional Services 479,440 557,346 686,590 (28,638) 657,952
0.42 Communications 178,096 268,244 271,000 261,225 532,225
0.43 Travel 70,713 86,609 99,000 (13,649) 85,351
0.44 Advertising 16,388 26,298 16,000 12,000 28,000
0.45 Operating Rentals 248,230 259,559 96,533 2,545 99,078
0.46 Insurance 71,672 77,036 77,480 3,725 81,205
0.47 Utilities 132,952 126,133 142,000 1,200 143,200
0.48 Repairs and Maintenance 196,894 293,980 340,200 32,936 373,136
0.49 Miscellaneous 82,137 175,094 124,655 23,786 148,441
0.40 Total Other Services and Charges $1,476,523 $1,870,297 $1,853,458 $295,130 $2,148,588
0.50 Inter-Governmental 1,003 1,248 1,000 0 1,000
0.60 Capital Expenditures - Non Book 295,337 473,344 470,500 (85,640) 384,860
- Books and Materials 2,616,609 2,742,527 3,086,605 289,330 3,375,935
Total 18,099,847 19,156,138 20,196,959 1,017,887 21,214,846
507.XX.00 Transfer Out 0 776,509 300,000 1,720,000 2,020,000
397.XX.00 Transfer In 0 0 0 0 0
589.XX.00 Other Non-Expenditures 0 45,351 0 0 0
Estimated Ending Fund Balance (Use of Reserve) 1,573,762 355,902 (202,005) (1,957,205) (2,059,210)
Total Expenditures & Fund Balance 19,673,609 20,333,900 20,294,954 780,682 21,175,636
Final - December 19, 2012
TIMBERLAND REGIONAL LIBRARY
General Fund - 2013 Estimated Expenditures

19 | P a g e
2013 Estimated Resources:
15,000 Investment Interest
1,700,000 Transfer from General Fund
$1,715,000 Total Building Fund Resources
2013 Estimated Expenditures: General Description:
5,000 General Bookdrop
25,000 ADA
20,000 Energy Efficiency
30,000 Unanticipated
15,000 Signage
57,000 Amanda Park Walkway cover $30,000
17,900 Hoodsport Composition roof replacement $17,500
35,000 Montesano Heat pump replace, $30,000
8,000 Naselle Exterior planter removal, $8,000
93,096 North Mason Hwy 3 widening, Sewer connect, T-stats
8,000 Packwood Possible heat pump replace, $7,000
10,000 Salkum Downspout drain, interior painting
12,000 Service Center Carpet replace, breaker panel
4,000 Architectural Services
200,000 Maintenance or Space
Planning to be determined
$539,996
Fund Balance
Jan 1, 2012 $584,868
Increase 1,175,004
Dec 31, 2012 $1,759,872
TIMBERLAND REGIONAL LIBRARY
2013 Building Fund - Estimated Resources & Expenditures
Draft Final - November 28, 2012

20 | P a g e
2013 Estimated Resources:
6,000 Investment Interest
300,000 Transfer from General Fund
306,000 Total Automated Circulation Resources
2013 Estimated Expenditures:
Capital Expenditures - TRL:
System Software
13,044 New SCKO License
21,479 Office 2010 Professional Plus for Staff
30,220 Other Software
System Hardware
27,175 Firewall Replacement
18,142 Other Hardware
20,000 Unanticipated
130,060 Total Automated Circulation Fund Uses
Fund Balance
Jan 1, 2012 $632,646
Increase 175,940
Dec 31, 2012 $808,586
TIMBERLAND REGIONAL LIBRARY
2013 Automated Circulation Fund - Estimated Resources & Expenditures
Draft Final - November 28, 2012

21 | P a g e
2013 Estimated Resources:
1,300 Investment Interest
20,000 Transfer from General Fund
21,300 Total Automated Circulation Resources
2013 Estimated Expenditures:
21,000 Unemployment Compensation Payments - TRL:
21,000 Total Unemployment Compensation Fund Uses
Fund Balance
Jan 1, 2012 $162,558
Increase 300
0
Dec 31, 2012 $162,858
TIMBERLAND REGIONAL LIBRARY
2013 Unemployment Compensation Fund - Estimated Resources & Expenditures
Draft Final - November 28, 2012
22 | P a g e
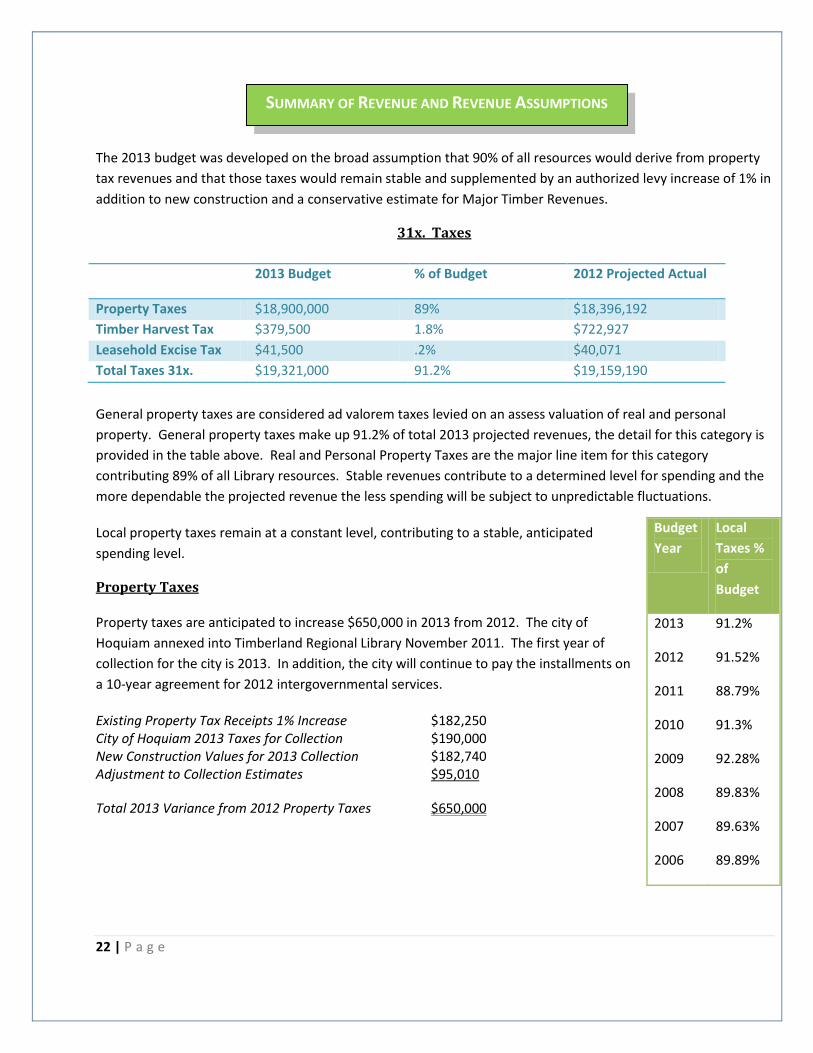
Summary of Revenues and Revenue Assumptions
The 2013 budget was developed on the broad assumption that 90% of all resources would derive from property
tax revenues and that those taxes would remain stable and supplemented by an authorized levy increase of 1% in
addition to new construction and a conservative estimate for Major Timber Revenues.
31x. Taxes
General property taxes are considered ad valorem taxes levied on an assess valuation of real and personal
property. General property taxes make up 91.2% of total 2013 projected revenues, the detail for this category is
provided in the table above. Real and Personal Property Taxes are the major line item for this category
contributing 89% of all Library resources. Stable revenues contribute to a determined level for spending and the
more dependable the projected revenue the less spending will be subject to unpredictable fluctuations.
Local property taxes remain at a constant level, contributing to a stable, anticipated
spending level.
Property Taxes
Property taxes are anticipated to increase $650,000 in 2013 from 2012. The city of
Hoquiam annexed into Timberland Regional Library November 2011. The first year of
collection for the city is 2013. In addition, the city will continue to pay the installments on
a 10-year agreement for 2012 intergovernmental services.
Existing Property Tax Receipts 1% Increase $182,250 City of Hoquiam 2013 Taxes for Collection $190,000 New Construction Values for 2013 Collection $182,740 Adjustment to Collection Estimates $95,010
Total 2013 Variance from 2012 Property Taxes $650,000
2013 Budget % of Budget 2012 Projected Actual
Property Taxes $18,900,000 89% $18,396,192
Timber Harvest Tax $379,500 1.8% $722,927
Leasehold Excise Tax $41,500 .2% $40,071
Total Taxes 31x. $19,321,000 91.2% $19,159,190
Budget
Year
Local
Taxes %
of
Budget
2013 91.2%
2012 91.52%
2011 88.79%
2010 91.3%
2009 92.28%
2008 89.83%
2007 89.63%
2006 89.89%
SUMMARY OF REVENUE AND REVENUE ASSUMPTIONS
23 | P a g e
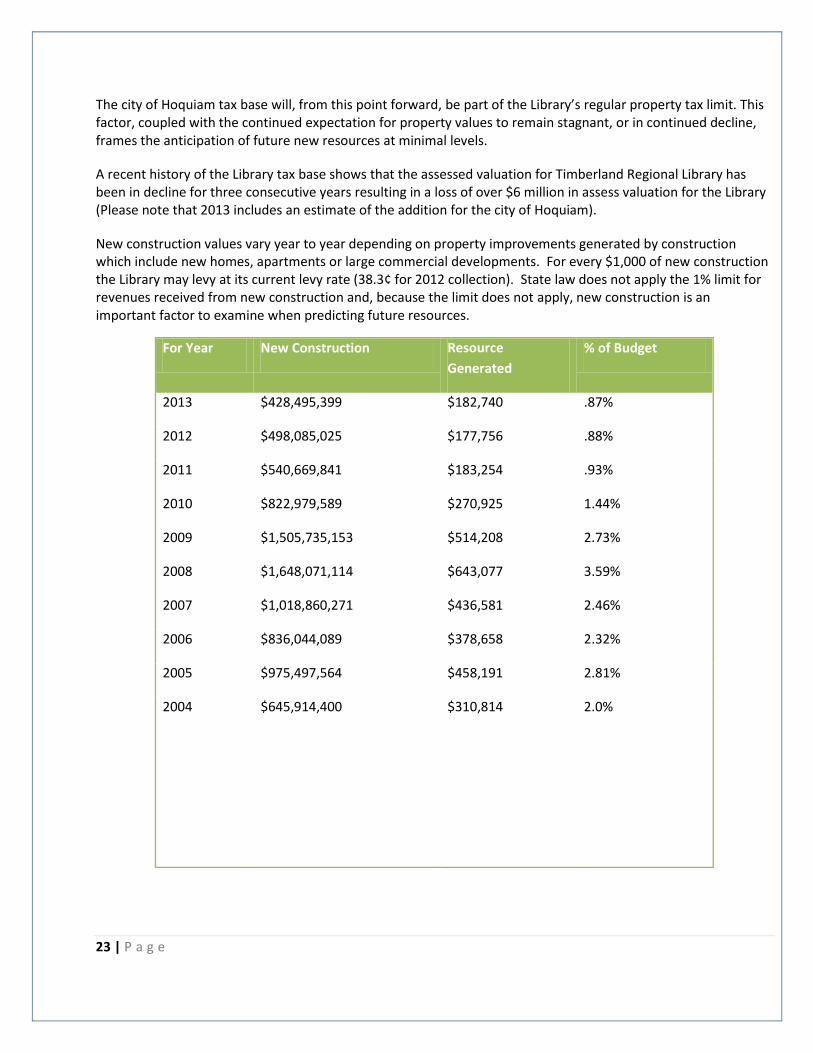
The city of Hoquiam tax base will, from this point forward, be part of the Library’s regular property tax limit. This factor, coupled with the continued expectation for property values to remain stagnant, or in continued decline, frames the anticipation of future new resources at minimal levels.
A recent history of the Library tax base shows that the assessed valuation for Timberland Regional Library has been in decline for three consecutive years resulting in a loss of over $6 million in assess valuation for the Library (Please note that 2013 includes an estimate of the addition for the city of Hoquiam).
New construction values vary year to year depending on property improvements generated by construction which include new homes, apartments or large commercial developments. For every $1,000 of new construction the Library may levy at its current levy rate (38.3¢ for 2012 collection). State law does not apply the 1% limit for revenues received from new construction and, because the limit does not apply, new construction is an important factor to examine when predicting future resources.
For Year New Construction Resource
Generated
% of Budget
2013 $428,495,399 $182,740 .87%
2012 $498,085,025 $177,756 .88%
2011 $540,669,841 $183,254 .93%
2010 $822,979,589 $270,925 1.44%
2009 $1,505,735,153 $514,208 2.73%
2008 $1,648,071,114 $643,077 3.59%
2007 $1,018,860,271 $436,581 2.46%
2006 $836,044,089 $378,658 2.32%
2005 $975,497,564 $458,191 2.81%
2004 $645,914,400
$310,814 2.0%

24 | P a g e
The levy rate of assessment, or millage rate, is based on Timberland Regional Library’s assessed property value. The statutory limit is $0.50 per $1,000 of assessed valuation. Recent mill rates are trending upward; an inverse relationship to TRL’s overall assessed valuation.
Since 2009 the millage rate is estimated to increase by 8.6 cents, leaving 8.4 cents as available capacity before reaching the statutory limit. If the 50 cent limit is reached, available resources will be subject to the decrease in property values within its boundary and create a need to manage expenditures at a drastically reduced level. Keep in mind that if Timberland Regional Library is at its full taxing authority it will not be able to receive revenue from property taxes on new construction.
Pierce County Library System is projecting property values within its district to decline again in 2014 by 5%, again in 2015 by 2% and then level off. But there are signs of recovery within the housing market. The November 2012 Department of Natural Resources Forecast stated that the “housing market continues to show positive signs” and “new housing starts in September were at…their highest level in four years.” Most importantly, the report pointed out that “average U.S. housing prices have increased in each of seven months through August.” From these comments it seems remote that TRL will continue to see the rise in its millage rate of the previous four years, and reach its statutory limit.
Timber Harvest Tax
Timber harvest tax represents county-levied tax on timber harvested from privately and
publicly owned land. A more detailed examination of timber harvest tax will be included with Major Timber
Revenues.
Leasehold Excise Tax
These are taxes on property owned by state or local governments and leased to private parties. Receipts were at
a high of $77,788.27 in 2010 and a low of $39,850 in 2008. Leasehold excise taxes are projected to reach
$40,071, or $2,929 short of the estimated amount for 2012 receipts. For this reason the 2013 projection is
$1,500 less than 2012.
33X. Intergovernmental Revenues
2013 % of Budget 2012 Projected Actual
Indirect Federal Grants $10,250 .05% $11,634
State Forest Land $305,000 1.4% $299,315
In Lieu of Taxes $9,750 .05% $23,937
City Contract Fees $102,236 .5% $122,173
Total
Intergovernmental
$427,236 2.0% $457,059
For
Year
Mill Rate
(In
cents)
2013 41.6
2012 38.3
2011 35.688
2010 33.894
2009 32.92
2008 34.15
2007 39.02
2006 42.85
25 | P a g e
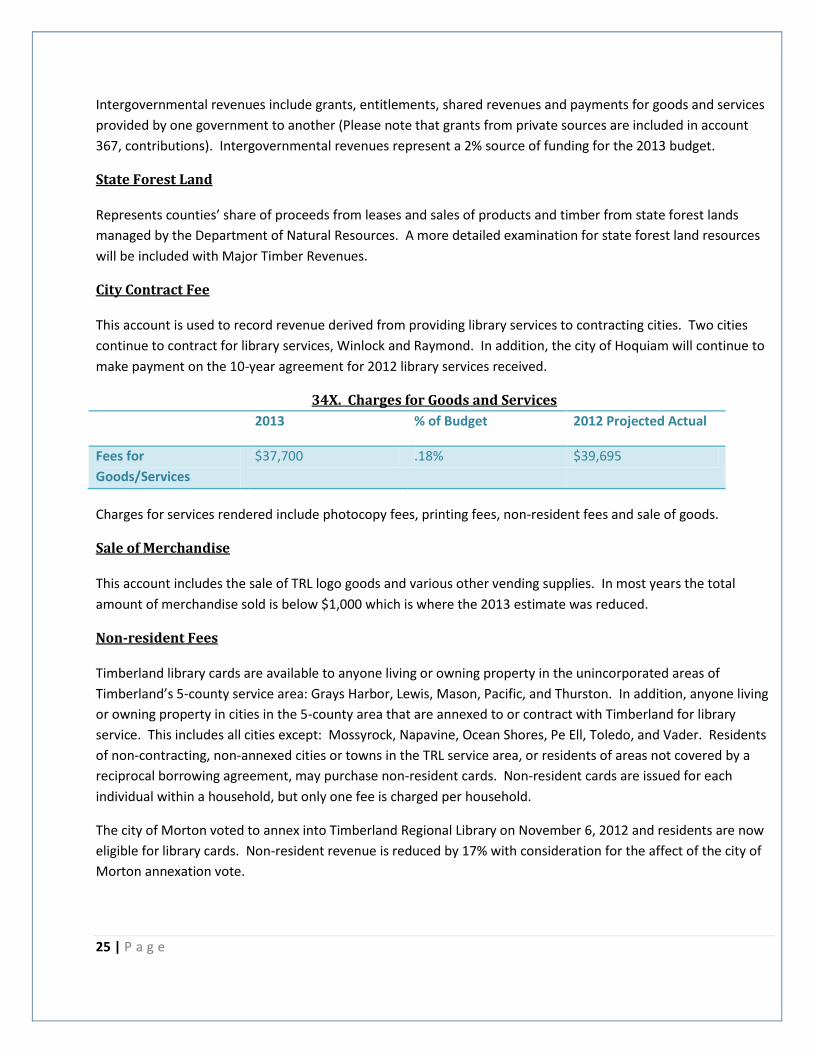
Intergovernmental revenues include grants, entitlements, shared revenues and payments for goods and services
provided by one government to another (Please note that grants from private sources are included in account
367, contributions). Intergovernmental revenues represent a 2% source of funding for the 2013 budget.
State Forest Land
Represents counties’ share of proceeds from leases and sales of products and timber from state forest lands
managed by the Department of Natural Resources. A more detailed examination for state forest land resources
will be included with Major Timber Revenues.
City Contract Fee
This account is used to record revenue derived from providing library services to contracting cities. Two cities
continue to contract for library services, Winlock and Raymond. In addition, the city of Hoquiam will continue to
make payment on the 10-year agreement for 2012 library services received.
34X. Charges for Goods and Services
2013 % of Budget 2012 Projected Actual
Fees for
Goods/Services
$37,700 .18% $39,695
Charges for services rendered include photocopy fees, printing fees, non-resident fees and sale of goods.
Sale of Merchandise
This account includes the sale of TRL logo goods and various other vending supplies. In most years the total
amount of merchandise sold is below $1,000 which is where the 2013 estimate was reduced.
Non-resident Fees
Timberland library cards are available to anyone living or owning property in the unincorporated areas of
Timberland’s 5-county service area: Grays Harbor, Lewis, Mason, Pacific, and Thurston. In addition, anyone living
or owning property in cities in the 5-county area that are annexed to or contract with Timberland for library
service. This includes all cities except: Mossyrock, Napavine, Ocean Shores, Pe Ell, Toledo, and Vader. Residents
of non-contracting, non-annexed cities or towns in the TRL service area, or residents of areas not covered by a
reciprocal borrowing agreement, may purchase non-resident cards. Non-resident cards are issued for each
individual within a household, but only one fee is charged per household.
The city of Morton voted to annex into Timberland Regional Library on November 6, 2012 and residents are now
eligible for library cards. Non-resident revenue is reduced by 17% with consideration for the affect of the city of
Morton annexation vote.
26 | P a g e
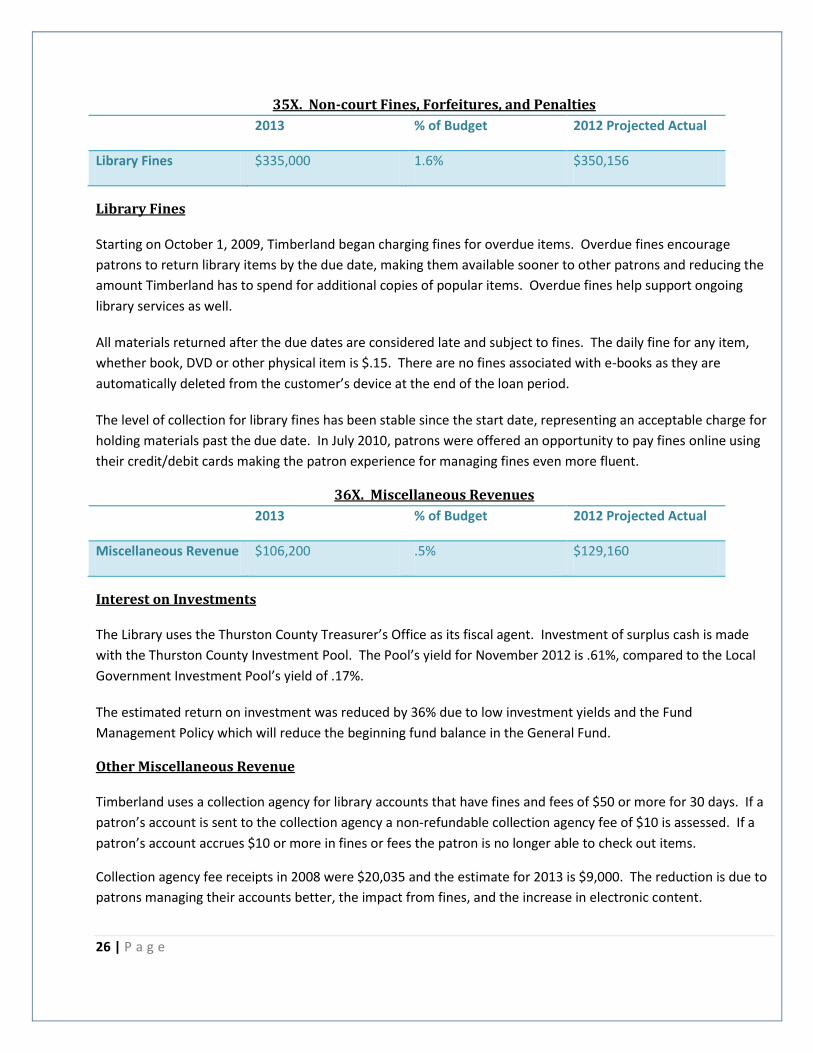
35X. Non-court Fines, Forfeitures, and Penalties
2013 % of Budget 2012 Projected Actual
Library Fines $335,000 1.6% $350,156
Library Fines
Starting on October 1, 2009, Timberland began charging fines for overdue items. Overdue fines encourage
patrons to return library items by the due date, making them available sooner to other patrons and reducing the
amount Timberland has to spend for additional copies of popular items. Overdue fines help support ongoing
library services as well.
All materials returned after the due dates are considered late and subject to fines. The daily fine for any item,
whether book, DVD or other physical item is $.15. There are no fines associated with e-books as they are
automatically deleted from the customer’s device at the end of the loan period.
The level of collection for library fines has been stable since the start date, representing an acceptable charge for
holding materials past the due date. In July 2010, patrons were offered an opportunity to pay fines online using
their credit/debit cards making the patron experience for managing fines even more fluent.
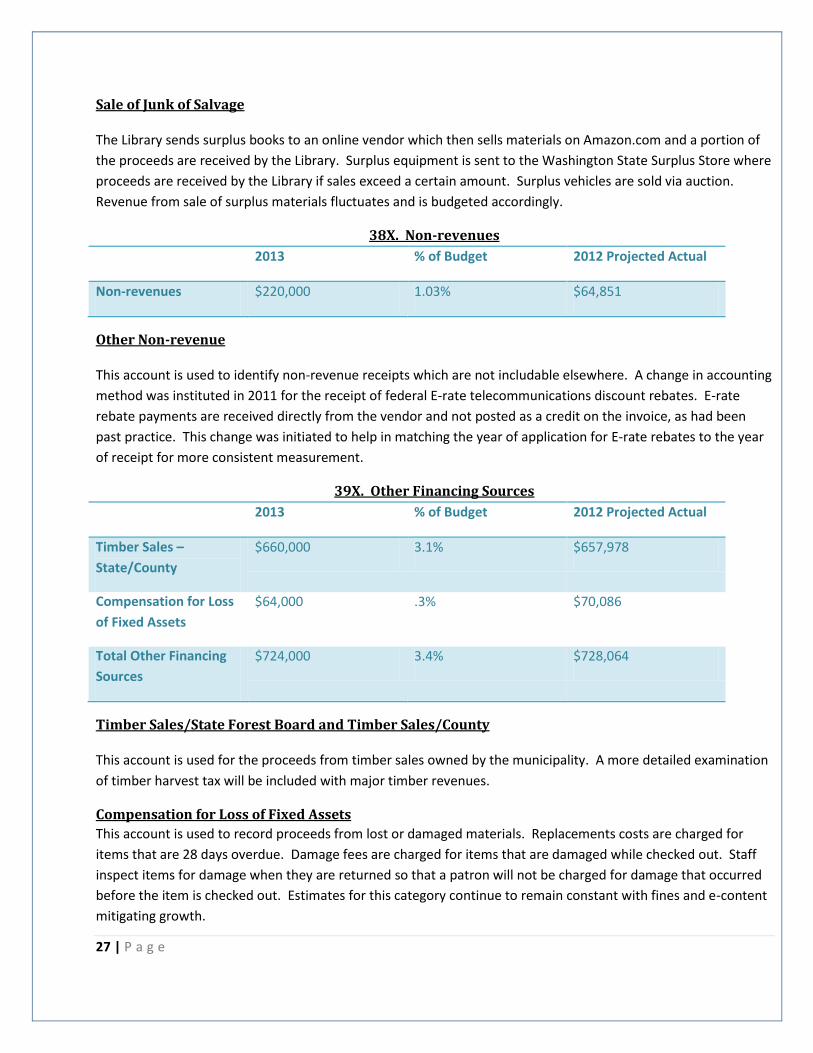
36X. Miscellaneous Revenues
2013 % of Budget 2012 Projected Actual
Miscellaneous Revenue $106,200 .5% $129,160
Interest on Investments
The Library uses the Thurston County Treasurer’s Office as its fiscal agent. Investment of surplus cash is made
with the Thurston County Investment Pool. The Pool’s yield for November 2012 is .61%, compared to the Local
Government Investment Pool’s yield of .17%.
The estimated return on investment was reduced by 36% due to low investment yields and the Fund
Management Policy which will reduce the beginning fund balance in the General Fund.
Other Miscellaneous Revenue
Timberland uses a collection agency for library accounts that have fines and fees of $50 or more for 30 days. If a
patron’s account is sent to the collection agency a non-refundable collection agency fee of $10 is assessed. If a
patron’s account accrues $10 or more in fines or fees the patron is no longer able to check out items.
Collection agency fee receipts in 2008 were $20,035 and the estimate for 2013 is $9,000. The reduction is due to
patrons managing their accounts better, the impact from fines, and the increase in electronic content.
27 | P a g e
Sale of Junk of Salvage
The Library sends surplus books to an online vendor which then sells materials on Amazon.com and a portion of
the proceeds are received by the Library. Surplus equipment is sent to the Washington State Surplus Store where
proceeds are received by the Library if sales exceed a certain amount. Surplus vehicles are sold via auction.
Revenue from sale of surplus materials fluctuates and is budgeted accordingly.
38X. Non-revenues
2013 % of Budget 2012 Projected Actual
Non-revenues $220,000 1.03% $64,851
Other Non-revenue
This account is used to identify non-revenue receipts which are not includable elsewhere. A change in accounting
method was instituted in 2011 for the receipt of federal E-rate telecommunications discount rebates. E-rate
rebate payments are received directly from the vendor and not posted as a credit on the invoice, as had been
past practice. This change was initiated to help in matching the year of application for E-rate rebates to the year
of receipt for more consistent measurement.
39X. Other Financing Sources
2013 % of Budget 2012 Projected Actual
Timber Sales –
State/County
$660,000 3.1% $657,978
Compensation for Loss
of Fixed Assets
$64,000 .3% $70,086
Total Other Financing
Sources
$724,000 3.4% $728,064
Timber Sales/State Forest Board and Timber Sales/County
This account is used for the proceeds from timber sales owned by the municipality. A more detailed examination
of timber harvest tax will be included with major timber revenues.
Compensation for Loss of Fixed Assets
This account is used to record proceeds from lost or damaged materials. Replacements costs are charged for
items that are 28 days overdue. Damage fees are charged for items that are damaged while checked out. Staff
inspect items for damage when they are returned so that a patron will not be charged for damage that occurred
before the item is checked out. Estimates for this category continue to remain constant with fines and e-content
mitigating growth.
28 | P a g e
Major Timber Revenues
Major timber revenues apply to the excise tax on timber harvested from any private or public lands within
Timberland Regional Library. A five percent timber excise tax is collected from the timber harvester and paid to
the Washington State Department of Revenue.
Timber tax is composed of a four percent county tax and a one percent state tax. The county portion is
distributed back to the county where the timber was harvested and helps fund capital projects, voter-approved
bonds, school maintenance and operations, county roads, libraries and fire districts. Timberland Regional Library
is becoming more and more dependent on Major Timber Revenues for support of its operations.
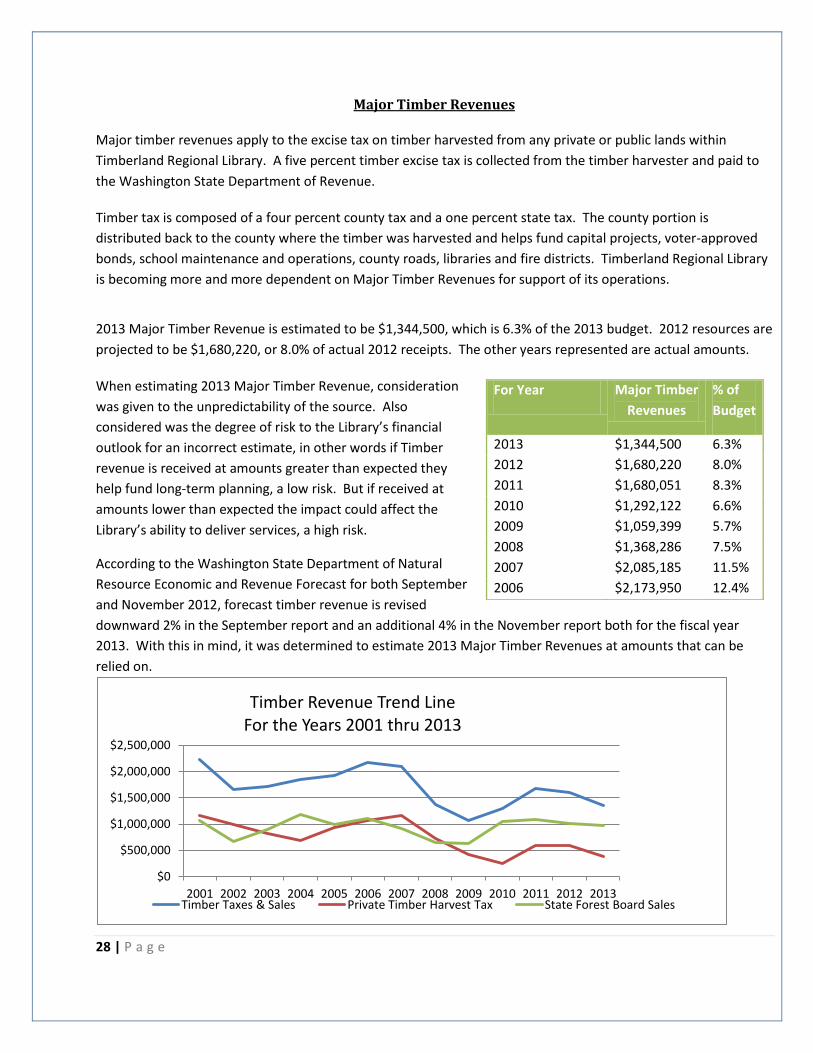
2013 Major Timber Revenue is estimated to be $1,344,500, which is 6.3% of the 2013 budget. 2012 resources are
projected to be $1,680,220, or 8.0% of actual 2012 receipts. The other years represented are actual amounts.
When estimating 2013 Major Timber Revenue, consideration
was given to the unpredictability of the source. Also
considered was the degree of risk to the Library’s financial
outlook for an incorrect estimate, in other words if Timber
revenue is received at amounts greater than expected they
help fund long-term planning, a low risk. But if received at
amounts lower than expected the impact could affect the
Library’s ability to deliver services, a high risk.
According to the Washington State Department of Natural
Resource Economic and Revenue Forecast for both September
and November 2012, forecast timber revenue is revised
downward 2% in the September report and an additional 4% in the November report both for the fiscal year
2013. With this in mind, it was determined to estimate 2013 Major Timber Revenues at amounts that can be
relied on.
$0
$500,000
$1,000,000
$1,500,000
$2,000,000
$2,500,000
2001 2002 2003 2004 2005 2006 2007 2008 2009 2010 2011 2012 2013
Timber Revenue Trend Line For the Years 2001 thru 2013
Timber Taxes & Sales Private Timber Harvest Tax State Forest Board Sales
For Year Major Timber
Revenues
% of
Budget
2013 $1,344,500 6.3%
2012 $1,680,220 8.0%
2011 $1,680,051 8.3%
2010 $1,292,122 6.6%
2009 $1,059,399 5.7%
2008 $1,368,286 7.5%
2007 $2,085,185 11.5%
2006 $2,173,950 12.4%

29 | P a g e
Major Timber Revenues fluctuate greatly, but a predictable minimum base can be determined as the 2009 receipt
of $1,059,000; it is reasonable to anticipate that total 2013 receipts will not go lower. The standard deviation for
timber receipts from 2001 to 2013 is $370,000. The standard deviation added to the predictable minimum base
of $1,059,000, adjusted for an anticipated downward DNR forecast of 6%, is a result utilized to estimate 2013
Major Timber Revenue at $1,344,500.
$-
$50,000
$100,000
$150,000
$200,000
$250,000
2008 2009 2010 2011 2012
Years
Timberland Regional Library State Forest Board Sales
Monthly
12 Month Moving Average
Timber Taxes & Sales
Private Timber
Harvest Tax State Forest Board Sales
Ratio Priv/State
2001 Timber Taxes & Sales 2,233,215.30 1,163,946.10 1,069,269.20 1.09 2002 Timber Taxes & Sales 1,664,621.74 990,260.01 674,361.73 1.47 2003 Timber Taxes & Sales 1,712,084.01 816,400.65 895,683.36 0.91 2004 Timber Taxes & Sales 1,855,237.39 679,612.15 1,175,625.24 0.58 2005 Timber Taxes & Sales 1,923,854.50 938,343.14 985,511.36 0.95 2006 Timber Taxes & Sales 2,173,950.12 1,070,343.00 1,103,607.12 0.97 2007 Timber Taxes & Sales 2,085,185.38 1,169,502.42 915,682.96 1.28 2008 Timber Taxes & Sales 1,368,285.84 728,866.01 639,419.83 1.14 2009 Timber Taxes & Sales 1,059,398.90 427,726.14 631,672.76 0.68 2010 Timber Taxes & Sales 1,292,122.03 118,649.69 796,574.04 0.15 2011 Timber Taxes & Sales 1,680,050.78 602,343.23 1,077,708.55 0.56 2012 Timber Taxes & Sales 1,680,220.00 722,927.69 957,292.31 0.76 2013 Timber Taxes & Sales 1,344,500.00 379,500.00 965,000.00 0.39
30 | P a g e
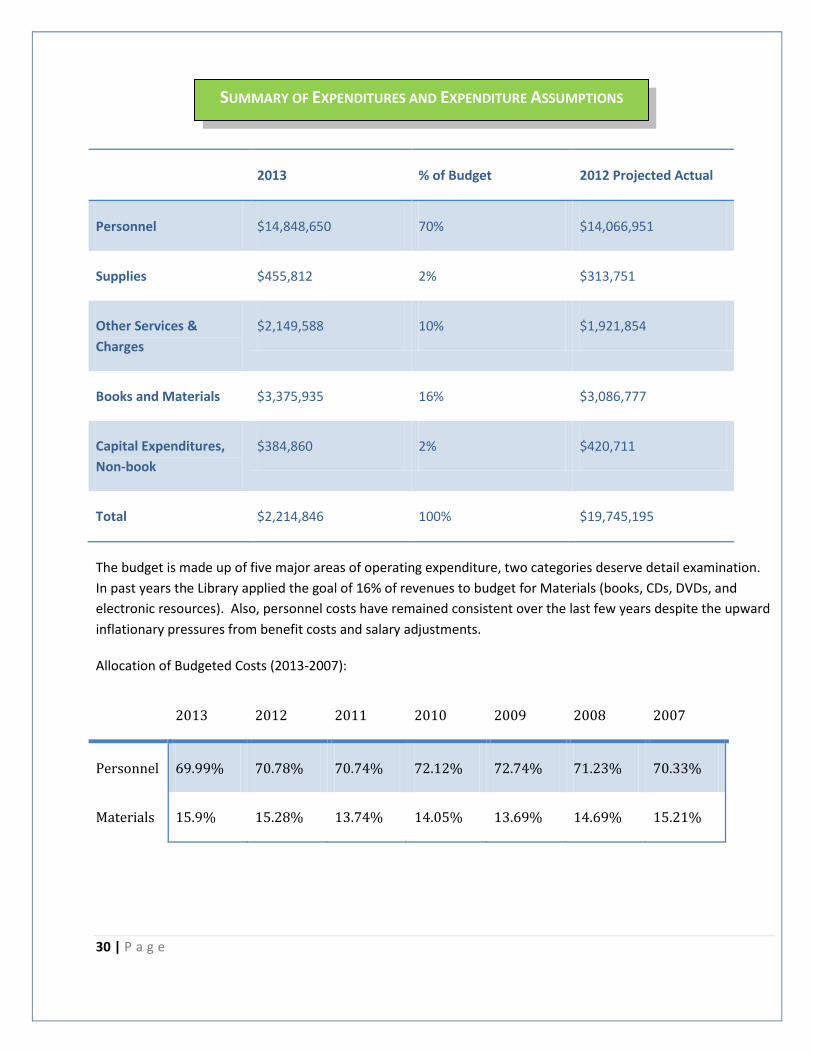
Summary of Expenditures and Expenditure Assumptions
2013 % of Budget 2012 Projected Actual
Personnel $14,848,650 70% $14,066,951
Supplies $455,812 2% $313,751
Other Services &
Charges
$2,149,588 10% $1,921,854
Books and Materials $3,375,935 16% $3,086,777
Capital Expenditures,
Non-book
$384,860 2% $420,711
Total $2,214,846 100% $19,745,195
The budget is made up of five major areas of operating expenditure, two categories deserve detail examination.
In past years the Library applied the goal of 16% of revenues to budget for Materials (books, CDs, DVDs, and
electronic resources). Also, personnel costs have remained consistent over the last few years despite the upward
inflationary pressures from benefit costs and salary adjustments.
Allocation of Budgeted Costs (2013-2007):
2013 2012 2011 2010 2009 2008 2007
Personnel 69.99% 70.78% 70.74% 72.12% 72.74% 71.23% 70.33%
Materials 15.9% 15.28% 13.74% 14.05% 13.69% 14.69% 15.21%
SUMMARY OF EXPENDITURES AND EXPENDITURE ASSUMPTIONS

31 | P a g e
Personnel costs
Personnel costs account for nearly 70% of anticipated expenditures and pay for staffing the Library to meet its
mission and operating goals. The change for 2013 from the 2012 budget is an increase of $554,179, or 3.88%.
The Library budgets at full-employment where each position is considered funded for the full-year at its current
step and grade. There is no consideration given for the realities of retirements, resignations, terminations, the
amount of time it takes to fill vacancies, or re-hiring at lower steps. The factor could range from 1.2% to 2% of
salaries and wages, Pierce County Library Systems used a factor of 2% in 2012 and 3% for 2013. 2013 Personnel
Detail:
2013 Personnel Detail:
2013
2012
%
Budget
Budget
Change
Salaries and Wages
11,093,701.88
10,860,779.98
2.14%
Extra Hours/Substitutes
48,436.52
47,957.82
1.00%
Industrial Insurance
73,217.47
73,002.04
0.30%
Medical Insurance
1,647,941.27
1,480,960.43
11.28%
FICA
850,566.27
831,147.66
2.34%
PERS
898,445.16
756,035.02
18.84%
Dental Insurance
182,836.56
188,500.14
-3.00%
Other Benefits
53,505.60
56,087.88
-4.60%
Total
14,848,650.73
14,294,470.97
3.88%
The total change for salaries and benefits from the previous budget year of 2012 is 3.88%, or $554,179.79.
Salaries and Wages
Staffing includes all full and part-time personnel located in all locations. Salaries and Wage factors for 2013
include a 1.5% cost of living adjustment and minimum wage rate increase of 1.66%, to $9.19/hour.
Extra Hours/Substitute
Extra/Substitute cost is a factor based on past year averages meant to capture the use of extra hours and
substitutes to fill vacant FTEs.

32 | P a g e
Benefits
Benefits as a category include medical and dental costs, retirement, payroll taxes, vision, basic life insurance,
long-term disability, and an employee assistance program.
The estimate for 2012 medical insurance included an incorrect assumption of a higher level of migration to lower
tiered plans and the dropping of medical coverage by employees. Actual 2012 medical cost was higher.
The 2011 Legislature passed retirement rates for 2012 but not for 2013. The Library will budget at the Pension
Funding Council proposal of 9.19%. Contribution rates for the last few years have been as follows:
July 2013 - June 2014 9.19%
July 2012 - June 2013 7.21%
July 2011 - June 2012 7.21%
July 2010 - June 2011 5.31% The increase from 5.31% to 9.19% for PERS contributions has resulted in an additional $380,000 to the 2013
budget for estimated personnel costs.
$0
$200,000
$400,000
$600,000
1999 2000 2001 2002 2003 2004 2005 2006 2007 2008 2009 2010 2011 2012
Substitute Cost
Substitute Cost
2003 2004 2005 2006 2007 2008 2009 2010 2011 2012 2013
205
210
215
220
225
230
235
240
245
250
255
$0
$50,000
$100,000
$150,000
$200,000
$250,000
$300,000
$350,000
$400,000
$450,000
$500,000
Substitute Cost FTEs FTEs Subsitute Cost

33 | P a g e
The 2013 benefit margin is projected to be 33.3%, an increase from the 2012 margin of 32.47%.
Supplies
This category represents articles and commodities purchased for consumption by the various departments or as
part of public services. It also includes fuel for the courier vehicles and small tools utilized by the Facilities
department. The 2013 estimate for supplies has been reduced by 7% from the 2012 budget estimate due to
management of expenditures.
Other Services and Charges
This category is meant to capture the other various aspects to operations including professional services,
communications, travel, advertising, operating rentals, insurance, utilities, repairs and maintenance and
miscellaneous. The 2013 estimate for this category is an increase of 15.9% over the 2012 estimate, or $295,130.
Communications will not include the rebate for E-rate telecommunications discount; the $270,000 anticipated
rebate will be shown on the revenue side of the financial statements and not the expenditure side.
The element for training is set for a 44% increase as staff development is one of the 2013 budget priorities.
0.0%
5.0%
10.0%
15.0%
20.0%
25.0%
30.0%
2000 2001 2002 2003 2004 2005 2006 2007 2008 2009 2010 2011 2012 2013
Timberland Regional Library Fringe Benefit Percent
0
5,000,000
10,000,000
15,000,000
2001 2002 2003 2004 2005 2006 2007 2008 2009 2010 2011 2012 2013
Wages Benefits

34 | P a g e
Books and Materials
Collection materials include purchases of materials for use by the public. It includes print material, machine
readable material, audio-visual material, other materials, and processing charges. Books and materials will be
15.9% of the 2013 budget.
In the past, 16% was the target for collections which will include additional variations such as leased materials
and pre-loaded Nooks. Processing charges is increased 80% to a total estimate of $135,000; downloadables is
increased 7.5% to $713,800: 21.1% of the overall materials budget: and 1.8%, or $61,330, was set aside for
emerging formats.
$244.45 $285.27
$431.95 $491.08
$141.60
$231.93
$348.04
$468.19
$0.00
$100.00
$200.00
$300.00
$400.00
$500.00
$600.00
2004 2005 2006 2007 2008 2009 2010 2011 2012 2013
Training $/FTE
Training $/FTE
15.60% 15.57%
15.98% 16.10% 16.22%
15.20%
14.69%
14.37%
13.95% 13.74%
13.93%
15.94%
13.50%
14.00%
14.50%
15.00%
15.50%
16.00%
16.50%
2000 2002 2004 2006 2008 2010 2012
Collections % of Budget

35 | P a g e
Collections investment in ratio to the population of Timberland Regional Library has steadily risen over the last
four years.
$5.22
$5.56 $5.54 $5.74
$5.93 $6.09
$6.30 $6.32 $6.54
$5.81 $5.59
$5.82
$6.52
$7.12
4.00
4.50
5.00
5.50
6.00
6.50
7.00
7.50
2000 2001 2002 2003 2004 2005 2006 2007 2008 2009 2010 2011 2012 2013
Collections Investment per capita
Tenino Entry Sign
Carved by local stonemason Keith Phillips using
sandstone from the Tenino sandstone quarry

36 | P a g e
Summary of General Fund Balance
Past practice has held that, by default, all sources of unexpended revenues not held for special purpose, such as
those related to grants, are released into the General Fund at year-end unless the Board takes action to identify
and approve use of fund balance to support the special purpose funds, or the funds restricted for specific
purposes such as the Building Fund and Auto-circulation Fund.
The General Fund balance is a key tool for managing the Library’s cash flow. Should the General Fund balance get
too low, not enough funds are available to pay for the first four or five months of each year (until tax collections
are received), requiring the Library to borrow from other sources through Board action.
In 2009, the Government Finance Officers Association (GFOA) released an updated policy statement on cash
reserves (Fund Balance). GFOA recommends a Fund Reserve policy to address one or more of the following 5
factors:
1. Predictability of revenues and the volatility of expenditures – higher fund levels may be needed if there
are unpredictable fluctuations in revenues, or expenditures are volatile.
2. Perceived exposure to significant one-time outlays (e.g., disasters, state budget cuts, immediate capital
outlay needs).
3. Potential drain upon general fund resources from other funds. In other words, deficits in other funds
may require that a higher level of fund balance be maintained.
4. Liquidity, or the disparity between when financial resources become available to make payments and the
average maturity of related liabilities, may require a higher level for fund balance.
5. Commitments and assignments for a specific purpose may require higher than normal levels.
Beginning Fund Balance
The General Fund balance is estimated to be at $9.21 million. The actual amount will not be known until the
year-end report is issued.
Minimum Beginning Assigned Fund Balance (Reserve Commitments)
It is Timberland Regional Library’s policy to provide a minimum beginning assigned fund balance of twice the
maximum monthly deficit of the preceding year.
-$4,000.00
$6,000.00
$16,000.00
Tho
usa
nd
s Cash Flow 2012
Receipts
Expenditures
Cash Balance
Maximum monthly deficit March 2012
SUMMARY OF GENERAL FUND BALANCE

37 | P a g e
Formula $3,525,872.37 x 2 = $7,051,744.74 (Minimum Beginning Assigned Fund Balance)
The Library calculates that approximately $7.05 million will be needed for cash flow to operate until the large
influx of tax revenues come in late April. As revenues are received through December, this reserve is restored
and becomes available for the following year.
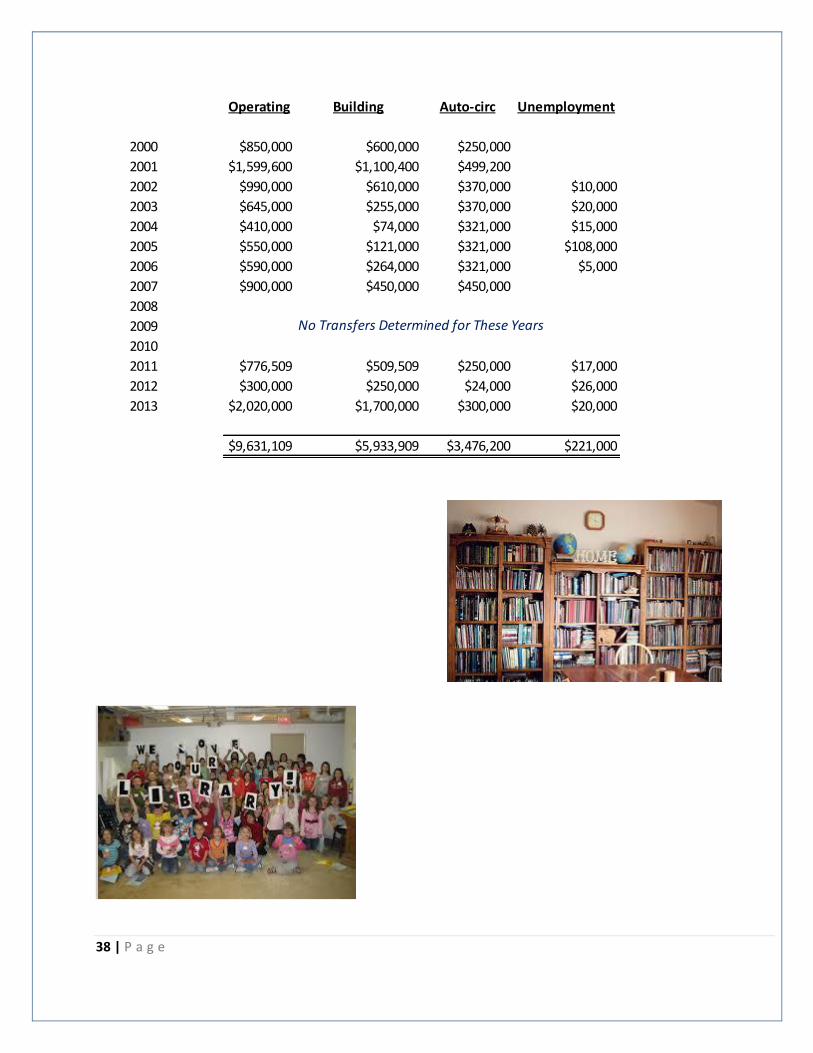
Transfers to Special Purpose Funds
The amount to be transferred to the special purpose funds, Building Fund, Automated Circulation Fund, and
Unemployment Fund, will be the difference between ending fund balance and the minimum beginning assigned
fund balance. The appropriate level of funding for the special purpose funds shall be determined by assignment.
Operating Transfers by Year
Timberland Regional Library CASH FLOW 2012
Month Receipts Expenditures Cash Balance
Jan-12 402,311.15 1,678,543.09 (1,276,231.94)
Feb-12 699,605.34 3,272,412.10 (2,572,806.76)
Mar-12 1,336,156.37 4,862,028.74 (3,525,872.37)
Apr-12 5,831,809.99 6,430,949.55 (599,139.56)
May-12 9,722,488.35 8,036,851.41 1,685,636.94
Jun-12 11,118,456.13 9,677,436.37 1,441,019.76
Jul-12 11,526,474.91 11,204,587.30 321,887.61
Aug-12 11,741,291.76 12,772,061.94 (1,030,770.18)
Sep-12 12,152,335.81 14,620,429.71 (2,468,093.90)
Oct-12 16,250,274.29 16,298,512.46 (48,238.17)
Nov-12 19,570,300.46 18,063,180.20 1,507,120.26
McCleary Timberland Library Art
Naselle Timberland Library Art
38 | P a g e
Operating Building Auto-circ Unemployment
2000 $850,000 $600,000 $250,000
2001 $1,599,600 $1,100,400 $499,200
2002 $990,000 $610,000 $370,000 $10,000
2003 $645,000 $255,000 $370,000 $20,000
2004 $410,000 $74,000 $321,000 $15,000
2005 $550,000 $121,000 $321,000 $108,000
2006 $590,000 $264,000 $321,000 $5,000
2007 $900,000 $450,000 $450,000
2008
2009
2010
2011 $776,509 $509,509 $250,000 $17,000
2012 $300,000 $250,000 $24,000 $26,000
2013 $2,020,000 $1,700,000 $300,000 $20,000
$9,631,109 $5,933,909 $3,476,200 $221,000
No Transfers Determined for These Years