Embed Size (px)
Citation preview

Timber Research CentreTimber Research Centre
Michael Anderson– Mohamed FaridMichael Anderson– Mohamed Farid
Pablo Prallong – Lewis Macleod Pablo Prallong – Lewis Macleod
Ross Turbet Ross Turbet
16394 & 16469 16394 & 16469 Group AGroup A
26/04/20054th Presentation

Presentation AgendaPresentation Agenda Introduction to ProjectIntroduction to Project
Building DescriptionBuilding Description
DemandsDemands
Demand Side Management TechniquesDemand Side Management Techniques ESP-R – Design ChangesESP-R – Design Changes HomerHomer ControlControl
SupplySupply
ConclusionConclusion

Our AimOur Aim
Use Demand Side Management to Use Demand Side Management to facilitate the embedding renewable facilitate the embedding renewable energy to a Timber research centreenergy to a Timber research centre
Apply design changes to match Apply design changes to match building energy demands with building energy demands with renewable supply.renewable supply.
Show results through simulation and Show results through simulation and website.website.

Review of the buildingReview of the building
Timber Research CentreTimber Research Centre
Up to 80 occupantsUp to 80 occupants
Situated in outskirts of GlasgowSituated in outskirts of Glasgow
Typical of offices (loads) across Typical of offices (loads) across Central Scotland (weather)Central Scotland (weather)

Building DemandsBuilding Demands
HeatingHeating Space heatingSpace heating Hot waterHot water
ElectricalElectrical LightingLighting VentilationVentilation MachineryMachinery Other appliancesOther appliances

Calculating DemandsCalculating Demands
Heating Demands Electrical Demands
Esp-r Model

Seasonal DemandsSeasonal Demands
Heating demandsHeating demands

Seasonal DemandsSeasonal Demands
Electrical DemandsElectrical Demands

Demand Side Management.Demand Side Management.
Strategies utilised throughout the Strategies utilised throughout the project.project.
Peak clippingPeak clipping Valley fillingValley filling Load shiftingLoad shifting
Design changes made in order to Design changes made in order to implement these strategies.implement these strategies.
How these changes have affected How these changes have affected the demands of our design.the demands of our design.

Design changes 1.Design changes 1.Peak clippingPeak clipping
To help lower the demand, we looked to To help lower the demand, we looked to significantly reduce the loads in the significantly reduce the loads in the building building
Natural lighting.Natural lighting.
Natural heating.Natural heating.
Energy reduction in cafeteria.Energy reduction in cafeteria.

Design changes 2.Design changes 2.Valley fillingValley filling
The goal is to build up off-peak loads in order The goal is to build up off-peak loads in order to smooth out the load and improve the to smooth out the load and improve the
economic efficiency of the building.economic efficiency of the building.
Heating slowly turned on in the Heating slowly turned on in the morning before occupancymorning before occupancy
Heating during the weekends.Heating during the weekends.

Design changes 3.Design changes 3.Load shiftingLoad shifting
The idea behind load shifting is to move the The idea behind load shifting is to move the times of peak energy usage to times where times of peak energy usage to times where there is a excess of electricity.there is a excess of electricity.
Stagger times at which Stagger times at which occupants enter the building.occupants enter the building.
Change designated break times Change designated break times throughout the day.throughout the day.

Effects of changes.Effects of changes.
Lower demand peaks in spaces, Lower demand peaks in spaces, both in terms of heating and both in terms of heating and lighting.lighting.
Smoothened demand curveSmoothened demand curve
Better options and feasibility for Better options and feasibility for supply matching.supply matching.

Design changesDesign changes

U-ValueU-Value
External wall propertiesExternal wall properties
Weatherboard: 100mmWeatherboard: 100mm Glasswool: 75Glasswool: 75 Air Gap: 50Air Gap: 50 Breezeblock: 100Breezeblock: 100
Overall U-Value = 0.39W/mOverall U-Value = 0.39W/m22KK
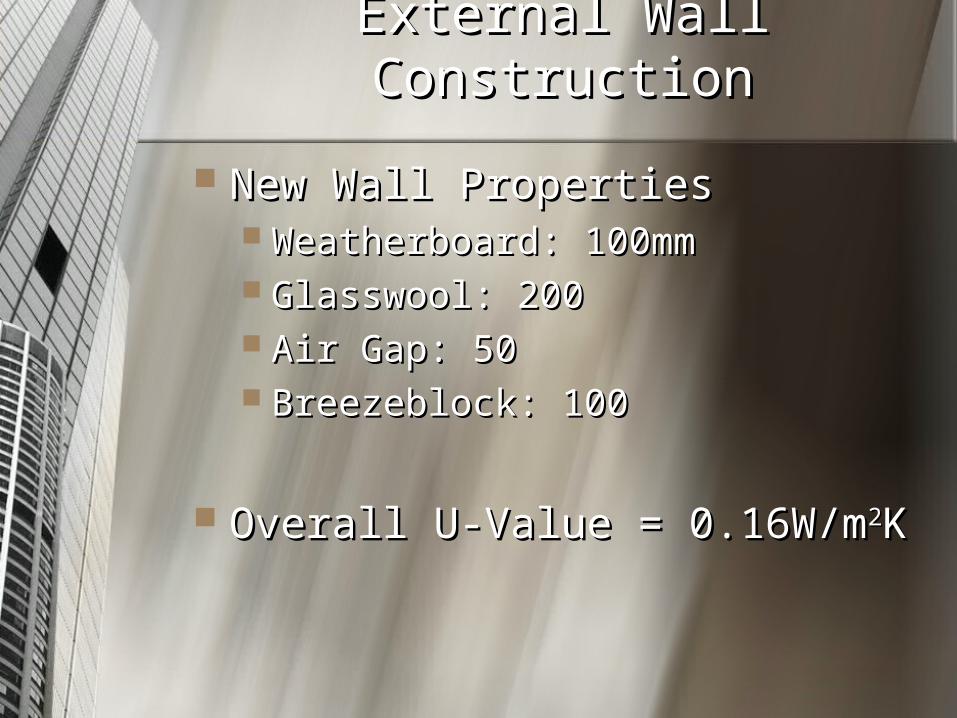
External Wall ConstructionExternal Wall Construction
New Wall PropertiesNew Wall Properties Weatherboard: 100mmWeatherboard: 100mm Glasswool: 200Glasswool: 200 Air Gap: 50Air Gap: 50 Breezeblock: 100Breezeblock: 100
Overall U-Value = 0.16W/mOverall U-Value = 0.16W/m22KK

DaylightDaylight
Utilising as much daylight as Utilising as much daylight as possiblepossible

DaylightDaylight
Careful to avoidCareful to avoid
glare & unwanted glare & unwanted
heat gainsheat gains

Heating controlHeating control
Continuous heating…Continuous heating…
Pre-Heat Pre-Heat 0000 – 0700 (12DegC)0000 – 0700 (12DegC)
Basic Control 0700 -1600 (26DegC)Basic Control 0700 -1600 (26DegC)
Pre-Heat 1600 – 0000 (12DegC)Pre-Heat 1600 – 0000 (12DegC)

Seasonal DemandsSeasonal Demands
Typical winterTypical winter

Seasonal DemandsSeasonal Demands
Typical spring Typical spring

Seasonal DemandsSeasonal Demands
Typical summerTypical summer

Automatic Control SystemAutomatic Control System
Sensors Sensors
Computer NetworkComputer Network
Controlling each room Controlling each room separatelyseparately

Flow chartsFlow charts

Lighting ControlLighting Control

SupplySupply
Wind Energy 30KWWind Energy 30KW
PV Solar 40KWPV Solar 40KW
Generator 50 KWGenerator 50 KW
Battery x 10Battery x 10 Nominal Voltage 4VNominal Voltage 4V Nominal Capacity 7.6 KWhNominal Capacity 7.6 KWh

Matching MethodsMatching Methods

Component Production Component Production Fraction Fraction (kWh/yr)(kWh/yr)
PV array 63,462 27%PV array 63,462 27% Wind turbine 57,946 25%Wind turbine 57,946 25% Generator 1112,359 48%Generator 1112,359 48% Total 233,766 100%Total 233,766 100%

Annual electric energy Annual electric energy consumption consumption
Total Electrical Demand Total Electrical Demand 173,310 kWh/yr173,310 kWh/yr
Excess electricity:60,456kWh/yr Excess electricity:60,456kWh/yr

Emissions without Emissions without RenewableRenewable
(kg/yr)(kg/yr) Carbon dioxide 260,993Carbon dioxide 260,993 Carbon monoxide 644Carbon monoxide 644 Unburned hydrocarbons 71.4Unburned hydrocarbons 71.4 Particulate matter 48.6Particulate matter 48.6 Sulfur dioxide 524Sulfur dioxide 524 Nitrogen oxides 5,748Nitrogen oxides 5,748

Emissions after Emissions after embedding Renewablesembedding Renewables
Emissions down by approx 50%Emissions down by approx 50%
(kg/yr) (kg/yr)
Carbon dioxide 136,379Carbon dioxide 136,379 Carbon monoxide 337Carbon monoxide 337 Unburned hydrocarbons 37.3Unburned hydrocarbons 37.3 Particulate matter 25.4Particulate matter 25.4 Sulfur dioxide 274Sulfur dioxide 274 Nitrogen oxides 3,004Nitrogen oxides 3,004
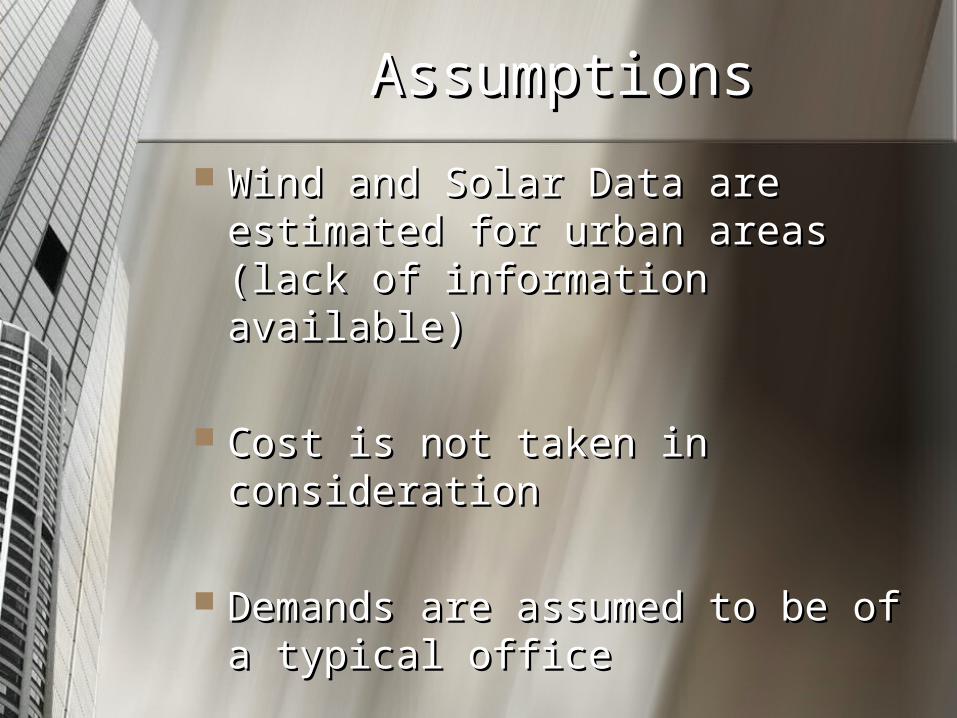
AssumptionsAssumptions
Wind and Solar Data are Wind and Solar Data are estimated for urban areas (lack estimated for urban areas (lack of information available)of information available)
Cost is not taken in Cost is not taken in considerationconsideration
Demands are assumed to be of Demands are assumed to be of a typical officea typical office
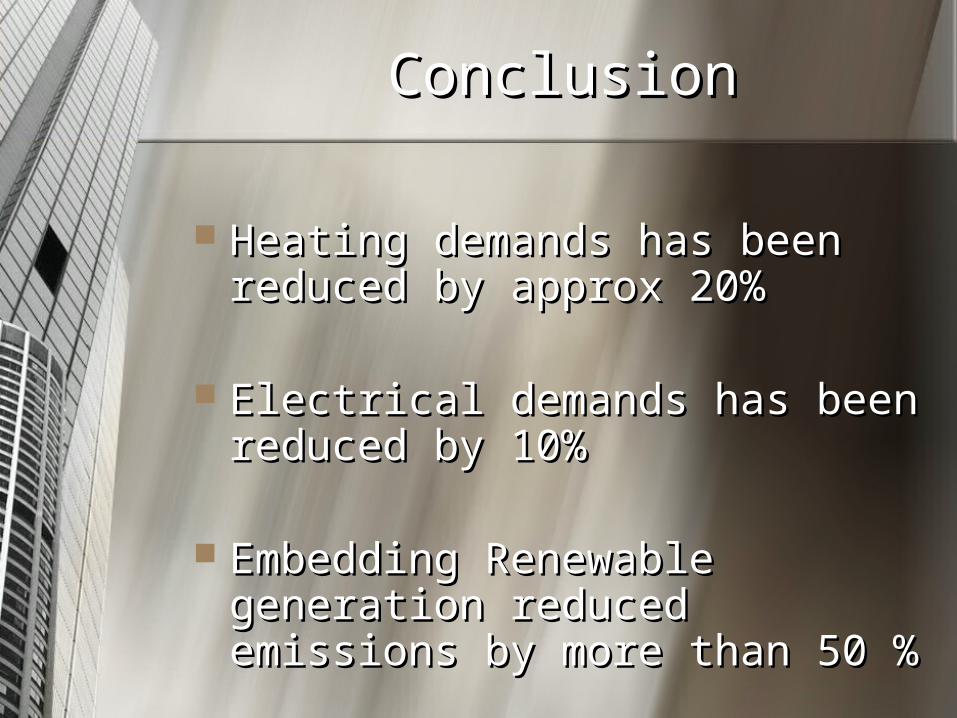
ConclusionConclusion
Heating demands has been Heating demands has been reduced by approx 20%reduced by approx 20%
Electrical demands has been Electrical demands has been reduced by 10% reduced by 10%
Embedding Renewable Embedding Renewable generation reduced emissions generation reduced emissions by more than 50 %by more than 50 %

Thank you for your Thank you for your attentionattention
Any Questions?Any Questions?

Crit 4 (Final Presentation)Crit 4 (Final Presentation)Your team should be reporting the Your team should be reporting the
outcomes from the year's outcomes from the year's investigation. These should include a investigation. These should include a
summary of how and where energy summary of how and where energy savings have been achieved, savings have been achieved,
an assessment of the improvements an assessment of the improvements to building performance, to building performance,
reduction in plant capacity and the reduction in plant capacity and the reduced environmental impact reduced environmental impact achieved by adopting the plant and achieved by adopting the plant and control procedures used. control procedures used.


![[16469] Low Energy Building Design](https://img.pdfslide.us/doc/110x75/568137cb550346895d9f6947/16469-low-energy-building-design-56e8b8c5874f4.jpg)