Embed Size (px)
Citation preview

2015 Tilted Earth Wine & Music Festival
Executive Summary
Produced by
Arizona Hospitality Research & Resource Center
The W.A. Franke College of Business
Northern Arizona University
July 6, 2015
Introduction:
The Arizona Hospitality Research & Resource Center, a unit of The W.A. Franke College of Business was asked to help the City of Cottonwood, Recreation Services to design and analyze a survey of visitors to the 2015 Tilted Earth Wine & Music Festival held in Cottonwood, Arizona. Professional staff from the AHRCC helped the Recreation Services Division to develop a survey instrument to measure visitor satisfaction with the event, as well as collecting demographic and expenditure information. The festival was held on June 19th and 20th in Cottonwood, where 129 surveys were obtained from both locals and non‐locals.
For the purpose of this study, non‐locals are considered to be any festival‐goers who do not come from the immediate Verde Valley communities. Therefore, non‐local visitors in this analysis can and will include visitors from Prescott, Prescott Valley and Bagdad, communities within Yavapai County but outside of the geographic region formed by the Verde Valley. This is important as it affects the overall calculation of the economic impact of the festival. Generally tourism surveys, only out‐of‐county money is considered when calculating economic impact. However, in the case of Arizona counties which tend to be very large, visitors who are more than 50 miles away from home in one direction are considered eligible to be included in the economic impact analysis.
This executive summary will summarize the data collected on the survey instrument and report economic impact. A complete list of tables and frequency distributions, in the order that they appear on the questionnaire, are also included.

Festival Visitor Characteristics:
• Most of the visitors to the festival (96%) were from Arizona. Out‐of‐state visitors included two visitor parties from California, and one each from Washington, Nevada and Utah. One international visitor arrived from the Netherlands.
• Most Arizona residents were from Maricopa County (46%), especially Phoenix and Sun City; about a third (36%) were from the Verde Valley, especially Cottonwood and Sedona; other Arizona communities accounted for 12 percent, and other Yavapai County visitors, outside the Verde Valley, accounted for the remaining 6.0 percent.
• Average party size was 3.2 persons; very few (10%) festival‐goers traveled with children under 18 years of age.
• The largest number of festival‐goers learned about the event from family and friends (28%), followed by posters/flyers (26%), and through the grape vine (17%). These were followed by online‐website (14%) and Social Media (13%); less than 10% of attendees had visited previously, seen a newspaper/magazine article, or heard about the festival on the radio.
Festival Experience:
• Festival visitors were asked about their level of satisfaction with the festival experience. Generally, festival‐goers were very satisfied, measured by their mean (average) responses based on a five point scale where 1 is totally dissatisfied and 5 is totally satisfied. Overall the score was very high; the lowest score was even between somewhat and totally satisfied:
o The highest satisfaction ratings were for the ease of purchasing tickets, the friendliness‐helpfulness of staff, the festival atmosphere, and activities for children, all with a very high mean score of 4.9 out of 5.
o The next highest satisfaction level was for the wine garden experience and the quality of the musical performers/bands, both with mean scores of 4.8 out of 5.
o Visitors were also satisfied with the organization/layout of the festival, and the quality of the food vendors, both with mean scores of 4.7 out of 5.
o The lowest score recorded by visitors was for parking logistics and shuttle services, with a mean score of 4.2 out of 5.
• On average, attendees visited seven different wine booths. A majority (53%) purchased take‐home bottles of wine, and more than three‐fourths (79%) voted in the People’s Choice awards; only seven respondents (6%) attended the Winemaker Dinner on Friday evening.
• Overall, the Tilted Earth Festival was an outstanding success for visitors, recording an extremely high mean score of 9 out of a possible 10. Obviously the festival met the expectations of the guests.

• Almost all visitors (98%) indicated that they would recommend the Tilted Earth Festival to family and friends.
• Festival‐goers were asked what they liked best about the Tilted Earth Festival. Numerous responses mentioned the atmosphere, the wine, and the people. Verbatim responses can be found in the tables section.
• Festival‐goers were also asked what the Tilted Earth Festival could do to improve their experiences. The top two issues were amelioration of high temperatures (need for water, misters, shade, etc.), and shuttle and parking issues.
• Attendees at the Tilted Earth Festival felt a strong sense of community, with almost all guests (97%) indicating that they felt a part of a community at the festival.
• Festival‐goers were also asked to indicate which of four attributes of the festival were most important to them. The attributes included: Friendship, Value, Fun and Family‐oriented. Rated according to their mean (average) score (where 1 is the most important and 4 is the least important), Fun received the highest rating (mean score 1.6), followed by Friendship (1.9), Family‐oriented (2.3) and Value (2.5).
• Festival‐goers were also asked what three factors are most important in their daily food consumption. In descending order of importance, these were: Flavor‐Taste (77%), Nutritional Value (76%), Affordability (43%), Quick (25%), Organic‐Free Range (23%), Low Fat (13%), Non‐GMO (10%), Vegetarian‐Vegan (10%), and Gluten‐free (6%).
• Finally, visitors were queried about their interest in future activities which may be offered at next years Tilted Earth Festival. In order of importance, most visitors wanted to see breweries added to the festival (62%). Breweries were followed by camping and distilleries (34% each), extending the festival to three days, Friday thru Sunday (29%), art exhibits (24%), and a film festival (15%).
• As a follow‐up question to potential new offerings at next year’s festival, festival‐goers were asked to identify their favorite genre of film. Comedies (39%) were the most popular genre, followed by independent films (25%), action (12%), romantic (11%), science fiction‐horror (7%) and suspense (5%).
Demographics
• Almost two‐thirds (65%) of survey respondents were women; males were one‐third (35%). This does not, however, mean that women comprised the majority of all visitors, this simply is a reflection that women were more likely to respond to the survey.
• The overall average age of visitors was 46.1 years, a prime demographic for Arizona tourism.
• In terms of age, males (45.6 years) were slightly younger than females (46.0 years), however the differences are not statistically significant.
• Generational analysis is a very handy tool used in marketing. The Pew Charitable Trust in a recent study defines six current generations that fit across current age cohorts. These

generations are Millennials (currently age 18‐33), Gen X (35‐45), Younger Boomers (46‐55), Older Boomers (56‐64), the Silent Generation (65‐73) and the GI Generation (74 years and older). Each of these generations has different values and attitudes shaped by their formative years. The survey sample is weighted towards Younger Boomers, with the average age of 46.1 on the cusp of the younger boomers and Gen‐X. When younger (25%) and older (16%) boomers are combined they account for 42 percent of the total festival‐goers, with Gen‐X comprising 29 percent of visitors, followed by Millennials (20%). There were relatively few members of the silent generation (10%) and no respondents from the GI generation. The overall younger age of the festival‐goers and their position in the younger boomer cohort is a distinct advantage both for longevity of festival and the economic stability of attendees.
• The average household income of festival‐goers before taxes in 2014 was $86,504, while the median income (which is less affected by extreme values) was $76,000. One‐third of the sample of festival‐goers (35%) had annual household incomes in excess of $100,000, including 18 percent with household incomes in excess of $150,000. Roughly one‐fourth (24%) had annual household incomes below $50,000.
Lodging
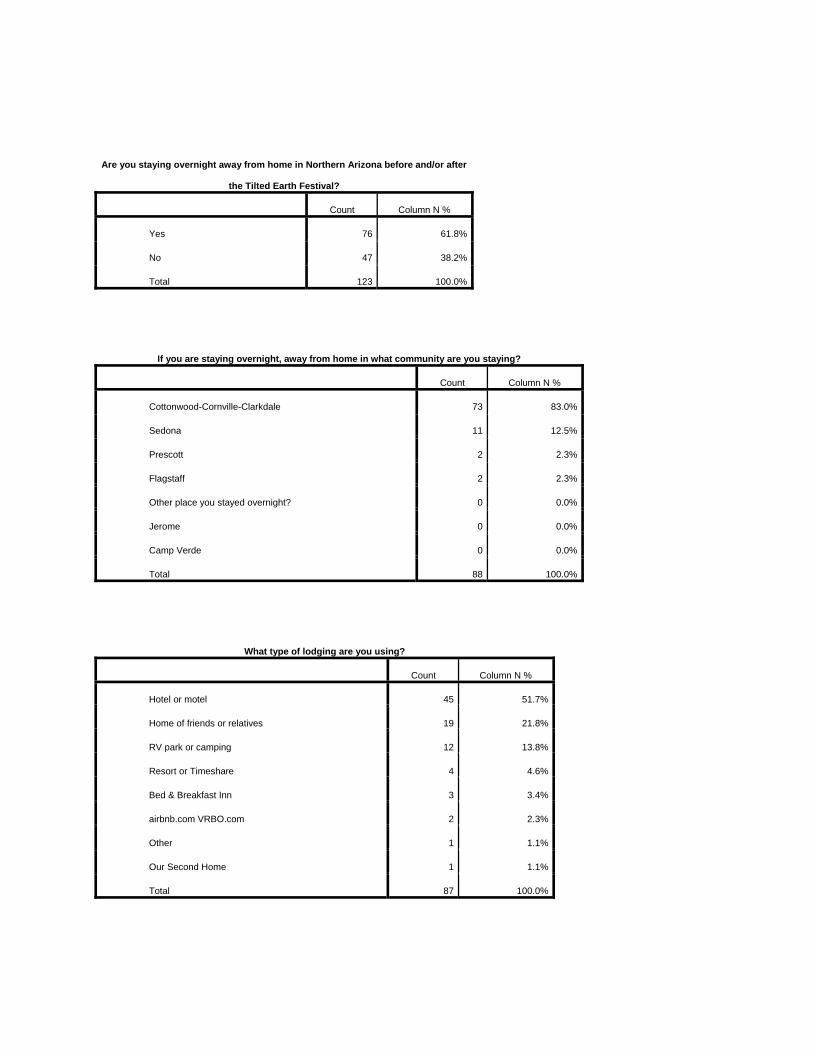
• A surprising 62 percent of all survey respondents indicated that they were staying overnight away from home in Northern Arizona on this trip either before or after the Tilted Earth Festival. This does not necessarily imply that all these festival‐goers were staying because of the festival, but rather the festival was a part of their trip experience while in the region.
• The vast majority (83%) of those who stayed overnight, stayed in the Cottonwood‐Cornville‐Clarkdale area, followed by Sedona (13%), and Prescott and Flagstaff (2% each).
• Three‐fourths of all overnight visitors (76%) stayed in paid accommodations, with the remainder either in the homes of family or friends (22%), a second home or other (1% each). The largest number of overnight visitors stayed in a hotel or motel (52%), followed by RV park or camping (14%), Resort or Timeshare (5%), B&B (3%), and airbnb.com or VRBO.com (2%).
Festival Expenditures
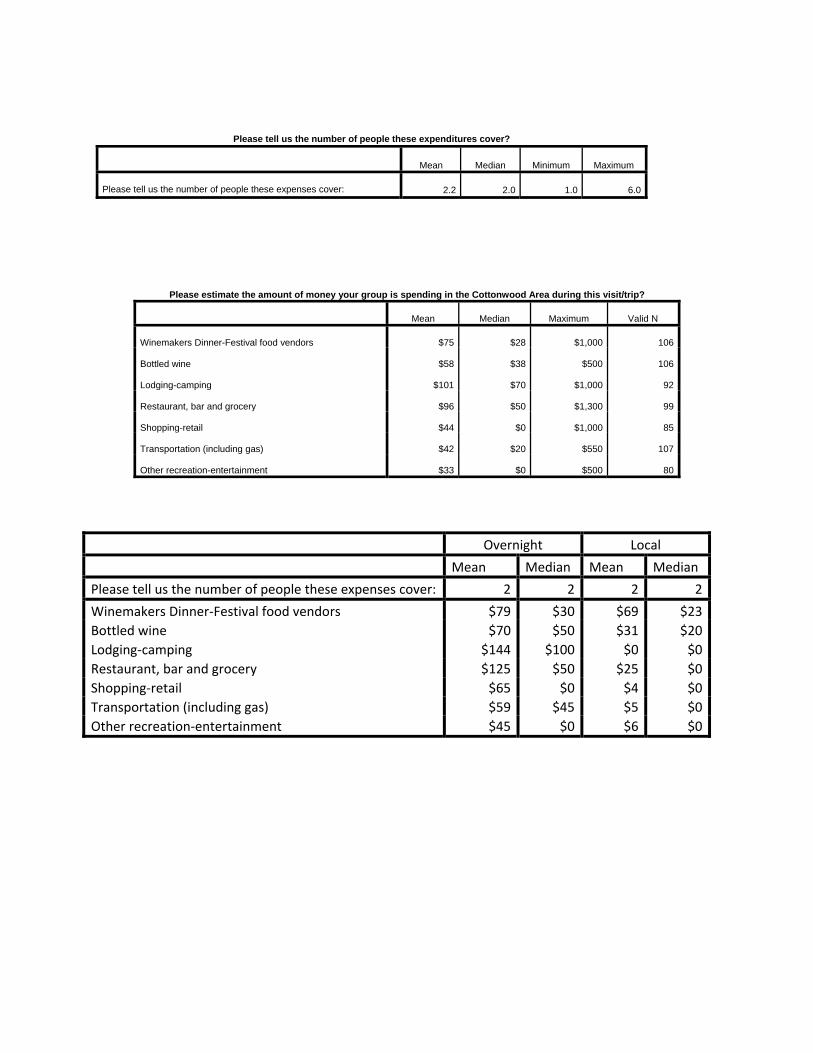
• The largest average trip expenditures by festival‐goers were for lodging or camping ($101 per trip), followed by restaurant, bar and grocery expenditures ($96), Winemakers Dinner and festival food vendor expenditure ($75), purchases of bottled wine ($58), tourist shopping or retail ($44), transportation including gas ($42%), and other recreation or entertainment expenditures ($33). Not all respondents had expenditures in every category; the largest percentage of festival‐goers had transportation expenditures (83%), followed by food vendors and bottled wine (82% each), while 71 percent had lodging or camping expenditures. See Table below.
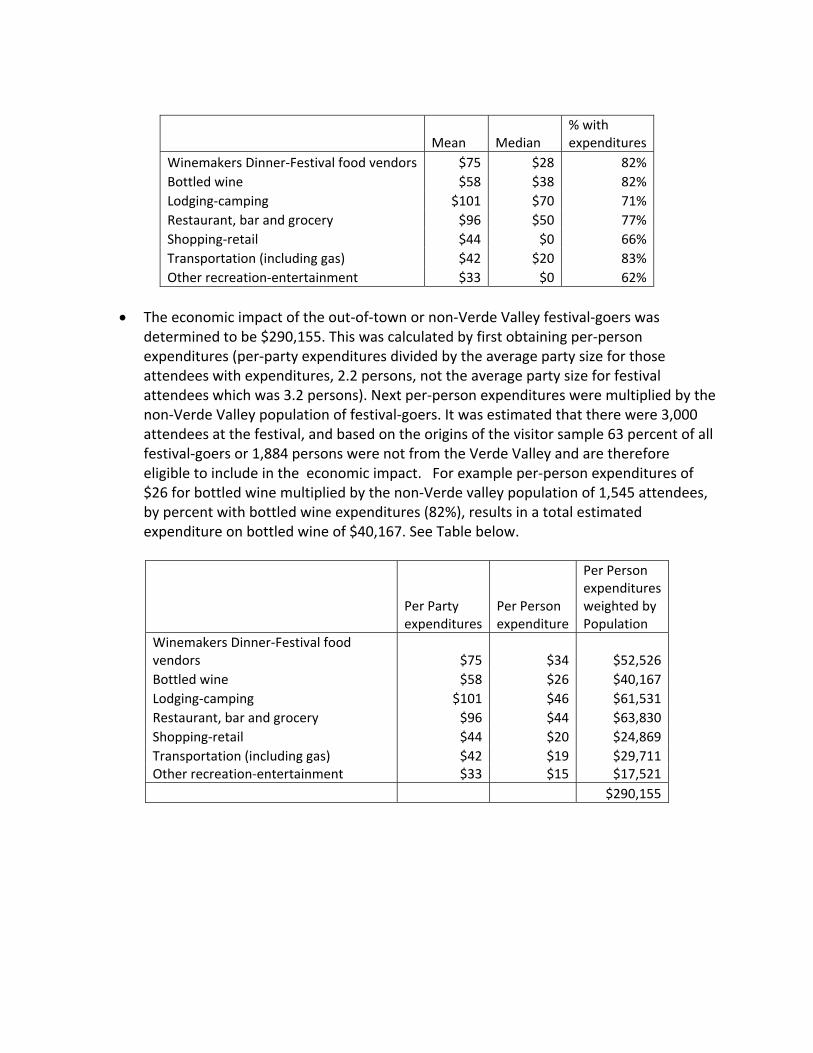
Mean Median % with expenditures
Winemakers Dinner‐Festival food vendors $75 $28 82% Bottled wine $58 $38 82% Lodging‐camping $101 $70 71% Restaurant, bar and grocery $96 $50 77% Shopping‐retail $44 $0 66% Transportation (including gas) $42 $20 83% Other recreation‐entertainment $33 $0 62%
• The economic impact of the out‐of‐town or non‐Verde Valley festival‐goers was
determined to be $290,155. This was calculated by first obtaining per‐person expenditures (per‐party expenditures divided by the average party size for those attendees with expenditures, 2.2 persons, not the average party size for festival attendees which was 3.2 persons). Next per‐person expenditures were multiplied by the non‐Verde Valley population of festival‐goers. It was estimated that there were 3,000 attendees at the festival, and based on the origins of the visitor sample 63 percent of all festival‐goers or 1,884 persons were not from the Verde Valley and are therefore eligible to include in the economic impact. For example per‐person expenditures of $26 for bottled wine multiplied by the non‐Verde valley population of 1,545 attendees, by percent with bottled wine expenditures (82%), results in a total estimated expenditure on bottled wine of $40,167. See Table below.
Per Party expenditures
Per Person expenditure
Per Person expenditures weighted by Population
Winemakers Dinner‐Festival food vendors $75 $34 $52,526 Bottled wine $58 $26 $40,167 Lodging‐camping $101 $46 $61,531 Restaurant, bar and grocery $96 $44 $63,830 Shopping‐retail $44 $20 $24,869 Transportation (including gas) $42 $19 $29,711 Other recreation‐entertainment $33 $15 $17,521
$290,155

Festival Economic Impact
Three processes are integral in modeling expenditure impacts: direct, indirect, and induced effects. Direct effects are that portion of initial tourist expenditures spent by the tourism sector for inputs necessary to provide the goods and services. For example, a tourist visits the Tilted Earth Festival in Yavapai county, and spends X dollars at a hotel. Then X is the direct effect of his expenditures. But the hotel in turn spends a portion of the initial expenditure on inputs necessary to run the operation (electricity, maid service, and so forth). Some of the hotel’s spending will occur outside of Yavapai County. However, the portion that the hotel spends within the county again contributes to the economy. This impact of the initial tourist expenditures is termed the indirect effect. Finally, those individuals or firms within Yavapai County who receive money through the indirect effect in turn spend money in the county. This final effect is termed the induced effect of the initial expenditure. The ratio of the three effects combined to the initial expenditure is labeled the multiplier for that expenditure. Therefore an output multiplier is the sum of direct (tourist spending), indirect (hotel spending) and induced (consumption) divided by direct tourism spending. Similarly, direct jobs are jobs that are supported by direct expenditures, while indirect and induced jobs are those supported by indirect and induced expenditures. It is important to remember that direct jobs are jobs supported by visitor expenditures in the county and may include but are not limited to jobs at the festival.
• Direct expenditures from the last column of the previous table were modeled in the
Implan input‐output model which examines and models the flow of direct expenditures through the regional economy of Yavapai County. Please note that direct event expenditures are reduced by $38,815, which is the result of direct leakage for goods and services purchased from outside the county and region. The overall direct impact of $251,340 resulted in further indirect impacts of $59,612 and induced impacts of $62,621 for a total economic impact of $373,573 with an expenditure multiplier of 1.5. See Table below.
• The total expenditure of $251,340 supports 2.8 direct jobs in the region and 0.4 jobs in the indirect and 0.5 jobs in the induced sectors of the economy for a total of 3.7 jobs with an employment multiplier of 1.3. See Table below.
• The festival generated significant state and local taxes of $23,346 and Federal taxes of $26,487.
Impact Type Direct Impact
Indirect Impact
Induced Impact
Output Multiplier
Total Impact
Output $251,340 $59,612 $62,621 1.5 $373,573 Employment 2.8 0.4 0.5 1.3 3.7

APPENDIX A:
DATA TABLES 2015
TILTED EARTH WINE & MUSIC FESTIVAL

How many people are in your group including yourself?
Mean Median Minimum Maximum
How many people in your group today,
including yourself? 3.2 2.0 1.0 20.0
Does your group include children/youth (under age 18)?
Count Column N %
Yes 13 10.2%
No 114 89.8%
Total 127 100.0%
How did you hear about the Tilted Earth Festival?
Count Column N %
Friend or Family Member told me 36 28.3%
Posters-flyers 33 26.0%
Through the grape vine! 21 16.5%
Online-website 18 14.2%
Social Media (Facebook-Twitter) 16 12.6%
Attended previously 16 12.6%
Newspaper or magazine 7 5.5%
Radio 6 4.7%
Television 0 0.0%

Tell us how satisfied you are with the Festival experience in each of the following areas:
Not applicable responses removed
Totally Dissatisfied
Somewhat
Dissatisfied
Neither Satisfied nor
Dissatisfied Somewhat Satisfied Totally Satisfied Mean
Ease of purchasing tickets 0.0% 0.8% 0.8% 7.3% 91.1% 4.9
Parking logistics, shuttle 6.7% 7.5% 5.0% 23.3% 57.5% 4.2
Organization-layout of festival 0.8% 0.8% 3.2% 19.8% 75.4% 4.7
Friendliness-helpfulness of staff 0.0% 0.0% 0.8% 4.7% 94.5% 4.9
Festival atmosphere 0.0% 0.0% 0.0% 7.1% 92.9% 4.9
Experience at wine garden 0.0% 0.0% 2.4% 12.8% 84.8% 4.8
Quality of food vendors 1.1% 0.0% 3.2% 18.9% 76.8% 4.7
Musical performers-bands 0.0% 0.8% 2.4% 16.0% 80.8% 4.8
Activities for children 0.0% 0.0% 1.8% 5.5% 92.7% 4.9
1 = Totally Dissatisfied
3 = Neither Satisfied nor Dissatisfied
5=Totally Satisfied

Roughly, how many different Winery Booths did you visit?
Mean Median Minimum Maximum
Winery Booths visited? 6.9 6.0 .0 17.0
Did you purchase take-home bottles?
Count Column N %
Yes 79 63.2%
No 46 36.8%
Total 125 100.0%
Did you vote in the People’s Choice awards?
Count Column N %
Yes 101 78.9%
No 27 21.1%
Total 128 100.0%
Did you attend the Winemaker Dinner event on Friday evening?
Count Column N %
Yes 7 5.6%
No 119 94.4%
Total 126 100.0%
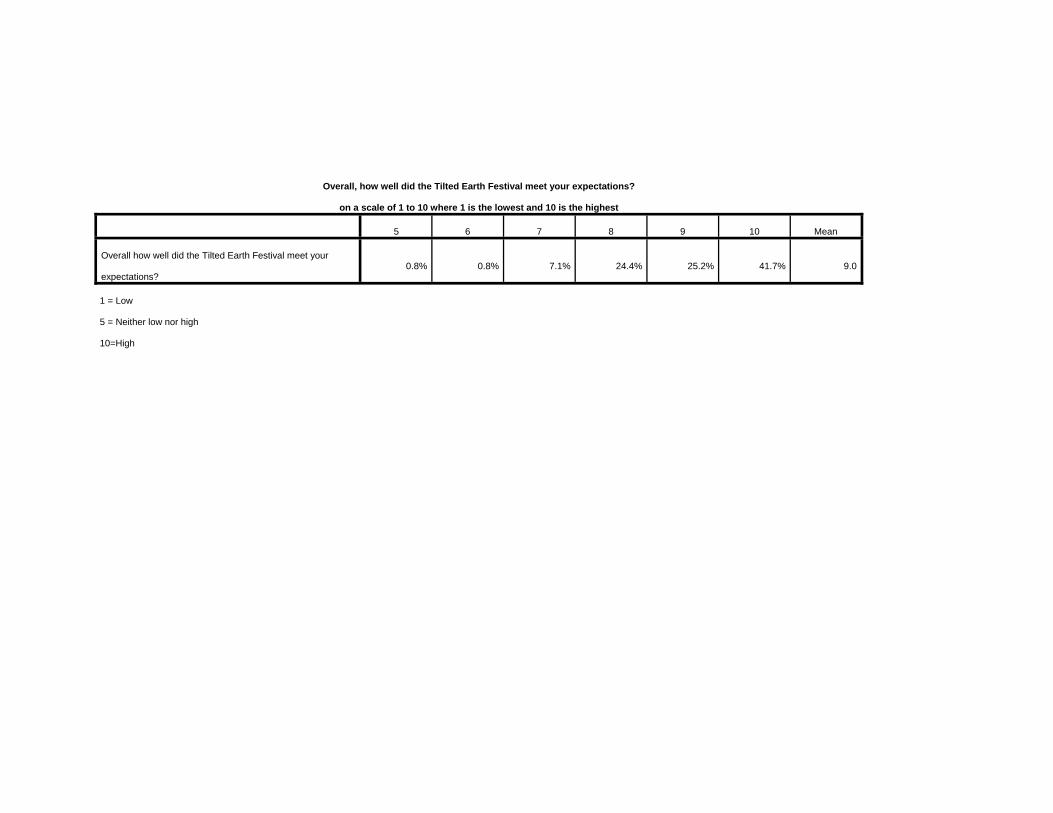
Overall, how well did the Tilted Earth Festival meet your expectations?
on a scale of 1 to 10 where 1 is the lowest and 10 is the highest
5 6 7 8 9 10 Mean
Overall how well did the Tilted Earth Festival meet your
expectations? 0.8% 0.8% 7.1% 24.4% 25.2% 41.7% 9.0
1 = Low
5 = Neither low nor high
10=High

Would you recommend the Tilted Earth Festival to friends and family?
Count Column N %
Yes 119 97.5%
No 3 2.5%
Total 122 100.0%
What did you like BEST about the 2015 Tilted Earth Festival?
Count Column N % ATMOSPHERE 14 11.1%MUSIC 8 6.3%WINE 4 3.2%WINE TASTING 3 2.4%WINE & MUSIC 2 1.6%VARIETY OF WINE BOOTHS 2 1.6%SAM PILLSBURY 2 1.6%MUSIC & WINE 2 1.6%WINEMAKERS DINNER 1 0.8%WINE/MUSIC 1 0.8%WINE! 1 0.8%WINE;VERY RESONABLE;FOOD TRUCKS 1 0.8%WINE, WOMEN 1 0.8%WINE, STAFF, BAND 1 0.8%WINE VENDORS, FOOD TRUCKS 1 0.8%WINE SPRITZERS & MUSIC LINEUP 1 0.8%WINE MUSIC ATMOSPHERE 1 0.8%WINE MUSIC 1 0.8%WINE GARDEN, MUSIC, RELAXING ATMOSPHERE 1 0.8%WINE BOOTHS‐FRIENDLINESS LOCATION 1 0.8%WINE & MUSIC & FOOD 1 0.8%VIP AREA 1 0.8%VIP & MUSIC 1 0.8%VINEYARD INFO 1 0.8%VIBE 1 0.8%VENUE & THE ATMOSPHERE 1 0.8%VARIETY OF WINE 1 0.8%THE WINE, MUSIC 1 0.8%THE WINE VARIETY 1 0.8%THE WINE AND PEOPLE 1 0.8%THE WINE (FESTIVAL OPPORTUNITY) 1 0.8%

What did you like BEST about the 2015 Tilted Earth Festival? THE WINE 1 0.8%THE SURVEY! 1 0.8%THE SUN GOING DOWN 1 0.8%THE RELAXING ATMOSPHERE 1 0.8%THE PEOPLE & MUSIC 1 0.8%THE LOCATION & RUSTED ROOT 1 0.8%THE LOCAL WINERIES 1 0.8%THE LAYOUT‐SHADE 1 0.8%THE FOOD VENDORS 1 0.8%THE BANDS/KIDDO @PASSION GIVERS 1 0.8%THE ATMOSPHERE AND COMMUNITY 1 0.8%THE ATMOSPHERE 1 0.8%TEMPERATURE, WINE 1 0.8%STARTED LATER 1 0.8%STAFF ARE NICE 1 0.8%SHADED TREES 1 0.8%ROBERT EARL KEENE 1 0.8%ROAD TRIP 1 0.8%POSITIVE ATMOSPHERE, KID FRIENDLY, MUSIC 1 0.8%OVERALL EXPERIENCE/WINE, MUSIC, FOOD 1 0.8%OPENNESS, ACCESSABLE 1 0.8%NICE PORTAPOTTIES :) 1 0.8%NICE NIGHT 1 0.8%NICE LOCATION GOOD MUSIC GREAT WINE 1 0.8%NICE ATMOSPHERE 1 0.8%MUSIC, WINE, WEATHER, EVERYTHING! 1 0.8%MUSIC, WINE, KIDS ACTIVITIES 1 0.8%MUSIC, FREE TASTINGS 1 0.8%MUSIC GOOD, LIKED VENDORS 1 0.8%MUSIC AND VIBE, KID FRIENDLY 1 0.8%MUSIC AND ATMOSPHERE 1 0.8%MINGLING 1 0.8%LOCATION + FOOD + SAFE + RUSTED ROOT 1 0.8%LOCATION 1 0.8%LINEUP OF MUSIC 1 0.8%LIKE THE ATMOSPHERE 1 0.8%LAYOUT, GREAT WEATHER/LOCATION, COMFORTABLE 1 0.8%LAYOUT AND FOOD VENDORS 1 0.8%LAYED BACK FEELING, THE PEOPLE 1 0.8%KIDS ACTIVITIES, FOOD TRUCK CONCEPT, SILENT AUCTION 1 0.8%IT'S RELAXING 1 0.8%INCREDIBLE VENUE AND GREAT BOOTHS. ENJOYED BANDS AS WELL. 1 0.8%INCLUDED EVERYTHING, VARIETY OF FOOD TRUCKS 1 0.8%

What did you like BEST about the 2015 Tilted Earth Festival? HUMANE SOCIETY BOOTH AND THE WINE 1 0.8%FRIENDLINESS OF STAFF 1 0.8%FRIENDLINESS 1 0.8%FREE TICKETS (RADIO) 1 0.8%FOOD/WINE 1 0.8%FOOD 1 0.8%FAMILY ATMOSPHERE 1 0.8%EVERYTHING, CULTURE 1 0.8%EVERYTHING, BECAUSE THE MUSIC, OUTDOORS ETC. 1 0.8%EVERYTHING 1 0.8%ENVIRONMENT 1 0.8%CLOSE PARKING, NOT SO CROWDED. LIKE THE ATMOSPHERE, RELAXING. 1 0.8%CLAY PLAY 1 0.8%CHRISTINE‐THE SURVEY TAKER! 1 0.8%BEAUTIFUL OUTDOOR ENVIRONMENT/LIVE MUSIC 1 0.8%BANDS 1 0.8%BAND & ATMOSPHERE 1 0.8%BAND 1 0.8%ATMOSPHERE, WINE, MUSIC 1 0.8%ATMOSPHERE AND FRIENDLINESS OF PEOPLE 1 0.8%ATMOSPHERE & FRIENDS 1 0.8%ATMOPSHERE 1 0.8%ALL LOCAL! 1 0.8%Total 126 100.0%

What could the Tilted Earth Festival do to IMPROVE your experience?
Count Column N % PARKING 5 4.4%MORE FOOD VENDORS 3 2.6%LOWER THE PRICE 2 1.8%EARLIER IN THE YEAR 2 1.8%COOLER WEATHER 2 1.8%WOULD LIKE TO BRING DOGS 1 0.9%WEBSITE WAS DIFFICULT TO UNDERSTAND 1 0.9%WEATHER;TIME OF YEAR 1 0.9%WATER STATION 1 0.9%WATER MISTERS FOR THE HEAT! 1 0.9%WATER MISTERS FOR THE HEAT 1 0.9%WATER BOTTLES 1 0.9%VERY DUSTY‐BETTER CLEANED‐2 DIFFERENT BOOTHS FOR PURCHASING WINE TICKETS 1 0.9%TOO LONG OF A WALK‐PARKING 1 0.9%TIME OF YEAR 1 0.9%TICKETS COULD BE A BIT LESS 1 0.9%TICKETING ISSUE 1 0.9%THE HEAT‐START AN HOUR LATER 1 0.9%TAXI & COMMUNICATION 1 0.9%SMOKING SECTION 1 0.9%SMOKING AREAS NOT WELL MARKED 1 0.9%SHUTTLE‐EXPLAIN FEES (TASTES CHEAPER THEN TICKET) 1 0.9%SHUTTLE TO THE EVENT 1 0.9%SHUTTLE TO DEAD HORSE, WOULD LIKE ICED COFFEE 1 0.9%SHUTTLE TO DEAD HORSE 1 0.9%SHUTTLE INFORMATION 1 0.9%SHORTER LINES 1 0.9%PRICING;TOO SMALL VOTING SLIP/NO ONE KNOWS HOW TO DO PEOPLE'S CHOICE 1 0.9%PARKING, SHUTTLES, BUSSES 1 0.9%PARKING, LIGHTING, SHUTTLES INTO EVENT 1 0.9%PARKING, BETTER TRANSPORTATION FOR SENIORS ESP. 1 0.9%PARKING‐NO FEE 1 0.9%PARKING LET KIDS COME IN WINE GARDEN W/FAMILIES. DIFFERENT TIME OF YEAR. 1 0.9%NOTHING, LOVED IT. 1 0.9%NOTHING, IT'S WONDERFUL 1 0.9%NOTHING 1 0.9%NONE 1 0.9%NON‐DRINKERS/SODA, WATER ETC. 1 0.9%

What could the Tilted Earth Festival do to IMPROVE your experience? MOVE TO A COOLER TIME 1 0.9%MOVE THE TIME BACK 1 0.9%MOVE IT BACK LATER AT NIGHT 1 0.9%MOSQUITOS‐ADD TIKI TORCHES 1 0.9%MORE WINE IN THE CUPS 1 0.9%MORE WINE 1 0.9%MORE VARIETY OF FOOD TRUCKS 1 0.9%MORE VARIETY OF FOOD 1 0.9%MORE VARIETY ‐ DESERT 1 0.9%MORE TICKETS & BREWERIES/BEER 1 0.9%MORE TABLES 1 0.9%MORE SPACE BETWEEN WINE VENDORS; PARKING CLOSER 1 0.9%MORE SINGING IN WINE GARDEN/MISTERS 1 0.9%MORE SHUTTLES/BUSSES 1 0.9%MORE SHUTTLE/BUSSES 1 0.9%MORE SHADING & CLOSER PARKING 1 0.9%MORE SHADING 1 0.9%MORE SHADE 1 0.9%MORE SEATING 1 0.9%MORE ROOM FOR THE WINE BOOTHS & MORE SEATING AVAILABLE 1 0.9%MORE INFORMATION ON WEBSITE 1 0.9%MORE INFORMATION ON THE WEBSITE‐HOURS, CHAIRS, ETC. WHERE DOES THE MONEY GO? 1 0.9%MORE GOURMET FOOD, MORE ROOM BETWEEN BOOTHS, FOOD CLOSER TO WINE 1 0.9%MORE FOOD VENDORS, MORE TRANPARENCY IN INFO 1 0.9%MORE FOOD VARIETY 1 0.9%MORE FOOD TRUCKS 1 0.9%MORE CLEAR INSTRUCTIONS ON TICKETS 1 0.9%MONTH EARLIER 1 0.9%MISTERS, WATER STATIONS 1 0.9%MISTERS 1 0.9%MISTER TENT 1 0.9%MAYBE COOLER TEMPS 1 0.9%MAY? DIFFERENT TIME 1 0.9%ICE CREAM TRUCK 1 0.9%FRONT DESK COOPERATION 1 0.9%FREE PARKING 1 0.9%FOOD SIGNS 1 0.9%FINE 1 0.9%FANS WITH MISTERS. SHUTTLE TO DEAD HORSE 1 0.9%EARLIER IN THE YEAR (WEATHER) HEALTHIER FOOD VENDORS 1 0.9%DOESN'T WANT TO PAY FOR BAND UNLESS ITS RODGER COYNE AND PEACE MAKERS 1 0.9%

What could the Tilted Earth Festival do to IMPROVE your experience? DIFFERENT TIME OF YEAR‐MORE SEATING‐MISTERS 1 0.9%DIFFERENT TIME OF YEAR‐LESS HEAT 1 0.9%DIFFERENT TIME OF YEAR 1 0.9%DIFFERENT TIME OF THE YEAR 1 0.9%DID NOT LIKE HAVING 1 TASTE PER TICKET‐WANTED TO TRY OUT THE WINERIES AND ONLY SAMPLED A SMALL AMOUNT. WILL NOT GO TO NE 1 0.9%DESIGNATED SMOKING AREAS 1 0.9%CRAFT BEERS 1 0.9%COOLER TIME OF YEAR. WOULD LIKE ICED COFFEE 1 0.9%COOLER TIME 1 0.9%CLOSER SHUTTLE DROP OFF 1 0.9%BUS HOURS 1 0.9%BRING BEER TO THIS EVENT 1 0.9%BETTER SIGNS FOR SHUTTLE 1 0.9%BETTER SIGNAGE 1 0.9%BETTER SHUTTLE SERVICE‐FREE PARKING 1 0.9%BETTER PARKING, WEB COMMUNICATION 1 0.9%BETTER MUSIC 1 0.9%BETTER COMMUNICATION ABOUT TICKETS 1 0.9%BETTER COMMUNICATION ABOUT SHUTTLE AND DINNERS 1 0.9%BETTER COMMUNICATION ABOUT PARKING 1 0.9%BETTER COMMUNICATING WITH HARD COPIES OF TICKETS. 1 0.9%BEER GARDEN 1 0.9%BANDS‐DON'T LIKE WISKEY & CAMOMILE 1 0.9%ADD LOCAL GROWN FOOD TO OPTIONS 1 0.9%ADD BEER OR SPIRITS 1 0.9%2X MISTER TENT 1 0.9%Total 114 100.0%
Do you feel like part of a community at Tilted?
Count Column N %
Yes 114 96.6%
No 4 3.4%
Total 118 100.0%

What is more important to you?
Mean Score
Fun 1.6
Friendship 1.9
Family-oriented 2.3
Value 2.5
What are the MOST important factors in your daily food consumption?
Count Column N %
Flavor-Taste 96 76.8%
Nutritional Value 95 76.0%
Affordability 54 43.2%
Quick 31 24.8%
Organic-Free Range 29 23.2%
Low-fat 16 12.8%
Non-GMO 13 10.4%
Vegetarian-Vegan 12 9.6%
Gluten-free 7 5.6%
Would you be interested in any of the following if we offered these next year?
Count Column N %
Breweries 75 62.0%
Camping 41 33.9%
Distilleries 41 33.9%
3-Day Festival (Friday thru Sunday) 35 28.9%
Art Exhibits 29 24.0%
Film 18 14.9%

Which genre of film is your FAVORITE?
Count Column N %
Comedy 45 39.1%
Independent 29 25.2%
Action 14 12.2%
Romantic 13 11.3%
Science Fiction - Horror 8 7.0%
Suspense 6 5.2%
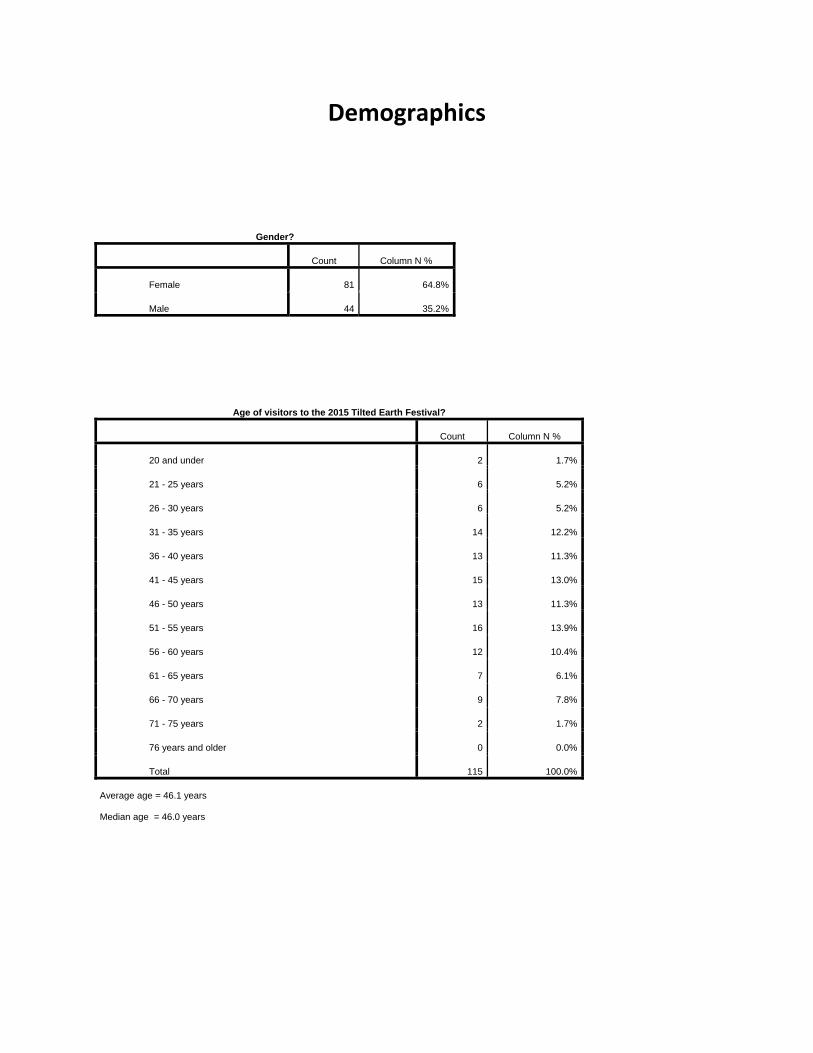
Demographics
Gender?
Count Column N %
Female 81 64.8%
Male 44 35.2%
Age of visitors to the 2015 Tilted Earth Festival?
Count Column N %
20 and under 2 1.7%
21 - 25 years 6 5.2%
26 - 30 years 6 5.2%
31 - 35 years 14 12.2%
36 - 40 years 13 11.3%
41 - 45 years 15 13.0%
46 - 50 years 13 11.3%
51 - 55 years 16 13.9%
56 - 60 years 12 10.4%
61 - 65 years 7 6.1%
66 - 70 years 9 7.8%
71 - 75 years 2 1.7%
76 years and older 0 0.0%
Total 115 100.0%
Average age = 46.1 years
Median age = 46.0 years
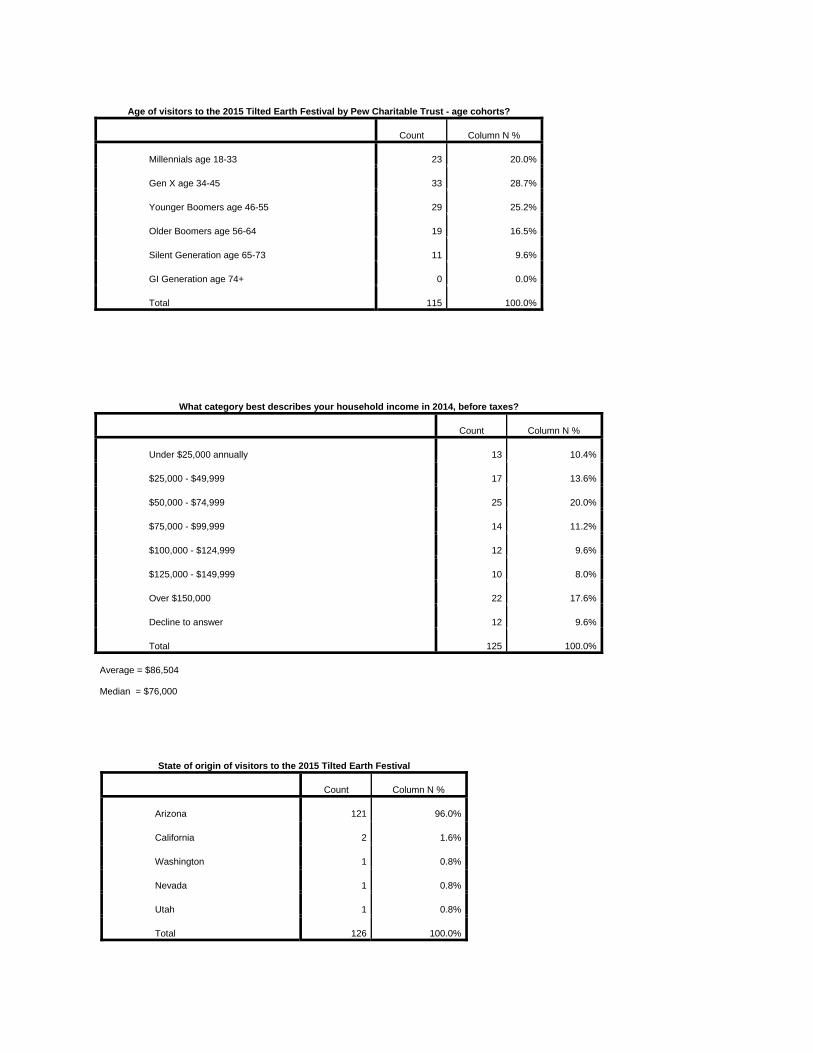
Age of visitors to the 2015 Tilted Earth Festival by Pew Charitable Trust - age cohorts?
Count Column N %
Millennials age 18-33 23 20.0%
Gen X age 34-45 33 28.7%
Younger Boomers age 46-55 29 25.2%
Older Boomers age 56-64 19 16.5%
Silent Generation age 65-73 11 9.6%
GI Generation age 74+ 0 0.0%
Total 115 100.0%
What category best describes your household income in 2014, before taxes?
Count Column N %
Under $25,000 annually 13 10.4%
$25,000 - $49,999 17 13.6%
$50,000 - $74,999 25 20.0%
$75,000 - $99,999 14 11.2%
$100,000 - $124,999 12 9.6%
$125,000 - $149,999 10 8.0%
Over $150,000 22 17.6%
Decline to answer 12 9.6%
Total 125 100.0%
Average = $86,504
Median = $76,000
State of origin of visitors to the 2015 Tilted Earth Festival
Count Column N %
Arizona 121 96.0%
California 2 1.6%
Washington 1 0.8%
Nevada 1 0.8%
Utah 1 0.8%
Total 126 100.0%
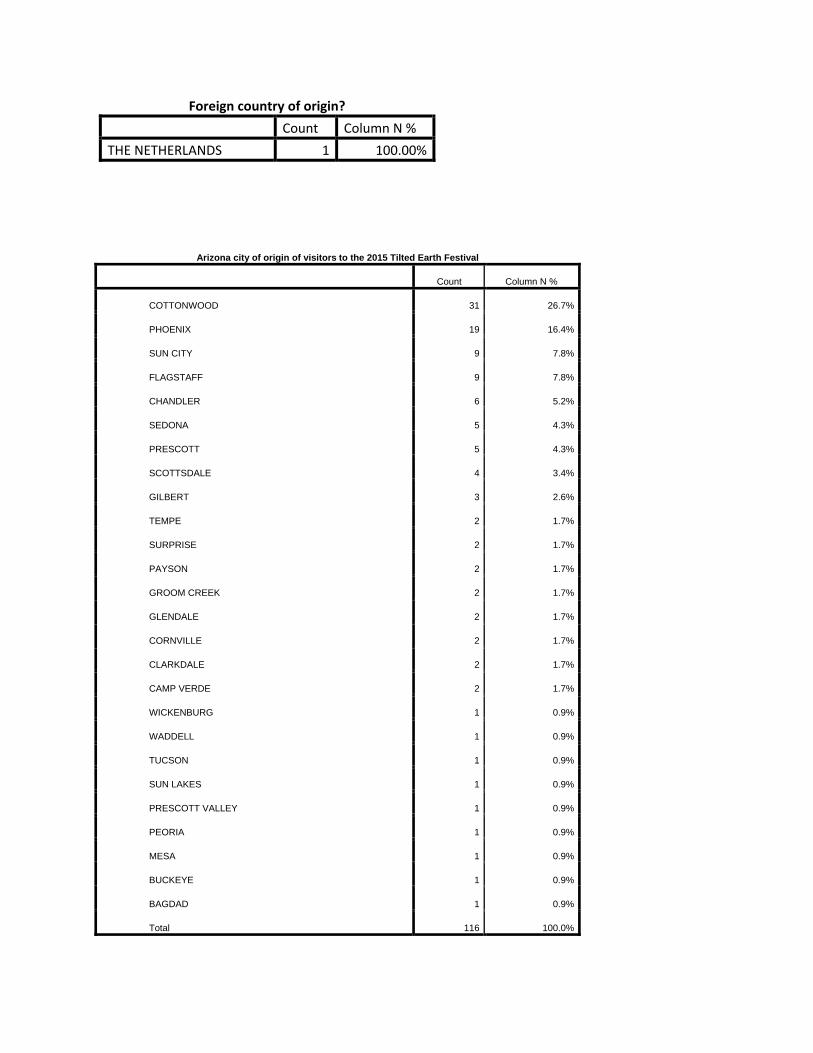
Foreign country of origin?
Count Column N % THE NETHERLANDS 1 100.00%
Arizona city of origin of visitors to the 2015 Tilted Earth Festival
Count Column N %
COTTONWOOD 31 26.7%
PHOENIX 19 16.4%
SUN CITY 9 7.8%
FLAGSTAFF 9 7.8%
CHANDLER 6 5.2%
SEDONA 5 4.3%
PRESCOTT 5 4.3%
SCOTTSDALE 4 3.4%
GILBERT 3 2.6%
TEMPE 2 1.7%
SURPRISE 2 1.7%
PAYSON 2 1.7%
GROOM CREEK 2 1.7%
GLENDALE 2 1.7%
CORNVILLE 2 1.7%
CLARKDALE 2 1.7%
CAMP VERDE 2 1.7%
WICKENBURG 1 0.9%
WADDELL 1 0.9%
TUCSON 1 0.9%
SUN LAKES 1 0.9%
PRESCOTT VALLEY 1 0.9%
PEORIA 1 0.9%
MESA 1 0.9%
BUCKEYE 1 0.9%
BAGDAD 1 0.9%
Total 116 100.0%
Are you staying overnight away from home in Northern Arizona before and/or after
the Tilted Earth Festival?
Count Column N %
Yes 76 61.8%
No 47 38.2%
Total 123 100.0%
If you are staying overnight, away from home in what community are you staying?
Count Column N %
Cottonwood-Cornville-Clarkdale 73 83.0%
Sedona 11 12.5%
Prescott 2 2.3%
Flagstaff 2 2.3%
Other place you stayed overnight? 0 0.0%
Jerome 0 0.0%
Camp Verde 0 0.0%
Total 88 100.0%
What type of lodging are you using?
Count Column N %
Hotel or motel 45 51.7%
Home of friends or relatives 19 21.8%
RV park or camping 12 13.8%
Resort or Timeshare 4 4.6%
Bed & Breakfast Inn 3 3.4%
airbnb.com VRBO.com 2 2.3%
Other 1 1.1%
Our Second Home 1 1.1%
Total 87 100.0%
Please tell us the number of people these expenditures cover?
Mean Median Minimum Maximum
Please tell us the number of people these expenses cover: 2.2 2.0 1.0 6.0
Please estimate the amount of money your group is spending in the Cottonwood Area during this visit/trip?
Mean Median Maximum Valid N
Winemakers Dinner-Festival food vendors $75 $28 $1,000 106
Bottled wine $58 $38 $500 106
Lodging-camping $101 $70 $1,000 92
Restaurant, bar and grocery $96 $50 $1,300 99
Shopping-retail $44 $0 $1,000 85
Transportation (including gas) $42 $20 $550 107
Other recreation-entertainment $33 $0 $500 80
Overnight Local
Mean Median Mean Median Please tell us the number of people these expenses cover: 2 2 2 2 Winemakers Dinner‐Festival food vendors $79 $30 $69 $23 Bottled wine $70 $50 $31 $20 Lodging‐camping $144 $100 $0 $0 Restaurant, bar and grocery $125 $50 $25 $0 Shopping‐retail $65 $0 $4 $0 Transportation (including gas) $59 $45 $5 $0 Other recreation‐entertainment $45 $0 $6 $0