Embed Size (px)
DESCRIPTION
Whitney Tilson July Shareholder letter value investinghttp://www.Valuewalk.com
Citation preview
145 E. 57th Street, 10th
Floor, New York, NY 10022
Whitney R. Tilson and Glenn H. Tongue phone: 212 386 7160
Managing Partners fax: 240 368 0299
www.T2PartnersLLC.com
July 31, 2010
Dear Partner,
Our fund gained 3.5% net in July vs. 7.0% for the S&P 500, 7.2% for the Dow and 7.0% for the
Nasdaq. Year to date, our fund is up 13.6% net vs. -0.1% for the S&P 500, 1.9% for the Dow
and -0.2% for the Nasdaq.
Given our conservative positioning, our fund performed in line with what we’d expect: our long
book was up with the market, but our short book dampened our returns somewhat. On the long
side, winners of note included BP (up 33.2%), Goldman Sachs (14.9%), Resource America
(13.0%), American Express (12.4%), AB InBev (10.5%), CIT (7.4%), and General Growth
Properties (5.0%), slightly offset by Berkshire Hathaway (-2.5%).
On the short side, we profited handsomely from VistaPrint (-30.4%) and Gentiva Health Services
(-23.6%), but these gains were more than offset by losses on MBIA (up 54.7%) and InterOil
(35.1%).
Three of our Favorite Stocks and Thoughts on Time Horizons
Earlier this month we shared with you the attached presentation on three of our favorite stocks,
AB InBev, Microsoft and BP. We discuss each of these investments further below, including
highlighting the very different time horizons we have for each of these investments and how it
affects our analysis.
AB InBev
In the case of AB InBev, we think the beer business is very stable, with slow growth in most of
the world’s largest markets, but with high growth potential in certain developing markets like
China – comparable businesses in our minds would be Coca Cola and McDonald’s. This type of
stable, dominant business gives us the confidence to project earnings and cash flows many years
into the future, and we expect that we might hold this stock for a long time.
(Incidentally, one might ask why we don’t also own Coca Cola and McDonald’s. The primary
answer is valuation: Coca Cola and McDonald’s, like many big-cap blue chips, are moderately
priced, but we think AB InBev is downright cheap, as we show in our presentation. A secondary
reason is that we think AB InBev’s management team is among the finest we’ve ever invested
alongside and this, combined with a lot of fat in the recently acquired Anheuser Busch business,
will lead to substantial cost savings (and a resulting jump in earnings) that isn’t likely for Coca
Cola and McDonald’s.)
-2-
Microsoft
Our investment horizon is quite a bit shorter for any technology company, even such a dominant
one as Microsoft. We can’t – and doubt that anyone can – accurately predict where Microsoft’s
business (and therefore earnings) will be in 5-10 years. But we don’t have to in order to own the
stock today. Our investment thesis here is very simple: we believe that both consensus earnings
estimates and the multiple investors are currently placing on those earnings are much too low
and that both are likely to expand significantly over the next 12-18 months, at which point we
will likely exit the position.
On July 22nd
, Microsoft reported spectacular Q4 earnings. For the 2010 fiscal year, revenues
rose 7% and earnings per share jumped 30%, but there is enormous positive momentum, as Q4
revenues were up 22% year over year and EPS soared 50% – truly remarkable numbers for a
company of this size. These gains are being driven by successful new products in all three of the
areas that generate more than 100% of Microsoft’s profits: Windows (Windows 7), Business
Division (Office 2010), and Server and Tools (Windows Server, SQL Server and System
Center).
We think growth in all three areas will continue to be strong for another year or two (though the
year over year growth rates will slow after next quarter), resulting in earnings per share growth
of 20-25% over the next year. This is far above the consensus analyst view that Microsoft’s
earnings for the next 12 months (FY 2011) will be $2.37, up a mere 13% over the $2.10
Microsoft just reported for FY 2010. If analysts were projecting 13% revenue growth, we might
agree with them, but with Microsoft’s high operating leverage (plus ongoing cost cutting), we
think low-double-digit revenue growth will translate into much higher EPS growth.
Of course even exceptional, estimate-beating EPS growth doesn’t necessarily mean the stock
will be a great investment if its valuation is very high, but the opposite is true in this case.
Microsoft closed July at $25.81, has $3.50-$4.38 of net cash (depending on whether one includes
$7.8 billion of “Equity and other investments” as cash). Let’s call it $22, divided by FY 2010
EPS of $2.10, for a trailing P/E of 10.5x. Looking forward 12 months, even if one uses analysts’
estimates of $2.37, the forward P/E is 9.3x. Both of these are extremely low P/E multiples for a
dominant cash-cow business with 80%, 37% and 28% gross, operating, and net margins,
especially one that’s showing robust growth. In addition, the stock pays a 2.0% dividend and the
company returned nearly triple the amount of the dividend to shareholders last year by buying
back $3.8 billion of stock last quarter and $11.3 billion last year.
We think there’s very little chance that Microsoft’s P/E multiple contracts from today’s
depressed level, so if we’re wrong and analysts are right that EPS grows 13% over the next year,
plus the P/E multiple remains steady, then we’ll make 15% on this investment (13% plus the 2%
dividend). If EPS grows 20% and the trailing P/E multiple rises to 12, then the stock will be at
$30.24 and we’ll make 19%, and if EPS grows 25% and the multiple rises to 14 (still below fair
value in our opinion), the stock will be at $36.75 and we’ll make 44%.
There are, of course, upside and downside scenarios beyond these three, but under almost any
scenario, we think this will be a very satisfactory 12-18 month investment, with very low risk
given the company’s strong balance sheet, earnings momentum, and depressed P/E multiple.
-3-
Note that by having an investment thesis that is relevant over a specific time frame, we don’t
have to have an opinion on questions that we don’t know the answer to: will cloud computing
make Microsoft’s business model obsolete, will Google apps take meaningful market share from
Microsoft Office, etc.?
BP
Our investment horizon for BP is even shorter. As we discussed in the lengthy analysis attached
to last month’s letter (also see the attached presentation), we focused on the immediate crisis and
were simply betting that: the well would be capped sooner than most investors expected; that the
environmental damage would be less than feared; the clean-up costs, fines and legal liabilities
would be at the low end of estimates; and that the company had the assets and cash flows to meet
all eventualities. Note that all of these factors are short term (1-2 quarters in nature), so we don’t
have to have an opinion on things like the future price of oil.
The events over the past two weeks have validated every element of our investment thesis. The
well has been temporarily – and will soon be permanently – capped; the Gulf of Mexico is
(thankfully) rapidly recovering from the environmental damage; total costs appear likely to be in
the $33-46 billion range, a very manageable number that is far lower than many estimates; BP
sold $7 billion of non-core assets to Apache for a fantastic price: 2x book value and 42x cash
flow; and the company reported very strong earnings last Tuesday that put to rest any lingering
concerns about possible bankruptcy.
Excluding costs related to the spill, earnings per share were up 69% and cash from operations
was up 31%. BP generated $8.8 billion of cash from operations, dwarfing the $2.9 billion spent
during the quarter related to the spill. Most importantly, the company has $7 billion of cash
(plus $5 billion from Apache received today) and has an additional $17 billion of committed
bank facilities. BP also announced that it plans to sell an additional $23 billion of non-core
assets – and if it can get anything like the price it got for the assets it sold to Apache, this will be
enormously accretive. Finally, as an added bonus, BP’s tone-deaf CEO, Tony Hayward,
resigned and was replaced by Bob Dudley. Our research on him indicates that he’s a very strong
operating manager, a tough negotiator and, from a public relations perspective, we love the fact
that he’s an American who was raised in Mississippi.
We started buying BP’s stock in early June around $37 and bought all the way down to its late-
June low of $26.75 (including some call options near the low). Our average cost is around $29,
so with the stock today at $38.47, we’ve made a healthy profit. We’re not selling, however, as
we think BP’s intrinsic value is at least $50.
Market Overview
Given that we think we own many great, low-risk stocks on the long side (such as the three
discussed above), why are we so conservatively positioned right now (roughly 100% long and
70% short, or 30% net long)? The answer is two-fold: first, there’s plenty of speculation and
foolishness in certain stocks and sectors (InterOil at $60, MBIA at $8.68, VistaPrint still at
$33.05, the for-profit education sector), so we think we can enhance our returns with our short
book. Second, we are very worried about many macro factors. We’ve attached in Appendix A
an excerpt from Jeremy Grantham’s recent letter, in which he does an excellent job of outlining
-4-
eight macro factors that could send the American and/or world economy into a double-dip
recession. We share his concerns.
In general, we believe that in the aftermath of the bursting of the biggest asset bubble in history,
we are in uncharted waters and there is a very wide range of possible outcomes over the next 2-7
years. Broadly speaking, they fall into three scenarios:
1) A V-shaped economic recovery with strong GDP growth (3-5%), a falling unemployment
rate, and reduced government deficits. Under this scenario, the stock market would likely
compound at 7-10%.
2) A “muddle-through” economy with weak GDP growth (1-2%), unemployment remaining
high (7-9%), and continued government deficits. Under this scenario, the stock market
would likely compound at 2-5%.
3) A double- (and triple-, and quadruple-) dip recession where periods of growth are
followed by periods of contraction, with no overall GDP growth, unemployment around
10% (with the actual level higher due to people giving up looking for work), and large
deficits as the government tries to stimulate the economy (but with little impact). Under
this scenario, which looks like what Japan has gone through for more than two decades,
the stock market would be flat to down.
Both as investors and as Americans, we’re of course hoping for 1), but fear that this is the least
likely of these scenarios. A few months ago, we would have guessed (and it’s no more than an
educated guess) that the odds were 25%, 50% and 25%, respectively, but in light of recent weak
economic indicators, the odds have shifted unfavorably. Hence, we are positioning our portfolio
more conservatively, trimming some of our longs, adding to our short book, and increasingly
shifting our long portfolio into big-cap, strong-balance-sheet, dominant-market-position blue
chips like Berkshire Hathaway, AB InBev and Microsoft, as well as short-duration, special
situation investments like BP and Liberty Acquisition Corp. warrants.
Quarterly Conference Call
We had our 90-minute quarterly conference call on July 28th
, during which we discussed most of
the major long positions in our fund and shared our macro views, especially on the U.S. housing
market, which affect our overall portfolio positioning.
You can listen to the call in two ways:
1) Dial (712) 432-1280, enter access code 1023274#, and hit 3# when you hear the
recording; or
2) You can download the audio file here:
http://rcpt.yousendit.com/918559701/6a135e0a8c4fb5058585eb0ba8b57b71
Conclusion
In their latest Kiplinger’s column, Our Favorite Short Sales, John Heins and Whitney share their
views on shorting and discuss some of our positions.
-5-
Thank you for your continued confidence in us and the fund. As always, we welcome your
comments or questions, so please don’t hesitate to call us at (212) 386-7160.
Sincerely yours,
Whitney Tilson and Glenn Tongue
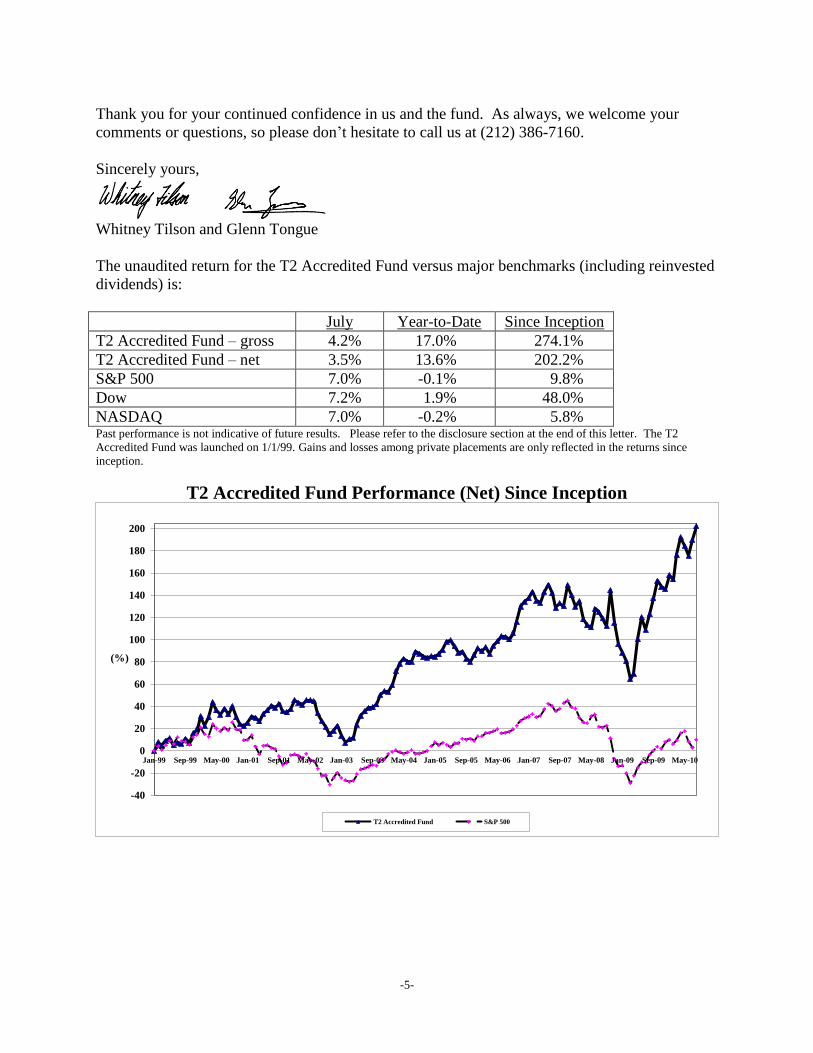
The unaudited return for the T2 Accredited Fund versus major benchmarks (including reinvested
dividends) is:
July Year-to-Date Since Inception
T2 Accredited Fund – gross 4.2% 17.0% 274.1%
T2 Accredited Fund – net 3.5% 13.6% 202.2%
S&P 500 7.0% -0.1% 9.8%
Dow 7.2% 1.9% 48.0%
NASDAQ 7.0% -0.2% 5.8% Past performance is not indicative of future results. Please refer to the disclosure section at the end of this letter. The T2
Accredited Fund was launched on 1/1/99. Gains and losses among private placements are only reflected in the returns since
inception.
T2 Accredited Fund Performance (Net) Since Inception
-40
-20
0
20
40
60
80
100
120
140
160
180
200
Jan-99 Sep-99 May-00 Jan-01 Sep-01 May-02 Jan-03 Sep-03 May-04 Jan-05 Sep-05 May-06 Jan-07 Sep-07 May-08 Jan-09 Sep-09 May-10
(%)
T2 Accredited Fund S&P 500
-6-
Appendix A: Excerpt from Jeremy Grantham’s July 2010 Letter
The entire letter is posted at: www.gmo.com/websitecontent/JGLetter_SummerEssays_2Q10.pdf
“Seven Lean Years” Revisited
The idea behind “seven lean years” is that it is unrealistic to expect to overcome the several
problems facing most developed countries, including the U.S., in fewer than several years. The
purpose of this section is to review the negatives that are likely to hamper the global developed
economy, especially from the viewpoint of how much time may be involved.
First, one of the causes of the financial crisis was the over-indebtedness of consumers in certain
countries, including the U.S., the U.K., and several European countries. As of today, although
they have stopped increasing consumer debt – which itself is unprecedented and has eaten into
consumption – the total improvement in personal debt levels is still minimal. It would take at
least seven years of steady reduction to reach a more normal level. Anything more rapid than this
would make it nearly impossible for the economy to grow anywhere near its normal rate or,
perhaps, at all.
There is in the situation today a nerve-wracking creative tension. At one extreme, massive
stimulus induces government debt to rise to levels that cause a real problem in servicing the debt
– interest and repayment – or at least a crisis of confidence. At the other extreme, a draconian
attempt to hold debt levels while the economy is still fragile runs the risk of causing a severe
secondary economic decline. Deciding which horn of this dilemma to favor will probably prove
to be the central economic policy choice of our time. I am sympathetic to those in power. This is
not an easy choice. My guess, though, is that the best course is less debt reduction now and a
longer, slower reduction later. Overdoing it now may well cause an economic setback for an
already tender and vulnerable global economy that might easily be enough to more than undo all
of the benefits of debt reduction. Indeed, with a weaker economy leading to lower government
income, it might sadly cause debt levels to rise after all. This need for time to cure all ills is one
reason why I picked a seven-lean-year recovery over a more normal and rapid one. The bad
news, though, is that in the end, by hook or by crook, debt levels must be lowered at every level,
especially governmental. There is almost no way that this process will be pleasant or quick.
Second, and the most immediately frightening aspect of the seven-lean-year scenario, is that
although the credit crisis was caused by too much credit on too sloppy a basis, the cure was to
increase aggregate debt by flooding economies with government debt. Dangerously excessive
financial system debt was moved across, with additions, to become dangerously excessive
government debt, with levels of debt to GDP not seen outside of major wars, and seldom then.
Increasingly the “cure” seems more like a stay of execution. With bank crises, there is the
backstop of the central government. For minor countries, the IMF may be a net help, but for
major countries in trouble, the IMF seems outgunned and, if several major countries have a debt
crisis simultaneously, the IMF is clearly irrelevant.
Third, we have lost a series of artificial stimuli that came out of the steady increases in debt
levels and the related asset bubbles. For example, the artificial lift to consumers’ attitudes
resulting from steadily rising house prices is unlikely to return soon. In fact, some further price
-7-
decline in house prices in the U.S. is probably more than a 50/50 bet, and in the U.K. and
Australia is nearly certain. For sure, that feeling of supreme confidence – counting on the
inevitability of further steady rises in house prices, which was baked into average U.S. opinion
by 2006 (including Bernanke’s, unfortunately) – is long gone. The direct shot in the arm to the
economy from the rise in economic activity from an abnormally high rate of home construction
and the services associated with an abnormally high turnover rate of existing houses (more
realtors, etc.) is also a distant memory here. So the stimulus from rising prices has gone, and
stock prices, although they have made a strong recovery everywhere in the developed world, are
still way down from their highs of 10 years ago and, notably in the U.S., are still overpriced.
Both the market and house price declines have also reduced confidence in the nest eggs that
people felt they could count on for retirement as well as a little more spending on the way there.
Now consumers are readjusting to a greater need to save and, perhaps unfortunately, a greater
need to work longer. Unprecedentedly, they are paying down some consumer debt. These
changed attitudes will surely last for years.
Fourth, although the financial system has passed its point of maximum stress in the U.S., very
bad things may lie ahead in Europe. And the leverage in the system and the chances of further
write-downs (yet more housing defaults and private equity write-downs, for example) leave
banks undercapitalized and reluctant to lend. Any more shoes dropping here or in Europe, or
elsewhere for that matter, will tend to keep them nervous. The growth in the total U.S. GDP
caused by previous rapid increases in the size of the financial sector has also disappeared, and
with any luck will stay disappeared, for it was not healthy growth in my opinion.
Fifth, the runaway costs in the public sector, particularly at the state and city levels, where
average salaries and pensions ran far above private sector equivalents in a mere 15 years (why,
that would make a good report by itself!), have run into a brick wall of reduced taxes. State and
other municipalities are incredibly dependent on real estate taxes, which are down over 30%
from falling real estate prices and defaults, and also on capital gains rates, which have been hit
by falling asset prices generally. Their legal need to stay balanced is leading to painful cost
cutting, which in turn puts pressure on an economy that is coming to the end of much of the
stimulus. With many of the artificial stimuli of the ’90s and 2000s gone, their revenues are
unlikely to bounce back in one or two years, and a double-dip in the economy or new asset price
declines would move their recovery back further.
Sixth, unemployment is high and will also suffer from the loss of those kickers related to asset
bubbles. The U.S. economy appears to have an oddly hard time producing enough jobs to get
ahead of the natural yearly increases in the workforce. (At least for a while, one long-term
economic drag – slowing longer-term growth of the U.S. labor force – becomes an intermediate-
term help in reducing unemployment, but beyond five years, it too will work to reduce GDP
growth, as it has already done in the last 10 years.) Needless to say, unemployment works to
keep consumer confidence and, hence, corporate willingness to invest, below normal.
Seventh, another longer-term problem for the global economy is trade imbalances. The U.S. in
particular cannot continue to run large trade imbalances. In a world growing nervous about the
quality of sovereign debt – even that of the U.S. – domestic sovereign debt levels have exploded.
The added complication and threat to the dollar from accumulating foreign debts just adds risk
and doubts to the system. This is similar to the accumulating surpluses of the Chinese.
-8-
Imbalances destabilize the system. The trick, though, is to reduce these imbalances so that the
process does not reduce global growth. This necessary rebalancing will not be quick or easy.
Eighth, there is a related but different problem with the euro: incompetent management in Spain,
Greece, Portugal, Ireland, and Italy allowed the local competitiveness of their manufactured
goods to become 20% or more uncompetitive with those of Germany. It was never going to be
an easy matter to head this process off, and doing so would have taken some tough actions with
uncomfortable short-term consequences. But they could see the problem building up like
clockwork at about 2% to 3% a year, year after year. This did not result from the banking crisis,
and it was never going to be easy to solve with a fixed currency. The difficulty was implicit in
the structure of the euro from the beginning. Indeed, my friend and former partner, Paul
Woolley,1 believed, and let everyone know it, that from day one this was a fatal flaw nearly
certain to bring the euro down under stress. But one might have hoped for better evasive action
or better survival instincts.
Greece in particular has two largely independent problems. First, it has approximately 22%
overpriced labor (complete with 14 months’ salary and retirement in one’s 50s), which can only
be cured by reducing their pay by 22%. This would be tough for any government that does not
have an exceptionally well-established social contract – a commitment from individuals that they
have obligations to help the whole society to prosper or, in this case, muddle through. The
Greeks probably do not have it. Perhaps the U.S. does not either. Would we take being told that
ordinary workers would have to earn 22% less when there are so many other people to blame for
our current problems? The Japanese, in contrast, probably do, but may well have other offsetting
disadvantages.
The second problem for the Greeks is that they have accumulated too many government debts
relative to their ability to pay and, as the doubts rise, so do the rates they must pay such that their
ability to pay falls and the doubts rise further. Temporary bailouts are postponements of a
necessary restructuring. Should the system get out of control, there is the problem of the Greek
debt that is stuffed into other European banks. (My colleague, Edward Chancellor, is writing on
this topic.) I merely want to make the point that these twin Greek problems, which affect, to
varying intensity, the other PIGS, have become an intrinsic part of the “seven lean years,” more
or less guaranteeing slower than normal GDP growth and a long workout period.
Ninth, the general rising levels of sovereign debt and the particular problems facing the euro bloc
and Japan are leading to the systematic loss of confidence in our faith-based currencies. It is
becoming a fragile system that will increasingly limit governments’ choices in terms of dealing
with low growth and excessive credit.
Finally, and possibly most important of all, on a long horizon there is a very long-term problem
that will overlap with the seven-year workout and make the period even tougher: widespread
over-commitments to pensions and health benefits, which is covered in the next section.
1 Paul Woolley started a center for the study of “Capital Market Dysfunctionality” at the London School of
Economics.
-9-
T2 Accredited Fund, LP (the “Fund”) commenced operations on January 1, 1999. The Fund’s
investment objective is to achieve long-term after-tax capital appreciation commensurate with
moderate risk, primarily by investing with a long-term perspective in a concentrated portfolio of
U.S. stocks. In carrying out the Partnership’s investment objective, the Investment Manager, T2
Partners Management, LLC, seeks to buy stocks at a steep discount to intrinsic value such that
there is low risk of capital loss and significant upside potential. The primary focus of the
Investment Manager is on the long-term fortunes of the companies in the Partnership’s portfolio
or which are otherwise followed by the Investment Manager, relative to the prices of their stocks.
There is no assurance that any securities discussed herein will remain in Fund’s portfolio at the
time you receive this report or that securities sold have not been repurchased. The securities
discussed may not represent the Fund’s entire portfolio and in the aggregate may represent only a
small percentage of an account’s portfolio holdings. It should not be assumed that any of the
securities transactions, holdings or sectors discussed were or will prove to be profitable, or that
the investment recommendations or decisions we make in the future will be profitable or will
equal the investment performance of the securities discussed herein. All recommendations within
the preceding 12 months or applicable period are available upon request.
Performance results shown are for the T2 Accredited Fund, LP and are presented gross and net
of incentive fees. Gross returns reflect the deduction of management fees, brokerage
commissions, administrative expenses, and other operating expenses of the Fund. Gross returns
will be reduced by accrued performance allocation or incentive fees, if any. Gross and net
performance includes the reinvestment of all dividends, interest, and capital gains. Performance
for the most recent month is an estimate.
The fee schedule for the Investment Manager includes a 1.5% annual management fee and a 20%
incentive fee allocation. For periods prior to June 1, 2004, the Investment Manager’s fee
schedule included a 1% annual management fee and a 20% incentive fee allocation, subject to a
10% “hurdle” rate. In practice, the incentive fee is “earned” on an annual, not monthly, basis or
upon a withdrawal from the Fund. Because some investors may have different fee arrangements
and depending on the timing of a specific investment, net performance for an individual investor
may vary from the net performance as stated herein.
The return of the S&P 500 and other indices are included in the presentation. The volatility of
these indices may be materially different from the volatility in the Fund. In addition, the Fund’s
holdings differ significantly from the securities that comprise the indices. The indices have not
been selected to represent appropriate benchmarks to compare an investor’s performance, but
rather are disclosed to allow for comparison of the investor’s performance to that of certain well-
known and widely recognized indices. You cannot invest directly in these indices.
Past results are no guarantee of future results and no representation is made that an investor will
or is likely to achieve results similar to those shown. All investments involve risk including the
loss of principal. This document is confidential and may not be distributed without the consent
of the Investment Manager and does not constitute an offer to sell or the solicitation of an offer
to purchase any security or investment product. Any such offer or solicitation may only be made
by means of delivery of an approved confidential offering memorandum.
Our View on the U.S. Stock Market, and Three Long Ideas
T2 Accredited Fund, LP Tilson Offshore Fund, Ltd.
T2 Qualified Fund, LP
Presentation at the 7th Annual Value Investing Seminar July 13, 2010

T2 Partners Management L.P. Manages Hedge Funds and Mutual Funds
and is a Registered Investment Advisor
145 E. 57th Street, 10th Floor
New York, NY 10022
(212) 386-7160
www.T2PartnersLLC.com
3
Disclaimer
THIS PRESENTATION IS FOR INFORMATIONAL AND EDUCATIONAL PURPOSES ONLY AND SHALL NOT BE CONSTRUED TO CONSTITUTE INVESTMENT ADVICE. NOTHING CONTAINED HEREIN SHALL CONSTITUTE A SOLICITATION, RECOMMENDATION OR ENDORSEMENT TO BUY OR SELL ANY SECURITY OR OTHER FINANCIAL INSTRUMENT.
INVESTMENT FUNDS MANAGED BY WHITNEY TILSON AND GLENN TONGUE OWN STOCK IN MANY OF THE COMPANIES DISCUSSED HEREIN. THEY HAVE NO OBLIGATION TO UPDATE THE INFORMATION CONTAINED HEREIN AND MAY MAKE INVESTMENT DECISIONS THAT ARE INCONSISTENT WITH THE VIEWS EXPRESSED IN THIS PRESENTATION.
WE MAKE NO REPRESENTATION OR WARRANTIES AS TO THE ACCURACY, COMPLETENESS OR TIMELINESS OF THE INFORMATION, TEXT, GRAPHICS OR OTHER ITEMS CONTAINED IN THIS PRESENTATION. WE EXPRESSLY DISCLAIM ALL LIABILITY FOR ERRORS OR OMISSIONS IN, OR THE MISUSE OR MISINTERPRETATION OF, ANY INFORMATION CONTAINED IN THIS PRESENTATION.
PAST PERFORMANCE IS NO GUARANTEE OF FUTURE RESULTS AND FUTURE RETURNS ARE NOT GUARANTEED.
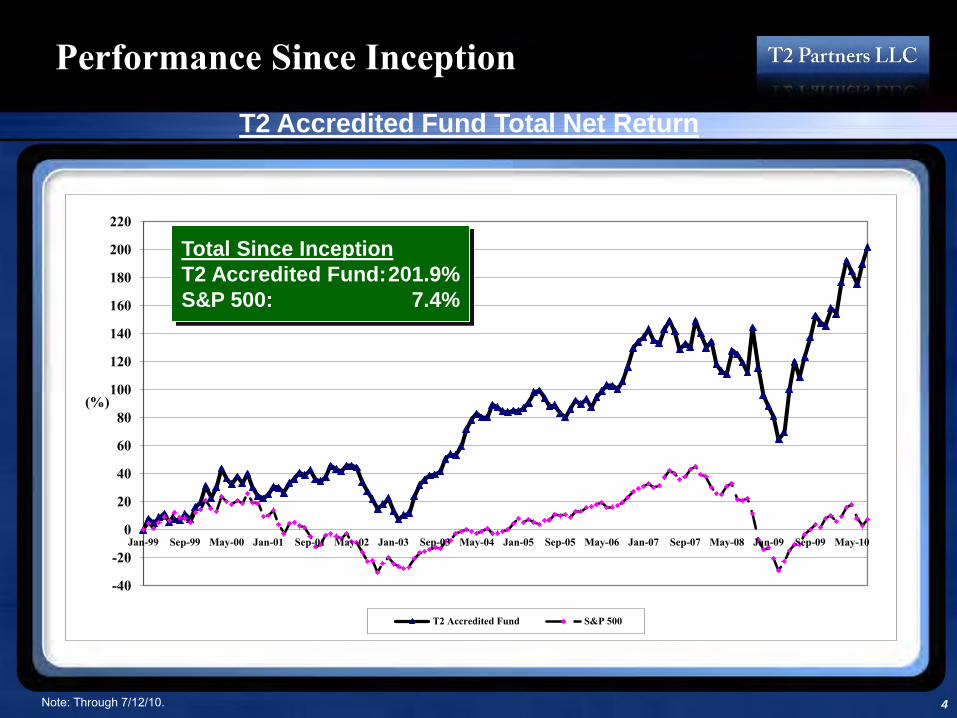
Performance Since Inception
T2 Accredited Fund Total Net Return
4
-40
-20
0
20
40
60
80
100
120
140
160
180
200
220
Jan-99 Sep-99 May-00 Jan-01 Sep-01 May-02 Jan-03 Sep-03 May-04 Jan-05 Sep-05 May-06 Jan-07 Sep-07 May-08 Jan-09 Sep-09 May-10
(%)
T2 Accredited Fund S&P 500
Total Since Inception
T2 Accredited Fund: 201.9%
S&P 500: 7.4%
Note: Through 7/12/10.
5
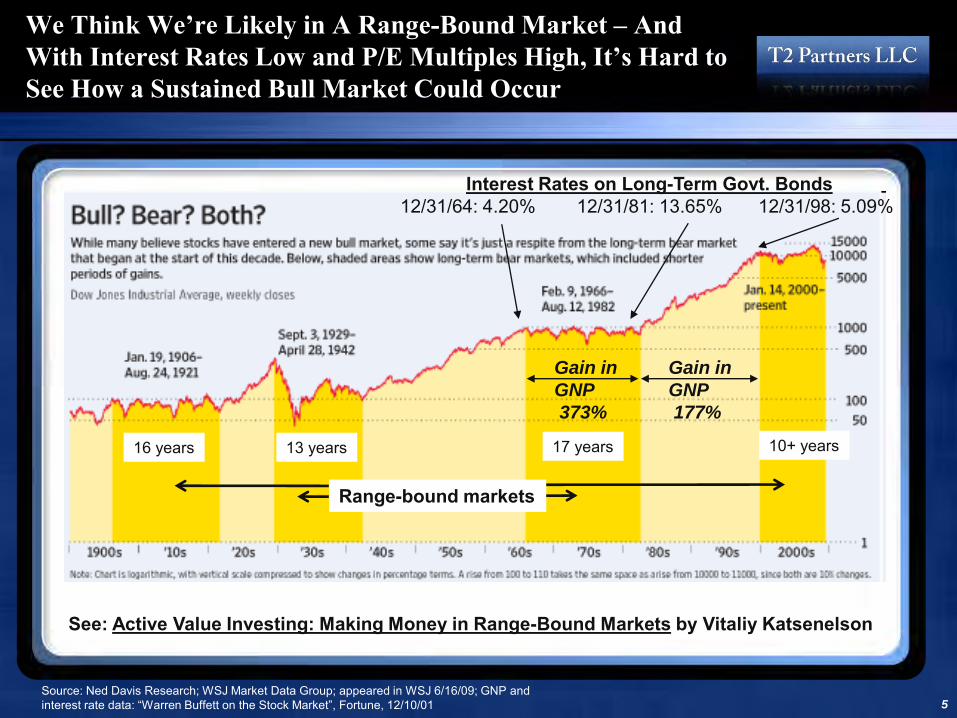
We Think We’re Likely in A Range-Bound Market – And With Interest Rates Low and P/E Multiples High, It’s Hard to See How a Sustained Bull Market Could Occur
Source: Ned Davis Research; WSJ Market Data Group; appeared in WSJ 6/16/09; GNP and interest rate data: “Warren Buffett on the Stock Market”, Fortune, 12/10/01
Gain in
GNP
373%
Gain in
GNP
177%
Interest Rates on Long-Term Govt. Bonds 12/31/64: 4.20% 12/31/81: 13.65% 12/31/98: 5.09%
Range-bound markets
See: Active Value Investing: Making Money in Range-Bound Markets by Vitaliy Katsenelson
16 years 13 years 17 years 10+ years
6
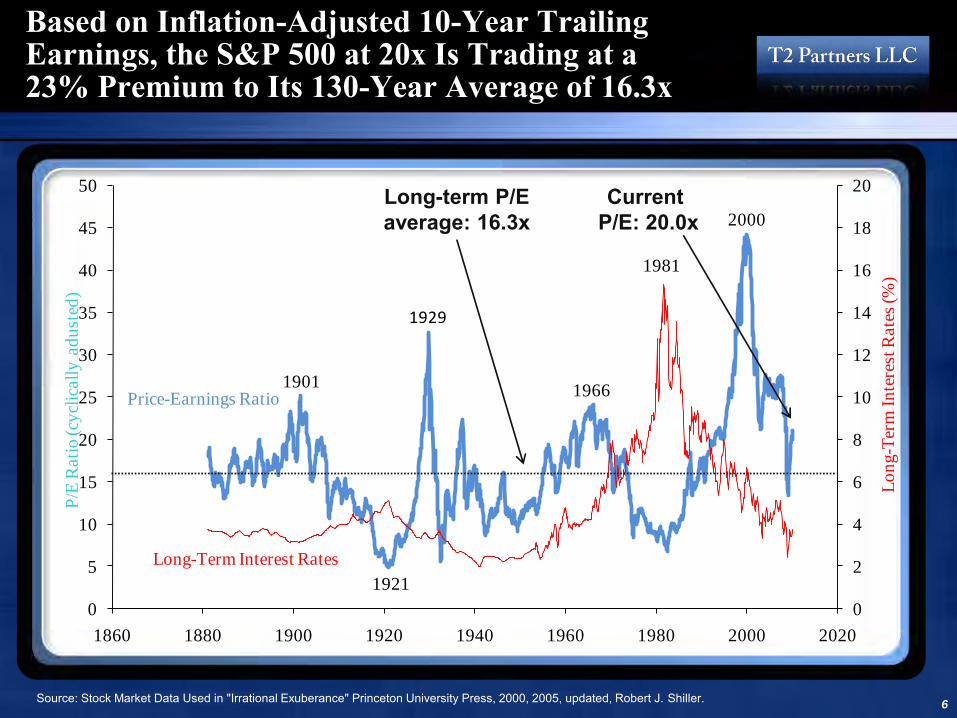
Based on Inflation-Adjusted 10-Year Trailing Earnings, the S&P 500 at 20x Is Trading at a 23% Premium to Its 130-Year Average of 16.3x
Source: Stock Market Data Used in "Irrational Exuberance" Princeton University Press, 2000, 2005, updated, Robert J. Shiller.
0
2
4
6
8
10
12
14
16
18
20
0
5
10
15
20
25
30
35
40
45
50
1860 1880 1900 1920 1940 1960 1980 2000 2020
Lo
ng-T
erm
In
tere
st R
ate
s (%
)
P/E
Rati
o (cy
clic
all
y a
du
sted
)
19011966
2000
Price-Earnings Ratio
Long-Term Interest Rates
1981
1921
1929
Current P/E: 20.0x
Long-term P/E average: 16.3x
Three Big-Cap Blue Chips: Anheuser-Busch InBev,
Microsoft, and BP

8
Anheuser-Busch InBev
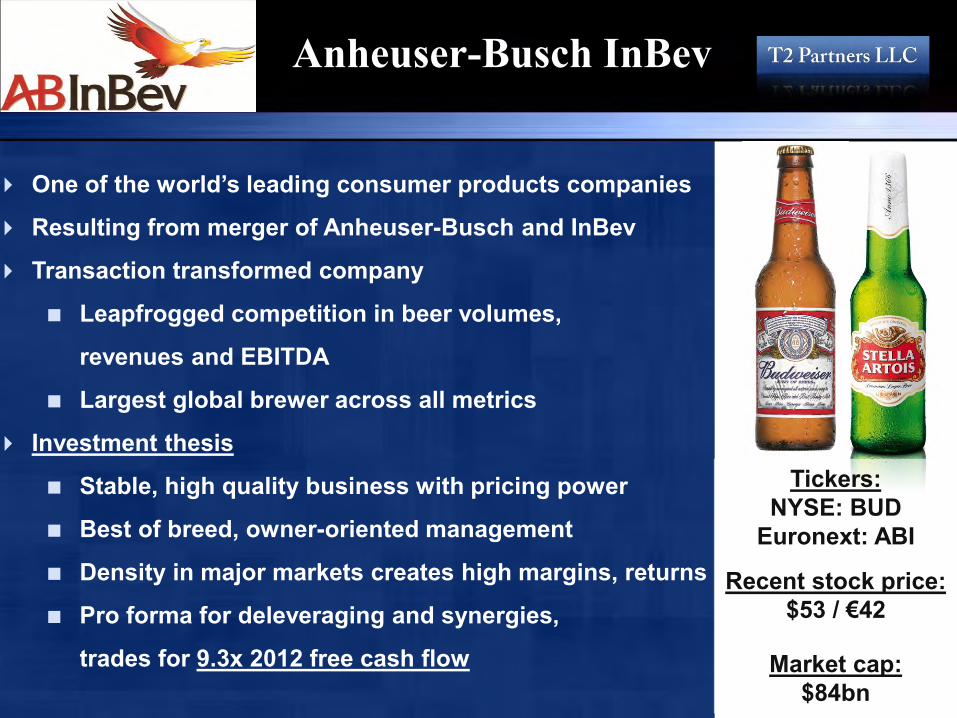
One of the world’s leading consumer products companies
Resulting from merger of Anheuser-Busch and InBev
Transaction transformed company
Leapfrogged competition in beer volumes,
revenues and EBITDA
Largest global brewer across all metrics
Investment thesis
Stable, high quality business with pricing power
Best of breed, owner-oriented management
Density in major markets creates high margins, returns
Pro forma for deleveraging and synergies,
trades for 9.3x 2012 free cash flow
Tickers: NYSE: BUD
Euronext: ABI
Recent stock price: $53 / €42
Market cap:
$84bn
Beer: High Quality Business
Stable: All top brewers grew revenues through the last two years on an organic basis; affordable luxury
Profitable: Margins expand with scale and revenues
Regional economies of scale are key for high EBITDA margins
Wide moat: Attractive returns on capital
Profitability requires scale and distribution penetration Investment in marketing and advertising to build the brand
franchise
Timeless: Beer is one of the world’s oldest prepared beverages. Earliest known chemical evidence dates from 3,000 BC. By the 7th century AD, monasteries were selling beer commercially. This is not a business that will disappear.
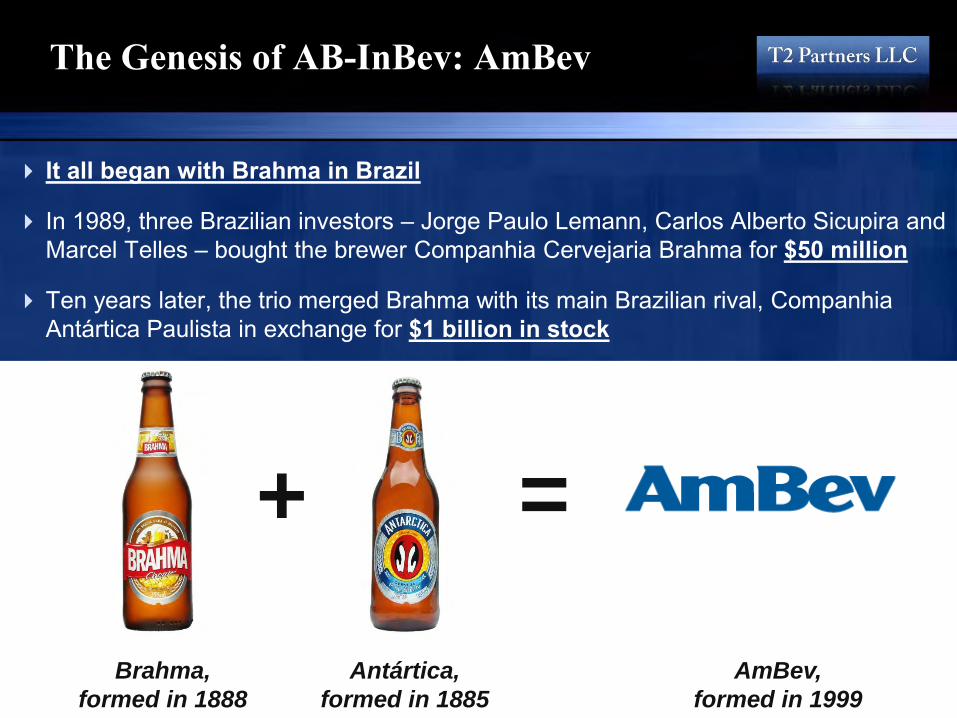
The Genesis of AB-InBev: AmBev
It all began with Brahma in Brazil
In 1989, three Brazilian investors – Jorge Paulo Lemann, Carlos Alberto Sicupira and Marcel Telles – bought the brewer Companhia Cervejaria Brahma for $50 million
Ten years later, the trio merged Brahma with its main Brazilian rival, Companhia Antártica Paulista in exchange for $1 billion in stock
Antártica,
formed in 1885
Brahma,
formed in 1888
+ =
AmBev,
formed in 1999
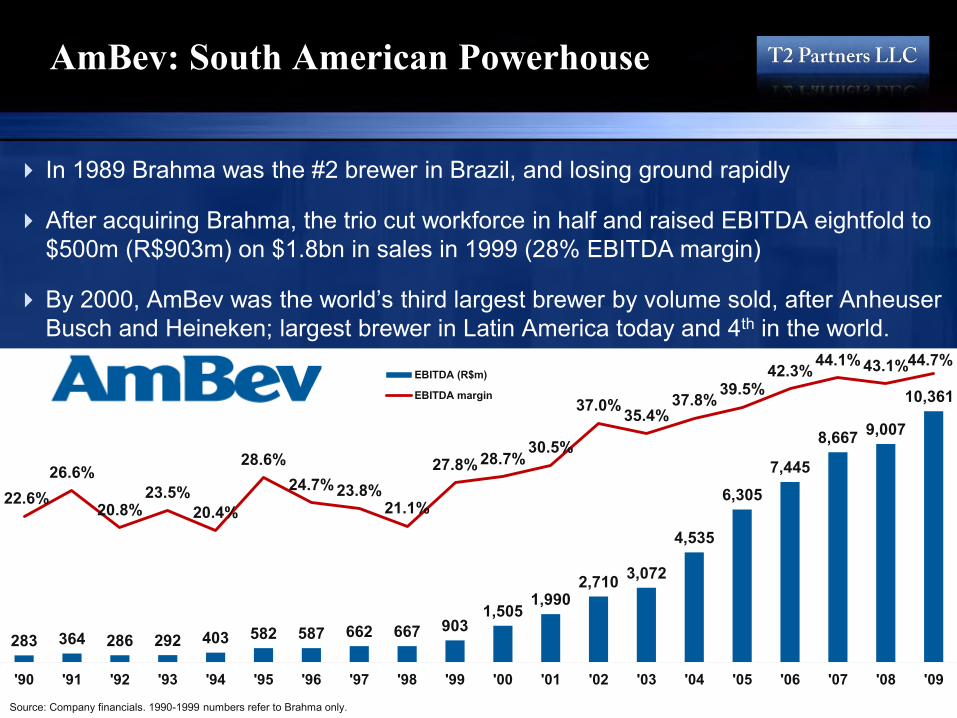
AmBev: South American Powerhouse
In 1989 Brahma was the #2 brewer in Brazil, and losing ground rapidly
After acquiring Brahma, the trio cut workforce in half and raised EBITDA eightfold to $500m (R$903m) on $1.8bn in sales in 1999 (28% EBITDA margin)
By 2000, AmBev was the world’s third largest brewer by volume sold, after Anheuser Busch and Heineken; largest brewer in Latin America today and 4th in the world.
283 364 286 292 403 582 587 662 667 903 1,505
1,990 2,710 3,072
4,535
6,305 7,445
8,667 9,007
10,361
22.6% 26.6%
20.8% 23.5%
20.4%
28.6% 24.7% 23.8%
21.1%
27.8% 28.7% 30.5%
37.0% 35.4% 37.8% 39.5%
42.3% 44.1% 43.1% 44.7%
'90 '91 '92 '93 '94 '95 '96 '97 '98 '99 '00 '01 '02 '03 '04 '05 '06 '07 '08 '09
EBITDA (R$m)
EBITDA margin
Source: Company financials. 1990-1999 numbers refer to Brahma only.
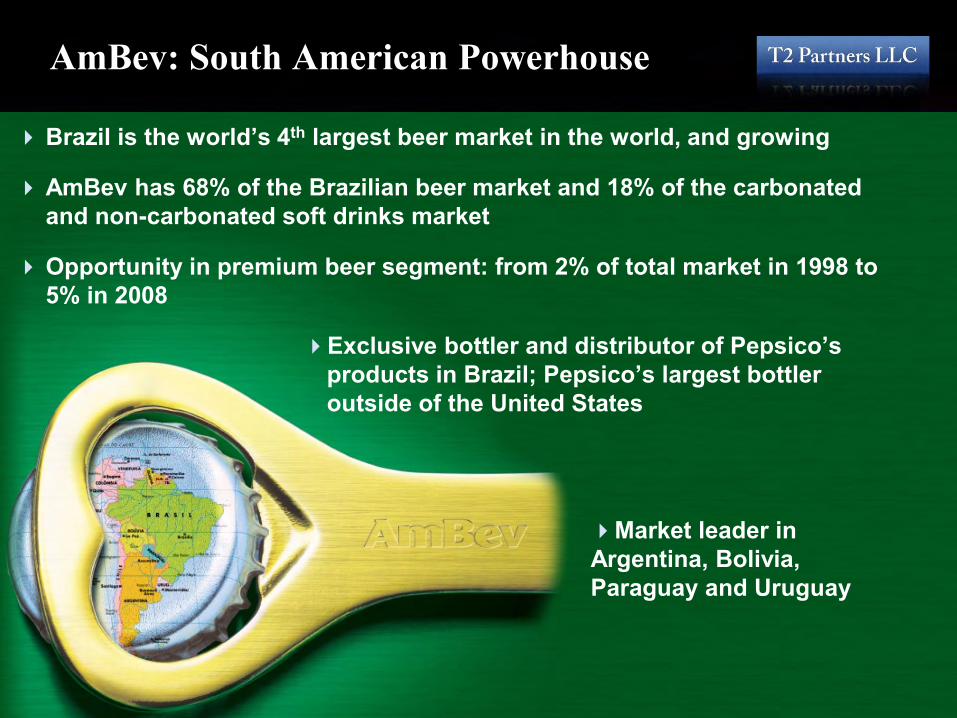
AmBev: South American Powerhouse
Brazil is the world’s 4th largest beer market in the world, and growing
AmBev has 68% of the Brazilian beer market and 18% of the carbonated and non-carbonated soft drinks market
Opportunity in premium beer segment: from 2% of total market in 1998 to 5% in 2008
Exclusive bottler and distributor of Pepsico’s products in Brazil; Pepsico’s largest bottler outside of the United States
Market leader in Argentina, Bolivia, Paraguay and Uruguay
Meanwhile in Belgium…
Interbrew was a collection of brands dating back to 1366; by 1993, it was still focused on its home market of Belgium
With the saturation of the beer market in Western Europe, Interbrew began an aggressive expansion plan
Through acquisition of Labatt, Interbrew obtained a market share of 43% in Canada
Other acquisitions followed; in the 10 years to 2004, Interbrew had the industry’s fastest growth in EBITDA per share
That year, it was the third largest global brewer by volume, with Anheuser-Busch in first place and SABMiller in second
By then it had well-known global brands such as Stella Artois, Beck’s, Bass, Leffe, Labatt and Hoegaarden
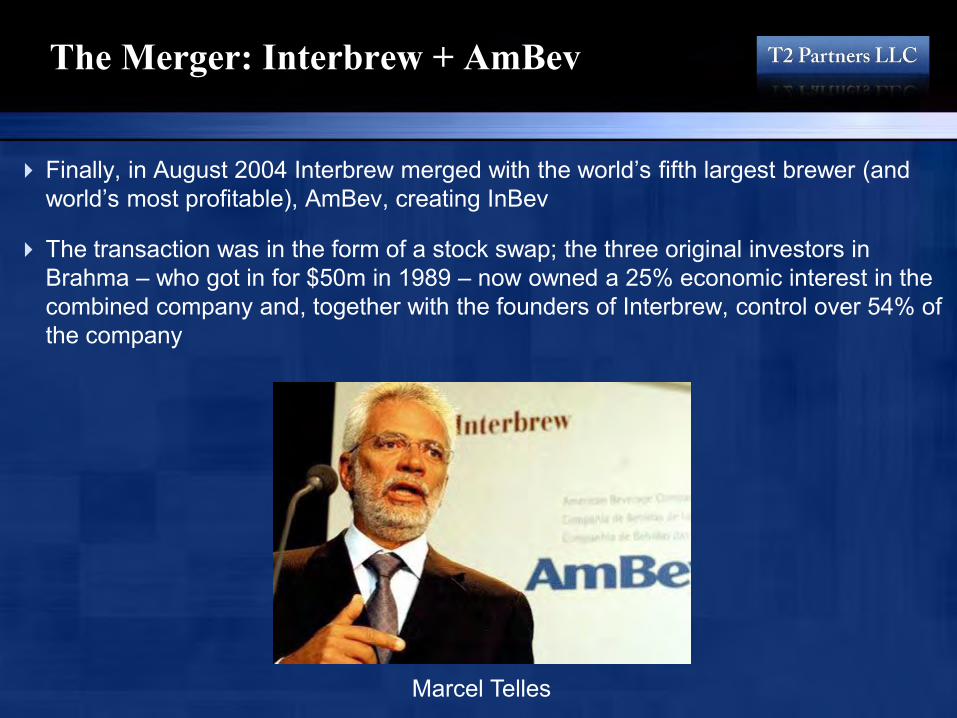
The Merger: Interbrew + AmBev
Finally, in August 2004 Interbrew merged with the world’s fifth largest brewer (and world’s most profitable), AmBev, creating InBev
The transaction was in the form of a stock swap; the three original investors in Brahma – who got in for $50m in 1989 – now owned a 25% economic interest in the combined company and, together with the founders of Interbrew, control over 54% of the company
Marcel Telles
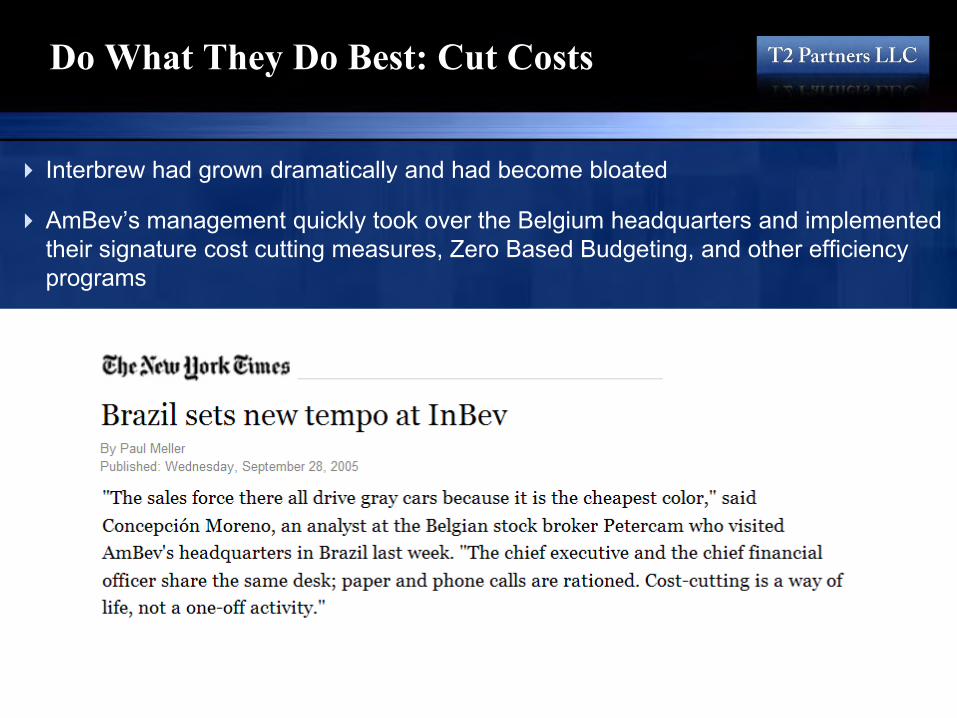
Do What They Do Best: Cut Costs
Interbrew had grown dramatically and had become bloated
AmBev’s management quickly took over the Belgium headquarters and implemented their signature cost cutting measures, Zero Based Budgeting, and other efficiency programs
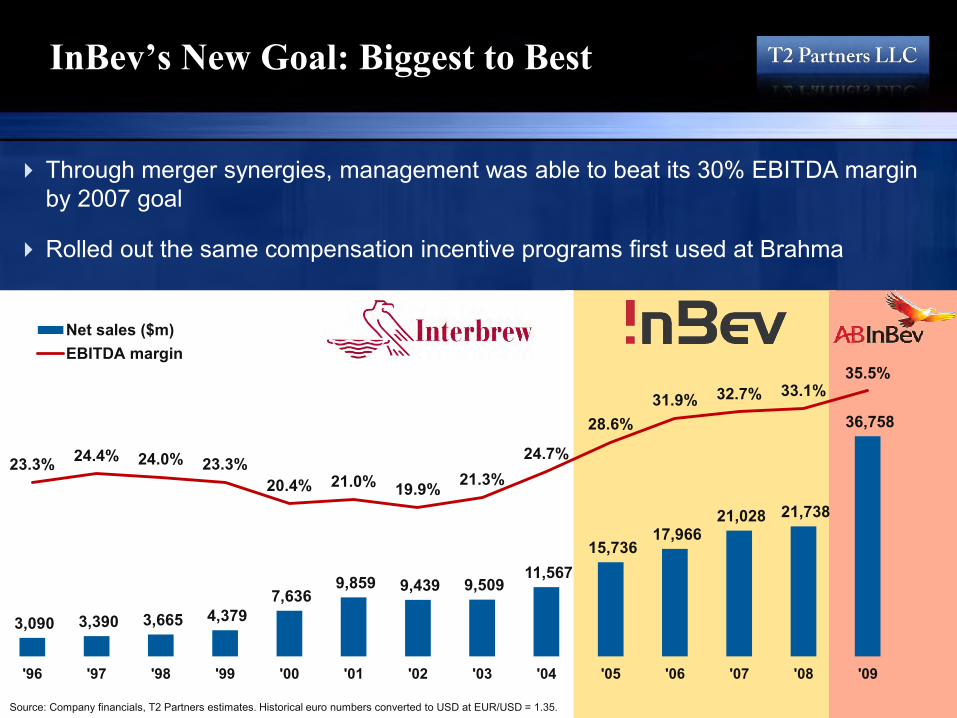
3,090 3,390 3,665 4,379 7,636
9,859 9,439 9,509 11,567
15,736 17,966
21,028 21,738
36,758
23.3% 24.4% 24.0% 23.3% 20.4% 21.0% 19.9% 21.3%
24.7%
28.6% 31.9% 32.7% 33.1%
35.5%
'96 '97 '98 '99 '00 '01 '02 '03 '04 '05 '06 '07 '08 '09
Net sales ($m)EBITDA margin
InBev’s New Goal: Biggest to Best
Through merger synergies, management was able to beat its 30% EBITDA margin by 2007 goal
Rolled out the same compensation incentive programs first used at Brahma
Source: Company financials, T2 Partners estimates. Historical euro numbers converted to USD at EUR/USD = 1.35.
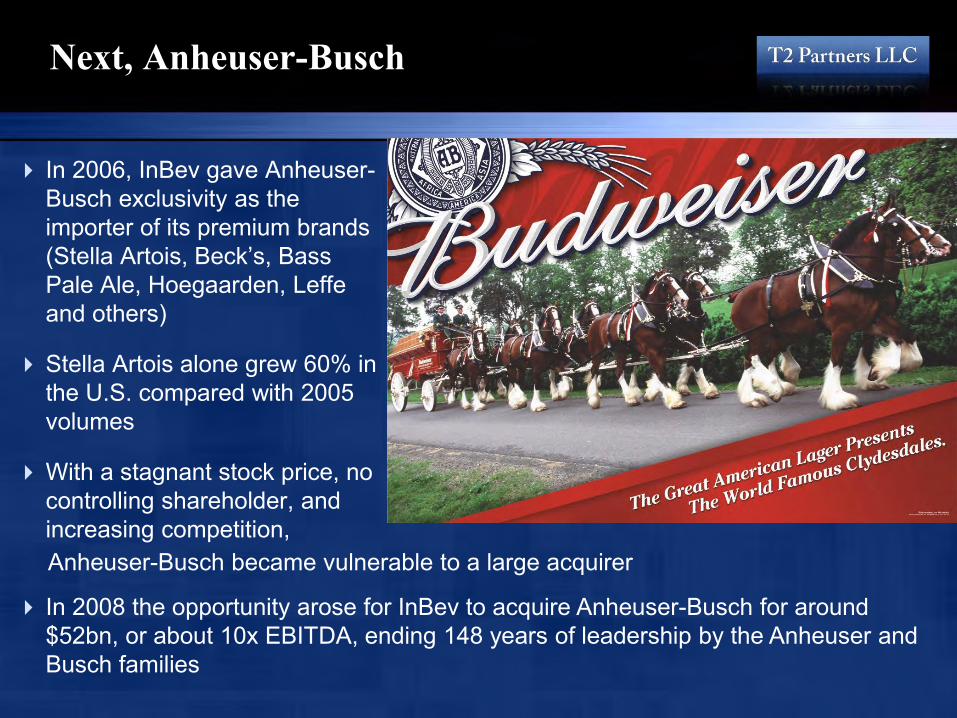
Next, Anheuser-Busch
In 2006, InBev gave Anheuser-Busch exclusivity as the importer of its premium brands (Stella Artois, Beck’s, Bass Pale Ale, Hoegaarden, Leffe and others)
Stella Artois alone grew 60% in the U.S. compared with 2005 volumes
With a stagnant stock price, no controlling shareholder, and increasing competition,
Anheuser-Busch became vulnerable to a large acquirer
In 2008 the opportunity arose for InBev to acquire Anheuser-Busch for around $52bn, or about 10x EBITDA, ending 148 years of leadership by the Anheuser and Busch families
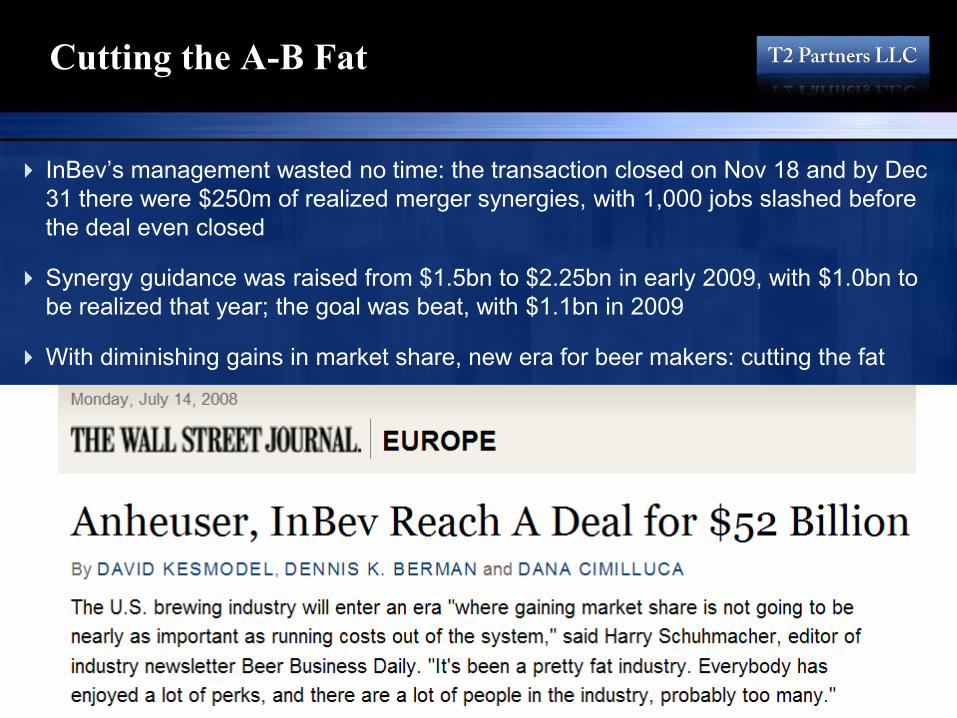
Cutting the A-B Fat
InBev’s management wasted no time: the transaction closed on Nov 18 and by Dec 31 there were $250m of realized merger synergies, with 1,000 jobs slashed before the deal even closed
Synergy guidance was raised from $1.5bn to $2.25bn in early 2009, with $1.0bn to be realized that year; the goal was beat, with $1.1bn in 2009
With diminishing gains in market share, new era for beer makers: cutting the fat
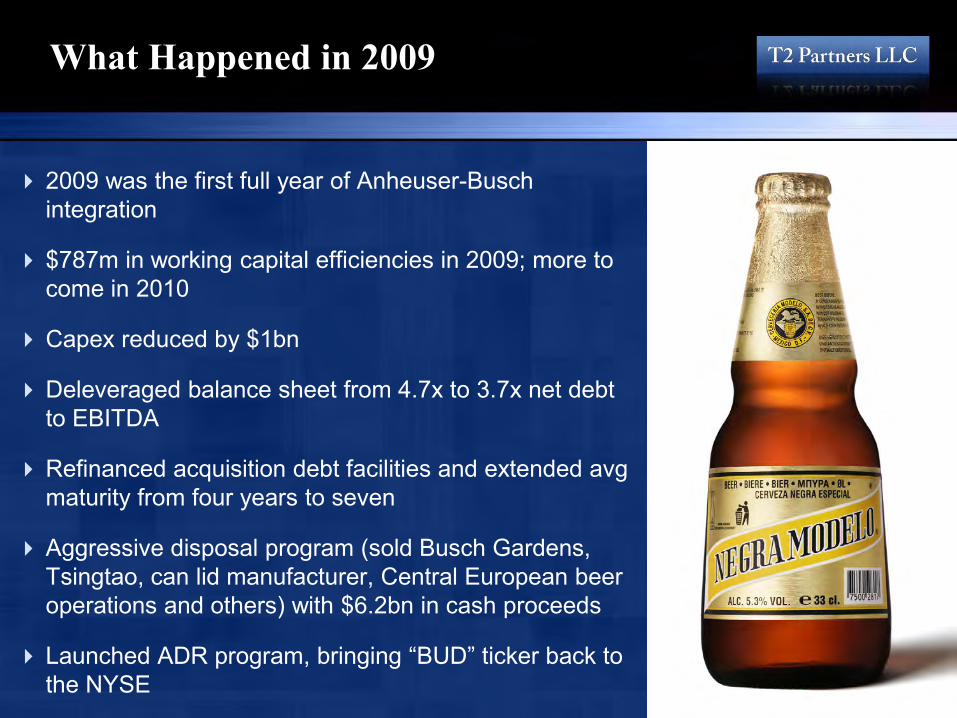
What Happened in 2009
2009 was the first full year of Anheuser-Busch integration
$787m in working capital efficiencies in 2009; more to come in 2010
Capex reduced by $1bn
Deleveraged balance sheet from 4.7x to 3.7x net debt to EBITDA
Refinanced acquisition debt facilities and extended avg maturity from four years to seven
Aggressive disposal program (sold Busch Gardens, Tsingtao, can lid manufacturer, Central European beer operations and others) with $6.2bn in cash proceeds
Launched ADR program, bringing “BUD” ticker back to the NYSE
AB-InBev Today: A Snapshot
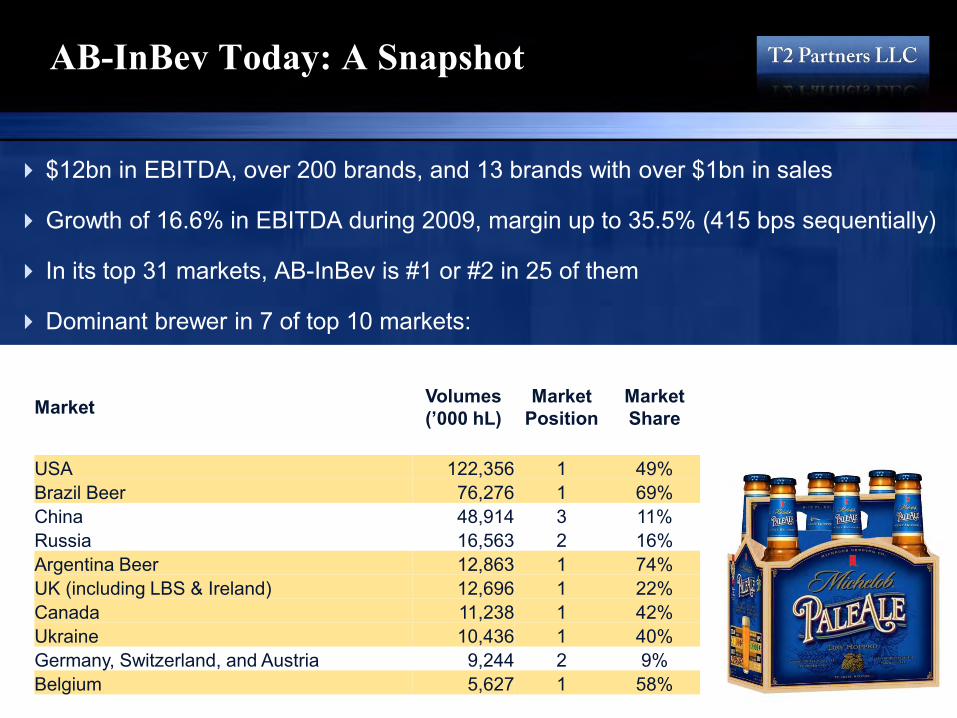
$12bn in EBITDA, over 200 brands, and 13 brands with over $1bn in sales
Growth of 16.6% in EBITDA during 2009, margin up to 35.5% (415 bps sequentially)
In its top 31 markets, AB-InBev is #1 or #2 in 25 of them
Dominant brewer in 7 of top 10 markets:
Market
Volumes
(’000 hL)
Market
Position
Market
Share
USA 122,356 1 49% Brazil Beer 76,276 1 69% China 48,914 3 11% Russia 16,563 2 16% Argentina Beer 12,863 1 74% UK (including LBS & Ireland) 12,696 1 22% Canada 11,238 1 42% Ukraine 10,436 1 40% Germany, Switzerland, and Austria 9,244 2 9% Belgium 5,627 1 58%
AB-InBev Today: A Snapshot
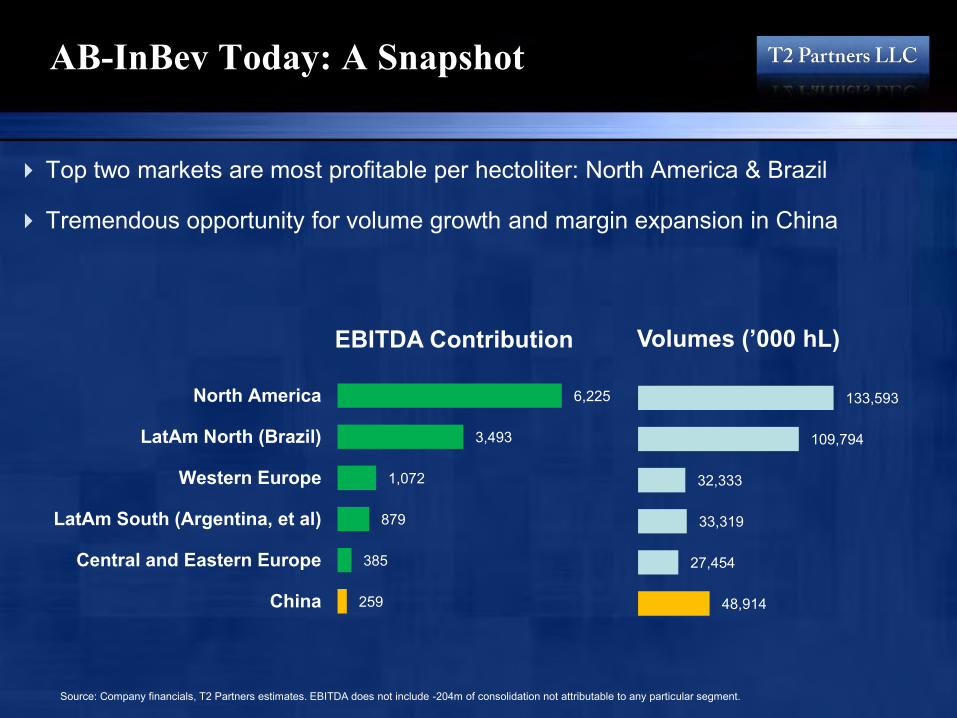
Top two markets are most profitable per hectoliter: North America & Brazil
Tremendous opportunity for volume growth and margin expansion in China
6,225
3,493
1,072
879
385
259
North America
LatAm North (Brazil)
Western Europe
LatAm South (Argentina, et al)
Central and Eastern Europe
China
133,593
109,794
32,333
33,319
27,454
48,914
EBITDA Contribution Volumes (’000 hL)
Source: Company financials, T2 Partners estimates. EBITDA does not include -204m of consolidation not attributable to any particular segment.
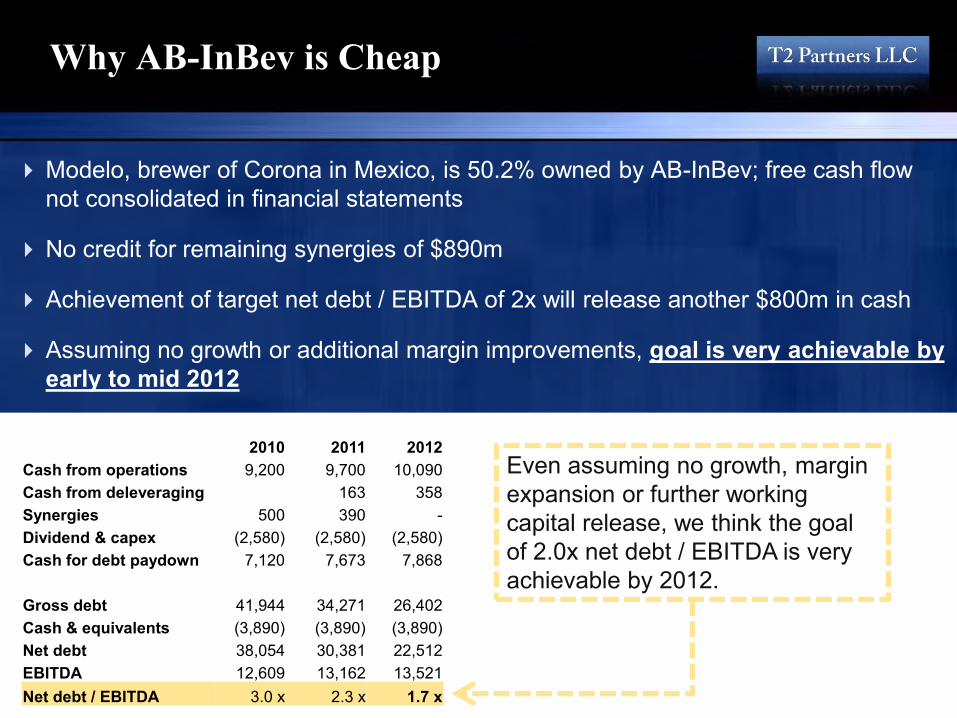
Why AB-InBev is Cheap
Modelo, brewer of Corona in Mexico, is 50.2% owned by AB-InBev; free cash flow not consolidated in financial statements
No credit for remaining synergies of $890m
Achievement of target net debt / EBITDA of 2x will release another $800m in cash
Assuming no growth or additional margin improvements, goal is very achievable by early to mid 2012
2010 2011 2012 Cash from operations 9,200 9,700 10,090 Cash from deleveraging 163 358 Synergies 500 390 - Dividend & capex (2,580) (2,580) (2,580) Cash for debt paydown 7,120 7,673 7,868 Gross debt 41,944 34,271 26,402 Cash & equivalents (3,890) (3,890) (3,890) Net debt 38,054 30,381 22,512 EBITDA 12,609 13,162 13,521 Net debt / EBITDA 3.0 x 2.3 x 1.7 x
Even assuming no growth, margin expansion or further working capital release, we think the goal of 2.0x net debt / EBITDA is very achievable by 2012.
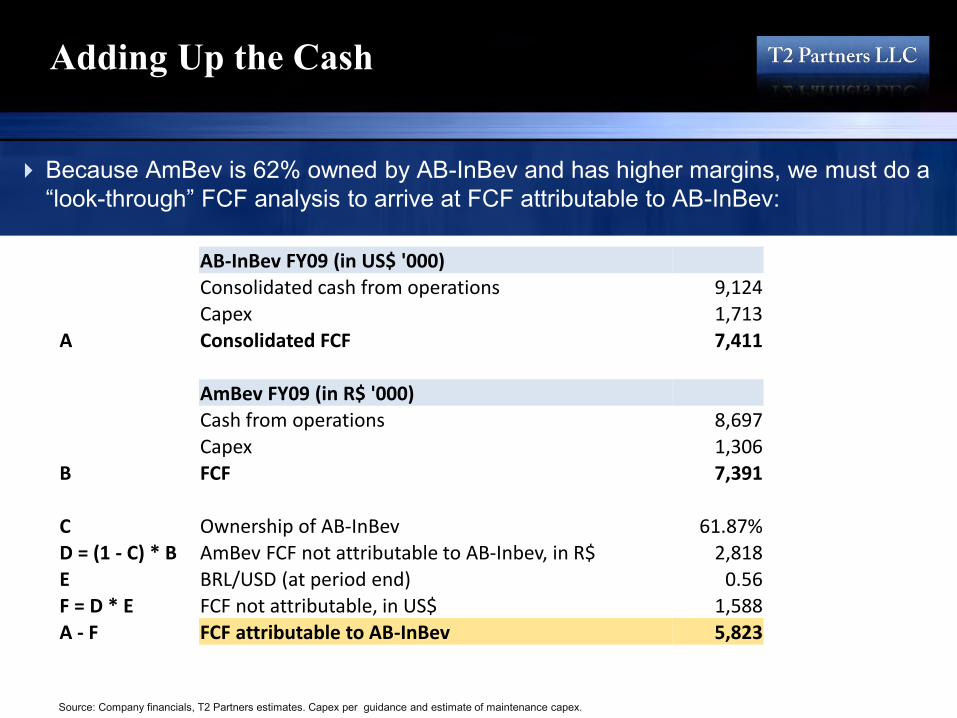
Adding Up the Cash
Because AmBev is 62% owned by AB-InBev and has higher margins, we must do a “look-through” FCF analysis to arrive at FCF attributable to AB-InBev:
Source: Company financials, T2 Partners estimates. Capex per guidance and estimate of maintenance capex.
AB-InBev FY09 (in US$ '000) Consolidated cash from operations 9,124
Capex 1,713 A Consolidated FCF 7,411
AmBev FY09 (in R$ '000) Cash from operations 8,697
Capex 1,306 B FCF 7,391
C Ownership of AB-InBev 61.87%
D = (1 - C) * B AmBev FCF not attributable to AB-Inbev, in R$ 2,818 E BRL/USD (at period end) 0.56
F = D * E FCF not attributable, in US$ 1,588 A - F FCF attributable to AB-InBev 5,823
Pro Forma 2012 Free Cash Flow
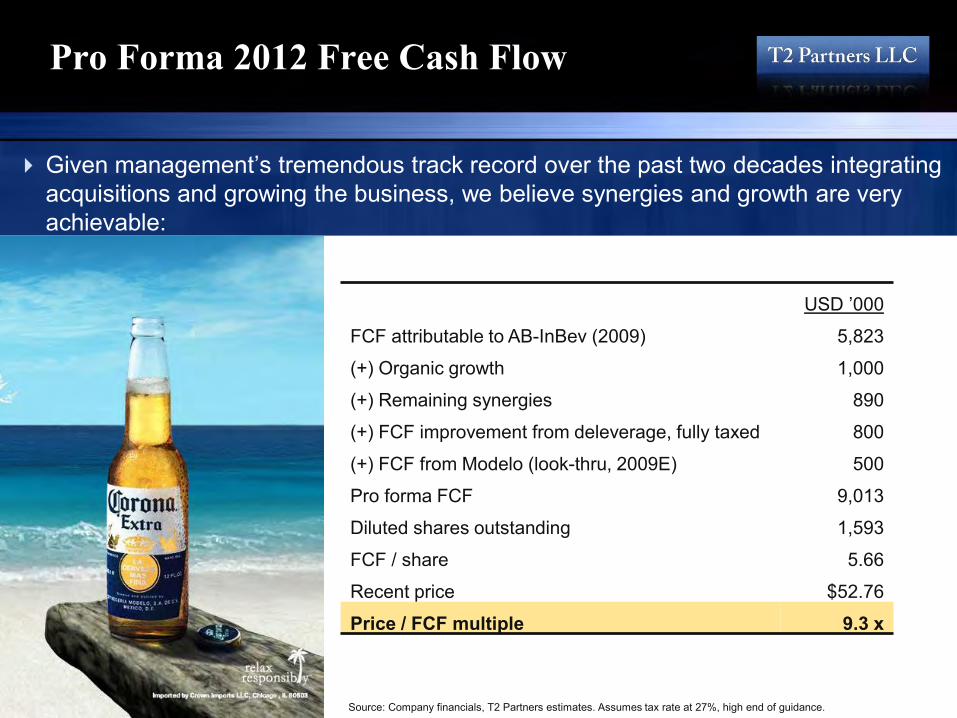
Given management’s tremendous track record over the past two decades integrating acquisitions and growing the business, we believe synergies and growth are very achievable:
USD ’000 FCF attributable to AB-InBev (2009) 5,823
(+) Organic growth 1,000
(+) Remaining synergies 890
(+) FCF improvement from deleverage, fully taxed 800
(+) FCF from Modelo (look-thru, 2009E) 500
Pro forma FCF 9,013
Diluted shares outstanding 1,593
FCF / share 5.66 Recent price $52.76 Price / FCF multiple 9.3 x
Source: Company financials, T2 Partners estimates. Assumes tax rate at 27%, high end of guidance.
Potential Upside
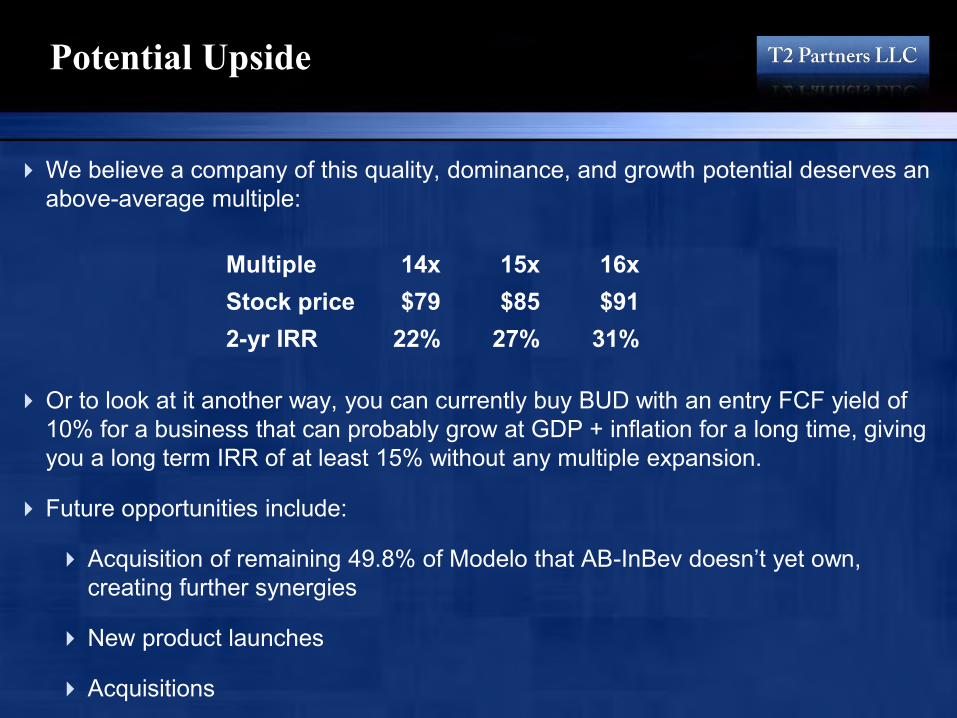
We believe a company of this quality, dominance, and growth potential deserves an above-average multiple:
Or to look at it another way, you can currently buy BUD with an entry FCF yield of 10% for a business that can probably grow at GDP + inflation for a long time, giving you a long term IRR of at least 15% without any multiple expansion.
Future opportunities include:
Acquisition of remaining 49.8% of Modelo that AB-InBev doesn’t yet own, creating further synergies
New product launches
Acquisitions
Multiple 14x 15x 16x Stock price $79 $85 $91 2-yr IRR 22% 27% 31%
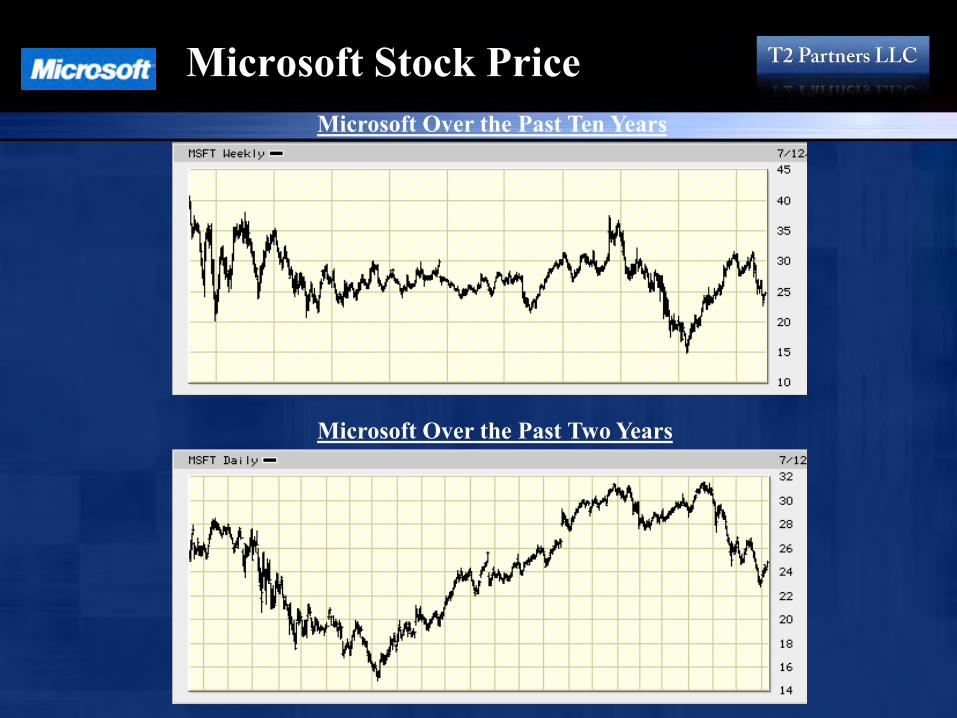
Microsoft Stock Price
Microsoft Over the Past Two Years
Microsoft Over the Past Ten Years
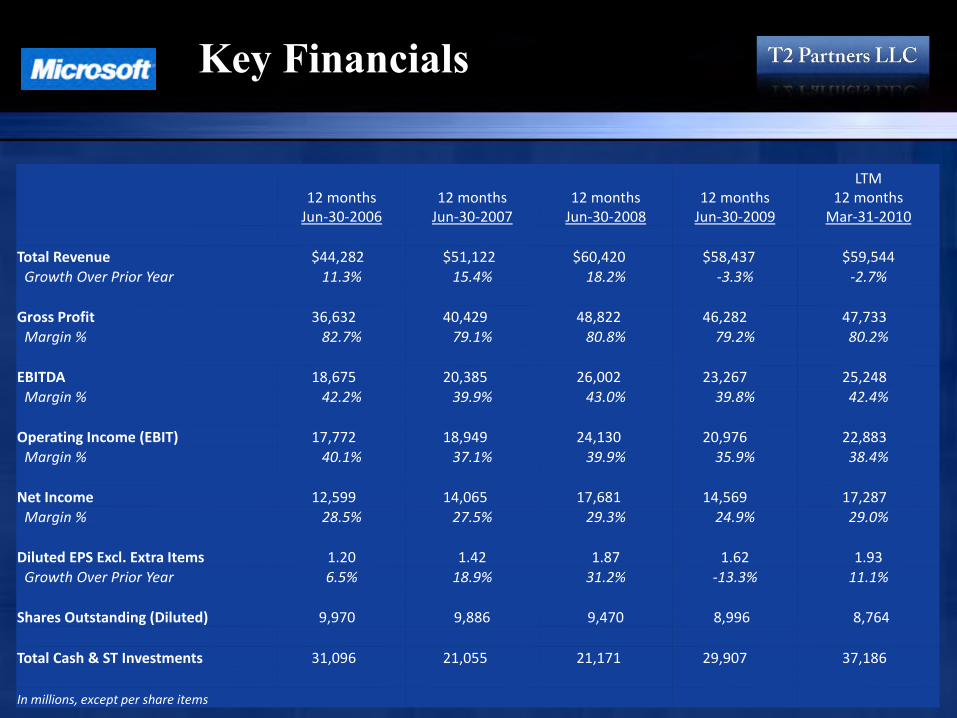
Key Financials
12 months Jun-30-2006
12 months Jun-30-2007
12 months Jun-30-2008
12 months Jun-30-2009
LTM 12 months
Mar-31-2010
Total Revenue $44,282 $51,122 $60,420 $58,437 $59,544 Growth Over Prior Year 11.3% 15.4% 18.2% -3.3% -2.7%
Gross Profit 36,632 40,429 48,822 46,282 47,733 Margin % 82.7% 79.1% 80.8% 79.2% 80.2%
EBITDA 18,675 20,385 26,002 23,267 25,248 Margin % 42.2% 39.9% 43.0% 39.8% 42.4%
Operating Income (EBIT) 17,772 18,949 24,130 20,976 22,883 Margin % 40.1% 37.1% 39.9% 35.9% 38.4%
Net Income 12,599 14,065 17,681 14,569 17,287 Margin % 28.5% 27.5% 29.3% 24.9% 29.0%
Diluted EPS Excl. Extra Items 1.20 1.42 1.87 1.62 1.93 Growth Over Prior Year 6.5% 18.9% 31.2% -13.3% 11.1%
Shares Outstanding (Diluted) 9,970 9,886 9,470 8,996 8,764
Total Cash & ST Investments 31,096 21,055 21,171 29,907 37,186
In millions, except per share items
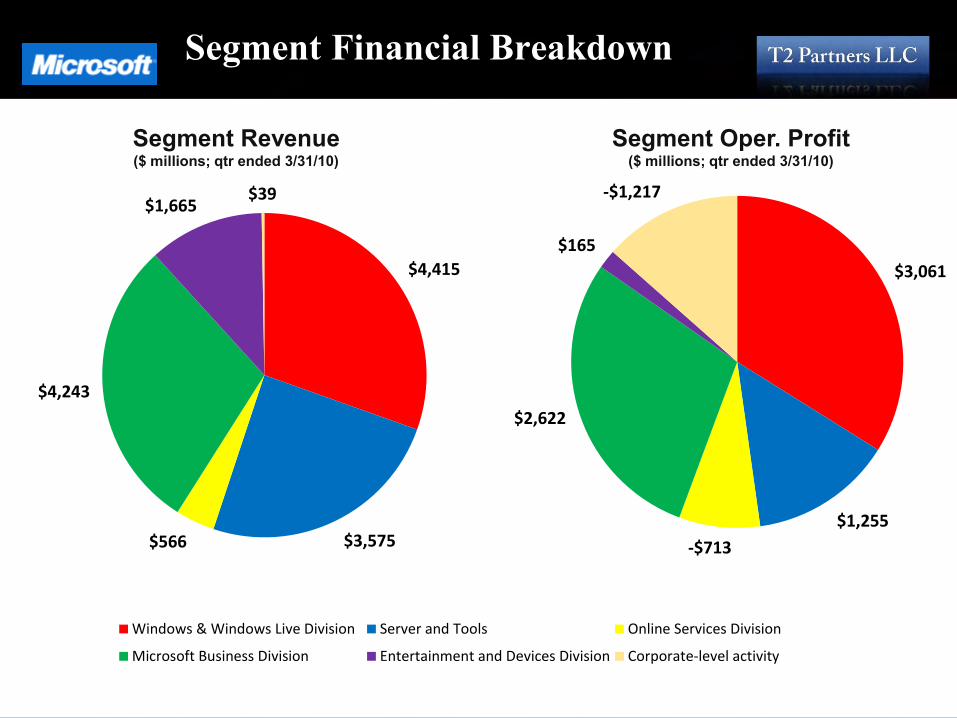
Segment Financial Breakdown
$4,415
$3,575 $566
$4,243
$1,665 $39
Windows & Windows Live Division Server and Tools Online Services Division
Microsoft Business Division Entertainment and Devices Division Corporate-level activity
$3,061
$1,255
-$713
$2,622
$165
-$1,217
Segment Revenue ($ millions; qtr ended 3/31/10)
Segment Oper. Profit ($ millions; qtr ended 3/31/10)
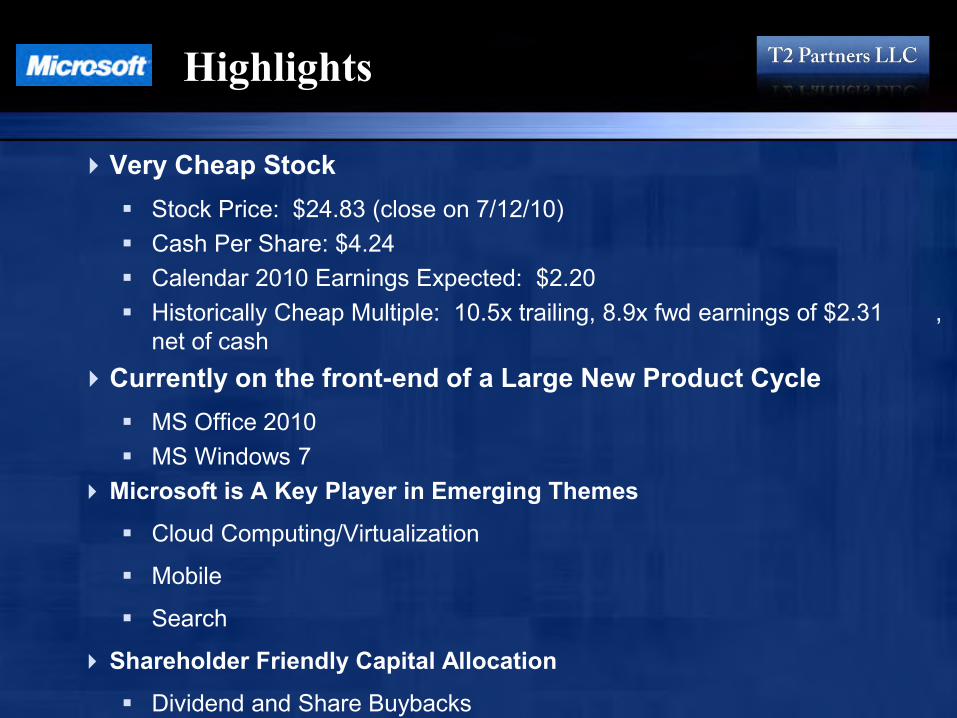
Highlights
Very Cheap Stock Stock Price: $24.83 (close on 7/12/10) Cash Per Share: $4.24 Calendar 2010 Earnings Expected: $2.20 Historically Cheap Multiple: 10.5x trailing, 8.9x fwd earnings of $2.31 ,
net of cash Currently on the front-end of a Large New Product Cycle
MS Office 2010 MS Windows 7
Microsoft is A Key Player in Emerging Themes
Cloud Computing/Virtualization
Mobile
Search
Shareholder Friendly Capital Allocation
Dividend and Share Buybacks
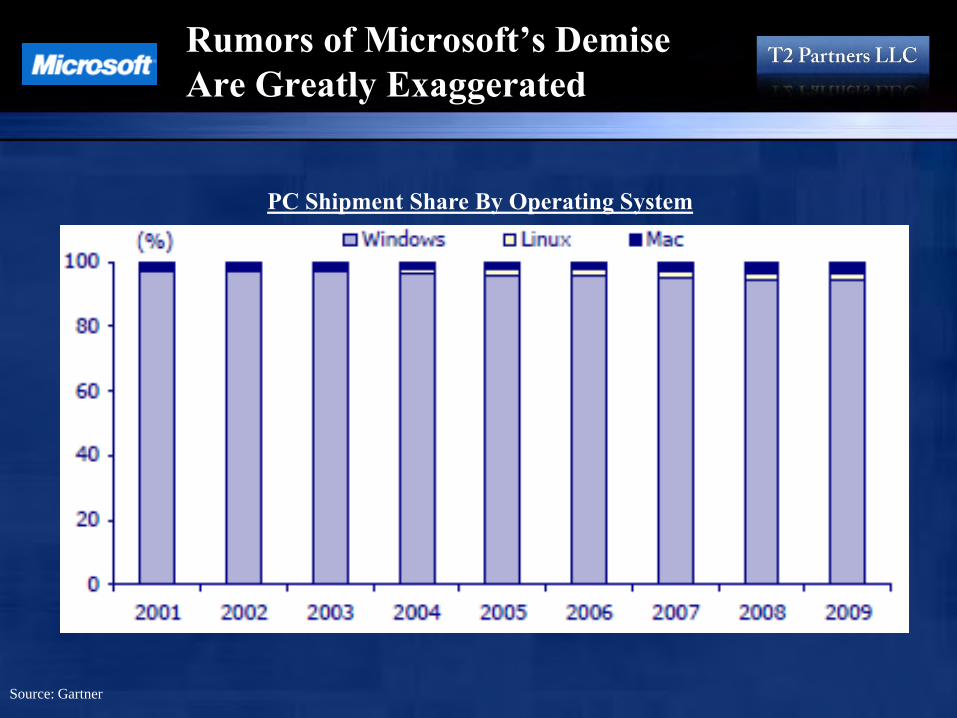
Rumors of Microsoft’s Demise Are Greatly Exaggerated
PC Shipment Share By Operating System
Source: Gartner
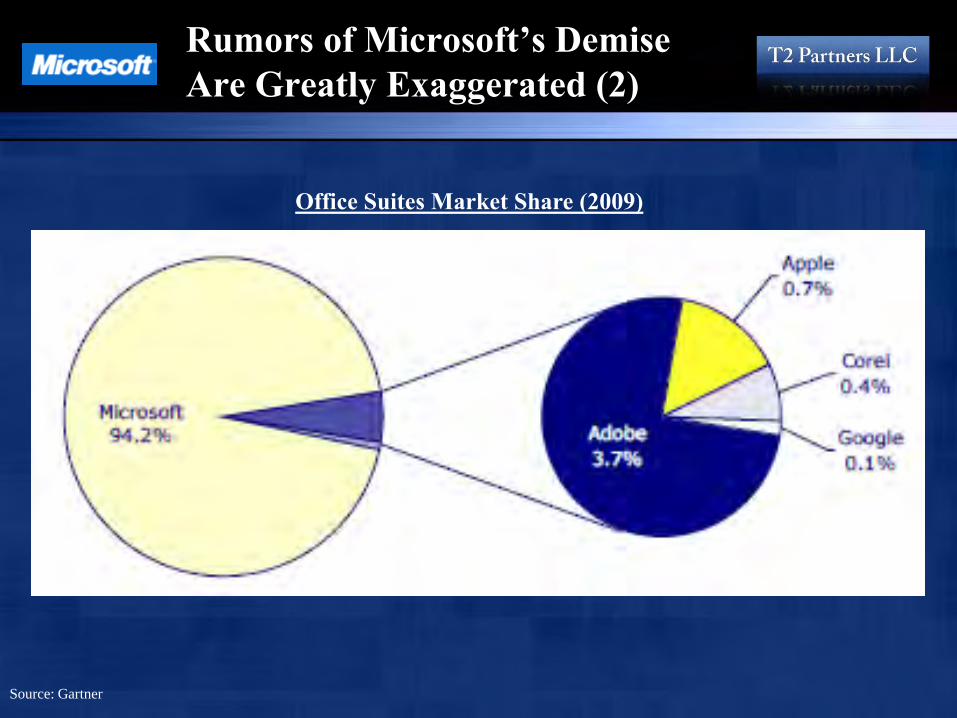
Rumors of Microsoft’s Demise Are Greatly Exaggerated (2)
Office Suites Market Share (2009)
Source: Gartner
Rumors of Microsoft’s Demise Are Greatly Exaggerated (3)
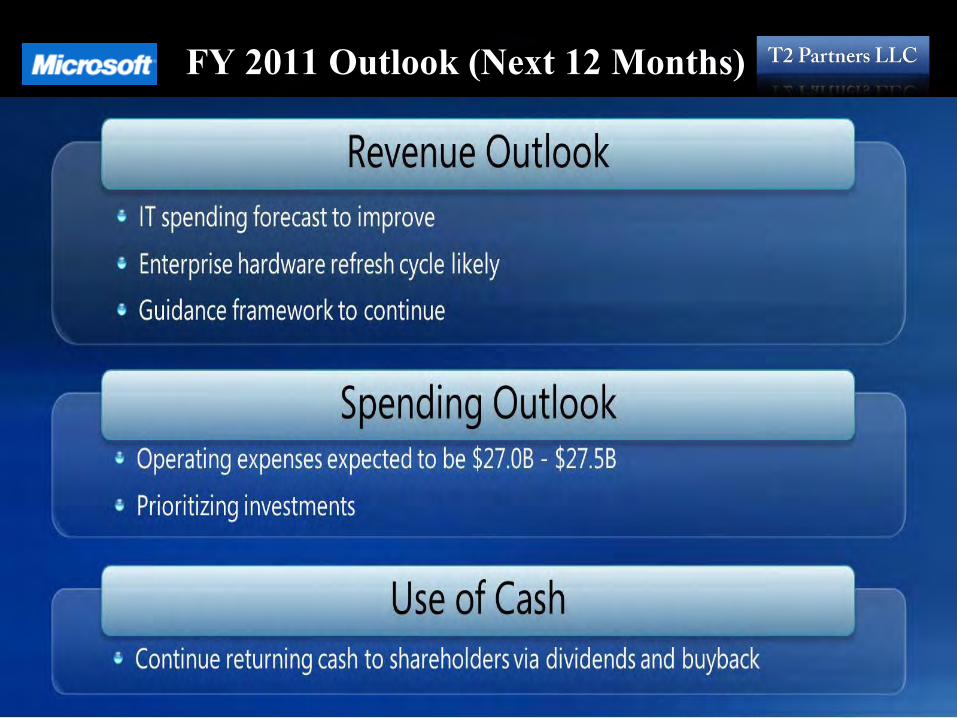
FY 2011 Outlook (Next 12 Months)
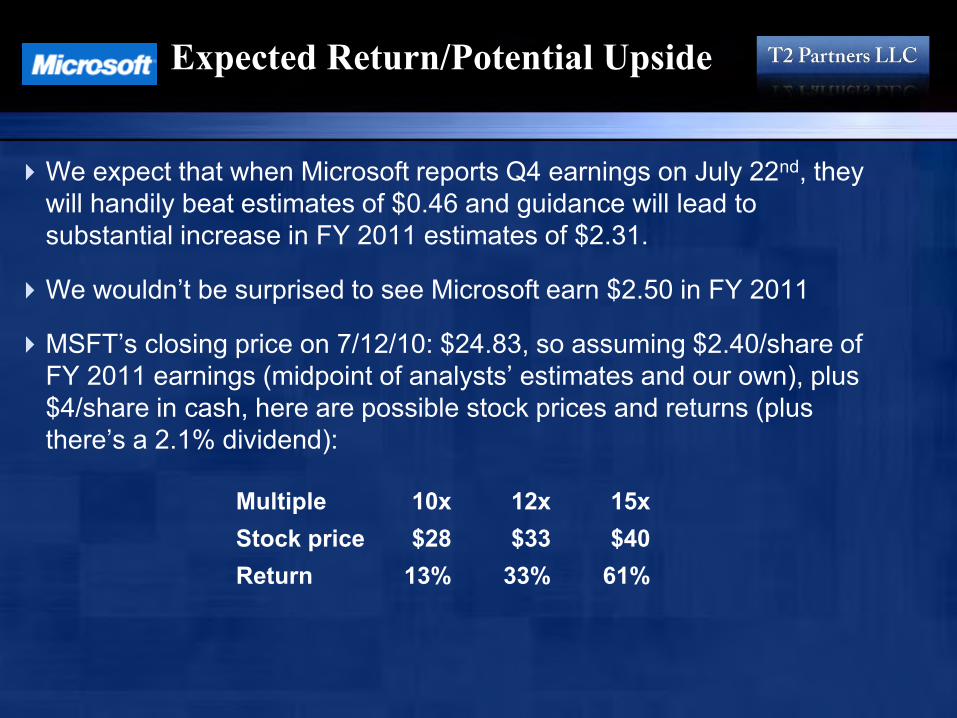
Expected Return/Potential Upside
We expect that when Microsoft reports Q4 earnings on July 22nd, they will handily beat estimates of $0.46 and guidance will lead to substantial increase in FY 2011 estimates of $2.31.
We wouldn’t be surprised to see Microsoft earn $2.50 in FY 2011
MSFT’s closing price on 7/12/10: $24.83, so assuming $2.40/share of FY 2011 earnings (midpoint of analysts’ estimates and our own), plus $4/share in cash, here are possible stock prices and returns (plus there’s a 2.1% dividend):
Multiple 10x 12x 15x Stock price $28 $33 $40 Return 13% 33% 61%
36
37
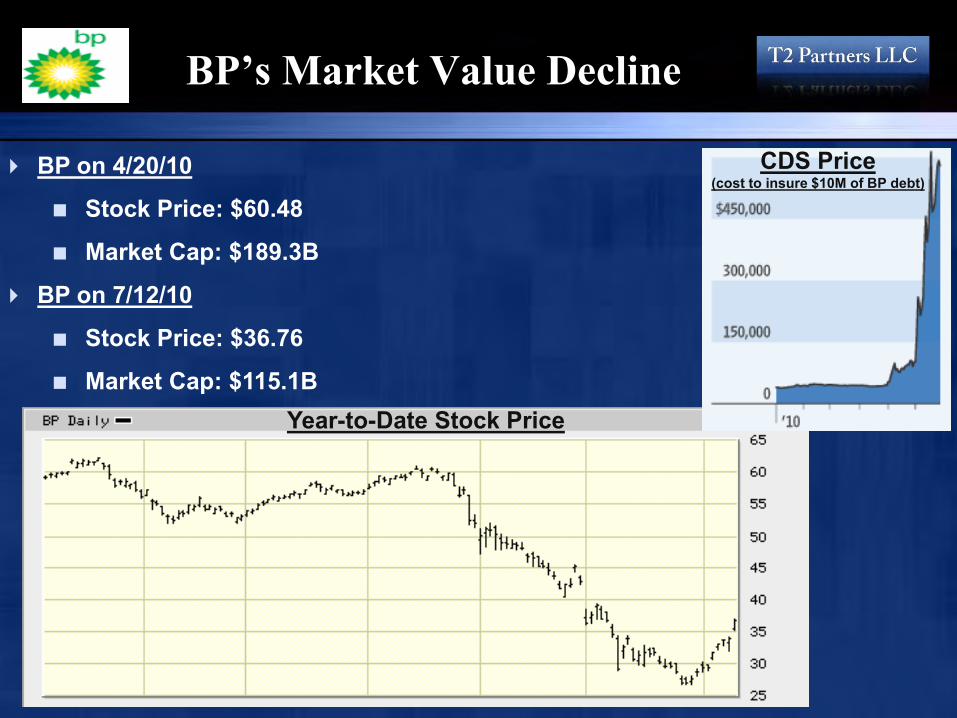
BP’s Market Value Decline
BP on 4/20/10
Stock Price: $60.48
Market Cap: $189.3B
BP on 7/12/10
Stock Price: $36.76
Market Cap: $115.1B Year-to-Date Stock Price
CDS Price (cost to insure $10M of BP debt)
Key Issues
How big is the spill and how bad could it get?
How profitable is BP?
How much might future profits be impacted?
Can BP raise additional cash?
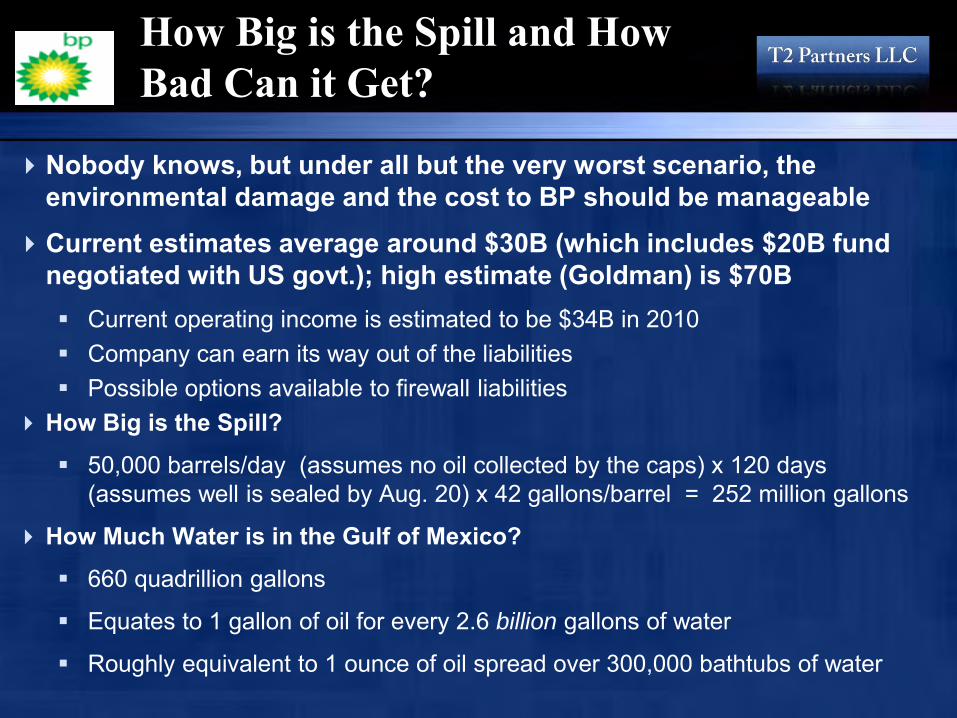
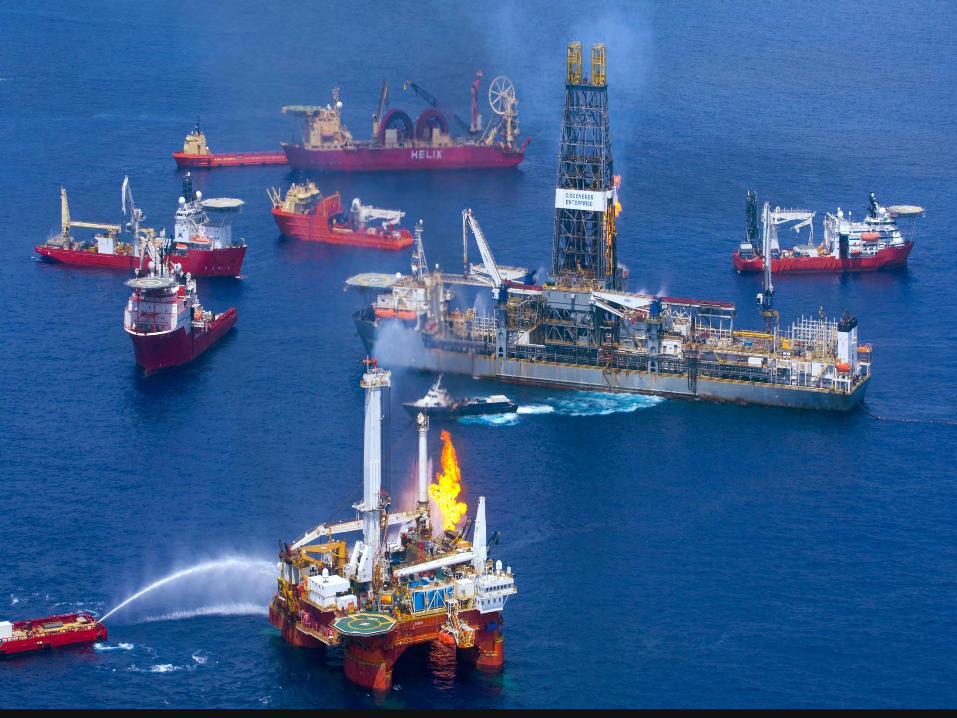
How Big is the Spill and How Bad Can it Get?
Nobody knows, but under all but the very worst scenario, the environmental damage and the cost to BP should be manageable
Current estimates average around $30B (which includes $20B fund negotiated with US govt.); high estimate (Goldman) is $70B Current operating income is estimated to be $34B in 2010 Company can earn its way out of the liabilities Possible options available to firewall liabilities
How Big is the Spill?
50,000 barrels/day (assumes no oil collected by the caps) x 120 days (assumes well is sealed by Aug. 20) x 42 gallons/barrel = 252 million gallons
How Much Water is in the Gulf of Mexico?
660 quadrillion gallons
Equates to 1 gallon of oil for every 2.6 billion gallons of water
Roughly equivalent to 1 ounce of oil spread over 300,000 bathtubs of water
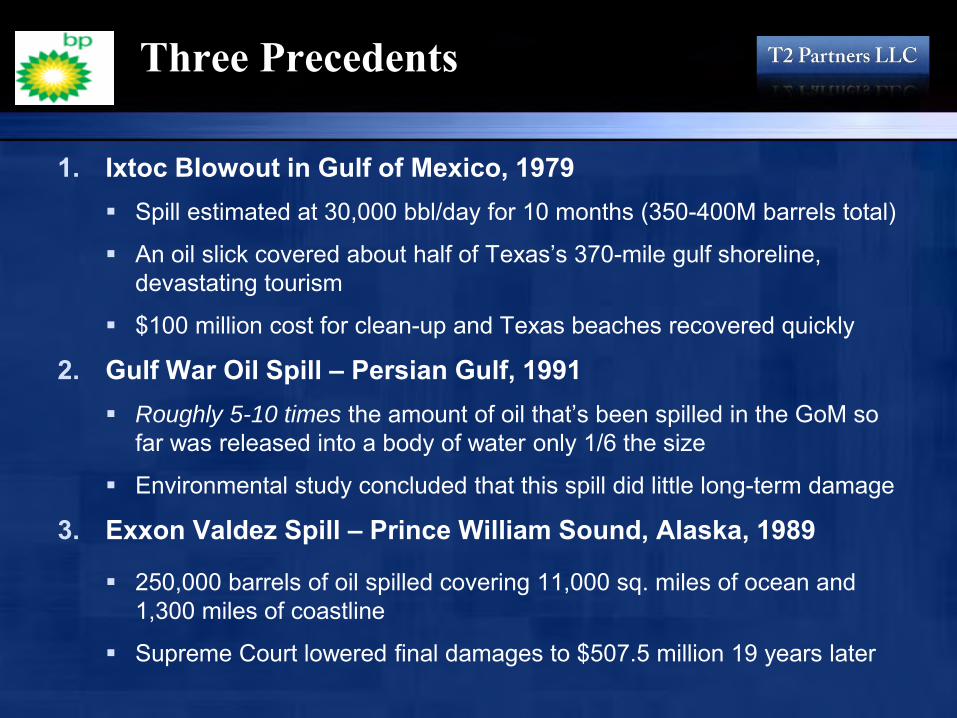
Three Precedents
1. Ixtoc Blowout in Gulf of Mexico, 1979 Spill estimated at 30,000 bbl/day for 10 months (350-400M barrels total)
An oil slick covered about half of Texas’s 370-mile gulf shoreline, devastating tourism
$100 million cost for clean-up and Texas beaches recovered quickly
2. Gulf War Oil Spill – Persian Gulf, 1991 Roughly 5-10 times the amount of oil that’s been spilled in the GoM so
far was released into a body of water only 1/6 the size
Environmental study concluded that this spill did little long-term damage
3. Exxon Valdez Spill – Prince William Sound, Alaska, 1989
250,000 barrels of oil spilled covering 11,000 sq. miles of ocean and 1,300 miles of coastline
Supreme Court lowered final damages to $507.5 million 19 years later
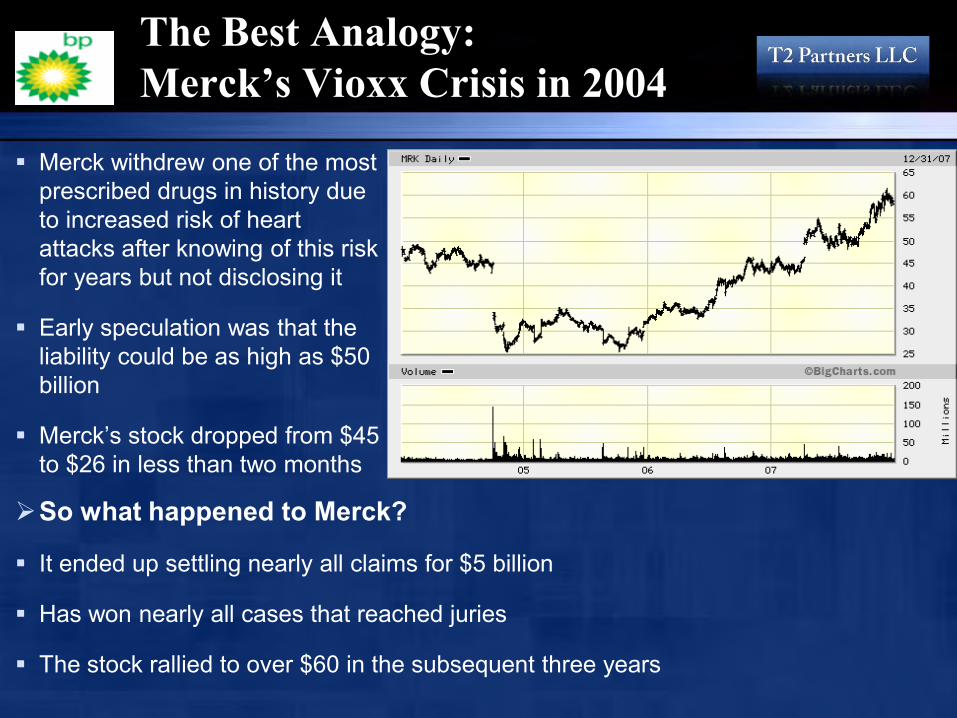
The Best Analogy: Merck’s Vioxx Crisis in 2004
Merck withdrew one of the most prescribed drugs in history due to increased risk of heart attacks after knowing of this risk for years but not disclosing it
Early speculation was that the liability could be as high as $50 billion
Merck’s stock dropped from $45 to $26 in less than two months
So what happened to Merck?
It ended up settling nearly all claims for $5 billion
Has won nearly all cases that reached juries
The stock rallied to over $60 in the subsequent three years
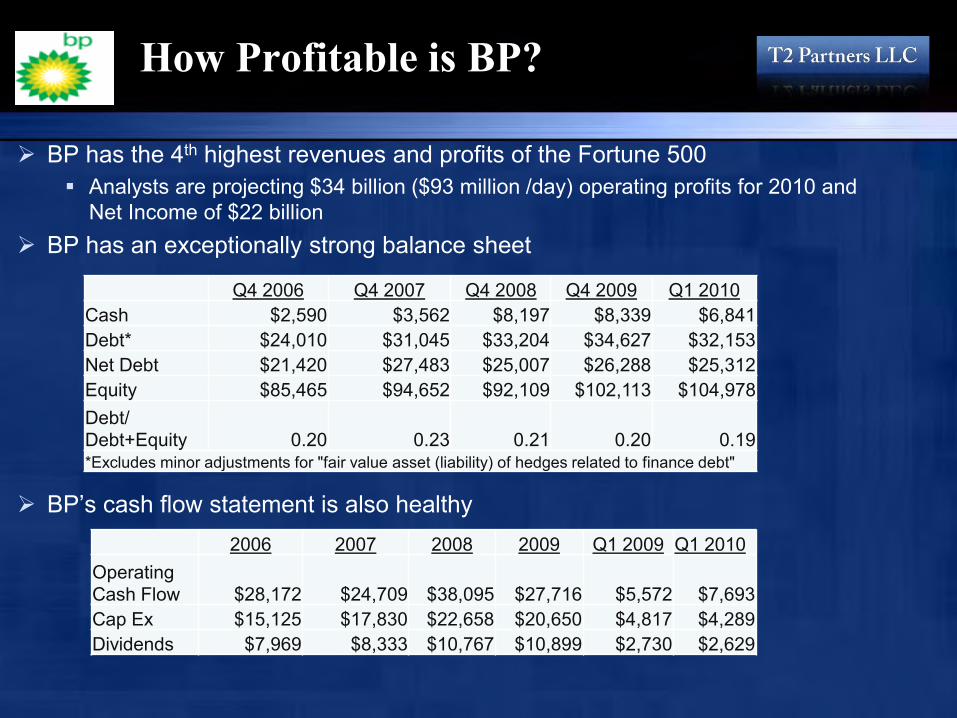
How Profitable is BP?
BP has the 4th highest revenues and profits of the Fortune 500 Analysts are projecting $34 billion ($93 million /day) operating profits for 2010 and
Net Income of $22 billion BP has an exceptionally strong balance sheet
BP’s cash flow statement is also healthy
Q4 2006 Q4 2007 Q4 2008 Q4 2009 Q1 2010
Cash $2,590 $3,562 $8,197 $8,339 $6,841 Debt* $24,010 $31,045 $33,204 $34,627 $32,153 Net Debt $21,420 $27,483 $25,007 $26,288 $25,312 Equity $85,465 $94,652 $92,109 $102,113 $104,978 Debt/ Debt+Equity 0.20 0.23 0.21 0.20 0.19 *Excludes minor adjustments for "fair value asset (liability) of hedges related to finance debt"
2006 2007 2008 2009 Q1 2009 Q1 2010
Operating Cash Flow $28,172 $24,709 $38,095 $27,716 $5,572 $7,693 Cap Ex $15,125 $17,830 $22,658 $20,650 $4,817 $4,289 Dividends $7,969 $8,333 $10,767 $10,899 $2,730 $2,629
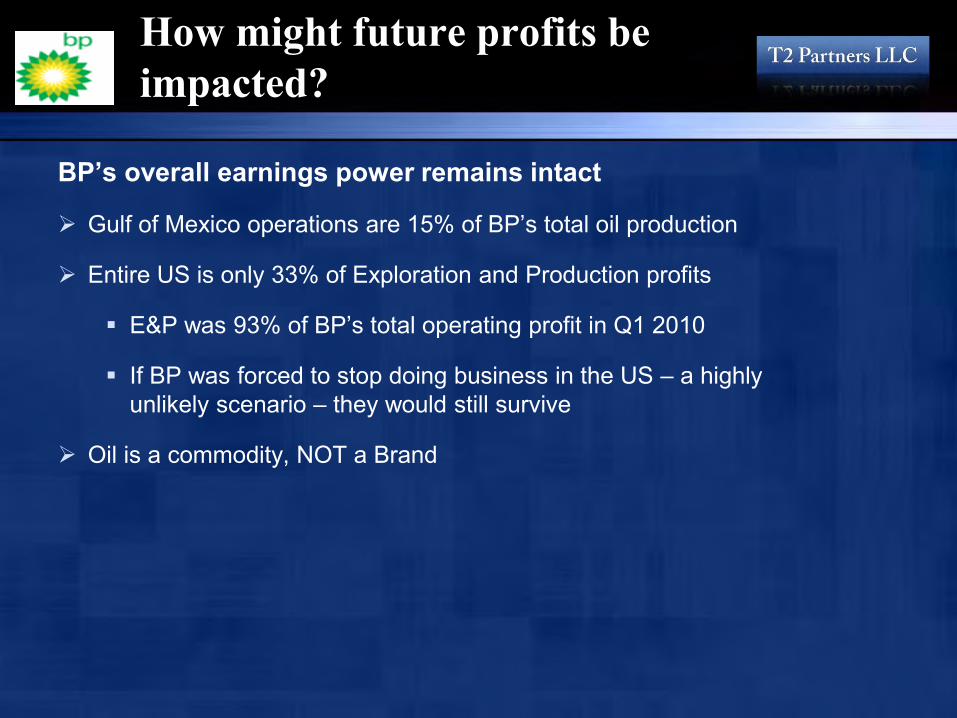
How might future profits be impacted?
BP’s overall earnings power remains intact
Gulf of Mexico operations are 15% of BP’s total oil production
Entire US is only 33% of Exploration and Production profits
E&P was 93% of BP’s total operating profit in Q1 2010
If BP was forced to stop doing business in the US – a highly unlikely scenario – they would still survive
Oil is a commodity, NOT a Brand
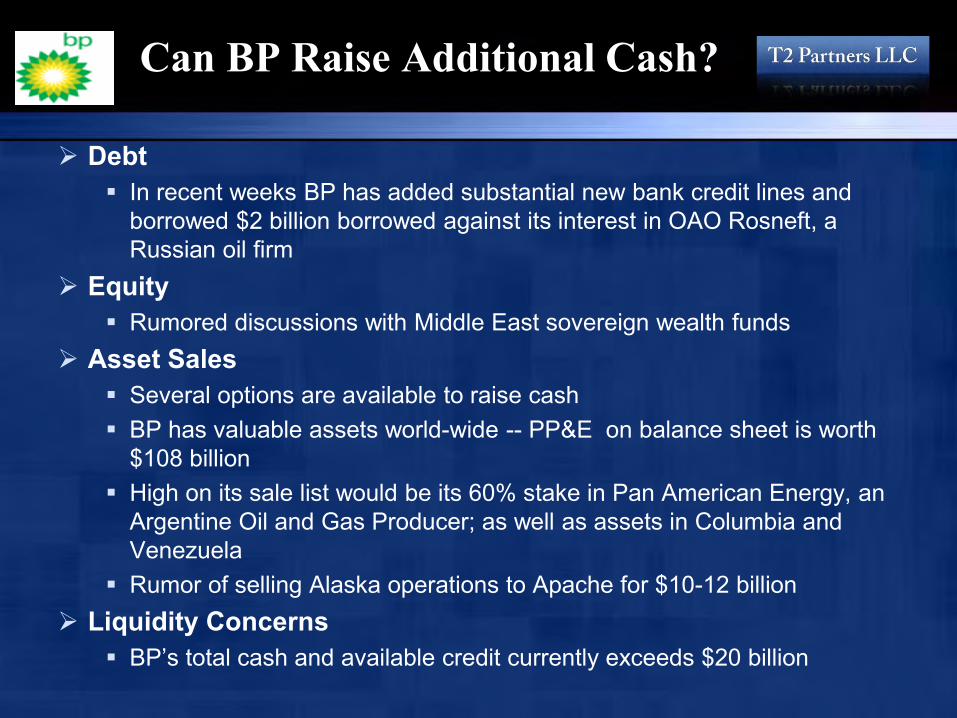
Can BP Raise Additional Cash?
Debt In recent weeks BP has added substantial new bank credit lines and
borrowed $2 billion borrowed against its interest in OAO Rosneft, a Russian oil firm
Equity Rumored discussions with Middle East sovereign wealth funds
Asset Sales Several options are available to raise cash BP has valuable assets world-wide -- PP&E on balance sheet is worth
$108 billion High on its sale list would be its 60% stake in Pan American Energy, an
Argentine Oil and Gas Producer; as well as assets in Columbia and Venezuela
Rumor of selling Alaska operations to Apache for $10-12 billion Liquidity Concerns
BP’s total cash and available credit currently exceeds $20 billion
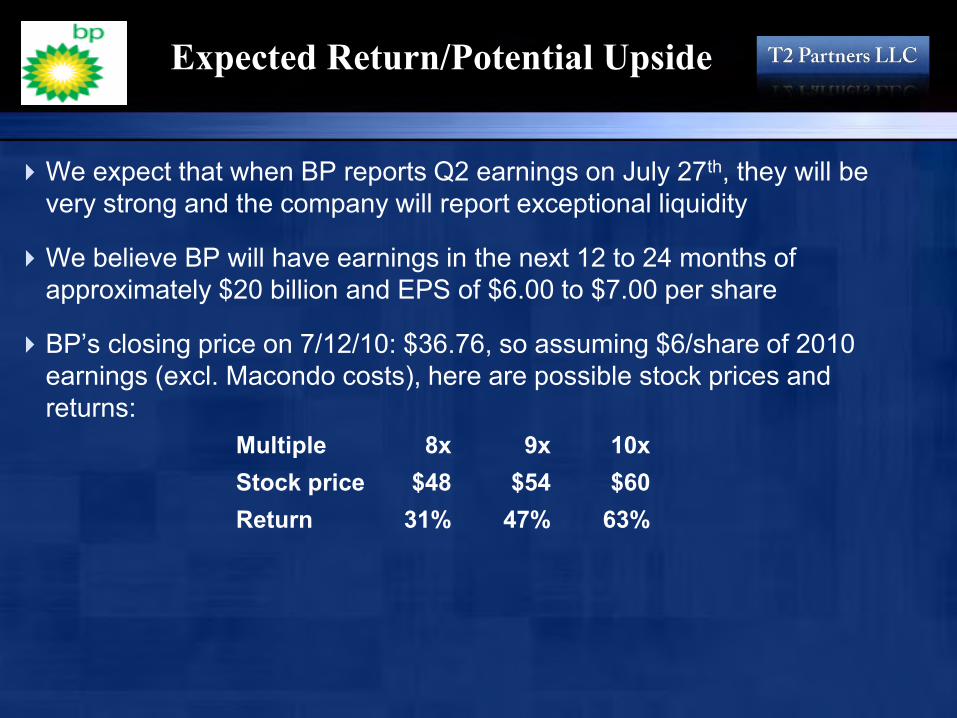
Expected Return/Potential Upside
We expect that when BP reports Q2 earnings on July 27th, they will be very strong and the company will report exceptional liquidity
We believe BP will have earnings in the next 12 to 24 months of approximately $20 billion and EPS of $6.00 to $7.00 per share
BP’s closing price on 7/12/10: $36.76, so assuming $6/share of 2010 earnings (excl. Macondo costs), here are possible stock prices and returns:
Multiple 8x 9x 10x Stock price $48 $54 $60 Return 31% 47% 63%

Questions?