Embed Size (px)
Citation preview

IN THIS ISSUE...
ASSOCIATION NEWS
1
YOUR BOTTOM LINE
10
GENERAL BUSINESS NEWS
15
CALENDAR
41
Registration StillClimbing for 2004Management Conference
Tile ManagementQuarterly
Vol. III, No. III September 2004
Published by
Remember toforward to your employees!
________________________________________________________________________________________________________________________________________________________________________________________________________
Registrations are still arriving dailyfor the 2004 Management Conferenceto be held November 4-7 in Cancun,Mexico. With 225 people alreadyregistered, it should be one of the morememorable events of CTDA's educationalyear.
World-class speakers such asCharlie Plumb, Jonathan Trivers, AlBates, and Jack Daly will be on handwith tips to grow your business andprepare for the changes ahead. But thehighlight of every CTDA event is theunique networking opportunitiesavailable during the conference. Notonly will the owners and managers ofthe top distribution companies in thecountry be in attendance, but the uppermanagement of the leadingmanufacturers will also be present. Addto this international associationrepresentatives, press, and invited guests,
and you have a who's who of the ceramictile industry.
CTDA's annual Hall of Fameinductions for Sam Widener and S.M.Van Kirk will be a part of Thursday'sschedule and you can try your luck atwinning $1,000,000 in the golf hole-in-one contest on Saturday.
In addition to the JW Marriott'snumerous amenities designed to fillyour free time, Cancun affordsManagement Conference attendees anumber of additional diversions: deepsea fishing, a snorkeling adventure withyour own watercraft, archeological tours,and a Saturday evening fiesta completewith games and prizes.
If you haven't registered yet, space isstill available!
For more information:Please visit our website at
www.ctdahome.org for completeconference information. See you there!

Tile Management Quarterly2
CTDA Holds the Summer Boardand Committee Meetings
In late August, members of the CTDA Board of Directorsand committees gathered in Chicago for the summer meetings.Held the weekend of the Chicago Air and Water Show, it gaveparticipants an opportunity for a family getaway too!
A very special ceremony was held for CTDA legal counselBill Ives. Many of you know of Mr. Ives' love of eating,especially chocolate (and Starbucks coffee too!). At thesummer meeting in 2003, Mr. Ives availed himself of theentire piece of chocolate cake from the group sampler dessertplatter at Smith and Wollensky. He was unable to attend thedinner there this year--we think he was afraid we would pullsome silly stunt reminiscent of his 2003 antics--so we decidedto bring the stunt to him the next morning.
Executive Director Rick Church presented Mr. Ives witha challenge: if he could eat an entire Smith and Wollenskychocolate cake (all 5 layers and 40 pounds of it) by 4:00 p.m.,he would be rewarded with a cash prize!
Much to our disappointment, Mr. Ives turned down thechallenge, but happily served everyone cake for the morningbreak!
We can't wait to see what he comes up with for retributionnext summer!
If you want to be there in person, sign up today toparticipate on a CTDA committee. Committees meet 4 timesa year: January (prior to Surfaces), May (prior to Coverings),August (in Chicago), and November (at the ManagementConference).
Tile Management Quarterly3
CTDA Sponsors Make It Happen
We are so very pleased to announcethe following sponsors for the 2004Management Conference. As you know,our conference is made possible eachyear by their commitment to educationin our industry.
Please thank them for theircontinued support!
PlatinumCeramic Tiles of ItalyCoveringsCrossville Ceramics CompanyDal-Tile Corp./American OleanLaticrete International, Inc.Laufen/USMAPEI CorporationTEC Specialty Products, Inc.Tile of SpainTurkish Ceramic Association
GoldAqua Mix, Inc.Azuvi/Classic Ceramic TileDancik International, Ltd.Kale EksportNational Gypsum CompanyProphet 21Schechner Lifson CorporationSchluter Systems L.P.United States Gypsum CorporationVitra USA
SilverBonsal/Fin PanFlorida TileSGM
BronzeGeorgia-PacificNational Metal ShapesNoble Company
Golf AwardsAqua Mix, Inc.
Golf HoleEPC America
Golf Beverage CartSchechner Lifson Corporation
Honorable MentionCeramic Tile and Stone Consultants
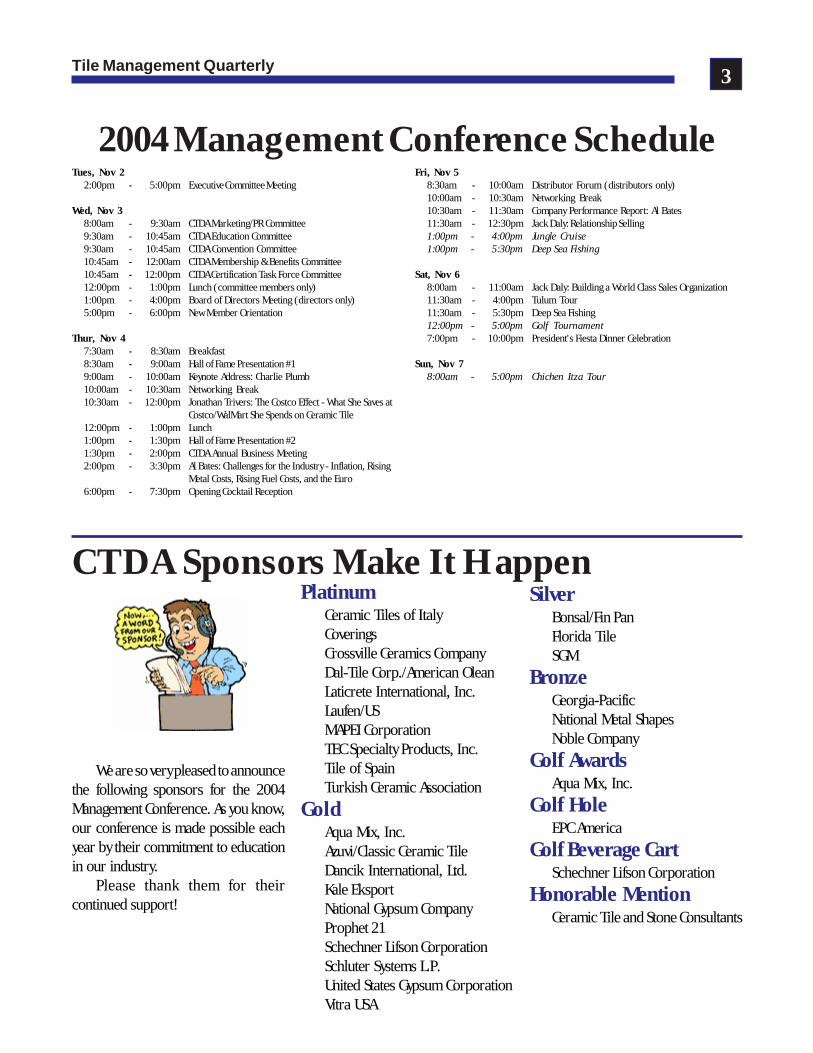
Tues, Nov 22:00pm - 5:00pm Executive Committee Meeting
Wed, Nov 38:00am - 9:30am CTDA Marketing/PR Committee9:30am - 10:45am CTDA Education Committee9:30am - 10:45am CTDA Convention Committee10:45am - 12:00am CTDA Membership & Benefits Committee10:45am - 12:00pm CTDA Certification Task Force Committee12:00pm - 1:00pm Lunch (committee members only)1:00pm - 4:00pm Board of Directors Meeting (directors only)5:00pm - 6:00pm New Member Orientation
Thur, Nov 47:30am - 8:30am Breakfast8:30am - 9:00am Hall of Fame Presentation #19:00am - 10:00am Keynote Address: Charlie Plumb10:00am - 10:30am Networking Break10:30am - 12:00pm Jonathan Trivers: The Costco Effect - What She Saves at
Costco/WalMart She Spends on Ceramic Tile12:00pm - 1:00pm Lunch1:00pm - 1:30pm Hall of Fame Presentation #21:30pm - 2:00pm CTDA Annual Business Meeting2:00pm - 3:30pm Al Bates: Challenges for the Industry - Inflation, Rising
Metal Costs, Rising Fuel Costs, and the Euro6:00pm - 7:30pm Opening Cocktail Reception
2004 Management Conference ScheduleFri, Nov 5
8:30am - 10:00am Distributor Forum (distributors only)10:00am - 10:30am Networking Break10:30am - 11:30am Company Performance Report: Al Bates11:30am - 12:30pm Jack Daly: Relationship Selling1:00pm - 4:00pm Jungle Cruise1:00pm - 5:30pm Deep Sea Fishing
Sat, Nov 68:00am - 11:00am Jack Daly: Building a World Class Sales Organization11:30am - 4:00pm Tulum Tour11:30am - 5:30pm Deep Sea Fishing12:00pm - 5:00pm Golf Tournament7:00pm - 10:00pm President's Fiesta Dinner Celebration
Sun, Nov 78:00am - 5:00pm Chichen Itza Tour
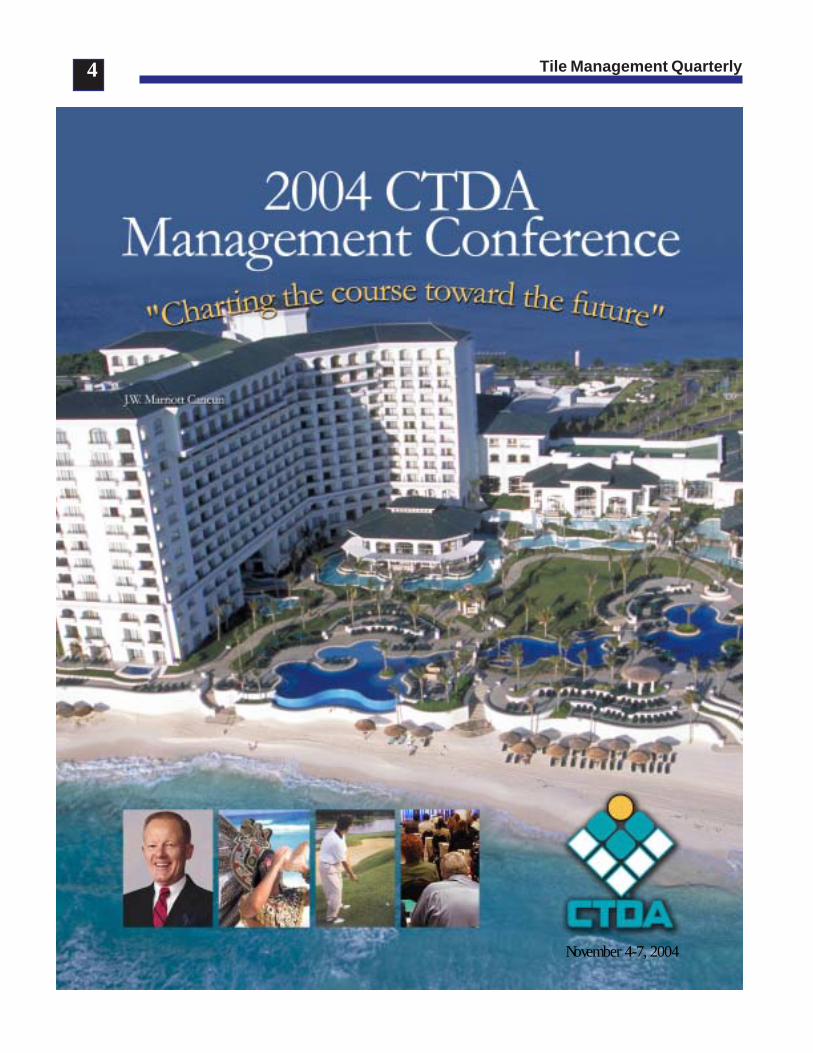
Tile Management Quarterly4
November 4-7, 2004

Tile Management Quarterly5
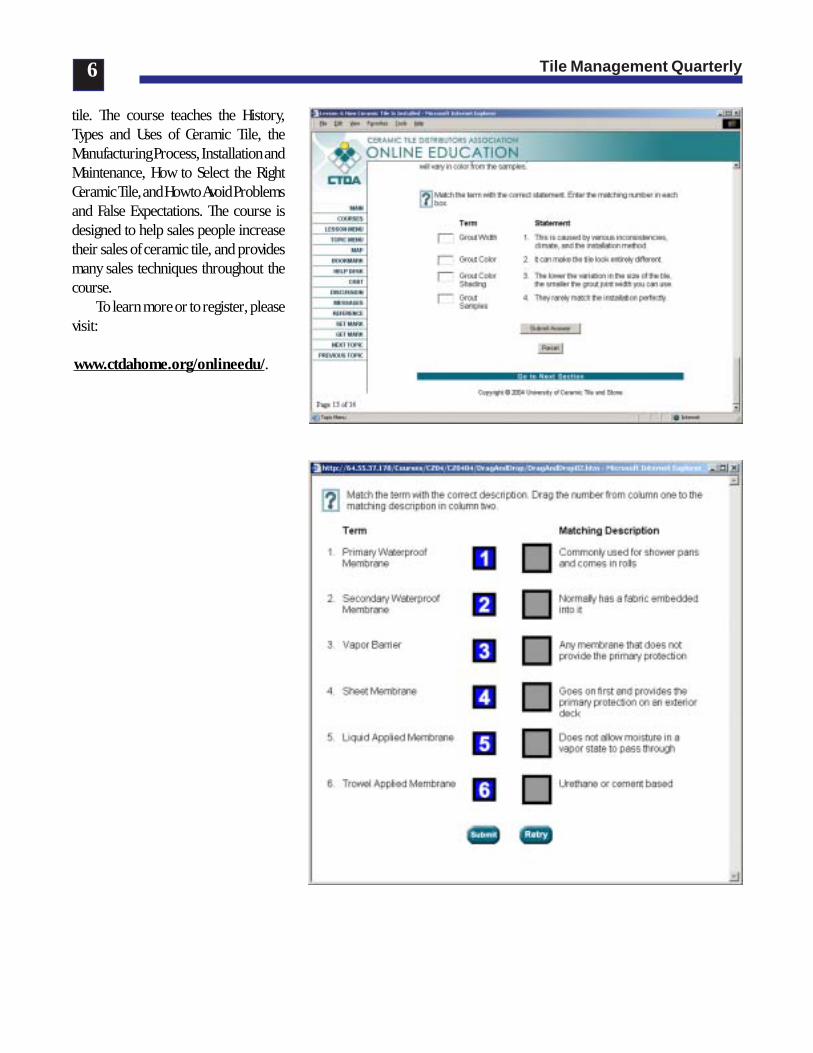
CTDA members have asked foreducational programs on ceramic tilethat they could offer to their employees,and now we have them as a discountedCTDA membership benefit. CTDA andthe University of Ceramic Tile and Stone(U of CTS) have joined to develop aseries of educational programs to helpceramic tile distributor and dealeremployees be more effective at theirjobs.
CTDA Online EducationalCourses:• Teach your employees the basics of
ceramic tile with selling tips• Give your employees credibility with
your customers• Sell more tile with more upgrades• Available on the internet for 14
days, 24/7 (any time at home or atwork)
• No lost employee productivity timeor travel expenses
• Self-paced interactive course - comeand go as you please at your ownrate.
• Enjoyable experience and veryeffective at teaching
• Student prints their own diplomaupon completion
• Group Managers get reports onstudents’ progress and results
• All you need is a computer andaccess to the internet
Understanding the Basics ofCeramic Tile is a ceramic tile coursefor new employees and those who haven’thad the opportunity to learn about thehistory and all the aspects of ceramic
CTDA Announces New On-LineCeramic Tile Training
Tile Management Quarterly6
tile. The course teaches the History,Types and Uses of Ceramic Tile, theManufacturing Process, Installation andMaintenance, How to Select the RightCeramic Tile, and How to Avoid Problemsand False Expectations. The course isdesigned to help sales people increasetheir sales of ceramic tile, and providesmany sales techniques throughout thecourse.
To learn more or to register, pleasevisit:
www.ctdahome.org/onlineedu/.
Tile Management Quarterly7
In August of this year, the CTDA Strategic Planning Committee met in Chicago, Illinois for two long days planning the futureof CTDA. At the end of the second day, a working document was finalized and approved by the Board of Directors in September.Below is the result of their work. Please review and forward any comments to the CTDA staff and be ready to do your partto help CTDA reach newer and greater heights in the years ahead.
CTDA is the leading source ofknowledge, networking and educational opportunities
to grow the ceramic tile and stone industry
Value Create recognition for the value CTDA delivers to its members.Objective #1: Increase awareness of all CTDA programs in 2005. Measure success by benchmarking against 2004 strategic
planning survey results.Objective #2: Achieve 85% or greater membership retention annually and achieve net 5% increase in membership annually.Objective #3: In all CTDA programs, develop awareness level of at least 80% by end of first year; 90% by end of second year.Objective #4: In 2005, research possibilities of group health insurance coverage for CTDA members. Report findings to
Board for consideration.
Networking Maximize networking opportunities for members.Objective #1: Annually host a Management Conference for distributors and suppliers of ceramic tile, stone and related
products.Objective #2: Annually participate in Coverings with a booth, reception and as a host of educational programming.Objective #3: Publish six issues of TileDealer magazine in 2005.Objective #4: Annually publish a directory listing all members of the association, their contact information and products
they make/sell.
Education Provide quality educational events and tools to the industry.Objective #1: In 2005, implement online educational courses for CTDA members and their employees to learn the basics
of ceramic tile and stone.Objective #2: Continue to offer Tile Training in a Box and Shade Variation programs to members and non-members.Objective #3: In 2005, launch a certification program for ceramic tile and stone salespeople.Objective #4: Annually survey and publish aggregate operational and financial data of distributors. (CPR Report)Objective #5: Annually survey and publish aggregate profile data on distributor’s businesses including product trends,
company size, etc.Objective #6: In 2005, hold at least one session at Management Conference focused on specific industry issues like:
moisture intrusion, green building, installation techniques, etc.Objective #7: Charge Education Committee in 2005 with developing recommendations to deliver industry specific education
on environmental and installation issues.
CTDA Strategic Plan 2004
Tile Management Quarterly8
Stone Enhance existing tools and develop new ones for use by the stone segment of the industry.Objective #1: In 2005, develop a Committee to re-purpose all existing materials and tools to include stone and stone related
products.Objective #2: In 2005, consider renaming CTDA to more formally include stone.
Localization Deliver value to members through local/regional meetings and educationalevents.
Objective #1: Host four local one day conferences in 2005 with a minimum total attendance of 200.
Consumer Pull Through Create tools to develop consumer demand for products suppliedby the tile and stone industry.
Objective #1: In 2005, develop an online design center for consumers on CTDA’s website and connect consumers interestedin specific brands of tile with distributors that carry those brands.
Online Identify and plan for online opportunities that will create efficiencies and enhance thebusinesses of our members.
Objective #1: In 2005, develop a committee to develop, consider and recommend opportunities for online efficiencies tothe CTDA Board of Directors.
Objective #2: Online Committee should make several recommendations at least one of which is implemented by CTDA Boardin 2006 budget.
Objective #3: Establish ERC as the CEO desktop for the ceramic tile and stone industry by the end of 2005.
How Much Can You Put In One Box? We Put An Entire Industry In This One…
CTDA Training in a Box is an easy, affordable way to introduce a newcomer to the ceramic tile industry using a varietyof reading, audiovisual and sensory resource aids in an easy to use box, complete with a tabbed binder of information andresource information. Simply place the labels provided on your own tile, andtraining is ready to begin!
Training Guide Deluxe Program (with 4 videos)1-5 copies $189.00 each 1-5 copies $239.006-10 copies $129.00 each 6-10 copies $179.00 each11+ copies $99.00 each 11+ copies $149.00 each
Available to non-CTDA members at $399.00
Visit www.ctdahome.org to order your copy today!

Tile Management Quarterly9
Education CommitteeThe Education Committee finalized
plans for the on-line training and willhave the program available to membersby the Management Conference.
Membership & BenefitsCommitteeThe Membership and Benefits Committeecontinued their discussion ofcommunications with members and arelooking into new benefits to offer.
Marketing CommitteeThe Marketing Committee reviewed
TileDealer Magazine and offeredguidance for the 2005 editorial calendar.
Certification Task ForceThe Task Force has begun the beta-
testing phase of the CertificationProgram. Look for more informationcoming soon.
Convention PlanningCommittee
The committee finalized the detailsfor the November conference and begandiscussions on 2005.
They are also working on plans forthe booth and reception at Coverings2005. More details to come.
Board of DirectorsThe Board of Directors reviewed
the draft Strategic Planning and begandiscussions regarding the 2005 budgetto be adopted at their November meeting.
CTDA Board of Directors andCommittee Updates
2004 Fall Committee Meeting ScheduleAll meetings will be held in Cancun, Mexico. For more information, please
contact the CTDA office.Executive Committee Tuesday, November 3 2:00-6:00 p.m.Marketing/PR Committee Wednesday, November 4 8:00-9:30 a.m.Education Committee Wednesday, November 4 9:30-10:45 a.m.Convention Planning Committee Wednesday, November 4 9:30-10:45 a.m.Membership & Benefits Committee Wednesday, November 4 10:45 – 12:00
noonCertification Committee Wednesday, November 4 10:45 – 12:00 noonLuncheon Wednesday, November 4 12:00-1:00 p.m.Board of Directors Wednesday, November 4 1:00 – 4:00 p.m.
2005 Winter Committee Meeting ScheduleAll meetings will be held in Las Vegas, Nevada. For more information, please
contact the CTDA office.Executive Committee Tuesday, January 25 10:00 a.m.-1:00 p.m.Marketing/PR Committee Tuesday, January 25 1:00-2:30 p.m.Education Committee Tuesday, January 25 2:30-3:45 p.m.Convention Planning Committee Tuesday, January 25 2:30-3:45 p.m.Membership & Benefits Committee Tuesday, January 25 3:45 – 4:30 p.m.Certification Committee Tuesday, January 25 3:45 – 4:30 p.m.Board of Directors Tuesday, January 25 4:30 – 7:00 p.m.
If you are interested in serving on a committee, pleasecontact the CTDA office at 1-800-938-CTDA(2832), [email protected]

Tile Management Quarterly10
Most CTDA members continue tooperate under price pressures. Eventhough the economy has turned up,there is a relentless push by customersfor an extra discount. Far too manyfirms simply lower the price and moveon.
This report will examine two keyissues with regard to the price/volumerelationship:• The Sales Volume Challenge—
Measurement of the volume increaserequired by the typical CTDAmember to offset a price decrease.
• Holding the Line on Prices—Suggestions regarding specificprocedures for holding the line onprice.The first of these is extremely
quantitative. It demonstrates quiteclearly the futility of chasing additionalvolume. The second is much morequalitative in nature. It probes the areasof action that are likely to have thelargest payoff in controlling pricereductions.
The Sales Volume ChallengeFar too many decision makers view
price cutting benignly or even favorably.In part this is a function of the continualpressures on margin faced by firmsevery day. If everybody is asking forprice reductions, the concept becomesa way of life. It is also due to the fact thatsome firms that have successfully used
Profit Improvement Report:
price as a competitive tool. In particular,Wal-Mart and Dell Computer arecommonly presented in the businesspress as role models for success.
The truth is that CTDA membersface a very different cost structure thaneither Wal-Mart or Dell. The uniquestructure of expenses in the industrymakes it extremely difficult to employprice cutting successfully without asignificant change in operations.
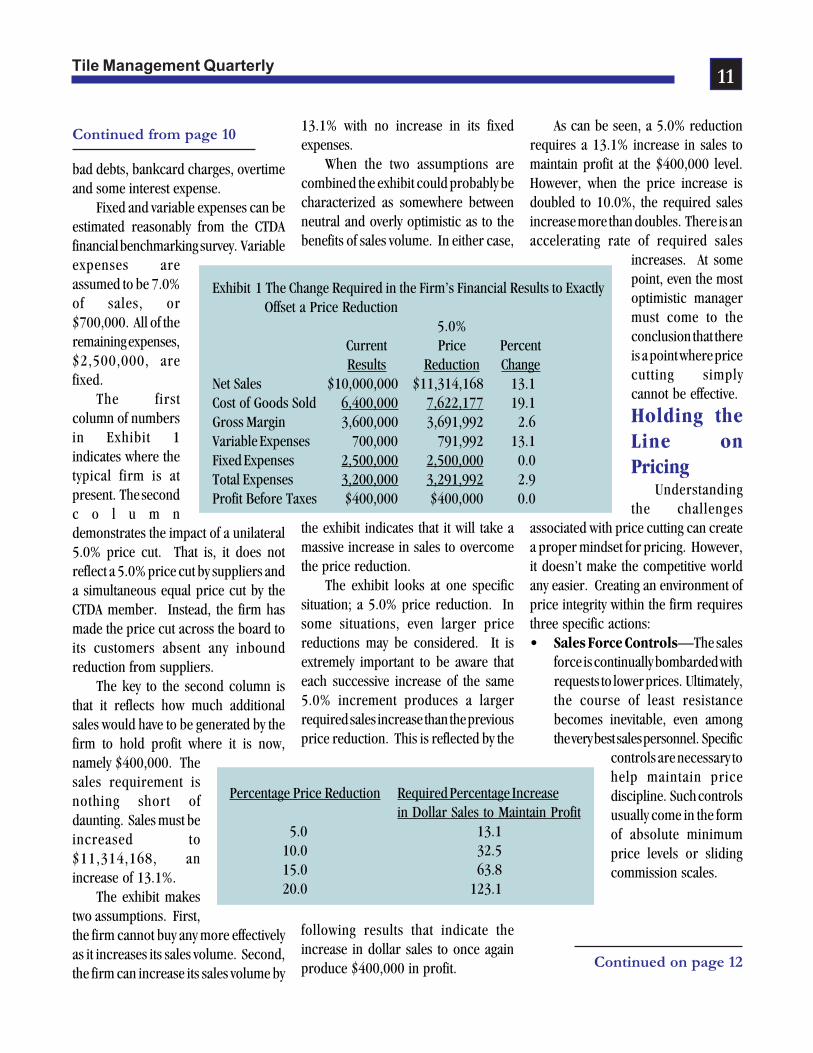
Exhibit 1 looks at the operation ofthe typical CTDA member. According tothe most recent CTDA financialbenchmarking survey, this firm generates$10,000,000 in sales volume, operateson a gross margin of 36.0% and producesa pre-tax profit of $400,000, or 4.0% ofsales.
In addition, the firm has both fixedand variable expenses as part of itsfinancial profile. Fixed expensesrepresent the commitments that mustbe made so that the firm can conductbusiness, including rent, maintenanceand related expenses. It also includesvirtually all salaries and associated fringebenefits.
In sharp contrast, variable expensesrepresent the incremental costs ofgenerating additional sales. Typically,these will include sales commissions,
Al Bates, Profit PlanningGroup, Inc.
YourBottomLine
Continued on page 11
Making It UpWith Volume
Tile Management Quarterly11
bad debts, bankcard charges, overtimeand some interest expense.
Fixed and variable expenses can beestimated reasonably from the CTDAfinancial benchmarking survey. Variableexpenses areassumed to be 7.0%of sales, or$700,000. All of theremaining expenses,$2,500,000, arefixed.
The firstcolumn of numbersin Exhibit 1indicates where thetypical firm is atpresent. The secondc o l u m ndemonstrates the impact of a unilateral5.0% price cut. That is, it does notreflect a 5.0% price cut by suppliers anda simultaneous equal price cut by theCTDA member. Instead, the firm hasmade the price cut across the board toits customers absent any inboundreduction from suppliers.
The key to the second column isthat it reflects how much additionalsales would have to be generated by thefirm to hold profit where it is now,namely $400,000. Thesales requirement isnothing short ofdaunting. Sales must beincreased to$11,314,168, anincrease of 13.1%.
The exhibit makestwo assumptions. First,the firm cannot buy any more effectivelyas it increases its sales volume. Second,the firm can increase its sales volume by
13.1% with no increase in its fixedexpenses.
When the two assumptions arecombined the exhibit could probably becharacterized as somewhere betweenneutral and overly optimistic as to thebenefits of sales volume. In either case,
the exhibit indicates that it will take amassive increase in sales to overcomethe price reduction.
The exhibit looks at one specificsituation; a 5.0% price reduction. Insome situations, even larger pricereductions may be considered. It isextremely important to be aware thateach successive increase of the same5.0% increment produces a largerrequired sales increase than the previousprice reduction. This is reflected by the
following results that indicate theincrease in dollar sales to once againproduce $400,000 in profit.
As can be seen, a 5.0% reductionrequires a 13.1% increase in sales tomaintain profit at the $400,000 level.However, when the price increase isdoubled to 10.0%, the required salesincrease more than doubles. There is anaccelerating rate of required sales
increases. At somepoint, even the mostoptimistic managermust come to theconclusion that thereis a point where pricecutting simplycannot be effective.
Holding theLine onPricing
Understandingthe challenges
associated with price cutting can createa proper mindset for pricing. However,it doesn’t make the competitive worldany easier. Creating an environment ofprice integrity within the firm requiresthree specific actions:• Sales Force Controls—The sales
force is continually bombarded withrequests to lower prices. Ultimately,the course of least resistancebecomes inevitable, even amongthe very best sales personnel. Specific
controls are necessary tohelp maintain pricediscipline. Such controlsusually come in the formof absolute minimumprice levels or slidingcommission scales.
Continued from page 10
Continued on page 12
Percentage Price Reduction Required Percentage Increasein Dollar Sales to Maintain Profit
5.0 13.110.0 32.515.0 63.820.0 123.1
Exhibit 1 The Change Required in the Firm’s Financial Results to Exactly Offset a Price Reduction
5.0%Current Price PercentResults Reduction Change
Net Sales $10,000,000 $11,314,168 13.1Cost of Goods Sold 6,400,000 7,622,177 19.1Gross Margin 3,600,000 3,691,992 2.6Variable Expenses 700,000 791,992 13.1Fixed Expenses 2,500,000 2,500,000 0.0Total Expenses 3,200,000 3,291,992 2.9Profit Before Taxes $400,000 $400,000 0.0
Tile Management Quarterly12
Continued from page 11
• Margin Enhancements—Most ofthe severe price competition isfocused on the commodity end ofthe product line. At the slow-moving end of the assortment thereare numerous opportunities to buildmargin back. There should be nohesitation in doing so in instanceswhere product availability on slowsellers is a major value being added.
• Employee Education—There issometimes the tendency to view thepricing challenge as being entirelythe responsibility of the sales force.In point of fact, numerousemployees impact margin in actionsranging from buying moreeffectively to controlling damagedgoods and shrinkage. Everyemployee needs to be aware of themargin issue.
Moving ForwardPrice pressures are not going to go
away any time soon. To continue to besuccessful, CTDA members must makesure that every decision maker in thefirm understands the impact that pricecutting has on performance and therather massive sales increase that itmandates.
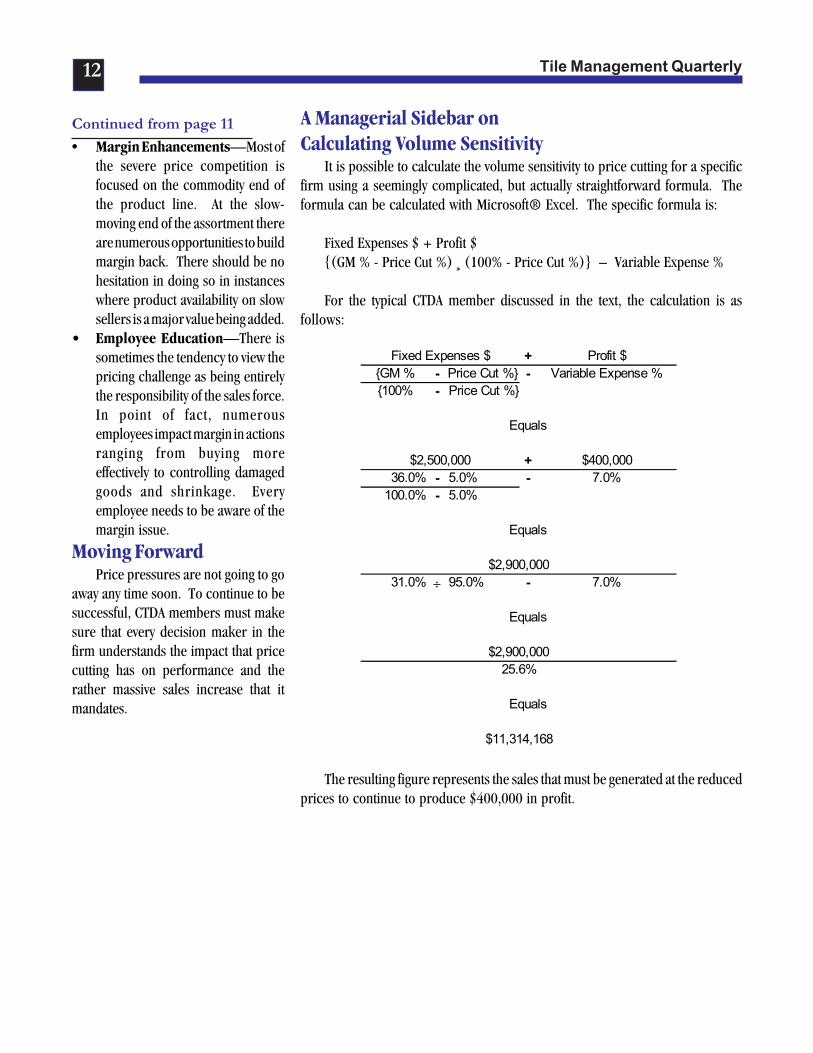
A Managerial Sidebar onCalculating Volume Sensitivity
It is possible to calculate the volume sensitivity to price cutting for a specificfirm using a seemingly complicated, but actually straightforward formula. Theformula can be calculated with Microsoft® Excel. The specific formula is:
Fixed Expenses $ + Profit ${(GM % - Price Cut %) ¸ (100% - Price Cut %)} – Variable Expense %
For the typical CTDA member discussed in the text, the calculation is asfollows:
The resulting figure represents the sales that must be generated at the reducedprices to continue to produce $400,000 in profit.
+{GM % - Price Cut %} -{100% - Price Cut %}
Equals
+36.0% - 5.0% -
100.0% - 5.0%
Equals
31.0% ÷ 95.0% -
Equals
Equals
Profit $
$2,500,000 $400,000
Variable Expense %
$11,314,168
25.6%
7.0%
7.0%$2,900,000
$2,900,000
Fixed Expenses $

Tile Management Quarterly13
cement tough
Cementitious core
Fiberglass mesh
Double wrappedEdgeTech® design
Cementitious core
Fiberglass mesh
Double wrappedEdgeTech® design
NationalGypsumhas the best
cementboardfor your next project.
NationalGypsumhas the best
cementboardfor your next project.
Applications• Tub surrounds• Shower enclosures• Garden tubs• Countertops• Floor underlayment• Radius construction
(with PermaBase Flex)
Features• Fastens closer to edge• Easiest to cut• Low water absorption• Interior and exterior
use• 30-year limited
warranty
For technical information, call: 1-800-NATIONAL
(1-800-628-4662)or visit our website at:www.nationalgypsum.com

Tile Management Quarterly14
Many of us have by now read JimCollins terrific business book Good toGreat. If you haven’t, we recommenddoing so. This article is not about thebook, but rather about the cover storyfrom the May issue of Fast Companymagazine, which keys on the five yearold JetBlue airline. The question posedis can CEO David Neeleman make itgreat?
A year ago, Fast Company published10 make-or-break questions thataddressed what a fast company is today.Here they are repeated:1. Does your company create an
emotional bond with itscustomers?
2. Does your strategy stand outfrom the crowd?
3. Is your company a fun place towork-and a fun organization todo business with?
4. Are you built to change?5. Do you embrace the value of
values?6. Are you as disciplined, as you
are creative?7. Are you winning the battle for
talent?8. Do you use technology to change
expectations and reshape yourbusiness?
9. Are you built for speed?10. Have you built a company of
leaders?Editor John Byrne believes Jet Blue
meets every one of these tests ( if you’veyet to experience the JetBlue airline, putit on your to-do list). John states it stillmust meet one more and most difficult
GOOD TO GREAT…ARE YOUAND YOUR COMPANY READY?Jack Daly www.ProfessionalSalesCoach.net
of all: 11. Can you Scale? Of the manyhundreds of articles I have read over thepast several months, this was one of thebest. Here are some of the take-aways:
JetBlue has put together 12consecutive profitable quarters, and isreporting among the industry’s bestoperating margins, the highestpercentage of seats filled, and one of thetop rates for on-time arrivals. It’sintroducing a new plane every 3 weeks-and next year will be adding one every 10days. Comparable growth companiescited include Starbucks, Dell, andAmazon. These companies depend onflexibility, speed, and a sense of intimacywith employees and customers alike.The challenge now is: is it scalable?
Some lessons learned-Do more for customers. “I don’t
care if they notice everything we do. Justas long as they notice something that’sdifferent about us.”
Only the paranoid survive.Neeleman is always on the lookout forcomplacency, particularly when thingsare going well. “When you’re makingmoney and good margins, you tend toget sloppy.”
Actions speak louder thanwords. Neeleman talks a lot aboutteamwork. When he flies, he helps flightattendants pass out snacks and staysbehind to clean the plane. “You can’task employees to do something youwouldn’t be willing to do yourself.”
The best culture polices itself.Competition is the ultimate
motivation. “People respond to thatchallenge.”
Employees have to understandthe business. “I always talk about thetripod- low costs, a great product, andcapitalization,” he says. “If everyonehere understands how important it is tomaintain each leg, you’ve got a verystable business model.”
Build a team of big thinkers.Since he has never run a large company,Neeleman has surrounded himself withsenior execs that have.
Don’t scale at the expense ofpeople. If a change hurts morale, it’snot worth it, because employees treatcustomers the way they’re treatedthemselves.
Stay small as you grow. JetBluetries to maintain the feel of a startup byhaving senior officers practice visibleleadership.
Propagate the culture. In a seriesof training courses, Neeleman and othersenior managers teach supervisors theprinciples they rely on to manage peopleand make decisions.
As it manages growth, the airlinemust standardize many other things itdoes to avoid starting from scratch everytime. For example, JetBlue has developeda checklist of what has to happenwhenever it enters a new market.Everyone has access to the list on thecompany intranet. Low costs remain anobsession. JetBlue’s reservation agents,for example, work from home ratherthan in an expensive call center.
Clearly Culture Rules. What are youdoing to proactively manage your culture?What systems and processes do you havein place to ensure an ongoing vibrantsuccess culture?

Tile Management Quarterly15
Housing Starts Return ToHighest Pace Of Year InAugust
Housing starts climbed back to thehighest pace of the year in August,reaching a seasonably adjusted annualrate of 2.0 million units, the U.S.Commerce Department reported.
The 2-million-unit pace, whichmatched the pace set in March, was 0.6percent above July’s upwardly revisedrate of 1.988 million. Total housingstarts were up by 10.4 percent on a year-to-date basis.
“Builders remain confident aboutthe market and are keeping up withstrong demand for single-family homesand condominiums,” said BobbyRayburn, president of the NationalAssociation of Home Builders (NAHB)and a home and apartment builder fromJackson, Miss. “However, builders aremanaging their production schedulescarefully and cutting back slightly on thenumber of new building permits.”
Issuance of total building permitsdecreased 5.5 percent from the upwardlyrevised July pace to a seasonably adjustedrate of 1.952 million units. However,permits are up by 10 percent on a year-to-date basis.
“The housing market recently hasbeen buoyed by a healthy combinationof strong demographics, improvingemployment and income growth and adownshift in long-term interest rates,”said NAHB Chief Economist DavidSeiders. “Naysayers talking about ahousing bubble should look at thefundamentals that are in place and seethat the national housing market isextremely sound.”
For the month, single-family housingstarts increased 0.4 percent to a pace of
GeneralBusinessNews
1.667 million. This was an 11.6 percentincrease over the August 2003 pace.Multifamily housing starts increased toa seasonally adjusted rate of 333,000units, 1.5 percent above the July pace,but 2.3 percent below a year earlier.
“Starts are likely to slip a bit in thefourth quarter as interest rates firm up,but it’s now clear that single-familyhome production will hit a new annualrecord in 2004,” Seiders added.
Construction of new homes andapartments increased across all regionsbut the West for the month. The Westdecreased 4.7 percent in August followinga surge in new construction the monthbefore. The Northeast increased 6.5percent, the Midwest increased 4.8percent and the South increased 1.0percent for the month.
Single-family permit issuancedecreased by 3.0 percent and multifamilypermits were down 13.8 percent fromthe July pace.
Builder Confidence Down,But Not Out In September
Following a strong bump-up inAugust, builder confidence in the marketfor new single-family homes edged downthis month but remained within thenarrow range maintained since this timelast year, according to the latest NationalAssociation of Home Builders/WellsFargo Housing Market Index (HMI).The seasonally adjusted monthly gaugeof builder sentiment registered a 68 forSeptember, down three points from itsmonth-ago reading.
“This is exactly on par with theindex’s year-ago standing, and showsthat, in the midst of a particularlydevastating hurricane season, builderconfidence is essentially unshaken,” said
Continued on page 16
Tile Management Quarterly16
Bobby Rayburn, NAHB president and ahome and apartment builder fromJackson, Miss.
“Favorable financing conditions,sound house-price performance andreviving consumer confidence continueto propel the single-family market,”agreed NAHB Chief Economist DavidSeiders. “Builders are still reportinghealthy demand for new homes acrossmost markets, and that bodes well forsales in coming months.”
The NAHB/Wells Fargo HMI isderived from a monthly survey ofbuilders that NAHB has been conductingfor almost 20 years. Home builders areasked to rate current sales of single-family homes as “good,” “fair” or “poor.”They are also asked to rate traffic ofprospective buyers as “high to very high,”“average” or “low to very low.” Scoresfor responses to each component areused to calculate a seasonally adjustedindex, where any number over 50indicates that more builders view salesconditions as good than poor.
Following a four-point surge to 71in August, the HMI dropped back threepoints to the same range it has been infor the past year. Two out of three of thecomponent indexes – the one gaugingcurrent sales conditions and the onegauging traffic of prospective buyers –fell four points this time around, to 73and 52, respectively. The componentgauging expected sales in the next sixmonths declined three points to 75. Allare within close range of their year-agostandings in September 2003.
Continued from page 15
Continued on page 17
Builders Applaud NAFTASoftwood Ruling, Call ForQuick Elimination Of CostlyDuties
Hailing it as a major victory forhousing affordability and millions ofAmerican consumers who are feelingthe pinch of near-record lumber prices,the National Association of HomeBuilders (NAHB) today said that a NorthAmerican Free Trade Agreement paneldecision clears the way to removeburdensome tariffs on Canadian timber.
Countervailing and anti-dumpingduties totaling more than 27 percenthave been in place since May of 2002. Ofall the NAFTA and World TradeOrganization court rulings against thetariffs that have emerged since then,yesterday’s verdict represents by far themost significant development because ifthe U.S. can’t prove its contention thatCanadian lumber shipments threatenthe domestic industry, it must removethe duties it imposes on lumber fromCanada.
“For the third time, NAFTA hasunequivocally ruled that Canadian lumberimports present no harm to the domesticindustry. We call on the Administrationto refrain from any further legalmaneuvers or delays and allow thisdecision to be implemented within 10days, as ordered by the NAFTA panel.This would rescind the 27 percent levieson Canadian lumber and end the hiddentax imposed on American home buyersand renters,” said Bobby Rayburn,president of NAHB and a home andapartment builder from Jackson, Miss.
Twice previously, NAFTA haddetermined that the domestic lumberindustry’s threat of injury allegationswere baseless and contrary to law. In
each instance, the case was remandedback to the U.S. International TradeCommission.
In a strongly worded decisionreleased yesterday, the NAFTA panelclearly indicated that it had grown wearyof the ITC’s attempts to prove that U.S.lumber interests were harmed bycompetition from their northernneighbor.
The five-member NAFTA panel,which consists of three Americans andtwo Canadians, unanimously concludedthat the ITC was “simply unwilling toaccept this (NAFTA) panel’s review” and“has consistently ignored the authorityof this panel in an effort to preserve itsfinding of threat of material injury.”
The NAFTA panel ordered the ITC“to make a determination consistentwith the decision of this panel that theevidence on the record does not supporta finding of threat of material injury andto make that determination within 10days.”
Although the NAFTA panel notedthat the U.S. had no new evidence toback the claims of injury and that it“would be an exercise in futility” tofurther review the case, the U.S. couldstill appeal the ruling to an “extraordinarychallenge” committee.
“Such an action would merely be adelaying tactic,” said Rayburn, who notedthat NAFTA’s extraordinary challengeprovisions are only meant to be used formatters of gross misconduct, for whichthere is no legitimate claim in this case.
With the price of framing lumbernow at $473 per 1,000 board feet,according to Random Lengths – upmore than 40 percent from the beginningof the year and approaching the all-timehigh of $519 recorded in 1994 – Rayburn
Tile Management Quarterly17
Continued from page 16
noted that the NAFTA decision could nothave come at a better time.
“Rising building material costs,led by lumber, have added $5,000 to$7,000 to the cost of constructing anaverage new home,” he said. “The dutieshave artificially boosted lumber pricesand have helped line the pockets ofdomestic producers at the expense ofU.S. consumers. NAFTA hasunambiguously ruled that this case hasno merit. Therefore, the Administrationshould prevent this case from draggingout any further and allow these punitiveduties to disappear.”
Survey Reveals NationwideShortages Of Cement, OtherKey Building Materials
A shortage of cement and other keybuilding materials looms as the biggestthreat to the dynamic housing marketthat has produced record levels of newhome construction in the U.S., accordingto a recent survey conducted by theNational Association of Home Builders(NAHB).
“A nationwide survey conducted inJuly shows that builders are reportingshortages of cement, gypsum wallboard,oriented strand board (OSB), steelframing and insulating materials,” saidJerry Howard, executive vice presidentand CEO of NAHB. “Rising wholesaleprices of building materials have added$5,000 to $7,000 to the cost of buildingan average new home, and constructiondelays caused by supply shortages couldtranslate into further cost increases. Leftunchecked, these factors could result inserious disruptions to the housingmarket.”
Of most immediate concern iscement, with 41 percent of respondentsciting a shortage of this vital buildingmaterial. This is a huge jump from May,when 11 percent of those polled viewedthis as an issue. In March, only 3 percentof builders reported that cement was inshort supply.
To relieve the shortage, Howardcalled on the Administration to eliminatethe high anti-dumping duties on importsof Mexican cement.
Shortages first appeared this springin Florida, which imports about 40percent of its cement, compared with anationwide average of just 20 percent.Supplies subsequently tightened in otherregions partly because strong demandfrom China has diverted the amount ofcement available from other countriesand limited the number of cargo shipsthat can bring the product to U.S. ports.
Prohibitive duties have severelylimited supplies from Mexico, which isthe most logical source of supplementaryimports. A delivery from that countrytakes only four days, compared to anaverage of 44 days for a cement shipmentfrom Asia.
“With global shipping capacitystrained, the ability to import cementfrom Asia and Europe to meet thisshortfall has been significantly reduced,”said Howard. “Therefore, it makes senseto rescind the costly anti-dumping dutieson Mexican cement that are preventinga stable and reliable supply of importsto U.S. consumers.”
Twenty-six percent of those surveyedreported experiencing a shortage ofgypsum wall board, up from 11 percentlast October, 16 percent in March and19 percent in May.
Nearly one-third of respondentsare experiencing shortages of oriented
strand board and plywood, wood panelproducts used for wall sheathing, floorsand roofs. While this is a significantfigure, it is well below the peak of 52percent reported in last October’s survey.However, prices of those products remainhigh.
Insulation material is another sorespot for builders, as 20 percent noted alack of this product, compared to 10percent just four months earlier.
In a number of regions where brickis widely used, builders have reportedshortages of that material as well.
While framing lumber suppliesappear adequate, the larger concernamong builders in this area is pricevolatility. The price of 1,000 board feetof framing lumber hit a yearly high of$472 last week, up 52 percent from$311 a year ago, according to RandomLengths, a trade publication based inEugene, Ore.
Shortages of building materialshave also led to rising costs. During thepast six months, 90 percent ofrespondents reported paying higherprices for framing lumber and orientedstrand board, 88 percent for plywood,86 percent for cement, 80 percent forsteel, 75 percent for gypsum wall boardand 68 percent for insulation.
“A steady supply of buildingmaterials available at reasonable pricesis important to maintaining a vibranthousing market and to meeting thegrowing demand for affordable housing,”said Howard.
Tile Management Quarterly18
Continued on page 19
Distributors have started the journeyback to higher profits after the recentrecession. There is a feeling that evenif the good old days are not yet back, atleast they are on the horizon; business asusual is all that is needed.
In fact, “business as usual” willprobably not be close to good enough togenerate desired profit levels. Initialindications are that distributor profitsare going to bounce back, but to a levelthat is lower than in the past. There isalso an indication that the differencesbetween profitability winners and loserswill become even more pronounced inthe future.
In short, it is much more than atime for optimism. More fundamentally,it is a time to broaden the vision of thecompany. Distributors have the potentialto build profit relationships that willendure for the next decade. Doing sorequires taking action now.
This management report examinesthe profit opportunities and challengesfacing CTDA members. It does so bydrawing heavily upon the 2004 PROFITreport sponsored by CTDA. Two issueswill be examined:· The Profit Gap—The profitability
penalty that the typical firms pay incomparison to its more successfulbrethren.
· The Five Pillars of FinancialSuccess—An examination of theframework for action that firms
The Five Pillars of FinancialSuccess in Distribution(Implications from the PROFIT Report)Al Bates, Profit Planning Group, Inc.
need to adopt to ensure they notonly survive but also prosper in thefuture.
The Profit GapCTDA has always been a two-tiered
industry with regard to profitability.That is, there has always been ameasurable gap between the typical firmand the high-profit one. Such a gap isinevitable.
The concern is that the gap has nowreached a size that represents a long-term threat. The more successful firmsnot only generate higher profits today,but will be able to use their higherprofits to expandtheir market sharesignificantly in thefuture. It is asituation witho m i n o u simplications.
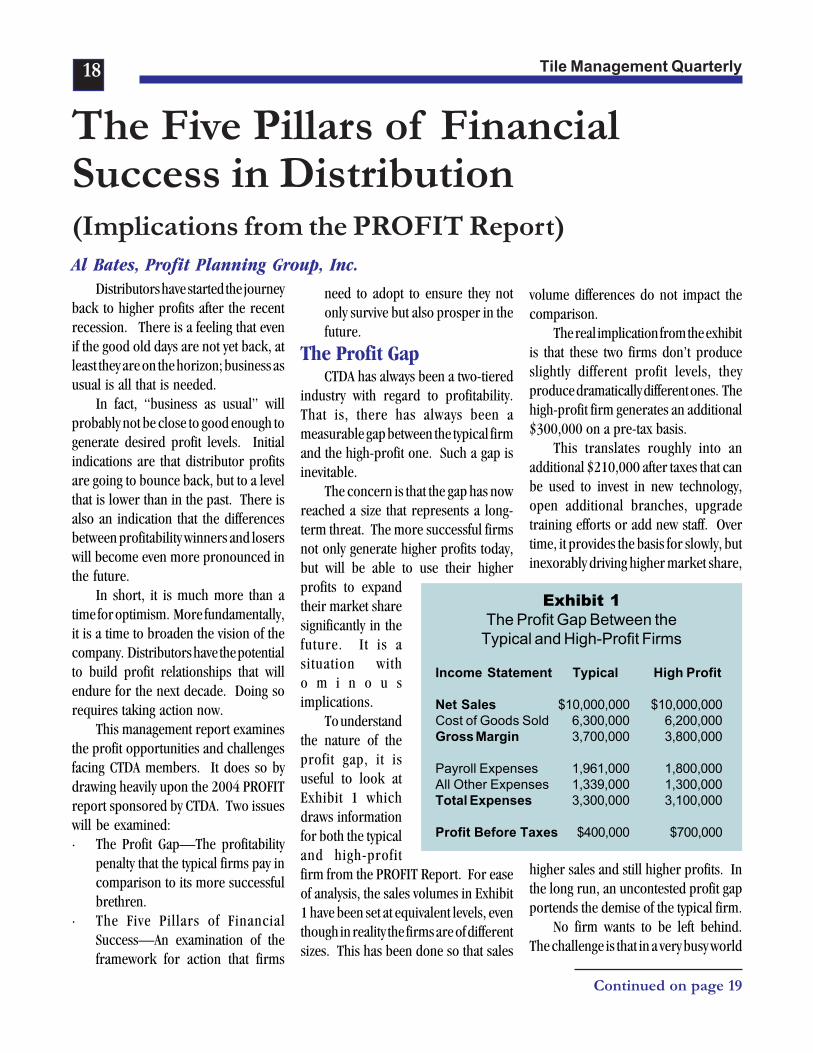
To understandthe nature of theprofit gap, it isuseful to look atExhibit 1 whichdraws informationfor both the typicaland high-profitfirm from the PROFIT Report. For easeof analysis, the sales volumes in Exhibit1 have been set at equivalent levels, eventhough in reality the firms are of differentsizes. This has been done so that sales
volume differences do not impact thecomparison.
The real implication from the exhibitis that these two firms don’t produceslightly different profit levels, theyproduce dramatically different ones. Thehigh-profit firm generates an additional$300,000 on a pre-tax basis.
This translates roughly into anadditional $210,000 after taxes that canbe used to invest in new technology,open additional branches, upgradetraining efforts or add new staff. Overtime, it provides the basis for slowly, butinexorably driving higher market share,
higher sales and still higher profits. Inthe long run, an uncontested profit gapportends the demise of the typical firm.
No firm wants to be left behind.The challenge is that in a very busy world
Exhibit 1The Profit Gap Between the
Typical and High-Profit Firms
Income Statement Typical High Profit
Net Sales $10,000,000 $10,000,000Cost of Goods Sold 6,300,000 6,200,000Gross Margin 3,700,000 3,800,000
Payroll Expenses 1,961,000 1,800,000All Other Expenses 1,339,000 1,300,000Total Expenses 3,300,000 3,100,000
Profit Before Taxes $400,000 $700,000
Tile Management Quarterly19
where sometimes everything seemsimportant, there is difficulty in layingout a plan of action for the future.Closing the gap will require not onlypriorities for action, but an entirely newfocus on what the firm is trying to be.
The Pillars of FinancialSuccess
In closing the gap, there is aninevitable desire to find the silver bulletthat will drive the firm to improvedresults. Unfortunately, there are nosilver bullets for producing higher profitsin distribution. Instead, success willcome from doing a lot of things rightover an extended time period. Firmsmust have a clear strategy, operateefficiently, understand the needs ofcustomers, and engage in a myriad ofother activities as effectively as possible.
Even though there are no magicanswers, a detailed analysis of the PROFITReport and comparisons with otherindustries does suggest that there is adefinite “short list” of factors thatdistinguish the successful firms fromthe ordinary ones. Given theirimportance, these factors are beingreferred to here as the five pillars offinancial success.
They are not five actions to take andthen check off on a to-do list. Further,they are not five profit drivers to worryabout, such as sales, gross margin andinventory. Instead, they are fivefundamental characteristics of firms thatenjoy long-term success. The five factorslisted below are all strategic in nature.They describe the competitive andoperating environment the firm hascreated.
· Barriers to Entry—Competitivebattles are not fought on every itemon every transaction every singleday. Instead, competition is wagedbetween alternative businesssystems.
· De-Commoditization—The overallproduct assortment offered allowsfor both tonnage sales andreasonable margin opportunitiesfrom non-commodities.
· Employee Productivity—Newprocedures for controlling payrollexpense have been implemented.
· Profit Focus—The maximization ofdollar profits takes priority over themaximization of sales or theminimization of asset investment.
· Internal Profit Understanding—There is a clear understanding withinthe decision-making ranks of howprofit is generated or destroyed byemployee actions.
Focusing on these strategic factorsprovides no absolute guarantee ofsuccess. Brilliant strategies can becombined with ineffective operatingprocedures to produce marginal results.Instead, concentrating on these fivefactors creates an environment in whicheffective operations can deliver highprofits. Without such approaches, highprofits are distinctly unattainableregardless of operational efficiency.
Barriers to EntryEconomic theory contends that
barriers to entry are industry-wideconditions. If it is impossible, or atleast very difficult for new competitorsto enter an industry, then every firm inthe industry prospers. In fact, researchinto distribution profitability indicatesthat the single most important reasonwhy some industries produce higher
profits than others are such industry-wide barriers.1
The reality is that distribution firmscan’t unilaterally create industry-widebarriers to entry for their line of trade.Instead, they must find a way to erecttheir own unique barriers to entry at theindividual firm level. Such barriers aremuch more fragile than industry-widelegal or licensing barriers. However,they also are much easier to construct.
Examples of company-specificbarriers to entry abound in distribution,although they are not often thought of assuch. A few selected examples include:
· Proprietary Technology—Orderingsystems that link customers anddistributors, particularly in anautomatic reordering mode.
· Patronage Programs—Cumulativerebate programs that tend to tiecustomers to the firm.
· Tailored Assortments—Programsthat facilitate one-stop shopping.These are particularly effective inindustries where competitors aredramatically reducing inventory forcash flow reasons.
· Operational Effectiveness—Differentially high fill rates anddifferentially low error rates thatlower operating costs for customers.
Measuring the impact of barriers toentry is difficult when relying exclusivelyon available financial information. Ananalysis of profitability information fromPROFIT reports conducted in fortydifferent lines of trade in distributionsuggests three benefits (1) an enhancedgross margin, probably in the range ofone to two percentage points above theindustry norm, (2) five to ten percent in
Continued from page 18
Continued on page 20

Tile Management Quarterly20
additional sales volume, and (3) areduction in payroll of between one-halfand one percentage point.
It should be noted carefully thatevery line of trade is unique and thatsuch differences play out differentlyamong the various lines of trade.
Financial results from the PROFIT reportsuggest that CTDA members appear tofollow a pattern very close to the norm.
Exhibit 2 measures the profit impactof potential changes in performance forthe typical CTDA member. A typicalfirm, producing pre-tax profits of$400,000, has the opportunity toincrease profits by $302,000 or 75.5%if all three of the profit enhancementopportunities were realized fully.
The changes don’t impact resultsslightly. They move the firm into adifferent sphere of profitability. For allpractical purposes the firm is no longereven in the same industry. If barriers toentry can be thought of as manageabledefenses rather than an industry-widecondition over which the firm has nocontrol, there is no real limit to theprofitability levels that can be achieved.
De-Commoditization of theProduct Line
Firms in nearly every industry feelthat their products are, or are rapidlybecoming, commodities. This simply is
not the case. The product offer for CTDAmembers is diverse with numerousopportunities to avoid directcompetition. Even if the most basicSKUs are commodities, there are alwayssome extended product offerings to wraparound the commodity base.
The level of commoditization issecond only to barriers to entry as a
strategic determinant of profit indistribution. Interestingly, firms in thesame industry often have very differentviews about the extent to which they sellcommodities. Part of this is reality, buta large part is perception.
The distinction betweencommodities and non-commodities isimportant in that it produces a mind set
in the firm about the role of pricing.With true commodities, the naturalfeeling is that there is little that can bedone in the pricing arena. When themarket price declines, firms must meetthat price. If not, they are symbolicallywaving a flag indicating that their priceon every item is high.
Non-commodities call for a verydifferent set of rules. On these itemsthere is the perception that there issome breathing room on price. Theitems may still be price sensitive to alarge degree, but there is no requirementto meet every competitive price in everyinstance.
If one firm in the industry has aperception that virtually everything is acommodity while another feels thatonly a few items are commodities, thenthe two firms come to very differentpositions regarding pricing and grossmargin. Exhibit 3 presents the differentperceptions graphically.
The chart measures the gross margin“hit” the firm will experience if its
prices on commodities are forced downfrom 2% to 10%. Each of the lines on
Exhibit 3 The Impact of Commodities on Gross Margin
30.0
32.0
34.0
36.0
38.0
40.0
0 2 4 6 8 10
Price Cut--%
Tota
l Firm
Gro
ss M
argi
n--%
0.0 10.0 20.0 30.0 40.0 50.0Percent of Sales from Commodities:
Continued from page 19
Continued on page 21
Exhibit 2The Impact on Profit of Selected Changes in Performance
AdditionalArea of Change Improvement ProfitGross Margin Percentage One Percentage Point $100,000Net Sales Five Percent 152,000Payroll as a Percent of Sales One-Half Percentage Point 50,000Total Improvement Potential $302,000
Tile Management Quarterly21
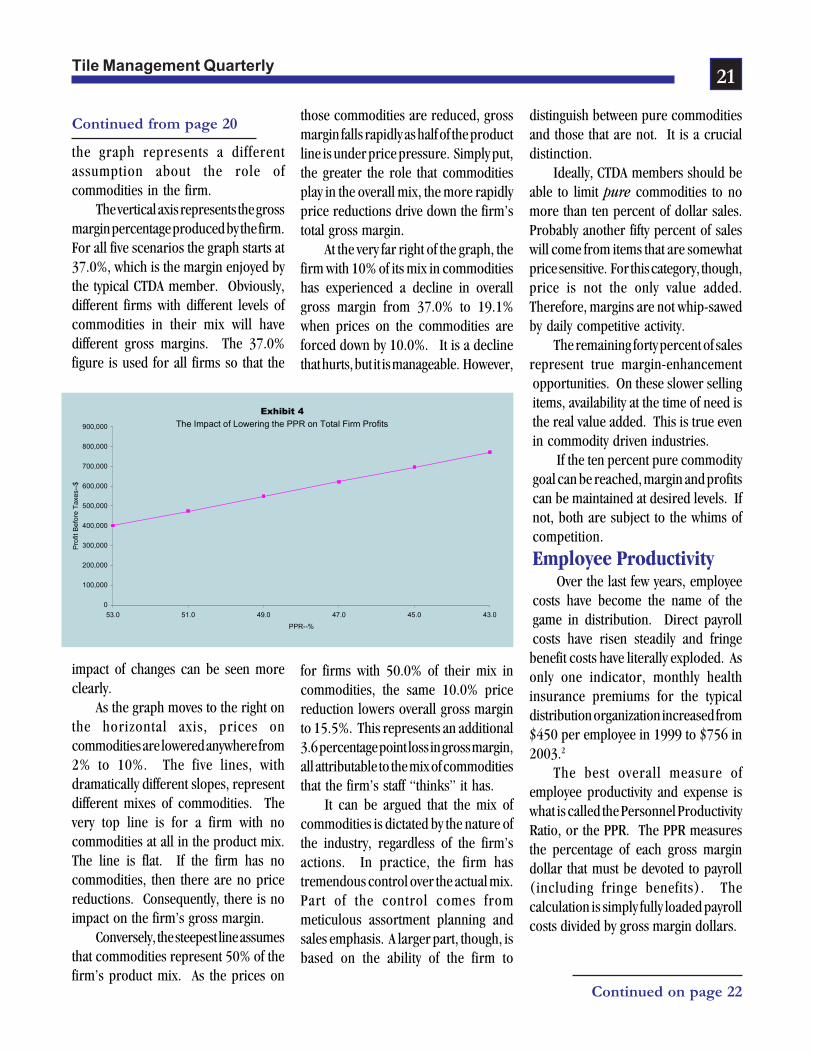
the graph represents a differentassumption about the role ofcommodities in the firm.
The vertical axis represents the grossmargin percentage produced by the firm.For all five scenarios the graph starts at37.0%, which is the margin enjoyed bythe typical CTDA member. Obviously,different firms with different levels ofcommodities in their mix will havedifferent gross margins. The 37.0%figure is used for all firms so that the
impact of changes can be seen moreclearly.
As the graph moves to the right onthe horizontal axis, prices oncommodities are lowered anywhere from2% to 10%. The five lines, withdramatically different slopes, representdifferent mixes of commodities. Thevery top line is for a firm with nocommodities at all in the product mix.The line is flat. If the firm has nocommodities, then there are no pricereductions. Consequently, there is noimpact on the firm’s gross margin.
Conversely, the steepest line assumesthat commodities represent 50% of thefirm’s product mix. As the prices on
those commodities are reduced, grossmargin falls rapidly as half of the productline is under price pressure. Simply put,the greater the role that commoditiesplay in the overall mix, the more rapidlyprice reductions drive down the firm’stotal gross margin.
At the very far right of the graph, thefirm with 10% of its mix in commoditieshas experienced a decline in overallgross margin from 37.0% to 19.1%when prices on the commodities areforced down by 10.0%. It is a declinethat hurts, but it is manageable. However,
for firms with 50.0% of their mix incommodities, the same 10.0% pricereduction lowers overall gross marginto 15.5%. This represents an additional3.6 percentage point loss in gross margin,all attributable to the mix of commoditiesthat the firm’s staff “thinks” it has.
It can be argued that the mix ofcommodities is dictated by the nature ofthe industry, regardless of the firm’sactions. In practice, the firm hastremendous control over the actual mix.Part of the control comes frommeticulous assortment planning andsales emphasis. A larger part, though, isbased on the ability of the firm to
distinguish between pure commoditiesand those that are not. It is a crucialdistinction.
Ideally, CTDA members should beable to limit pure commodities to nomore than ten percent of dollar sales.Probably another fifty percent of saleswill come from items that are somewhatprice sensitive. For this category, though,price is not the only value added.Therefore, margins are not whip-sawedby daily competitive activity.
The remaining forty percent of salesrepresent true margin-enhancementopportunities. On these slower sellingitems, availability at the time of need isthe real value added. This is true evenin commodity driven industries.
If the ten percent pure commoditygoal can be reached, margin and profitscan be maintained at desired levels. Ifnot, both are subject to the whims ofcompetition.
Employee ProductivityOver the last few years, employee
costs have become the name of thegame in distribution. Direct payrollcosts have risen steadily and fringebenefit costs have literally exploded. Asonly one indicator, monthly healthinsurance premiums for the typicaldistribution organization increased from$450 per employee in 1999 to $756 in2003.2
The best overall measure ofemployee productivity and expense iswhat is called the Personnel ProductivityRatio, or the PPR. The PPR measuresthe percentage of each gross margindollar that must be devoted to payroll(including fringe benefits). Thecalculation is simply fully loaded payrollcosts divided by gross margin dollars.
Exhibit 4 The Impact of Lowering the PPR on Total Firm Profits
0
100,000
200,000
300,000
400,000
500,000
600,000
700,000
800,000
900,000
53.0 51.0 49.0 47.0 45.0 43.0
PPR--%
Pro
fit B
efor
e Ta
xes-
-$
Continued from page 20
Continued on page 22
Tile Management Quarterly22
For the typical CTDA member fromExhibit 1, the calculation of the PPR is:
Payroll CostsGross Margin
=$1,961,000$3,700,000
=53.0%
This means that for every one dollarof gross margin that is generated, thefirm must spend 53.0 cents on payroll.The figure is too high for long-termfinancial success.
Exhibit 4 graphs the dollar profitsthe firm will generate as it begins tolower its PPR. As can be seen, therelationship is quite pronounced. If, forexample the firm could make a tenpoint reduction in the PPR, then dollarprofits would increase from the current$400,000 to $770,000.
A ten point cut is dramatic. However,the high-profit firms within CTDA operateon a PPR of only 55.0%, compared to53.0% for the typical firm. A programto move systematically towards the high-profit number is essential.
In trying to improve the PPR, firmshave three distinct opportunities:
· Actual Cost Levels—The amountspent per employee on payroll andfringe benefits.
· Productivity—The amount ofoutput that is generated per unit oflabor input.
· Workload—The number of orders,deliveries, invoices and the like thatmust be processed.
Historically, firms have focusedalmost exclusively on the first two—costs and productivity. As a result,efforts in these areas have reached apoint of diminishing (or possibly evenno) returns.
Cost reductions continue to be animportant strategy for firms that canengage in outsourcing. However, mostdistribution functions have to beperformed locally. In current parlance,it is hard to move the truck-drivingfunction to India.
While distribution firms are blockedon lowering payroll costs, they face analmost impossible battle on fringebenefits. Firms have engaged in somerearguard programs such as increasingco-pays and deductibles on healthinsurance. The best that can be hopedfor, though, is to reduce the rate ofincrease.
Enhanced productivity has been thefocal point of distributor activity inrecent years. Inevitably, this has lead toincreasing sophistication in terms oftechnology and operating systems. Theuse of technology to drive higher levelsof productivity has been the great successof distribution. At the same time, theimpact on the bottom line has beeninfuriatingly small.
The vast majority of employee-productivity technology has beenindustry wide. That is, new technologythrusts, such as bar coding andincreasingly, radio frequencyidentification, ultimately are widelyadopted by almost all distributors. Theresult is that costs go down for everybody.
If the story ended there, it wouldrepresent the proverbial happy ending.Unfortunately, as costs go down foreverybody, gross margins also tend to godown for everybody. This leaves CTDA
members more productive, but not moreprofitable.
It is probably time for distributorsto turn their attention to controlling theworkload. That is, they must managethe number of orders received, thenumber of deliveries made and the like.
For most managers, even thinkingabout workload controls is anathema.Distribution firms have built their entirebusiness around service. If anything,though, distributors are now over-servicing their customers. The costimplication is clearly negative fordistributors. Of strategic consequence,the cost implication is also negative forcustomers who waste their own employeetime by placing and processing too manysmall orders.
Controlling the workload involves acombination of better analysis of costsand more sophisticated selling:
· Analysis—Before excessive activitycan be eliminated, it must beidentified. Activity Based Costingtools are now cheap enough (withExcel or other spreadsheets) thatevery firm should know its costs toprocess an order or make a delivery.The cost-understanding issue is nolonger a barrier.
· Selling—Understanding is differentthan taking action. Programs mustbe in place to educate the salesforce, and ultimately customers, onthe essential need for fewer, largerorders throughout the channel.
Profit FocusTo accuse distributors of not having
a profit focus is to accuse them of beingun-American. The reality, though, isthat most firms do not focus on profits
Continued from page 21
Continued on page 23
Tile Management Quarterly23
with the absolute intensity that theyshould.
A true profit focus in distributionmeans two things. First, every operatingdivision within the firm starts the yearwith a clear understanding of how muchprofit it should generate. Second, keydecision makers are compensated upontheir ability to help the division reachthat goal.
Profit UnderstandingMost CTDA members don’t really
develop a profit-based financial plan. Infact, a large number of firms don’t evenplan at all. They simply buy things andsell things and hope it all works out. Forfirms that do plan, the overwhelmingmajority of them focus on sales.
Sales would seem to be a naturalstarting point in planning. To reallyreach high-profit performance, though,firms should engage in what iscommonly called profit-first planning.That is, they should begin the year bydetermining how much profit the firm(or branch or division) is going to earn.
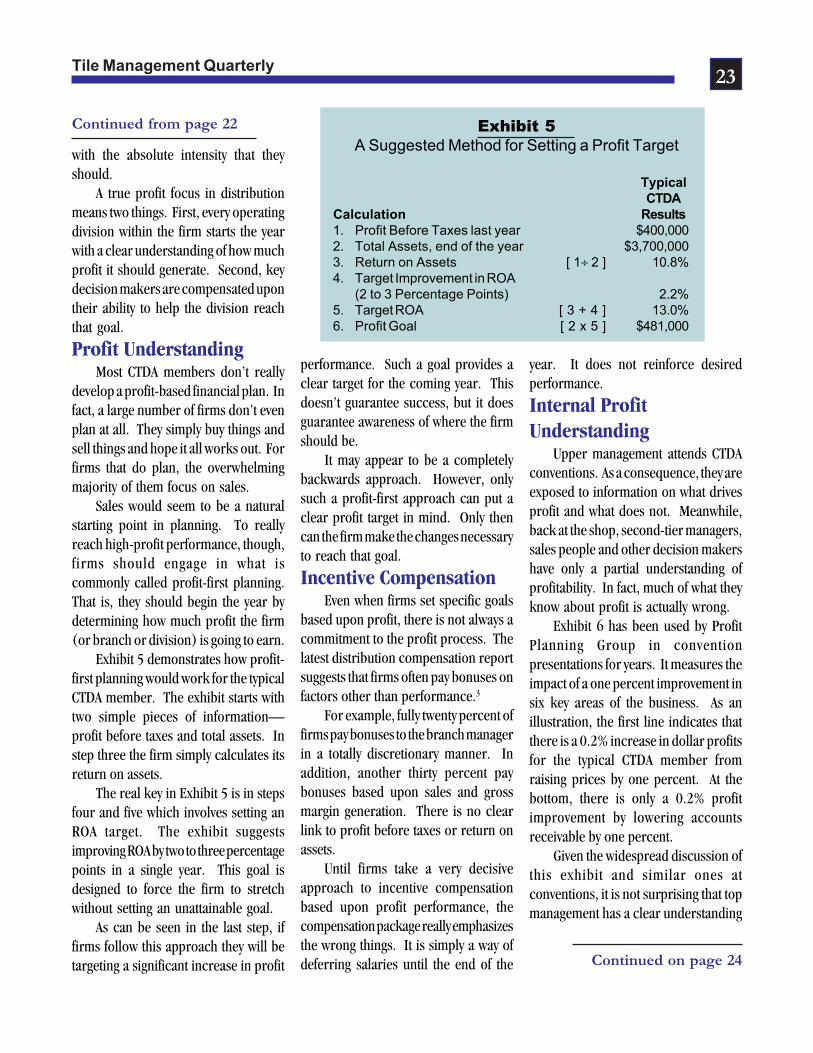
Exhibit 5 demonstrates how profit-first planning would work for the typicalCTDA member. The exhibit starts withtwo simple pieces of information—profit before taxes and total assets. Instep three the firm simply calculates itsreturn on assets.
The real key in Exhibit 5 is in stepsfour and five which involves setting anROA target. The exhibit suggestsimproving ROA by two to three percentagepoints in a single year. This goal isdesigned to force the firm to stretchwithout setting an unattainable goal.
As can be seen in the last step, iffirms follow this approach they will betargeting a significant increase in profit
performance. Such a goal provides aclear target for the coming year. Thisdoesn’t guarantee success, but it doesguarantee awareness of where the firmshould be.
It may appear to be a completelybackwards approach. However, onlysuch a profit-first approach can put aclear profit target in mind. Only thencan the firm make the changes necessaryto reach that goal.
Incentive CompensationEven when firms set specific goals
based upon profit, there is not always acommitment to the profit process. Thelatest distribution compensation reportsuggests that firms often pay bonuses onfactors other than performance.3
For example, fully twenty percent offirms pay bonuses to the branch managerin a totally discretionary manner. Inaddition, another thirty percent paybonuses based upon sales and grossmargin generation. There is no clearlink to profit before taxes or return onassets.
Until firms take a very decisiveapproach to incentive compensationbased upon profit performance, thecompensation package really emphasizesthe wrong things. It is simply a way ofdeferring salaries until the end of the
year. It does not reinforce desiredperformance.
Internal ProfitUnderstanding
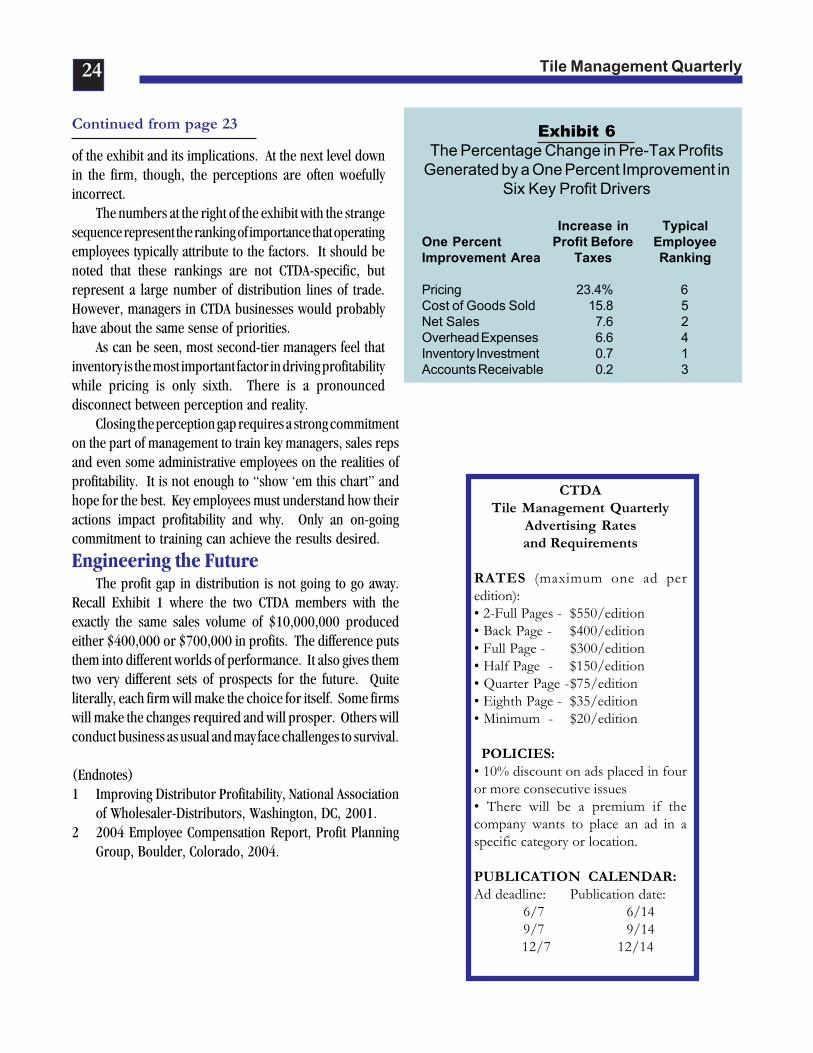
Upper management attends CTDAconventions. As a consequence, they areexposed to information on what drivesprofit and what does not. Meanwhile,back at the shop, second-tier managers,sales people and other decision makershave only a partial understanding ofprofitability. In fact, much of what theyknow about profit is actually wrong.
Exhibit 6 has been used by ProfitPlanning Group in conventionpresentations for years. It measures theimpact of a one percent improvement insix key areas of the business. As anillustration, the first line indicates thatthere is a 0.2% increase in dollar profitsfor the typical CTDA member fromraising prices by one percent. At thebottom, there is only a 0.2% profitimprovement by lowering accountsreceivable by one percent.
Given the widespread discussion ofthis exhibit and similar ones atconventions, it is not surprising that topmanagement has a clear understanding
Continued from page 22
Continued on page 24
Exhibit 5A Suggested Method for Setting a Profit Target
TypicalCTDA
Calculation Results1. Profit Before Taxes last year $400,0002. Total Assets, end of the year $3,700,0003. Return on Assets [ 1÷ 2 ] 10.8%4. Target Improvement in ROA
(2 to 3 Percentage Points) 2.2%5. Target ROA [ 3 + 4 ] 13.0%6. Profit Goal [ 2 x 5 ] $481,000
Tile Management Quarterly24
of the exhibit and its implications. At the next level downin the firm, though, the perceptions are often woefullyincorrect.
The numbers at the right of the exhibit with the strangesequence represent the ranking of importance that operatingemployees typically attribute to the factors. It should benoted that these rankings are not CTDA-specific, butrepresent a large number of distribution lines of trade.However, managers in CTDA businesses would probablyhave about the same sense of priorities.
As can be seen, most second-tier managers feel thatinventory is the most important factor in driving profitabilitywhile pricing is only sixth. There is a pronounceddisconnect between perception and reality.
Closing the perception gap requires a strong commitmenton the part of management to train key managers, sales repsand even some administrative employees on the realities ofprofitability. It is not enough to “show ‘em this chart” andhope for the best. Key employees must understand how theiractions impact profitability and why. Only an on-goingcommitment to training can achieve the results desired.
Engineering the FutureThe profit gap in distribution is not going to go away.
Recall Exhibit 1 where the two CTDA members with theexactly the same sales volume of $10,000,000 producedeither $400,000 or $700,000 in profits. The difference putsthem into different worlds of performance. It also gives themtwo very different sets of prospects for the future. Quiteliterally, each firm will make the choice for itself. Some firmswill make the changes required and will prosper. Others willconduct business as usual and may face challenges to survival.
(Endnotes)1 Improving Distributor Profitability, National Association
of Wholesaler-Distributors, Washington, DC, 2001.2 2004 Employee Compensation Report, Profit Planning
Group, Boulder, Colorado, 2004.
CTDATile Management Quarterly
Advertising Ratesand Requirements
RATES (maximum one ad peredition):• 2-Full Pages - $550/edition• Back Page - $400/edition• Full Page - $300/edition• Half Page - $150/edition• Quarter Page -$75/edition• Eighth Page - $35/edition• Minimum - $20/edition
POLICIES:• 10% discount on ads placed in fouror more consecutive issues• There will be a premium if thecompany wants to place an ad in aspecific category or location.
PUBLICATION CALENDAR:Ad deadline: Publication date: 6/7 6/14 9/7 9/14
12/7 12/14
Continued from page 23 Exhibit 6The Percentage Change in Pre-Tax Profits
Generated by a One Percent Improvement inSix Key Profit Drivers
Increase in TypicalOne Percent Profit Before EmployeeImprovement Area Taxes Ranking
Pricing 23.4% 6Cost of Goods Sold 15.8 5Net Sales 7.6 2Overhead Expenses 6.6 4Inventory Investment 0.7 1Accounts Receivable 0.2 3
Tile Management Quarterly25
2003 PRODUCTIVITY BY INDUSTRY:
WHOLESALE TRADE, RETAIL TRADE, AND
FOOD SERVICES AND DRINKING PLACESThe Bureau of Labor Statistics of the
U.S. Department of Labor reported todayon labor productivity changes forwholesale trade, retail trade, and foodservices and drinking places. In 2003,labor productivity—defined as outputper hour—rose 3.4 percent for wholesaletrade, 5.1 percent for retail trade, and3.3 percent for food services and drinkingplaces. In both the retail and wholesaletrade sectors, output increased in 2003while hours declined. In food servicesand drinking places, both output andhours increased in 2003.
From 1987 to 2003, laborproductivity in the wholesale trade sectorrose an average of 3.5 percent per year.Output increased 4.0 percent per year,and hours increased 0.5 percent peryear. Labor productivity in retail tradeincreased 2.9 percent per year, whileoutput increased 3.9 percent, and hoursincreased 0.9 percent per year. In foodservices and drinking places, laborproductivity increased at an averageannual rate of 0.8 percent between 1987-2003, as output increased 2.4 percentand hours grew 1.6 percent per year.
Labor compensation and unit laborcosts are not reported in this releasebecause data to develop these measuresfor 2003 are not yet available. Industryproductivity and cost measures areproduced and published as source databecome available. Measures forindustries in other sectors have beenpublished in separate releases and can
Continued on page 26
be accessed online at http://www.bls.gov/schedule/archives/all_nr.htm.
2002-03 changeLabor productivity grew in 15 of the
18 durable and nondurable wholesaletrade industries measured in 2003. Eightof the nine durable goods and seven ofthe nine nondurable goods wholesaleindustries had productivity increases.Among the durable goods wholesaleindustries, the highest productivityincreases occurred for electrical goods(NAICS 4236) and commercialequipment (NAICS 4234), with outputper hour increases of 8.1 percent and7.8 percent, respectively. Two otherdurable wholesale industries, furnitureand furnishing (NAICS 4232) and lumberand construction supplies (NAICS 4233),had output per hour increases in 2003nearly as high, with gains of 7.6 percentand 7.4 percent, respectively. Amongthe nondurable wholesale tradeindustries, druggists’ goods (NAICS4242) had the highest productivityincrease (11.5 percent), followed bymiscellaneous nondurable goods (NAICS4249) with an increase of 6.4 percent.Output increased in 11 of the 18wholesale trade industries in 2003, whilehours declined in 14 industries. Laborproductivity declined 2.6 percent forwholesale electronic markets and agentsand brokers (NAICS 425), reflecting a2.2 percent increase in output with a 4.9percent increase in hours in 2003.
Labor productivity rose in 23 of the27 retail trade industries in 2003. Thehighest increases were 25.3 percent inelectronics and appliance stores (NAICS443) and 15.8 percent in electronicshopping and mail-order houses (NAICS4541). Productivity grew in five of thesix largest retail trade industries, thosewith more than 1,000,000 employees.Output grew in 22 of the 27 retailindustries, and all but two of theseindustries experienced productivityincreases. Hours declined in 17 retailindustries, 15 of which experiencedproductivity increases.
Labor productivity increased 3.3percent in food services and drinkingplaces in 2003. All four of the industriesin this subsector had productivity gains.The largest productivity gain occurredfor drinking places (NAICS 7224) —5.4percent. The two large industries in thisgroup, full-service restaurants (NAICS7221) and limited-service eating places(NAICS 7222), experienced productivitygains of 3.4 percent and 3.5 percent,respectively.
Long-term trendsLabor productivity increased in 16
of the 18 durable and nondurableindustries in the wholesale trade sectorfrom 1987 to 2003. Output per hourrose most rapidly in commercialequipment wholesalers (NAICS 4234)and in electric goods wholesalers (NAICS
Tile Management Quarterly26
4236), advancing at average annual ratesof 13.4 percent per year and 9.3 percentper year, respectively. Output rose in allbut two durable and nondurablewholesale industries, petroleum (NAICS4247) and metal and minerals (NAICS4235), while hours declined in fiveindustries. Productivity rose 4.5 percentper year in wholesale electronic marketsand agents and brokers (NAICS 425)from 1987 to 2003, reflecting average
Table1. Annual percent change in output per hour and related series: retail trade, wholesale trade, and foodservices and drinking places industries, 1987-03 and 2002-03
Annual % change, 1987-03 Annual % change, 2002-032003
NAICS Industry Employment Output Outputcode (thousands) per hour Output Hours per hour Output HoursWholesale Trade42 Wholesale trade 5826 3.5 4.0 0.5 3.4 2.1 -1.3423 Durable goods 3063 4.9 5.2 0.3 4.8 2.9 -1.84231 Motor vehicles and parts 360 3.4 3.6 0.2 4.2 3.8 -0.34232 Furniture and furnishings 117 2.0 2.3 0.3 7.6 2.3 -4.94233 Lumber and construction supplies 237 0.2 1.6 1.4 7.4 10.2 2.64234 Commercial equipment 673 13.4 14.0 0.6 7.8 7.0 -0.74235 Metals and minerals 121 -0.2 -0.2 -0.1 0.1 -5.3 -5.44236 Electric goods 355 9.3 9.2 -0.2 8.1 4.0 -3.84237 Hardware and plumbing 237 1.9 2.6 0.7 3.2 -0.4 -3.54238 Machinery and supplies 670 2.1 2.0 -0.1 4.9 1.8 -3.04239 Miscellaneous durable goods 293 2.1 2.6 0.4 -3.4 -3.6 -0.3424 Nondurable goods 2106 1.4 1.8 0.4 3.4 1.2 -2.24241 Paper and paper products 158 2.3 2.3 0.0 3.4 -0.7 -4.04242 Druggists’ goods 215 3.9 6.9 2.9 11.5 9.5 -1.84243 Apparel and piece goods 162 0.8 1.2 0.3 -9.3 -5.8 3.94244 Grocery and related products 714 1.5 2.4 1.0 3.0 1.1 -1.84245 Farm product raw materials 80 3.1 0.2 -2.8 0.3 1.5 1.24246 Chemicals 135 0.0 1.0 1.0 -1.0 -2.7 -1.74247 Petroleum 110 1.7 -0.7 -2.4 1.8 0.2 -1.64248 Alcoholic beverages 138 1.1 2.3 1.1 1.0 4.7 3.74249 Miscellaneous nondurable goods 395 0.3 0.3 0.0 6.4 -1.4 -7.3425 Electronic markets and agents and brokers 657 4.5 6.2 1.6 -2.6 2.2 4.942511 Business to business electronic markets 70 9.3 8.2 -1.0 29.1 5.0 -18.742512 Wholesale trade agents and brokers 587 2.8 4.8 2.0 -7.5 0.1 8.2
gains in output and hours of 6.2 percentand 1.6 percent, respectively.
Output per hour increased in all but1 of the 27 retail trade industries from1987 to 2003. Labor productivity rose ata rapid 14.0 percent per year, on average,in electronics and appliance stores(NAICS 443) and 12.5 percent inelectronic shopping and mail orderhouses (NAICS 4541). Output increasedin 26 of the 27 retail industries, whilehours increased in 21 industries. Amongthe six largest retail industries, other
general merchandise stores (NAICS4529) had the greatest averageproductivity gains between 1987 and2003, 7.9 percent per year on average,followed by clothing stores, where outputper hour increased 4.7 percent per year.
All three of the food servicesindustries had average annual growth inlabor productivity of 1.0 percent or less.Labor productivity in drinking placesdeclined 1.0 percent per year from 1987to 2003, as output declined 0.7 percentper year and hours increased 0.3 percent.
Continued from page 25
Tile Management Quarterly27
Annual % change, 1987-03 Annual % change, 2002-032003
NAICS Industry Employment Output Outputcode (thousands) per hour Output Hours per hour Output HoursRetail Trade44,45 Retail trade 15866 2.9 3.9 0.9 5.1 4.5 -0.6441 Motor vehicle and parts dealers 1975 1.7 3.0 1.3 1.6 3.1 1.54411 Automobile dealers 1319 1.2 2.7 1.5 -0.4 1.6 2.14412 Other motor vehicle dealers 158 3.8 6.3 2.4 14.8 26.7 10.44413 Auto parts, accessories, and tire stores 497 3.1 3.6 0.5 6.3 4.0 -2.2442 Furniture and home furnishings stores 597 3.5 4.5 1.0 7.9 7.0 -0.94421 Furniture stores 304 3.4 4.1 0.7 5.3 3.8 -1.44422 Home furnishings stores 293 3.7 5.0 1.3 11.1 10.8 -0.3443 Electronics and appliance stores 544 14.0 15.5 1.3 25.3 18.7 -5.3444 Building material and garden supply stores 1242 3.0 5.1 2.0 6.4 9.3 2.74441 Building material and supplies dealers 1077 3.0 5.4 2.3 6.6 9.1 2.44442 Lawn and garden equipment and supplies stores 165 3.2 3.5 0.4 5.6 10.8 4.9445 Food and beverage stores 2953 0.2 0.6 0.3 3.9 1.7 -2.14451 Grocery stores 2517 0.2 0.6 0.4 2.7 1.5 -1.24452 Specialty food stores 279 -0.2 0.1 0.2 13.9 6.9 -6.24453 Beer, wine and liquor stores 158 1.6 0.3 -1.3 11.6 2.1 -8.5446 Health and personal care stores 981 2.5 3.9 1.3 7.0 4.4 -2.4447 Gasoline stations 905 2.2 1.6 -0.6 -0.5 -1.7 -1.2448 Clothing and clothing accessories stores 1391 4.6 4.7 0.1 6.1 6.8 0.74481 Clothing stores 1003 4.7 5.0 0.3 5.7 6.6 0.94482 Shoe stores 188 4.1 2.7 -1.4 4.0 3.3 -0.74483 Jewelry, luggage, and leather goods stores 200 4.2 4.9 0.7 9.5 10.6 1.0451 Sporting goods, hobby, book, and music stores 727 3.6 5.2 1.5 -0.7 0.4 1.24511 Sporting goods and musical instrument stores 490 4.3 5.6 1.3 0.0 2.0 2.14512 Book, periodical, and music stores 238 2.1 4.2 2.1 -1.9 -2.7 -0.8452 General merchandise stores 2827 3.9 5.5 1.5 5.0 5.6 0.54521 Department stores 1621 1.3 2.9 1.6 3.3 -1.3 -4.44529 Other general merchandise stores 1206 7.9 9.4 1.3 4.9 12.2 7.0453 Miscellaneous store retailers 1112 3.7 5.1 1.3 4.1 2.2 -1.84531 Florists 139 3.1 1.9 -1.2 8.7 7.9 -0.74532 Office supplies, stationery and gift stores 462 5.7 6.8 1.0 3.2 3.4 0.14533 Used merchandise stores 166 3.2 7.5 4.2 2.2 9.6 7.24539 Other miscellaneous store retailers 346 1.8 3.9 2.0 7.4 -1.4 -8.2454 Nonstore retailers 613 8.9 9.0 0.0 15.4 9.4 -5.24541 Electronic shopping and mail-order houses 247 12.5 16.6 3.6 15.8 13.8 -1.74542 Vending machine operators 64 1.8 -0.1 -1.9 11.0 -4.8 -14.24543 Direct selling establishments 302 3.4 1.6 -1.8 9.5 3.1 -5.8
Food Services and Drinking Places722 Food services and drinking places 8791 0.8 2.4 1.6 3.3 4.9 1.57221 Full-service restaurants 4189 0.9 2.7 1.8 3.4 6.3 2.77222 Limited-service eating places 3690 1.0 2.6 1.6 3.5 5.3 1.87223 Special food services 518 0.0 1.8 1.7 2.7 -1.6 -4.27224 Drinking places, alcoholic beverages 395 -1.0 -0.7 0.3 5.4 -0.8 -5.9Industry employment may not sum to aggregate levels due to rounding.
Tile Management Quarterly28
When I was a new business owner Iattended a management seminar, thespeaker said something that I have neverforgotten. “Your business is as good asyour worst employee.” What a soberingthought.
Paul Harvey said: “For a company’sadvertising strategy to work, it has to behandled not only corporately but alsoindividually.” Haven’t you ever walkedinto a hotel and felt like saying to thedesk clerk “Haven’t you seen yourcommercials, you’re supposed to benice to me” then walked into therestaurant and felt like deducting 15%for putting up with the lousy service?
I was parked in the Union SquareGarage in San Francisco, I asked theyoung man at the counter if I could havea token to use for the ladies room, hesaid “we are out”, I said “that’s not verygood customer service”, and thenstaggered, cross legging to my car. Acouple of months later, same garage,different young man, I was about to givethem $16.00 of my hard earned cash, Isaid “could I have a token for he ladiesroom please?” He said “we are out, butfollow me”, we walked a few yards to theladies room, he turned a lever and allthe tokens fell out, he gave one to meand took the rest back to the till for thenext customers. Can you imagine thefirst young man would not give me goodservice because he would have had towalk just a few steps?
Perhaps that young man was not aslucky as I was to be brought up in an
Everyone Represents YourCompanyPatricia Fripp, CSP, CPAE
entrepreneurial environment, that meanshis manager or supervisor should lethim know exactly what is expected.
I was in New York with my brother.We left a movie at 9:45 p.m. and althoughwe thought we should be sensible and goback to the hotel, we were having sucha good time that we thought we wouldsqueeze in one other movie. A ClaudeVan Damme film had started 10 minutesbefore two blocks down the street. Thiswas a high action film and it did notmatter if we missed the first couple ofminutes. As we were racing down thestreet, my brother was explaining thestory line to me, we got to the counter ofthe cinema exactly fifteen minutes afterthe film had started. We said “we knowwe are late, but we want to go in, twotickets please.” The cashier said “we areout, you can’t come in, I’ve closed thetill.” I said “well put the money in thetill tomorrow”, “no” she said, “onceI’ve closed the till we can’t open it.” I ama firm believer that if you don’t like thefirst answer you get talk to somebodyelse, I went to the gentlemen who wasactually taking the tickets. We said “Lookwe really want to see this film, we realizewe are late, put the money in the tilltomorrow, let us in free or keep themoney yourselves.” This was too muchof a decision, he called the manager, wewent through the choices, she said “no,once you miss the beginning of the lastshow, we don’t let you in.”
As we were walking away I turnedaround and said “I can tell none of you
own this business, because the numberone key point in business is that ifpeople want to give you money, you takeit.” Owning the business does not meanyour name is on the door. It is anattitude that everyone has to have tocompete in challenging times. Who istraining all your employees? What isexpected of them?
I was delivering some customerservice seminars for telephone operatorsfor a large company. Their manager said“Patricia, we want our employees tounderstand about good customer service,but they don’t shop in Nordstrom, theydon’t stay in fancy hotels, how do we getthe point across? I said “I promise you asthey are all consumers themselves theyknow exactly what good customer serviceis.”
When I presented my seminar I toldthem some of my funny, good and badcustomer service stories. I then askedthem to share some of their experiences.I heard some fabulous and frighteningtales. One women explained that shehad bought a leotard to go under herchild’s Halloween costume. When shegot it home she found that it was a sizeto small, she hadn’t opened the package.She returned it to the store the next day.The young man at the counter said whatdo you mean, you don’t even know whatsize your own kid is?” Then she madeanother purchase, wrote a check andmade the mistake of putting the nextdays date on it. He threw the pen across
Continued on page 29
Tile Management Quarterly29
the counter and said “will you initialthat?” in a condescending tone of voice.She went up to the customer servicedepartment and told them the story anddo you know what they said? “That musthave been Anthony.” If they understoodabout Anthony’s behavior, why was hestill waiting on customers? Why isn’t hein the shipping department untilsomeone has time to train him oncustomer service?
What we need to do is make sureeverybody in our organization, large orsmall know that they are part of the salesdepartment, the service department andthe PR campaign, everybody makes adifference.
Successful author and “integritysales trainer” Ron Willingham was talkingto the CEO and high level managers of acar company, the CEO was saying howmuch we believe in customer service,we have to train our people in goodcustomer service. A gentlemen in theback put his hand up and said “If wetruly believed in good customer service,why do we consistently ship cars todealers who have very bad customerservice records?” As Ron said to me overdinner “It’s not what management says,that sets a corporate culture, it’s whatthey let happen.”
In the early days of Crown ZellerbachPaper Company’s business in thenorthwest, a company truck driver wasmoving his load along a narrow, twistingroad. A man driving a big, impressivecar slowed him up, and it took the truckdriver about twenty minutes to pass theman. When he did, he rolled down hiswindow and shouted, “You $*$@!#*!;you want to take up the wholeroad!”...with the Zellerbach name allover the truck! It just so happened that
the man in the car was Zellerbach’slargest purchaser in the entire state, andhe saw that the truck belonged to CrownZellerbach. He immediately contactedhis purchasing agent and said, “Cancelall orders we have with Zellerbach andnever, ever do business with them again.”
At the time, the paper company wasbeing managed by its founder, Mr. IsadoreZellerbach, who attempted to contacthis ex-client by phone for two months inorder to find out why the account hadbeen cancelled.
He had no luck. He flew up to thenorthwest in person. He said to hiscustomer, “We give you good service,prompt deliveries and great prices. Whywon’t you do business with us anymore?”
The man told Mr. Zellerbach aboutthe truck driver. At that moment,Zellerbach realized that he hadoverlooked the most important aspectof his business: everyone in his companyrepresented Crown Zellerbach to theoutside world.
Sometimes it’s difficult for us torealize that we do represent our companyevery day. But a single negative contactcan ruin a company’s reputation in theeyes of a customer. You do make adifference every day in your company’sultimate success.
Sometimes we have good employeesthat management could take a lessonfrom. Several years ago at the NationalSpeakers Association Winter Workshopin a hotel in Nashville the board ofdirectors met and afterwards six of ushad adjourned to the coffee shop tocontinue our deliberations. We weren’ttrying to be awkward, but nobody wantedanything exactly as it was presented onthe menu, no one wanted the same asanyone else and as speakers we talkedthe entire time the waitress was taking
the order, she was so nice and so patientthat at the end of the meal I said “Mydear, this is going to be worth yourwhile, these guys are big tippers.” Shesaid something that I have neverforgotten, she said “I’m not being nicefor a tip, I don’t care if you don’t give mea tip, I just feel that if we give you goodservice, if your group comes back hereanother year, you’ll bring your businessback to our hotel and not thecompetition.”
Frankly, I was impressed, here wasa waitress talking about our hotel. WhenI got back to my office I asked myassistant to send a letter to the manager.“Dear Sir, I am a motivational speakerand I travel nationwide talking aboutgood and bad service, may I congratulateyou on all of your staff, especially thiswaitress and I related the tale. I said“Sir, I don’t know what you do tomotivate your people, but keep doing it,it works.” I never received a reply, Ithink the manager and the waitressshould change places for a couple ofweeks, she knows more about PR thanhe does.
SUGGESTIONS:If you have a glossy brochure,
explaining your services make sureeverybody reads it, print in how evermany languages it takes. If you have amission statement of philosophy, have itposted everywhere. Be creative on howyou explain what’s expected.
Got off an airplane in Columbus,Ohio and a gentleman that had beensitting next to me introduced me to theyoung man who was meeting him. Hesaid “John worked in Disney World forthree years.” I said “How old were you?”
He said “Eighteen to twenty-one.” Isaid “Where did you work?” He said
Continued from page 28
Continued on page 30
Tile Management Quarterly30
“Lost and Found”, I said “Is it true thatwhen you first go to work in DisneyWorld or Disneyland, they send youthrough a week’s training program tellingyou about the philosophy and that youhave to be nice to people and what yourjob is?”
“Yes,” he said. I said “After that firstweeks training, in the three years heworked there how often did you hear thephilosophy on how you had to treatpeople?”
He said “Every day”. I said “Oh,come on, you’re kidding.” “No” he said,it took different forms, it took differentwords, but he heard it everyday. It istough getting good help. Yes, it is, butlet’s be inspired by people who want tobe the best.
I was staying at the CheyenneMountain Conference Center and was
very impressed by all the employees. Asit was one of these facilities where yourroom could in fact be a long way fromthe lodge, bell people stopped me tomake sure I wasn’t lost and to see if Ineeded directions. The waiters in therestaurants were exceptionally friendlyand outgoing. I was getting ready tospeak at a banquet and one of thewaiters had gone out of his way toinitiate help and I commented to himhow impressed I was with all the staff.He said “I have worked in six differenthotels, and without a doubt the help isbetter in this one than any other place Ihave worked.” I said “What’s the secret?”He said “The management here treats usso much as professionals that it is somuch easier for us to do our jobs.”
Dr. Ko Nishimura, President andco-CEO of Solectron, Corporation wonthe Malcolm Baldrige award, 74% of hisemployees have English as a second
Continued from page 29 language, in one department they speak22 different languages. He said “Theydidn’t necessarily try and win the award,they just used the techniques or thecriteria to strive for continuousimprovement.”
Nishimura says “Tomorrow’smanager must learn to supervise a workforce that is older and has moreminorities and women.” Even old-lineCEO’S are taking a new approach tomanagement. General Electric ChairmanJohn Welch, Jr., advocates a kinder,gentler style that does not suppress ideasor intimidate employees. In GE’s annualreport, Welch promises a managementtechnique neither autocratic nortyrannical. He encouragescommunication outside traditionalchannels and says “Factory workersshould be included in workplacedecisions.”
Patricia Fripp, [email protected],1-800 634-3035, http://www.fripp.com
Training • Marketing Services • Business PlanningJob Problem Investigation • Testing Services
All Services Customized for You
Visit our website at
www.CTaSC.comPhone (619) 669-2967
Fax (619) [email protected]
Serving National and International Clients
• Need Job Problem Investigations?• Need Installation Specifications?• Need a Marketing & Sales Plan?• Need Marketing Research and
Outsourcing Services?• Need Product Testing Services?• Need Training?
Ceramic Tile and StoneConsulting Services
Training • Research • Planning • Investigations • Testing
Tile Management Quarterly31
Every business and professionalpractice MUST be in the public eye. Youneed customers! Folks need your goodsand services — it’s a mutual alliance formutual benefit! But if potential clientsand customers don’t know you exist, orcan’t find you, you will go bankrupt! Theywon’t benefit from your services, andyou won’t make any money. So,marketing is a necessity. Advertising isone form of marketing, but it’s terriblyexpensive. Here are the Top 10alternatives:1. Contact 5 past customers or referral
sources to thank them for theirbusiness and ask them to evaluatethe quality of your service. Let themknow they are the most importantpart of your research anddevelopment program. Listen totheir suggestions!
2. Re-do your business cards,brochures or letterhead. Updateyour slogans, be certain your use ofcolors, textures and headlines isappropriate and represents preciselythe image you want to convey. Hirea graphic designer. Don’t skimp onyour first impression!
3. Announce a new program, newproducts, new hours, new personnelor new policies. So long as it is realand improves the quality and levelof your service, this is news thatcustomers, clients and the mediawill want to know about.
4. Attend and participate in networkingopportunities. From business open-
The Top 10 Ways to Market yourBusiness or Professional PracticeWithout Advertising
houses to neighborhood picnics, togreeting people you’ve donebusiness with when you see themaround town, always look for waysto remind people of who you areand the services and benefits youprovide.
5. Cooperate with other organizationsto achieve name and brandrecognition you couldn’t achieveon your own. Sponsor a localsoftball team, join with a radiostation to sponsor a contest, orparticipate in a charity golftournament. Partnerships can bringhuge rewards!
6. Offer a seminar, class orworkshop. Local news media willoften cover an interesting topic,and it’s a great way to make peopleaware of your services. Charge littleor no admission, have greathandouts and materials, and get acrowd together.
7. Use direct mail. Typically, we thinkof this as “junk mail” going tothousands of people, but more oftenit’s a matter of using your wordprocessor to write a personal letterto 200 past customers, colleagues,or even competitors. Make itinteresting, personal, and remindthem of your special niche or uniqueservices. Include a coupon orcertificate. Make sure your directmail is not “junk”!
8. Form an alliance with yoursuppliers, colleagues or (even) yourcompetitors to offer a “combo”package that neither of you couldoffer alone and share the marketingexpenses. Attorneys and accountantscan offer compelling packages. Amassage therapist might pair with aChiropractor, a gym, or a weight-loss program. Who can you team upwith?
9. Review everything a potentialcustomer sees or hears when theydo business with you. How do youanswer your phone? Do your signsneeds repainting, is your lobbyattractive and comfortable? Is yourdesk a mess? Do you take pride inyour appearance and take time tomake clients comfortable? It’s all inthe details!
10. Resubmit your web page to at least5 search engines this week. Eachsearch engine has it’s own rules andyou don’t want to flood them, but itis wise to update your listing at leastevery few months. (And, if you aren’ton the web, well, that’s tip #11)
Tile Management Quarterly32
The proportion of employees coveredby employer-sponsored medical care planshas fallen gradually over the last decade. InMarch 2003, 45 percent of employees hadelected coverage, down from 63 percent in1992-3, according to data released todayby the Bureau of Labor Statistics, U.S.Department of Labor. The large majority ofemployees covered by medical care planswere in plans requiring employeecontributions for both single coverage andfamily coverage. Employee contributionsto medical care premiums averaged$228.98 per month for family coverage;for single coverage, employeecontributions averaged $60.24 per month.Since 1992-3, the average monthlycontribution required of employees hasrisen about 75 percent for both family andsingle coverage.
Just under half of private industryemployees participated in an employerprovided retirement plan. Twenty percentof employees were in defined benefit plansand 40 percent were covered by definedcontribution plans. (Some employeesparticipate in both types.) The overallcoverage of retirement plans has heldrelatively steady for the last few years. Themix of plans, however, has changed.Defined benefit plans cover a smallerportion of workers than they did 10 yearsago, while defined contribution plans covera larger portion.
These data are from the NationalCompensation Survey (NCS), whichprovides comprehensive measures ofoccupational earnings, compensation costtrends, and details of benefit provisions.The focus of this news release is on theincidence of employee benefits, rangingfrom health and retirement benefits tosubsidized commuting; it also includes data
EMPLOYEE BENEFITS INPRIVATE INDUSTRY, 2003
on employee contributions to medical careplans.
Beginning with this news release, BLSis presenting benefit incidence andprovisions data in new ways. This is a resultof the consolidation of severalcompensation surveys into a singleprogram of compensation statistics, theNational Compensation Survey (NCS).Among the goals of the NCS are more timelypublication, a greater variety of data, andnew series that link benefit costs to benefitincidence and provisions. (For moreinformation on current and upcomingchanges, please see the Technical Note.)In addition to health and retirement plans,the survey also covered paid leave, life anddisability insurance, and other selectedbenefits. (See tables 2-4.)Worker characteristics
Access to and participation in benefitplans varied by occupational group, full-and part-time work schedule, union status,and earnings. For example, workers inwhite-collar occupations were more likelyto participate in defined contribution plansthan service workers. Union workers hadhigher rates of coverage for most benefits.Paid leave benefits (vacations, holidays,etc.) were commonly available to mostworkers regardless of occupation or unionstatus but were reported less frequently forpart-time workers.
For the first time in 2003, data onavailability of benefits were tabulatedseparately for workers in jobs averagingunder and over $15 an hour. (Please seethe Technical Note for further details.)Those in jobs averaging $15 an hour ormore were far more likely to be covered byall benefits. For example, workers in higherpaid occupations were twice as likely as
workers in lower paid jobs to participate inhealth and retirement plans.Establishment characteristics
The incidence of benefits varied byindustry, establishment size, and location.Benefits were more commonly offered toworkers in goods- producing than to thosein service-providing industries. Workersin medium and large private sectorestablishments (those employing 100employees and more) were more likely tohave access to a variety of benefits. Thedifferences were more pronounced incoverage for retirement and insurancebenefits than for paid leave benefits. For thefirst time in 2003, NCS data on benefitincidence were produced by censusdivision. Coverage for most benefits wasmore common in the Middle Atlantic, EastNorth Central and East South Centraldivisions.
For the first time, data are available onthe proportion of establishments offeringemployee benefits. A majority of privateestablishments offered health insurance toemployees in March 2003, and about halfof establishments offered retirement plans.There were sharp differences in theavailability of both benefits among largerand smaller establishments. Nearly all largerestablishments (those employing 100workers or more) offered health insurance,compared with just over half of smallerestablishments. Larger establishments werenearly twice as likely as smallerestablishments to offer retirement plans.The data show the provision of health carebenefits to retirees is fairly rare except forestablishments of 100 workers or more.(See table 8).
* Footnote 3 in table 5 was added onDecember 15, 2003.
Continued on page 33
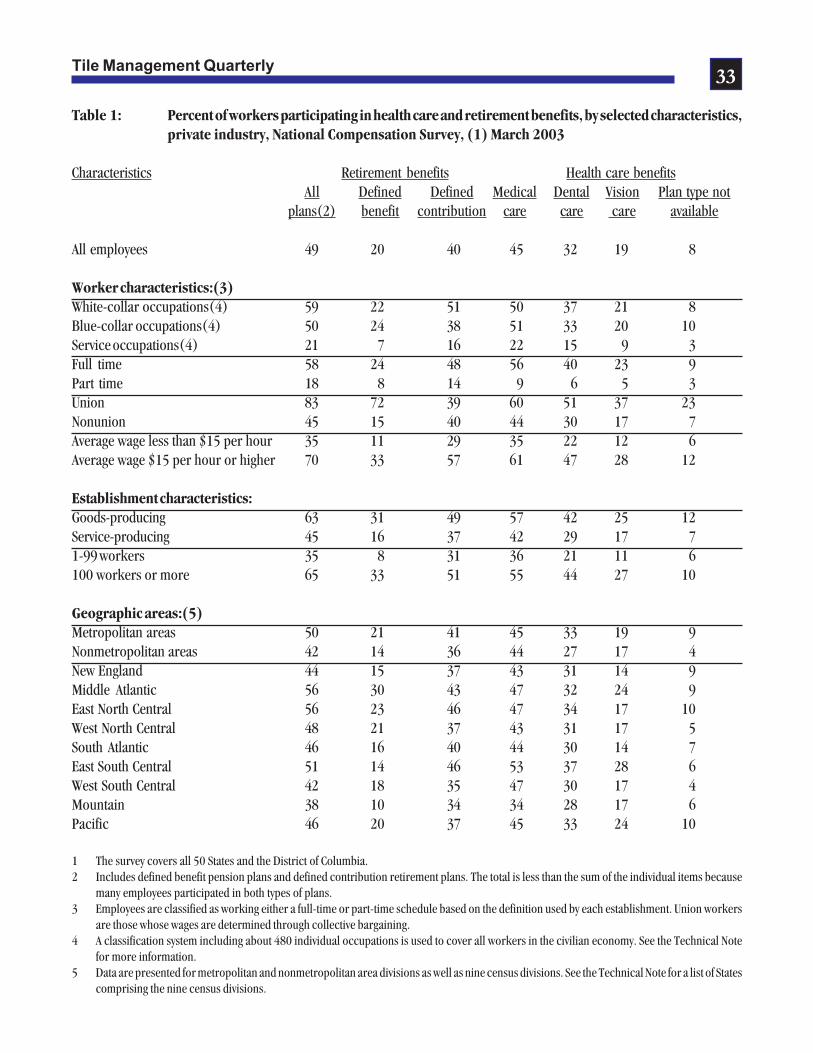
Tile Management Quarterly33
Table 1: Percent of workers participating in health care and retirement benefits, by selected characteristics,private industry, National Compensation Survey, (1) March 2003
Characteristics Retirement benefits Health care benefitsAll Defined Defined Medical Dental Vision Plan type not
plans(2) benefit contribution care care care available
All employees 49 20 40 45 32 19 8
Worker characteristics:(3)White-collar occupations(4) 59 22 51 50 37 21 8Blue-collar occupations(4) 50 24 38 51 33 20 10Service occupations(4) 21 7 16 22 15 9 3Full time 58 24 48 56 40 23 9Part time 18 8 14 9 6 5 3Union 83 72 39 60 51 37 23Nonunion 45 15 40 44 30 17 7Average wage less than $15 per hour 35 11 29 35 22 12 6Average wage $15 per hour or higher 70 33 57 61 47 28 12
Establishment characteristics:Goods-producing 63 31 49 57 42 25 12Service-producing 45 16 37 42 29 17 71-99 workers 35 8 31 36 21 11 6100 workers or more 65 33 51 55 44 27 10
Geographic areas:(5)Metropolitan areas 50 21 41 45 33 19 9Nonmetropolitan areas 42 14 36 44 27 17 4New England 44 15 37 43 31 14 9Middle Atlantic 56 30 43 47 32 24 9East North Central 56 23 46 47 34 17 10West North Central 48 21 37 43 31 17 5South Atlantic 46 16 40 44 30 14 7East South Central 51 14 46 53 37 28 6West South Central 42 18 35 47 30 17 4Mountain 38 10 34 34 28 17 6Pacific 46 20 37 45 33 24 10
1 The survey covers all 50 States and the District of Columbia.2 Includes defined benefit pension plans and defined contribution retirement plans. The total is less than the sum of the individual items because
many employees participated in both types of plans.3 Employees are classified as working either a full-time or part-time schedule based on the definition used by each establishment. Union workers
are those whose wages are determined through collective bargaining.4 A classification system including about 480 individual occupations is used to cover all workers in the civilian economy. See the Technical Note
for more information.5 Data are presented for metropolitan and nonmetropolitan area divisions as well as nine census divisions. See the Technical Note for a list of States
comprising the nine census divisions.
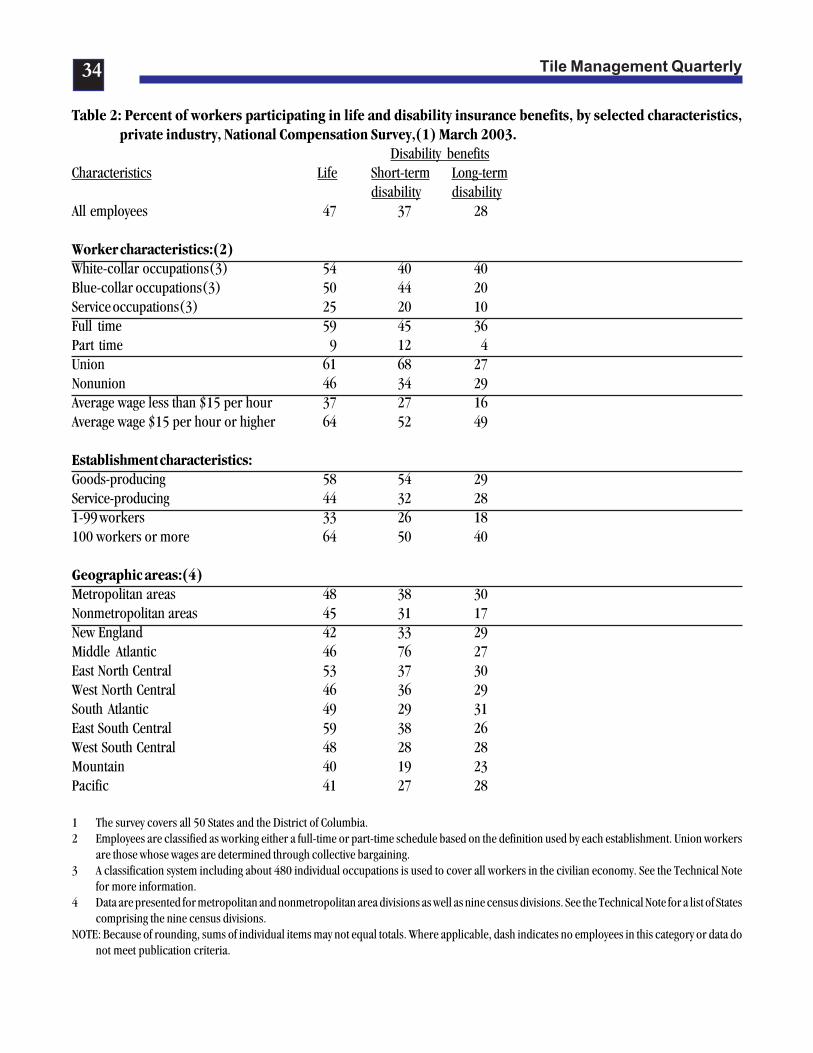
Tile Management Quarterly34
Table 2: Percent of workers participating in life and disability insurance benefits, by selected characteristics,private industry, National Compensation Survey,(1) March 2003.
Disability benefitsCharacteristics Life Short-term Long-term
disability disabilityAll employees 47 37 28
Worker characteristics:(2)White-collar occupations(3) 54 40 40Blue-collar occupations(3) 50 44 20Service occupations(3) 25 20 10Full time 59 45 36Part time 9 12 4Union 61 68 27Nonunion 46 34 29Average wage less than $15 per hour 37 27 16Average wage $15 per hour or higher 64 52 49
Establishment characteristics:Goods-producing 58 54 29Service-producing 44 32 281-99 workers 33 26 18100 workers or more 64 50 40
Geographic areas:(4)Metropolitan areas 48 38 30Nonmetropolitan areas 45 31 17New England 42 33 29Middle Atlantic 46 76 27East North Central 53 37 30West North Central 46 36 29South Atlantic 49 29 31East South Central 59 38 26West South Central 48 28 28Mountain 40 19 23Pacific 41 27 28
1 The survey covers all 50 States and the District of Columbia.2 Employees are classified as working either a full-time or part-time schedule based on the definition used by each establishment. Union workers
are those whose wages are determined through collective bargaining.3 A classification system including about 480 individual occupations is used to cover all workers in the civilian economy. See the Technical Note
for more information.4 Data are presented for metropolitan and nonmetropolitan area divisions as well as nine census divisions. See the Technical Note for a list of States
comprising the nine census divisions.NOTE: Because of rounding, sums of individual items may not equal totals. Where applicable, dash indicates no employees in this category or data do
not meet publication criteria.
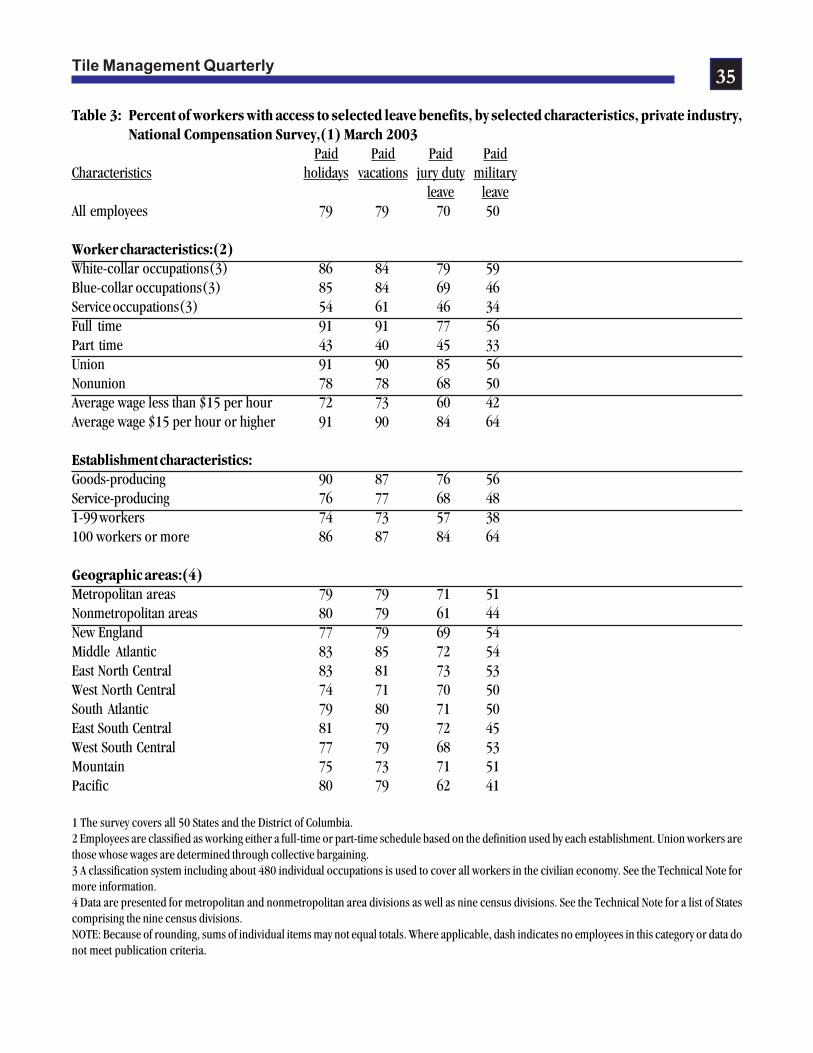
Tile Management Quarterly35
Table 3: Percent of workers with access to selected leave benefits, by selected characteristics, private industry,National Compensation Survey,(1) March 2003
Paid Paid Paid PaidCharacteristics holidays vacations jury duty military
leave leaveAll employees 79 79 70 50
Worker characteristics:(2)White-collar occupations(3) 86 84 79 59Blue-collar occupations(3) 85 84 69 46Service occupations(3) 54 61 46 34Full time 91 91 77 56Part time 43 40 45 33Union 91 90 85 56Nonunion 78 78 68 50Average wage less than $15 per hour 72 73 60 42Average wage $15 per hour or higher 91 90 84 64
Establishment characteristics:Goods-producing 90 87 76 56Service-producing 76 77 68 481-99 workers 74 73 57 38100 workers or more 86 87 84 64
Geographic areas:(4)Metropolitan areas 79 79 71 51Nonmetropolitan areas 80 79 61 44New England 77 79 69 54Middle Atlantic 83 85 72 54East North Central 83 81 73 53West North Central 74 71 70 50South Atlantic 79 80 71 50East South Central 81 79 72 45West South Central 77 79 68 53Mountain 75 73 71 51Pacific 80 79 62 41
1 The survey covers all 50 States and the District of Columbia.2 Employees are classified as working either a full-time or part-time schedule based on the definition used by each establishment. Union workers arethose whose wages are determined through collective bargaining.3 A classification system including about 480 individual occupations is used to cover all workers in the civilian economy. See the Technical Note formore information.4 Data are presented for metropolitan and nonmetropolitan area divisions as well as nine census divisions. See the Technical Note for a list of Statescomprising the nine census divisions.NOTE: Because of rounding, sums of individual items may not equal totals. Where applicable, dash indicates no employees in this category or data donot meet publication criteria.
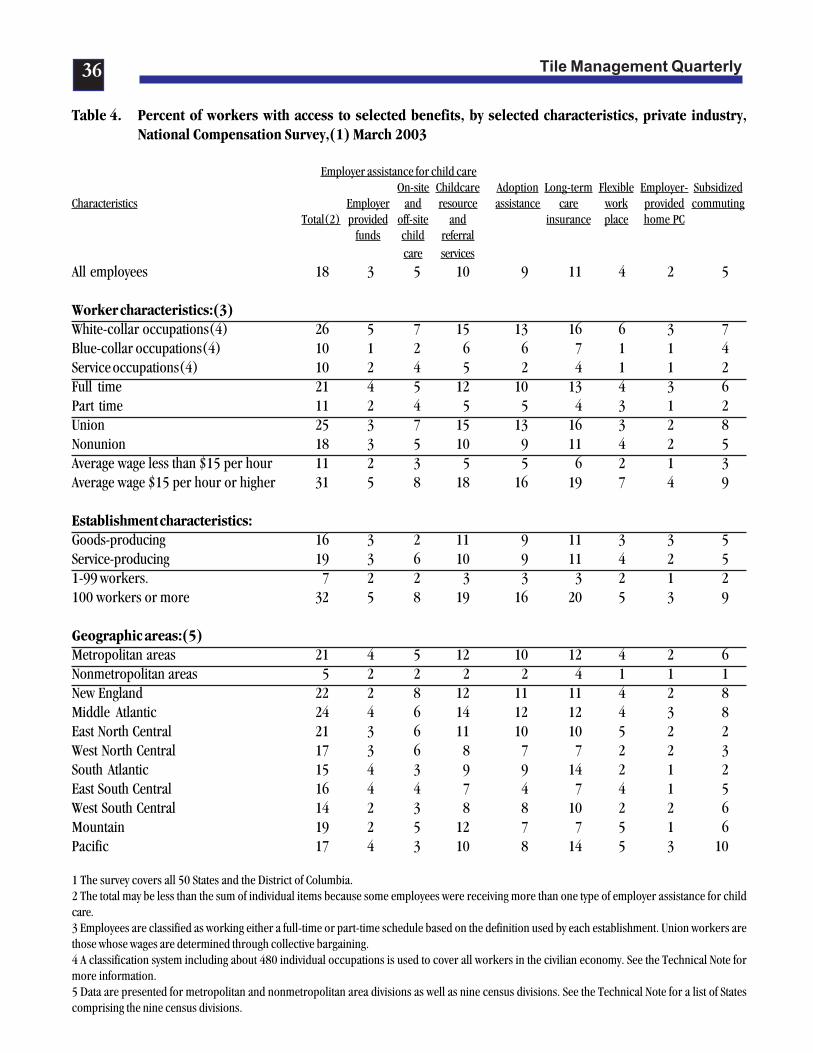
Tile Management Quarterly36
Table 4. Percent of workers with access to selected benefits, by selected characteristics, private industry,National Compensation Survey,(1) March 2003
Employer assistance for child careOn-site Childcare Adoption Long-term Flexible Employer- Subsidized
Characteristics Employer and resource assistance care work provided commutingTotal(2) provided off-site and insurance place home PC
funds child referralcare services
All employees 18 3 5 10 9 11 4 2 5
Worker characteristics:(3)White-collar occupations(4) 26 5 7 15 13 16 6 3 7Blue-collar occupations(4) 10 1 2 6 6 7 1 1 4Service occupations(4) 10 2 4 5 2 4 1 1 2Full time 21 4 5 12 10 13 4 3 6Part time 11 2 4 5 5 4 3 1 2Union 25 3 7 15 13 16 3 2 8Nonunion 18 3 5 10 9 11 4 2 5Average wage less than $15 per hour 11 2 3 5 5 6 2 1 3Average wage $15 per hour or higher 31 5 8 18 16 19 7 4 9
Establishment characteristics:Goods-producing 16 3 2 11 9 11 3 3 5Service-producing 19 3 6 10 9 11 4 2 51-99 workers. 7 2 2 3 3 3 2 1 2100 workers or more 32 5 8 19 16 20 5 3 9
Geographic areas:(5)Metropolitan areas 21 4 5 12 10 12 4 2 6Nonmetropolitan areas 5 2 2 2 2 4 1 1 1New England 22 2 8 12 11 11 4 2 8Middle Atlantic 24 4 6 14 12 12 4 3 8East North Central 21 3 6 11 10 10 5 2 2West North Central 17 3 6 8 7 7 2 2 3South Atlantic 15 4 3 9 9 14 2 1 2East South Central 16 4 4 7 4 7 4 1 5West South Central 14 2 3 8 8 10 2 2 6Mountain 19 2 5 12 7 7 5 1 6Pacific 17 4 3 10 8 14 5 3 10
1 The survey covers all 50 States and the District of Columbia.2 The total may be less than the sum of individual items because some employees were receiving more than one type of employer assistance for childcare.3 Employees are classified as working either a full-time or part-time schedule based on the definition used by each establishment. Union workers arethose whose wages are determined through collective bargaining.4 A classification system including about 480 individual occupations is used to cover all workers in the civilian economy. See the Technical Note formore information.5 Data are presented for metropolitan and nonmetropolitan area divisions as well as nine census divisions. See the Technical Note for a list of Statescomprising the nine census divisions.
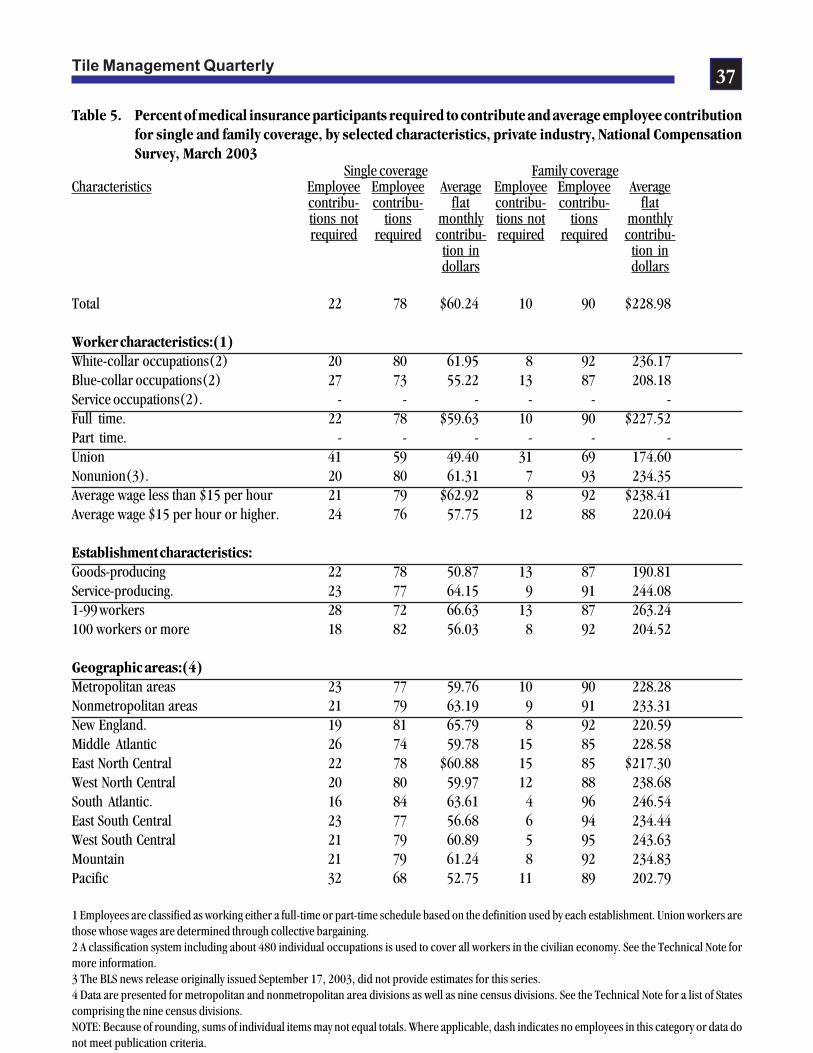
Tile Management Quarterly37
Table 5. Percent of medical insurance participants required to contribute and average employee contributionfor single and family coverage, by selected characteristics, private industry, National CompensationSurvey, March 2003
Single coverage Family coverageCharacteristics Employee Employee Average Employee Employee Average
contribu- contribu- flat contribu- contribu- flattions not tions monthly tions not tions monthlyrequired required contribu- required required contribu-
tion in tion indollars dollars
Total 22 78 $60.24 10 90 $228.98
Worker characteristics:(1)White-collar occupations(2) 20 80 61.95 8 92 236.17Blue-collar occupations(2) 27 73 55.22 13 87 208.18Service occupations(2). - - - - - -Full time. 22 78 $59.63 10 90 $227.52Part time. - - - - - -Union 41 59 49.40 31 69 174.60Nonunion(3). 20 80 61.31 7 93 234.35Average wage less than $15 per hour 21 79 $62.92 8 92 $238.41Average wage $15 per hour or higher. 24 76 57.75 12 88 220.04
Establishment characteristics:Goods-producing 22 78 50.87 13 87 190.81Service-producing. 23 77 64.15 9 91 244.081-99 workers 28 72 66.63 13 87 263.24100 workers or more 18 82 56.03 8 92 204.52
Geographic areas:(4)Metropolitan areas 23 77 59.76 10 90 228.28Nonmetropolitan areas 21 79 63.19 9 91 233.31New England. 19 81 65.79 8 92 220.59Middle Atlantic 26 74 59.78 15 85 228.58East North Central 22 78 $60.88 15 85 $217.30West North Central 20 80 59.97 12 88 238.68South Atlantic. 16 84 63.61 4 96 246.54East South Central 23 77 56.68 6 94 234.44West South Central 21 79 60.89 5 95 243.63Mountain 21 79 61.24 8 92 234.83Pacific 32 68 52.75 11 89 202.79
1 Employees are classified as working either a full-time or part-time schedule based on the definition used by each establishment. Union workers arethose whose wages are determined through collective bargaining.2 A classification system including about 480 individual occupations is used to cover all workers in the civilian economy. See the Technical Note formore information.3 The BLS news release originally issued September 17, 2003, did not provide estimates for this series.4 Data are presented for metropolitan and nonmetropolitan area divisions as well as nine census divisions. See the Technical Note for a list of Statescomprising the nine census divisions.NOTE: Because of rounding, sums of individual items may not equal totals. Where applicable, dash indicates no employees in this category or data donot meet publication criteria.
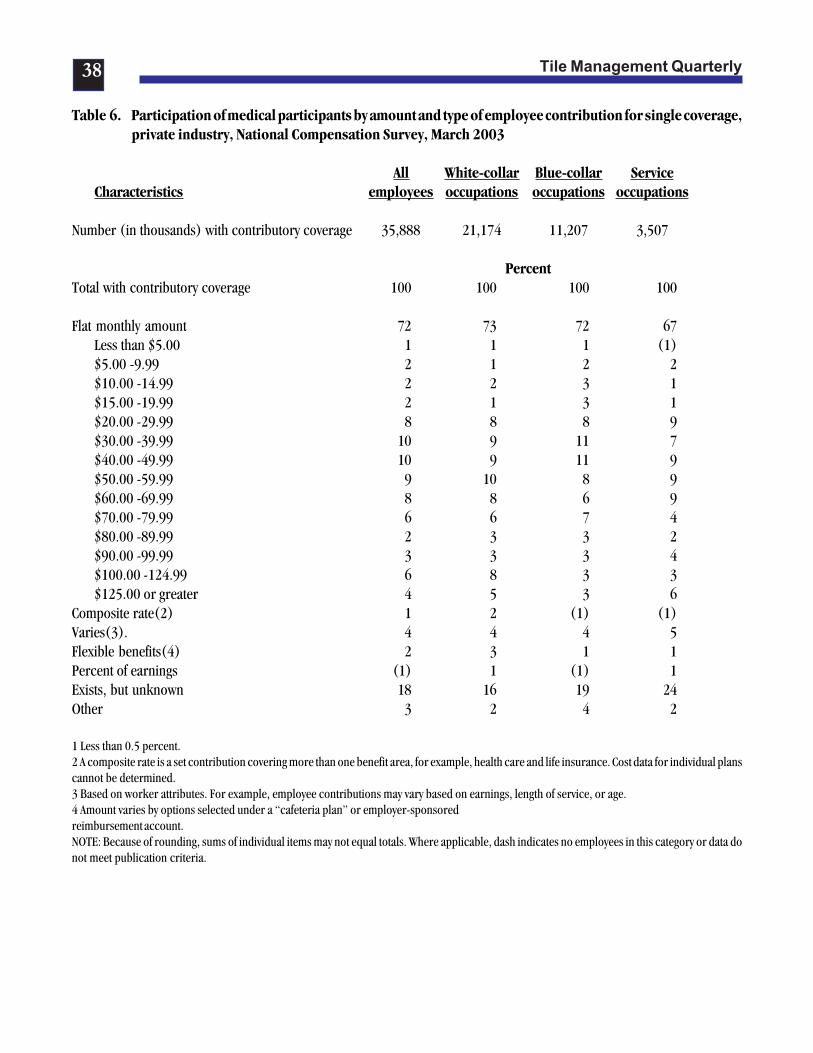
Tile Management Quarterly38
Table 6. Participation of medical participants by amount and type of employee contribution for single coverage,private industry, National Compensation Survey, March 2003
All White-collar Blue-collar ServiceCharacteristics employees occupations occupations occupations
Number (in thousands) with contributory coverage 35,888 21,174 11,207 3,507
PercentTotal with contributory coverage 100 100 100 100
Flat monthly amount 72 73 72 67Less than $5.00 1 1 1 (1)$5.00 -9.99 2 1 2 2$10.00 -14.99 2 2 3 1$15.00 -19.99 2 1 3 1$20.00 -29.99 8 8 8 9$30.00 -39.99 10 9 11 7$40.00 -49.99 10 9 11 9$50.00 -59.99 9 10 8 9$60.00 -69.99 8 8 6 9$70.00 -79.99 6 6 7 4$80.00 -89.99 2 3 3 2$90.00 -99.99 3 3 3 4$100.00 -124.99 6 8 3 3$125.00 or greater 4 5 3 6
Composite rate(2) 1 2 (1) (1)Varies(3). 4 4 4 5Flexible benefits(4) 2 3 1 1Percent of earnings (1) 1 (1) 1Exists, but unknown 18 16 19 24Other 3 2 4 2
1 Less than 0.5 percent.2 A composite rate is a set contribution covering more than one benefit area, for example, health care and life insurance. Cost data for individual planscannot be determined.3 Based on worker attributes. For example, employee contributions may vary based on earnings, length of service, or age.4 Amount varies by options selected under a “cafeteria plan” or employer-sponsoredreimbursement account.NOTE: Because of rounding, sums of individual items may not equal totals. Where applicable, dash indicates no employees in this category or data donot meet publication criteria.
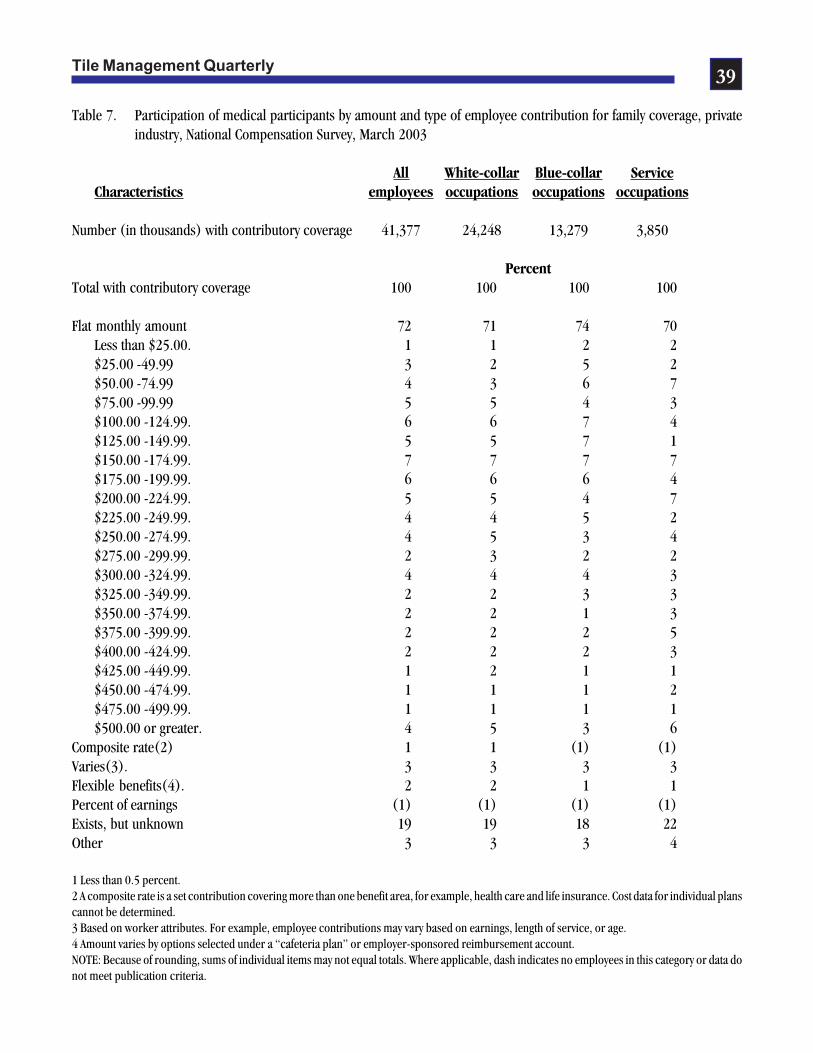
Tile Management Quarterly39
Table 7. Participation of medical participants by amount and type of employee contribution for family coverage, privateindustry, National Compensation Survey, March 2003
All White-collar Blue-collar ServiceCharacteristics employees occupations occupations occupations
Number (in thousands) with contributory coverage 41,377 24,248 13,279 3,850
PercentTotal with contributory coverage 100 100 100 100
Flat monthly amount 72 71 74 70Less than $25.00. 1 1 2 2$25.00 -49.99 3 2 5 2$50.00 -74.99 4 3 6 7$75.00 -99.99 5 5 4 3$100.00 -124.99. 6 6 7 4$125.00 -149.99. 5 5 7 1$150.00 -174.99. 7 7 7 7$175.00 -199.99. 6 6 6 4$200.00 -224.99. 5 5 4 7$225.00 -249.99. 4 4 5 2$250.00 -274.99. 4 5 3 4$275.00 -299.99. 2 3 2 2$300.00 -324.99. 4 4 4 3$325.00 -349.99. 2 2 3 3$350.00 -374.99. 2 2 1 3$375.00 -399.99. 2 2 2 5$400.00 -424.99. 2 2 2 3$425.00 -449.99. 1 2 1 1$450.00 -474.99. 1 1 1 2$475.00 -499.99. 1 1 1 1$500.00 or greater. 4 5 3 6
Composite rate(2) 1 1 (1) (1)Varies(3). 3 3 3 3Flexible benefits(4). 2 2 1 1Percent of earnings (1) (1) (1) (1)Exists, but unknown 19 19 18 22Other 3 3 3 4
1 Less than 0.5 percent.2 A composite rate is a set contribution covering more than one benefit area, for example, health care and life insurance. Cost data for individual planscannot be determined.3 Based on worker attributes. For example, employee contributions may vary based on earnings, length of service, or age.4 Amount varies by options selected under a “cafeteria plan” or employer-sponsored reimbursement account.NOTE: Because of rounding, sums of individual items may not equal totals. Where applicable, dash indicates no employees in this category or data donot meet publication criteria.
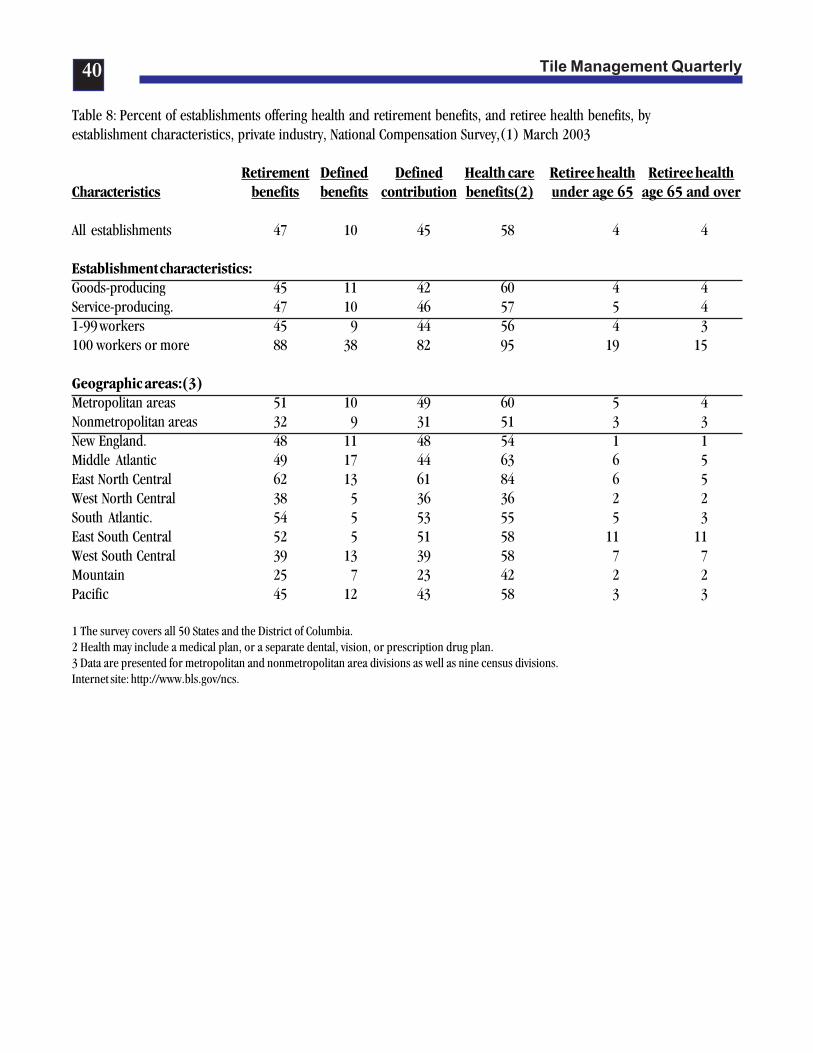
Tile Management Quarterly40
Table 8: Percent of establishments offering health and retirement benefits, and retiree health benefits, byestablishment characteristics, private industry, National Compensation Survey,(1) March 2003
Retirement Defined Defined Health care Retiree health Retiree healthCharacteristics benefits benefits contribution benefits(2) under age 65 age 65 and over
All establishments 47 10 45 58 4 4
Establishment characteristics:Goods-producing 45 11 42 60 4 4Service-producing. 47 10 46 57 5 41-99 workers 45 9 44 56 4 3100 workers or more 88 38 82 95 19 15
Geographic areas:(3)Metropolitan areas 51 10 49 60 5 4Nonmetropolitan areas 32 9 31 51 3 3New England. 48 11 48 54 1 1Middle Atlantic 49 17 44 63 6 5East North Central 62 13 61 84 6 5West North Central 38 5 36 36 2 2South Atlantic. 54 5 53 55 5 3East South Central 52 5 51 58 11 11West South Central 39 13 39 58 7 7Mountain 25 7 23 42 2 2Pacific 45 12 43 58 3 3
1 The survey covers all 50 States and the District of Columbia.2 Health may include a medical plan, or a separate dental, vision, or prescription drug plan.3 Data are presented for metropolitan and nonmetropolitan area divisions as well as nine census divisions.Internet site: http://www.bls.gov/ncs.

Tile Management Quarterly41
Welcome New Members!American Business Computers
Joe Flannick 215-322-8333
Halex CorporationJamie Makuuchi 909-622-3537
Klein and Company, Inc.Kathy Waldrop 770-345-6334
North American Tile Tool Co.Brian H. Turner 859-525-8891
Melcer Tile Co., Inc.Jay Rauton 843-744-5345
Pacific Tile ImportsMargaret Sheen 808-245-1765
Questech CorporationGary Marmer 802-773-1228
Tropical Tile & Marble Distrib.Juan Suarez 305-823-2360
SI CorporationKirk Smith 800-901-2288
Viking Distributors, Inc.Galen Vicknair 225-926-4993
Calendar of EventsITSS Expo Las Vegas
October 21-23, 2004Las Vegas, NV
CTDA Management ConferenceNovember 4-7, 2004Cancun, Mexico
SurfacesJanuary 26-28, 2005 (Exhibits)January 25-28, 2005 (Conference)Las Vegas, NV
Global Tile & Stone ExpoJanuary 27-29, 2005Las Vegas, NV
CevisamaFebruary 8-12, 2005Valencia, Spain
RevestirMarch 8-11, 2005Sao Paulo, Brazil
Stonetech 2005 BeijingMarch 14-17, 2005Beijing, China
The Miami ExpoMarch 23-25, 2005Miami, FL
CoveringsMay 3-6, 2005Orlando, FL