Embed Size (px)
Citation preview
TIIG Merseyside and Cheshire Themed ReportWinter Injuries across Merseyside and Cheshire (2011/12 to 2013/14)
December 2014
Jennifer Brizell, Stuart Cole, Karen A Critchley and Mark WhitfieldCentre for Public Health Research Directorate Faculty of Education, Health and Community Liverpool John Moores University 2nd Floor, Henry Cotton Building 15-21 Webster Street Liverpool L3 2ET
Tel: 0151 231 4314 Fax: 0151 231 4552
[email protected] www.tiig.info
www.cph.org.uk www.twitter.com/tiig_cph
ISBN: 978-1-908929-85-3 (web)

TIIG Merseyside and Cheshire Themed ReportPage 1
TIIG | Winter Injuries across Merseyside and Cheshire Page | 3
CONTENTS
Foreword ............................................................................................................................................................................................. 4
Acknowledgements ............................................................................................................................................................................. 4
Key findings ......................................................................................................................................................................................... 5
Introduction ......................................................................................................................................................................................... 6
Methods .............................................................................................................................................................................................. 6
Winter injury attendances across Merseyside and Cheshire .............................................................................................................. 8
Number of injury attendances and trends ...................................................................................................................................... 8
Area of residency .......................................................................................................................................................................... 10
Patient demographics ................................................................................................................................................................... 15
Injury group ................................................................................................................................................................................... 17
Incident location ........................................................................................................................................................................... 20
Referral source .............................................................................................................................................................................. 20
Arrival mode .................................................................................................................................................................................. 21
Disposal method ........................................................................................................................................................................... 21
Winter injury attendances by local authority districts ...................................................................................................................... 23
Cheshire East ................................................................................................................................................................................. 24
Cheshire West and Chester ........................................................................................................................................................... 26
Halton ............................................................................................................................................................................................ 28
Warrington .................................................................................................................................................................................... 30
Knowsley ....................................................................................................................................................................................... 32
Liverpool ....................................................................................................................................................................................... 34
Sefton ............................................................................................................................................................................................ 36
St Helens ....................................................................................................................................................................................... 38
Wirral ............................................................................................................................................................................................ 40
Ambulance call outs across Merseyside and Cheshire ...................................................................................................................... 42
Number of call outs and trends .................................................................................................................................................... 42
Location of call out ........................................................................................................................................................................ 42
Patient demographics ................................................................................................................................................................... 45
Incident type ................................................................................................................................................................................. 46
References ......................................................................................................................................................................................... 47
TIIG Merseyside and Cheshire Themed Report Page 2
TIIG | Winter Injuries across Merseyside and Cheshire Page | 4
FOREWORD
Increasing pressures on hospitals during winter are not confined to A&E departments. Whilst A&E injury attendances are
generally lower during winter periods, the number of patients who are admitted into hospital peak over winter months and
often those patients requiring sustained care over winter periods are those who are elderly. Apparent from this report is that
whilst those aged 60 years and over do not form the majority of winter injury A&E attendances they do account for the largest
proportion of those who are admitted into hospital, highlighting pressures not just on A&E department but on numerous other
departments throughout hospitals across Merseyside and Cheshire.
This report offers vital evidence in highlighting those most at risk of injury during winter, the most prevalent types of injury
which occur and geographically where these injuries are most likely to occur.
For those working in the field of accidental injuries and particularly those working in elderly care, I hope this report is useful for
you in taking action to reduce injuries during the winter period.
Dr Fiona Lemmens
Aintree Park Group Practice
Liverpool CCG Urgent Care Lead
Chair of the North Mersey System Resilience Group
ACKNOWLEDGEMENTS
With thanks to the emergency departments involved with the collection of the data used in this report and to the North West
Ambulance Service for providing ambulance call out data. Thank you also to the Trauma and Injury Intelligence Group (TIIG)
Merseyside and Cheshire Steering Group for their continued involvement in TIIG. Finally, thank you to our colleagues at the
Centre for Public Health; Howard Reed for his assistance in producing the maps; and, Sarah Birtwistle, Jamie Deville and Jane
Harris for their assistance in proof reading this report.

TIIG Merseyside and Cheshire Themed ReportPage 3
TIIG | Winter Injuries across Merseyside and Cheshire Page | 5
KEY FINDINGS
There were a total of 236,413 winter injury attendances to Merseyside and Cheshire’s emergency departments
(EDs) between 2011/12 and 2013/14; of which, 216,997 were residents of Merseyside and Cheshire (92%).
Liverpool local authority had the highest number of attendances across the whole of Merseyside and Cheshire
representing 24% of all winter injuries made by Merseyside and Cheshire residents.
The crude rate of attendances to Merseyside and Cheshire’s EDs was 8,961.6 per 100,000 resident population.
Local authority districts significantly worse than the average for Merseyside and Cheshire were Knowsley, Sefton,
Liverpool and Halton.
January consistently saw the most injury attendances across all three reported winter periods (n=81,952).
Just over half (51%) of winter injury attendees were male.
One-‐third (33%) of attendees were aged between 30 and 59 years, followed by one-‐quarter (25%) aged 60 years
plus, 24% were aged between 15 and 29 years and 18% were aged 14 years and under.
Almost three-‐quarters (74%) of attendances were recorded as ‘other injury’.
Falls accounted for 10% of winter injury attendances; winter 2011/12 had the highest number of falls (n=8,034
attendances) and patients aged 60 years plus accounted for 45% of all fall-‐related injuries.
Road traffic collisions accounted for 5% of injury attendances; of which, 43% were aged between 30 and 59 years.
The primary incident location was the home (53%).
Over three-‐fifths (63%) of attendees self-‐referred and just under one-‐tenth (9%) were referred by the emergency
services.
Thirty-‐six per cent of winter injury attendees arrived at the department by private transport while 28% arrived by
ambulance.
Thirty-‐nine per cent of attendees were discharged with no follow-‐up treatment required, 35% required further
treatment for their injuries and 21% were admitted to hospital.
There were 53,131 ambulance call outs due to injury during winter between 2011/12 and 2013/14 across
Merseyside and Cheshire.
Almost one-‐quarter (23%) of ambulance call outs were to Liverpool local authority.
Over half (55%) of all ambulance call outs were due to injuries sustained by a fall.
TIIG Merseyside and Cheshire Themed Report Page 4
TIIG | Winter Injuries across Merseyside and Cheshire Page | 6
INTRODUCTION
Winter is often associated with a rise in patient numbers during the cold weather, thus having an impact on health services. The
very young, chronically ill and the elderly are those among the most vulnerable during the winter months (The British Medical
Association [BMA], 2013), and patients presenting to emergency departments (EDs) and general practitioners (GPs) with cold
and flu symptoms peak during this time, putting additional strain on health services (Dean, 1997).
Elderly attendees to an ED are more likely to require a hospital bed than younger attendees. The NHS reported that there is an
over 80% chance of persons over the age of 75 years requiring admission to hospital from an A&E attendance, compared to just
a 20% chance of those aged under 30 years (NHS 2013a). The Department of Health have recently reported that an ageing
population was putting pressure on ED services over winter and that extra doctors would help reduce this burden (British
Broadcasting Corporation [BBC], 2014). In response, the Health Secretary, Jeremy Hunt, has announced plans to recruit an extra
260 doctors to help ease pressures on EDs during winter 2014/15 (BBC, 2014).
The Trauma and Injury Intelligence Group (TIIG) Injury Surveillance System warehouses data collected by the EDs across the
North West of England and the North West Ambulance Service (NWAS). Using data collated by TIIG, this report provides an
indication of the burden of winter injuries on health services and residents of Merseyside and Cheshire between 2011/12 and
2013/14. It can be used by local partners to inform prevention strategies and support local work in relation to injuries sustained
during winter.
METHODS
The following data were extracted from the TIIG Injury Surveillance System:
All injury attendances to the EDs across Merseyside and Cheshire (see Box 1)A during winter between 2011/12 and
2013/14B;
Ambulance call outs due to injury across Merseyside and Cheshire during winter between 2011/12 and 2013/14B
(sourced through the North West Ambulance Service).
ED attendances were analysed to explore and report on the extent of injuries across Merseyside and Cheshire over the past
three winter periods. Data are presented to show an overall picture of winter injury attendances, and then broken down by each
local authority district to assist local partners. Ambulance call outs during winter between 2011/12 and 2013/14 have been
analysed and included to supplement this report.
A Due to a high volume of Merseyside residents (particularly from Sefton local authority) attending Ormskirk District General Hospital in Lancashire (n=3,035), attendances to this hospital have been included in the analyses. B Winter attendances are categorised as those which occurred in December, January and February of each financial year.

TIIG Merseyside and Cheshire Themed ReportPage 5
TIIG | Winter Injuries across Merseyside and Cheshire Page | 7
Figures do not relate to individuals, but to the number of ED attendances and the number of ambulance call outs; for example,
an individual could present to an ED more than once during the three-‐year period but all attendances made by the individual
have been included in the analyses. Where figures have been presented for Merseyside and Cheshire residents only presenting
to an ED, this is based on the postcode of residency where complete and correctC.
Please note that this report looks at data for injury and trauma only; data for non-‐trauma ED attendances and ambulance call
outs (e.g. generally unwell, influenza, coughs and colds, viruses etc.) are not reported, except for Aintree University Hospital due
to the way the IT system records data. Figures for Aintree University Hospital therefore will skew the results, particularly for
Knowsley, Liverpool and Sefton local authorities as residents of these areas tend to present to this ED.
Crude rates were calculated for each local authority per 100,000 resident population across Merseyside and Cheshire (using
Office for National Statistics mid-‐2013 population estimates). To identify where there were significant differences between areas,
95% confidence intervals (CIs)D were calculated.
For all tables, numbers less than five have been suppressed (with ***) in line with patient confidentiality. If there is only one
number less than five in a category then a second number has been suppressed to prevent back calculations from totals (e.g.
<15). Also note that percentages may not add up to 100% due to rounding.
C The following hospitals do not provide TIIG with the patients’ full postcode; however the Lower Super Output Area (LSOA) and Middle Super Output Area (MSOA) are reported: Southport and Formby District General Hospital, Macclesfield District General Hospital, Ormskirk District General Hospital, The Royal Liverpool University Hospital and Whiston Hospital.
Super Output Areas (SOAs) are used in the reporting of small area statistics; for more information visit: http://www.ons.gov.uk/ons/guide-‐method/geography/beginner-‐s-‐guide/census/super-‐output-‐areas-‐-‐soas-‐/index.html. D Confidence intervals (CIs) are a range of values indicating the uncertainty there is around the estimation of a calculated rate; the wider the CI, the more uncertainty there is. CIs are normally calculated at a 95% confidence level, representing the range in which the true population value will lie 95 out of 100 times (Association of Public Health Observatories, 2008).
Box 1: Hospitals included in analyses
Location Hospital Service(s) (ED/UCC)^
Merseyside
Aintree University Hospital ED Alder Hey Children’s Hospital ED Arrowe Park Hospital ED Southport and Formby District General Hospital ED The Royal Liverpool University Hospital ED Whiston Hospital ED
Cheshire
Countess of Chester Hospital ED & UCC Leighton Hospital ED & UCC Macclesfield District General Hospital ED Warrington Hospital ED
Lancashire Ormskirk District General Hospital ED & UCC
^ ED = Emergency Department; UCC = Urgent Care Centre. For the purpose of this report, ‘EDs’ refer to all the hospitals listed in this table, whether ED and/or UCC services are provided.
TIIG Merseyside and Cheshire Themed Report Page 6
TIIG | Winter Injuries across Merseyside and Cheshire Page | 8
WINTER INJURY ATTENDANCES ACROSS MERSEYSIDE AND CHESHIRE
NUMBER OF INJURY ATTENDANCES AND TRENDS
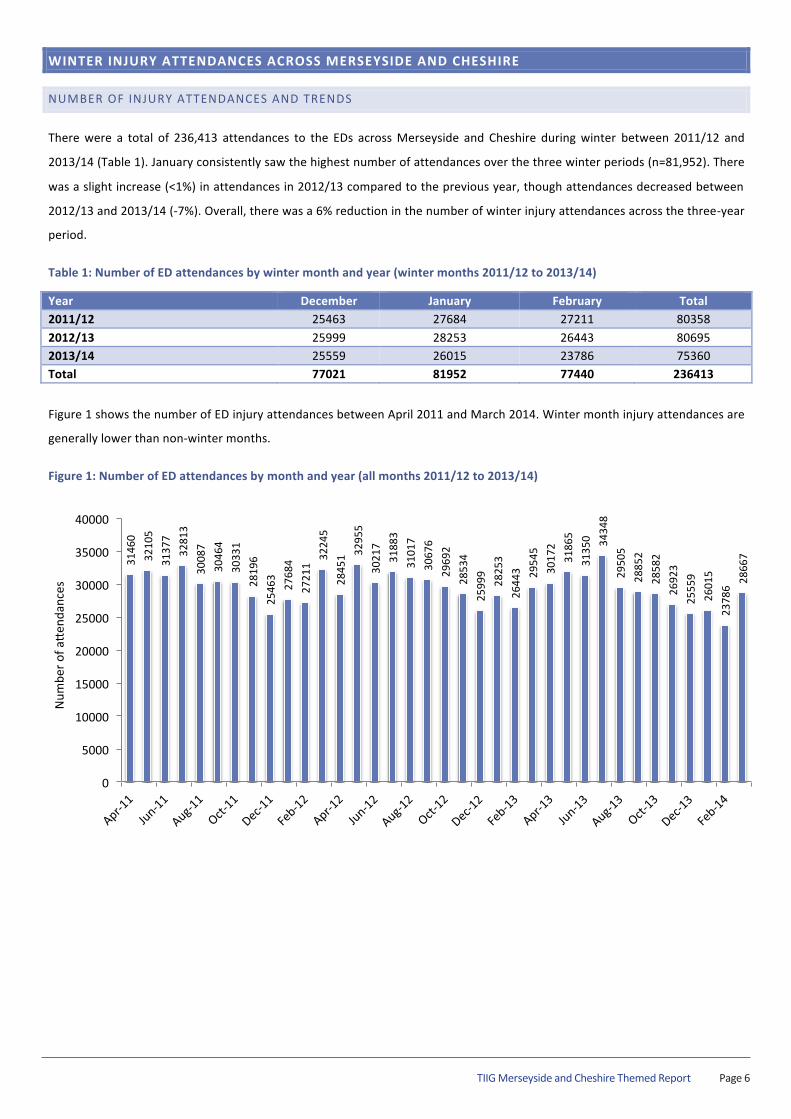
There were a total of 236,413 attendances to the EDs across Merseyside and Cheshire during winter between 2011/12 and
2013/14 (Table 1). January consistently saw the highest number of attendances over the three winter periods (n=81,952). There
was a slight increase (<1%) in attendances in 2012/13 compared to the previous year, though attendances decreased between
2012/13 and 2013/14 (-‐7%). Overall, there was a 6% reduction in the number of winter injury attendances across the three-‐year
period.
Table 1: Number of ED attendances by winter month and year (winter months 2011/12 to 2013/14)
Year December January February Total 2011/12 25463 27684 27211 80358 2012/13 25999 28253 26443 80695 2013/14 25559 26015 23786 75360 Total 77021 81952 77440 236413
Figure 1 shows the number of ED injury attendances between April 2011 and March 2014. Winter month injury attendances are
generally lower than non-‐winter months.
Figure 1: Number of ED attendances by month and year (all months 2011/12 to 2013/14)
3146
0 32
105
3137
7 32
813
3008
7 30
464
3033
1 28
196
2546
3 27
684
2721
1 32
245
2845
1 3295
5 30
217
3188
3 31
017
3067
6 29
692
2853
4 25
999
2825
3 26
443 29
545
3017
2 31
865
3135
0 3434
8 29
505
2885
2 28
582
2692
3 25
559
2601
5 23
786
2866
7
0
5000
10000
15000
20000
25000
30000
35000
40000
Num
ber o
f ao
enda
nces
TIIG Merseyside and Cheshire Themed ReportPage 7
TIIG | Winter Injuries across Merseyside and Cheshire Page | 9
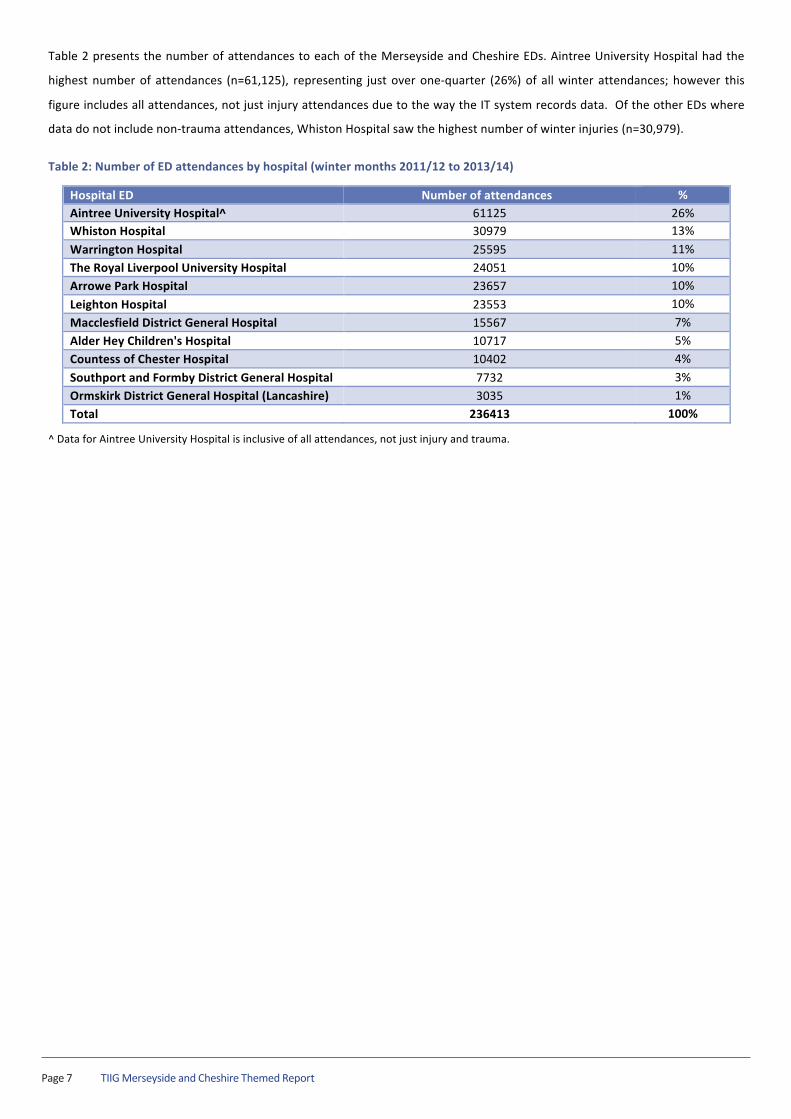
Table 2 presents the number of attendances to each of the Merseyside and Cheshire EDs. Aintree University Hospital had the
highest number of attendances (n=61,125), representing just over one-‐quarter (26%) of all winter attendances; however this
figure includes all attendances, not just injury attendances due to the way the IT system records data. Of the other EDs where
data do not include non-‐trauma attendances, Whiston Hospital saw the highest number of winter injuries (n=30,979).
Table 2: Number of ED attendances by hospital (winter months 2011/12 to 2013/14)
^ Data for Aintree University Hospital is inclusive of all attendances, not just injury and trauma.
Hospital ED Number of attendances % Aintree University Hospital^ 61125 26% Whiston Hospital 30979 13% Warrington Hospital 25595 11% The Royal Liverpool University Hospital 24051 10% Arrowe Park Hospital 23657 10% Leighton Hospital 23553 10% Macclesfield District General Hospital 15567 7% Alder Hey Children's Hospital 10717 5% Countess of Chester Hospital 10402 4% Southport and Formby District General Hospital 7732 3% Ormskirk District General Hospital (Lancashire) 3035 1% Total 236413 100%

TIIG Merseyside and Cheshire Themed Report Page 8
TIIG | Winter Injuries across Merseyside and Cheshire Page | 10
AREA OF RESIDENCY
Merseyside and Cheshire residents accounted for 92% of all attendances between the winter periods of 2011/12 and 2013/14
(n=216,997). The number and crude rate per 100,000 resident population of ED attendances during the winter months between
2011/12 and 2013/14 are presented in Table 3 and Figure 2. The crude rate of attendances across Merseyside and Cheshire was
8,961.6 per 100,000 population. Whilst Liverpool local authority accounted for the highest number of attendances, Knowsley
local authority had the highest crude rate at 15,258.1 per 100,000 population. As well as Knowsley, Sefton, Liverpool and Halton
local authorities were all significantly worse than the average for Merseyside and Cheshire.
It should be noted that many residents of Knowsley, Liverpool and Sefton local authorities attend Aintree University Hospital
which includes all attendances, not just injury and trauma, due to the way the IT system records data; therefore data for Aintree
University Hospital will skew the results, particularly for these local authority districts.
Table 3: Number and crude rate of ED attendances by local authority of residency, Merseyside and Cheshire residents (winter months 2011/12 to 2013/14)
Local authority Attendances Crude rate (per 100,000) 95% CI (lower) 95% CI (upper) Liverpool 52917 11240.3 11144.7 11336.5 Sefton 34581 12657.4 12524.4 12791.6 Cheshire East 28796 7726.2 7637.2 7815.9 Wirral 22476 7017.3 6925.8 7109.6 Knowsley 22290 15258.1 15058.5 15459.8 Cheshire West and Chester 15880 4797.2 4722.9 4872.4 Halton 13644 10831.2 10650.2 11014.4 Warrington 13549 6605.8 6495.0 6717.9 St Helens 12864 7300.0 7174.3 7427.2 Total 216997 8961.6 8924.0 8999.4
Figure 2: Crude rate of ED attendances by local authority of residency, Merseyside and Cheshire residents (winter months 2011/12 to 2013/14)
15258.1
12657.4
11240.3
10831.2
7726.2
7300.0
7017.3
6605.8
4797.2
8961.6
0 2000 4000 6000 8000 10000 12000 14000 16000 18000
Knowsley
Seqon
Liverpool
Halton
Cheshire East
St Helens
Wirral
Warrington
Cheshire West and Chester
Merseyside and Cheshire
Crude rate (per 100,000)
Loca
l aut
horit
y

TIIG Merseyside and Cheshire Themed ReportPage 9
TIIG | Winter Injuries across Merseyside and Cheshire Page | 11
Table 4 shows the 20 wards with the highest number of attendees presenting to an ED with injuries during winterE. A large
proportion of attendees were resident in Liverpool and Sefton local authorities.
Table 4: Number of ED attendances by ward of residency, Merseyside and Cheshire residents (winter months 2011/12 to 2013/14)
Ward name Ward code Local authority Number of attendances Warbreck 00BYGJ Liverpool 4118 Gillmoss 00BYFS Liverpool 3973 Fazakerley 00BYFR Liverpool 3468 County 00BYFL Liverpool 2949 Pirrie 00BYGB Liverpool 2916 St Oswald 00CAGW Liverpool 2894 Linacre 00CAGL Sefton 2864 Netherton and Orrell 00CAGR Sefton 2580 Derby 00CAGF Sefton 2535 Ford 00CAGH Sefton 2279 Molyneux 00CAGQ Sefton 2241 Melrose 00BYFX Liverpool 2220 Clubmoor 00BYFK Liverpool 2206 Church 00CAGE Sefton 2206 Tower Hill 00BXFU Knowsley 2065 Croxteth 00BYFM Liverpool 2051 Park 00CAGT Sefton 2041 Litherland 00CAGM Sefton 1998 Sudell 00CAGX Sefton 1963 Tuebrook 00BYGF Liverpool 1874
E A full ward breakdown is available upon request.
TIIG Merseyside and Cheshire Themed Report Page 10
TIIG | Winter Injuries across Merseyside and Cheshire Page | 12
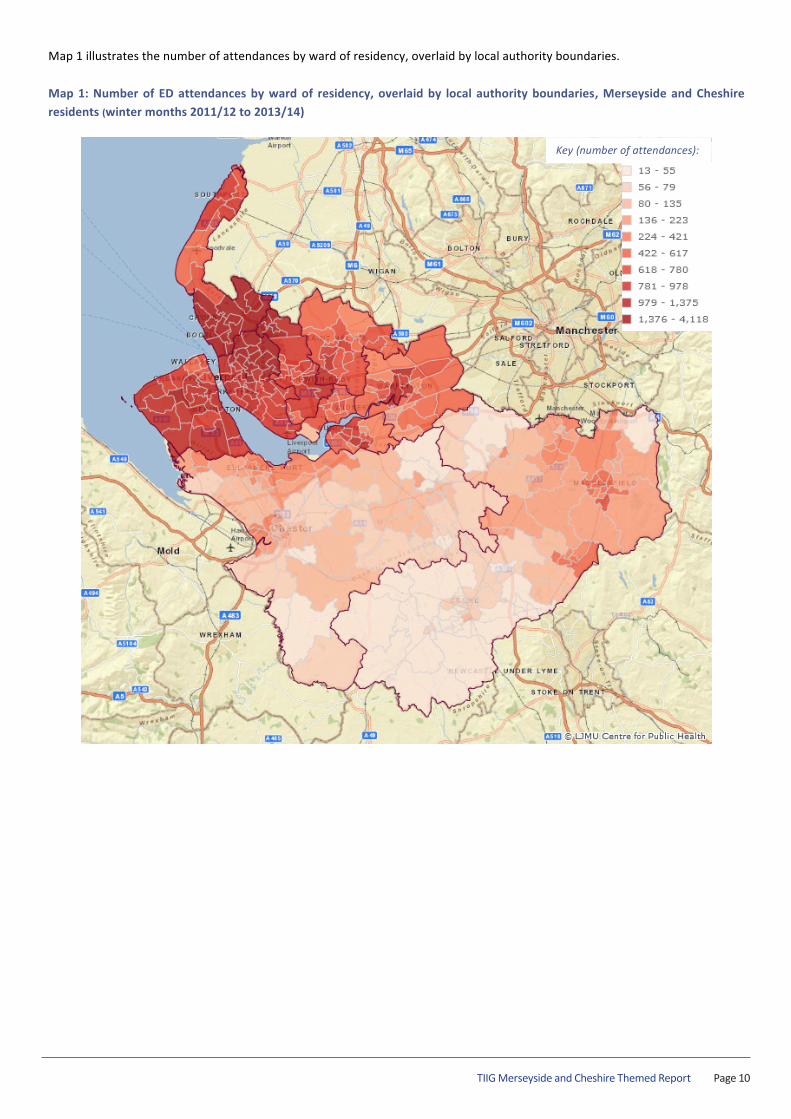
Map 1 illustrates the number of attendances by ward of residency, overlaid by local authority boundaries.
Map 1: Number of ED attendances by ward of residency, overlaid by local authority boundaries, Merseyside and Cheshire residents (winter months 2011/12 to 2013/14)
Key (number of attendances):
TIIG Merseyside and Cheshire Themed ReportPage 11
TIIG | Winter Injuries across Merseyside and Cheshire Page | 13
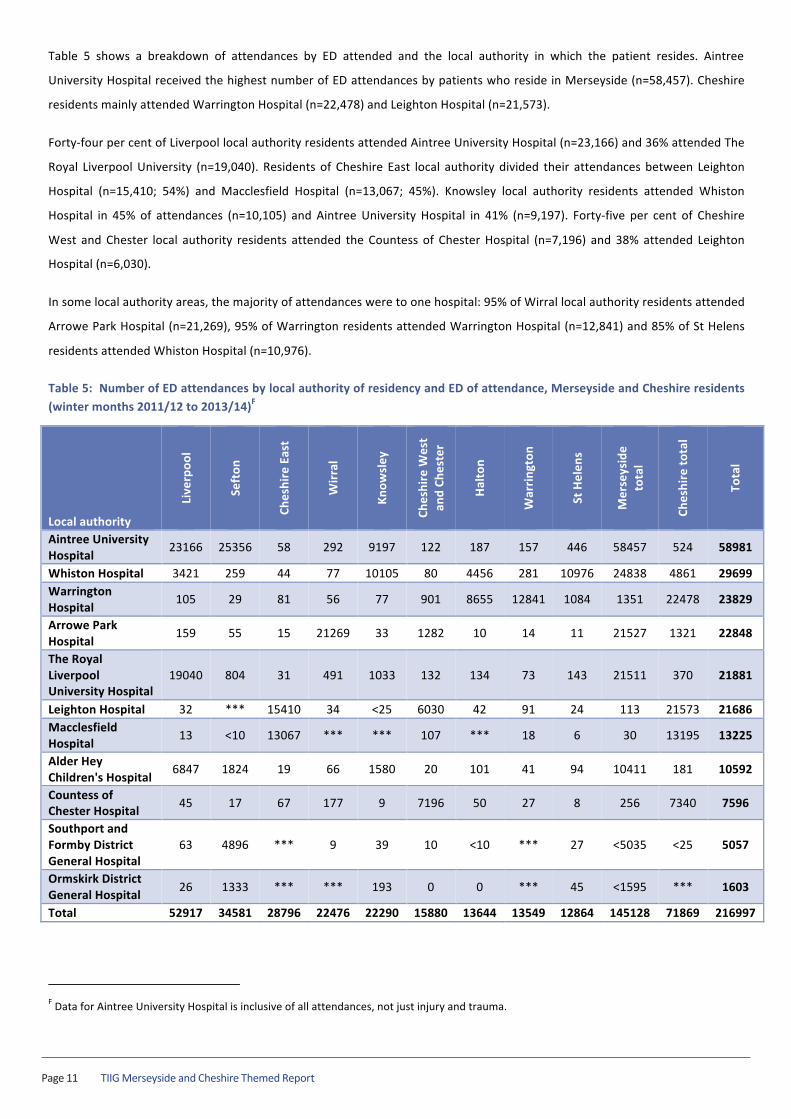
Table 5 shows a breakdown of attendances by ED attended and the local authority in which the patient resides. Aintree
University Hospital received the highest number of ED attendances by patients who reside in Merseyside (n=58,457). Cheshire
residents mainly attended Warrington Hospital (n=22,478) and Leighton Hospital (n=21,573).
Forty-‐four per cent of Liverpool local authority residents attended Aintree University Hospital (n=23,166) and 36% attended The
Royal Liverpool University (n=19,040). Residents of Cheshire East local authority divided their attendances between Leighton
Hospital (n=15,410; 54%) and Macclesfield Hospital (n=13,067; 45%). Knowsley local authority residents attended Whiston
Hospital in 45% of attendances (n=10,105) and Aintree University Hospital in 41% (n=9,197). Forty-‐five per cent of Cheshire
West and Chester local authority residents attended the Countess of Chester Hospital (n=7,196) and 38% attended Leighton
Hospital (n=6,030).
In some local authority areas, the majority of attendances were to one hospital: 95% of Wirral local authority residents attended
Arrowe Park Hospital (n=21,269), 95% of Warrington residents attended Warrington Hospital (n=12,841) and 85% of St Helens
residents attended Whiston Hospital (n=10,976).
Table 5: Number of ED attendances by local authority of residency and ED of attendance, Merseyside and Cheshire residents (winter months 2011/12 to 2013/14)F
Local authority
Live
rpoo
l
Sefton
Cheshire East
Wirr
al
Know
sley
Cheshire W
est
and Ch
ester
Halton
Warrin
gton
St Helen
s
Merseyside
total
Cheshire to
tal
Total
Aintree University Hospital
23166 25356 58 292 9197 122 187 157 446 58457 524 58981
Whiston Hospital 3421 259 44 77 10105 80 4456 281 10976 24838 4861 29699 Warrington Hospital
105 29 81 56 77 901 8655 12841 1084 1351 22478 23829
Arrowe Park Hospital
159 55 15 21269 33 1282 10 14 11 21527 1321 22848
The Royal Liverpool University Hospital
19040 804 31 491 1033 132 134 73 143 21511 370 21881
Leighton Hospital 32 *** 15410 34 <25 6030 42 91 24 113 21573 21686 Macclesfield Hospital
13 <10 13067 *** *** 107 *** 18 6 30 13195 13225
Alder Hey Children's Hospital
6847 1824 19 66 1580 20 101 41 94 10411 181 10592
Countess of Chester Hospital 45 17 67 177 9 7196 50 27 8 256 7340 7596
Southport and Formby District General Hospital
63 4896 *** 9 39 10 <10 *** 27 <5035 <25 5057
Ormskirk District General Hospital 26 1333 *** *** 193 0 0 *** 45 <1595 *** 1603
Total 52917 34581 28796 22476 22290 15880 13644 13549 12864 145128 71869 216997
F Data for Aintree University Hospital is inclusive of all attendances, not just injury and trauma.
TIIG Merseyside and Cheshire Themed Report Page 12
TIIG | Winter Injuries across Merseyside and Cheshire Page | 14
SELF-‐TREATMENT: EASING THE STRAIN THROUGH PHARMACIES
Many patients suffering ill-‐health during the winter months will visit a primary care centre. GPs are currently seeing more
patients than ever before, as data from 2009 shows an increase of 80 million GP consultations since 1995 (Health and
Social Care Information Centre, 2009). This was estimated at 120 million more in 2013 compared to 1995, at around 340
million GP consultations per year (NHS, 2013b).
Patients visiting GPs for cold and flu symptoms during the winter months are estimated to cost the NHS £35.2 million per
year, with the vast majority of such consultations reported as unnecessary (NHS, 2013a). According to data from
Doctors.net.uk Limited (2013), 86% of GPs believed that patients who presented during the winter period could have
received the same treatment from a pharmacist. Furthermore, 99% of GPs reported receiving unnecessary visits from
patients suffering from colds during winter and over two-‐fifths of people (44%) visited their GP, expecting to be
prescribed antibiotics, which would have no effect on cold and flu illness (Proprietary Association of Great Britain and
Pharmacy Voice, 2013).
In response to the suggestion that patients may be unnecessarily contributing to the strain on GPs and EDs, the
Proprietary Association of Great Britain and Pharmacy Voice launched the Treat Yourself Better campaign. As little as one
in five (21%) adults currently use their local pharmacy for expert advice, rather than visiting their GP. The campaign
provides an online resource to inform those suffering from cold and flu symptoms on how to access treatment and advice
from a pharmacist, as opposed to a GP or walk-‐in centre (Proprietary Association of Great Britain and Pharmacy Voice,
2013 and 2014). Research on patient beliefs and expectations regarding the prescription of antibiotics shows that one-‐
fifth of people experiencing a respiratory tract infection expected to receive antibiotics. Almost everyone in the study
who requested their GP to prescribe antibiotics were given them, although one-‐quarter of patients who received
antibiotics, did not finish the prescribed course (McNulty et al., 2013).
In 2013, the NHS rolled out the Examine Your Options campaign in Merseyside. This campaign aims to inform the public
about health care and treatment options available to them during the winter months. The campaign, which includes
posters on public transport, reminds people to make use of NHS walk-‐in services, GP out of hours service, NHS Direct,
pharmacists and the NHS website (Liverpool Clinical Commissioning Group, 2013).
For more information visit:
www.treatyourselfbetter.co.uk and http://www.liverpoolccg.nhs.uk/News/2013/november/examine_your_options.aspx.
TIIG Merseyside and Cheshire Themed ReportPage 13
TIIG | Winter Injuries across Merseyside and Cheshire Page | 15
PATIENT DEMOGRAPHICS
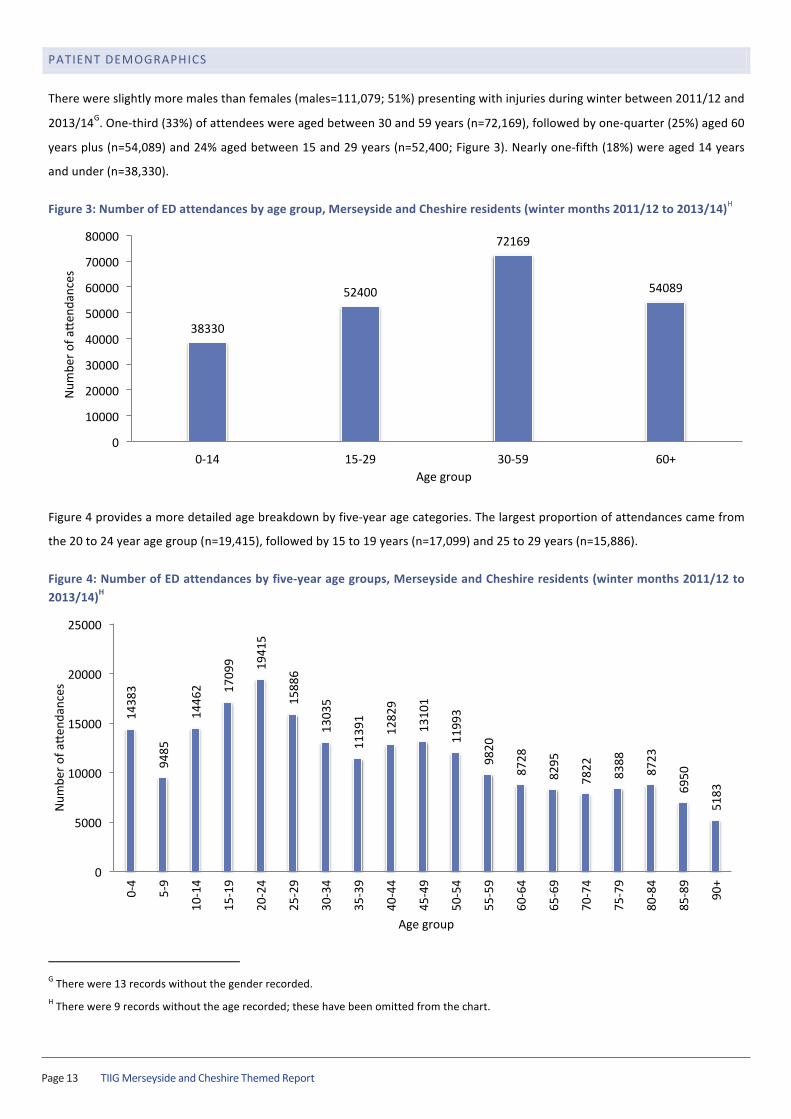
There were slightly more males than females (males=111,079; 51%) presenting with injuries during winter between 2011/12 and
2013/14G. One-‐third (33%) of attendees were aged between 30 and 59 years (n=72,169), followed by one-‐quarter (25%) aged 60
years plus (n=54,089) and 24% aged between 15 and 29 years (n=52,400; Figure 3). Nearly one-‐fifth (18%) were aged 14 years
and under (n=38,330).
Figure 3: Number of ED attendances by age group, Merseyside and Cheshire residents (winter months 2011/12 to 2013/14)H
Figure 4 provides a more detailed age breakdown by five-‐year age categories. The largest proportion of attendances came from
the 20 to 24 year age group (n=19,415), followed by 15 to 19 years (n=17,099) and 25 to 29 years (n=15,886).
Figure 4: Number of ED attendances by five-‐year age groups, Merseyside and Cheshire residents (winter months 2011/12 to 2013/14)H
G There were 13 records without the gender recorded. H There were 9 records without the age recorded; these have been omitted from the chart.
38330
52400
72169
54089
0
10000
20000
30000
40000
50000
60000
70000
80000
0-‐14 15-‐29 30-‐59 60+
Num
ber o
f ao
enda
nces
Age group
1438
3
9485
1446
2 1709
9 1941
5
1588
6
1303
5
1139
1
1282
9
1310
1
1199
3
9820
8728
8295
7822
8388
8723
6950
5183
0
5000
10000
15000
20000
25000
0-‐4
5-‐9
10-‐
14
15-‐1
9
20-‐2
4
25-‐2
9
30-‐3
4
35-‐3
9
40-‐4
4
45-‐4
9
50-‐5
4
55-‐5
9
60-‐6
4
65-‐6
9
70-‐7
4
75-‐7
9
80-‐8
4
85-‐8
9
90+
Num
ber o
f ao
enda
nces
Age group
TIIG Merseyside and Cheshire Themed Report Page 14
TIIG | Winter Injuries across Merseyside and Cheshire Page | 16
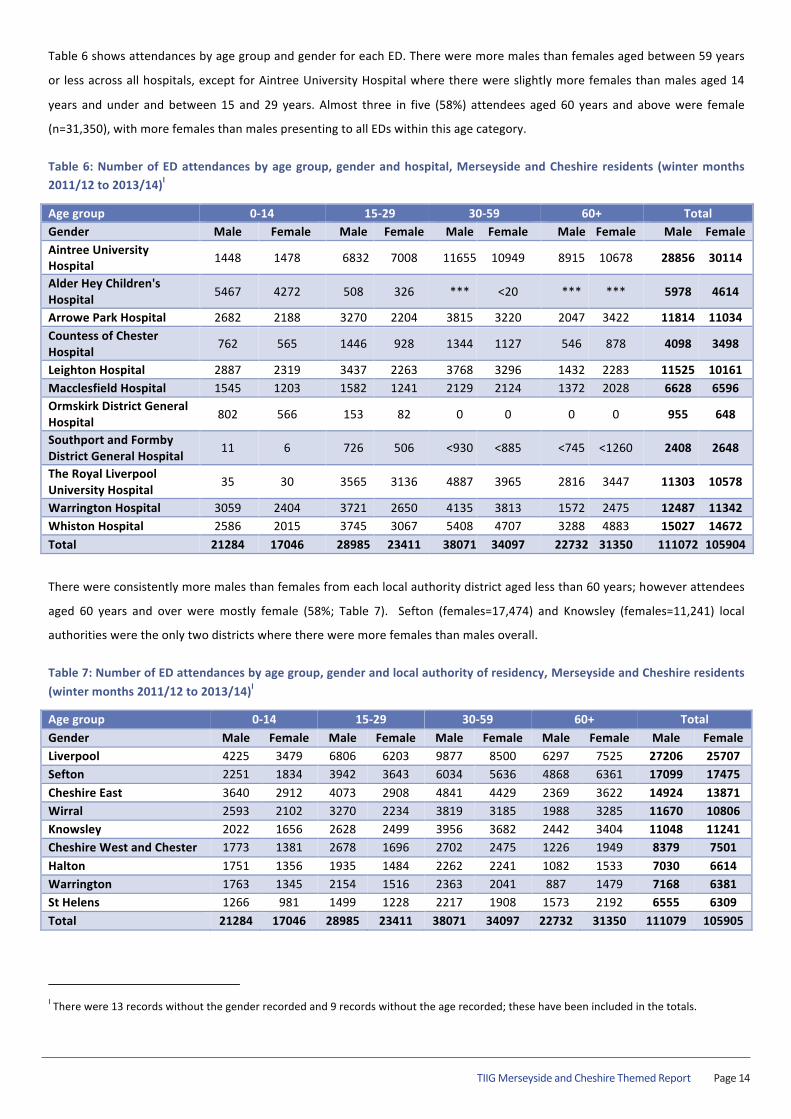
Table 6 shows attendances by age group and gender for each ED. There were more males than females aged between 59 years
or less across all hospitals, except for Aintree University Hospital where there were slightly more females than males aged 14
years and under and between 15 and 29 years. Almost three in five (58%) attendees aged 60 years and above were female
(n=31,350), with more females than males presenting to all EDs within this age category.
Table 6: Number of ED attendances by age group, gender and hospital, Merseyside and Cheshire residents (winter months 2011/12 to 2013/14)I
Age group 0-‐14 15-‐29 30-‐59 60+ Total Gender Male Female Male Female Male Female Male Female Male Female Aintree University Hospital 1448 1478 6832 7008 11655 10949 8915 10678 28856 30114
Alder Hey Children's Hospital 5467 4272 508 326 *** <20 *** *** 5978 4614
Arrowe Park Hospital 2682 2188 3270 2204 3815 3220 2047 3422 11814 11034 Countess of Chester Hospital
762 565 1446 928 1344 1127 546 878 4098 3498
Leighton Hospital 2887 2319 3437 2263 3768 3296 1432 2283 11525 10161 Macclesfield Hospital 1545 1203 1582 1241 2129 2124 1372 2028 6628 6596 Ormskirk District General Hospital 802 566 153 82 0 0 0 0 955 648
Southport and Formby District General Hospital
11 6 726 506 <930 <885 <745 <1260 2408 2648
The Royal Liverpool University Hospital
35 30 3565 3136 4887 3965 2816 3447 11303 10578
Warrington Hospital 3059 2404 3721 2650 4135 3813 1572 2475 12487 11342 Whiston Hospital 2586 2015 3745 3067 5408 4707 3288 4883 15027 14672 Total 21284 17046 28985 23411 38071 34097 22732 31350 111072 105904
There were consistently more males than females from each local authority district aged less than 60 years; however attendees
aged 60 years and over were mostly female (58%; Table 7). Sefton (females=17,474) and Knowsley (females=11,241) local
authorities were the only two districts where there were more females than males overall.
Table 7: Number of ED attendances by age group, gender and local authority of residency, Merseyside and Cheshire residents (winter months 2011/12 to 2013/14)I
Age group 0-‐14 15-‐29 30-‐59 60+ Total Gender Male Female Male Female Male Female Male Female Male Female Liverpool 4225 3479 6806 6203 9877 8500 6297 7525 27206 25707 Sefton 2251 1834 3942 3643 6034 5636 4868 6361 17099 17475 Cheshire East 3640 2912 4073 2908 4841 4429 2369 3622 14924 13871 Wirral 2593 2102 3270 2234 3819 3185 1988 3285 11670 10806 Knowsley 2022 1656 2628 2499 3956 3682 2442 3404 11048 11241 Cheshire West and Chester 1773 1381 2678 1696 2702 2475 1226 1949 8379 7501 Halton 1751 1356 1935 1484 2262 2241 1082 1533 7030 6614 Warrington 1763 1345 2154 1516 2363 2041 887 1479 7168 6381 St Helens 1266 981 1499 1228 2217 1908 1573 2192 6555 6309 Total 21284 17046 28985 23411 38071 34097 22732 31350 111079 105905
I There were 13 records without the gender recorded and 9 records without the age recorded; these have been included in the totals.
TIIG Merseyside and Cheshire Themed ReportPage 15
TIIG | Winter Injuries across Merseyside and Cheshire Page | 18
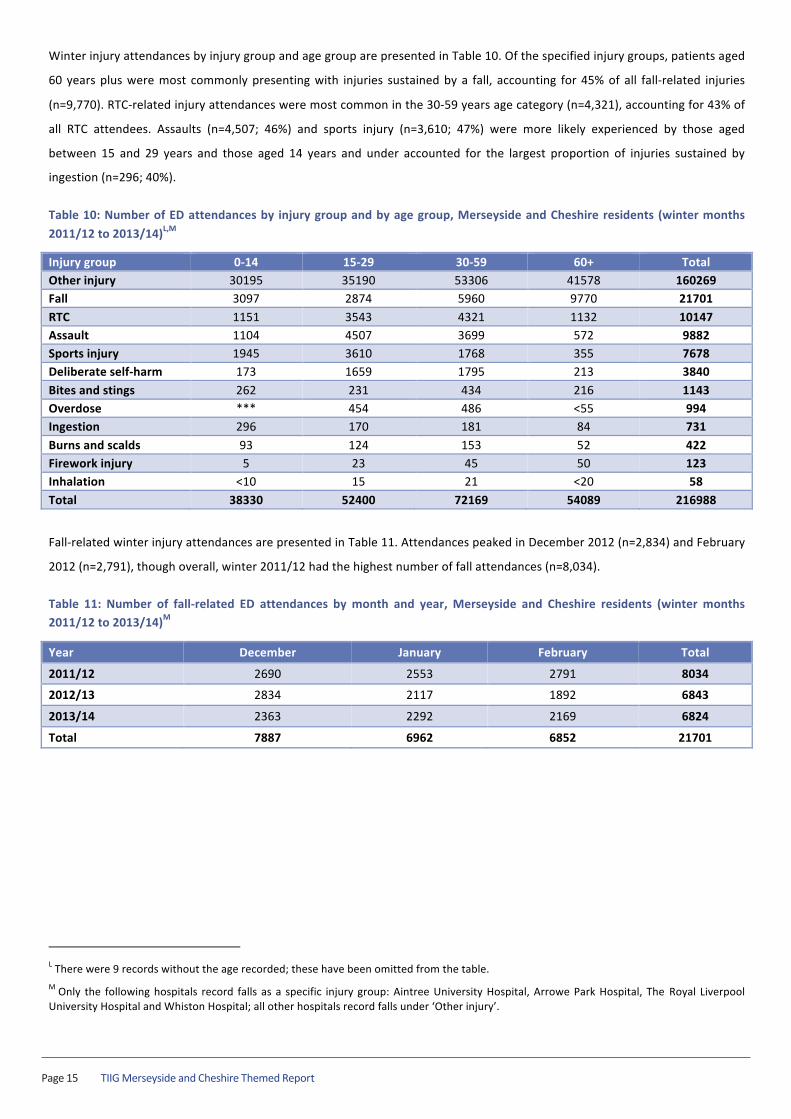
Winter injury attendances by injury group and age group are presented in Table 10. Of the specified injury groups, patients aged
60 years plus were most commonly presenting with injuries sustained by a fall, accounting for 45% of all fall-‐related injuries
(n=9,770). RTC-‐related injury attendances were most common in the 30-‐59 years age category (n=4,321), accounting for 43% of
all RTC attendees. Assaults (n=4,507; 46%) and sports injury (n=3,610; 47%) were more likely experienced by those aged
between 15 and 29 years and those aged 14 years and under accounted for the largest proportion of injuries sustained by
ingestion (n=296; 40%).
Table 10: Number of ED attendances by injury group and by age group, Merseyside and Cheshire residents (winter months 2011/12 to 2013/14)L,M
Injury group 0-‐14 15-‐29 30-‐59 60+ Total Other injury 30195 35190 53306 41578 160269 Fall 3097 2874 5960 9770 21701 RTC 1151 3543 4321 1132 10147 Assault 1104 4507 3699 572 9882 Sports injury 1945 3610 1768 355 7678 Deliberate self-‐harm 173 1659 1795 213 3840 Bites and stings 262 231 434 216 1143 Overdose *** 454 486 <55 994 Ingestion 296 170 181 84 731 Burns and scalds 93 124 153 52 422 Firework injury 5 23 45 50 123 Inhalation <10 15 21 <20 58 Total 38330 52400 72169 54089 216988
Fall-‐related winter injury attendances are presented in Table 11. Attendances peaked in December 2012 (n=2,834) and February
2012 (n=2,791), though overall, winter 2011/12 had the highest number of fall attendances (n=8,034).
Table 11: Number of fall-‐related ED attendances by month and year, Merseyside and Cheshire residents (winter months 2011/12 to 2013/14)M
Year December January February Total
2011/12 2690 2553 2791 8034
2012/13 2834 2117 1892 6843
2013/14 2363 2292 2169 6824
Total 7887 6962 6852 21701
L There were 9 records without the age recorded; these have been omitted from the table. M Only the following hospitals record falls as a specific injury group: Aintree University Hospital, Arrowe Park Hospital, The Royal Liverpool University Hospital and Whiston Hospital; all other hospitals record falls under ‘Other injury’.
TIIG Merseyside and Cheshire Themed Report Page 16
TIIG | Winter Injuries across Merseyside and Cheshire Page | 18
Winter injury attendances by injury group and age group are presented in Table 10. Of the specified injury groups, patients aged
60 years plus were most commonly presenting with injuries sustained by a fall, accounting for 45% of all fall-‐related injuries
(n=9,770). RTC-‐related injury attendances were most common in the 30-‐59 years age category (n=4,321), accounting for 43% of
all RTC attendees. Assaults (n=4,507; 46%) and sports injury (n=3,610; 47%) were more likely experienced by those aged
between 15 and 29 years and those aged 14 years and under accounted for the largest proportion of injuries sustained by
ingestion (n=296; 40%).
Table 10: Number of ED attendances by injury group and by age group, Merseyside and Cheshire residents (winter months 2011/12 to 2013/14)L,M
Injury group 0-‐14 15-‐29 30-‐59 60+ Total Other injury 30195 35190 53306 41578 160269 Fall 3097 2874 5960 9770 21701 RTC 1151 3543 4321 1132 10147 Assault 1104 4507 3699 572 9882 Sports injury 1945 3610 1768 355 7678 Deliberate self-‐harm 173 1659 1795 213 3840 Bites and stings 262 231 434 216 1143 Overdose *** 454 486 <55 994 Ingestion 296 170 181 84 731 Burns and scalds 93 124 153 52 422 Firework injury 5 23 45 50 123 Inhalation <10 15 21 <20 58 Total 38330 52400 72169 54089 216988
Fall-‐related winter injury attendances are presented in Table 11. Attendances peaked in December 2012 (n=2,834) and February
2012 (n=2,791), though overall, winter 2011/12 had the highest number of fall attendances (n=8,034).
Table 11: Number of fall-‐related ED attendances by month and year, Merseyside and Cheshire residents (winter months 2011/12 to 2013/14)M
Year December January February Total
2011/12 2690 2553 2791 8034
2012/13 2834 2117 1892 6843
2013/14 2363 2292 2169 6824
Total 7887 6962 6852 21701
L There were 9 records without the age recorded; these have been omitted from the table. M Only the following hospitals record falls as a specific injury group: Aintree University Hospital, Arrowe Park Hospital, The Royal Liverpool University Hospital and Whiston Hospital; all other hospitals record falls under ‘Other injury’.
TIIG | Winter Injuries across Merseyside and Cheshire Page | 19
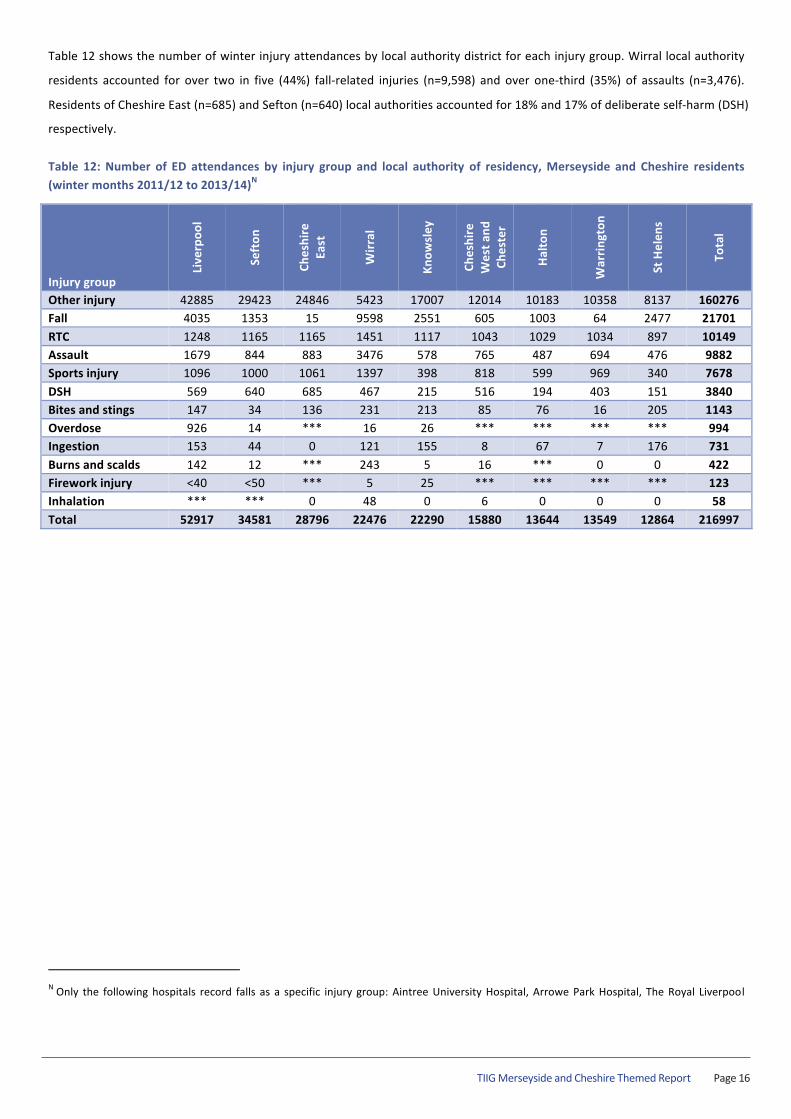
Table 12 shows the number of winter injury attendances by local authority district for each injury group. Wirral local authority
residents accounted for over two in five (44%) fall-‐related injuries (n=9,598) and over one-‐third (35%) of assaults (n=3,476).
Residents of Cheshire East (n=685) and Sefton (n=640) local authorities accounted for 18% and 17% of deliberate self-‐harm (DSH)
respectively.
Table 12: Number of ED attendances by injury group and local authority of residency, Merseyside and Cheshire residents (winter months 2011/12 to 2013/14)N
Injury group
Live
rpoo
l
Sefton
Cheshire
East
Wirr
al
Know
sley
Cheshire
West a
nd
Chester
Halton
Warrin
gton
St Helen
s
Total
Other injury 42885 29423 24846 5423 17007 12014 10183 10358 8137 160276 Fall 4035 1353 15 9598 2551 605 1003 64 2477 21701 RTC 1248 1165 1165 1451 1117 1043 1029 1034 897 10149 Assault 1679 844 883 3476 578 765 487 694 476 9882 Sports injury 1096 1000 1061 1397 398 818 599 969 340 7678 DSH 569 640 685 467 215 516 194 403 151 3840 Bites and stings 147 34 136 231 213 85 76 16 205 1143 Overdose 926 14 *** 16 26 *** *** *** *** 994 Ingestion 153 44 0 121 155 8 67 7 176 731 Burns and scalds 142 12 *** 243 5 16 *** 0 0 422 Firework injury <40 <50 *** 5 25 *** *** *** *** 123 Inhalation *** *** 0 48 0 6 0 0 0 58 Total 52917 34581 28796 22476 22290 15880 13644 13549 12864 216997
N Only the following hospitals record falls as a specific injury group: Aintree University Hospital, Arrowe Park Hospital, The Royal Liverpool University Hospital and Whiston Hospital; all other hospitals record falls under ‘Other injury’.
TIIG Merseyside and Cheshire Themed ReportPage 17
TIIG | Winter Injuries across Merseyside and Cheshire Page | 20
INCIDENT LOCATION
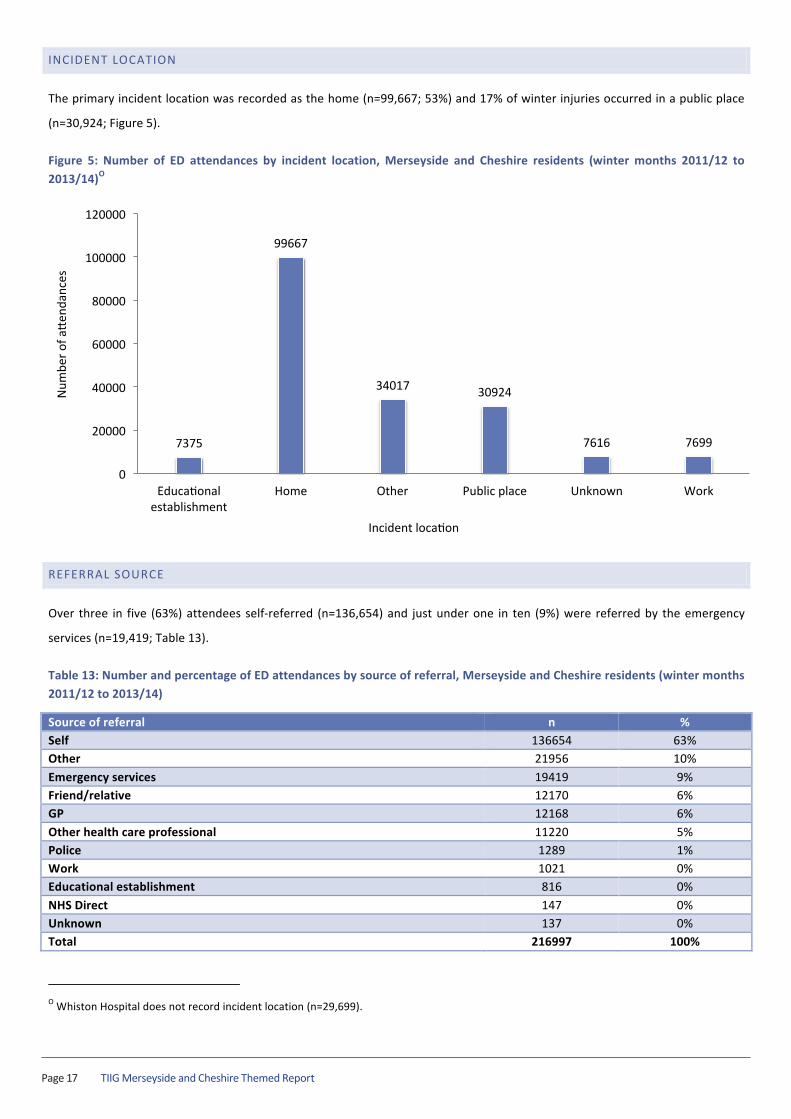
The primary incident location was recorded as the home (n=99,667; 53%) and 17% of winter injuries occurred in a public place
(n=30,924; Figure 5).
Figure 5: Number of ED attendances by incident location, Merseyside and Cheshire residents (winter months 2011/12 to 2013/14)O
REFERRAL SOURCE
Over three in five (63%) attendees self-‐referred (n=136,654) and just under one in ten (9%) were referred by the emergency
services (n=19,419; Table 13).
Table 13: Number and percentage of ED attendances by source of referral, Merseyside and Cheshire residents (winter months 2011/12 to 2013/14)
Source of referral n % Self 136654 63% Other 21956 10% Emergency services 19419 9% Friend/relative 12170 6% GP 12168 6% Other health care professional 11220 5% Police 1289 1% Work 1021 0% Educational establishment 816 0% NHS Direct 147 0% Unknown 137 0% Total 216997 100%
O Whiston Hospital does not record incident location (n=29,699).
7375
99667
34017 30924
7616 7699
0
20000
40000
60000
80000
100000
120000
Educawonal establishment
Home Other Public place Unknown Work
Num
ber o
f ao
enda
nces
Incident locawon
TIIG Merseyside and Cheshire Themed Report Page 18
TIIG | Winter Injuries across Merseyside and Cheshire Page | 21
ARRIVAL MODE
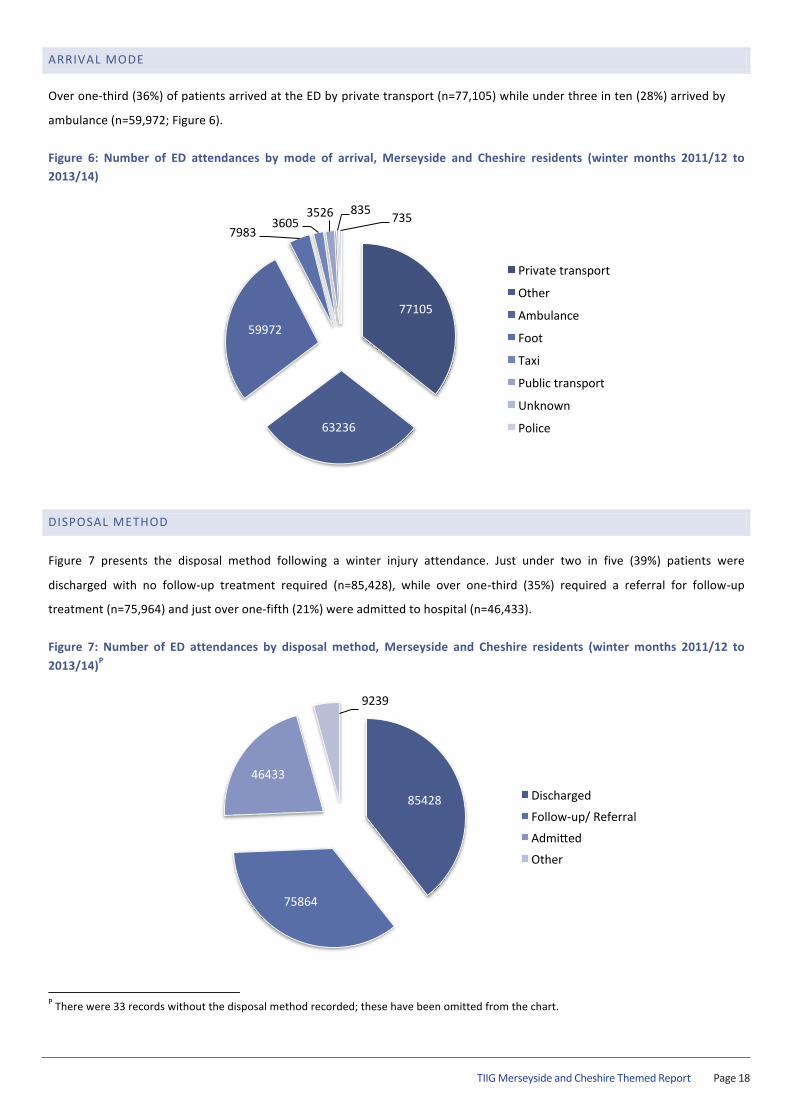
Over one-‐third (36%) of patients arrived at the ED by private transport (n=77,105) while under three in ten (28%) arrived by
ambulance (n=59,972; Figure 6).
Figure 6: Number of ED attendances by mode of arrival, Merseyside and Cheshire residents (winter months 2011/12 to 2013/14)
DISPOSAL METHOD
Figure 7 presents the disposal method following a winter injury attendance. Just under two in five (39%) patients were
discharged with no follow-‐up treatment required (n=85,428), while over one-‐third (35%) required a referral for follow-‐up
treatment (n=75,964) and just over one-‐fifth (21%) were admitted to hospital (n=46,433).
Figure 7: Number of ED attendances by disposal method, Merseyside and Cheshire residents (winter months 2011/12 to 2013/14)P
P There were 33 records without the disposal method recorded; these have been omitted from the chart.
77105
63236
59972
7983 3605
3526 835 735
Private transport
Other
Ambulance
Foot
Taxi
Public transport
Unknown
Police
85428
75864
46433
9239
Discharged
Follow-‐up/ Referral
Admioed
Other
TIIG Merseyside and Cheshire Themed ReportPage 19
TIIG | Winter Injuries across Merseyside and Cheshire Page | 22
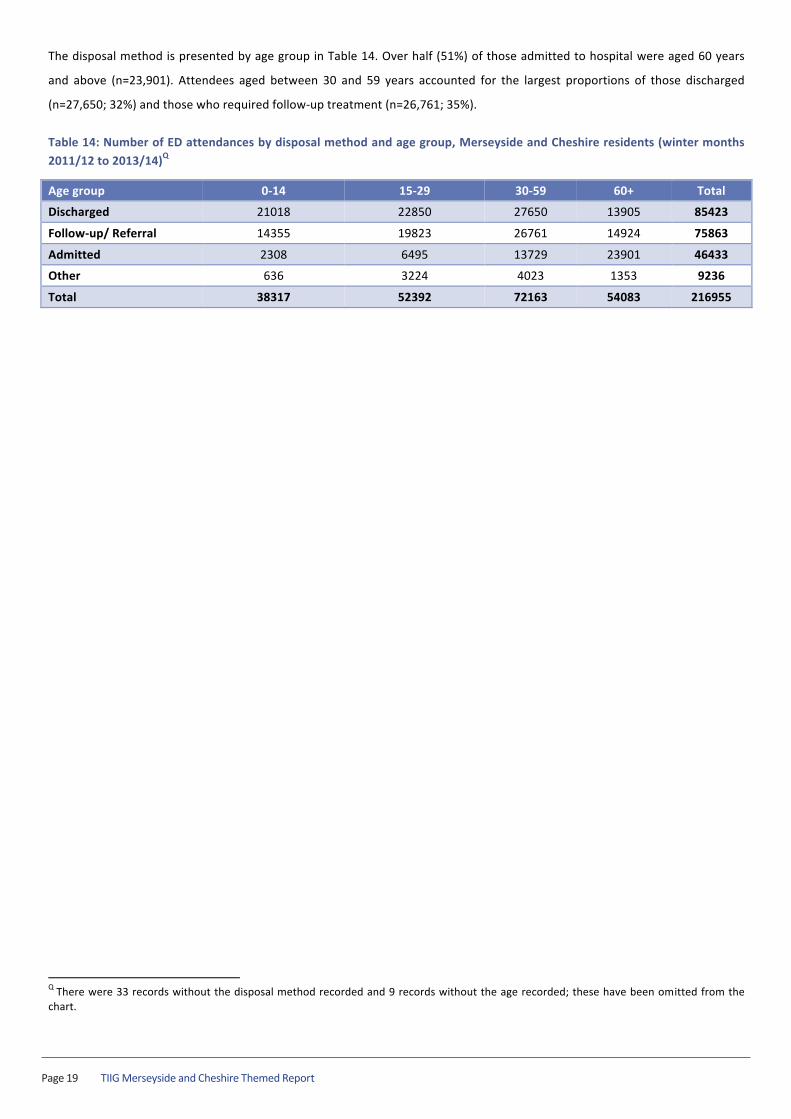
The disposal method is presented by age group in Table 14. Over half (51%) of those admitted to hospital were aged 60 years
and above (n=23,901). Attendees aged between 30 and 59 years accounted for the largest proportions of those discharged
(n=27,650; 32%) and those who required follow-‐up treatment (n=26,761; 35%).
Table 14: Number of ED attendances by disposal method and age group, Merseyside and Cheshire residents (winter months 2011/12 to 2013/14)Q
Age group 0-‐14 15-‐29 30-‐59 60+ Total
Discharged 21018 22850 27650 13905 85423
Follow-‐up/ Referral 14355 19823 26761 14924 75863
Admitted 2308 6495 13729 23901 46433
Other 636 3224 4023 1353 9236
Total 38317 52392 72163 54083 216955
Q There were 33 records without the disposal method recorded and 9 records without the age recorded; these have been omitted from the chart.

TIIG Merseyside and Cheshire Themed Report Page 20
TIIG | Winter Injuries across Merseyside and Cheshire Page | 23
WINTER INJURY ATTENDANCES BY LOCAL AUTHORITY DISTRICTS
The following sections of this report explore ED attendances during winter 2011/12, 2012/13 and 2013/14 by each local
authority district across Merseyside and Cheshire (local authority data tables are available upon request).
It should be noted that many residents of Knowsley, Liverpool and Sefton local authorities attend Aintree University Hospital
which includes all attendances, not just injury and trauma, due to the way the IT system records data; therefore data for Aintree
University Hospital will skew the results, particularly for these local authority districts. Unless otherwise stated, the numbers
reported in this section are the cumulative total of ED attendances across the three winter periods.
TIIG Merseyside and Cheshire Themed ReportPage 21
TIIG | Winter Injuries across Merseyside and Cheshire Page | 24
CHESHIRE EAST
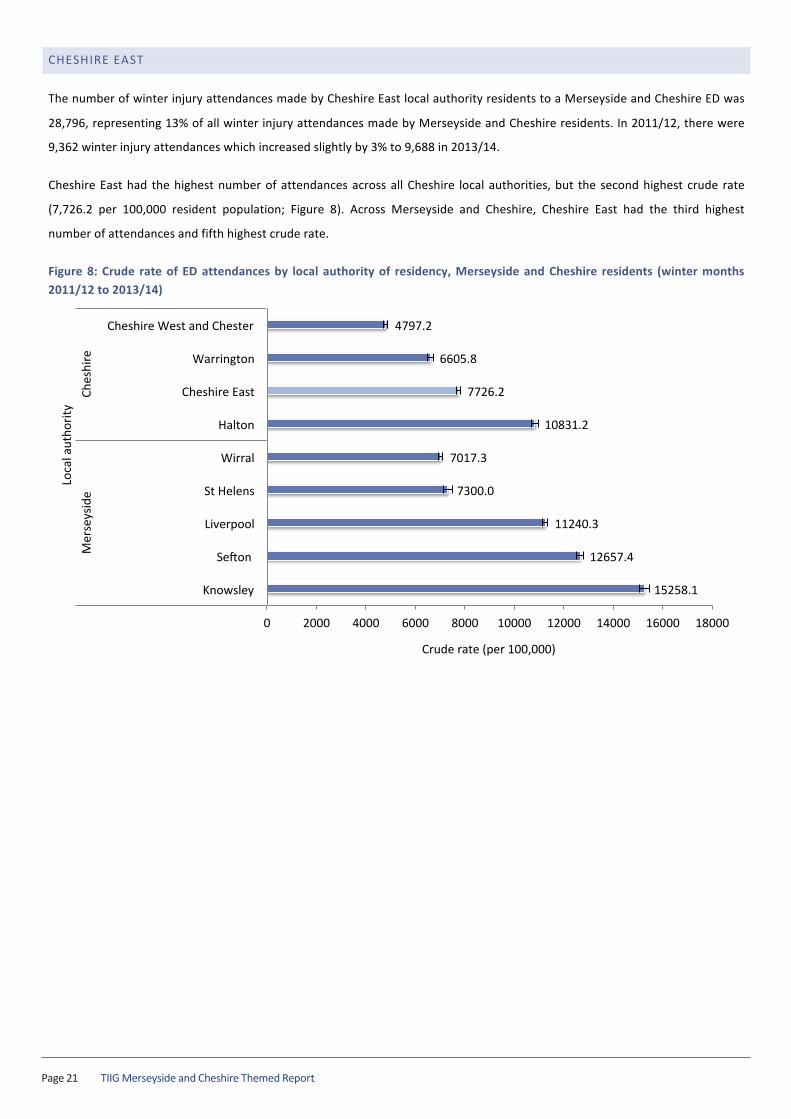
The number of winter injury attendances made by Cheshire East local authority residents to a Merseyside and Cheshire ED was
28,796, representing 13% of all winter injury attendances made by Merseyside and Cheshire residents. In 2011/12, there were
9,362 winter injury attendances which increased slightly by 3% to 9,688 in 2013/14.
Cheshire East had the highest number of attendances across all Cheshire local authorities, but the second highest crude rate
(7,726.2 per 100,000 resident population; Figure 8). Across Merseyside and Cheshire, Cheshire East had the third highest
number of attendances and fifth highest crude rate.
Figure 8: Crude rate of ED attendances by local authority of residency, Merseyside and Cheshire residents (winter months 2011/12 to 2013/14)
15258.1
12657.4
11240.3
7300.0
7017.3
10831.2
7726.2
6605.8
4797.2
0 2000 4000 6000 8000 10000 12000 14000 16000 18000
Knowsley
Seqon
Liverpool
St Helens
Wirral
Halton
Cheshire East
Warrington
Cheshire West and Chester
Mer
seys
ide
Ches
hire
Crude rate (per 100,000)
Loca
l aut
horit
y
TIIG Merseyside and Cheshire Themed Report Page 22
TIIG | Winter Injuries across Merseyside and Cheshire Page | 25
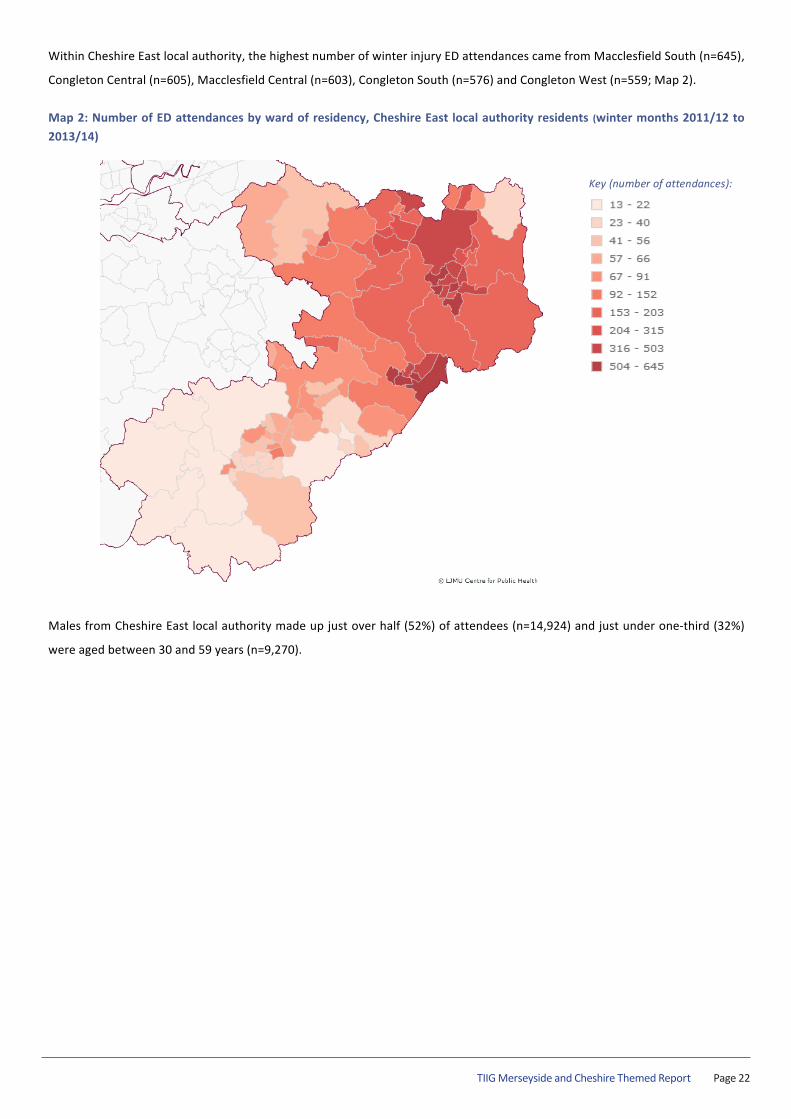
Within Cheshire East local authority, the highest number of winter injury ED attendances came from Macclesfield South (n=645),
Congleton Central (n=605), Macclesfield Central (n=603), Congleton South (n=576) and Congleton West (n=559; Map 2).
Map 2: Number of ED attendances by ward of residency, Cheshire East local authority residents (winter months 2011/12 to 2013/14)
Males from Cheshire East local authority made up just over half (52%) of attendees (n=14,924) and just under one-‐third (32%)
were aged between 30 and 59 years (n=9,270).
Key (number of attendances):

TIIG Merseyside and Cheshire Themed ReportPage 23
TIIG | Winter Injuries across Merseyside and Cheshire Page | 26
CHESHIRE WEST AND CHESTER
The number of winter injury attendances made by Cheshire West and Chester local authority residents to a Merseyside and
Cheshire ED was 15,880, representing 7% of all winter injury attendances made by Merseyside and Cheshire residents. In
2011/12 there were 5,606 attendances compared to 4,959 in 2013/14; a 12% decrease.
Cheshire West and Chester had the second highest number of attendances across all Cheshire local authorities, but the lowest
crude rate (4,797.2 per 100,000 resident population; Figure 9). Across Merseyside and Cheshire, Cheshire West and Chester had
the fourth lowest number of attendances and lowest crude rate.
Figure 9: Crude rate of ED attendances by local authority of residency, Merseyside and Cheshire residents (winter months 2011/12 to 2013/14)
15258.1
12657.4
11240.3
7300.0
7017.3
10831.2
7726.2
6605.8
4797.2
0 2000 4000 6000 8000 10000 12000 14000 16000 18000
Knowsley
Seqon
Liverpool
St Helens
Wirral
Halton
Cheshire East
Warrington
Cheshire West and Chester
Mer
seys
ide
Ches
hire
Crude rate (per 100,000)
Loca
l aut
horit
y

TIIG Merseyside and Cheshire Themed Report Page 24
TIIG | Winter Injuries across Merseyside and Cheshire Page | 27
Within Cheshire West and Chester local authority, the highest number of winter injury ED attendances came from Frodsham
North (n=421), Blacon Hall (n=392), College (n=335), Blacon Lodge (n=308), and Stanlow and Wolverham (n=300; Map 3).
Map 3: Number of ED attendances by ward of residency, Cheshire West and Chester local authority residents (winter months 2011/12 to 2013/14)
Males made up 53% of winter injury attendances (n=8,379) and one-‐third (33%) of all attendees from Cheshire West and
Chester were aged between 30 and 59 years (n=5,177).
Key (number of attendances):
TIIG Merseyside and Cheshire Themed ReportPage 25
TIIG | Winter Injuries across Merseyside and Cheshire Page | 28
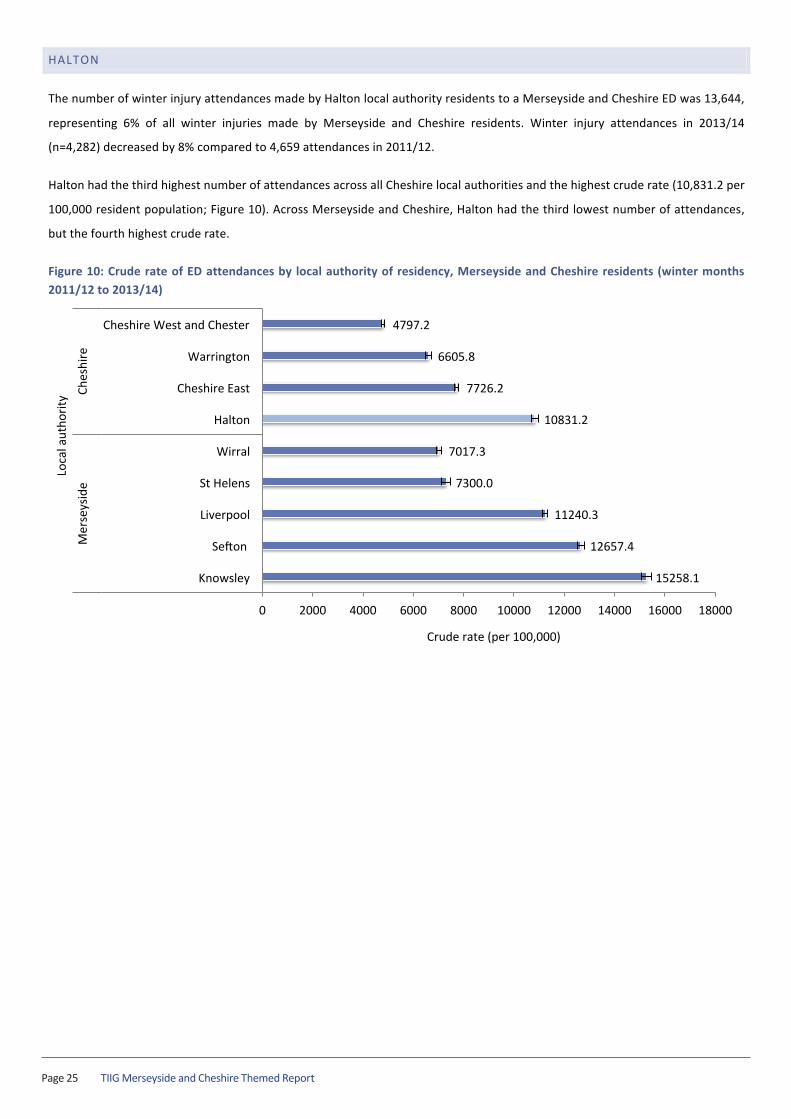
HALTON
The number of winter injury attendances made by Halton local authority residents to a Merseyside and Cheshire ED was 13,644,
representing 6% of all winter injuries made by Merseyside and Cheshire residents. Winter injury attendances in 2013/14
(n=4,282) decreased by 8% compared to 4,659 attendances in 2011/12.
Halton had the third highest number of attendances across all Cheshire local authorities and the highest crude rate (10,831.2 per
100,000 resident population; Figure 10). Across Merseyside and Cheshire, Halton had the third lowest number of attendances,
but the fourth highest crude rate.
Figure 10: Crude rate of ED attendances by local authority of residency, Merseyside and Cheshire residents (winter months 2011/12 to 2013/14)
15258.1
12657.4
11240.3
7300.0
7017.3
10831.2
7726.2
6605.8
4797.2
0 2000 4000 6000 8000 10000 12000 14000 16000 18000
Knowsley
Seqon
Liverpool
St Helens
Wirral
Halton
Cheshire East
Warrington
Cheshire West and Chester
Mer
seys
ide
Ches
hire
Crude rate (per 100,000)
Loca
l aut
horit
y
TIIG Merseyside and Cheshire Themed Report Page 26
TIIG | Winter Injuries across Merseyside and Cheshire Page | 29
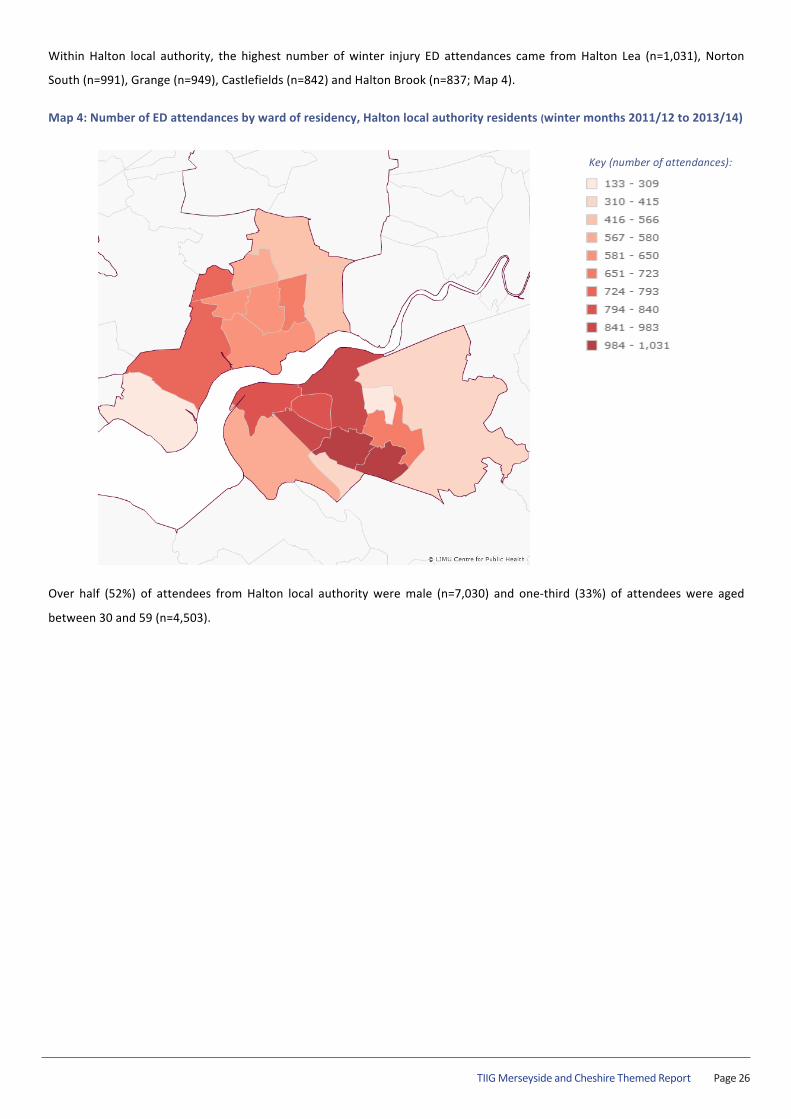
Within Halton local authority, the highest number of winter injury ED attendances came from Halton Lea (n=1,031), Norton
South (n=991), Grange (n=949), Castlefields (n=842) and Halton Brook (n=837; Map 4).
Map 4: Number of ED attendances by ward of residency, Halton local authority residents (winter months 2011/12 to 2013/14)
Over half (52%) of attendees from Halton local authority were male (n=7,030) and one-‐third (33%) of attendees were aged
between 30 and 59 (n=4,503).
Key (number of attendances):
TIIG Merseyside and Cheshire Themed ReportPage 27
TIIG | Winter Injuries across Merseyside and Cheshire Page | 30
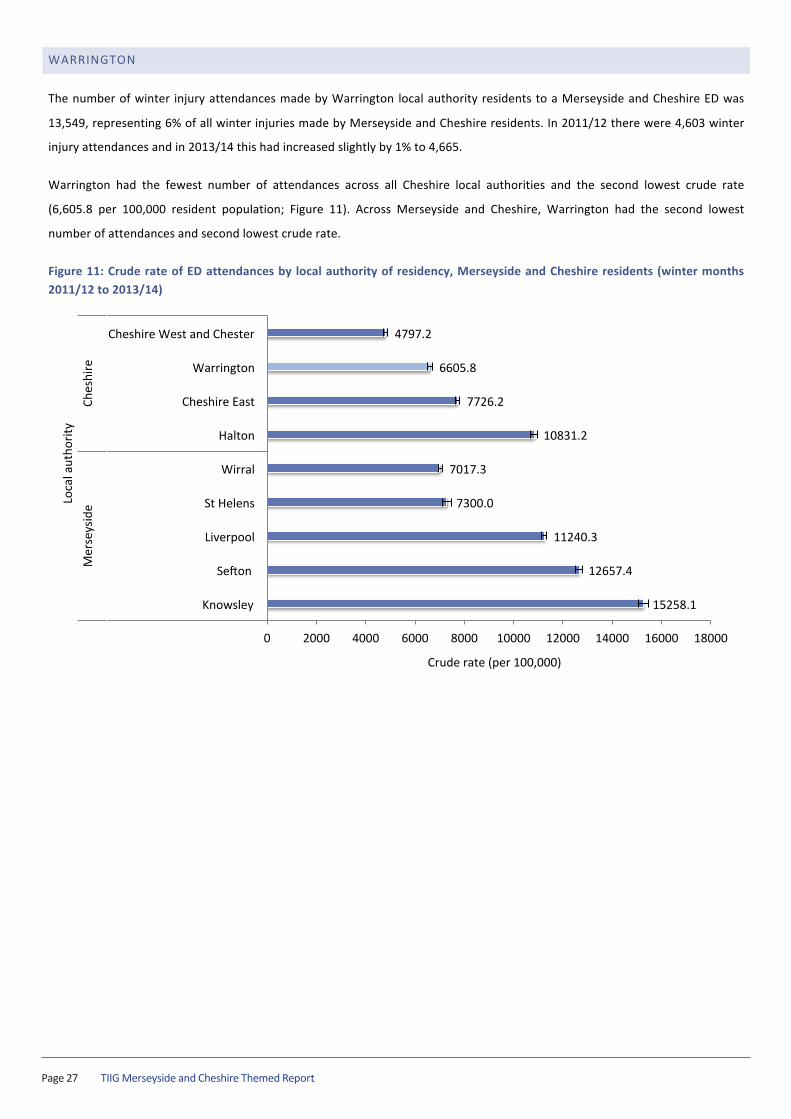
WARRINGTON
The number of winter injury attendances made by Warrington local authority residents to a Merseyside and Cheshire ED was
13,549, representing 6% of all winter injuries made by Merseyside and Cheshire residents. In 2011/12 there were 4,603 winter
injury attendances and in 2013/14 this had increased slightly by 1% to 4,665.
Warrington had the fewest number of attendances across all Cheshire local authorities and the second lowest crude rate
(6,605.8 per 100,000 resident population; Figure 11). Across Merseyside and Cheshire, Warrington had the second lowest
number of attendances and second lowest crude rate.
Figure 11: Crude rate of ED attendances by local authority of residency, Merseyside and Cheshire residents (winter months 2011/12 to 2013/14)
15258.1
12657.4
11240.3
7300.0
7017.3
10831.2
7726.2
6605.8
4797.2
0 2000 4000 6000 8000 10000 12000 14000 16000 18000
Knowsley
Seqon
Liverpool
St Helens
Wirral
Halton
Cheshire East
Warrington
Cheshire West and Chester
Mer
seys
ide
Ches
hire
Crude rate (per 100,000)
Loca
l aut
horit
y

TIIG Merseyside and Cheshire Themed Report Page 28
TIIG | Winter Injuries across Merseyside and Cheshire Page | 31
Within Warrington local authority, the highest number of winter injury ED attendances came from Bewsey and Whitecross
(n=1,216), Fairfield and Howley (n=1,113), Poplars and Hulme (n=984), Orford (n=916) and Whittle Hall (n=759; Map 5).
Map 5: Number of ED attendances by ward of residency, Warrington local authority residents (winter months 2011/12 to 2013/14)
Males made up 53% of attendances (n=7,168) and one-‐third (33%) of all attendees from Warrington local authority were aged
between 30 and 59 years (n=4,404).
Key (number of attendances):

TIIG Merseyside and Cheshire Themed ReportPage 29
TIIG | Winter Injuries across Merseyside and Cheshire Page | 32
KNOWSLEY
The number of winter injury attendances made by Knowsley local authority residents to a Merseyside and Cheshire ED was
22,290, representing 10% of all winter injuries made by Merseyside and Cheshire residents. There were 7,979 winter injury
attendances in 2011/12 which decreased by 20% in 2013/14 (n=6,411).
Knowsley had the second lowest number of attendances across all Merseyside local authorities, but the highest crude rate
(15,258.1 per 100,000 resident population; Figure 12). Across Merseyside and Cheshire, Knowsley had the fifth highest number
of attendances and highest crude rate.
Figure 12: Crude rate of ED attendances by local authority of residency, Merseyside and Cheshire residents (winter months 2011/12 to 2013/14)
15258.1
12657.4
11240.3
7300.0
7017.3
10831.2
7726.2
6605.8
4797.2
0 2000 4000 6000 8000 10000 12000 14000 16000 18000
Knowsley
Seqon
Liverpool
St Helens
Wirral
Halton
Cheshire East
Warrington
Cheshire West and Chester
Mer
seys
ide
Ches
hire
Crude rate (per 100,000)
Loca
l aut
horit
y
TIIG Merseyside and Cheshire Themed Report Page 30
TIIG | Winter Injuries across Merseyside and Cheshire Page | 33
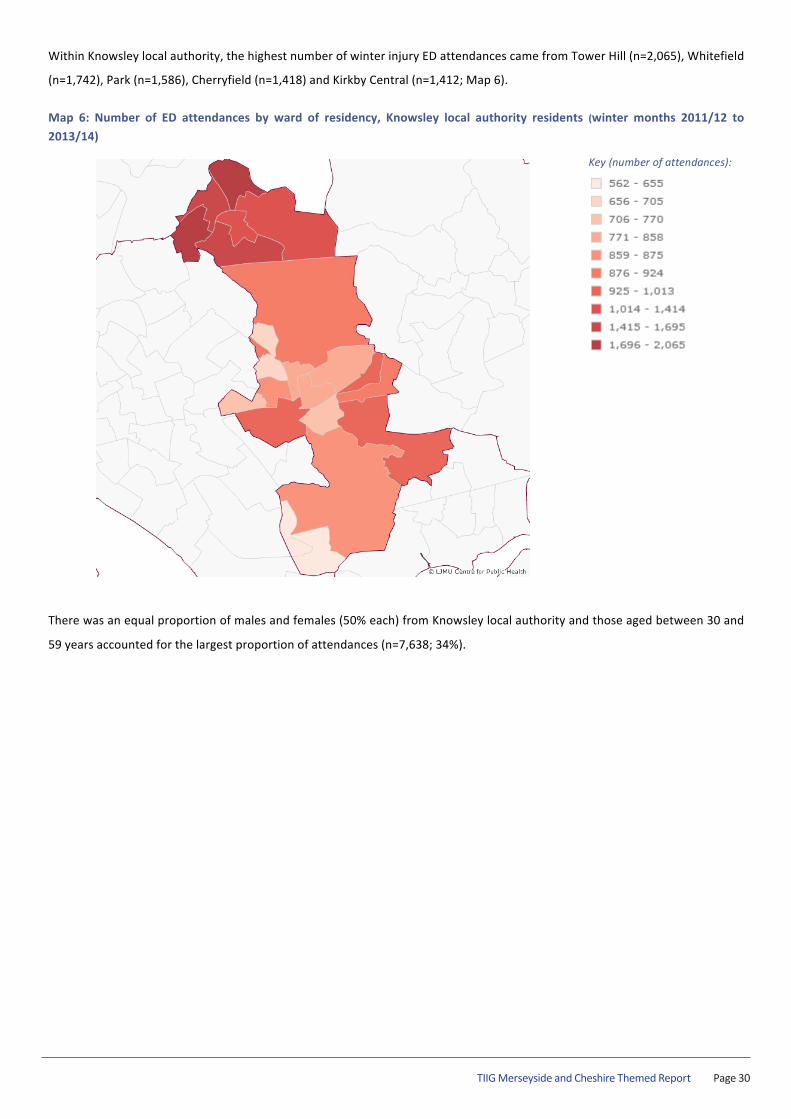
Within Knowsley local authority, the highest number of winter injury ED attendances came from Tower Hill (n=2,065), Whitefield
(n=1,742), Park (n=1,586), Cherryfield (n=1,418) and Kirkby Central (n=1,412; Map 6).
Map 6: Number of ED attendances by ward of residency, Knowsley local authority residents (winter months 2011/12 to 2013/14)
There was an equal proportion of males and females (50% each) from Knowsley local authority and those aged between 30 and
59 years accounted for the largest proportion of attendances (n=7,638; 34%).
Key (number of attendances):
TIIG Merseyside and Cheshire Themed ReportPage 31
TIIG | Winter Injuries across Merseyside and Cheshire Page | 34
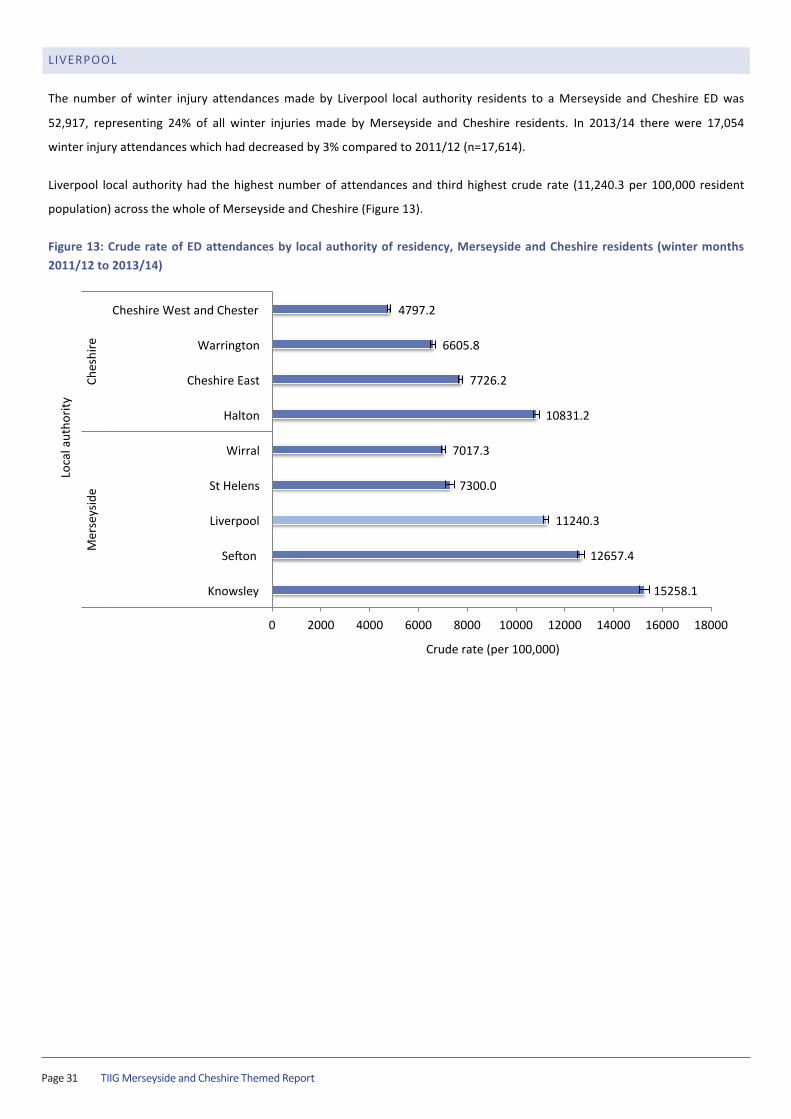
LIVERPOOL
The number of winter injury attendances made by Liverpool local authority residents to a Merseyside and Cheshire ED was
52,917, representing 24% of all winter injuries made by Merseyside and Cheshire residents. In 2013/14 there were 17,054
winter injury attendances which had decreased by 3% compared to 2011/12 (n=17,614).
Liverpool local authority had the highest number of attendances and third highest crude rate (11,240.3 per 100,000 resident
population) across the whole of Merseyside and Cheshire (Figure 13).
Figure 13: Crude rate of ED attendances by local authority of residency, Merseyside and Cheshire residents (winter months 2011/12 to 2013/14)
15258.1
12657.4
11240.3
7300.0
7017.3
10831.2
7726.2
6605.8
4797.2
0 2000 4000 6000 8000 10000 12000 14000 16000 18000
Knowsley
Seqon
Liverpool
St Helens
Wirral
Halton
Cheshire East
Warrington
Cheshire West and Chester
Mer
seys
ide
Ches
hire
Crude rate (per 100,000)
Loca
l aut
horit
y
TIIG Merseyside and Cheshire Themed Report Page 32
TIIG | Winter Injuries across Merseyside and Cheshire Page | 35
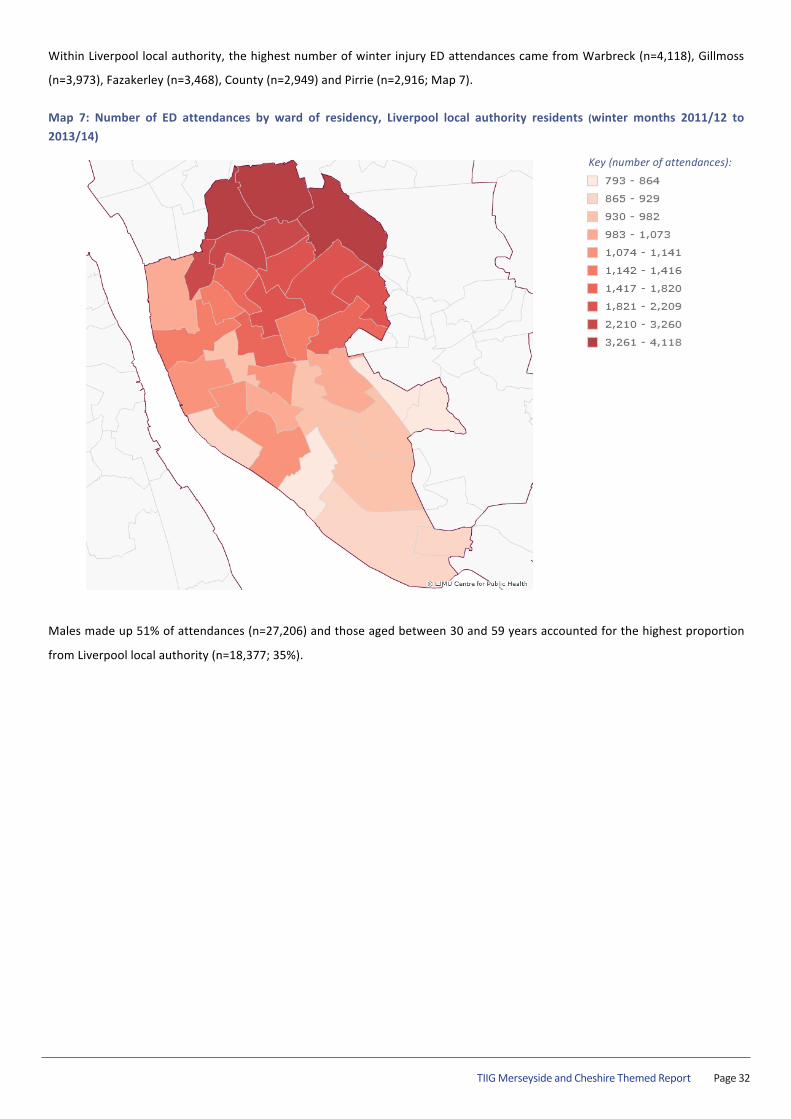
Within Liverpool local authority, the highest number of winter injury ED attendances came from Warbreck (n=4,118), Gillmoss
(n=3,973), Fazakerley (n=3,468), County (n=2,949) and Pirrie (n=2,916; Map 7).
Map 7: Number of ED attendances by ward of residency, Liverpool local authority residents (winter months 2011/12 to 2013/14)
Males made up 51% of attendances (n=27,206) and those aged between 30 and 59 years accounted for the highest proportion
from Liverpool local authority (n=18,377; 35%).
Key (number of attendances):
TIIG Merseyside and Cheshire Themed ReportPage 33
TIIG | Winter Injuries across Merseyside and Cheshire Page | 36
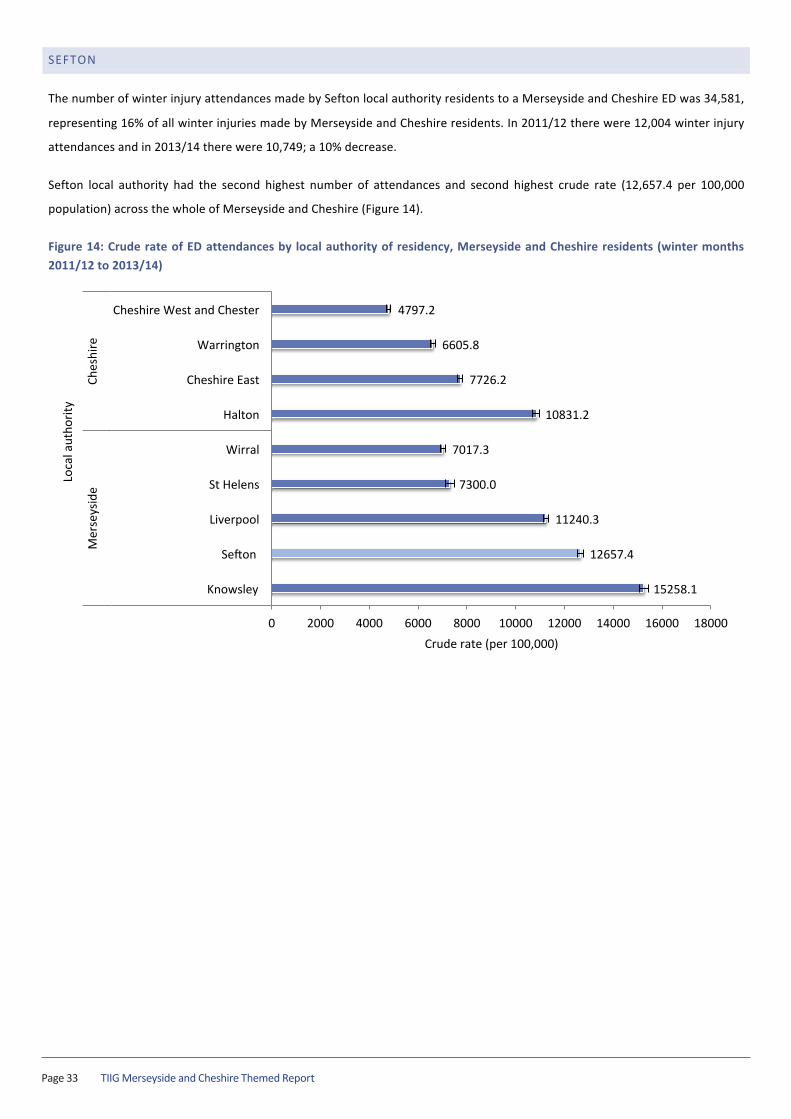
SEFTON
The number of winter injury attendances made by Sefton local authority residents to a Merseyside and Cheshire ED was 34,581,
representing 16% of all winter injuries made by Merseyside and Cheshire residents. In 2011/12 there were 12,004 winter injury
attendances and in 2013/14 there were 10,749; a 10% decrease.
Sefton local authority had the second highest number of attendances and second highest crude rate (12,657.4 per 100,000
population) across the whole of Merseyside and Cheshire (Figure 14).
Figure 14: Crude rate of ED attendances by local authority of residency, Merseyside and Cheshire residents (winter months 2011/12 to 2013/14)
15258.1
12657.4
11240.3
7300.0
7017.3
10831.2
7726.2
6605.8
4797.2
0 2000 4000 6000 8000 10000 12000 14000 16000 18000
Knowsley
Seqon
Liverpool
St Helens
Wirral
Halton
Cheshire East
Warrington
Cheshire West and Chester
Mer
seys
ide
Ches
hire
Crude rate (per 100,000)
Loca
l aut
horit
y

TIIG Merseyside and Cheshire Themed Report Page 34
TIIG | Winter Injuries across Merseyside and Cheshire Page | 37
Within Sefton local authority, the highest number of winter injury ED attendances came from St Oswald (n=2,894), Linacre
(n=2,864), Netherton and Orrell (n=2,580), Derby (n=2,535) and Ford (n=2,279; Map 8).
Map 8: Number of ED attendances by ward of residency, Sefton local authority residents (winter months 2011/12 to 2013/14)
Just over half (51%) of winter injury attendees from Sefton local authority were female (n=17,475) and just over one-‐third (34%)
were aged between 30 and 59 years (n=11,670).
Key (number of attendances):

TIIG Merseyside and Cheshire Themed ReportPage 35
TIIG | Winter Injuries across Merseyside and Cheshire Page | 38
ST HELENS
The number of winter injury attendances made by St Helens local authority residents to a Merseyside and Cheshire ED was
12,864, representing 6% of all winter injuries made by Merseyside and Cheshire residents. In 2011/12 there were 4,826 winter
injury attendances and in 2013/14 this had decreased by 31% to 3,324.
St Helens local authority had the fewest number of attendances across the whole of Merseyside and Cheshire. Within
Merseyside, St Helens had the second lowest crude rate and across Merseyside and Cheshire as a whole, the fourth lowest
(7,300.0 per 100,000 population; Figure 15).
Figure 15: Crude rate of ED attendances by local authority of residency, Merseyside and Cheshire residents (winter months 2011/12 to 2013/14)
15258.1
12657.4
11240.3
7300.0
7017.3
10831.2
7726.2
6605.8
4797.2
0 2000 4000 6000 8000 10000 12000 14000 16000 18000
Knowsley
Seqon
Liverpool
St Helens
Wirral
Halton
Cheshire East
Warrington
Cheshire West and Chester
Mer
seys
ide
Ches
hire
Crude rate (per 100,000)
Loca
l aut
horit
y
TIIG Merseyside and Cheshire Themed Report Page 36
TIIG | Winter Injuries across Merseyside and Cheshire Page | 39
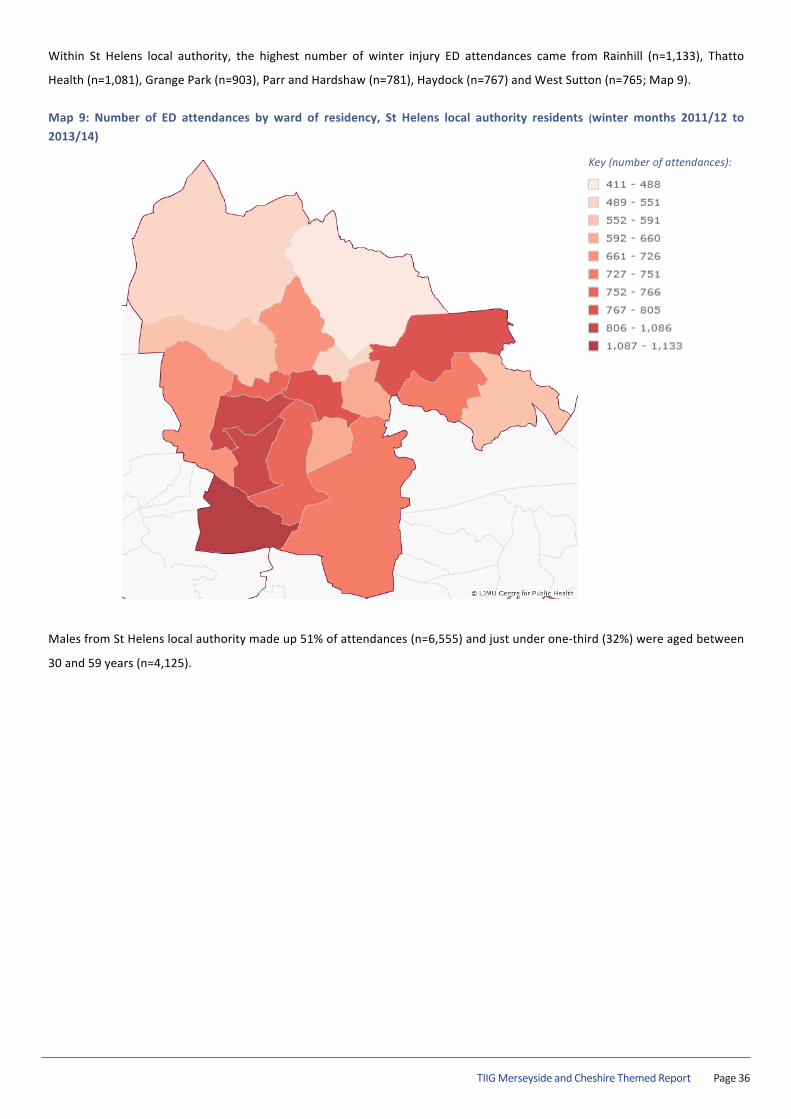
Within St Helens local authority, the highest number of winter injury ED attendances came from Rainhill (n=1,133), Thatto
Health (n=1,081), Grange Park (n=903), Parr and Hardshaw (n=781), Haydock (n=767) and West Sutton (n=765; Map 9).
Map 9: Number of ED attendances by ward of residency, St Helens local authority residents (winter months 2011/12 to 2013/14)
Males from St Helens local authority made up 51% of attendances (n=6,555) and just under one-‐third (32%) were aged between
30 and 59 years (n=4,125).
Key (number of attendances):
TIIG Merseyside and Cheshire Themed ReportPage 37
TIIG | Winter Injuries across Merseyside and Cheshire Page | 40
WIRRAL
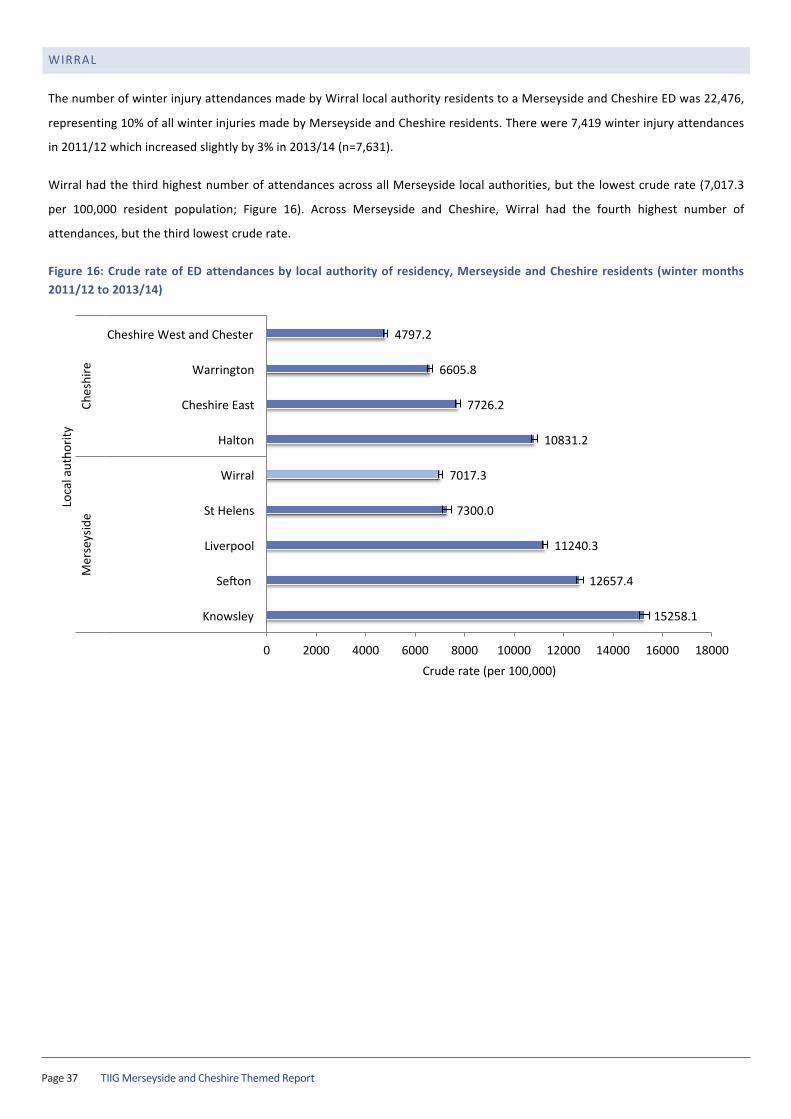
The number of winter injury attendances made by Wirral local authority residents to a Merseyside and Cheshire ED was 22,476,
representing 10% of all winter injuries made by Merseyside and Cheshire residents. There were 7,419 winter injury attendances
in 2011/12 which increased slightly by 3% in 2013/14 (n=7,631).
Wirral had the third highest number of attendances across all Merseyside local authorities, but the lowest crude rate (7,017.3
per 100,000 resident population; Figure 16). Across Merseyside and Cheshire, Wirral had the fourth highest number of
attendances, but the third lowest crude rate.
Figure 16: Crude rate of ED attendances by local authority of residency, Merseyside and Cheshire residents (winter months 2011/12 to 2013/14)
15258.1
12657.4
11240.3
7300.0
7017.3
10831.2
7726.2
6605.8
4797.2
0 2000 4000 6000 8000 10000 12000 14000 16000 18000
Knowsley
Seqon
Liverpool
St Helens
Wirral
Halton
Cheshire East
Warrington
Cheshire West and Chester
Mer
seys
ide
Ches
hire
Crude rate (per 100,000)
Loca
l aut
horit
y
TIIG Merseyside and Cheshire Themed Report Page 38
TIIG | Winter Injuries across Merseyside and Cheshire Page | 41
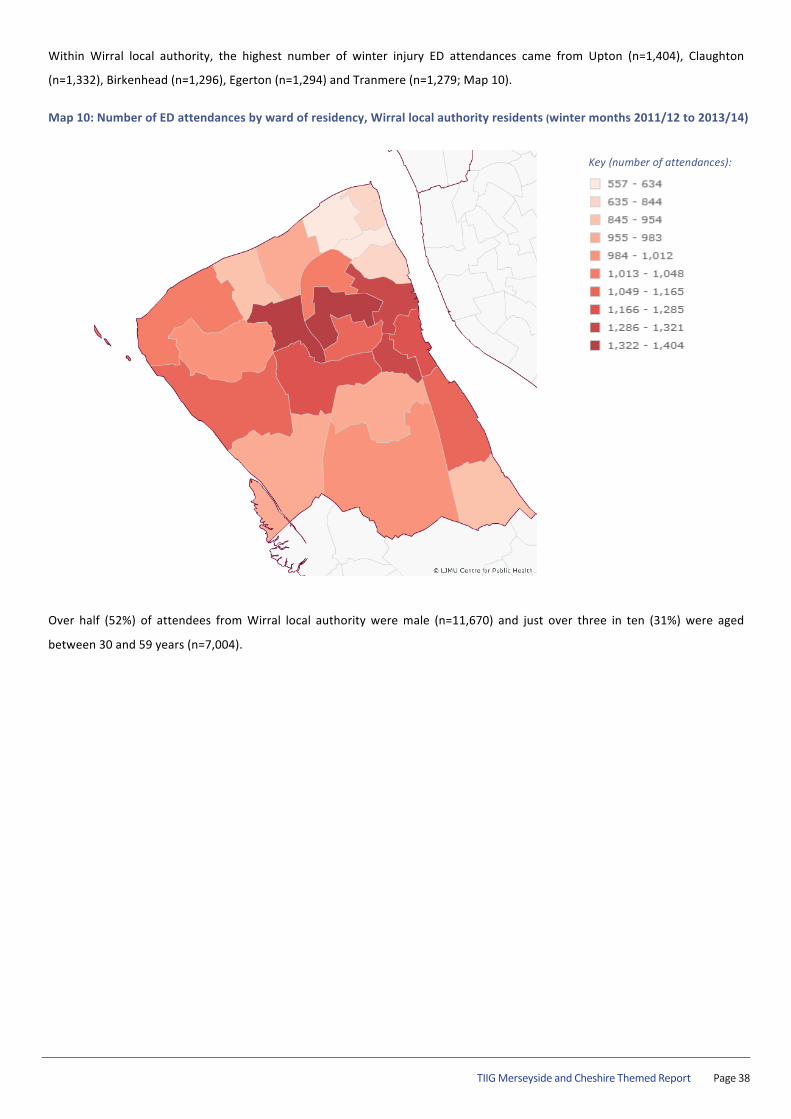
Within Wirral local authority, the highest number of winter injury ED attendances came from Upton (n=1,404), Claughton
(n=1,332), Birkenhead (n=1,296), Egerton (n=1,294) and Tranmere (n=1,279; Map 10).
Map 10: Number of ED attendances by ward of residency, Wirral local authority residents (winter months 2011/12 to 2013/14)
Over half (52%) of attendees from Wirral local authority were male (n=11,670) and just over three in ten (31%) were aged
between 30 and 59 years (n=7,004).
Key (number of attendances):
TIIG Merseyside and Cheshire Themed ReportPage 39
TIIG | Winter Injuries across Merseyside and Cheshire Page | 42
AMBULANCE CALL OUTS ACROSS MERSEYSIDE AND CHESHIRE
NUMBER OF CALL OUTS AND TRENDS
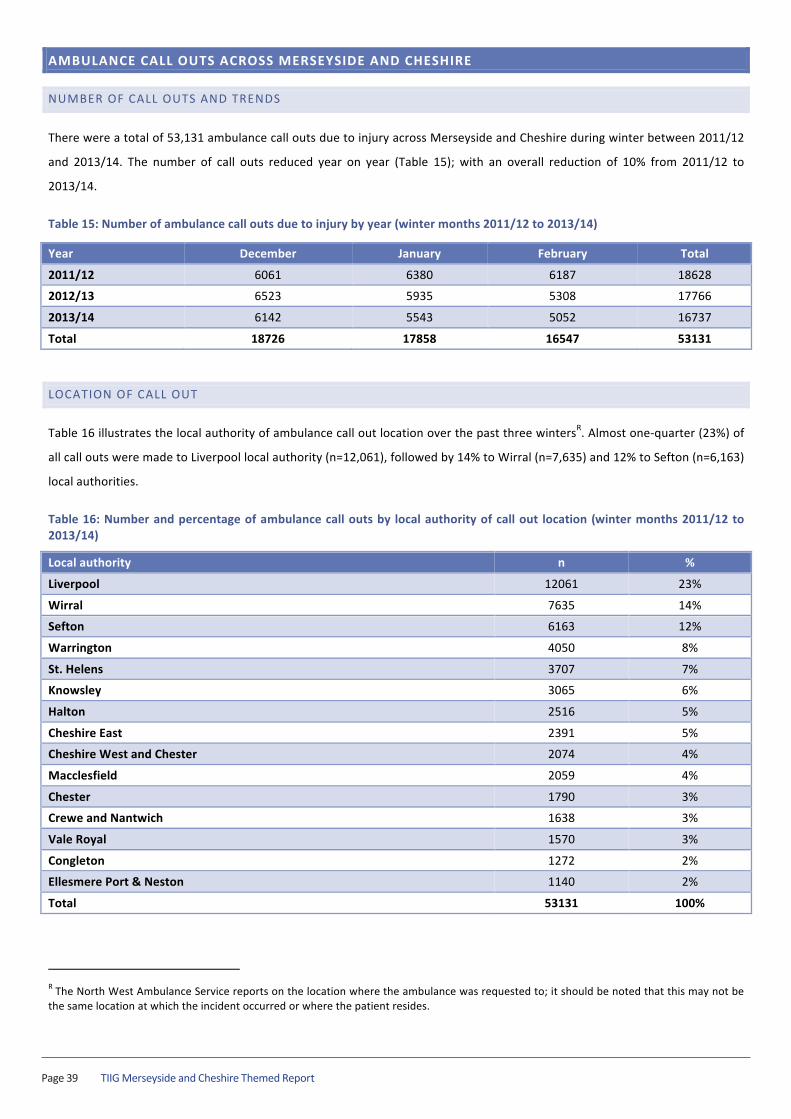
There were a total of 53,131 ambulance call outs due to injury across Merseyside and Cheshire during winter between 2011/12
and 2013/14. The number of call outs reduced year on year (Table 15); with an overall reduction of 10% from 2011/12 to
2013/14.
Table 15: Number of ambulance call outs due to injury by year (winter months 2011/12 to 2013/14)
Year December January February Total
2011/12 6061 6380 6187 18628
2012/13 6523 5935 5308 17766
2013/14 6142 5543 5052 16737
Total 18726 17858 16547 53131
LOCATION OF CALL OUT
Table 16 illustrates the local authority of ambulance call out location over the past three wintersR. Almost one-‐quarter (23%) of
all call outs were made to Liverpool local authority (n=12,061), followed by 14% to Wirral (n=7,635) and 12% to Sefton (n=6,163)
local authorities.
Table 16: Number and percentage of ambulance call outs by local authority of call out location (winter months 2011/12 to 2013/14)
Local authority n %
Liverpool 12061 23%
Wirral 7635 14%
Sefton 6163 12%
Warrington 4050 8%
St. Helens 3707 7%
Knowsley 3065 6%
Halton 2516 5%
Cheshire East 2391 5%
Cheshire West and Chester 2074 4%
Macclesfield 2059 4%
Chester 1790 3%
Crewe and Nantwich 1638 3%
Vale Royal 1570 3%
Congleton 1272 2%
Ellesmere Port & Neston 1140 2%
Total 53131 100%
R The North West Ambulance Service reports on the location where the ambulance was requested to; it should be noted that this may not be the same location at which the incident occurred or where the patient resides.

TIIG Merseyside and Cheshire Themed Report Page 40
TIIG | Winter Injuries across Merseyside and Cheshire Page | 43
The 20 wards which received the highest number of ambulance call outs are presented in Table 17. A large proportion of these
wards where in Liverpool local authority.
Table 17: Number of ambulance call outs by ward of call out location (winter months 2011/12 to 2013/14)
Ward name Ward code Local authority Number of call outs Abercromby 00BYFA Liverpool 1004 Everton 00BYFQ Liverpool 947 Birkenhead 00CBFC Wirral 816 Dukes 00CAGG Sefton 670 Bewsey and Whitecross 00EUNC Warrington 512 Cambridge 00CAGD Sefton 498 Kensington 00BYFW Liverpool 494 Broadgreen 00BYFG Liverpool 478 Tuebrook 00BYGF Liverpool 461 Linacre 00CAGL Sefton 450 Anfield 00BYFD Liverpool 445 Melrose 00BYFX Liverpool 440 Tranmere 00CBFW Wirral 440 City & St Anne's 13UBGL Cheshire West and Chester 440 Seacombe 00CBFT Wirral 430 Gillmoss 00BYFS Liverpool 427 Granby 00BYFT Liverpool 423 Fairfield and Howley 00EUNG Warrington 416 New Brighton 00CBFP Wirral 412 Warbreck 00BYGJ Liverpool 410
TIIG Merseyside and Cheshire Themed ReportPage 41
TIIG | Winter Injuries across Merseyside and Cheshire Page | 44
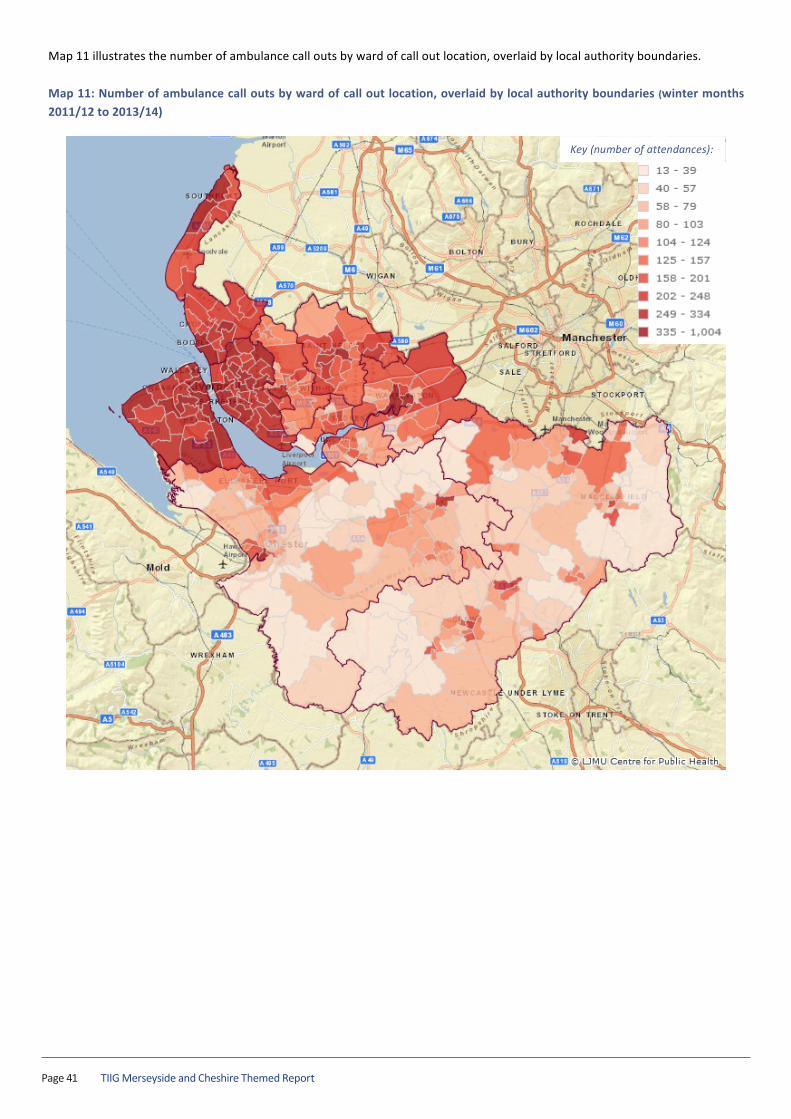
Map 11 illustrates the number of ambulance call outs by ward of call out location, overlaid by local authority boundaries.
Map 11: Number of ambulance call outs by ward of call out location, overlaid by local authority boundaries (winter months 2011/12 to 2013/14)
Key (number of attendances):

TIIG Merseyside and Cheshire Themed Report Page 42
TIIG | Winter Injuries across Merseyside and Cheshire Page | 45
PATIENT DEMOGRAPHICS
The patient demographics, where providedS, of ambulance call outs across Merseyside and Cheshire are shown in Figure 8.
There were more females than males (females=26,746; 53%; Figure 8a) and over half (51%) of ambulance call outs during winter
were made to those aged 60 years and above (n=24,627), followed by just under three in ten (28%) aged between 30 and 59
years (n=13,373; Figure 8b).
Figure 8: Number of ambulance call outs by gender and age group (winter months 2011/12 to 2013/14)
a) GenderT b) Age groupU
S Please note that the completion of patient sex and age is poor. T There were 2,041 records with the gender recorded as ‘unknown’ and 574 records without the gender recorded; these have been omitted from the chart. U There were 4,695 records without the age recorded; these have been omitted from the chart.
26746 23770
Female
Male
1562 1254
7620
13373
24627
0
5000
10000
15000
20000
25000
30000
0-‐4 5-‐14 15-‐29 30-‐59 60+
Num
ber o
f am
bual
nce
cal
l out
s
Age group
TIIG Merseyside and Cheshire Themed ReportPage 43
TIIG | Winter Injuries across Merseyside and Cheshire Page | 46
INCIDENT TYPE
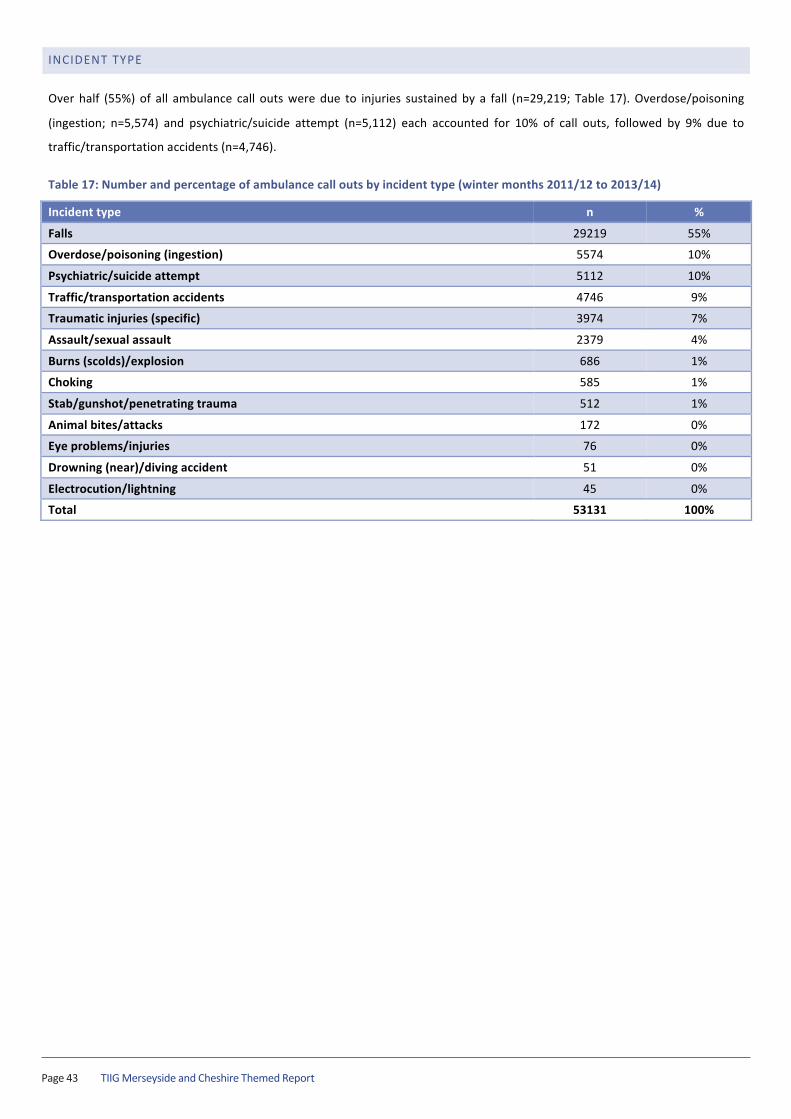
Over half (55%) of all ambulance call outs were due to injuries sustained by a fall (n=29,219; Table 17). Overdose/poisoning
(ingestion; n=5,574) and psychiatric/suicide attempt (n=5,112) each accounted for 10% of call outs, followed by 9% due to
traffic/transportation accidents (n=4,746).
Table 17: Number and percentage of ambulance call outs by incident type (winter months 2011/12 to 2013/14)
Incident type n %
Falls 29219 55%
Overdose/poisoning (ingestion) 5574 10%
Psychiatric/suicide attempt 5112 10%
Traffic/transportation accidents 4746 9%
Traumatic injuries (specific) 3974 7%
Assault/sexual assault 2379 4%
Burns (scolds)/explosion 686 1%
Choking 585 1%
Stab/gunshot/penetrating trauma 512 1%
Animal bites/attacks 172 0%
Eye problems/injuries 76 0%
Drowning (near)/diving accident 51 0%
Electrocution/lightning 45 0%
Total 53131 100%
TIIG Merseyside and Cheshire Themed Report Page 44
TIIG | Winter Injuries across Merseyside and Cheshire Page | 47
REFERENCES
Association of Public Health Observatories (2008) Commonly used public health statistics and their confidence intervals [online].
Available at: http://www.apho.org.uk/resource/item.aspx?RID=48457 [Accessed 12th December, 2013].
British Broadcasting Corporation (2014) NHS Drafts in extra A&E doctors to ‘bolster units’ [online]. Available at:
http://www.bbc.co.uk/news/health-‐29704925 [Accessed 21st October, 2014].
Dean, M. (1997) The NHS’s comfortable escape from “winter chaos”. The Lancet [online], 349 (9047), pp. 261. Available at:
http://www.thelancet.com/journals/lancet/article/PIIS0140-‐6736(05)64877-‐5/fulltext?version=printerFriendly [Accessed 29th
September, 2014].
Doctors.net.uk Limited (2013) Doctors.net.uk [online]. Available at: http://www.doctors.net.uk/ [Accessed 28th September,
2014].
Health and Social Care Information Centre (2009) Trends in Consultation Rates in General Practice: 1995-‐2009 [online]. Available
at: http://www.hscic.gov.uk/catalogue/PUB01077 [Accessed 30th September, 2014].
Liverpool Commissioning Group (2013) Do you know what your options are this winter? [online]. Available at:
http://www.liverpoolccg.nhs.uk/News/2013/november/examine_your_options.aspx [Accessed 6th November, 2014].
McNulty. C.A.M., et al (2013) Expectations for consultations and antibiotics for respiratory tract infection in primary care: the RTI
clinical iceberg. British Journal of General Practice [online], 63 (612) pp.429-‐436. Available at:
http://www.ncbi.nlm.nih.gov/pmc/articles/PMC3693799/ [Accessed 11th November, 2014].
England (2013a) Senior clinicians urge people to take advice early on health problems this winter [online]. Available at:
http://www.england.nhs.uk/2013/11/15/wint-‐ad [Accessed 28th September, 2014].
NHS England (2013b) The NHS belongs to the people: a call to action [online]. Available at: http://www.england.nhs.uk/wp-‐
content/uploads/2013/07/nhs_belongs.pdf. 24 October 2013 [Accessed 28th September, 2014].
Proprietary Association of Great Britain and Pharmacy Voice (2013) Treat yourself better with pharmacist advice [online].
Available at: http://www.treatyourselfbetter.co.uk [Accessed 30th September, 2014].
Proprietary Association of Great Britain and Pharmacy Voice (2014) Press release: NHS facing winter pressures as millions of Brits
visit their GP or A&E as first port of call for winter sniffles [online]. Available at:
http://www.treatyourselfbetter.co.uk/pdf/140908_Treat_Yourself_Better_with_Pharmacist_Advice_launch_release_FINAL.pdf
[Accessed 30th September, 2014].
The British Medical Association (2013) The British Medical Association Briefing Paper: Beating the effects of winter pressures
[online]. Available at: http://bma.org.uk/winter-‐pressures [Accessed 7th October, 2014].

Jennifer Brizell, Stuart Cole, Karen A Critchley and Mark WhitfieldCentre for Public Health Research Directorate Faculty of Education, Health and Community Liverpool John Moores University 2nd Floor, Henry Cotton Building 15-21 Webster Street Liverpool L3 2ET
Tel: 0151 231 4314 Fax: 0151 231 4552
[email protected] www.tiig.info
www.cph.org.uk www.twitter.com/tiig_cph
ISBN: 978-1-908929-85-3 (web)