Embed Size (px)
Citation preview

1 | P a g e
TigerShark UAS
Level Flyover Noise Measurements
Final Report – 18 July 2016
Adrian Sescu, Calvin Walker, Ratan Jha Mississippi State University
Prepared for: Federal Aviation Administration Office of Environment & Energy PoC: Mehmet Marsan, Ph.D.

2 | P a g e
1. Introduction FAA’s Office of Environment and Energy (AEE) is supporting the FAA Unmanned Aircraft Systems (UAS) Integration Office to ensure the safe, efficient, and timely integration of UAS into the United States’ National Airspace System (NAS). In order to fulfill this mission, the FAA is developing UAS standards, procedures, and regulatory products. The primary control over aircraft source noise is the noise certification process, which is the responsibility of AEE within the FAA. This document describes the TigerShark UAS level flyover noise measurements that were performed at Griffiss International Airport, Rome NY, on May 17 2016.
2. Test Aircraft Airplane information to be reported under Section G36.109(g) Tiger Shark is a medium weight UAS. It is powered by a Herbrandsen 372 engine with 31” x 18” blade propeller. Maximum Takeoff Weight is 397 lbs. Table 1: UAS specifications
Type NASC TigerShark Model Block 3Serial numbers (if any) 052 N1730XModifications that would affect the noise characteristics None
Engine performance 32 hp / 8,000 rpm
2 blades6,500 rpm with 31” X 18” prop.
Maximum takeoff weight (lbs.) 397
3. Measurement Site Acoustical considerations in selecting the measurement site location included the following:
• To minimize the effect of altitude on aircraft performance, the elevation of the measurement site should be below 2,000 feet above mean sea level (AMSL);
• To lessen the risk of external acoustic contamination, a measurement site should have a relatively quiet ambient environment with very few daily aircraft operations; and
• To eliminate the need of acoustic corrections due to terrain undulations, the measurement site should have a long stretch of flat terrain near the test runway, where a centerline and sideline microphone can be placed
Test Site Name: NY Griffiss UAS Test Site Airport Name: Griffiss International Airport, Rome NY (KRME)
3 | P a g e
Table 2: Points of Contact
Contact Phone Email Raymond Young (702) 525-1562 [email protected]
4. Instrumentation 4.1. Acoustic System The MSU acoustic system (Bruel & Kjaer) consists of:
o Two 2250-G4 Hand-held Analyzers (figure 1) with Sound Level Meter, Frequency Analysis, Enhanced Logging and Sound Recording Software (Qty: 2). Characteristics of the Type 4189 microphone: Sensitivity: 50mV/Pa Frequency: 6.3Hz . 20 kHz Dynamic Range: 14.6 . 146 dB Temperature: .30 to +1500 C (.22 to +3020 F) Polarization: Prepolarized
o One Sound Calibrator Class 1 and LS, 94 and 114 dB, 1 kHz o Two 1/2" Pressure-field Microphones, 3 Hz to 20 kHz, 200V Polarization
(Qty: 2). Characteristics of the Type 4192 microphone: Sensitivity: 12.5mV/Pa Frequency: 3.15 Hz . 20 kHz Dynamic Range: 19 . 162 dB Temperature: .30 to +3000 C (.22 to +5720 F) Polarization: 200V
o One laptop to acquire and post-process the data; o 2 tripods.
Figure 1. 2250-G4 B&K Analyzer
4.2. Meteorological System Wind speed and direction, relative humidity, air temperature, and barometric pressure at specified time intervals (typically, in the orders of seconds) were collected by the Volpe

4 | P a g e
team. However, the meteorological data were collected by Volpe only during the takeoff noise measurements. For the level flyover measurements, approximate values for wind speed, average temperature and humidity were collected from the internet, which are included in section 5.
4.3. Global Positioning System The time-space position information of the test aircraft during the takeoff and flyover noise certification tests was provided by NASC. The global positioning system (GPS) was used as the primary aircraft guidance and tracking system during measurements.
5. Measurements Procedures The tests were performed as follows:
Three level flyovers in each direction for two separate flight altitudes (i.e., 12 total runs).
Flight altitudes are: 200 feet and 400 feet (NASC tram could not perform flights at 50 and 100 ft – as originally planned – because of some flight safety issues: tall trees were present in the area).
During the measurements, the wind speed was below 2 m/s, the averaged temperature varied between 45 and 50 F, and the humidity varied between 68% and 70%.
Calibration of the microphones
The microphones were calibrated using the following procedure:
Mount the B&K 4231 calibrator on the microphone. Activate the calibrator with a sine wave signal of 94 decibels (dB) at 1 kHz. Calibrate the microphones to this reference signal. After calibration, record one minute of the calibration signal and note levels indicated on the log sheets.
Apply a microphone simulator to the preamp to measure the system noise floor and ensure no outside interference is present. Apply a +20 dB gain to raise the sensitivity of the meter to help identify any anomalous signals. Record one minute of the noise floor and note levels indicated on the log sheets.
Reinsert the microphone and reapply the calibrator to verify that the analyzer reads the same initial calibration reading performed in Step 1. Record another minute of the calibration signal and note levels indicated on the log sheets.
Number of measurements: 3 level flyovers in each direction for each flight altitude, i.e. 12 total runs: Flight altitudes are: 200 ft and 400 ft

5 | P a g e
Figures 2 and 3 show a front and a top view of the measurement setup, while figure 4 shows an example of a flight path. One microphone was positioned under the flight path, while the other one was positioned at 50 feet from the first in the lateral direction. Both of them were places at 4 feet from the ground.
Figure 2. View from the front – Level flyover
Figure 3. View from the top – Level flyover
200 ft, 400 ft
Microphone on tripod

6 | P a g e
Figure 4. Test site (red dot represents the location of the microphones)
6. Data Analysis Field elevation: 503.7 ft Sound level meter #1 location: 430 13.223’ N 750 23.283’ W Sound level meter #2 location: 430 13.219’ N 750 23.293’ W The NASC team was not able to fly the UAS at 50 and 100 feet because of flight safety issues (trees were present in close proximity to the measurement site). Next table lists the heights, headings, rotational speed of the engine and the maximum noise attained at the two microphones. More data about the collected noise are included in the appendix B. Table 3 Event Test height
(feet) Heading RPM Microphone #1 Microphone #2
LASmax LCpeak LASmax LCpeak1 200 1500 4000 76.41 94.16 75.04 92.49 2 300 1500 6700 87.71 103.86 88.94 105.38 3 230 1500 6800 92.35 107.57 91.44 107.81 4 200 3300 6800 90.62 106.28 91.86 110.595 200 3300 6700 91.27 106.19 90.75 107.75 6 200 3300 6700 90.18 104.32 91 108.32 7 400 3300 6600 83.27 96.44 85.19 100.9 8 480 3300 6700 82.17 96.89 85.07 100.67 9 440 3300 6600 84.77 99.37 85.77 103.27
10 440 1500 6800 84.06 98.64 86.16 103.29 11 450 1500 6800 84.26 98.71 85.58 100.04

7 | P a g e
12 470 1500 6800 82.92 97.52 83.77 98.79 Figures 5-12 show time histories of LAFmax, LAFmin, LCpeak and LAeq, while figures 13-16 show spectra history of LZeq (for several instances in time) for all cases. The gray vertical bands in the time history plots (figures 5-12) represent the instant in time corresponding to the maximum values, when the UAS was in the closest proximity to the sound level meater. The definitions of LAFmax, LAFmin, LCpeak, LAeq, and LZeq are given in the appendix. -The maximum LAeq for the level flight at 200 m perceived by microphone # 1 was 92.8 dB, while for the microphone # 2 it was 84.6 dB (the corresponding LCpeak levels were 110.6 dB and 98.7 dB, respectively). -The maximum LAeq for the level flight at 400 m perceived by microphone # 1 was 87.5 dB, while for the microphone # 2 it was 84.6 dB (the corresponding LCpeak levels were 107.6 dB and 103.3 dB, respectively). Spectra plots for LZeq in figures 13-16 show that the peak frequency is approximately 1000 Hz. All spectra plots show a spike around frequency 100 Hz, which corresponds to the first harmonic tone of the propeller (some of the plots also show a couple of multiple tones).

8 | P a g e
60
70
80
90
[ dB]
8: 2 8:40 AM
5/1 7/2 016
8: 2 8:45 AM 8:2 8: 5 0 AM 8:2 8: 5 5 AM 8: 29:0 0 AM 8 :29: 05 A M 8 :29: 10 A M
Soun d Cur sor val uesRep ortX: 8 : 28 :38 AM - 8: 2 9:13 AM
LAe q: 6 9.0 dBLog gedX: 8 : 28 :57 AM - 8: 2 8:58 AM
LAF max : 76 .8 d BLAF mi n : 75. 8 dB
LCp eak: 94. 2 dB
LAe q: 7 6.2 dB
60
70
80
90
[dB]
9:27:48 AM5/17/2016
9:27:54 AM 9:28:00 AM 9:28:06 AM 9:28:12 AM 9:28:18 AM
Sound Cursor valuesReportX: 9:27:47 AM - 9:28:23 AMLAeq: 68.3 dBLoggedX: 9:28:08 AM - 9:28:09 AMLAFmax: 75.5 dBLAFmin: 74.1 dBLCpeak: 92.5 dBLAeq: 74.9 dB
60
70
80
90
100
110[dB]
9:31:50 AM5/17/2016
9:31:55 AM 9:32:00 AM 9:32:05 AM 9:32:10 AM 9:32:15 AM 9:32:20 AM
Sound Cursor valuesReportX: 9:31:50 AM - 9:32:20 AMLAeq: 79.8 dBLoggedX: 9:32:02 AM - 9:32:03 AMLAFmax: 91.0 dBLAFmin: 88.6 dBLCpeak: 105.4 dBLAeq: 89.8 dB
60
70
80
90
100
110[dB]
9:39:10 AM5/17/2016
9:39:20 AM 9:39:30 AM
Sound Cursor valuesReportX: 9:39:05 AM - 9:39:34 AMLAeq: 81.5 dBLoggedX: 9:39:18 AM - 9:39:19 AMLAFmax: 93.6 dBLAFmin: 90.6 dBLCpeak: 107.8 dBLAeq: 92.6 dB
Figure 5. Time histories of LAFmax, LAFmin, LCpeak and LAeq for the level flight at
200 feet (1500 direction); microphone #1; events 1, 2 and 3 in table 3.

9 | P a g e
60
70
80
90
[dB]
8: 28: 4 0 AM
5 /17/ 2016
8: 28: 4 5 AM 8: 28: 5 0 AM 8 :28: 55 A M 8 :29: 00 A M 8 : 29: 05 A M 8 : 29: 10 A M
Sou nd Cur sor valu esRep ortX: 8 : 28 :38 A M - 8: 2 9:13 AM
LAe q: 6 9.0 d BLog gedX: 8 : 28 :57 A M - 8: 2 8:58 AM
LAF max : 76 .8 dBLAF mi n: 75. 8 dB
LCp eak: 94. 2 dB
LAe q: 7 6.2 d B
60
80
100
120[dB]
10:12:36 AM5/17/2016
10:12:42 AM 10:12:48 AM 10:12:54 AM 10:13:00 AM
Sound Cursor valuesReportX: 10:12:33 AM - 10:13:05 AMLAeq: 81.6 dBLoggedX: 10:12:50 AM - 10:12:51 AMLAFmax: 95.3 dBLAFmin: 90.1 dBLCpeak: 110.6 dBLAeq: 92.8 dB
70
80
90
100
110[dB]
10:15:50 AM5/17/2016
10:15:55 AM 10:16:00 AM 10:16:05 AM
Sound Cursor valuesReportX: 10:15:46 AM - 10:16:05 AMLAeq: 82.7 dBLoggedX: 10:15:51 AM - 10:15:52 AMLAFmax: 94.0 dBLAFmin: 87.9 dBLCpeak: 107.8 dBLAeq: 91.0 dB
60
70
80
90
100
110[dB]
10:18:36 AM5/17/2016
10:18:42 AM 10:18:48 AM 10:18:54 AM 10:19:00 AM 10:19:06 AM
Sound Cursor valuesReportX: 10:18:36 AM - 10:19:10 AMLAeq: 80.8 dBLoggedX: 10:18:53 AM - 10:18:54 AMLAFmax: 94.2 dBLAFmin: 88.1 dBLCpeak: 108.3 dBLAeq: 91.1 dB
Figure 6. Time histories of LAFmax, LAFmin, LCpeak and LAeq for the level flight at
200 feet (3300 direction); microphone #1; events 4, 5 and 6 in table 3.

10 | P a g e
60
70
80
90
[dB]
8: 28: 4 0 AM
5 /17/ 2016
8: 28: 4 5 AM 8: 28: 5 0 AM 8 :28: 55 A M 8 :29: 00 A M 8 : 29: 05 A M 8 : 29: 10 A M
Sou nd Cur sor valu esRep ortX: 8 : 28 :38 A M - 8: 2 9:13 AM
LAe q: 6 9.0 d BLog gedX: 8 : 28 :57 A M - 8: 2 8:58 AM
LAF max : 76 .8 dBLAF mi n: 75. 8 dB
LCp eak: 94. 2 dB
LAe q: 7 6.2 d B
60
70
80
90
100
110[dB]
10:32:50 AM5/17/2016
10:33:00 AM 10:33:10 AM 10:33:20 AM
Sound Cursor valuesReportX: 10:32:42 AM - 10:33:22 AMLAeq: 76.3 dBLoggedX: 10:33:04 AM - 10:33:05 AMLAFmax: 87.0 dBLAFmin: 83.7 dBLCpeak: 100.9 dBLAeq: 85.2 dB
60
70
80
90
100
110[dB]
10:36:00 AM5/17/2016
10:36:06 AM 10:36:12 AM 10:36:18 AM 10:36:24 AM 10:36:30 AM
Sound Cursor valuesReportX: 10:35:58 AM - 10:36:35 AMLAeq: 76.2 dBLoggedX: 10:36:17 AM - 10:36:18 AMLAFmax: 86.8 dBLAFmin: 82.4 dBLCpeak: 100.7 dBLAeq: 86.0 dB
60
70
80
90
100
110[dB]
10:39:24 AM5/17/2016
10:39:30 AM 10:39:36 AM 10:39:42 AM 10:39:48 AM 10:39:54 AM
Sound Cursor valuesReportX: 10:39:22 AM - 10:39:52 AMLAeq: 77.9 dBLoggedX: 10:39:39 AM - 10:39:40 AMLAFmax: 88.4 dBLAFmin: 83.3 dBLCpeak: 103.3 dBLAeq: 86.6 dB
Figure 7. Time histories of LAFmax, LAFmin, LCpeak and LAeq for the level flight at
400 feet (3300 direction); microphone #2; events 1, 2 and 3 in table 3.

11 | P a g e
60
70
80
90
[dB]
8: 28: 4 0 AM5 /17/ 2016
8: 28: 4 5 AM 8: 28: 5 0 AM 8 :28: 55 A M 8 :29: 00 A M 8 : 29: 05 A M 8 : 29: 10 A M
Sou nd Cur sor valu esRep ortX: 8 : 28 :38 A M - 8: 2 9:13 AM
LAe q: 6 9.0 d BLog gedX: 8 : 28 :57 A M - 8: 2 8:58 AMLAF max : 76 .8 dB
LAF mi n: 75. 8 dB
LCp eak: 94. 2 dBLAe q: 7 6.2 d B
50
60
70
80
90
100
110[dB]
10:44:10 AM5/17/2016
10:44:15 AM 10:44:20 AM 10:44:25 AM 10:44:30 AM 10:44:35 AM
Sound Cursor valuesReportX: 10:44:07 AM - 10:44:37 AMLAeq: 77.7 dBLoggedX: 10:44:15 AM - 10:44:16 AMLAFmax: 88.9 dBLAFmin: 83.7 dBLCpeak: 103.3 dBLAeq: 87.5 dB
60
70
80
90
100
110[dB]
10:47:10 AM5/17/2016
10:47:20 AM 10:47:30 AM
Sound Cursor valuesReportX: 10:47:08 AM - 10:47:37 AMLAeq: 77.2 dBLoggedX: 10:47:17 AM - 10:47:18 AMLAFmax: 86.8 dBLAFmin: 85.9 dBLCpeak: 100.0 dBLAeq: 86.4 dB
60
70
80
90
[dB]
10:50:20 AM5/17/2016
10:50:30 AM 10:50:40 AM
Sound Cursor valuesReportX: 10:50:15 AM - 10:50:44 AMLAeq: 76.1 dBLoggedX: 10:50:24 AM - 10:50:25 AMLAFmax: 84.6 dBLAFmin: 81.7 dBLCpeak: 98.8 dBLAeq: 83.8 dB
Figure 8. Time histories of LAFmax, LAFmin, LCpeak and LAeq for the level flight at
200 feet (1500 direction); microphone #2; events 4, 5 and 6 in table 3.

12 | P a g e
60
70
80
90
[dB ]
8: 28:4 0 A M
5 /17/ 2016
8: 28:4 5 A M 8 :28: 50 A M 8: 28 :55 A M 8:29 : 00 AM 8: 2 9:05 A M 8:2 9: 1 0 AM
ReportX : 8:2 8: 3 8 AM - 8 : 29: 13 A ML Aeq: 69. 0 dB
LoggedX : 8:2 8: 5 7 AM - 8 : 28: 58 A ML AFm ax: 76. 8 dB
L AFm in: 7 5. 8 dBL Cpea k: 9 4.2 dBL Aeq: 76. 2 dB
60
70
80
90
[dB]
8:28:40 AM5/17/2016
8:28:45 AM 8:28:50 AM 8:28:55 AM 8:29:00 AM 8:29:05 AM 8:29:10 AM
Sound Cursor valuesReportX: 8:28:38 AM - 8:29:13 AMLAeq: 69.0 dBLoggedX: 8:28:57 AM - 8:28:58 AMLAFmax: 76.8 dBLAFmin: 75.8 dBLCpeak: 94.2 dBLAeq: 76.2 dB
60
70
80
90
100
110[dB]
8:32:40 AM5/17/2016
8:32:50 AM 8:33:00 AM
Sound Cursor valuesReportX: 8:32:37 AM - 8:33:05 AMLAeq: 79.9 dBLoggedX: 8:32:50 AM - 8:32:51 AMLAFmax: 89.2 dBLAFmin: 83.7 dBLCpeak: 103.9 dBLAeq: 88.1 dB
60
70
80
90
100
110[dB]
8:39:50 AM5/17/2016
8:39:55 AM 8:40:00 AM 8:40:05 AM 8:40:10 AM 8:40:15 AM 8:40:20 AM
Sound Cursor valuesReportX: 8:39:50 AM - 8:40:20 AMLAeq: 82.6 dBLoggedX: 8:40:06 AM - 8:40:07 AMLAFmax: 94.2 dBLAFmin: 86.8 dBLCpeak: 107.6 dBLAeq: 92.6 dB
Figure 9. Time histories of LAFmax, LAFmin, LCpeak and LAeq for the level flight at
400 feet (1500 direction); microphone #1; events 7, 8 and 9 in table 3.

13 | P a g e
60
70
80
90
[ dB]
8: 2 8:40 AM
5/1 7/2 016
8: 2 8:45 AM 8:2 8: 5 0 AM 8:2 8: 5 5 AM 8: 29:0 0 AM 8 :29: 05 A M 8 :29: 10 A M
Soun d Cur sor val uesRep ortX: 8 : 28 :38 AM - 8: 2 9:13 AM
LAe q: 6 9.0 dBLog gedX: 8 : 28 :57 AM - 8: 2 8:58 AM
LAF max : 76 .8 d BLAF mi n : 75. 8 dB
LCp eak: 94. 2 dB
LAe q: 7 6.2 dB
60
70
80
90
100
110[dB]
9:13:20 AM5/17/2016
9:13:25 AM 9:13:30 AM 9:13:35 AM 9:13:40 AM 9:13:45 AM 9:13:50 AM
Sound Cursor valuesReportX: 9:13:18 AM - 9:13:51 AMLAeq: 81.3 dBLoggedX: 9:13:38 AM - 9:13:39 AMLAFmax: 92.7 dBLAFmin: 87.2 dBLCpeak: 106.3 dBLAeq: 91.2 dB
70
80
90
100
110[dB]
9:16:35 AM5/17/2016
9:16:40 AM 9:16:45 AM 9:16:50 AM
Sound Cursor valuesReportX: 9:16:32 AM - 9:16:52 AMLAeq: 83.7 dBLoggedX: 9:16:39 AM - 9:16:40 AMLAFmax: 93.0 dBLAFmin: 88.1 dBLCpeak: 106.2 dBLAeq: 91.7 dB
60
70
80
90
100
110[dB]
9:19:25 AM5/17/2016
9:19:30 AM 9:19:35 AM 9:19:40 AM 9:19:45 AM 9:19:50 AM 9:19:55 AM
Sound Cursor valuesReportX: 9:19:22 AM - 9:19:55 AMLAeq: 81.1 dBLoggedX: 9:19:42 AM - 9:19:43 AMLAFmax: 91.1 dBLAFmin: 89.1 dBLCpeak: 104.3 dBLAeq: 90.2 dB
Figure 10. Time histories of LAFmax, LAFmin, LCpeak and LAeq for the level flight at
400 feet (3300 direction); microphone #1; events 10, 11 and 12 in table 3.

14 | P a g e
60
70
80
90
[dB]
8: 28: 4 0 AM
5 /17/ 2016
8: 28: 4 5 AM 8: 28: 5 0 AM 8 :28: 55 A M 8 :29: 00 A M 8 : 29: 05 A M 8 : 29: 10 A M
Sou nd Cur sor valu esRep ortX: 8 : 28 :38 A M - 8: 2 9:13 AM
LAe q: 6 9.0 d BLog gedX: 8 : 28 :57 A M - 8: 2 8:58 AM
LAF max : 76 .8 dBLAF mi n: 75. 8 dB
LCp eak: 94. 2 dB
LAe q: 7 6.2 d B
60
70
80
90
[dB]
10:33:30 AM5/17/2016
10:33:36 AM 10:33:42 AM 10:33:48 AM 10:33:54 AM 10:34:00 AM
Sound Cursor valuesReportX: 10:33:26 AM - 10:34:01 AMLAeq: 76.6 dBLoggedX: 10:33:50 AM - 10:33:51 AMLAFmax: 84.3 dBLAFmin: 82.1 dBLCpeak: 96.2 dBLAeq: 83.1 dB
60
70
80
90
[dB]
10:36:42 AM5/17/2016
10:36:48 AM 10:36:54 AM 10:37:00 AM 10:37:06 AM 10:37:12 AM
Sound Cursor valuesReportX: 10:36:40 AM - 10:37:16 AMLAeq: 75.4 dBLoggedX: 10:36:59 AM - 10:37:00 AMLAFmax: 84.9 dBLAFmin: 76.0 dBLCpeak: 96.9 dBLAeq: 81.1 dB
60
70
80
90
100[dB]
10:40:06 AM5/17/2016
10:40:12 AM 10:40:18 AM 10:40:24 AM 10:40:30 AM 10:40:36 AM
Sound Cursor valuesReportX: 10:40:04 AM - 10:40:41 AMLAeq: 77.3 dBLoggedX: 10:40:25 AM - 10:40:26 AMLAFmax: 85.6 dBLAFmin: 83.2 dBLCpeak: 99.4 dBLAeq: 84.6 dB
Figure 11. Time histories of LAFmax, LAFmin, LCpeak and LAeq for the level flight at
400 feet (3300 direction); microphone #2; events 7, 8 and 9 in table 3.

15 | P a g e
60
70
80
90
[dB]
8: 28: 4 0 AM
5 /17/ 2016
8: 28: 4 5 AM 8: 28: 5 0 AM 8 :28: 55 A M 8 :29: 00 A M 8 : 29: 05 A M 8 : 29: 10 A M
Sou nd Cur sor valu esRep ortX: 8 : 28 :38 A M - 8: 2 9:13 AM
LAe q: 6 9.0 d BLog gedX: 8 : 28 :57 A M - 8: 2 8:58 AM
LAF max : 76 .8 dBLAF mi n: 75. 8 dB
LCp eak: 94. 2 dB
LAe q: 7 6.2 d B
60
70
80
90
[dB]
10:44:50 AM5/17/2016
10:44:55 AM 10:45:00 AM 10:45:05 AM 10:45:10 AM 10:45:15 AM
Sound Cursor valuesReportX: 10:44:49 AM - 10:45:19 AMLAeq: 76.9 dBLoggedX: 10:44:59 AM - 10:45:00 AMLAFmax: 85.7 dBLAFmin: 81.8 dBLCpeak: 98.6 dBLAeq: 84.6 dB
60
70
80
90
[dB]
10:47:50 AM5/17/2016
10:48:00 AM 10:48:10 AM 10:48:20 AM
Sound Cursor valuesReportX: 10:47:50 AM - 10:48:21 AMLAeq: 76.8 dBLoggedX: 10:48:01 AM - 10:48:02 AMLAFmax: 85.6 dBLAFmin: 83.6 dBLCpeak: 98.7 dBLAeq: 84.9 dB
60
70
80
90
[dB]
10:51:00 AM5/17/2016
10:51:10 AM 10:51:20 AM
Sound Cursor valuesReportX: 10:50:58 AM - 10:51:26 AMLAeq: 76.3 dBLoggedX: 10:51:08 AM - 10:51:09 AMLAFmax: 85.0 dBLAFmin: 81.7 dBLCpeak: 97.5 dBLAeq: 84.1 dB
Figure 12. Time histories of LAFmax, LAFmin, LCpeak and LAeq for the level flight at
400 feet (1500 direction); microphone #2; events 10, 11 and 12 in table 3.

16 | P a g e
102
103
104
0
10
20
30
40
50
60
70
80
90
100
frequency
LZ
eq
t1t2t3t4t5t6t7
102
103
104
0
10
20
30
40
50
60
70
80
90
100
frequency
LZ
eq
t1t2t3t4t5t6t7
102
103
104
0
10
20
30
40
50
60
70
80
90
100
frequency
LZe
q
t1t2t3t4t5t6t7
102
103
104
0
10
20
30
40
50
60
70
80
90
100
frequency
LZe
q
t1t2t3t4t5t6t7
102
103
104
0
10
20
30
40
50
60
70
80
90
100
frequency
LZ
eq
t1t2t3t4t5t6t7
102
103
104
0
10
20
30
40
50
60
70
80
90
100
frequency
LZe
q
t1t2t3t4t5t6t7
Figure 13. Spectra of LZeq for the level flight at 200 feet, for different times and for microphone #1: a) event 1; b) event 2; c) event 3; d) event 4; e) event 5; f) event 6 (see table 3). In the
legend, t1, t2, t3, t4, t5, t6 and t7 represent different times, 5 seconds apart from each other.
a) b)
c) d)
e) f)

17 | P a g e
102
103
104
0
10
20
30
40
50
60
70
80
90
100
frequency
LZ
eq
t1t2t3t4t5t6t7
102
103
104
0
10
20
30
40
50
60
70
80
90
100
frequency
LZe
q
t1t2t3t4t5t6t7
102
103
104
0
10
20
30
40
50
60
70
80
90
100
frequency
LZe
q
t1t2t3t4t5t6t7
102
103
104
0
10
20
30
40
50
60
70
80
90
100
frequency
LZe
q
t1t2t3t4t5t6t7
102
103
104
0
10
20
30
40
50
60
70
80
90
100
frequency
LZ
eq
t1t2t3t4t5t6t7
102
103
104
0
10
20
30
40
50
60
70
80
90
100
frequency
LZ
eq
t1t2t3t4t5t6t7
Figure 14. Spectra of LZeq for the level flight at 400 feet, for different times and for microphone #1: a) event 7; b) event 8; c) event 9; d) event 10; e) event 11; f) event 12 (see table 3). In the legend, t1, t2, t3, t4, t5, t6 and t7 represent different times, 5 seconds apart from each other.
a) b)
c) d)
e) f)

18 | P a g e
102
103
104
0
10
20
30
40
50
60
70
80
90
100
frequency
LZ
eq
t1t2t3t4t5t6t7
102
103
104
0
10
20
30
40
50
60
70
80
90
100
frequency
LZe
q
t1t2t3t4t5t6t7
102
103
104
0
10
20
30
40
50
60
70
80
90
100
frequency
LZ
eq
t1t2t3t4t5t6t7
102
103
104
0
10
20
30
40
50
60
70
80
90
100
frequency
LZ
eq
t1t2t3t4t5t6t7
102
103
104
0
10
20
30
40
50
60
70
80
90
100
frequency
LZ
eq
t1t2t3t4t5t6t7
102
103
104
0
10
20
30
40
50
60
70
80
90
100
frequency
LZ
eq
t1t2t3t4t5t6t7
Figure 15. Spectra of LZeq for the level flight at 200 feet, for different times and for microphone
#2: a) event 1; b) event 2; c) event 3; d) event 4; e) event 5; f) event 6 (see table 3). In the legend, t1, t2, t3, t4, t5, t6 and t7 represent different times, 5 seconds apart from each other.
a) b)
c) d)
e) f)

19 | P a g e
102
103
104
0
10
20
30
40
50
60
70
80
90
100
frequency
LZe
q
t1t2t3t4t5t6t7
102
103
104
0
10
20
30
40
50
60
70
80
90
100
frequency
LZe
q
t1t2t3t4t5t6t7
102
103
104
0
10
20
30
40
50
60
70
80
90
100
frequency
LZ
eq
t1t2t3t4t5t6t7
102
103
104
0
10
20
30
40
50
60
70
80
90
100
frequency
LZ
eq
t1t2t3t4t5t6t7
102
103
104
0
10
20
30
40
50
60
70
80
90
100
frequency
LZe
q
t1t2t3t4t5t6t7
102
103
104
0
10
20
30
40
50
60
70
80
90
100
frequency
LZ
eq
t1t2t3t4t5t6t7
Figure 16. Spectra of LZeq for the level flight at 400 feet, for different times and for microphone #2: a) event 7; b) event 8; c) event 9; d) event 10; e) event 11; f) event 12 (see table 3). In the legend, t1, t2, t3, t4, t5, t6 and t7 represent different times, 5 seconds apart from each other.
a) b)
c) d)
e) f)
20 | P a g e
Appendix A LAeq : A-weighted, equivalent sound level. A widely used noise parameter describing a sound level with the same Energy content as the varying acoustic signal measured LAFmax : A-weighted, Fast, Maximum, Sound Level. LAFmin : A-weighted, Fast, Minimum, Sound Level. LASmax : A-weighted, Slow, Maximum, Sound Level. LASmin : A-weighted, Slow, Minimum, Sound Level. LCpeak : C-weighted, Peak, Sound Level. A-weighting : the A-weighting filter covers the full audio range - 20 Hz to 20 kHz and the shape is similar to the response of the human ear at the lower levels - see the Equal Loudness Contours entry. C-weighting : a standard frequency weighting for sound level meters, commonly used for higher level measurements and Peak - Sound Pressure Levels. Approximately follows the 100 Phon curve - also written as dB(C) or dBC.
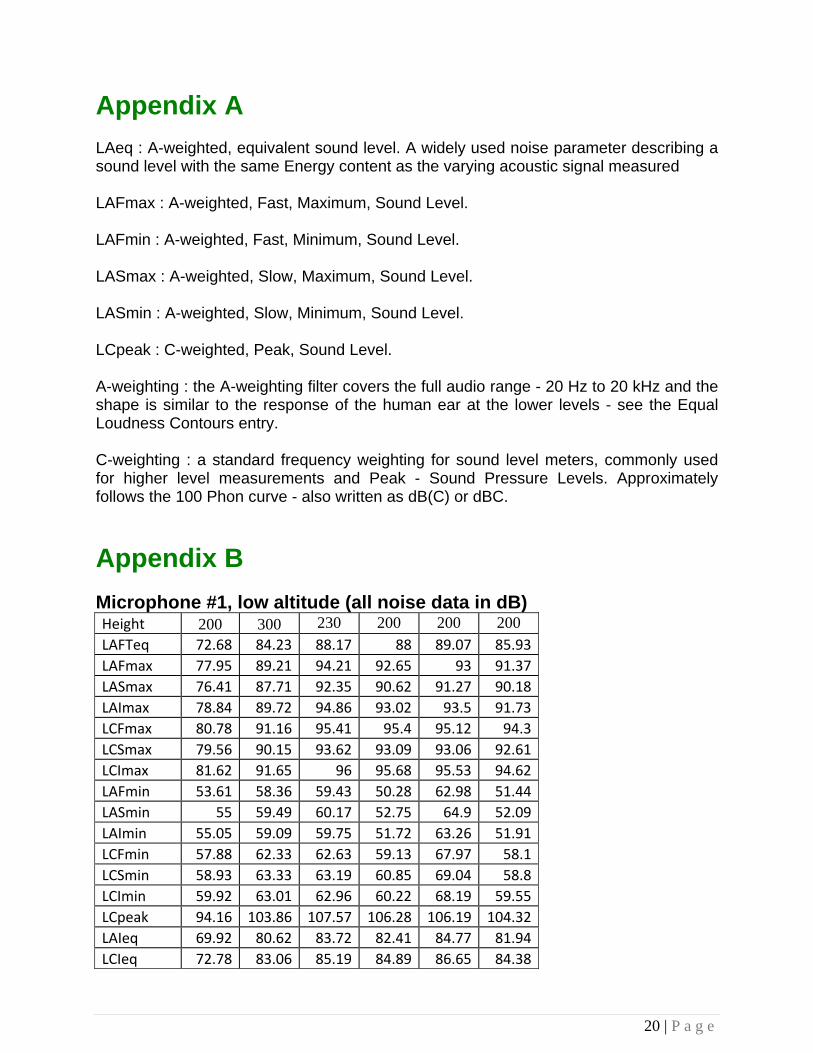
Appendix B Microphone #1, low altitude (all noise data in dB) Height 200 300 230 200 200 200 LAFTeq 72.68 84.23 88.17 88 89.07 85.93
LAFmax 77.95 89.21 94.21 92.65 93 91.37
LASmax 76.41 87.71 92.35 90.62 91.27 90.18
LAImax 78.84 89.72 94.86 93.02 93.5 91.73
LCFmax 80.78 91.16 95.41 95.4 95.12 94.3
LCSmax 79.56 90.15 93.62 93.09 93.06 92.61
LCImax 81.62 91.65 96 95.68 95.53 94.62
LAFmin 53.61 58.36 59.43 50.28 62.98 51.44
LASmin 55 59.49 60.17 52.75 64.9 52.09
LAImin 55.05 59.09 59.75 51.72 63.26 51.91
LCFmin 57.88 62.33 62.63 59.13 67.97 58.1
LCSmin 58.93 63.33 63.19 60.85 69.04 58.8
LCImin 59.92 63.01 62.96 60.22 68.19 59.55
LCpeak 94.16 103.86 107.57 106.28 106.19 104.32
LAIeq 69.92 80.62 83.72 82.41 84.77 81.94
LCIeq 72.78 83.06 85.19 84.89 86.65 84.38

21 | P a g e
LAeq 68.99 79.92 82.57 81.27 83.67 81.07 Microphone #1, high altitude (all noise data in dB) Height 400 480 440 440 450 470
LAFTeq 79.89 80.01 80.76 81.92 80.5 80.99
LAFmax 84.3 84.86 85.59 85.67 85.61 84.97
LASmax 83.27 82.17 84.77 84.06 84.26 82.92
LAImax 84.84 86.2 86.51 86.18 86.23 85.46
LCFmax 86.46 86.24 87.4 86.97 86.82 86.49
LCSmax 85.44 84.58 86.49 85.9 86.23 85.03
LCImax 86.99 87.39 88.28 87.39 87.22 86.89
LAFmin 50.78 53.94 54.53 56.63 52.68 55.74
LASmin 54.09 55.87 58.04 59.32 54.96 60.03
LAImin 54.05 54.64 57.56 58.68 53.74 60.14
LCFmin 56.61 58.41 58.97 63.07 58.5 63.94
LCSmin 59.3 60.16 61.52 64.09 60.35 64.67
LCImin 59.09 59.9 61.67 63.58 59.98 65.97
LCpeak 96.44 96.89 99.37 98.64 98.71 97.52
LAIeq 77.25 76.9 78.14 77.73 77.6 77.37
LCIeq 79.22 78.92 79.7 79.28 79.26 79.33
LAeq 76.55 75.44 77.29 76.86 76.83 76.31 Microphone #2, low altitude (all noise data in dB) Height 200 300 230 200 200 200 LAFTeq 71.85 85.14 87.12 88.1 90.18 87.9
LAFmax 75.92 91.02 93.56 95.31 93.95 94.23
LASmax 75.04 88.94 91.44 91.86 90.75 91
LAImax 76.71 91.79 94.17 96.31 94.66 95.03
LCFmax 78.76 92.81 96.47 96.92 95.58 96.17
LCSmax 77.92 91.37 94.68 93.71 92.68 93.16
LCImax 79.56 93.18 96.86 97.73 96.24 96.75
LAFmin 52.06 56 54.29 54.32 61.75 56.45
LASmin 53.02 57.84 56.14 54.41 63.81 56.85
LAImin 53.18 56.85 54.67 54.61 62.59 56.74
LCFmin 56.75 63.35 61.53 62.93 67.13 60.86
LCSmin 57.89 64.02 62.51 64.68 68.58 62.63
LCImin 58.34 63.79 62.21 66.2 68.2 63.57
LCpeak 92.49 105.38 107.81 110.59 107.75 108.32
LAIeq 68.93 80.89 83 84.53 85.29 83.24

22 | P a g e
LCIeq 71.72 83.24 86.13 86.11 87.07 85.25
LAeq 68.3 79.8 81.53 81.58 82.69 80.79 Microphone #2, high altitude (all noise data in dB) Height 400 480 440 440 450 470
LAFTeq 80.98 80.68 84.02 82.83 82.06 81.36
LAFmax 87.05 86.84 88.4 88.9 86.78 84.79
LASmax 85.19 85.07 85.77 86.16 85.58 83.77
LAImax 87.58 87.19 89.44 89.47 87.05 85.41
LCFmax 88.91 89.16 90.03 90.6 89.32 88.5
LCSmax 87.23 87.7 87.8 88.84 88.49 87.34
LCImax 89.24 89.65 90.82 91.13 89.56 89.08
LAFmin 54.16 56.86 56.54 47.68 57.19 55.59
LASmin 55.49 58.08 60.41 52.82 59.69 56.97
LAImin 54.5 57.18 60.03 54.73 58.8 57.82
LCFmin 58.99 60.62 63.64 64.14 61.88 66.95
LCSmin 60.35 61.94 65.25 66.58 63.72 68.72
LCImin 59.66 61.64 64.96 67.04 62.74 70.45
LCpeak 100.9 100.67 103.27 103.29 100.04 98.79
LAIeq 77.26 77.25 79.37 79.02 78.06 77.16
LCIeq 79.19 79.93 81.12 81.26 80.77 80.51
LAeq 76.27 76.23 77.91 77.72 77.21 76.08