Embed Size (px)
Citation preview

TAMK University of Applied Sciences Degree Programme in Information Technology, Master's Degree Mika Immonen Master’s Thesis Tieto Software Product Quality Analysis System Supervisor Lecturer, Jari Mikkolainen Commissioned by Director, R&D Support Services; Hannu Hytönen, Tieto Finland Oy Tampere 12/2009

TAMK University of Applied Sciences Degree Programme in Information Technology, Master's Degree Mika Immonen Author(s) Mika Immonen Master’s thesis Tieto Software Product Quality Analysis System Number of pages 77 Graduation time January 2010 Thesis supervisor Lecturer, Jari Mikkolainen Commissioned by Director, R&D Support Services; Hannu Hytönen, Tieto Finland
Oy
ABSTRACT The software quality assurance has become a significant aspect in the software industry. The overall complexity and the average size of the software product keeps growing; and at the same time, customers keep demanding that more should be done with lesser and lesser effort. This requires the usage of a good software quality assurance model to maintain a sufficient level of software quality. The software quality assurance has usually been addressed by following different quality processes but they often neglect the quality of the software product itself. Tieto SPQ (Tieto Software Product Quality) analysis system was designed to fill in the gap between the general software quality assurance and the actual software product quality. Tieto SPQ analysis system was also designed to unify the way how different software quality analyses could be executed and measured inside Tieto. The ISO/IEC 9126 and its successor the ISO/IEC 25000 standard families were taken as a base model for Tieto SPQ analysis system. These standards and other software quality metric suites found from software literature were used to create a solid and unified structure for the software product quality model. Based on the standards, the software quality model was divided into eight quality categories: functional suitability; reliability; security; compatibility; operability; performance efficiency; maintainability; and portability. This master’s thesis serves as a system architecture specification gathering together all requirements for Tieto SPQ analysis system. The scope of this master’s thesis is to define the different components and services of the system; design the needed database schema for the system; and to create definitions how the software product quality should be measured in Tieto.
Keywords Tieto SPQ analysis system, software product quality,
software product quality analysing

TAMK University of Applied Sciences Degree Programme in Information Technology, Master's Degree Mika Immonen Tekijä Mika Immonen Työn nimi Tiedon ohjelmistotuotteen laadun analysointijärjestelmä Sivumäärä: 77 Valmistumis aika Tammikuu 2010 Työn valvoja Lehtori, Jari Mikkolainen Työn tilaaja Johtaja, R&D Support Services; Hannu Hytönen, Tieto Finland Oy TIIVISTELMÄ Ohjelmiston laadunvarmistuksesta on tullut merkittävä tekijä ohjelmistoteollisuudessa. Ohjelmistojen monimutkaisuus ja keskimääräinen koko jatkavat kasvamistaan samalla kuin asiakkaat vaativat yhä enemmän sisältöä yhä pienemmällä työmäärällä. Tämä vaatii hyvän ohjelmiston laadunvarmistuksen käyttämistä, jotta voidaan taata riittävä taso ohjelmiston laadussa. Ohjelmiston laadunvarmistus on yleensä toteutettu seuraamalla erilaisia laatuprosesseja, mutta näiden perussynti on ollut laiminlyödä laatu itse ohjelmistotuotteen kohdalla. Tieto SPQ (Tieto Software Product Quality), Tieto ohjelmistotuotteen laadun analysointijärjestelmä suunniteltiin täyttämään ero yleisen ohjelmiston laadun-varmistuksen ja ohjelmistotuotteen laadun välillä. Tieto SPQ analysointijärjestelmä suunniteltiin myös yhdistämään ne tavat, joilla erilaisia ohjelmiston laadun analysointeja suoritetaan ja mitataan Tieto Oyj:ssä. ISO/IEC 9126 ja sen seuraaja ISO/IEC 25000 standardiperheet otettiin perustaksi Tiedon ohjelmistotuotteen laadun analysointijärjestelmässä. Näitä standardeja käytettiin yhdessä muiden ohjelmistoalan kirjallisuudesta kerättyjen ohjelmiston laatumittaristojen kanssa muodostamaan vakaa ja yhtenäinen rakenne ohjelmistotuotteen laatumalliksi. Standardeihin perustuen, ohjelmistotuotteen laatumalli jaettiin 8 eri laatukategoriaan: toiminnalliseen sopivuuteen, luotettavuuteen, turvallisuuteen, yhteensopivuuteen, käyttökelpoisuuteen, suoritustehokkuuteen ja siirrettävyyteen. Tämä informaatio-teknologian, ylempi AMK, päättötyö palvelee järjestelmä-arkkitehtuurimääritelmänä keräten yhteen kaikki vaatimukset Tiedon ohjelmisto-tuotteen laadun analysointijärjestelmästä. Työn ensisijaisena tarkoituksena on määritellä erilaiset järjestelmäpalvelut sekä järjestelmäkomponentit, suunnitella tarvittava tietokantamalli ja luoda määritelmät kuinka ohjelmistotuotteen laatua pitäisi mitata Tieto Oyj:ssä. Avainsanat Tieto SPQ analysointijärjestelmä, ohjelmistotuotteen laatu,
ohjelmistotuotteen laadun analysointi
Foreword
I want to thank Hannu Hytönen for providing this opportunity to write this master’s thesis from such a challenging subject; FISMA’s Risto Nevalainen for providing all ISO/IEC materials; and of course all different colleagues in Tieto for their professional aid and wisdom. I want to give special thanks to my wife, Miina, for her never-ending support during this project. I realise that it must have been nerve-wracking sometimes to tolerate me; especially during the writing process of this master’s thesis. Without her help my participation to the Degree Programme in Information Technology would not have been possible. Tampere December 2009 Mika Immonen

TAMK University of Applied Sciences Degree Programme in Information Technology, Master's Degree Mika Immonen Table of Contents 1 Introduction................................................................................................................ 8
2 Description of Master’s Thesis ................................................................................. 11 2.1 Starting Point and the Scope of the Master’s Thesis ......................................................11 2.2 Collecting Background Information ................................................................................11 2.3 System Design Phase ...................................................................................................12
3 Tieto Engineering Toolbox........................................................................................ 14 3.1 Overview.......................................................................................................................14
4 Software Quality ...................................................................................................... 17 4.1 Software Quality in General ...........................................................................................17 4.2 Measuring Software Quality...........................................................................................18
4.2.1 Static and Dynamic Quality Analysis .....................................................................18 4.2.2 Lines of Code .......................................................................................................19 4.2.3 Halstead's Complexity Metrics ..............................................................................20 4.2.4 Cyclomatic Complexity..........................................................................................21 4.2.5 Object-Oriented Metrics ........................................................................................22 4.2.5.1 Lorenz Metrics and Rules of Thumb .............................................................22 4.2.5.2 Chidamber and Kemerer Metrics Suite .........................................................23 4.2.5.3 Quality Model for Object-Oriented Design.....................................................26
4.3 ISO/IEC 9126 Series of standards – Software Product Quality .......................................28 4.3.1 Internal and External Quality Metrics.....................................................................29 4.3.1.1 Functionality .................................................................................................30 4.3.1.2 Reliability......................................................................................................30 4.3.1.3 Usability .......................................................................................................31 4.3.1.4 Efficiency......................................................................................................31 4.3.1.5 Maintainability ..............................................................................................31 4.3.1.6 Portability .....................................................................................................32 4.3.2 Quality in Use Metrics...........................................................................................32
4.4 ISO/IEC 25000 Series of standards – Software Quality Requirements and Evaluation ...33 4.4.1 Software Product Quality Lifecycle Model .............................................................34 4.4.2 Quality Models......................................................................................................35 4.4.2.1 Software Product Quality Model....................................................................36 4.4.2.1.1 Functional Suitability.................................................................................37 4.4.2.1.2 Reliability..................................................................................................38 4.4.2.1.3 Security ....................................................................................................38 4.4.2.1.4 Compatibility.............................................................................................38 4.4.2.1.5 Operability ................................................................................................39 4.4.2.1.6 Performance Efficiency.............................................................................39 4.4.2.1.7 Maintainability...........................................................................................40 4.4.2.1.8 Portability .................................................................................................40 4.4.2.2 System Quality in Use Model........................................................................41 4.4.2.2.1 Usability....................................................................................................41 4.4.2.2.2 Flexibility ..................................................................................................42 4.4.2.2.3 Safety.......................................................................................................42 4.4.2.3 Using the Quality Model................................................................................43

TAMK University of Applied Sciences Degree Programme in Information Technology, Master's Degree Mika Immonen
5 Tieto Software Product Quality Analysis System...................................................... 45 5.1 Overview.......................................................................................................................45 5.2 General Architecture......................................................................................................46 5.3 Software Product Quality ...............................................................................................50
5.3.1 Software Product Quality Model............................................................................50 5.3.1.1 Example of the Software Product Quality Model............................................51 5.3.2 The Overall Software Product Quality ...................................................................52 5.3.3 Calculation of the Software Product Quality Model Value ......................................54 5.3.4 Presenting the Software Product Quality Models...................................................55
5.4 Services of Tieto SPQ Analysis System.........................................................................56 5.4.1 Installation and Configuration Service ...................................................................56 5.4.2 Analysing Tools Integration Service ......................................................................56 5.4.3 Help Desk and Training Service............................................................................58 5.4.4 Quality Consultation Service .................................................................................59
5.5 Software Analysis Data Management ............................................................................59 5.6 Database Architecture ...................................................................................................63
5.6.1 Design Principles..................................................................................................63 5.6.2 Software Product Layer ........................................................................................63 5.6.3 Software Product Quality Model Layer ..................................................................66 5.6.4 Software Quality Library Layer ..............................................................................68 5.6.5 Software Product Quality Analysis Layer...............................................................69 5.6.6 Analysis Configuration Layer ................................................................................71
6 Conclusions ............................................................................................................. 73
References ................................................................................................................. 75

List of abbreviations
ACL Analysis Configuration Layer, the configuration layer from the database
schema of Tieto SPQ analysis system.
IEC International Electrotechnical Commission.
ISO International Organization for Standardization.
SPL Software Product Layer, the product layer from the database schema of Tieto
SPQ analysis system.
SPQAL Software Product Quality Analysis Layer, the quality analysis layer from the
database schema of Tieto SPQ analysis system.
SPQM Software Product Quality Model, the quality model of the software product.
SPQMW Software Product Quality Model Weight, the emphasis factor of the software
product quality model used in different quality calculations.
SPQF Software Product Quality Factor, the entity of the software product quality
model.
SPQFW Software Product Quality Factor Weight, the emphasis factor of the software
product quality factor used in different quality calculations.
SPQML Software Product Quality Model Layer, the quality model layer from the
database schema of Tieto SPQ analysis system.
SQLL Software Quality Library Layer, the quality library layer from the database
schema of Tieto SPQ analysis system.
Tieto ETB Tieto Engineering Toolbox, Tieto Corporation’s automated build server
cluster.
Tieto SPQ Tieto Software Product Quality analysis system, the software product quality
analysis system defined in this master’s thesis.

TAMK University of Applied Sciences 8 (77) Degree Programme in Information Technology, Master's Degree Mika Immonen
1 Introduction
As software products grow bigger in size and complexity, the software quality
assurance becomes more and more important. In the end, it is the quality of the software
which determines how well the product succeeds in the market. Software quality
assurance is generally addressed by introducing the ways to improve company’s quality
processes.
Total Quality Management (TQM) and Motorola’s Six Sigma started to consider wider
approach to quality. In TQM quality is based on long-term commitment of all the
stakeholders of the company. All employees, including management, should be
participating continuously to improve processes, products and services of the company
(Kan, 2002, 7).
Although a good quality process most often leads to a better quality, it does not mean
that one can forget the quality of the software product itself. Instead of the quality
processes or the quality of the processes, the focus in this master’s thesis is on the
quality of the software product itself and how it can be measured. In Tieto there is a
quality process which is based on popular and widely used ISO-9001:2000 quality
management standard. It defines how the company manages quality in general but it
does not help the software teams validate the quality of their software products.
Running different analyses and tests for the end product during automated assembly
lines has been a general practice in traditional industry for a long time. In software
development industry the idea of software factory is still evolving. Continuous
integration and agile software development methods require that the building and
compiling phases of the software are automated. This means building the product in
dedicated build servers, automating the testing phases and running different software
analyses at the same time the product is being composed to final software product.
In agile software development the actual product development happens in sprints.
Typically the length of one sprint is 2 to 4 weeks. During this time the product is built
many times in build servers. As the name continuous integration indicates the final

TAMK University of Applied Sciences 9 (77) Degree Programme in Information Technology, Master's Degree Mika Immonen
product is always evolving. This causes changes to the behaviour of the software
product between different build versions. Nonetheless, the overall stability and the
quality of the product should not decrease. The final product should follow the
industry’s and company’s quality standards. Automated testing and analysing tools are
used to check the integrity and the overall quality of the software product.
Currently in Tieto more and more projects are run using agile methods. Software
products and components are being composed using automated build frameworks and
servers. The problem is that it is very difficult for the management to compare quality
of the software products together. Each team can use their own code analysis tools and
solutions to validate their products.
The main purpose of this master’s thesis is to find out how software quality analysis
could be used and measured in one unified way in Tieto. Management and project team
members should be able to compare projects and their results without difficulty. Each
product should be evaluated with the goodness factor. This factor will be produced by
calculating the emphasized software product quality attributes together based on
selected quality model.
ISO/IEC 9126 and its successor ISO/IEC 25000 standard families introduce a concept
of software quality model. These standards are created to help companies consider
different quality aspects of their products. Software quality model divides software
product quality into eight characteristics. These characteristics are functional suitability,
reliability, security, compatibility, operability, performance efficiency, maintainability
and portability. (ISO/IEC 25010:2009, ISO/IEC 9126-1:2000)
The reason why both ISO/IEC 9126 and ISO/IEC 25000 standards are introduced in
chapter 4 is that during the writing process of this master’s thesis, in summer and fall
2009, the ISO/IEC 25000 standard was not completely finished. ISO/IEC 9126 has
spread much wider in the software industry but because the ISO/IEC 25000 standard
introduces some very interesting new quality attributes, it simply cannot be ignored.

TAMK University of Applied Sciences 10 (77) Degree Programme in Information Technology, Master's Degree Mika Immonen
This master’s thesis is written in parts. The first part is the theoretical study of the
software quality analysis; the second part contains the system description and the
architecture for Tieto SPQ analysis system (Tieto Software Product Quality); the final
part introduces the lessons learned during this master’s thesis and conclusions.
Chapter 2 explains how this master’s thesis was divided into different working phases.
Each working phase is described as well as the chosen boundaries for the scope of the
master’s thesis.
Chapter 3 covers the concept of the automated build system. This chapter introduces
Tieto ETB (Tieto Engineering Toolbox), Tieto’s software development environment
and its basic functionalities. Products build with Tieto ETB are analysed with selected
software quality analysis tools and these results will be stored in and presented with
Tieto SPQ analysis system.
Chapter 4 forms the ground level for this master’s thesis. It consists of the theoretical
study of the software quality in general and provides suggested quality metrics from the
literature. This chapter introduces different concepts of software quality metrics based
on both the ISO/IEC 9126 and ISO/IEC 25000 software quality standards and explains
the meaning of software quality model.
Chapter 5 introduces Tieto Software Product Quality analysis system (Tieto SPQ
analysis system). This chapter presents the overall architecture, general services and
components of the system; explains the chosen design decisions; and finally introduces
the database schema. Terminology and decisions in this chapter are widely based on
chapter 4 theories.
Chapter 6 wraps up this master’s thesis, what was learned during this project and what
should be next steps. This chapter points out some development ideas and suggestions
on how one should proceed with Tieto SPQ analysis system.

TAMK University of Applied Sciences 11 (77) Degree Programme in Information Technology, Master's Degree Mika Immonen
2 Description of Master’s Thesis
The work in this master’s thesis was divided into different phases; these phases are
explained in this chapter. Chapter also illustrates the starting point and the scope of this
thesis.
2.1 Starting Point and the Scope of the Master’s Thesis
When the subject for this master’s thesis was chosen in summer 2008; there was no
unified way to measure the quality of the software products in Tieto. Different
measurements to validate software processes (and their phases) existed but the actual
software product was left out from those measurements. The need was recognized and it
was decided that in this master’s thesis such a system will be designed and its
preliminary requirements gathered.
It was agreed with supervisors of Tieto that about 10% of monthly working hours can
be used for this master’s thesis. The amount of hours made it evident that there would
not be enough time to make 100% complete system implementation before the master’s
thesis deadline; the end of the year 2009. Gathering of the different background
materials started in February 2009 and the writing of this master’s thesis started in May
2009; after completing other courses from the studies of Degree Programme in
Information Technology, Master's Degree.
At start it was agreed with Hannu Hytönen, Director, R&D Support Services; that the
emphasis of this master’s thesis was to define what the upcoming software product
quality analysis system could look like and how it can be achieved. The task was to
define the main architecture of the system; how product quality can be measured, how
those results can be stored and how they can be used later on.
2.2 Collecting Background Information
In the first phase, the concept of the software quality was studied. How software quality
was defined in the software industry in general and how other companies had adopted it
to their own quality analysis systems. This was done using software literature and
searching information from the internet. This study showed that measuring the product

TAMK University of Applied Sciences 12 (77) Degree Programme in Information Technology, Master's Degree Mika Immonen
itself is not a trivial task to do. There are so many different aspects to look from the
quality point of view that the defining one description is challenging at best. Finding the
reliable information from the internet was not easy and it was not widely available.
From the start it was clear that new Tieto’s analysing system has to be based on general
and industry defined best practices from the software quality. It was then that FISMA
(Finnish Software Measurement Association), whose partner Tieto is, was contacted.
Risto Nevalainen from FISMA provided the ISO/IEC 9126 and ISO/IEC 25000 families
of standards. Further investigation showed that those standards can be utilised in Tieto
SPQ analysis system.
Final background phase was to investigate what was already done and defined inside
Tieto. This included gathering contacts from different organisation units and requesting
information about previous studies and thesis around this subject. In summer 2009 Tieto
created a new Process&Quality (P&Q) organisation as part of the new Tieto branding
process. The P&Q organisation concentrates to organise and harmonise different
processes and usage of the quality standards inside Tieto. It turned out that because the
P&Q organisation was just created there were no existing measurement processes
available to validate the quality of the actual software products. This discovery steered
this master’s thesis to use the ISO / IEC 9126 and the ISO / IEC 25000 standards as a
base for the own product quality models.
2.3 System Design Phase
When a background material was gathered, it was time to start to define the architecture
of the actual software product quality analysis system and its components. In this design
phase, numerous meetings were arranged with Hannu Hytönen and the draft of the
overall architecture was designed.
The database schema was designed first. The database schema went through multiple
evolution steps before the final version. One obstacle in this phase was the lack of the
actual analysis data. The analysis data was not properly harmonised so there could not
be any stress tests for the database or its queries.

TAMK University of Applied Sciences 13 (77) Degree Programme in Information Technology, Master's Degree Mika Immonen
One of the steps was testing and evaluation of existing analysing tools. The software
products from the existing projects were used as guinea pigs to test how well different
analysing tools could be run during build phases. Different configuration files were
written during this phase and it was decided that they can be used in Tieto SPQ analysis
system to run software analyses automatically.
Finally, the overall architecture was put together around the database schema. This
phase included different steps: creating the different software quality formulas;
designing the usage of the software product quality libraries and the software product
quality models; defining the services and system components of Tieto SPQ analysis
system; and of course many other smaller entities in the overall architecture.
TAMK University of Applied Sciences 14 (77) Degree Programme in Information Technology, Master's Degree Mika Immonen
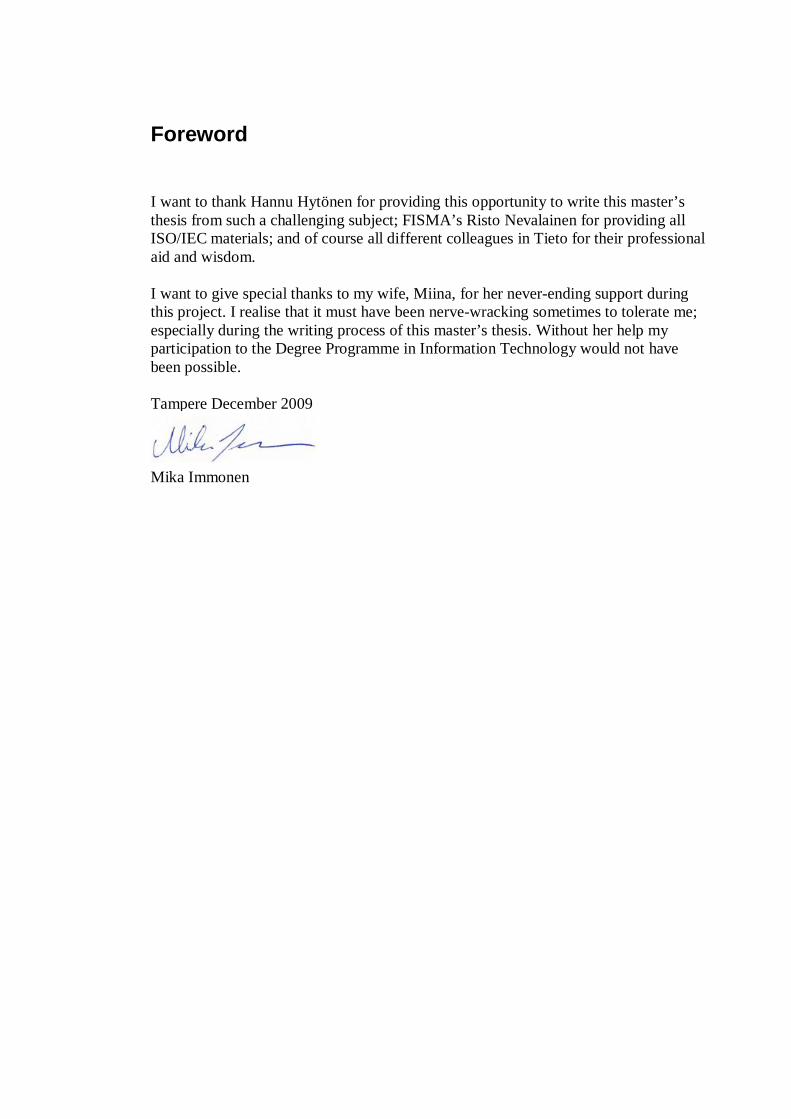
3 Tieto Engineering Toolbox
This chapter introduces Tieto Engineering Toolbox, the software development platform
used in Tieto. Tieto ETB was developed from the idea of having one Tieto wide
automated build system. Automated build system hides different time consuming
software development tasks from the end user by automating the project, user and
version control managements, build processes, progress tracking and test automation
management. Using the automated build system allows software teams to focus more on
their products instead of configuring different build, test and analysing frameworks.
Tieto ETB started as Tieto’s internal software development platform and it has grown to
be a full-scale software development platform service solution to the outside customers.
3.1 Overview
Tieto Engineering Toolbox (ETB) is a software development platform which can be
used with any target platform. Tieto ETB is gathered from evaluated and tested open
source, commercial and in-house components. These components are integrated
together into full-scale system by Tieto’s experts. Tieto ETB offers product independent
software development environment for taking care of different time consuming software
development tasks. This allows the stakeholders to focus on their core business.
Figure 1. Overview of the Tieto Engineering Toolbox platform.

TAMK University of Applied Sciences 15 (77) Degree Programme in Information Technology, Master's Degree Mika Immonen
Tieto ETB runs in dedicated servers and its services can be accessed with web
browsers, remote connection tools or different IDEs (Integrated Development
Environment) like Eclipse or MS Visual Studio.
As seen in figure 1, the platform consists of software, hardware and service layers.
Services layer offers support functionalities for the end users. Consultation services
include training and configuration help; platform services take care of the system
updates as well as hardware maintenance issues; the help desk services manage every
day tasks like user management issues and member privileges. (Aaltonen & Koivu,
2009, 4)
Hardware layer forms the ground level for Tieto ETB providing data storage and server
solutions to be used by the software layer. Together these layers offer components for
project management; information sharing; document management; developer
environment and test automation management.
Three core components of Tieto ETB are project management, continuous integration
and version control system. Commercial JIRA component is used for project
management. JIRA can be used with web browser or from the IDE and it is integrated
to other Tieto ETB components. Continuous integration means constant building of the
product. Different build phases are compilation, linking, running unit tests and analysis.
In Tieto ETB each build system is separated to own virtual environment allowing each
product to have dedicated build environment. To store software related materials like
source codes; Subversions are used in version control system. (Aaltonen & Koivu,
2009, 10)
Information sharing is provided with wiki pages for storing meeting memos, project
practices and other technical materials. Version controlled document storage offers
document management system. Integrations from build automation to unit test
frameworks and source code analyse tools allow teams to test and analyse their products
automatically. Test management & automation includes tools for test case
specifications, test scripts and test data management as well as running tests
automatically with each build. (Aaltonen & Koivu, 2009, 6)

TAMK University of Applied Sciences 16 (77) Degree Programme in Information Technology, Master's Degree Mika Immonen
Using harmonised software development environment inside the company brings
benefits to many stakeholders. Business management benefits from cost savings
through centralized R&D environment, quality increases through faster fault correction
capability and unified ways of working. For IT management it is easier to manage
controlled R&D environment and it reduces hardware costs and need for backbone
systems. To project management all projects are monitored and tracked in a similar
way, tracking from requirement to tested builds are easier to oversee. The project team
can concentrate on their products and leave R&D environment issues to Tieto ETB
support teams. (Aaltonen & Koivu, 2009, 3)

TAMK University of Applied Sciences 17 (77) Degree Programme in Information Technology, Master's Degree Mika Immonen
4 Software Quality
This chapter contains the theoretical part of this master’s thesis. Software quality is
investigated by looking into its meaning in general and defining it with the software
engineering literature. Means for software quality measurement are explained by
introducing general software metrics and ways to calculate them. Chapter ends by
introducing ISO’s (the International Organization for Standardization) and IEC’s (the
International Electrotechnical Commission) ISO/IEC 9126 and ISO/IEC 25000 families
of standards, which are designed for software product quality.
4.1 Software Quality in General
Simple definition for software quality is a hard task to achieve. The quality of the
product can be seen as bad or good depending on who is judging it. In general software
quality is an abstract term which consists of people’s expectations and experiences of
the system. People have their own opinions on how a product should work, how fast it
responds to their commands and so on.
According to Kan (2002, 1) quality is a multidimensional concept that consists of entity
of interest, the viewpoint of that entity and the quality attributes of the entity. Quality is
an abstract concept that can have different layers. This means that people can have very
different definitions for the quality depending on their backgrounds.
To end user, good software quality can mean that the product provides efficient and
necessary functionalities to complete the task it was designed for. This means, for
example, in an online book store easy and safe credit card transactions so that the
wanted book is easy to order and the payment is not charged twice. To the software
developer good quality can mean good maintainability or testability, how easy it is to
maintain and fix bugs or how easy it is to write unit tests. To software architects good
quality can mean the reusability of the used software components as well as the quality
of the documentation of the system.

TAMK University of Applied Sciences 18 (77) Degree Programme in Information Technology, Master's Degree Mika Immonen
Juran and Gryna1 defined quality as “fitness for use”. Ioannis and Pangiotis (2007, 7)
raise two meanings from it. First, the quality consists of the features which are needed
to satisfy the customer requirements and thus produce product satisfaction. Secondly,
the good quality brings freedom from the deficiencies.
Crosby2 introduces definition for quality as “conformance to requirements”. Kan
(2002, 2) states that it means software requirements must be clearly written to avoid any
misunderstandings. This is monitored during production phase using regular
measurements. Any deviation from those requirements is considered to be a defect.
To summarize, one can say: The quality of the software product means its ability to
fulfil or exceed all the expectations of the user. This should be achieved by using
reasonable amount of resources and containing acceptable level of system complexity.
4.2 Measuring Software Quality
Software products are getting bigger and bigger in size and in numbers of components.
Different components exchange information using different interfaces to other
components. This means that the overall complexity of the systems grows. It is has been
estimated that 50-80% of costs of the software project goes to maintenance (Ioannis and
Pangiotis (2007, 94). This is the reason why it is important for a software company to
understand the quality of their products in order to increase efficiency of the software
development. This sub chapter introduces basic terms and the ways how the quality of
the software product can be measured. The purpose is to give an insight to the software
quality metrics as well as set the ground level for further analysis.
4.2.1 Static and Dynamic Quality Analysis
In static quality analysis the actual product is not executed, instead the quality of its
parts, the source code and documentation are analysed. Analysis tools can be used to
predict the overall complexity of the product by calculating number of lines, number of
1 Original Source: Juran, J. M., and F. M. Gryna, Jr., 1970. Quality Planning and Analysis: From Product Development Through Use, New York: McGraw-Hill, 1970. 2 Original Source: Crosby, P. B., 1979. Quality Is Free: The Art of Making Quality Certain, New York: McGraw-Hill, 1979.

TAMK University of Applied Sciences 19 (77) Degree Programme in Information Technology, Master's Degree Mika Immonen
components or interfaces between components. With object-oriented programming
languages more complicated complexity metrics can also be used. Using these static
metrics can help people understand how maintainable or reusable the software product
is.
As opposite to static quality analysis, the dynamic quality analysis is run by executing
the product in specific environment. This is normally done during testing phase for
example at the end of the building process. Running dynamic analysis gives a better
understanding for example how effective and reliable the product is. Effectiveness can
be measured by monitoring the product’s use of resources and reliability can be
measured by calculating the test coverage.
4.2.2 Lines of Code
The “lines of code value” is the simplest measurement for the complexity in the
software system. Its abbreviation is LOC or KLOC (1000 lines of code) for large
programs. It has not been fully defined how LOC should be calculated. According to
Lee, Gunn, Pham and Ricaldi (1994) LOC means all the non-executables lines of code,
including comments and headers. It is important to use one single definition throughout
the analyses of the software product.
Kan states (Kan, 2002, 312) that LOC is normally calculated from the number of
executed statements in source code. Studies show that defect density (defects per
KLOC) is related to LOC count. Figure 2 illustrates the curvilinear relationships
between defect density and product module size in LOC.
Relationship between defect density and LOC
00,20,40,60,8
11,21,41,61,8
2
0 100 200 300 400 500 600 700
Program module size (LOC)
Defe
ct d
ensi
ty
Figure 2. Relationship between found defects and program module size.

TAMK University of Applied Sciences 20 (77) Degree Programme in Information Technology, Master's Degree Mika Immonen
According to Kan (Kan, 2002, 313) there might be optimum balance for software
product size and defect rate. Such a balance would lead to lowest amount of defects per
product. Finding such a balance would require more empirical studies of the subject.
4.2.3 Halstead's Complexity Metrics
Referring to Lee et al. (1994) Halstead3 separated software science from the computer
science by dividing software programming to operators and operands. Halstead defined
four basic measurements from the source code. Primitive measures of software science:
He then used these to derive program length, program volume, program size, program
difficulty, mental effort and estimated number of errors.
Halstead’s calculations have had huge affect on software metrics. Biggest criticism
towards Halstead’s complexity metrics is that the calculations are dependent on N1 and
N2. This means that the calculation to be accurate, the program has to be nearly
finished. Also the estimated number of errors (equation 6) states simply that number of
errors in software program depends on the size of the program. (Kan, 2002, 314).
3 Original source: Halstead, M. H., Elements of Software Science, New York: Elsevier North Holland, 1977
n1 = Number of distinct operators in a program n2 = Number of distinct operands in a program N1 = Number of operator occurrences N2 = Number of operand occurrences
Program Length (N) Program Volume (V) Program Size (S) Program Difficulty (D) Mental effort (E) Estimated number of errors (B)
= N1 + N2 (1) = (N1 + N2) ln (n1 + n2) (2) = (n1) ln (n1) + (n2) ln (n2) (3) = [(n1)/2] (N2/n2) (4) = [(n1) (N2) (N1+N2) ln(n1+n2)] / 2(n2) (5) = [E* x (2/3)] / 3000 (6)

TAMK University of Applied Sciences 21 (77) Degree Programme in Information Technology, Master's Degree Mika Immonen
4.2.4 Cyclomatic Complexity
From the study of Kan (2002, 315) we learn that McCabe4 introduced in 1976 the
measurement of the cyclomatic complexity. It was created to illustrate testability and
maintainability of the program.
McCabe cyclomatic complexity
McCabe’s cyclomatic complexity number can be used to calculate the number of
different individual paths through the program’s logic. (Lee et al., 1994) This will give
us a rough estimate of the needed test cases to cover 100% of the source code during
unit testing. McCabe equation can be used to validate degree of test coverage results by
comparing it to the number of actual execution rounds.
4 Original source: McCabe, T. J.,"A Complexity Measure," IEEE Transactions on Software Engineering, Vol. 2, No. 4, December 1976, pp. 308–320.
pneGVM 2)( (7)
where V(G) is Cyclomatic number of G, e is the number of edges,
n is the number of nodes and p is the number of unconnected parts of the graph.

TAMK University of Applied Sciences 22 (77) Degree Programme in Information Technology, Master's Degree Mika Immonen
4.2.5 Object-Oriented Metrics
In object-oriented (OO) software the classes and functions are the basic building blocks
of the software. It is natural that the OO metrics are closely related to classes, methods,
and the size (lines of code). When measuring complexity of the OO components, the
metrics should take OO characteristics such as inheritance, instance variables, and
coupling into account. (Kan, 2002, 334).
4.2.5.1 Lorenz Metrics and Rules of Thumb
Kan writes (Kan, 2002, 334) that in 1993 Lorenz introduced eleven OO design metrics.
Lorenz gathered these metrics based on his experience in OO software development. He
developed rules of thumb that give preferred values to each metric.
Table 1: Object Oriented Metrics and Rules of Thumb by Lorenz (Kan, 2002, 335)
Metric Rules of Thumb and Comments
1. Average Method Size (LOC) Should be less than 8 LOC (Smalltalk), 24 LOC (C++)
2. Average Number of Methods per Class
Should be less than 20. Bigger averages indicate too much responsibility in too few classes.
3. Average Number of Instance Variables per Class
Should be less than 6. More instance variables indicate that one class is doing more than it should.
4. Class Hierarchy Nesting Level (Depth of Inheritance Tree, DIT)
Should be less than 6, starting from the framework classes or the root class.
5. Number of Subsystem/Subsystem Relationships Should be less than the number in metric 6.
6. Number of Class/Class Relationships in Each Subsystem
Should be relatively high. This item relates to high cohesion of classes in the same subsystem. If one or more classes in a subsystem don't interact with many of the other classes, they might be better placed in another subsystem.
7. Instance Variable Usage
If groups of methods in a class use different sets of instance variables, look closely to see if the class should be split into multiple classes along those "service" lines.
8. Average Number of Comment Lines (per Method) Should be greater than 1.
9. Number of Problem Reports per Class Should be low (no specifics provided).
10. Number of Times Class Is Reused If a class is not being reused in different applications (especially an abstract class), it might need to be redesigned.
11. Number of Classes and Methods Thrown Away
Should occur at a steady rate throughout most of the development process. If this is not occurring, one is probably doing an incremental development instead of performing true iterative OO design and development.

TAMK University of Applied Sciences 23 (77) Degree Programme in Information Technology, Master's Degree Mika Immonen
As one can see from table 1, not all of the metrics are meant to be measured
quantitatively. Instead, they are guidelines for OO design and development. Metric 8
represents good programming practices, metric 9 is a quality indicator, and metric 11
validates OO development processes. (Kan, 2002, 334).
Metric 1, the average size of a method, states that the larger number may indicate poor
OO design and function-oriented coding. Larger number in metric 2, the average
number of methods per class, promotes code reusability but decreases the extensibility
and complicates testability. If one has too many methods per class, it could indicate that
the class has too big responsibility and some refactoring is required. Metric 4, Depth of
Inheritance Tree (DIT), can tell us that too large DIT value will overcomplicate testing
and makes understandability harder. (Kan, 2002, 334).
4.2.5.2 Chidamber and Kemerer Metrics Suite
Chidamber and Kemerer introduced in 1994 six OO metrics. These metrics are listed in
table 2 and they became later on commonly referred as CK metrics suite. (Kan, 2002,
337).
According to Kan (2002, 337), the Weighted Methods per Class (WMC) can tell us how
complex the methods of the class are. If each method of the class is equal in complexity,
the WMC is simply the number of the methods in that class. WMC is the sum of the
Table 2: Chidamber and Kemerer Metrics Suite. (Kan, 2002, 337).
Metric Description
WMC ( Weighted Methods per Class ) WMC is the avarage number of methods per class.
DIT ( Depth of Inheritance Tree ) The length of the maximum path of a class hierarchy from the node to the root of the inheritance tree.
NOC (Number of Children ) The number of immediate successors (subclasses) of a class in the hierarchy.
CBO ( Coupling Between Object Classes )
CBO is the number of classes to which a given class is coupled.
RFC (Response for a Class ) RFC is the number of local methods plus the number of methods called by local methods.
LCOM ( Lack of Cohesion on Methods ) The LCOM metric measures the dissimilarity of methods in a class by the usage of instance variables.

TAMK University of Applied Sciences 24 (77) Degree Programme in Information Technology, Master's Degree Mika Immonen
complexities of the methods and the complexity is calculated with cyclomatic
complexity. Sometimes this is not trivial task to implement because the inheritance
makes some of the methods inaccessible. Laing and Coleman (2001, 3) write that there
are two different ways to measure WMC metric. The first one is to calculate the
complexity by summing the complexity of each method contained in the class; the
second approach is to simply calculate the number of methods per class as a measure
for WMC. WMC can be used to estimate how much time and effort is needed to
develop and maintain the class.
The Depth of Inheritance Tree (DIT) is the longest path of inheritance to the current
module. The bigger the DIT value is, the harder it is to estimate behaviour of the class
because of the interaction between the inherited features and the new features. On the
other hand, the deeper inheritance raises the potential for reuse of class methods. (Laing
and Coleman, 2002, 3).
The Number of Children (NCO) is the number of subclasses in the class hierarchy. The
average NCO value predicts potential for reusability but the high NCO value may tell
about the failures in abstraction design. This can introduce more complexity in the
parent class because such a class must provide more generic services to their children.
(Laing and Coleman, 2002, 3).
Kan (2002, 337) says that Coupling Between Object Classes (CBO) can be used to
measure complexity of the class. The object becomes coupled when it calls other
object’s member functions or instance variables. Laing and Coleman (2001, 3) point out
that too heavy coupling is a signal of poor encapsulation and it may inhibit reuse.
From Kan (2002, 337) we learn that Response for a Class (RFC) tells the number of
methods that can be executed in response to a message received by an object of that
class. The greater the RFC number, the greater the complexity of the class. Laing and
Coleman (2001, 3) reason that large RFC number makes testing and debugging of the
class more complicated since the tester must understand the class hierarchy more
deeply.

TAMK University of Applied Sciences 25 (77) Degree Programme in Information Technology, Master's Degree Mika Immonen
Lack of Cohesion on Methods (LCOM) indicates how closely the local methods are
related to the local instance variables in the class. High cohesion shows good class
subdivision and low cohesion increases complexity and may introduce errors during
development process. ( Kan, 2002, 337). Laing and Coleman (2001, 3) suggest that
cohesion of methods in a class is preferable and low LCOM often implies that the class
should split in to subclasses.
Kan (2002, 340) also introduces some empirical studies based on CK suite. In those
studies it was discovered that low values of DIT and NOC usually shows that
developers are not taking advantage of the inheritance reuse of object-oriented design.
Studies also showed that WMC, RFC and CBO values were highly correlated. This
means that all these metrics measure similar issues.
Table 3 contains average values for CK metrics from NASA’s report from three
different types of products. NASA used reduced CK metric suite to validate three
different types of products. The product with “low” quality was a commercial product
and other two were NASA’s applications. The report states that the traditional CK
metric suite and reduced CK metric suite both resulted in the same quality for all three
products. It is mentioned that CK suite is more suitable for detecting low quality code.
(Laing and Coleman, 2001, 8; 16).
NASA’s Software Assurance Technology Center (SATC) proposed 9 metrics for
evaluating product quality. First 3 metrics were traditional software metrics: McCabe’s
Table 3: Avarage values for CK Metric Suite by NASA reports. (Laing and Coleman,
2001, 9; 12-13).
Chidamber & Kemerer metrics. Programming Language Java Java C++ Classes 46 1000 1617 LOC 50000 300000 500000 Quality Low High Medium CBO 2,48 1,25 2,09 LCOM 447,65 78,34 113,94 RFC 80,39 43,84 28,60 NOC 0,07 0,35 0,39 DIT 0,37 0,97 1,02 WMC 45,70 11,20 23,97

TAMK University of Applied Sciences 26 (77) Degree Programme in Information Technology, Master's Degree Mika Immonen
Complexity, Size (Lines of Code) and Comment Percentage (CP); and other 6 were
based on CK metric suite. These metrics cover the object-oriented design concepts like:
methods, classes (cohesion), coupling and inheritance. (Rosenberg and Hyatt, 1996, 6).
Different sets of quality metrics are an interesting way to evaluate quality of the
software product. Interpretation of these different metrics is not trivial task to
accomplish. In table 4 is listed lists STAC’s recommended (Rosenberg, 1998, 11)
objectives for several object-oriented metrics. These metrics can help software
developers and project managers comprehend product quality better.
4.2.5.3 Quality Model for Object-Oriented Design
Referring to El Wakil, El Bastawissi, Boshra, and Fahmy (2004, 6), Bansiya and
Davis5, introduced in 2002 the Quality Model for Object-Oriented Design (QMOOD).
The QMOOD is a comprehensive quality model that presents clearly defined and
empirically validated model to estimate object-oriented design attributes.
5 Original Source: Jagdish Bansiya, and Carl G. Davis,2002,”A Hierarchical Model for Object-Oriented Design Quality Assessment” ,IEEE TRANSACTIONS ON SOFTWARE ENGINEERING, VOL. 28, NO. 1, JANUARY 2002.
Table 5: Quality Model for Object Oriented Design by Bansiya and Davis. (Bansiya and
Davis, 2002, 7)
Quality Attribute Description
Reusability Describes presence of such features in object-oriented design that lead to reusage of components without significant amount of work.
Flexibility Describes features that allow including new functionality to the existing design. Flexibility allows design to adapt to the changes.
Understandability Describes design features that allow the design to be learnable and understandable. This is related to complexity of the design structure.
Functionality Describes the responsibilities of classes in design. These responsibilities are available through class’ public API.
Extendibility Describes presence of such features in existing design that allow it to be extendable.
Effectiveness Describes ability of the design to achieve the wanted functionality and behaviour using object-oriented design concepts.
Table 4: Suggested target values for object-oriented design metrics. (Rosenberg,1998,11).
Metric Target Cyclomatic Complexity Low Lines of Code/Executable Statements Low Comment Percentage ~20-30% Weighted Methods per Class Low Response for a Class Low Lack of Cohesion of Methods Low Cohesion of Methods High Coupling Between Objects Low Depth of Inheritance Low (trade-off) Number of Children Low (trade-off)
TAMK University of Applied Sciences 27 (77) Degree Programme in Information Technology, Master's Degree Mika Immonen
Table 5 introduce 6 quality attributes for the QMOOD quality model: reusability,
flexibility, understandability, functionality, extendibility and effectiveness. These
attributes are loose related to ISO/IEC 9126 standard.
Table 6 shows how QMOOD metrics are related to general object-oriented concepts and
techniques. According to El Wakil et al. (2004, 9), the QMOOD separates itself from
other object-oriented design (OOD) models because it provides mathematical formulas
that link design quality attributes with design metrics. This makes it possible to
calculate Total Quality Index (TQI) for the product.
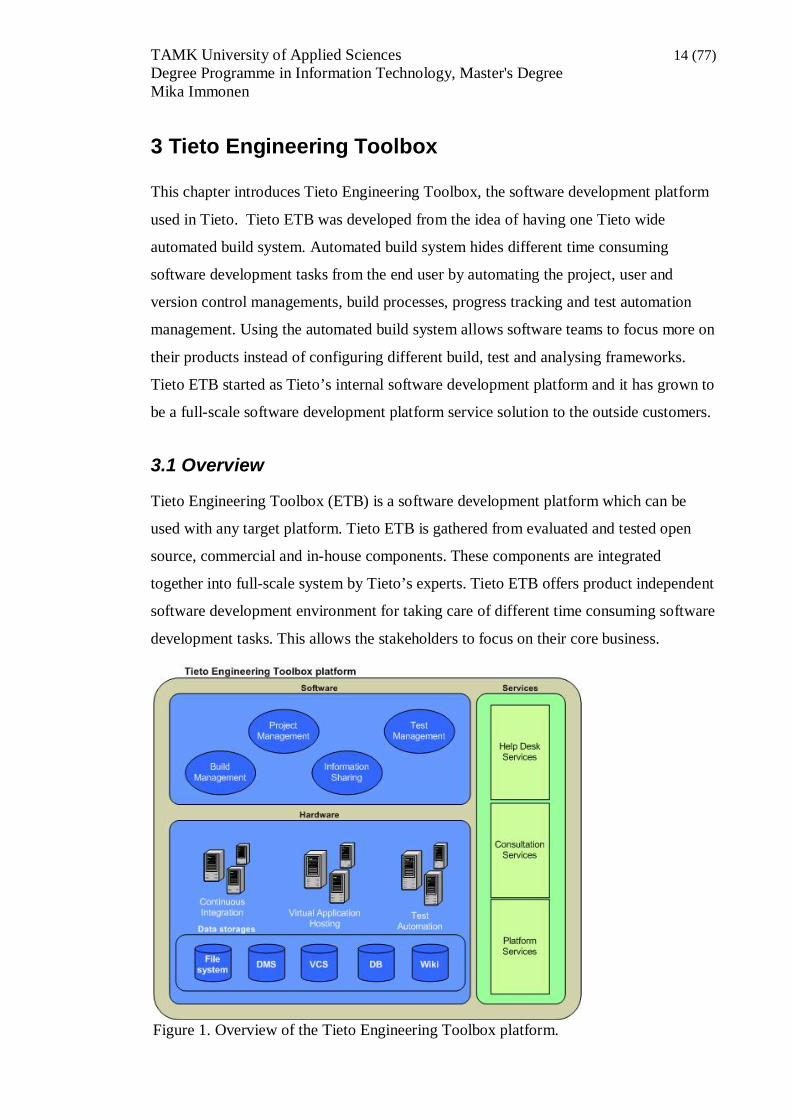
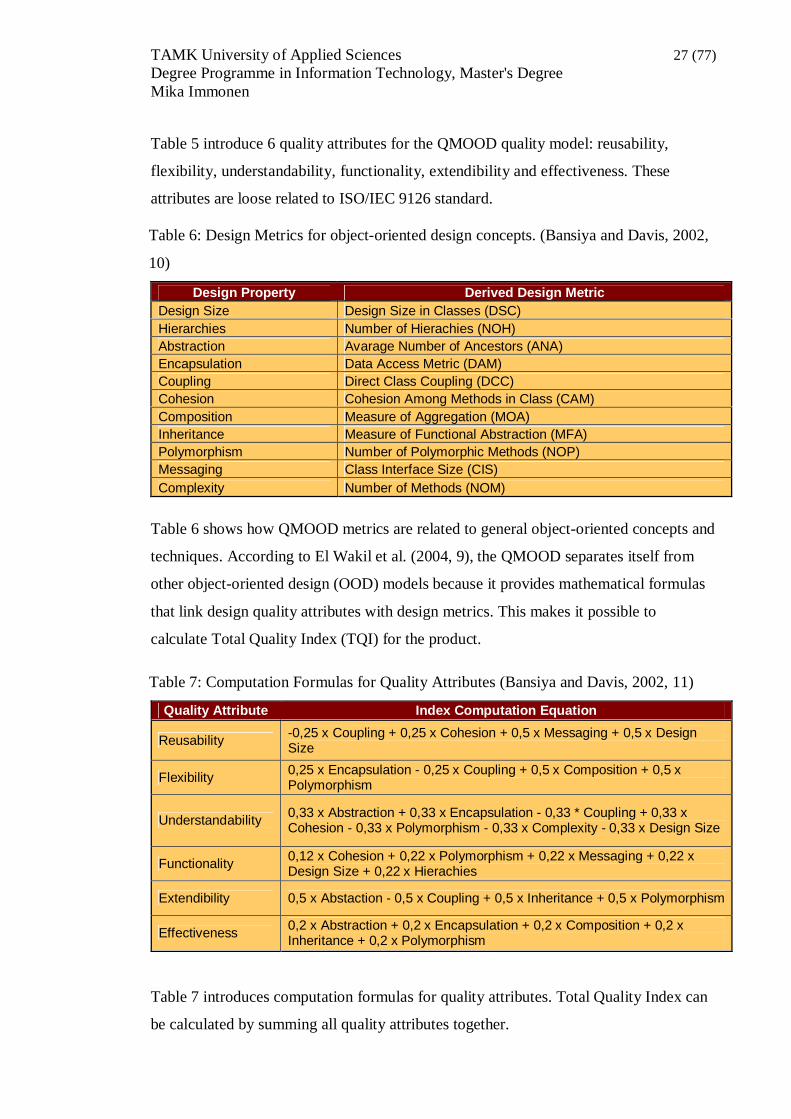
Table 7 introduces computation formulas for quality attributes. Total Quality Index can
be calculated by summing all quality attributes together.
Table 6: Design Metrics for object-oriented design concepts. (Bansiya and Davis, 2002,
10)
Design Property Derived Design Metric Design Size Design Size in Classes (DSC) Hierarchies Number of Hierachies (NOH) Abstraction Avarage Number of Ancestors (ANA) Encapsulation Data Access Metric (DAM) Coupling Direct Class Coupling (DCC) Cohesion Cohesion Among Methods in Class (CAM) Composition Measure of Aggregation (MOA) Inheritance Measure of Functional Abstraction (MFA) Polymorphism Number of Polymorphic Methods (NOP) Messaging Class Interface Size (CIS) Complexity Number of Methods (NOM)
Table 7: Computation Formulas for Quality Attributes (Bansiya and Davis, 2002, 11)
Quality Attribute Index Computation Equation
Reusability -0,25 x Coupling + 0,25 x Cohesion + 0,5 x Messaging + 0,5 x Design Size
Flexibility 0,25 x Encapsulation - 0,25 x Coupling + 0,5 x Composition + 0,5 x Polymorphism
Understandability 0,33 x Abstraction + 0,33 x Encapsulation - 0,33 * Coupling + 0,33 x Cohesion - 0,33 x Polymorphism - 0,33 x Complexity - 0,33 x Design Size
Functionality 0,12 x Cohesion + 0,22 x Polymorphism + 0,22 x Messaging + 0,22 x Design Size + 0,22 x Hierachies
Extendibility 0,5 x Abstaction - 0,5 x Coupling + 0,5 x Inheritance + 0,5 x Polymorphism
Effectiveness 0,2 x Abstraction + 0,2 x Encapsulation + 0,2 x Composition + 0,2 x Inheritance + 0,2 x Polymorphism

TAMK University of Applied Sciences 28 (77) Degree Programme in Information Technology, Master's Degree Mika Immonen
4.3 ISO/IEC 9126 Series of standards – Software Product Quality
ISO/IEC 9126 series of standard family is the series of standards that introduces
concepts of software quality model. ISO/IEC FDIS 9126:2000 version of the standard
replaces the older ISO/IEC 9126:1991 standard. Software quality evaluation was
removed from ISO/IEC 9126:1991 to its own standard, the ISO/IEC 14598 standard.
Documents included in ISO/IEC 9126 are software quality model (ISO/IEC 9126-1);
external metrics (ISO/IEC 9126-2); internal metrics (ISO/IEC 9126-3) and quality in
use (ISO/IEC 9126-4). (ISO/IEC 9126:2000, v)
In ISO/IEC 9126:2000 the software quality model is divided into two parts. The first
part contains external and internal metrics of the software. External and internal metrics
are categorized using six quality characteristics and those are then further divided into
sub characteristics. The second part contains software quality in use, which is divided
into four characteristics. (ISO/IEC 9126:2000, 1)
Internal quality metrics (figure 3) are applied when the product is in development phase
or is not in execution. With internal metrics the product is examined by looking into its
internal parts. These metrics contain static metrics like code complexity and compliance
to the selected coding standards. The idea of internal metric’s analysis is to give a better
picture of the internal quality of the software product and thus help predict the overall
quality of the final product. Reviewing the results with software team allows the team to
take more responsibility as well as to take corrective actions by increasing the internal
quality. (ISO/IEC 9126-3, 3)
Figure 3. Relationship between software product quality metrics. (ISO/IEC 9126-
2:2001, 3)

TAMK University of Applied Sciences 29 (77) Degree Programme in Information Technology, Master's Degree Mika Immonen
External quality metrics are divided into characteristics the same way as the internal
metrics are, but now the software product is evaluated from the outside. The software
product is analysed externally when it is running in its working environment. This
happens typically by analysing the program during testing phases or during actual
operational actions. Quality in use metrics measures the end user’s perspective, how
satisfied the user is with the product. These metrics tell us how well the product meets
the needs of the user in the name of effectiveness, productivity, safety and satisfaction.
(ISO/IEC 9126-2, 3 and ISO/IEC 9126-4, 4)
As it is stated in figure 3, the software product quality can be seen so that the internal
quality affects on external quality and the external quality affects on the quality in use.
This lifecycle of quality can also be read so that the final product’s quality depends on
the software’s external and internal quality. The earlier one takes quality into account,
the better it reflects to the quality of the final product as well.
The characteristics which are defined in the ISO/IEC 9126 standard are designed to be
used with any kind of computer software program and data in firmware. Standard gives
different software professionals a common terminology to be used in discussions about
software product quality. Standard is meant to be used by acquirers, quality assurance
and software development teams. Software quality model can be used for example to
identify software requirements, to identify software design objectives, to identify testing
objectives, to identify software quality assurance criteria and to identify acceptance
criteria for completed software product. (ISO/IEC 9126:2000, 1)
4.3.1 Internal and External Quality Metrics
Table 8 contains the characteristics and corresponding sub characteristics for internal
and external software product quality metrics. These are quality perspectives which may
be used in company’s quality assurance. This chapter provides brief description of each
characteristic and its sub characteristics. To get a deeper understanding of different
perspectives, one should study the ISO/IEC 9126-2 (External metrics) and the ISO/IEC
9126-3 (Internal metrics) standards. These documents introduce more detailed ideas for
example how one should measure each of these quality attributes.

TAMK University of Applied Sciences 30 (77) Degree Programme in Information Technology, Master's Degree Mika Immonen
4.3.1.1 Functionality
Functionality characteristic means the product’s ability to provide those functions and
operations which are required to fulfil the intended task in specified environment. Table
9 introduces the sub characteristics for functionality.
4.3.1.2 Reliability
Reliability characteristic means the product’s ability to uphold sufficient amount of
performance when product is used in specified environment. Table 10 introduces the
sub characteristics for reliability.
Table 8: ISO/IEC 9126-2 and ISO/IEC 9126-3 software product quality metrics for
internal and external metrics
Functionality Reliability Usability Effiency Maintainability Portability
Suitability Maturity Understandability Time Behaviour Analysability Adaptability
Accuracy Fault Tolerance Learnability Resource Utilisation Changeability Installability
Interoperability Recoverability Operability Efficiency Compliance Stability Co-existence
Security Reliability Compliance Attractiveness Testability Replaceability
Functionality Compliance Usability
Compliance Maintainability Compliance
Portability Compliance
Table 9: Sub characteristics of the functionality perspective
Name Description
Suitability Product's ability to offer required functionality to the task it was designed for.
Accuracy Product's ability to offer correct or specified accuracy in the task's results.
Interoperability Product's ability to be interoperable with one or more external systems.
Security Product's ability to secure its internal information so that no unauthorized usage is possible.
Functionality Compliance
Product's maturity to obey standards and regulations regarding functionality issues in specified environment.
Table 10: Sub characteristics of the reliability perspective
Name Description
Maturity Product's ability to avoid errors when an exception is thrown or some data error happens during execution.
Fault Tolerance Product's ability to maintain specified performance level when an exception is thrown or some data error happens during execution.
Recoverability Product's ability to restore certain level of performance when an exception is thrown or some date error happens during execution.
Reliability Compliance
Product's maturity to obey standards and regulations regarding reliability issues in specified environment.
TAMK University of Applied Sciences 31 (77) Degree Programme in Information Technology, Master's Degree Mika Immonen
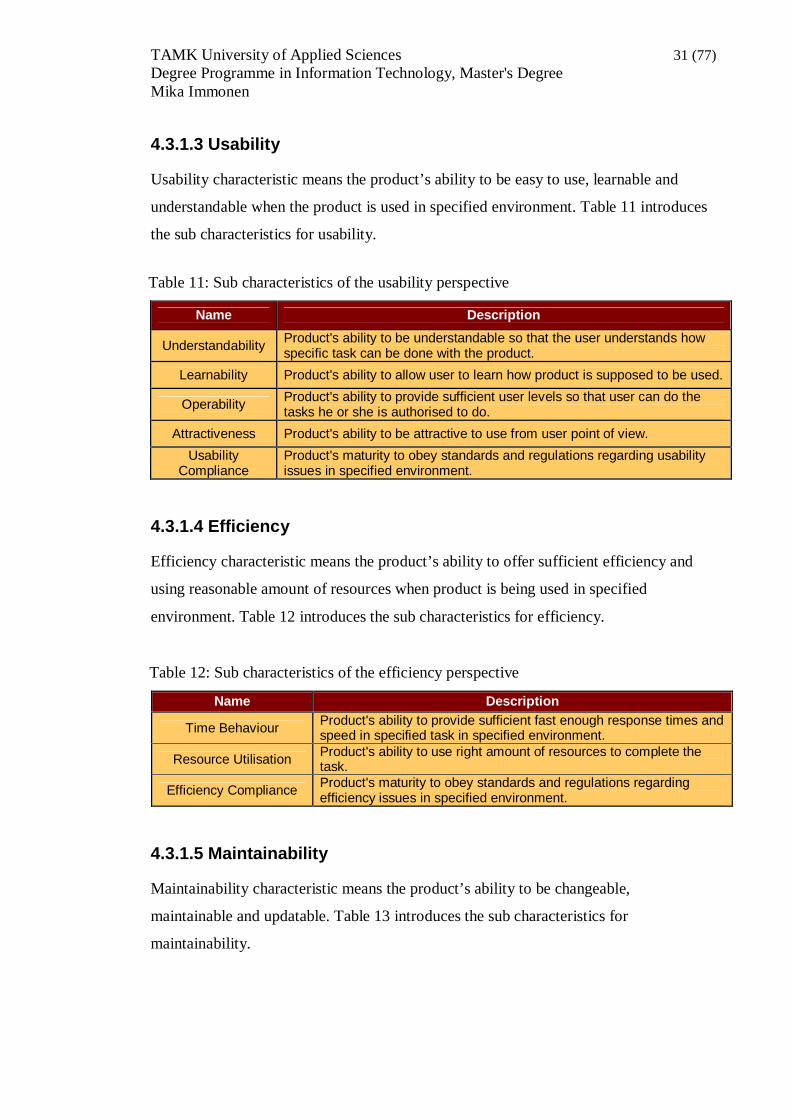
4.3.1.3 Usability
Usability characteristic means the product’s ability to be easy to use, learnable and
understandable when the product is used in specified environment. Table 11 introduces
the sub characteristics for usability.
4.3.1.4 Efficiency
Efficiency characteristic means the product’s ability to offer sufficient efficiency and
using reasonable amount of resources when product is being used in specified
environment. Table 12 introduces the sub characteristics for efficiency.
4.3.1.5 Maintainability
Maintainability characteristic means the product’s ability to be changeable,
maintainable and updatable. Table 13 introduces the sub characteristics for
maintainability.
Table 11: Sub characteristics of the usability perspective
Name Description
Understandability Product's ability to be understandable so that the user understands how specific task can be done with the product.
Learnability Product's ability to allow user to learn how product is supposed to be used.
Operability Product's ability to provide sufficient user levels so that user can do the tasks he or she is authorised to do.
Attractiveness Product's ability to be attractive to use from user point of view. Usability
Compliance Product's maturity to obey standards and regulations regarding usability issues in specified environment.
Table 12: Sub characteristics of the efficiency perspective
Name Description
Time Behaviour Product's ability to provide sufficient fast enough response times and speed in specified task in specified environment.
Resource Utilisation Product's ability to use right amount of resources to complete the task.
Efficiency Compliance Product's maturity to obey standards and regulations regarding efficiency issues in specified environment.

TAMK University of Applied Sciences 32 (77) Degree Programme in Information Technology, Master's Degree Mika Immonen
4.3.1.6 Portability
Portability characteristic means the product’s ability to be portable system from one
environment to another. Table 14 introduces the sub characteristics for portability.
4.3.2 Quality in Use Metrics
Quality in use metrics are divided into 4 different characteristics which all measure how
well the final product fits to its purpose to allow user to achieve his or hers goals in
specified context of use. Table 15 lists characteristics and their meanings. (ISO/IEC
9126-4:2001, 5)
Table 13: Sub characteristics of the maintainability perspective
Name Description
Analysability Product's ability to be analysable when one is searching reason for erroneous behaviour.
Changeability Product's ability to be able to change the structure of the program.
Stability Product's ability to be stable even if its structure is changed.
Testability Product's ability to be testable and thus support the product's validation through testing.
Maintainability Compliance
Product's maturity to obey standards and regulations regarding maintainability issues in specified environment.
Table 14: Sub characteristics of the portability perspective
Name Description
Adaptability Product's ability to adapt to different environments without using other functionalities that are required for the specific task.
Installability Product's ability to be installable to the specific environment.
Co-existence Product's ability to work independently and co-exist with other system in environments where different resources are shared.
Replaceability Product's ability to work independently and co-exist with other system in environments where different resources are shared.
Portability Compliance
Product's maturity to obey standards and regulations regarding portability issues in specified environment.
Table 15: ISO/IEC 9126-4 software product quality metrics for ‘Quality in use’
Name Description
Effectiveness Product's ability to allow the user to achieve his or hers goals with sufficient accuracy and completeness.
Productivity Product's ability to allow the user to achieve his or hers goals by using sufficient amount of resources relatively to the sufficient performance.
Safety Product's ability to reach acceptable level of risks. Risks to people, data, environment or property.
Satisfaction Product's ability to satisfy the user so that she can complete task what she intended to do with the product.

TAMK University of Applied Sciences 33 (77) Degree Programme in Information Technology, Master's Degree Mika Immonen
4.4 ISO/IEC 25000 Series of standards – Software Quality Requirements and Evaluation
ISO/IEC 25000 series of standards replace the ISO/IEC 9126 and ISO/IEC 14598
standard families. It binds them into one standard family providing best practices and
lessons learned from both ISO/IEC 9126 and ISO/IEC 14598 standards. ISO/IEC 25000
is often regarded as SQuaRE, Software Quality Requirements and Evaluation.
General idea in SQuaRE is to take into use a logically ordered and unified standard that
is divided into two main processes: software quality requirements specification and
software quality evaluation. Both of these processes are supported by software quality
measurement process. SQuaRE is created to aid those who develop software, those who
acquire software products and those who evaluate the software quality. This is
established by defining criteria for the requirements, measurements and the evaluation
of the software quality. SQuaRE offers two-part quality model which introduces
recommended software quality metrics to be used by the developers, acquirers and
evaluators. As distinction to ISO 9000 standards, SQuaRE is dedicated to the software
product quality instead of the Quality Management processes. (ISO/IEC 25000:2005,
vii)
The differences between ISO/IEC 25000 and ISO/IEC 9126 and ISO/IEC 14598
standards are the introduction of one reference model, the introduction of Measurement
Primitives, the introduction of Quality Requirements Division, updated version of
evaluation process and updated guidance to the metrics. (ISO/IEC 25000:2005, vii)
Figure 4. Divisions of SQuaRE series of standards. (ISO/IEC 25000:2005, 11)

TAMK University of Applied Sciences 34 (77) Degree Programme in Information Technology, Master's Degree Mika Immonen
Figure 4 illustrates how ISO/IEC 25000, SQuaRE, is a family of 5 different set of
standards. These divisions are: Quality Management Division, Quality Model Division,
Quality Measurement Division, Quality Requirements Division and Quality Evaluation
Division.
Quality Management Division standard sets the ground level for the SQuaRE by
defining all common models, terms and definitions used by other standards in this
family. Quality Model Division introduces the quality model with internal, external and
quality in use metrics. It is updated version from the ISO/IEC 9126 quality model.
Quality Measurement Division includes software product quality measurement
reference model as well as mathematical definitions of quality measures. Quality
Requirements Division offers requirements and guidance to specify software quality
requirements. Quality Evaluation Division sums up the quality evaluation process of the
software product with requirements, recommendations and guidelines. (ISO/IEC
25000:2005, 12)
4.4.1 Software Product Quality Lifecycle Model
SQuaRE family of standards sees three major phases in the software product: product
under development, product in operation and product in use. These together form the
software product quality lifecycle model.
Figure 5. Software Product Quality Lifecycle Model. (ISO/IEC 25010:2009, 34)

TAMK University of Applied Sciences 35 (77) Degree Programme in Information Technology, Master's Degree Mika Immonen
In figure 5, the product under development phase involves internal quality; the product
in operation phase involves external quality; and the product in use phase involves
quality in use. This model also states that the implementation of software quality
requires a similar process as does the development of software product: requirement,
implementation and verification and validation.
Internal software quality requirements set the level for the internal quality of the
product. They inherit some of their requirements from the external quality layer.
Internal quality requirements can be used in verification of different phases of the
software development. This includes verification of the deliverables as well as
documentation. External software quality requirements define required level of quality
from the external view. This includes requirements from the quality in use layer.
External quality requirements are used as targets for technical verification and
validation of the software product. Quality in use requirements contains requirements
from the end user point of view. These requirements depend highly of the context of use
and they will be used as targets for validation done by the end user. (ISO/IEC
25000:2005, 15-16)
4.4.2 Quality Models
In SQuaRE the quality models are used as a framework to address all stakeholders’
requirements for the quality of the system. Different stakeholders can be software
developers, software architects, system integrators, acquirers, maintainers, and end
users. To take each stakeholder’s point of view into account SQuaRE divides quality in
three quality models. These quality models are the software product quality model, the
system quality in use and the data quality model. (ISO/IEC 25010:2009, 11)
In context of this master’s thesis the first two quality models are considered: the
software product quality model and the system quality in use. As stated earlier, the
ISO/IEC 25000 standard contains updated version from the ISO/IEC 9126 standard’s
software product quality model. The software product quality model contains 8 internal
and external quality characteristics; and the system quality in use model contains 3
characteristics. These characteristics are further divided into sub characteristics which
can be measured quantitatively.
TAMK University of Applied Sciences 36 (77) Degree Programme in Information Technology, Master's Degree Mika Immonen
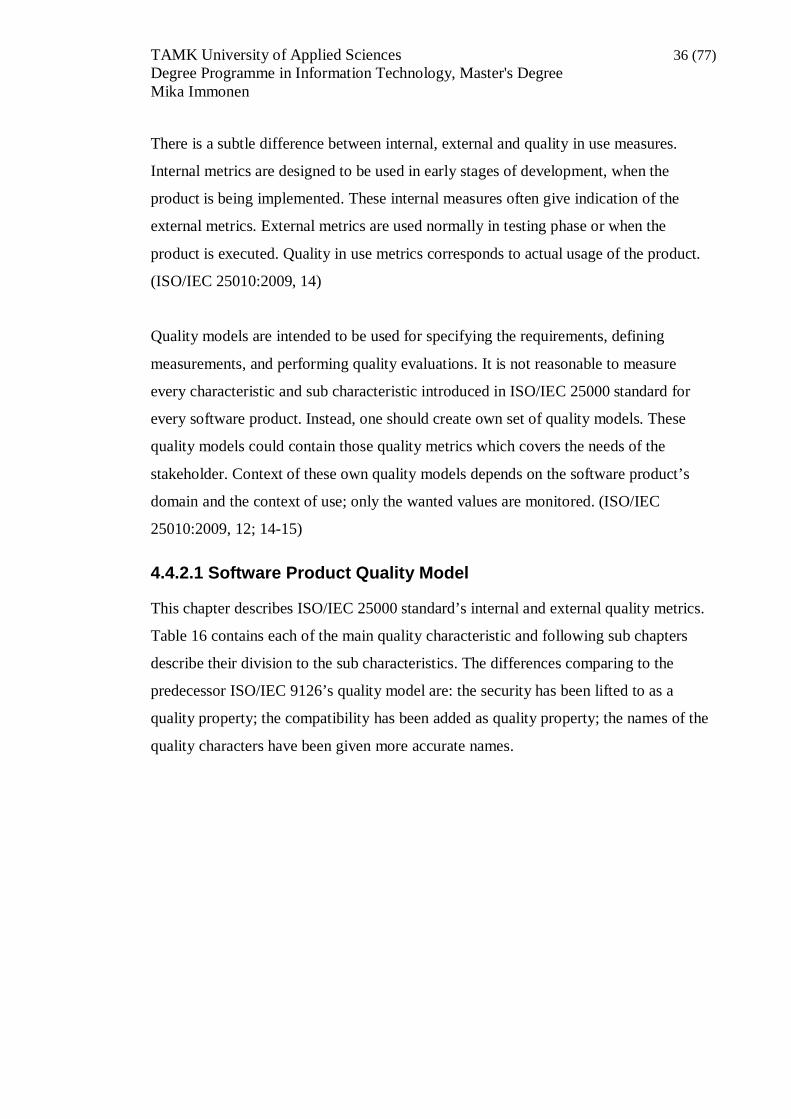
There is a subtle difference between internal, external and quality in use measures.
Internal metrics are designed to be used in early stages of development, when the
product is being implemented. These internal measures often give indication of the
external metrics. External metrics are used normally in testing phase or when the
product is executed. Quality in use metrics corresponds to actual usage of the product.
(ISO/IEC 25010:2009, 14)
Quality models are intended to be used for specifying the requirements, defining
measurements, and performing quality evaluations. It is not reasonable to measure
every characteristic and sub characteristic introduced in ISO/IEC 25000 standard for
every software product. Instead, one should create own set of quality models. These
quality models could contain those quality metrics which covers the needs of the
stakeholder. Context of these own quality models depends on the software product’s
domain and the context of use; only the wanted values are monitored. (ISO/IEC
25010:2009, 12; 14-15)
4.4.2.1 Software Product Quality Model
This chapter describes ISO/IEC 25000 standard’s internal and external quality metrics.
Table 16 contains each of the main quality characteristic and following sub chapters
describe their division to the sub characteristics. The differences comparing to the
predecessor ISO/IEC 9126’s quality model are: the security has been lifted to as a
quality property; the compatibility has been added as quality property; the names of the
quality characters have been given more accurate names.

TAMK University of Applied Sciences 37 (77) Degree Programme in Information Technology, Master's Degree Mika Immonen
4.4.2.1.1 Functional Suitability
Functional suitability quality property means the product’s ability to provide those
functions and operations which are required to fulfil the intended task in specified
environment. Table 17 lists the sub characteristics for functional suitability. (ISO/IEC
25010:2009, 16)
Table 16: ISO/IEC 25000 software product quality properties for internal and external
metrics
Functional Suitability Reliability
Functional Appropriateness Maturity
Accuracy Availability (New)
Functional Suitability Compliance Fault Tolerance
Recoverability
Reliability Compliance
Security (New) Compatibility (New) Confidentially (New) Co-Existence
Integrity (New) Interoperability
Non-Repudiation (New) Compatibility Compliance
Accountability (New)
Security Compliance (New)
Operability Performance Efficiency
Appropriateness Recognisability Time Behaviour
Learnability Resource Utilisation
Ease of use Performance Efficiency Compliance
Attractiveness
Technical Accessibility (New)
Operability Compliance
Maintainability Portability Modularity (New) Adaptability
Reusability (New) Installability
Analysability Replaceability
Changeability Portability Compliance
Modification Stability
Testability
Maintainability Compliance
Table 17: Sub characteristics of the functional suitability
Name Description Functional
Appropriateness The rate to which set of functions are suitable for specified tasks.
Accuracy The rate of correctness or freedom from error. Functional Suitability
Compliance
The rate of how well the product adheres standards and regulations regarding functional suitability in specified environment.

TAMK University of Applied Sciences 38 (77) Degree Programme in Information Technology, Master's Degree Mika Immonen
4.4.2.1.2 Reliability
Reliability quality property means the rate to which the product or component executes
its functions under stated conditions in specified period of time. Table 18 lists the sub
characteristics for reliability. (ISO/IEC 25010:2009, 16)
4.4.2.1.3 Security
Security quality property means the product’s ability to protect data or information
against unauthorized modification or access. It also means that the authorized users are
not denied access to the information and data. Table 19 lists the sub characteristics for
security. (ISO/IEC 25010:2009, 19)
4.4.2.1.4 Compatibility
Compatibility quality property means the product’s ability to execute correct tasks
while sharing resources and information of the hardware or software environment with
the other programs. Table 20 lists the sub characteristics for compatibility. (ISO/IEC
25010:2009, 20)
Table 18: Sub characteristics of the reliability
Name Description
Maturity The probability of executing faults in the software.
Availability The rate to which component or system is operational and accessible for use when required.
Fault Tolerance
The rate to which component or system operates normally despites the presence of hardware or software faults.
Recoverability The rate to which the product can recover the data or system state in case of an interruption or a failure.
Reliability Compliance
The rate of how well product adheres standards and regulations regarding reliability.
Table 19: Sub characteristics of the security
Name Description Confidentially The rate of protection from unauthorized use of data or information.
Integrity The rate which component or system prevents the unauthorized modification of or access to system data.
Non-Repudiation
The rate to how system events can be proven that they actually happened so that they cannot be later repudiated.
Accountability The rate to how system events can be traced back to the original event.
Security Compliance
The rate of how well product adheres standards and regulations regarding security.

TAMK University of Applied Sciences 39 (77) Degree Programme in Information Technology, Master's Degree Mika Immonen
4.4.2.1.5 Operability
Operability quality property means the product’s ability to be understandable, learnable,
usable and attractable to the end user, when the product is used in specified conditions.
Table 21 lists the sub characteristics for compatibility. (ISO/IEC 25010:2009, 18)
4.4.2.1.6 Performance Efficiency
Performance efficiency quality property means the product’s ability to perform its
functions relative to the amount of resources in used environment and in specified
conditions. Table 22 lists the sub characteristics for performance efficiency. (ISO/IEC
25010:2009, 17)
Table 20: Sub characteristics of the compatibility
Name Description
Co-Existence The rate to which the product can work independently and co-exist with other products and share resources from their environment.
Interoperability The rate to which two or more components or system exchange and use information together.
Compatibility Compliance
The rate of how well product adheres standards and regulations regarding compatibility.
Table 21:Sub characteristics of the operability
Name Description
Appropriateness Recognisability
The rate to which the product provides information to the user so that she can decide is the product right for the task.
Learnability The rate to which the product allows user to learn its functionality.
Ease of use The rate to which user find the product easy to operate and control.
Attractiveness The rate to which the product is attractive to the user.
Technical Accessibility The rate to which users with specified disabilities can use the product.
Operability Compliance
The rate of how well product adheres standards and regulations regarding operability.
Table 22: Sub characteristics of the performance efficiency
Name Description Time
Behaviour The processing and response times when product is running under specific conditions.
Resource Utilisation
The volume of resources the product uses when it is running under specific conditions.
Performance Efficiency
Compliance
The rate of how well product adheres standards and regulations regarding performance efficiency.
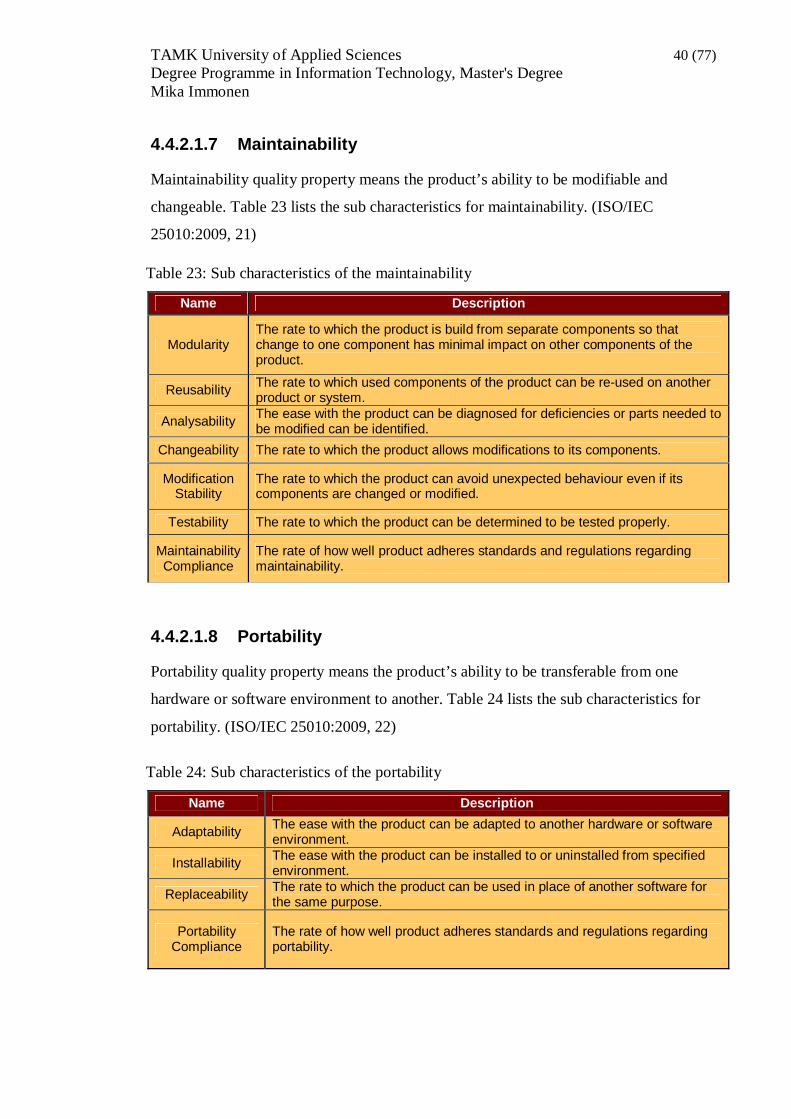
TAMK University of Applied Sciences 40 (77) Degree Programme in Information Technology, Master's Degree Mika Immonen
4.4.2.1.7 Maintainability
Maintainability quality property means the product’s ability to be modifiable and
changeable. Table 23 lists the sub characteristics for maintainability. (ISO/IEC
25010:2009, 21)
4.4.2.1.8 Portability
Portability quality property means the product’s ability to be transferable from one
hardware or software environment to another. Table 24 lists the sub characteristics for
portability. (ISO/IEC 25010:2009, 22)
Table 23: Sub characteristics of the maintainability
Name Description
Modularity The rate to which the product is build from separate components so that change to one component has minimal impact on other components of the product.
Reusability The rate to which used components of the product can be re-used on another product or system.
Analysability The ease with the product can be diagnosed for deficiencies or parts needed to be modified can be identified.
Changeability The rate to which the product allows modifications to its components.
Modification Stability
The rate to which the product can avoid unexpected behaviour even if its components are changed or modified.
Testability The rate to which the product can be determined to be tested properly.
Maintainability Compliance
The rate of how well product adheres standards and regulations regarding maintainability.
Table 24: Sub characteristics of the portability
Name Description
Adaptability The ease with the product can be adapted to another hardware or software environment.
Installability The ease with the product can be installed to or uninstalled from specified environment.
Replaceability The rate to which the product can be used in place of another software for the same purpose.
Portability Compliance
The rate of how well product adheres standards and regulations regarding portability.

TAMK University of Applied Sciences 41 (77) Degree Programme in Information Technology, Master's Degree Mika Immonen
4.4.2.2 System Quality in Use Model
Quality in use model takes care of the quality properties from end user’s point of view.
It validates how well the product meets the needs of the end user. In ISO/IEC 25000 the
quality in use model has been gathered from 3 characteristic: usability, flexibility and
safety.
Figure 6 shows all the characteristics of quality in use model. Next subchapters
introduce each sub character in more detail. It is noticeable that the ISO/IEC 25000 has
put more detail on quality in use issue than was in its predecessor, ISO/IEC 9126
standard. This correlates with the real life evaluation of the software industry because
usability is becoming more and more important in software industry.
4.4.2.2.1 Usability
Usability quality property covers the product’s ability to allow specified user to
complete the needed task in defined context of use. Table 25 lists the sub characteristics
for maintainability. (ISO/IEC 25010:2009, 24)
Table 25: Sub characteristics of the usability
Name Description
Effectiveness The product's accuracy and completeness to allow users to complete their tasks.
Efficiency The relative resources user needs to achieve accuracy and completeness in her tasks. Resources can be materials, time to complete task etc.
Satisfaction The user's opinion about the product when it is used to complete the wanted task.
Usability Compliance
The rate of how well product adheres standards and regulations regarding usability.
Figure 6. Quality model for quality in use. (ISO/IEC 25010:2009, 23)

TAMK University of Applied Sciences 42 (77) Degree Programme in Information Technology, Master's Degree Mika Immonen
4.4.2.2.2 Flexibility
Flexibility quality property covers the product’s ability to be usable in all possible
conditions it was designed to be used for. Table 26 lists the sub characteristics for
maintainability. (ISO/IEC 25010:2009, 24-25)
4.4.2.2.3 Safety
Safety quality property covers the product’s expected impact of harm to people, data,
information, software, property or the environment when the product is used as it was
designed to be used. Table 27 lists the sub characteristics for safety. (ISO/IEC
25010:2009, 25-26)
Table 26: Sub characteristics of the flexibility
Name Description
Context Conformity
The rate to which usability and safety meets the requirements in defined context of use.
Context Extensibility The rate of usability and safety which exceeds the original context of use.
Accessibility The rate to which usability and safety meets the users with special disabilities.
Flexibility Compliance
The rate of how well product adheres standards and regulations regarding flexibility.
Table 27: Sub characteristics of the flexibility
Name Description Operator
Health and Safety
The rate to which the product is expected to harm its operator in specific context of use.
Commercial Damage
The rate to which the product is expected to cause commercial damage to its operator or operator's reputation in specific context of use.
Public Health and Safety
The rate to which the product is expected to cause harm to public in specific context of use.
Environmental Harm
The rate to which the product is expected to cause harm to environment in specific context of use.
Safety Compliance
The rate of how well product adheres standards and regulations regarding safety.

TAMK University of Applied Sciences 43 (77) Degree Programme in Information Technology, Master's Degree Mika Immonen
4.4.2.3 Using the Quality Model
Software quality model in figure 7 visualizes a measurement of the quality model’s
characteristics and sub-characteristics. All software quality properties that can be
defined quantitatively are called attributes. These quality attributes are measured with a
measurement method. A measurement method is used to quantify the attribute in
specific scale. A measurement function is an algorithm which calculates quantitative
value to the quality measure elements. To get more accurate measurement result more
than one quality measure may be used to measure quality characteristics. (ISO/IEC
25010:2009, 32)
SQuaRE introduces 49 different quality aspects to be considered when talking about
software product quality. It is not reasonable or resource wise to try to measure all these
quality attributes from every software product. Instead, one should divide requirements
and needs from each stakeholder to several smaller sub quality models. Each of these
specific quality models will look the product from different angle and together they
form the overall picture of the product’s quality.
Software quality characteristics and sub-characteristics can be evaluated by direct
measurement, or indirectly by measuring their consequences. At the beginning of the
development cycle only the resources and process can be measured. When source code
and specifications are available, the internal measurements can be used to predict the
external quality. (ISO/IEC 25010:2009, 35)
Figure 7. Software quality measurement model. (ISO/IEC 25010:2009, 32)

TAMK University of Applied Sciences 44 (77) Degree Programme in Information Technology, Master's Degree Mika Immonen
The ISO/IEC 25000 standard documents were not in their final version in the time of
this thesis but according to recommendation from FISMA’s Risto Nevalainen
(Nevalainen, 2009) one could use ISO/IEC 9126-2 and ISO/IEC 9126-3 standards.
Those documents provide detailed mathematical formulas on how each of the internal
and external software metrics can be quantified.
The company’s own quality models could be defined based on the quality lifecycle
model. Sub quality model, based on quality in use phase, could contain specific end
user requirements and needs from the product’s running environment. Its validation
would be based on evaluation of the product with the end user as well as interviews.
Sub quality model, based on internal quality phase, measures could be gathered from
the automated build server’s quality analysis tools. Because the software product
domains can be very different from each other, there could be different internal quality
models.

TAMK University of Applied Sciences 45 (77) Degree Programme in Information Technology, Master's Degree Mika Immonen
5 Tieto Software Product Quality Analysis System
The concept of Tieto Software Product Quality analysis system (shortly Tieto SPQ
analysis system) is introduced in this chapter. Chapter explains the reasoning’s’ behind
the chosen architecture as well as exposes the needs and requirements of the system.
5.1 Overview
Quality is controlled through quality processes in Tieto. These quality processes are
based on widely spread ISO 9001:2000 quality management standard, CMMI
(Capability Maturity Model Integration) model and Tieto’s internal knowhow and
knowledge on software quality. These processes are guidelines and best practices how
software projects should be carried out and monitored. Although a good quality process
most often leads to a better quality, it does not mean that one can neglect the quality of
the software product itself.
Customers are demanding more and more with fewer resources and lesser effort. At the
same time, the size and complexity of the software systems continue to increase. This
raises the need for good quality assurance and measurements. In order to meet these
demands the efficiency of the software development has to increase as well and things
like maintenance costs and component/class reusability become important. This means
that the software developers need to produce software with better fault tolerance and
higher maintainability. These issues can only be addressed by automatically monitoring
all the software product development phases from design to implementation and testing.
During the writing of this thesis, in summer and fall 2009, there was no unified way in
Tieto how different software teams should measure the quality of their products. Each
team could decide what to measure and how. One reason for this is that most of the
projects are implemented for the external customers and often customers own quality
and software processes decide what methods and measurements are used or required.
As the maturity of Tieto Engineering Toolbox (Tieto ETB), the software development
platform of Tieto, increased the automated and controlled software analysing became
feasible. Tieto SPQ analysis system described in this master’s thesis is a solution to that.

TAMK University of Applied Sciences 46 (77) Degree Programme in Information Technology, Master's Degree Mika Immonen
It is a way to unify software quality analysing in corporate level. Using the results from
Tieto SPQ analysis system different stakeholders can see the overall quality of their
products and compare them.
5.2 General Architecture
Tieto SPQ analysis system is a standalone system and it runs on independent server. Its
main purpose is to store software quality analysis results from different software
products. Tieto SPQ analysis system is used to monitor and track the progress of the
software product quality over time.
Figure 8 represents the basic architectural structure of Tieto SPQ analysis system. It
shows the basic data flow through the whole system; starting from running the actual
Figure 8. Tieto SPQ Analysis System generic overview
TAMK University of Applied Sciences 47 (77) Degree Programme in Information Technology, Master's Degree Mika Immonen
software quality analyses and ending to showing the results to the different
stakeholders.
One of the preliminary requirements for Tieto SPQ analysis system was that it should
add value to existing ETB services but the new system should not be tightly bound to
ETB servers. This means that the system has to be located in a separate server and all
the analysis data must be collected using external tools.
This lead to a essential architectural decission: Tieto SPQ analysis system has to be
implemented using Service Oriented Architecture (SOA). This means that Tieto SPQ
analysis system itself does not contain any GUI (Graphical User Interface) components.
System’s business logic and features are concentrated strictly on data processing and
data storing functionalities.
Service oriented architecture approach was chosen for couple of reasons. Firstly, it
allows the system to be totally oblivious about where the data is coming from. In other
words, it gives the possibility to run analyses with any computer system and only save
the results to Tieto SPQ analysis system database. Software analyses can be run with
build servers or single computer by a development team. Secondly, it leaves the
presentation logic layer out from Tieto SPQ analysis system core components; thus
simplifying the architecture. Passing data to presentation layer is handled through web
services.
By using standard web service technique to expose services from business logic layer
the system does not bind the external client’s implementation to any specific
programming language or hardware. This was important thing to take into account
because it was not decided what kind of clients there will be in the future. For example,
the viewer client could be run from the standard computer or even from a mobile
device. Simply put, there are two types of external clients for Tieto SPQ analysis
system; clients to collect and store analyses data and clients to show the results of these
analyses.

TAMK University of Applied Sciences 48 (77) Degree Programme in Information Technology, Master's Degree Mika Immonen
In figure 8, the Product Quality Analysis layer symbolises the software quality
analysing phase. In this phase the quality analyses and evaluations are done to the actual
software products. Depending on the used product quality model; the analysing is done
either automatically by using the analysing tools in the build servers or manually by the
quality evaluation teams, developers or the team architect.
Running a quality analysis automatically means that the quality validation is run during
the product’s build phase; usually in the automated test phase of the product build. In
this phase one will have product’s binaries as well as source code at disposal, thus
allowing a good place to run the different analysing tests. When the tests are run in the
build servers, the results are sent to the data collector tool of Tieto SPQ analysis system
for further data processing. The original product binaries and source codes are not send
to the data collector, only the results from the analyses.
Manual quality analysis is done by the evaluation teams by evaluating the product with
the end users. In this phase the product is taken into use in real enviroment with actual
users of the software and the product’s usability metrics are evaluated. Manual quality
analyses can also be done by the developers or team architect depending on the required
metric of the chosen quality model that is being evaluated. After the manual evaluation,
the results are reported back to Tieto SPQ analysis system through a web page that
again process them and stores into the database.
In figure 8, the Product Quality Results layer shows the different stakeholders who are
interested in seeing the quality results. These stakeholders may include the development
team, customer representative, company’s quality organisation and the management.
When products are evaluated with using same quality models they can be compared.
The actual results are shown through an web application and one such application
would be Tieto SPQ analysis system viewer for Tieto ETB. This viewer would allow
easy integration with existing Tieto ETB platform and users.
As seen in the figure 8 the core of Tieto SPQ analysis system is its business logic layer.
This layer is responsible for providing different business logic services to external
clients, for example to the presentation logic layer. By concentrating all the services of

TAMK University of Applied Sciences 49 (77) Degree Programme in Information Technology, Master's Degree Mika Immonen
the business logic to be used through web services; the system can be maintainable and
extendable for the future needs. Abstracting the actual components from the external
client, one can improve changeability as long as the web service API stays intact.
Abtraction makes the system easier to develop and implement because the development
team can use for example a MySQL database as a development database but the real
enviroment can use the Microsoft SQL Server database if wanted.
In figure 9 there are the services of the business logic layer of Tieto SPQ analysis
system. These services can roughly be divided into three levels: the presentation
services, the analysis data handling services and the database services.
Presentation services provide services for the presentation layer. This includes web
services to retrieve different reports for the result viewer as well as functionality to store
permanent configuration data and settings. Different reporting functions get the report
content from the data calculation services before the report is send to the external
viewer. Analysis data handling services are used to collect and harmonise the analysis
data. All analyses data are checked and harmonised before they are saved to the
database. Data calculations query the data from the database and calculate the actual
quality values for the reports. The database services contains services for
Figure 9. Services of the business logic
layer of the Tieto SPQ analysis system.

TAMK University of Applied Sciences 50 (77) Degree Programme in Information Technology, Master's Degree Mika Immonen
administrational tasks and for storing the data to the database. By using automated
administrational operations one can register new products to the system with ease.
5.3 Software Product Quality
In Tieto SPQ analysis system the overall software product quality is a combination of
different software product quality models. This sub chapter describes how software
product quality is designed to be used in Tieto SPQ analysis system.
5.3.1 Software Product Quality Model
All different software product quality models are stored in Tieto SPQ analysis system’s
database. When Tieto SPQ analysis system is installed it is shipped with the default
software product quality library. This software product quality library is based on the
ISO / IEC 25000 and ISO / IEC 9126 standards introduced in chapter 4.
The idea behind the usage of the default software product quality library is that every
stakeholder who is taking Tieto SPQ analysis system into use can start using it
immediately. The default software product quality library can be used to create own
software product quality models from scratch. These software product quality models
are meant to be created by using a web page which is basically just a configurator where
one selects wanted software product quality factors to the software product quality
model.
Figure 10. Building the Software Product Quality Model.

TAMK University of Applied Sciences 51 (77) Degree Programme in Information Technology, Master's Degree Mika Immonen
Figure 10 shows the relationship between the software product quality libraries
(SPQLibrary) and the software product quality models. Tieto SPQ analysis system
could contain multiple SPQLibraries and more libraries could be added later on. In
figure 10 there is three different SPQLibraries to choose from. Each of the
SPQLibraries can be divided to the software product quality categories (SPQCategory)
and to the software product quality factors (SPQFactor). For example, in the ISO / IEC
25000 based SPQLibrary, the SPQCategory could be the reliability and the SPQFactor
the fault tolerance. The new software product quality model (SPQM) is composed from
the different SPQFactors. Each of the SPQM can contain one-to-many SPQFactors. In
figure 10 the SPQM1 contains 5 different SPQFactors and they are gathered from
different SPQLibraries.
5.3.1.1 Example of the Software Product Quality Model
For the beginners of Tieto SPQ analysis system the easiest way to create a software
product quality model would be to use such SPQFactors that are easy to analyse
automatically without human interaction.
In table 28 there is an example of the possible software product quality model that could
be used. It is based on the ISO / IEC 25000 standard and it includes software product
quality factors from two different software product quality categories: the
maintainability and the performance efficiency. This software product quality model is
validated by running automated tests and analyses during a build phase. These
SPQCategories were chosen because they are moderately easy to analyse; and they tell
something about the structure as well as the performance of the software product.
The maintainability SPQFactors are collected from the source code during the build
phase and the performance efficiency SPQFactors are gathered by running the actual
Table 28. Example of the Software Product Quality Model
SPQFactor SPQCategory Modularity Maintainability Reusability Maintainability Testability Maintainability Time behaviour Performance Efficiency Resource Utilisation Performance Efficiency

TAMK University of Applied Sciences 52 (77) Degree Programme in Information Technology, Master's Degree Mika Immonen
product. The modularity SPQFactor could be measured using different metrics from the
Chidamber and Kemerer metrics suite introduced in chapter 4.2.5.2. The Reusability
SPQFactor could be validated by using the reusability formula from the QMOOD
(Quality Model for Object-Oriented Design) metric suite introduced in chapter 4.2.5.3.
The testability SPQFactor is meant to be used to estimate how complicate the software
product’s source code is to write unit tests. For example, for software products written
in Java programming language, the Google’s Testability Explorer analysis tool could be
used. The time behaviour and the resource utilisation SPQFactors, from the
performance efficiency, were chosen to give a perspective how efficient the software
product is under execution.
5.3.2 The Overall Software Product Quality
The overall software product quality consists of a set of software product quality
models. The software product can have multiple software product quality models which
all inspect different software quality aspects from the software product.
In figure 11 there is an illustrated structure of the different components of the software
product quality. The software product quality model consists of the software product
quality factors and the analyses result values (ARV). The ARVs represent the actual
measured values for the software product quality factor. The quality analyses are run at
Figure 11. Illustrated structure of the different components of the software product quality.

TAMK University of Applied Sciences 53 (77) Degree Programme in Information Technology, Master's Degree Mika Immonen
time T1 by the build machine and the analysis results, ARV1 to ARVn, are used to
calculate the software product quality model values, SPQM1 to SPQMn. Each analysis
result value is emphasised with a specified factor, the Software Product Quality Factor
Weight (SPQFW).
Using the SPQFW introduces the possibility for different combinations of the software
product quality model. Tieto SPQ analysis system could contain different quality
models that all contain the same software quality factors but the factors are emphasised
differently, for example, because they are used in different computer environments. One
quality model could appreciate timing issues more highly and the other one could be
more interested in resource utilisation issues of the product. Yet, both of the quality
models represent the same type of software product quality model: the performance
efficiency.
As seen in the figure 11 the same analysis result value can be included to multiple
software product quality models. For example, the ARV1 is included to SPQM1 with
emphasis factor of 55% and to SPQM2 with emphasis factor of 20%. The idea is that
these emphasis factors can be tuned later on when knowledge of their importance
increases.
The overall software product quality is a percentage value from 0 to 100. The overall
software product quality is calculated from the SPQM average values. In Tieto SPQ
analysis system it is possible to give an optional emphasis factor, the Software Product
Quality Model Weight (SPQMW), for each of the software product quality models. The
SPQMW can be used to adjust the importance of the SPQM in the calculation of the
overall software product quality. This is especially handy when one does not exactly
know is the SPQM1 and the SPQM2 equal in importance. By tweaking the SPQMW
each company can adjust the importance of each SPQM into desired level.
To be able to easily compare the overall software quality of each of the software
products, the software products are given a star rating from one to five stars. By default,
the star rating could be simply converted evenly by representing each of the 20%
increase in quality with a new star. In figure 11 there is an imaginary situation where

TAMK University of Applied Sciences 54 (77) Degree Programme in Information Technology, Master's Degree Mika Immonen
the overall software product quality is shown with 3.5 stars. This means the score of
70% from the calculation of the overall software product quality. If one wants more
advanced quality star controlling, the normal distribution a.k.a Gaussian distribution
could be used to separate the good quality products from the bad ones.
5.3.3 Calculation of the Software Product Quality Model Value
The Software Product Quality Model Value (SPQMV) is a value that represents the
software product's quality in a scale of 0 to 100. The greater the SPQMV number, the
better the quality of the software product.
Formula of the Software Product Quality Model Value
Formula 8 shows how the SPQMV can be calculated using the analysis data from the
AnalysisResult table. The SPQMV is a sum of the emphasised analyses result values for
each of the quality factors that are part of the calculated software product quality model.
Firstly, the formula 8 calculates the average value from all the stored analyses results
(ARV) of the particular software quality factor; and then multiplies it with the emphasis
factor value, Software Product Quality Factor Weight (SPQFW), from the
SPQM_has_SPQFactor table.
The formula 8 is meant to be used to populate SPQMValue table from the values of the
AnalysisResult table. It was designed that if one wants later on change one or more of
the emphasis factors of the software product quality model, the values in SPQMValue
table could be recalculated. This makes it possible that when a new software product
n
k
m
nkn
k
m
ARVSPQFWSPQMV
1
1
100 (8)
where
SPQFW is an emphasis factor of the Software Product Quality Factor
ARV is the analysis result value from the AnalysisResult table
n is the number of the different software product quality factors
m is the number of the different analysis result values of SPQFk

TAMK University of Applied Sciences 55 (77) Degree Programme in Information Technology, Master's Degree Mika Immonen
quality model is created; one does not have to know the exact weight factors for all the
selected quality factors.
5.3.4 Presenting the Software Product Quality Models
The software product quality is a combination of 1 to n amount of quality models. Each
quality model represents different aspects of the overall quality based on the analysis
data stored in to the database.
Figure 12 illustrates one idea how software product’s quality could be presented to the
end users in the external Tieto SPQ analysis system viewer. In figure 12 there is an
imaginary progress of the software quality development of the product ‘x’ during
observation period of one year. In this figure there are three quality models available for
the product x: the maintainability, the performance efficiency and the usability. The y-
axis represents the software product quality model value that is calculated with the
formula 8 from the previous chapter. The y-axis is a percentage value ranging from 0 to
100 where the higher value is better. The x-axis contains the report’s observation
period.
Combining the data from the ProductLabel table with the data from the SPQMValue
table, one can insert more detailed information into the report charts. In figure 12 there
is an example where the performance efficiency has been affected because new analysis
tool configuration settings have been taken into use. The dark blue line in the graph
Figure 12. Development of the Software Product Quality during fixed observation period
(one year).
TAMK University of Applied Sciences 56 (77) Degree Programme in Information Technology, Master's Degree Mika Immonen
shows clearly the impact to the quality of the maintainability model between different
refactoring phases of the software product. The graph shows that refactoring in phase
one and phase two has dropped quality value dramatically for short period of time, but
overall the refactoring has increased the quality of the product. The graph also shows
that refactoring in phase three has dropped the overall quality so the conclusion is that
the refactoring in phase three was not a complete success. When the accuracy of the
data in the system evolves; one can offer more complex and precise reports to the end
users.
5.4 Services of Tieto SPQ Analysis System
Tieto SPQ analysis system will be delivered and installed as a fully working analysing
system. This will include all the necessary components for any company or team to start
analysing its software products. To make this possible Tieto SPQ analysis system has to
offer different kinds of services to make it easy for every team to start using quality
analyses. This chapter describes a few of those services: what they could be and what
their responsibilities would be. These services could be the installation and
configuration service; the analysing tools integration service; the help desk and training
service; and the quality consultation service.
5.4.1 Installation and Configuration Service
The Installation and Configuration Service (ICS) is a service that is needed when the
system is installed to the target group. The ICS is responsible for delivering Tieto SPQ
analysis system, installing the database and setting up all the connections and access
rights for the end users of the system. Depending on the selected quality model; the ICS
will distribute the needed analysis tools and their configuration and launch files.
5.4.2 Analysing Tools Integration Service
The Analysing Tools Integration Service (ATIS) is a service that maintains and offers
help and tools for different analysing purposes. Its main purpose is to provide all the
needed tools to evaluate software product quality model metrics. Before any tool can be
added to the ATIS list, it must be evaluated and right configuration data gathered to
prevent faulty analysis results. All the tool binaries are distributed from Tieto SPQ

TAMK University of Applied Sciences 57 (77) Degree Programme in Information Technology, Master's Degree Mika Immonen
analysis system server. This allows ATIS to manage tool updates in one centralised
way.
By default the ATIS offers tool configurations as an Apache Ant script file. The Apache
Ant is a task based build tool written in Java. It can be used to run different tasks like
execute, copy, delete, create folder and so on. The Apache Ant is also extendable so if
some functionality is not included in the core Ant libraries; one can easily create custom
Ant tasks with Java. The configuration file does not contain any knowledge about
project files. This means that it can be launched independently during build phase. The
complete configuration and launch files can be found from appendix 1 and appendix 2.
In the program listing 1 is a piece of configuration file showing PMD tool settings that
is used to pass different parameters to the analysis tool. All the tool’s settings can be
configured from this file.
This configuration file contains all the settings for all the analysis tools supported by the
system. The configuration file is not meant to be installed to the build machines; instead
it is linked from Tieto SPQ analysis system server in the actual launch file. By keeping
the configuration file in the server side gives the ATIS a better control over the settings.
If one wants later on to change some analysis tool’s configuration, it is done in the
server. Next time analyses are run all the build machines get the updated settings.
When a new analysis tool is added to the ATIS it must go through the evaluation and
validation phase. During this phase, the tool is examined more closely and it is
configured correctly to be suited for the quality metric(s) it is analysing. After the initial
Program listing 1: Example of an ant configuration for software quality
analysis tools ### Configuration file starts ### ### PMD ### pmd_output_file=pmd_results.xml pmd_output_folder=pmd pmd_ant_task_classname=net.sourceforge.pmd.ant.PMDTask pmd_use_short_file_names=true pmd_formatter_type=xml pmd_ruleset=rulesets/favorites.xml
. . ### Configuration file ends ###

TAMK University of Applied Sciences 58 (77) Degree Programme in Information Technology, Master's Degree Mika Immonen
settings are clarified, the tool’s settings are added to the configuration file and the tool is
ready to be used.
The program listing 2 shows a piece from the actual launch file. This file is executed in
the build machine and it will get all its settings from Tieto SPQ analysis system server’s
configuration file. The launch file is used to control which analyses tools are run and
where they output the analyses results for post-processing.
5.4.3 Help Desk and Training Service
The Help Desk and Training Service (HDTS) is a service that has two main
responsibilities; handling support tickets and to train new users. The help desk service is
responsible for general support tasks; such as, providing support by phone and email.
The training service is responsible for creating and distributing e-learning materials as
well as giving hands-on class trainings that will teach Tieto SPQ analysis system
functionalities to the end users.
Program listing 2: Ant launch file for running software quality analysis tools <!-- ========================================================================== --> <!-- Run software quality analysis tools --> <!-- ========================================================================== --> <target name="run_software_product_quality_analysis"> <echo>Initializing directory structure...</echo> <mkdir dir="${quality_analysis_results_dir}"/> <mkdir dir="${quality_analysis_binaries_dir}"/> <echo>Copying binaries to analyse...</echo> <copy todir="${quality_analysis_binaries_dir}" failonerror="true" overwrite="true"> <fileset dir="${product_binaries}/ "> <include name="*.jar"/> </fileset> </copy> <echo>Starting PMD analysis...</echo> <antcall target="pmd"/> </target> <!-- ========================================================================== --> <!-- PMD analysis --> <!-- ========================================================================== --> <target name="pmd"> <taskdef name="pmd" classname="${pmd_ant_task_classname}"/> <mkdir dir="${quality_analysis_results_dir}/${pmd_output_folder}/"/> <pmd shortFilenames="${pmd_use_short_file_names}"> <ruleset>${pmd_ruleset}</ruleset> <formatter type="${pmd_formatter_type}" toFile="${quality_analysis_results_dir}/${pmd_output_folder}/ ${pmd_output_file}"/> <fileset refid="product_plugin_source_files"/> </pmd> </target>

TAMK University of Applied Sciences 59 (77) Degree Programme in Information Technology, Master's Degree Mika Immonen
5.4.4 Quality Consultation Service
The Quality Consultation Service’s (QCS) is responsible to offer help in different
quality oriented situation. It can be used to order new quality models for the company,
to give training in quality issues or to order the evaluation team to validate the software
product quality. The services of the QCS should not be free of charge. It should be
chargeable for Tieto SPQ analysis system customers and this money should be used to
implement more accurate software product quality analyses for the end users.
5.5 Software Analysis Data Management
All the software analysis tools are run in the build servers automatically during different
build phases. In the end these analysis results are stored in the MySQL database but
before that they have to be collected and harmonised in a managed way. By using the
unified harmonisation process one can guarantee that all software products are treated
equally in Tieto SPQ analysis system. This chapter describes one possible solution for
the software analysis data management.
Figure 13. Overview of the analysis data collecting management.

TAMK University of Applied Sciences 60 (77) Degree Programme in Information Technology, Master's Degree Mika Immonen
Figure 13 shows the basic architecture for the software analysis data management in
Tieto SPQ analysis system. The software analysis data management is divided into two
phase: to the analysis data collecting phase and to the analysis data processing phase.
In the data collecting phase, the product is built in the build server and the specific
Apache Ant script is run to launch wanted analysis tools. The analysis results are saved
to folders specified by the Apache Ant configuration file. In order to get the results from
the build servers to Tieto SPQ analysis system, they have to be sent in a controlled way.
This could be done by using specially designed Apache Ant task.
In figure 13 the RAC (Raw Analysis data Collector) container represents the analysis
data collector Apache Ant task. This task could be written in Java and Tieto SPQ
analysis system’s the ATIS service could be in charge of distributing this to the
different build servers. By using Apache Ant task to send the analysis data, gives us the
advantage of an easy integration with the other ATIS analysis tool launch and
configuration files. All the needed configurations for the RAC could be stored to the
same Apache Ant configuration file defined by the ATIS. Because the configuration file
is meant to be located in the server; any future adjusting will be automatically updated
to build phases next time they are run.
To start the analysis processing phase, the RAC must send required analysis result files
and to invoke the analysis data processing web service. FTP (File Transfer Protocol)
could be used to send the analysis result files into a specific folder in Tieto SPQ
analysis system server. Also to successfully emit the analysis data for the correct
product and for the correct software product quality factor; the RAC must pass on to the
web service the product name, the measurement id and the URI (Uniform Resource
Identifier) of the analysis result files.
The product name can be either configured to the Apache Ant configuration file by the
ATIS or dynamically read from the build server. The measurement id is a 32-bit GUID
that is used to determine which tool is performing the current measurement and which
software product quality factor it is measuring. The measurement id has to be found
TAMK University of Applied Sciences 61 (77) Degree Programme in Information Technology, Master's Degree Mika Immonen
from Tieto SPQ analysis system database and therefore it is configured by the ATIS
when the analysis tool is integrated with the other ATIS tools.
The second half of the figure 13 contains the analysis data processing phase. This data
processing is done in Tieto SPQ analysis system server and it is invoked through a web
service call. The figure 13 shows different layers of the data processing mechanism in
Tieto SPQ analysis system: the analysis data validation management; the analysis tool
parser (ATP) management; the harmonisation and calculation management; and the
analysis data storage management.
The analysis data validation management layer is responsible of validating the input
from the RAC Apache Ant task and to pass on the data to the correct analysis tool
parser in the ATP management layer. The measurement id can tell the used analysis tool
and version; and that information can be used to select the correct ATP from the ATP
management layer. The product name is used to retrieve the correct product id from the
database so that it can be inserted to the AnalysisResults table by the analysis data
storage management layer. The analysis data storage management layer is responsible
of storing the analysis results into the correct tables in the database.
The analysis tool parser management layer is responsible for containing the correct
parser implementation to each of the analysis tools that are recognised by the system. In
figure 13, the ATP1 to the ATPn represents the different analysis tool parsers that are
supported by the system. The architecture of this layer has to be very extendable
because each time a new analysis tool is integrated to Tieto SPQ analysis system, a new
parser has to be added as well. This could be achieved, for example, by using some sort
of APT Manager. This ATP Manager would select and start the correct parser for the
input, collect the parsed data and pass the data on to the harmonisation and calculation
management layer.
The harmonisation and calculation management layer is responsible for scaling the
parsed analysis tool data to correct format and passing the data to the analysis data
storage management layer. In figure 13 the ATL1 to the ATLn (Analysis Tool Logic),
illustrates business logic components for each of the analysis tool parser output.

TAMK University of Applied Sciences 62 (77) Degree Programme in Information Technology, Master's Degree Mika Immonen
Together these components compose the business logic how different analysis results
are converted and harmonised so that they can be stored into the database. This layer
also has to be extendable because a new ATL component is needed when a new ATP
component is added to the system.
TAMK University of Applied Sciences 63 (77) Degree Programme in Information Technology, Master's Degree Mika Immonen
5.6 Database Architecture
The data storage for the analysing results is a MySQL database. The MySQL database
was chosen because it is widely spread and used; it is open source database; and it was
already in use in other Tieto ETB systems.
The appendix 3 contains the whole database schema for Tieto SPQ analysis system. The
designed database is a combination from different layers. Each layer represents a logical
entity that is divided into separate tables. Different layers are the Software Product
Layer (SPL), the Software Product Quality Model Layer (SPQML), the Software
Quality Library Layer (SQLL), the Software Product Quality Analysis Layer (SPQAL)
and the Analysis Configuration Layer (ACL). The appendix 3 also shows the full
relationships between different database tables. Following sub chapters describe
purpose of each of these layers in more detail.
5.6.1 Design Principles
All the tables in Tieto SPQ analysis system database contain unique auto-id to identify
individual entities of each table. Using the unique auto-id for each table also helps
indexing the tables better. Four different data types were used in Tieto SPQ analysis
system database schema design; Integer (INT), Decimal, Date and Varchar.
The integer data type was used for automatic ids; the decimal data type was used for
different emphasis factors and analyses result values; the date data type was used to
store timestamps for important events and the varchar data type was chosen because it
allows storing strings with variable-length. According to MySQL documentation
(MySQL 5.0 Reference Manual) the varchar data type takes less space than the fixed
size char data type; when it is used to save an empty string value. It was logical to use
the varchar data type especially for the different description fields because they are
optional and thus empty description fields do not take unnecessary space.
5.6.2 Software Product Layer
The Software Product Layer (SPL) in figure 14 contains all the software product related
information in Tieto SPQ analysis system. This layer’s main responsibility is to keep

TAMK University of Applied Sciences 64 (77) Degree Programme in Information Technology, Master's Degree Mika Immonen
track of the products that are monitored by the system. This layer also contains tables
for very light-weight user management.
Table 29 contains the schema of the ProgrammingLanguage table. The Programming-
Language table is used to identify different programming languages that the product can
have. The programming language knowledge can be used to specify which analysis
tools are provided for analyses. The programming language can also be used when one
wants to see a quality report separately for example to C++ and Java. The programming
language is mapped with many-to-many relationship, the
Product_has_ProgrammingLanguage table, to the Product table. Multiple programming
languages can be used to develop the product and same programming language is used
in multiple products.
Figure 14. Software Product Layer from the SoPQAS database schema.
Table 30. Schema of the ProductLabel table.
Column Datatype Required Description idProductLabel INT Yes Unique auto-id for the product label entity
idProduct INT Yes The product that this product label belongs to
LabelDescription VARCHAR(64) Yes Description of the product label LabelDate DATE Yes The date value of the product label
Table 29. Schema of the ProgrammingLanguage table.
Column Datatype Required Description
idProgrammingLanguage INT Yes Unique auto-id for the programming language entity
Name VARCHAR(32) Yes Name of the programming language
Description VARCHAR(128) No Optional. Description of the programming language

TAMK University of Applied Sciences 65 (77) Degree Programme in Information Technology, Master's Degree Mika Immonen
Table 30 contains the schema of the ProductLabel table. The ProductLabel table is used
for storing different comments about the product. The comment can be a version
number or some other development issue that may have changed the outcome of the
quality analyses. The ProductLabel can be used in a presentation layer to show
additional information to the user.
Table 31 contains the schema of the Project table. The project table stores all projects
recognized by Tieto SPQ analysis system. The project can have multiple products and it
must be created to the system before any products can be added. The project is mapped
with many-to-many relationship, the Project_has_User table, to the User table. This
means that the project can have multiple users and the user can participate in multiple
projects.
Table 32 contains the schema of the User table. The User table is an optional table for
Tieto SPQ analysis system. It offers light-weight user management to restrict
unauthorized access to analyses data. It is meant to be used to verify does the user have
access rights to view analyses results for selected products. This table is optional
because it is really meant to be used only in development and testing phases of the
system.
In the real production environment more sophisticated user management should be
used. This could be done using LDAP (Lightweight Directory Access Protocol) or other
Table 31. Schema of the Project table.
Column Datatype Required Description
idProject INT Yes Unique auto-id for the project entity
Name VARCHAR(64) Yes Name of the project
Description VARCHAR(128) No Optional. Description of the project
Table 32. Schema of the User table.
Column Datatype Required Description idUser INT Yes Unique auto-id for the user entity Username VARCHAR(32) Yes Username for the user Password VARCHAR(32) Yes Password for the user (MD5 checksum) Firstname VARCHAR(32) Yes User's firstname Lastname VARCHAR(32) Yes User's lastname Email VARCHAR(64) Yes User's email address

TAMK University of Applied Sciences 66 (77) Degree Programme in Information Technology, Master's Degree Mika Immonen
similar authentication protocols. The user identification should also be done in correct
business logic layer.
Table 33 contains the schema of the Product table. The Product table is the heart of the
system and it also contains most foreign keys to other tables. It is used to store all the
products that contain analyses data. The idProject column is used in one-to-many
relationship with the Project table to identify the project that the product belongs to.
5.6.3 Software Product Quality Model Layer
The Software Product Quality Model Layer (SPQML) in figure 15 contains all the
information from the different software product quality models stored in Tieto SPQ
analysis system.
Figure 15. Software Product Quality Model Layer from the SoPQAS database schema.
Table 33. Schema of the Product table.
Column Datatype Required Description idProduct INT Yes Unique auto-id for the product entity idProject INT Yes The project that this product belongs to Name VARCHAR(64) Yes Name of the product Description VARCHAR(128) No Optional. Description of the product

TAMK University of Applied Sciences 67 (77) Degree Programme in Information Technology, Master's Degree Mika Immonen
Table 34 contains the schema of the SPQM table. The Software Product Quality Model
(SPQM) table includes information of the different quality models stored in the system.
The SPQM is mapped with many-to-many relationship, the Product_has_SPQM table,
to the Product table. The software product can have multiple software product quality
models and the software product quality model can be used with multiple software
products. The SPQMWeight is an optional emphasis factor that can be used to adjust
the weight of the software product quality model in the calculation of the overall
software product quality.
Table 35 contains the schema of the SPQM_has_SPQFactor table. The
SPQM_has_SPQFactor table is a mapping table between the SPQM and the SPQFactor
tables. Each SPQFactor can belong to multiple software product quality models and
each software product quality model can have multiple SPQFactors. This table includes
the knowledge that tells how each software product quality model is made of. The
SPQFWeight is an emphasis factor that is used to specify how much weight SPQFactor
has in this particular software product quality model. The SPQFWeight is used in
calculation of the software product quality model value.
Table 34. Schema of the SPQM table.
Column Datatype Required Description idSPQM INT Yes Unique auto-id for the SPQM entity Name VARCHAR(64) Yes Name of the SPQM Description VARCHAR(256) No Optional. Description of the SPQM
SPQMWeight DECIMAL No Optional. Emphasis factor for the SPQM.
Table 35. Schema of the SPQM_has_SPQFactor table.
Column Datatype Required Description SPQM_idSPQM INT Yes Mapping id of theSPQM SPQFactor_idSPQFactor INT Yes Mapping id of the SPQFactor SPQFWeight DECIMAL Yes Emphasis factor for the SPQFactor

TAMK University of Applied Sciences 68 (77) Degree Programme in Information Technology, Master's Degree Mika Immonen
5.6.4 Software Quality Library Layer
The Software Quality Library Layer (SQLL) in figure 16 there is responsible for
providing information about different software product quality libraries.
table 36 contains the schema of the SPQFactor table. The Software Product Quality
Factor (SPQF) is a building block for creating a new software product quality model. It
is a smallest entity of the software product quality model that is measured by Tieto SPQ
analysis system. For example, the analysability could be an entity of the SPQFactor
when the software product quality library is the ISO/IEC 25000. The idSPQFLibrary
and the idSPQFCategory columns are used with one-to-many relationship to identify
what library and category this SPQFactor belongs to.
Figure 16. Software Quality Library Layer from the SoPQAS database schema.
Table 36. Schema of the SPQFactor table.
Column Datatype Required Description idSPQFactor INT Yes Unique auto-id for the SPQFactor entity idSPQFLibrary INT Yes The quality library this SPQFactor is part of idSPQFCategory INT No Optional. Category of the SPQFactor Name VARCHAR(64) Yes Name of the SPQFactor Description VARCHAR(128) No Optional. Description of the SPQFactor.
Table 37. Schema of the SPQLibrary table.
Column Datatype Required Description idSPQFLibrary INT Yes Unique auto-id for the SPQFLibrary entity Name VARCHAR(64) Yes Name of the SPQFLibrary Description VARCHAR(128) No Optional. Description of the SPQFLibrary

TAMK University of Applied Sciences 69 (77) Degree Programme in Information Technology, Master's Degree Mika Immonen
Table 37 contains the schema of the SPQLibrary table. Table contains information
about the different software quality libraries the system is familiar with. The ISO/IEC
9126 and the ISO/IEC 25000 are examples of possible software quality libraries in
Tieto SPQ analysis system.
Table 38 contains the schema of the SPQCategory table. The Software Product Quality
Category (SPQC) is an optional table to categorise software product quality factors. If
the SPQFactor is, for example, a resource utilisation, its optional SPQCategory could be
performance efficiency based on the ISO/IEC 25000 standard.
5.6.5 Software Product Quality Analysis Layer
The Software Product Quality Analysis Layer (SPQAL) in figure 17 holds all the data
from the quality analyses in Tieto SPQ analysis system. Layer’s main responsibility is
to store different analyses data and to provide it to the different quality reports.
Figure 17. Software Product Quality Analysis Layer from the SoPQAS database schema.
Table 38. Schema of the SPQCategory table.
Column Datatype Required Description idSPQFCategory INT Yes Unique auto-id for the SPQFCategory entity Name VARCHAR(64) Yes Name of the SPQFCategory Description VARCHAR(128) No Optional. Description of the SPQFCategory
Table 39. Schema of the SPQMValue table.
Column Datatype Required Description idSPQMValue INT Yes Unique auto-id for the SPQMValue entity idProduct INT Yes The product this entity belongs to idSPQM INT Yes The SPQM this entity represents of SPQMValue DECIMAL Yes The calculated value of the SPQM SPQMValueDate DATE Yes Date value when this entity was composed

TAMK University of Applied Sciences 70 (77) Degree Programme in Information Technology, Master's Degree Mika Immonen
Table 39 contains the schema of the SPQMValue table. This table is one of the most
important tables in the database. It is used to save the results for different software
product quality models. Values in this table are used when different kind of quality
reports are generated. Each calculated SPQMValue is linked to the correct product with
the idProduct id-value. The idSPQM column is used to identify which software product
quality model this SPQMValue belongs to.
Table 40 contains the schema of the AnalysisResult table. The AnalysisResults table is
the most important table in the database. It contains all the harmonised analyses results
from different build machines, evaluation teams etc. This table is used to calculate
SPQMValues for each software product quality models. The idProduct column is used
to identify the product this analysis result belongs to. The idAnalysisMeasurement
column can be used to identify what analysis tool and version was used to get specific
analysis data and which SPQFactor was measured.
Table 40. Schema of the AnalysisResult table. Column Datatype Required Description
idAnalysisResult INT Yes Unique auto-id for the analysis result entity
idProduct INT Yes The product this entity belongs to
idAnalysisMeasurement INT Yes The measurement method that was used to get this result
AnalysisResultValue DECIMAL Yes The stored value for this entity AnalysisDate DATE Yes The date when this entity was measured

TAMK University of Applied Sciences 71 (77) Degree Programme in Information Technology, Master's Degree Mika Immonen
5.6.6 Analysis Configuration Layer
The Analysis Configuration Layer (ACL) in figure 18 contains the configuration data
for the different analysis tools used in Tieto SPQ analysis system.
Table 41 contains the schema of the AnalysisMeasurement table. The
AnalysisMeasurement table is a mapping table between the AnalysisResult and the
SPQFactor and the AnalysisPerformer tables. This table is used to identify which
analysis tools are used to measure specific SPQFactor. The idAnalysisPerformer
Figure 18. Analysis Configuration Layer from the SoPQAS database schema.
Table 41. Schema of the AnalysisMeasurement table.
Column Datatype Required Description
idAnalysisMeasurement INT Yes Unique auto-id for the analysis measurement entity
GUID_AnalysisMeasurement VARCHAR(32) Yes MD5 checksum of this analysis reporter
idAnalysisPerformer INT Yes The entity that is performing this measurement
idSPQFactor INT Yes The SPQFactor this measurement is validating

TAMK University of Applied Sciences 72 (77) Degree Programme in Information Technology, Master's Degree Mika Immonen
identifies the actual tool behind the analysis. The idSPQFactor tells what software
product quality factor this measurement is validating. The GUID_AnalysisMeasurement
is a generated 32-bit MD5 checksum for the analysis data collecting process. This
identification can be used to make sure that the analysis data is reported to the right
SQPFactor and to the right analysis performer.
Table 42 contains the schema of the AnalysisPerformer table. The AnalysisPerformer
table contains the information of the analysis tools used to evaluate different SPQFactor
values. The Google’s Testability Explorer analysing tool and a software quality
evaluation team are examples of the entities of this table. This information can be used
later on to create reports that tell which analysis tools were used in some particular
measurement. The PerformerWeight is an optional emphasis factor that can be used to
adjust the weight effect of this tool when its analysis results are combined.
Table 43 contains the schema of the AnalysisType table. The AnalysisType is an
optional table for typing the analysis performer. This table can be used to separate
things like dynamic or static analysing; and manual or automatic analysing.
Table 42. Schema of the AnalysisPerformer table.
Column Datatype Required Description
idAnalysisPerformer INT Yes Unique auto-id for the analysis performer entity
Name VARCHAR(64) Yes Name of the analysis performer
Version VARCHAR(32) No Optional. Version of the analysis performer
Description VARCHAR(128) No Optional. Description of the analysis performer
idAnalysisType INT No Optional. The type of the analysis performer
PerformerWeight DECIMAL No Optional. Factor to adjust the emphasis of this entity
Table 43. Schema of the AnalysisType table.
Column Datatype Required Description idAnalysisType INT Yes Unique auto-id for the analysis type entity Name VARCHAR(32) Yes Name of the analysis type Description VARCHAR(128) No Optional. Description of the analysis type
TAMK University of Applied Sciences 73 (77) Degree Programme in Information Technology, Master's Degree Mika Immonen
6 Conclusions
Over the years the software products have grown bigger in size and complexity, and
that has raised the need for a good software quality assurance. To be able to provide a
sufficient level of software quality, different software quality assurance processes must
be in place. Unfortunately, these quality processes do not often take into account the
quality of the actual software product itself.
This led to the subject of this master’s thesis, Tieto SPQ (Software Product Quality)
analysis system. The work in this master’s thesis was done in two parts. Firstly, the
software quality was studied using software literature and the ISO/IEC 9126 and the
ISO/IEC 25000 family of standards. Secondly, the overall architecture of Tieto SPQ
analysis system was designed. One can say that this master’s thesis serves as an
architecture specification for Tieto SPQ analysis system. All the necessary system
services and components were introduced; and the concept of software product quality
model was defined.
Although the overall architecture for Tieto SPQ analysis system is now defined, the
final implementation of the system has not started yet. It was decided that the actual
implementation phases would start after this system specification phase is complete.
The next step would be to start different development phases where all system
components will be implemented and put to work. This could be done in a separate
project or by using competence development paths of Tieto personnel. This would mean
that each of the system components is implemented by one or more of Tieto employee
as part of their career development exercises.
When Tieto SPQ analysis system has been implemented and it is running with several
projects, one big challenge is to find correct analysis tools for all different SPQFactors
provided by the system. The evaluation of the analysis tools could be done by few
preselected projects from different software fields. These projects should be used to
identify which analysis tools are mature enough for Tieto SPQ analysis system.

TAMK University of Applied Sciences 74 (77) Degree Programme in Information Technology, Master's Degree Mika Immonen
The database defined in this master’s thesis is a very theoretical one because of the lack
of real-life analyses data. It can be used for storing the analyses results for different
SPQFactors but could still need some adjusting when the final system is implemented.
The lack of real-life analysis data also means that in order to supply sufficient amount
of reasonable reports to the end users, the analyses have to be executed for some period
of time before the data accuracy becomes feasible. The fine-tuning of the different
emphasis factors probably takes time too, perhaps one to two year. This is something
that has to be taken into account before Tieto SPQ analysis system is considered to be
provided to external customers of Tieto ETB.
One possibility to decrease the time to market of Tieto SPQ analysis system would be to
use some existing analysis softwares that already would contain multiple analysis tools
to validate different SPQFactors of the used software product quality model. Finding
and validating these existing systems would require once again another evaluation
phase but in the end it could save time compared to the situation where each of the
analysis tools is evaluated separately.
Some of the SPQFactors from the ISO/IEC 9126 and the ISO/IEC 25000 standards will
require the usage of evaluation teams. They cannot be simply measured automatically
by an analysis tool; instead, they require human interaction in order to be validated.
This process was recognised in this master’s thesis but the actual process still needs to
be defined in detail. This is part of the detailed definition of the Quality Consultation
Service (QCS).
There exist tremendous possibilities in the concept of Tieto SPQ analysis system,
especially because it is designed not only for the statical analyses tools but also to
support the usage of evaluation teams. It would stand out from other analysis systems
because it would support concepts from the ISO/IEC 9126 and the ISO/IEC 25000
standards. A lot of issues were covered during this master’s thesis but a lot of work is
still required before the system is up and running completely. In order to make Tieto
SPQ analysis system compelling and competitive against other analysis system, the
implementation and data collecting phases should be started as soon as possible.
TAMK University of Applied Sciences 75 (77) Degree Programme in Information Technology, Master's Degree Mika Immonen
References
Books, articles and web pages Ioannis G. Stamelos, and Panagiotis Sfetsos, 2007. Agile Software Development
Quality Assurance, Information Science Reference.
Kan, H. Stephen, 2002. Metrics and Models in Software Quality Engineering, Second
Edition. Addisson Wesley.
Tian, Jeff, 2005, Software Quality Engineering – Testing, Quality Assurance, and
Quantifiable Improvement, John Wiley & Sons, Inc.
Lee, T. Alice, Gunn Todd, Pham Tuan and Ricaldi Ron, 1994. Technical Memorandum
104799: Software Analysis Handbook - Software Complexity Analysis
and Software Reliability Estimation and Prediction [pdf-file].
[referred to 09.06.2009] Available:
http://ston.jsc.nasa.gov/collections/TRS/_techrep/TM-1994-104799.pdf
M. El Wakil, A. El Bastawissi, M. Boshra, and A. Fahmy, 2nd International Conference
on Informatics and Systems (INFOS04), 2004. Object-Oriented Design
Quality Models – A Survey and Comparison. [pdf-file].
[referred to 09.10.2009] Available:
http://homepages.wmich.edu/~m5elwakil/INFOS04_ElWakil.pdf
Laing Victor, Coleman Charles, Manager, SATC, 2001. Principal Components of
Orthogonal Object-Oriented Metrics (323-08-14),
White Paper Analyzing Results of NASA Object-Oriented Data. [pdf-
file].
[referred to 10.10.2009] Available:
http://satc.gsfc.nasa.gov/support/OSMASAS_SEP01/Principal_Componen
ts_of_Orthogonal_Object_Oriented_Metrics.pdf
Dr. Rosenberg, Linda H., Unisys Goverment Systems; Hyatt, Lawrence E., Software
Assurance Technology Center. 1996. Unisys Technology Conference.
Software Quality Metrics for Object-Oriented Environments. [pdf-file].

TAMK University of Applied Sciences 76 (77) Degree Programme in Information Technology, Master's Degree Mika Immonen
[referred to 10.10.2009] Available:
http://satc.gsfc.nasa.gov/support/CROSS_APR97/oocross.PDF
Bansiya Jagdish, Davis Carl G. , 2002 , A Hierarchical Model for Object-Oriented
DesignvQuality Assessment, IEEE Transactions on Software Engineering,
vol. 28, No. 1, January 2002.
Dr. Rosenberg, Linda H., Software Assurance Technology Center. 1998. Software
Technology Conference. Applying and Interpreting Object-Oriented
Metrics. [pdf-file].
[referred to 10.10.2009] Available:
http://satc.gsfc.nasa.gov/support/STC_APR98/apply_oo/apply.pdf
MySQL 5.0 Reference Manual, 10 Datatypes, 10.4 String Types, 10.4.1 - The CHAR
and VARCHAR Types. [Online]
[referred to 19.10.2009] Available:
http://dev.mysql.com/doc/refman/5.0/en/char.html

TAMK University of Applied Sciences 77 (77) Degree Programme in Information Technology, Master's Degree Mika Immonen
Standards ISO/IEC 9126-1:2000, ISO/IEC FDIS 9126-1:2000(E), Software engineering - Product
quality - Part 1: Quality model
ISO/IEC 9126-2:2001, ISO/IEC JTC1/SC7 N2419 9126-2, 17.01.2001, DTR 9126-2:
Software Engineering - Product Quality Part 2 - External Metrics
ISO/IEC 9126-3:2001, ISO/IEC JTC1/SC7 N2416 9126-3, 16.01.2001, DTR 9126-3:
Software Engineering - Product Quality Part 3 - Internal Metrics
ISO/IEC 9126-4:2001, ISO/IEC JTC1/SC7 N2430 9126-4, 02.02.2001, DTR 9126-4:
Software Engineering – Software Product Quality - Part 4: Quality In Use Metrics
ISO/IEC 25000:2005, ISO/IEC JTC1/SC7 N3163, FCD 25000 - Software Engineering
- Software product Quality Requirements and Evaluation (SQuaRE) - Guide to
SQuaRE.
ISO/IEC 25010:2009, ISO/IEC JTC1/SC7 N4231, 17.02.2009 , CD 25010.3, Software
engineering -Software product Quality Requirements and Evaluation (SQuaRE) Quality
model
Tieto’s internal materials Nevalainen, Risto. 2009. Senior Advisor, e-mail message 2.3.2009, FISMA (Finnish
Software Measurement Association), process management theme group, ISO
standardisation.
Aaltonen, Juha, Software Engineer. Koivu, Vesa, Information Solutions Manager. 2009.
ETB Technical overview.ppt, PowerPoint presentation 3.6.2009.
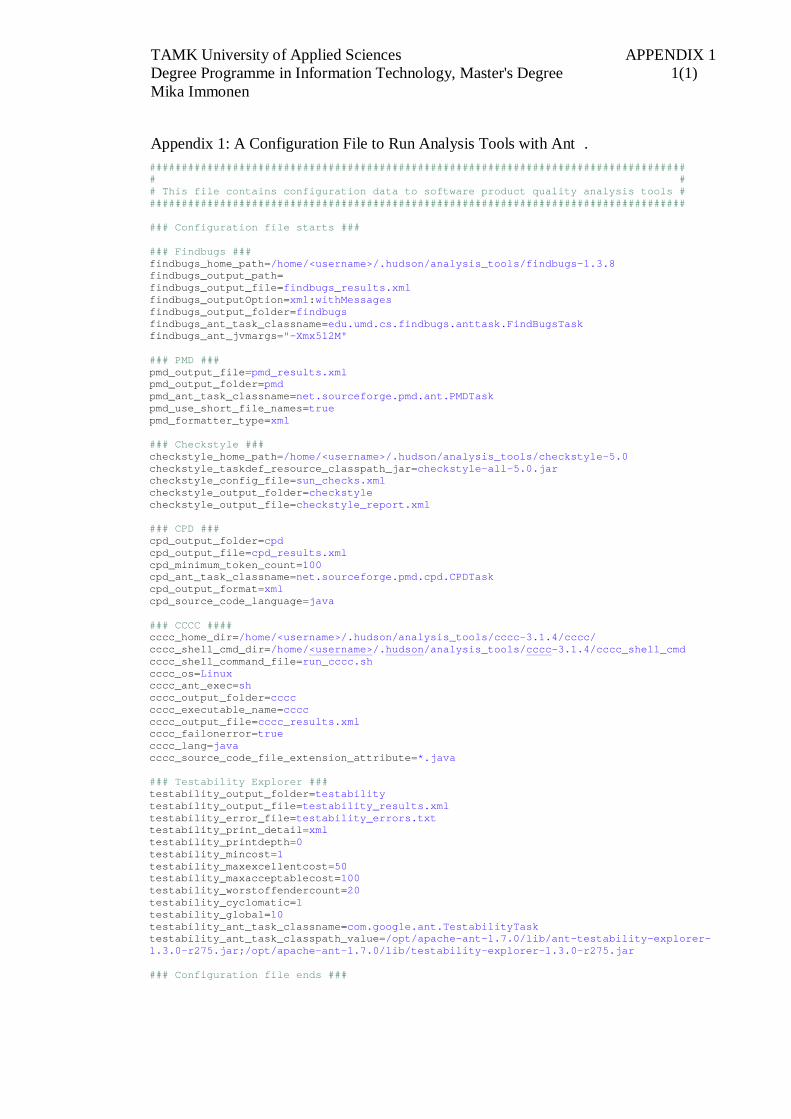
TAMK University of Applied Sciences APPENDIX 1 Degree Programme in Information Technology, Master's Degree 1(1) Mika Immonen
Appendix 1: A Configuration File to Run Analysis Tools with Ant . #################################################################################### # # # This file contains configuration data to software product quality analysis tools # #################################################################################### ### Configuration file starts ### ### Findbugs ### findbugs_home_path=/home/<username>/.hudson/analysis_tools/findbugs-1.3.8 findbugs_output_path= findbugs_output_file=findbugs_results.xml findbugs_outputOption=xml:withMessages findbugs_output_folder=findbugs findbugs_ant_task_classname=edu.umd.cs.findbugs.anttask.FindBugsTask findbugs_ant_jvmargs="-Xmx512M" ### PMD ### pmd_output_file=pmd_results.xml pmd_output_folder=pmd pmd_ant_task_classname=net.sourceforge.pmd.ant.PMDTask pmd_use_short_file_names=true pmd_formatter_type=xml ### Checkstyle ### checkstyle_home_path=/home/<username>/.hudson/analysis_tools/checkstyle-5.0 checkstyle_taskdef_resource_classpath_jar=checkstyle-all-5.0.jar checkstyle_config_file=sun_checks.xml checkstyle_output_folder=checkstyle checkstyle_output_file=checkstyle_report.xml ### CPD ### cpd_output_folder=cpd cpd_output_file=cpd_results.xml cpd_minimum_token_count=100 cpd_ant_task_classname=net.sourceforge.pmd.cpd.CPDTask cpd_output_format=xml cpd_source_code_language=java ### CCCC #### cccc_home_dir=/home/<username>/.hudson/analysis_tools/cccc-3.1.4/cccc/ cccc_shell_cmd_dir=/home/<username>/.hudson/analysis_tools/cccc-3.1.4/cccc_shell_cmd cccc_shell_command_file=run_cccc.sh cccc_os=Linux cccc_ant_exec=sh cccc_output_folder=cccc cccc_executable_name=cccc cccc_output_file=cccc_results.xml cccc_failonerror=true cccc_lang=java cccc_source_code_file_extension_attribute=*.java ### Testability Explorer ### testability_output_folder=testability testability_output_file=testability_results.xml testability_error_file=testability_errors.txt testability_print_detail=xml testability_printdepth=0 testability_mincost=1 testability_maxexcellentcost=50 testability_maxacceptablecost=100 testability_worstoffendercount=20 testability_cyclomatic=1 testability_global=10 testability_ant_task_classname=com.google.ant.TestabilityTask testability_ant_task_classpath_value=/opt/apache-ant-1.7.0/lib/ant-testability-explorer-1.3.0-r275.jar;/opt/apache-ant-1.7.0/lib/testability-explorer-1.3.0-r275.jar ### Configuration file ends ###

TAMK University of Applied Sciences APPENDIX 2 Degree Programme in Information Technology, Master's Degree 1(4) Mika Immonen
continued
Appendix 2: A Launch File to Run Analysis Tools with Ant. <?xml version="1.0" encoding="UTF-8"?> <!-- PURPOSE: ======== This file contains tool Ant task configurations for software product quality analysis. Currently supported analysis tools are Findbugs (http://findbugs.sourceforge.net/manual/introduction.html): ==================================================================== FindBugs™ is a program to find bugs in Java programs. It looks for instances of "bug patterns" code instances that are likely to be errors. PDM (http://pmd.sourceforge.net/): ================================== PMD scans Java source code and looks for potential problems like: * Possible bugs - empty try/catch/finally/switch statements * Dead code - unused local variables, parameters and private methods * Suboptimal code - wasteful String/StringBuffer usage * Overcomplicated expressions - unnecessary if statements, for loops that could be while loops * Duplicate code - copied/pasted code means copied/pasted bugs . Checkstyle (http://wiki.hudson-ci.org/display/HUDSON/Checkstyle+Plugin): ======================================================================== The Checkstyle plug-in scans for checkstyle-result.xml files in the build workspace and reports the number of warnings found. CPD(http://pmd.sourceforge.net/cpd.html): ========================================= CPD is part of the PMD tool. CPD stands for Copy-Paste-Detector and it can be used to check duplicate code block from the source. CCCC (http://wiki.hudson-ci.org/display/HUDSON/CCCC+Plugin): ============================================================ CCCC is a tool which analyzes C++ and Java files and generates a report on various metrics of the code. Metrics supported include lines of code, McCabe's complexity and metrics proposed by Chidamber&Kemerer and Henry&Kafura. Testability Explorer (http://wiki.hudson-ci.org//display/HUDSON/Testability+Explorer+Plugin): ================================================================================== Testability Explorer is an open-source tool that identifies hard-to-test Java code. Testability Explorer provides a repeatable objective metric of "testability." This metric becomes a key component of engineering a social change within an organization of developers. The Testability Explorer report provides actionable information to developers which can be used as measure of progress towards a goal and a guide to refactoring towards a more testable code-base. Further information can be found: http://googletesting.blogspot.com/2008/10/testability-explorer-measuring.html HOW TO CONFIGURATE: =================== Add each new tool as own target and then call them from run_software_product_quality_analysis target. The common analysis tool configuration data is read from software_product_quality_analysis_tools.properties file --> <project name="Software Product Quality Analysis Tools Package for ETB Linux Build" default="run_software_product_quality_analysis"> <!-- ========================================================================== --> <!-- Used property file(s) --> <!-- ========================================================================== --> <property file="software_product_quality_analysis_tools.properties"/>

TAMK University of Applied Sciences APPENDIX 2 Degree Programme in Information Technology, Master's Degree 2(4) Mika Immonen
continued
<!-- ========================================================================== --> <!-- Other default values --> <!-- ========================================================================== --> <property name="quality_analysis_results_dir" value="${env.WORKSPACE}/quality_analysis_results"/> <property name="quality_analysis_binaries_dir" value="${quality_analysis_results_dir}/binaries"/> <!-- ========================================================================== --> <!-- Scanned source files --> <!-- ========================================================================== --> <fileset id="product_plugin_source_files" dir="${product_plugin_dist_root}/src/"> <include name="**/*.java"/> </fileset> <!-- ========================================================================== --> <!-- Run software quality analysis tools --> <!-- ========================================================================== --> <target name="run_software_product_quality_analysis"> <echo>Initializing directory structure...</echo> <mkdir dir="${quality_analysis_results_dir}"/> <mkdir dir="${quality_analysis_binaries_dir}"/> <echo>Copying binaries to analyse...</echo> <copy todir="${quality_analysis_binaries_dir}" failonerror="true" overwrite="true"> <fileset dir="${product_binaries} /"> <include name="*.jar"/> </fileset> </copy> <echo>Starting FindBugs analysis...</echo> <antcall target="findbugs"/> <echo>Starting PMD analysis...</echo> <antcall target="pmd"/> <echo>Starting Checkstyle analysis...</echo> <antcall target="checkstyle"/> <echo>Starting CPD analysis...</echo> <antcall target="cpd"/> <echo>Starting CCCC analysis...</echo> <antcall target="cccc"/> <echo>Starting Testability Explorer analysis...</echo> <antcall target="testability_explorer"/> </target> <!-- ========================================================================== --> <!-- FindBugs analysis --> <!-- ========================================================================== --> <target name="findbugs"> <taskdef name="findbugs" classname="${findbugs_ant_task_classname}"/> <property name="findbugs.home" value="${findbugs_home_path}" /> <mkdir dir="${quality_analysis_results_dir}/${findbugs_output_folder}/"/> <findbugs home="${findbugs.home}" jvmargs="${findbugs_ant_jvmargs}" output="${findbugs_outputOption}" outputFile="${quality_analysis_results_dir}/${findbugs_output_folder}/ ${findbugs_output_file}" > <sourcePath path="${product_plugin_dist_root}/src/"/> <class location="${quality_analysis_binaries_dir}/${product_pluginID}_ ${product_version}.jar" /> </findbugs> </target>

TAMK University of Applied Sciences APPENDIX 2 Degree Programme in Information Technology, Master's Degree 3(4) Mika Immonen
continued
<!-- ========================================================================== --> <!-- PMD analysis --> <!-- ========================================================================== --> <target name="pmd"> <taskdef name="pmd" classname="${pmd_ant_task_classname}"/> <mkdir dir="${quality_analysis_results_dir}/${pmd_output_folder}/"/> <pmd shortFilenames="${pmd_use_short_file_names}"> <ruleset>rulesets/favorites.xml</ruleset> <ruleset>basic</ruleset> <formatter type="${pmd_formatter_type}" toFile="${quality_analysis_results_dir}/${pmd_output_folder}/ ${pmd_output_file}"/> <fileset refid="product_plugin_source_files"/> </pmd> </target> <!-- ========================================================================== --> <!-- Checkstyle analysis --> <!-- ========================================================================== --> <target name="checkstyle"> <taskdef resource="checkstyletask.properties" classpath="${checkstyle_home_path}/ ${checkstyle_taskdef_resource_classpath_jar}"/> <mkdir dir="${quality_analysis_results_dir}/${checkstyle_output_folder}/"/> <checkstyle config="${checkstyle_home_path}/${checkstyle_config_file}" failureProperty="checkstyle.failure" failOnViolation="false"> <formatter type="xml" tofile="${quality_analysis_results_dir}/${checkstyle_output_folder}/ ${checkstyle_output_file}"/> <fileset refid="product_plugin_source_files"/> </checkstyle> <!-- <style in="checkstyle_report.xml" out="checkstyle_report.html" style="checkstyle.xsl"/> --> </target> <!-- ========================================================================== --> <!-- CPD(Copy-Paste-Detector) analysis --> <!-- ========================================================================== --> <target name="cpd"> <mkdir dir="${quality_analysis_results_dir}/${cpd_output_folder}/"/> <taskdef name="cpd" classname="${cpd_ant_task_classname}" /> <cpd minimumTokenCount="${cpd_minimum_token_count}" language="${cpd_source_code_language}" format="${cpd_output_format}" outputFile="${env.WORKSPACE}/quality_analysis_results/cpd/cpd_results.xml"> <fileset refid="product_plugin_source_files"/> </cpd> </target>

TAMK University of Applied Sciences APPENDIX 2 Degree Programme in Information Technology, Master's Degree 4(4) Mika Immonen
<!-- ========================================================================== --> <!-- CCCC analysis --> <!-- ========================================================================== --> <target name="cccc"> <mkdir dir="${quality_analysis_results_dir}/${cccc_output_folder}/"/> <copy todir="${quality_analysis_results_dir}/${cccc_output_folder}" failonerror="${cccc_failonerror}" overwrite="true"> <fileset dir="${cccc_shell_cmd_dir}"> <include name="${cccc_shell_command_file}"/> </fileset> </copy> <exec dir="${cccc_home_dir}/${cccc_shell_cmd_dir}" executable="${cccc_ant_exec}" os="${cccc_os}" failonerror="${cccc_failonerror}"> <arg value="${cccc_shell_command_file}"/> <arg value="${env.WORKSPACE}"/> <arg value="${cccc_source_code_file_extension_attribute}"/> <arg value="${cccc_home_dir}/${cccc_executable_name}"/> <arg value="${cccc_output_file}"/> <arg value="${cccc_lang}"/> </exec> </target> <!-- ========================================================================== --> <!-- Testability Explorer analysis --> <!-- ========================================================================== --> <target name="testability_explorer"> <mkdir dir="${quality_analysis_results_dir}/${testability_output_folder}/"/> <taskdef name="testability" classname="${testability_ant_task_classname}" classpath="${testability_ant_task_classpath_value}"/> <testability filter="" resultfile="${quality_analysis_results_dir}/ ${testability_output_folder}/${testability_output_file}" errorfile="${quality_analysis_results_dir}/ ${testability_output_folder}/${testability_error_file}" printdepth="${testability_printdepth}" print="${testability_print_detail}" mincost="${testability_mincost}" maxexcellentcost="${testability_maxexcellentcost}" maxacceptablecost="${testability_maxacceptablecost}" worstoffendercount="${testability_worstoffendercount}" cyclomatic="${testability_cyclomatic}" global="${testability_global}" whitelist="eclipse*"> <classpath> <fileset dir="${quality_analysis_binaries_dir}"> <include name="${product_pluginID}_${product_version}.jar"/> </fileset> </classpath> </testability> </target> </project>

TAMK University of Applied Sciences APPENDIX 3 Degree Programme in Information Technology, Master's Degree 1(1) Mika Immonen
Appendix 3: The Database Schema for the Software Product Qualty Analysis System.