Embed Size (px)
Citation preview
TIDES OFCHANGE
CIC HOLDINGS PLC ANNUAL REPORT 2020/21
CIC HOLDINGS PLCANNUAL REPORT 2020/21


The unprecedented challenges of the COVID-19 pandemic affected a wide range of industries and businesses across the world— putting to test the strengths and capabilities of even the most powerful business entities.
Successfully adopting a pragmatic approach in order to overcome the obstacles the last year imposed, CIC was able to embark on a new growth
trajectory and adopt a business model which continued to nurture its innumerable stakeholders through steadfast trust. The collective efforts
of the Group’s dynamic team not only improved the Company’s versatility to adapt within a changing market, but also continued to strengthen and
establish resilience and agility across all key sectors.
Today, as we welcome a new year, your Company is confident that together, we will be able to overcome the challenges that tomorrow may bring.
TIDES OFCHANGE

CIC HOLDINGS PLC Annual Report 2020/212
CONTENTS
OVERVIEW
Strategic Business Units 04
Financial & Operational Highlights 05
EXECUTIVE REPORTS
Chairman’s Statement 06
Board of Directors 10
GOVERNANCE
Corporate Governance 14
Audit Committee Report 18
Report of the Human Capital & Compensation Committee 19
Nominations Committee Report 20
Related Party Transaction Review Committee 21
Board of Directors’ Statement on Internal Controls 22
MANAGEMENT DISCUSSION AND ANALYSIS
Agri Produce 25
Livestock Solutions 27
Health & Personal Care 29
Industrial Solutions 31
Crop Solutions 33
FINANCIAL REPORTS
Annual Report of the Directors on the Affairs of the Company 36
Directors’ Responsibility for Financial Reporting 41
Chief Operating Officer’s and Chief Financial Officer’s Responsibility Statement 42
Independent Auditor’s Report 43
Statement of Profit or Loss and Other Comprehensive Income 46
Statement of Financial Position 47
Statement of Changes in Equity 49
Statement of Cash Flow 51
Notes to the Financial Statements 53
ANNEXURES
Shareholders & Investors Information 128
Movement in Issued Capital and Dividend Distribution 132
Subsidiaries and Equity Accounted Investees 134
Ten Year Group Performance 136
Notice of Meeting 140
Form of Proxy, Annual General Meeting 141
Form of Proxy, Annual General Meeting(Non-Voting (Class X) Shares) 143

3TIDES OF CHANGE
VALUES
To be the most respected and admiredcorporate for the positive impact we make onsociety by nurturing the lives of those we touch.
Harnessing science and modern technology, wewill provide solutions of superior quality whichare efficient and safe. We will build rewardingand lasting relationships with our stakeholdersand be a significant entity in every sector we operate.
VISION
MISSION
OWNERSHIP &ACCOUNTABILITYTHIS IS MY BUSINESS AND I TAKE RESPONSIBILITY FOR MY PROMISES AND ACTIONS.
TEAMWORK & TRUSTWE RELY ON EACH OTHER TOUNLEASH THE POWER OF WORKING TOGETHER.
INTEGRITY & RESPECT HONESTY AND TRUTH AREPARAMOUNT; WE RESPECT THE LAW AND EACH OTHER.
ENTREPRENEURIAL &INNOVATIVEWE WILL CONSTANTLY CHALLENGE BOUNDARIES SEEKING NEW HORIZONS.
CUSTOMER FOCUS &QUALITYTHE CUSTOMER COMES FIRST; WE WILL NOT COMPROMISE ON THE STANDARDS OF OUR PRODUCTS AND SERVICES.
BIAS FOR ACTION ANDWINNING SPIRITNO STONE WILL BE LEFT UNTURNED IN THE PURSUIT OF OUR GOALS.

CIC HOLDINGS PLC Annual Report 2020/214
STRATEGICBUSINESS UNITS
• Agri produce retail chain• Agri resort• Dairy• Farms• Fruits and vegetables• Grains• Rice
• Feeds• Poultry• Vetcare• Dairy breeding
• Lawn and garden• Plant nutrition• Plant protection• Seeds
• Herbal care• Medical devices• Personal care• Pharmaceuticals
• Construction material• Industrial raw material• Packaging
“The ‘starburst’ symbol depicts both the convergence of CIC’s various business entities towards one common purpose, which is ‘Nurturing Life’, and divergent positive impact of these businesses in their respective sectors.”
Agri Produce
Livestock Solutions
Crop Solutions
Health and Personal Care
Industrial Solutions

5TIDES OF CHANGE
FINANCIAL &OPERATIONAL HIGHLIGHTS
GroupFor the year ended 31st March 2021 2020
Earning Highlights and RatiosGroup revenue Rs. ‘000 37,233,343 30,535,563 Group profit before interest and tax Rs. ‘000 5,393,707 3,186,802 Income tax expense Rs. ‘000 (975,188) (535,997)Profit for the year from continuing operations Rs. ‘000 3,936,864 1,336,135 Profit/(loss) for the year from discontinued operations Rs. ‘000 (90,771) (256,735)Other comprehensive income Rs. ‘000 1,391,641 (445,674)Total comprehensive income Rs. ‘000 5,237,734 633,726 Profit attributable to equity holders of the Company Rs. ‘000 3,132,411 832,584 Dividend paid Rs. ‘000 473,850 189,540 Basic/Diluted earnings per share Rs. 8.26 2.20 Interest cover Number of times 6.18 2.10 Return on equity % 24 9 Return on assets % 13 2 Pre-tax return on capital employed % 22 12
Statement of Financial Position - Highlights and RatiosTotal assets Rs. ‘000 40,031,179 39,268,872 Total equity Rs. ‘000 16,302,987 11,711,748 Total debts Rs. ‘000 9,841,004 17,101,221 Equity attributable to equity holders of the Company Rs. ‘000 13,224,467 9,575,528 Number of shares in issue Number 379,080,000 94,770,000 Net assets per share Rs. 34.89 25.26 Debt/Equity % 60.36 146.02 Debt/Total assets % 24.58 43.55
Market/Shareholder Information Market price per share as at 31st March Ordinary Rs. 50.90 35.00 Non-Voting (Class X ) Rs. 42.40 28.90 Dividend per share Interim paid Rs. 1.00 0.25 Second interim paid Rs. - 0.25 Final proposed Rs. 1.25 - Market capitalisation Rs. Mn 18,552 3,184 Float adjusted market capitalisation Rs. Mn 10,490 1,797 Price earnings ratio Ordinary Number of times 6.16 15.94 Non-Voting (Class X) Number of times 5.13 13.16
Other Information Total employees Number 2,137 2,088 Revenue per employee Rs. ‘000 17,423 14,624 Total value addition to employees Rs. ‘000 2,292,297 2,169,540 Value addition to lenders of the capital Rs. ‘000 1,799,035 2,247,042 Total taxes paid to Government Rs. ‘000 1,057,815 1,238,079

CIC HOLDINGS PLC Annual Report 2020/216
CIC Group recorded a stellar performance for the year under review notwithstanding continued economic headwinds and the devastating impact of the unprecedented COVID-19 pandemic.
I am pleased to report that the CIC Group recorded a stellar performance for the year under review notwithstanding continued economic headwinds and the devastating impact of the unprecedented COVID-19 pandemic. The Group tabled its best ever profit after tax of Rs.3,846Mn in the year under review, reflecting an impressive two-fold year on year growth, a significant 256% increase of PAT over the Rs. 1,079Mn registered in the previous financial year. Marking yet another outstanding achievement, the Group declared Rs.853Mn as dividend to its shareholders in the current financial year, which is the highest ever return to be distributed to shareholders by CIC in its 57 year history. It is noteworthy that this dividend figure of Rs. 853Mn for the FY2020/21 denotes a remarkable 348% increase over the dividend declared the year before.
CHAIRMAN’SSTATEMENT
S.H. AmarasekeraChairman

7TIDES OF CHANGE
Marking yet another outstanding achievement, the Group declared Rs.853Mn as dividend to its shareholders in the current financial year, which is the highest ever return to be distributed to shareholders by CIC in its 57-year history.
I am confident that it was the hard yet necessary strategic decisions taken by the Management over the past two years that made a material difference to our ability to not only weather this storm, but to be amongst those who have produced outstanding results in these most turbulent of times. It is therefore with a deep sense of satisfaction that I present to you the Annual Report and Financial Statements of CIC Holdings PLC for the year ending 31st March 2021.
While the Q1 results across all five clusters could have been affected by the 2-month island-wide lockdown imposed by the
Government as part of its COVID control strategy, timely action taken enabled the CIC group to post a record breaking Q1 performance in the FY 2020/21. Equally strong performances were reported across all businesses for the rest of the financial year as well, as each cluster swiftly acclimatised themselves to the situation.
The Crop Solutions cluster taken together with our Agri Businesses having benefited largely by gaining share from the heightened demand for agricultural input throughout the year, recorded strong performances in the year under review. The Government’s drive to promote agriculture resulted in the demand for agricultural inputs rising to an all time high. The Health and Personal care segment also declared exceptional results thereby contributing significantly towards the Groups’ overall performance. I am very pleased to report that the Personal Care segment represented by Link Naturals continues to make strong headway in overseas markets.
Both the Agri Produce and Livestock clusters, after experiencing some initial setbacks at the onset of the lockdown, recovered well in order to conclude the year with satisfactory results which were a significant improvement on the results during the last financial year. It is also very encouraging to see that the Industrial Solutions cluster showing signs of recovery
towards early 2021, after remaining under stress for a considerable part of the current financial year.
LIVING UP TO OUR CORE VALUESAs COVID-19 reached pandemic status, it became apparent that 2020 would be a year unlike any other. Recognising the potential opportunities available, the CIC Group wasted no time in adapting to the fast- changing economic climate and re-aligning itself in order to tackle the challenges head on.
Thrust into the midst of an unprecedented national lockdown, our first priority was the safety of our staff and to keep our factories and distribution infrastructure up and running so as to ensure our products reached end users without delay. Thanks to the herculean efforts of our teams along with the support of the regulatory authorities including the Sri Lanka Police, CIC was able to operate most of its production facilities and mobilise its logistics infrastructure from the onset of the lockdown.
Operations at our Blending Plant at Peliyagoda and re-packing plant at Godagama resumed in early April 2020, albeit with limited staff and a restricted distributor network enabling CIC to provide farmers with essential Agri inputs required for cultivation during the lockdown period. Similarly, by rescheduling our transport networks, we were able to maintain an uninterrupted distribution of healthcare products to hospitals and pharmacies throughout this period.
At a time when many industries were compelled to remain shut, CIC, with the aid of the regulatory authorities obtained the necessary approvals required to run its Dairy Products manufacturing plant in Dambulla, in order that we could continue to accept daily milk supplies and thereby safeguard the livelihoods of our farmer / outgrower networks based in the North Central Province.
Similarly, CIC also secured special permission to operate the feed mill and poultry farm in Ekala and Badalgama continued with
PROFIT AFTER TAX
Rs. 3,846 MnPAT INCREASE
256%

CIC HOLDINGS PLC Annual Report 2020/218
CHAIRMAN’S STATEMENT
farming activities at CIC’s three seed farms at Dambulla, Hingurakgoda and Talawa, all with the intention of addressing rising concerns regarding food security. Experimenting with new and innovative ways to make our products more accessible, our Fresheez outlets pursued strategic collaborations in order to deliver much needed fresh fruits, vegetables and other essential items directly to consumer homes during times of curfew.
Prioritising the health and safety of our employees from the very inception of the pandemic, CIC has at all times taken the necessary steps to implement recommended health guidelines in order to ensure the safety of our very own “frontliners”, the manufacturing and distribution teams returning to work during the lockdown. Moreover, we were able to implement the work from home model within a few days of the lockdown being declared in March 2020 and provide all our administrative employees with the necessary resources required to carry on with business as usual. The financial security of our people was also a priority and it was made clear that staff would not be subject to pay cuts or retrenchments despite the challenges posed to business. All bonus entitlements attributed to the previous performance cycle were also paid in full.
EXCEEDING SHAREHOLDER EXPECTATIONSAs mentioned at the commencement of my report, CIC declared its highest ever dividend payout in the year under review totaling Rs.853Million, which also marks a 349% jump over the dividend payout in the preceding year.
During the year under review, CIC effected a share split without altering its stated capital. Following the 1:4 share split, the 94,770,000 shares at the commencement of the financial year increased to 379,080,000 shares as at 31st March 2021. The aforesaid split was considered and approved by the Board in order to make the share more liquid thereby enhancing the overall value to our shareholders and also to permit more investors to acquire shares in CIC.
CIC will continue to be mindful of the liquidity of its share in order that all investors will view the share as an attractive investment option. In this context, the CIC Group reiterates its commitment to maintain an equitable distribution of profits to shareholders taking into account the economic climate of the Country, the financial performance of the Group as well as its investment needs.
GEARING UP FOR THE FUTURE While dealing with the trials and tribulations of 2020, CIC did not lose sight of the importance of reinforcing its foundations to support the Group’s future growth trajectory.
To that end, the Board spent a considerable period of time this past year re-examining and strengthening governance processes throughout the Group.
In a bid to improve the skill matrix at Board level, we were also pleased to welcome Mr. Sujeewa Mudalige and Mr. Jit Gunaratne to the CIC Holdings PLC Board, with effect from 16th October 2020 and 06th January 2021 respectively. Sujeewa, as an experienced finance professional and Jit, a seasoned marketing professional with many years expertise in their respective disciplines, bring strong perspectives and new insights that will no doubt enrich the quality of the Group Board. With these new appointments, I am confident that CIC Board collectively has the requisite expertise and experience to support and challenge our management teams as they strive to take the Group forward.
LOOKING AHEADAfter performing exceedingly well in what has been an extraordinarily challenging year, the CIC Group is in a strong position for growth. All our clusters the Agri produce, Crop Solutions, Livestock, Industrial Solutions as well as the Health and Personal Care are all well placed in their respective market spheres. This gives them the ability to leverage their strong portfolio of brands and island wide distribution network to grow captive markets share while aggressively promoting export products in their respective overseas markets.
Recognising the potential opportunities available, the CIC Group wasted no time in adapting to the fast- changing economic climate and re- aligning itself in order to tackle the challenges head on. Thrust into the midst of an unprecedented national lockdown, our first priority was the safety of our staff and to keep our factories and distribution infrastructure up and running so as to ensure our products reached end users without delay.

9TIDES OF CHANGE
That said, the recent announcement by the Government declaring its policy of promoting organic fertilizer and other inputs which went hand in hand with the decision to ban the import of Chemical Fertilizer and Agrochemicals may have an impact on the financial performance of our Crop Solutions Cluster. However, I am pleased to report that the preemptive measures we have taken in the recent past to strengthen our capacity in the organic fertilizer area puts CIC ahead of the game. Having already ventured into the manufacture and distribution of organic fertilizer, albeit on a small scale, we will now ramp up production in order to align with Government policy and will strive to do our utmost best to further support this Government initiative.
I expect the Agri Produce and Livestock clusters to continue their growth momentum in the coming months. Similarly, I am very confident that the herbal healthcare segment under Link Naturals too would continue making further inroads into the local market while building on its recent success in export markets.
Meanwhile even as the recent third wave of the pandemic has brought fresh worries regarding its impact on the economy and on businesses, I am nevertheless very optimistic for the future of the CIC Group. Given our diversified portfolio of businesses each with strong positions in key sectors of the economy, there are many clear opportunities for growth.
APPRECIATIONSIt has been a very challenging year and our ability to stay resilient is in no small part due to the steadfast support that CIC has received from my colleagues on the Board.
I wish to take this opportunity to thank each and every one of you for your guidance and wise counsel.
As a Board, we are deeply grateful to our leaders and their teams across the Group. The spirit in which they came together in far from ideal conditions, was without a doubt the reason why the CIC Group was able to continue with its operations despite restrictions.
I must also acknowledge that all what we achieved this past year would not have been possible had it not been for the leadership and judgement shown by our Executive Team. Their quick and commendable decision making have been nothing short of remarkable and I am sure they will emerge from this experience having learned many valuable lessons which would auger well for the Group in the future.
I am also greatly indebted to the regulatory bodies, health authorities, tri-forces and other personnel who helped in battling the spread of the COVID-19 virus and working towards the safety of the people.
On behalf of the Board, I would finally like to extend our deep appreciation to our valued customers, shareholders, and strategic business partners for always supporting the Group’s endeavours. We will ensure that the Group continues not only to meet but strive to exceed your expectations in the years to come.
S. H. AmarasekeraChairman
21st May 2021

CIC HOLDINGS PLC Annual Report 2020/2110
BOARD OFDIRECTORS
Mr. Harsha Amarasekera, President’s Counsel was appointed to the Board of CIC on 28th October 2005. He was appointed as Acting Chairman on 01st January 2014 and as Chairman on 23rd May 2014. Mr. Harsha Amarasekera is a leading luminary in the legal profession in Sri Lanka having a wide practice in the Original Courts as well as in the Appellate Courts. His fields of expertise include Commercial Law, Business Law, Securities Law, Banking Law and Intellectual Property Law.
He also serves as an Independent Director in several listed companies in the Colombo Stock Exchange including Sampath Bank PLC, Swisstek (Ceylon) PLC and Swisstek Aluminium Limited as Chairman. He is also an Independent Non-Executive Director of Vallibel One PLC, Expolanka Holdings PLC, Royal Ceramic PLC, Ambeon Capital PLC, Vallibel Power Erathna PLC and Amaya Leisure PLC. He is also the Chairman of CIC Agri Businesses (Private) Limited.
Appointed to the Board on 10th March 2008. Mr. Captain is an entrepreneur and investor in Sri Lankan corporate sector, bringing with him a wealth of knowledge and over 15 years of business experience in a range of manufacturing sectors. His current business interests range from paints, garments, industrial gloves, cutting and polishing diamonds, plastics and other packing material. He is the co-founder of Asia Stock Brokers, Asia Capital, Dutch Lanka Trailers, Asia Siyaka and Asian Alliance. He is also a Non- Executive Director of Hatton National Bank PLC (up to 2nd April 2021) and many other unlisted companies. Mr. Captain was educated at the University of Miami, Florida, USA.
First appointed to the Board of CIC Holdings PLC on 4th November 2005 and held the position of Group Finance Director / Company Secretary till November 2010. He re-joined the Company as Group Finance Director / Company Secretary in July 2017 and was appointed as Chief Operating Officer in September 2019.
Holds a B.Sc. Degree in Physical Science from the University of Colombo and is a Fellow Member of Chartered Institute of Management Accountants UK with over 30 years of experience in Finance, General Management & Operations including 7 years of overseas experience. Has spent over 20 years of his professional career with CIC.
Also serves as CEO of Chemanex PLC and as a Non-Executive Director on the Boards of several unlisted companies of the Group.
S. H. AMARASEKERAIndependent, Non-Executive Director/Chairman
S. FERNANDOChief Operating Officer/ Company Secretary
R. S. CAPTAINNon-Independent, Non-Executive Director

11TIDES OF CHANGE
Appointed to the Board on 06th January 2021, Mr. J. R. Gunaratne counts 40 years of experience in Strategic Planning, Production & Distribution, Industrial Relations and Change Management in the Food & Beverage, Plantations and Leisure Sectors.
During his career at John Keells Holdings PLC, he has held Directorships in several listed and private companies of the John Keells Group. He has been a Member of the Food Advisory Council of the Ministry of Health and a Member of the Council for Hotel & Tourism of the Employer’s Federation of Ceylon. He was the Founder Chairman of the Beverage Association of Sri Lanka.
Joined CIC Board on 11th April 2013. He has had a successful track record in private equity with Actis, a leading global emerging markets fund until his retirement in 2011 as an Actis Partner. He has led many of the most successful private equity transactions in Sri Lanka.
Mr. Enderby joined Hemas Holdings PLC in March 2013 to head the Group’s efforts in Mergers and Acquisitions. He took up the office of Deputy CEO and Director of Hemas Holdings PLC in November 2013 and was appointed the Chief Executive Officer of the company in April 2014. He resigned as CEO and Director of Hemas Holdings PLC in September 2020.
He is the Non-Executive Chairman of Ironwood Capital Partners, Sri Lanka’s leading private equity fund. He has also served on the Boards of many leading companies in Sri Lanka and India. He is a Fellow Member of the Chartered Institute of Management Accountants, holds a Degree in Economics and Accounting from Queen’s University Belfast and a Master’s Degree in Development Studies from the University of Melbourne.
Appointed alternate Director to ICI Nominee Director on 21st May 2002, thereafter as a Director on 25th October 2008. Immediate Past Deputy Chairman of Commercial Bank of Ceylon PLC. He is a Fellow Member of the Institute of Chartered Accountants of Sri Lanka. He is also the Chairman of Commercial Insurance Brokers (Private) Limited. He also serves on the Boards of many other private companies. He served at Zambia Consolidated Copper Mines in Africa for over 13 years in various senior positions including Head of Treasury, managing a loan portfolio in excess of US$ 2Bn. He was the Immediate Past President of The Sri Lanka Institute of Directors.
S. M. ENDERBYIndependent, Non-Executive Director
J. R. GUNARATNEIndependent, Non-Executive Director
M. P. JAYAWARDENAIndependent, Non-Executive Director

CIC HOLDINGS PLC Annual Report 2020/2112
BOARD OF DIRECTORS
Appointed to the Board on 16th October 2020, Mr. Sujeewa Mudalige counts over 30 years of experience as a Chartered Accountant. He is also a fellow member of CIMA (UK), ACCA (UK) and CPA (Australia). He has vast experience as the Audit Committee Chair in both public and private sector organisations.
Mr. Mudalige is the Managing Partner of PricewaterhouseCoopers, Sri Lanka and currently serves as an Independent Non-Executive Director at CIC Feeds Group and Link Natural Products Private Limited. He is the Non-Executive Chair of Mercantile Services Provident Society (MSPS). He is also an Independent Non-Executive Director at National Development Bank PLC and NSBM Green University.
He is a past President of ICASL and has been a member of the Council of ICASL and of the governing board of CIMA UK- Sri Lanka Division, a Commission member of the Securities and Exchange Commission of Sri Lanka and held several such other positions locally and globally during the span of his career. He was an Independent Non-Executive Director of Hatton National Bank PLC from 2012 to 2019.
First appointed to the Board of Directors in 1995 and served as Commercial Director and Group Finance Director till 2005. During this period he also served on the Board of Directors in many of the Subsidiaries and Associate Companies within the Group. On leaving the CIC Group he functioned as Country Controller and Group Finance Director for Shell Sri Lanka and subsequently as Group Chief Operating Officer of Browns Group of Companies and Managing Director of Browns Investment PLC.
He is currently employed as Director of Paints & General Industries Limited and Director/Chief Executive Officer of Polypak Secco Limited. He was re-appointed to the Board of CIC Holdings PLC on 1st July 2016. He also functions as Chairman of Chemanex PLC and serves on the Board of Directors of Akzo Nobel Paints Lanka (Private) Limited, Link Natural Products (Private) Limited and CISCO Speciality Packaging (Private) Limited. He also is a Director of Hatton National Bank PLC and Chairman of Sithma Development (Private) Limited.
Rimoe Saldin is a Fellow of the Institute of Chartered Accountants of Sri Lanka. An associate of Institute of Chartered Accountants of England and Wales. He is also a Fellow of the Chartered Institute of Management Accountants in UK and a Certified Management Accountant, Australia. He is an alumni of the Asian Institute of Management Manila. He has over 20 years of top management level experience in the areas of Finance, Human Resource Development, General Management and Operations.
D. T. S. H. MUDALIGEIndependent, Non-Executive Director
P. R. SALDINNon-Independent, Non-Executive Director
ripples OFAmbition
GOVERNANCE
Corporate Governance 14
Audit Committee Report 18
Report of the Human Capital & Compensation Committee 19
Nominations Committee Report 20
Related Party Transaction Review Committee 21
Board of Directors’ Statement on Internal Controls 22

CIC HOLDINGS PLC Annual Report 2020/2114
CORPORATEGOVERNANCEThe Board of Directors of CIC Holdings PLC is committed to uphold the principles of Corporate Governance as directed by the rules of Colombo Stock Exchange.
BOARD OF DIRECTORSBoard is responsible for setting the financial and operational policies, reviewing and approving the strategic plans and annual budgets, monitoring of performance, approving Financial Statements and major transactions other than the transactions specified in section 185 (1) of the Companies Act. It also monitors risk profile of the Group and the effectiveness of financial controls and compliance.
The Board of Directors consists of eight(8) members, of which seven(7) members are Non-Executive Directors. Of the Non- Executive Directors five(5) are Independent, determined according to the guidelines issued to listed companies. The composition of the Board of Directors are as follows:
Independent, Non-Executive Directors Non- Executive Directors Executive Directors
Mr. S. H. Amarasekera Mr. R. S. Captain Mr. S. FernandoMr. S. M. Enderby Mr. P. R. SaldinMr. J. R. GunaratneMr. M. P. JayawardenaMr. D. T. S. H. Mudalige
Section 7.10.4 of listing rules requires the Board to make a determination annually, as to the independence or non-independence of each Non-Executive Director, based on declarations made by the Non-Executive Directors and other information available to the Board.
On Perusal of the declarations the Board noted that –
(a) Messrs. S. M. Enderby, J. R. Gunaratne and D. T. S. H. Mudalige are Independent Directors.
(b) The specified criteria categorise the following Directors as Non-Independent Directors:
Name of Director Specific criteria, with the application of which, the Director shall not be considered independent.
Mr. S. H. Amarasekera Served on the Board for a period exceeding 9 yearsMr. R.S. Captain Director of another company which has a significant shareholding in
the CompanyMr. M.P. Jayawardena Served on the Board for a period exceeding 9 yearsMr. P. R. Saldin Director of another company which has a significant shareholding in
the Company
According to Rule 7.10.3 (b), in the event a Director does not qualify as ‘Independent’ against any of the criteria, but if the Board, taking into account all the circumstances, is of the opinion that the Director is nevertheless ‘Independent’, the Board shall specify the criteria not met and the basis for its determination in the Annual Report.
When applying 7.10.4.the Board considered all related issues and the contribution made by such Directors, including the application of the following tests, to determine whether the Directors, whose names are given in (b) above could be considered independent.
The simple meaning of the word ‘Independent’ is “not depending on authority or control”, “self-governance”.
i. Whether a director uses his position (eg. Long standing position or other influential position) to influence the Board to take decisions
• to his benefit or
• according to his wishes or
• against the wishes of the majority of the other Directors or
• against the interests of the Company
ii. Whether he uses his position to prevent the other Directors from expressing their views and opinions at Board meetings or at any other discussions.
iii. Whether the views of the others (directors, professionals etc) are disregarded or ignored.
iv. Whether the matters are only referred to such Director for a decision, generally or as a practice, without referring these matters to other Directors.
v. Whether the other Directors feel that their presence and their contribution is immaterial.
vi. Whether the Directors are not given an opportunity to assess the performance of the Board, which includes the performance of every single Director.
vii. One reason for non-existence of team spirit is undue influence of one or more Directors. The test to be used is whether there is adequate team spirit in the Board.
viii. Whether there is a practice to refer matters, which can be dealt with at a lower level, to such Director.
ix. Whether third parties deal with such director on matters which can be easily finalised by any other party at a lower level.
On the above basis, the Board determined that Mr. S. H. Amarasekera & Mr. M. P. Jayawardena, too could be considered Independent.

15TIDES OF CHANGE
Appointment of Non-Executive Directors is based on the collective decision of the Board.
As per Article 25(2) of the Articles of Association, any Director appointed during the year shall hold office until the next/following Annual General Meeting and shall be eligible for re-election and not be counted for Article 25(6).
As per Article 25(6) of the Articles of Association, one-third of the Directors of the Board must retire by rotation at every Annual General Meeting. The Managing Director is not subject to retirement by rotation, nor shall be taken into account in determining the Directors to retire. The person who has served for the longest period shall retire but is eligible for re-appointment.
At the outset of the COVID-19 pandemic, the Board evaluated the impact of COVID-19 on the each business of the Group and the ability of each business to manage its operations under extreme conditions and assessed cash and liquidity position of each business given the uncertain environment ahead and formulated strategies going forward and implemented the same.
The attendance at the Board and Committee meetings held during the year 2020/21 is given below in Table 01.
The Board conducts an internal Board evaluation each year. The Evaluation considers a range of factors relevant to the effectiveness of the Board, including the balance of skills, experience, independence and knowledge of the Board, its diversity and how the Board works together as a unit. The review is led by the Board Chairman and supported by the Company Secretary. A questionnaire is completed by Members of the Board and the results are thereafter evaluated.
The Board met six(6) times during the year. In order to ensure robust discussion, informed deliberation and effective decision-making the Directors were provided with necessary information well in advance, by way of Board papers.
Table 01
Name Board Audit Committee Human Capital & Compensation
Committee
Nominations Committee
RPT Review Committee
Mr. S. H. Amarasekera 6/6 2/2 2/2 *Mr. S. Fernando 6/6Mr. R. S. Captain 6/6 1/2 2/2Mr. S. M. Enderby 6/6 7/8 1/2 5/5Mr. J. R. Gunaratne(Appointed w.e.f. 06.01.2021)
1/1
Mr. M. P. Jayawardena 6/6 8/8 2/2 5/5 *Mr. D. T. S. H. Mudalige(Appointed w.e.f. 16.10.2020)
2/2 2/2
Mr. P. R. Saldin 6/6 8/8 * 2/2 * 2/2
* Chairman of Respective Committee
AUDIT COMMITTEEAudit Committee consists of four(04) Non-Executive Directors, three(03) of whom are Independent. The Chairman of the Company & the Chief Operating Officer attend meetings by invitation.
The Committee reviews the financial information, which is provided to shareholders, the financial controls, compliance with laws, regulations and ethics, risk management, performance guidelines, qualifications and independence of the external auditors and the performance of the internal audit reviews. Both the internal auditors and external auditors have direct access to the Audit Committee.
The Audit Committee met eight(8) times during the year and the attendance is given above in Table 01.
Audit Committee Report is given in page 18.
HUMAN CAPITAL & COMPENSATION COMMITTEE (REMUNERATION COMMITTEE)The Human Capital & Compensation Committee consists of five(5) Non-Executive Directors, three(3) of whom are Independent, reviews the salary and benefits programmes of Executive Employees, including the Executive Directors.
Directors’ RemunerationTotal remuneration paid to Executive and Non-Executive Directors are given in page 75 and the Report of the Human Capital & Compensation Committee is given in page 19.
The Human Capital & Compensation Committee met two(2) times during the year and the attendance is given above in Table 01.
RELATED PARTY TRANSACTIONS REVIEW COMMITTEEThe Committee consists of two(2) Independent Non-Executive Directors. The Chief Operating Officer attends meetings by invitation.

CIC HOLDINGS PLC Annual Report 2020/2116
CORPORATE GOVERNANCE
The scope of the Committee is to provide independent review, approval and oversight of Related Party Transactions on the terms set forth in greater detail in the Committee Charter.
The Committee met five(5) times during the year and the attendance is given above in Table 01.
Related Party Transaction Review Committee Report is given in page 21.
COMPLIANCE WITH THE RULES OF THE COLOMBO STOCK EXCHANGE ON CORPORATE GOVERNANCE AND RELATED PARTY TRANSACTIONSSection Subject Description Status Details
7.10.1 (a) Non-Executive Directors
At least two Non-Executive Directors or such number of Non-Executive Directors equivalent to one third of the total number of Directors, whichever is higher
Compliant 7 Non-Executive Directors
7.10.2 Independent Directors
Where the Board includes only two Non-Executive Directors, both shall be Independent. In all other instances two or one third of Non-Executive Directors, whichever is higher
Compliant 5 Independent Directors
7.10.2 (b) Independent Directors
Each Non-Executive Director to submit a signed and dated declaration annually of his/her independence or Non-Independence
Compliant Refer page 14 for Corporate Governance Report
7.10.3 (a) Disclosure Relating to Directors
The Board shall make a determination annually as to the independence or non- independence of Non- Executive Directors.
Compliant Regular evaluation is made against the criteria set out in section 7.10.4
7.10.3(b) Disclosure relating to Directors
In the event a Director does not qualify as “independent” but if the Board is of the opinion that the Director is “Independent”, the Board shall specify the criteria not met and the basis for its determination
Compliant 2 Non-Executive Directors qualify as Independent Directors according to the criteria set out in this section
7.10.3 (c) Disclosure relating to Directors
The Board shall publish in its Annual Report a brief resume of each Director
Compliant Refer Page 10 for the profile of Board Members
7.10.3 (d) Disclosure relating to Directors
Upon the Appointment of new Directors, the entity shall forthwith provide the Exchange a brief resume of such Director
Compliant Regular information provided to the Exchange upon the appointment of new Directors.
7.10.5 (a) Remuneration Committee
The Remuneration Committee shall comprise of a minimum of two Independent Non-Executive Directors or of Non-Executive Directors a majority of whom shall be independent, whichever is higher.
Compliant Of the 5 Non-Executive Directors who are members of the Committee 3 are Independent
7.10.5 (b) Remuneration Committee
Functions of Remuneration Committee Compliant Refer page 19 for Remuneration Committee Report
7.10.5 (c) Remuneration Committee
Disclosure in the Annual Report about the name of Directors comprising the Remuneration Committee, contain a statement of the remuneration policy and set out the aggregate remuneration paid to Executive and Non-Executive Directors
Compliant Refer page 19 for the Remuneration Committee Report and the Note 11 to Financial Statements

17TIDES OF CHANGE
Section Subject Description Status Details
7.10.6 (a) Composition of the Audit Committee
Minimum of two Independent Non-Executive Directors or of Non-Executive Directors a majority of whom shall be Independent, whichever shall be higher
One Non-Executive Director shall be appointed as Chairman of the Committee.
The Chief Executive Officer and the Chief Financial Officer of the Listed Entity shall attend Audit Committee meetings.
The Chairman or one member of the Committee should be a Member of a recognised professional accounting body.
Compliant The Audit Committee comprises of four Non-Executive Directors, three of whom are Independent
The Chairman of the Audit Committee is a Non-Executive Director
The Chairman, Chief Operating Officer and Chief Financial Officer attend Audit Committee meetings by invitation.
Chairman is a Fellow member of the Institute of Chartered Accountants of Sri Lanka.
7.10.6 (b) Audit Committee Functions of the Audit Committee Compliant Refer page 18 for the Audit Committee Report
7.10.6 (c) Audit Committee Disclosure in the Annual Report Compliant Refer page 18 for the Audit Committee Report
9.2.1 Related Party Transactions Review Committee
All Related Party Transactions should be reviewed by the “Related Party Transactions Review Committee”.
Compliant Refer the page 21 Related Party Transactions Review Committee Report
9.2.2 Composition of Related Party Transactions Review Committee
The Committee should comprise a combination of Non-Executive Directors and Independent Non-Executive Directors. The composition may also include Executive Directors.
One Independent Non-Executive Director shall be appointed as Chairman of the Committee.
Compliant The Committee comprise of two Independent Non-Executive Directors
Chairman of the Committee is an Independent Non-Executive Director
9.2.4 Frequency of Meetings and Minutes
The Committee shall meet at least once a calendar quarter.
The Committee shall ensure that the minute of the meeting are properly documented and communicated to the Board of Directors.
Compliant Refer page 21 for the Related Party Transactions Review Committee Report
9.3.2 (c) Disclosure in the Annual Report
Requirements listed in the section Compliant Refer page 21 for the Report of the Related Party Transactions Review Committee
9.3.2 (d) Disclosure in the Annual Report
A declaration by the Board of Directors in the Annual Report as an affirmative / negative statement of the compliance with the Rules pertaining to Related Party Transactions.
Compliant Refer page 36 for the Annual Report of the Directors on the affairs of the Company.

CIC HOLDINGS PLC Annual Report 2020/2118
AUDITCOMMITTEE REPORTCOMPOSITION In accordance with the Corporate Governance Guidelines, the Board appointed Audit Committee comprises of four Non-Executive Directors majority of whom are Independent. The Audit Committee as of 31st March 2021 consisted of the following.
Mr. P. R. Saldin – Committee ChairmanNon-Executive Director
Mr. S. M. EnderbyIndependent, Non-Executive Director
Mr. M. P. Jayawardena Independent, Non-Executive Director
Mr. D. T. S. H. Mudalige Independent, Non-Executive Director
The Chairman, Mr. S. H. Amarasekera and Chief Operating Officer, Mr. S. Fernando attend meetings by invitation.
The financial knowledge and the business acumen and the independence of the members are brought to bear on the deliberations and judgements on matters that come within their purview.
ROLE The Audit Committee charter which defines the role and responsibility of the Audit Committee is reviewed annually to ensure that new developments and other issues are properly addressed. The Committee among other functions reviews the operation and effectiveness of Internal Control Systems, ensuring that a good financial reporting system is in place, is well-managed and oversees the preparation, presentation and adequacy of disclosures in the Financial Statements in accordance with Sri Lanka Accounting Standards, Companies Act and other relevant financial reporting regulations. The Committee monitors the internal and external audit functions. The internal controls within the Company are designed to provide reasonable but not absolute assurance to the Directors and assist them to monitor the financial position of the Group.
The Audit Committee defines the responsibility for the internal audit function, monitors the internal audit programme and results of the internal audit process, considers recommendations made by the Internal and External Auditors, reviews their reports and takes necessary action. The Audit Committee is empowered to review any activity within the Company. The Committee makes recommendations to the Board on appointment, re-appointment and removal of External Auditors and approval of terms of engagement and remuneration.
MEETINGSThe Committee held eight meetings during the year. The attendance of the Committee members are given on page 15. The Internal Auditors, Messrs. BDO Partners attend meetings when required and the Audit Committee makes inquiries from any officer of the Company as deemed necessary.
ACTIVITIESDuring the year, the Committee reviewed internal audit reports forwarded by the Internal Auditors. The reports are submitted on a quarterly basis as they carry out the audits according to a scheduled programme. In addition, they carry out special audits if the need arises. Having assessed the internal financial controls, the Committee is of the view that adequate controls and procedures are in place to provide reasonable assurance that the Company’s assets are safeguarded. The Company’s procedures are in place to ensure compliance with statutory requirements. The compliances are monitored through the quarterly ‘Statutory Compliance Report’.
The Committee had a meeting with the External Auditors in relation to the annual audit to ensure the independence in their approach and methodology. The Committee reviewed the Group Management Letter submitted by the External Auditors, Messrs. KPMG, along with the management response. These recommendations are implemented by
the management and the Audit Committee follows up on the implementation of these recommendations. The Committee also reviewed the Audited Financial Statements with the External Auditors and the quarterly Financial Statements were reviewed prior to publication.
The Audit Committee is satisfied, based on the declaration from Messrs. KPMG and as far as the Audit Committee is aware, that the Auditors do not have any relationship or interest in the Company or its Subsidiaries other than the remuneration paid to the Auditors as disclosed in page 75.
The Audit Committee has recommended to the Board of Directors, that Messrs. KPMG, be re-appointed as Auditors for the financial year ending 31st March 2022 subject to the approval of shareholders at the Annual General Meeting to be held on 30th June 2021.
CONCLUSIONThe Audit Committee is satisfied that the Group’s accounting policies, operational controls and risk management processes provide reasonable assurance that the affairs of the Group are managed in accordance with Group policies and that Group assets are properly accounted for and adequately safeguarded.
Finally, I would like to thank my colleagues in the Committee, Steven Enderby, Preethi Jayawardena and Sujeewa Mudalige for their valuable contribution with their vast commercial experience and professional expertise. I also thank the Chairman, the Chief Operating Officer and the Secretary to the Committee for their contribution.
P. R. SaldinChairmanAudit Committee
21st May 2021

19TIDES OF CHANGE
REPORT OF THE HUMAN CAPITAL & COMPENSATION COMMITTEECOMPOSITIONThe Human Capital & Compensation Committee consists of Non-Executive Directors majority of whom are Independent. The Human Capital & Compensation Committee as of 31st March 2021 consisted of the following.
Mr. P. R. Saldin – Committee ChairmanNon-Executive Director
Mr. S. H. Amarasekera Independent, Non-Executive Director/ Chairman
Mr. R. S. Captain Non-Executive Director
Mr. S. M. Enderby Independent, Non-Executive Director
Mr. M. P. Jayawardena Independent, Non-Executive Director
The Chief Operating Officer Mr. S. Fernando attends the meetings by invitation.
FUNCTIONSThe Human Capital & Compensation Committee is responsible for developing the Group’s remuneration policy and determining the remuneration packages of executive employees of the Group. The Committee recommends to the Board and its subsidiaries the remuneration to be paid to Key Management Personnel. The Committee reviews HR policies and the policies pertaining to remuneration and perquisites of the Executives of the Company annually. The Committee will also review the Human Resource Strategies of the Company.
MEETINGSThe Committee will have meetings on need basis. The Committee met two(02) times during the year. The Chairman of the Committee can convene a special meeting in the event a requirement arises, provided all members are given sufficient notice of such special meeting. The quorum for a meeting is two members. The COO is invited to participate at the sittings of the Committee meetings as and when required by the Chairman considering the topics for deliberation at such meetings. The proceedings of the Committee meetings were regularly reported to the Board of Directors.
REMUNERATIONThe Committee believes that the Company’s remuneration strategy is paramount to differentiate us from the competitors and to retain our top performers. Therefore, our remuneration philosophy is anchored on a total rewards approach. The remuneration strategy has been designed to enable the company to develop, motivate and retain our internal talent pipeline; and when necessary to attract key talent externally to sustain the performance of the Group. With the re-strategising process the Company carefully evaluated the various jobs and positions, rationalised the structure and reviewed the Company’s Remuneration Policy.
SUCCESSION PLANNINGSuccession planning within our Group is an ongoing process for responding to change, so that our Group operations would go on with little disruption as possible. The Committee reviews the succession planning process in
place to ensure that our best talent is in line for future leadership and critical roles and to mitigate the risk of future talent shortages and also to retain and develop critical knowledge capital.
The aggregate remuneration paid to Executive & Non-Executive Directors is given in Note 11 to the Financial Statements in page 75.
Finally, I would like to thank my colleagues in the Committee for their valuable contribution towards the progress of the Committee.
P. R. SaldinChairmanHuman Capital & Compensation Committee
21st May 2021

CIC HOLDINGS PLC Annual Report 2020/2120
NOMINATIONSCOMMITTEE REPORTCOMPOSITION The Nominations Committee comprises of three members who are Non-Executive Directors. The Nominations Committee as of 31st March 2021 consisted of the following.
Mr. S. H. Amarasekera – Committee ChairmanIndependent, Non-Executive Director/ Chairman
Mr. R. S. Captain Non-Executive Director
Mr. P. R. SaldinNon-Executive Director
The Chief Operating Officer, Mr. S. Fernando attends the meetings by invitation.
MEETINGSThe Committee meets on need basis and held two (02) meetings during the year under review.
SCOPE To recommend to the Board the process of selecting the Chairman and CEO
To identify suitable persons who could be considered for appointment to the Board as Executive and Non-Executive Directors
• To make recommendations on matters referred to it by the Board
• To review the composition of the Board
• To evaluate the independence and effectiveness of the Non- Executive Directors.
• To identify suitable persons for appointment to the Board of Subsidiaries and ratify the appointment of any Director selected by them in order to ensure that required competencies are available in such companies.
The Committee is satisfied that the combined knowledge and experience of the Board matches the requirements of the Company.
During the year the Committee recommended appointment of Independent Non-Executive Directors Mr. D. T. S. H. Mudalige and Mr. J. R. Gunaratne to the Board of Directors.
The Committee recommended that, Messrs. J. R. Gunaratne and D. T. S. H. Mudalige who retire in terms of Article 25(2) of the Articles of Association of the Company and Messrs. R. S. Captain and M. P. Jayawardena who retire in terms of Article 25(6) of the Articles of Association of the Company, be re-elected to the Board at the Annual General Meeting to be held on 30th June 2021.
S. H. AmarasekeraChairmanNominations Committee
21st May 2021

21TIDES OF CHANGE
REPORT OF THE RELATED PARTY TRANSACTIONS REVIEW COMMITTEECOMPOSITION OF THE COMMITTEE In accordance with the Code of Best Practices on Related Party Transactions, issued by the Colombo Stock Exchange, the Board appointed Related Party Transactions Review Committee comprises of two Independent Non-Executive Directors. The Related Party Transactions Review Committee as of 31st March 2021 consisted of the following.
Mr. M. P. Jayawardena – Committee ChairmanIndependent, Non-Executive Director
Mr. S. M. EnderbyIndependent, Non-Executive Director
The Chief Operating Officer, Mr. S Fernando attends the meetings by invitation.
TERMS OF REFERENCE OF THE COMMITTEERelated Party Transactions Review Committee was formed by the Board during the year ended 31st March 2015 to assist the Board in reviewing all related party transactions of the Group.
Committee is responsible for,
• Developing and recommending the RPT policy consistent with guidelines of CSE for adoption by the Board of Directors of the Company and its Subsidiaries.
• Making immediate market disclosures on applicable RPT as required by Section 9 of the Listing Rules of the CSE.
• Providing information to the Board of Directors on the RPT of each of the Group Companies.
• Making appropriate disclosures on RPT in the Annual Report of the Company as required by the continuing listing requirement of CSE.
The committee holds meetings on a quarterly basis to review and report to the Board on matters involving RPT falling under its terms of reference.
Any member of the Committee who has an interest in a RPT under discussion shall refrain from participating in the review discussion. Upon completion of its review of the transaction the Committee may determine to permit or prohibit the RPT. All related party transactions which require immediate market disclosure will be pre-approved by the Committee. Other RPT entered into without pre-approval of the Committee shall not be deemed to violate this policy or be invalid or unenforceable so long as the transaction is brought to the Committee within a reasonable and practical time period. Thereafter it should be ratified by the Committee after it becomes reasonably apparent that the transaction falls within the policy framework. As such all RPT other than the exempted transactions will be reviewed either prior to the transaction being entered into or if the transaction is expressed to be conditional on such review prior to the completion of the transaction.
The Committee has also reviewed in advance all proposed related party transactions and has communicated comments/observations to the Board of Directors.
METHODOLOGY ADOPTED BY THE COMMITTEEMonitoring systems are in place to obtain declarations from all Directors (at the time of joining the Board and annually thereafter) informing the Company Secretary, the primary contact point for Directors, of any existing or potential RPTs carried out by them or their Close Family Members (CFMs) or any changes to the position already disclosed.
Monitoring systems are in place to obtain confirmations on any new appointments accepted by Directors of the Company in other entities and from other Key Management Personnel (KMPs) to identify and capture such transactions carried out by the Group with such entities which need to be disclosed under ‘Directors Interest in Contracts’ in the Annual Report.
The Committee relies on the integrity of periodically reportable Related Party Transactions data sourced via a comprehensive list of Related Parties based on latest available declarations, signed off by the responsible Directors/ KMPs, which in turn is further reviewed by the Secretary. This review is carried out by comparing Related Party Transactions with benchmarked criteria applicable for comparable Non-Related Party Transactions, to determine that Related Parties have not received any favourable nor preferential consideration. Further the Committee has the right of access as well as the power to call for clarification and explanation from Management & Auditors (External & Internal).
ACTIVITIES DURING THE YEAR Quarterly or earlier as necessary, meetings were held during the year to scrutinise all Related Party Transactions with Directors, Key Management Personnel (KMPs), substantial shareholders, Subsidiaries and Associate Companies of the Company and such other related parties as defined in the Code with a view to determining that they have not received any favourable nor preferential consideration vis a vis the other shareholders, suppliers and customers of the Company as well as to ascertain that their transactions and dealings are in strict conformity with Statutory and Regulatory requirements which the Company is obliged to adhere to. The Committee communicated the comments/observations to the Board of Directors.
M. P. JayawardenaChairmanRelated Party Transactions Review Committee
21st May 2021

CIC HOLDINGS PLC Annual Report 2020/2122
BOARD OF DIRECTORS’STATEMENT ON INTERNAL CONTROLSREQUIREMENTThe Code of Best Practice on Corporate Governance 2017 issued jointly by the Securities and Exchange Commission and the Institute of Chartered Accountants, Sri Lanka, recommends Board to present a statement on internal controls.
RESPONSIBILITYThe Board of Directors is responsible for the adequacy and effectiveness of the Group’s system of internal controls. However, such a system is designed to manage the Group’s key exposure areas within an acceptable risk profile rather than eliminating the risk of failure to achieve the Group’s objectives. Accordingly, the system of internal controls can only provide a reasonable assurance but not absolute against the material misstatement of management and financial information and records or against financial losses or fraud. The Board has established an ongoing process for identifying, evaluating and managing the significant exposures faced by the Company and this process includes enhancing the system of internal controls as and when there are changes for the business environment or regulatory framework.
The Board has assessed the internal control system taking into account principles for the assessment of internal control systems as given in that guidance. The Board is of the view that the system of internal controls in place is sound and adequate to provide reasonable assurance regarding the reliability of financial reporting and that the preparation of Financial Statements for external purposes is in accordance with relevant accounting principles and regulatory requirements.
The management assists the Board in implementation of the Board policies and procedures.
KEY INTERNAL CONTROL PROCESSESThe key processes that have been established in reviewing the adequacy and integrity of the system of internal controls with respect to financial reporting includes the following:
The Board sub-committees are established to assist the Board in ensuring the effectiveness of the Group’s operations and that they are in accordance with corporate objectives, strategy, annual budget, policies and business environment.
The Group’s internal audit functions provide comfort on the efficiency and effectiveness of the internal control system. It monitors compliance on policies and procedures and highlights significant findings in respect of non-compliance. Audits are carried out on all subsidiaries and frequency of which is determined by the level of risk assessed. The annual audit plan is reviewed and approved by the Audit Committee.
The Audit Committee reviews internal control issues identified by the Group’s internal auditors/external auditors, regulatory authorities and the management and evaluates the adequacy of internal controls.
In assessing the internal control systems, the management of the Company continued to review and update all procedures and controls that are connected with significant accounts and disclosures of the Financial Statements of the Company/ Group.
CONFIRMATION STATEMENTThe Board of Directors of CIC Holdings PLC (Group) confirm that the financial reporting system has been designed to provide reasonable assurance regarding the reliability of financial reporting system and the preparation of Financial Statements for external purposes has been done in accordance with Sri Lanka Accounting Standards, Companies Act No. 7 of 2007, Listing Rules of the Colombo Stock Exchange, requirements of Security and Exchange Commission of Sri Lanka and other regulatory requirements.
By order of the Board,
S. H. AmarasekeraChairman
S. FernandoChief Operating Officer
P. R. SaldinChairman - Audit Committee
21st May 2021

STREAMS OFVALUE
MANAGEMENT DISCUSSION AND ANALYSIS
Agri Produce 25
Livestock Solutions 27
Health & Personal Care 29
Industrial Solutions 31
Crop Solutions 33

CIC HOLDINGS PLC Annual Report 2020/2124
MANAGEMENT DISCUSSION AND ANALYSIS
Livestock Solutions Health and Personal Care
Crop SolutionsIndustrial Solutions
Agri Produce
At CIC Holdings our businesses are ‘nurturing life’ and are committed to improve the well-being and quality of the lives of Sri Lankans across the island.

25TIDES OF CHANGE
CIC’s Agri Produce segment is dedicated towards improving the wellbeing and quality of life of all Sri Lankans. Though its portfolio of home-grown Rice, nutritious Fresh Produce and high quality locally manufactured Dairy products, the segment strives to stimulate a general proclivity towards nutrition-based consumption that will enhance the overall health and wellbeing of consumers over time.
The FY 2020/21 was a challenging time for the Agri Produce sector, as normal consumption and spending patterns altered significantly amidst the chaos caused by the COVID-19 pandemic. Regardless, the segment tabled a resilient performance with all key metrics either on par or marginally below budgets for the year under review.
RiceThe Rice segment experienced mixed fortunes in the current financial year. Sales volumes in both the modern trade and the HORECA channel were adversely affected by the 2-month lockdown, prompting CIC to tie up with existing modern trade partners
AgriProduce
The FY 2020/21 was a challenging time for the Agri Produce sector, as normal consumption and spending patterns altered significantly amidst the chaos caused by the COVID-19 pandemic.
as well as several new online retailers to ensure availability of its signature Gold Crop brand in the retail market. CIC’s Gold Crop Rice being the only local brand catering to the niche markets for Healthy, Speciality and Traditional Rice varieties also proved to be a significant advantage in building up modern trade volumes thereafter. The demand from the HORECA channel however continued to be sluggish for much of the remainder of the year amidst the slow recovery in the food and beverage industry and the hotel sector.
Meanwhile the government’s decision to ban the imported Basmathi rice created a very viable opportunity for CIC to promote its premium value Basmathi product to the mainstream market. Taking immediate action to benefit from the vacuum in the market added a significant boost to the Rice segment’s annual volumes as well as the bottom line for the year. Export volumes also showed a notable improvement compared to the previous year.

CIC HOLDINGS PLC Annual Report 2020/2126
Sector Review - Agri Produce
Future OutlookBased on the January - March 2021, consumption patterns and consumer spending indicators, the future outlook for the Agri Produce business looks quite promising. The demand for perishables such as Rice, Dairy products and Fresh Produce from the retail sector appears to be on the upward trend. Similarly, the food and beverage industry and the hotel sector too are expected to stage a full recovery over the next 12 - 18 months, thus creating a solid platform for the Agri Produce business to move firmly forward in this space as well.
Proposed Action Rice Dairy Fresh Produce
Augment the product portfolio to deepen the penetration into both the modern trade and the HORECA channel
Expand milling capacity to focus on exports
Diversify the cultured dairy range for the mainstream market
Create a premium high value offering to target niche market segments
Leverage on digital technology to offer convenient delivery solutions that will ideally complement the “Fresheez” value proposition
R & D initiatives aimed at developing new Rice varieties continued throughout the year, with trials on a new health rice variant nearing completion. In other developments, the milling plant was recertified under the ISO 22000 re-certified standard.
DairyThe Dairy Operation which produces and markets a range of high quality cultured Dairy products, recorded satisfactory results for the year under review, thanks to proactive efforts to overcome myriad challenges.
The countrywide lockdown was a particularly challenging period. One of the main concerns during this time was the continuous supply of raw milk, which was being delivered by company’s dairy out grower farmers. Taking the challenge, the company resumed processing activities with necessary approvals obtained to keep the Dambulla Dairy production facility in operation throughout the lockdown period. While this helped to safeguard over 2,000 small scale dairy farmers who form the backbone of the Dairy Operation supply chain, it also gave opportunity to cater to the consumer facing scarcity of dairy products during the period. The next challenge was the shrinking market as a result of pandemic induced economic was the downturn. Accordingly, retail demand for CIC’s cultured dairy range weakened considerably during the lockdown period and remained muted for much of 2020. To add to this, product distribution also proved to be a key challenge during the lockdown period as wholesale distributors and retail outlets alike remained shut during the 2-month island-wide lockdown. In response the Dairy segment began working with key distribution partners to provide them with necessary support to improve their reach by offering door to door delivery services.
Faced with a shrinking retail market, the Dairy segment redirected its attention to the B2B space, a highly successful move that delivered excellent results within the year itself.
In an encouraging development, the retail demand for cultured dairy products showed signs of gradually regularising in the early part of 2021, enabling CIC’s Dairy segment to record good volume growth in Q4 of the current financial year.
R & D activities were further intensified during the year, with a special emphasis on developing a health and wellness range for the mainstream retail market.
Fresh ProduceIt was a tough year for the Fresh Produce business which operates the “Fresheez” chain of outlets that offer made-to-order fresh juices along with a range of fresh farm produce. The lockdown declared in March 2020 was a severe blow for the “Fresheez’’ chain as it came just ahead of the peak April new year period. Consequently, demand for the main product - made-to-order fresh juices
vanished overnight as all outlets were shut for the entire 2-month period with only the outlet at Jawatte kept open in order to facilitate fresh produce orders coming through online channels and delivery partners.
Challenged by supply chain disruptions due to inter-district mobility restrictions, the supplier base was expanded and the overall procurement methodology was further streamlined in a bid to provide customers with an uninterrupted service, while maintaining the “Fresheez” hallmark of quality and goodness. As part of this commitment, the range of offerings was expanded to with additional frozen items and a new home made ready to eat product range being introduced and promoted via delivery partners and through social media platforms.
With the gradual resumption of economic activity from mid-2020 onwards, the ‘Fresheez” chain of outlets were also slowly reopened, starting with the outlets on the southern expressway and by end of the year all the “Fresheez” outlets were fully operational.

27TIDES OF CHANGE
Livestock Solutions
A concerted effort to expand local supplier networks, and the application of astute strategies enabled us to deliver excellent results.
CIC’s Livestock Solutions sector consisting of feed milling, hatchery (day-old-chicks) and poultry farms including a processing facility, is among the few large vertically integrated operators in the country’s poultry value chain. The group’s Vet Care business is also managed within the Livestock Solutions vertical.
Impacted by the pandemic, the year under review was a tough year for all segments of the sector. The 2-month country-wide lockdown and the severe economic downturn that followed posed many significant challenges. The frequent localised curfews and lockdowns in areas where most of the sector’s operations were located were an added challenge. However, proactive steps were initiated to address and overcome these issues, with particular emphasis on measures to safeguard the health and safety of staff. These timely actions and the application of astute strategies, enabled all segments to deliver excellent results, leading to a complete turnaround of the sector, recording one of its best ever performances.
FeedHaving experienced a tough start to the year under review, the Feed business staged a strong recovery from the second quarter onwards thanks to speedy and decisive actions implemented to overcome the numerous challenges. Supply chain disruptions at the beginning of the lockdown were managed effectively to ensure an uninterrupted supply of local raw materials to the feed mill. A concerted effort to expand local supplier networks helped secure alternative materials to overcome the challenges posed by the import restrictions imposed in March 2020 and the subsequent shipment delays and other inadequacies at the port of Colombo. Furthermore, prompt actions taken to secure the SLSI Covid Control Certificate enabled the business to build confidence among staff and stakeholders which helped carry out operations with minimum interruptions during the lockdown period. The intermittent travel restrictions and other pandemic related constraints experienced throughout the year posed constant challenges to efficient

CIC HOLDINGS PLC Annual Report 2020/2128
Sector Review - Livestock Solutions
workforce mobilisation and in securing the required support services. The continuing ban on the import of maize/corn, the principle raw material, led to a significant increase in the price of locally grown corn and a shortage of stocks due to hoarding by opportunistic traders. Some relief was provided by permitting the limited importation of the wheat as a substitute raw material. This and the devaluation of the LKR have led to unavoidable increases in the price of feed during the year; an added burden to poultry farmers who operate in a largely price controlled market. If a solution is not found to make corn more freely available at reasonable prices, the profitability of the feed industry will come under serious pressure.
Day-Old-Chicks (DOC)The DOC operation too faced its share of challenges. With disruptions to regular delivery and distribution causing a shift in demand patterns and the resultant stock build up at the hatchery became a major issue in the first few months of the financial year. However, the situation was corrected as market dynamics gradually returned to normal in the third quarter. The decision taken the previous year to change the parent bird stock helped the business immensely by improving productivity and reducing cost of production which helped exploit market opportunities.
Poultry Despite some initial setbacks, the Poultry segment moved quickly to make up lost ground on the back of a significant demand uptick in the second half of the year. The strong push for volumes was coupled with targeted initiatives to drive operational efficiencies and thereby lower the overall cost of production. The actions taken to sharpen marketing and sales operations and to improve customer service continue to reap rich dividend. Given the prevailing consumer price controls on whole chicken coupled with increasing input costs, in particular the sharp rise in the cost of feed, impacted profitability. If the constant appeals to remove price control on whole chicken remains unheeded or at the least a price increase to mitigate rising input costs is not granted, the industry profitability will be seriously challenged.
Vet CareThe Vet Care segment performed well in the year under review strengthening its position in several of its core markets. The ability to maintain steady and uninterrupted supplies regardless of the pandemic provided a significant edge that allowed the Vet Care segment to further consolidate its market share in the B2B space. Meanwhile, the existing pet care range was further expanded with the launch of several new products aimed at the retail market.
Future OutlookFeedThis business essentially caters to the poultry and dairy industries. With these two industries expected to expand and grow, demand for feed is projected to remain buoyant. The timely sourcing of raw materials at reasonable prices is a critical success factor in the feed industry. It is expected that the pressure on availability and sourcing of key imported raw materials will ease in the coming year but will be subject to the impact of the LKR devaluation. The battle to secure adequate stocks of locally grown corn at the right price will continue if the Government does not intervene to resolve the matter, resulting in the industry having to absorb unsustainable costs.
Day-Old-Chicks (DOC)The demand for Day-Old-Chicks is expected to increase in line with the projected growth of the poultry industry. Accordingly, the company plans to embark on expanding production capacity to facilitate the growing demand of the group’s poultry segment as well as that of other customers.
PoultryConsumption of chicken the cheapest protein available is expected to continue increasing at 5%-8% per annum. As the pandemic raises concerns regarding food security, the demand for chicken is likely to increase in the short term. Furthermore, as the economy recovers post the pandemic and consumer spending increases, the consumption of chicken is expected to keep rising. Consequently, more players may enter the industry, leading to heightened competition across the poultry value chain. This will be a challenge, but being a relatively large and integrated operator that benefits from scale and efficiencies, the business is equipped to overcome this hurdle. Whilst focusing on further improvements in marketing and distribution together with aggressively driving cost efficiencies, the business will explore capacity enhancements to sustain its growth momentum. Increasing input costs in a price controlled market will remain a challenge to the industry.
Vet CareThe Vet Care market is expected to maintain its growth trajectory as the poultry and dairy industries expand and the country strives to reach benchmark international standards for livestock care. As most of this segment’s products are imported, the LKR devaluation will be an ongoing challenge to suppliers and customers. Many initiatives will be explored to expand partnerships with new principals and to launch new products, both of which are integral to meet the entity’s growth ambitions.
29TIDES OF CHANGE
Health andPersonal Care
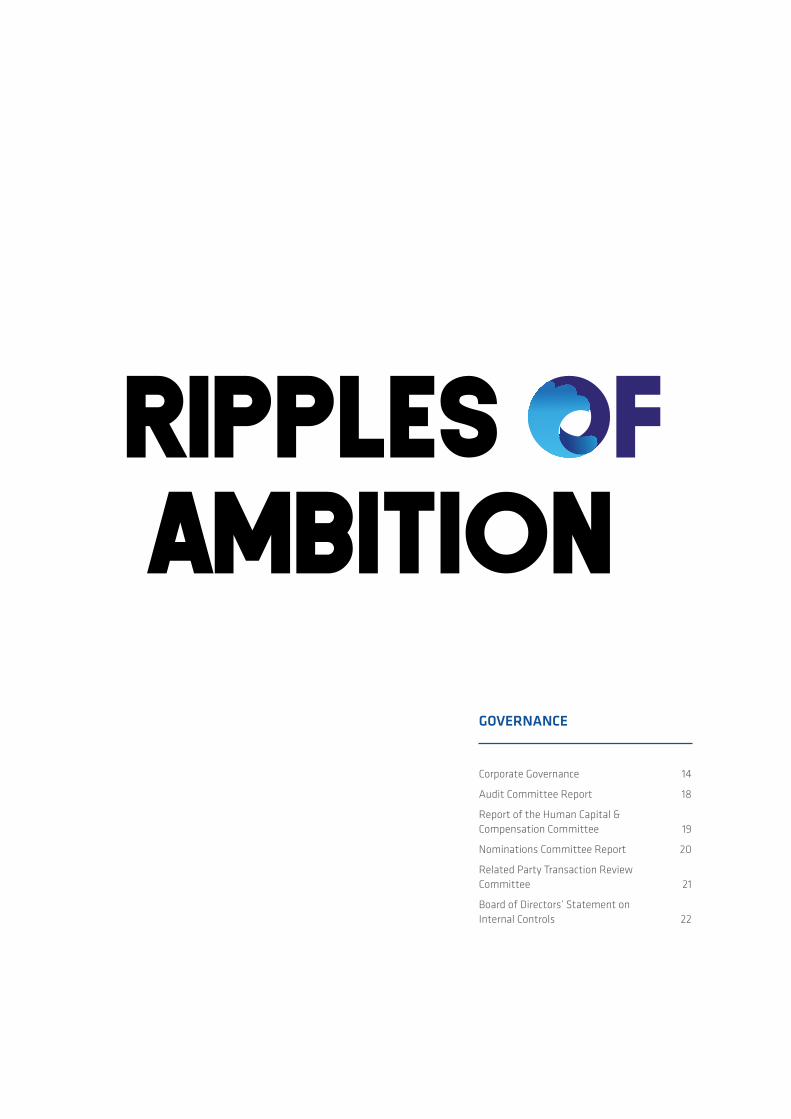
The ability to provide uninterrupted delivery notwithstanding COVID related restrictions proved to be the competitive advantage that allowed the segment to capitalise on the demand.
CIC’s Health and Personal Care segment consists of three distinct verticals: Pharmaceuticals, Medical Devices and Personal Care. The Pharma unit has built strong ties with globally renowned pharmaceutical brands to supply a wide range of pharmaceutical products to serve the healthcare needs of Sri Lankans. CIC’s Pharma manufacturing unit is a pioneer in local manufacturing and introduced new products to the market. The Company is operating from a GMP approved facility and is planning to upgrade the manufacturing facility for higher capacity. Currently plans are underway to introduce the locally manufactured products to the pharma portfolios of foreign principals.
The Medical Devices unit through its partnerships with leading global principals specialises in providing the latest equipment for trauma & maxillofacial, neuro and orthopedic support as well diagnostics. After serving the market for the past 40 years, CIC’s Pharma & Medical Devices units continues to maintain leadership positions in their respective market spaces.
The Personal Care unit meanwhile is represented by Link Natural Products (Private) Limited which offers a wide range herbal care products all produced locally at the Company’s wide range of herbal care products plant and marketed under the “LINK” brand. Backed by strong market penetration in the local retail market and the HORECA channel, Link maintains a commanding share of Sri Lanka’s personal care market. In recent years, the Company has also ventured into export markets, where its products continue to gain traction notwithstanding stiff competition from leading global brands.
A combination of pandemic related challenges as well as some notable market opportunities brought mixed fortunes for CIC’s Health and Personal Care segment in the year under review.
PharmaceuticalsThe Pharma segment as a whole recorded a strong growth in the year under review. A consistent demand from both the state and private healthcare systems enabled Pharma

CIC HOLDINGS PLC Annual Report 2020/2130
Sector Review - Health and Personal Care
imports to record good growth. Moving quickly to mobilise its logistics and delivery networks the segment was able to ensure uninterrupted distribution throughout the year, including during the lockdown period. The ability to provide uninterrupted delivery notwithstanding COVID related restrictions proved to be the competitive advantage that allowed the segment to capitalise on the demand. In other developments, the segment secured a new strategic tie up with a leading global supplier. Through this new tie up, CIC’s Pharma segment will gain access to a range of new products that further augments its portfolio and also provides first mover advantage in yet untapped markets.
The Pharma manufacturing operation came under pressure owing to a drop in demand due to limited operation from Government OPD for its main product line. Accordingly, the plant was operated at 70% to 80% capacity for much of the year. Factory operations were further hampered by low labour accessibility due to COVID related mobility restrictions that were implemented at various times during the year. On a positive note, the manufacturing segment made good progress in its new product research activities, with successful trials pointing towards a breakthrough new product line.
Medical DevicesThe Medical Devices business registered stable results for the FY 2020/21 backed by ongoing tender contracts to supply selected medical devices to the state sector. However, the exchange differential attached to these long-term tender contracts had an adverse impact on the segment’s bottom line in the current financial year as well.
Meanwhile demand from the private sector declined visibly on the back of lower patient numbers at private sector hospitals during the 2-months lockdown, a trend that continued well into 2021.
considerable advantage when tapping into these new export markets.
Moving quickly to minimise disruptions caused by the pandemic, all health guidelines and safety precautions were implemented to enable manufacturing operations to continue without interruption throughout the year. At the same time strong emphasis was placed on productivity improvements as well as cost containment in order to safeguard the bottom line. Meanwhile in an effort to benchmark global manufacturing standards the process of obtaining the ISO 45001 – Occupational Health and Safety standards commenced towards the latter part of 2020.
No new products were added to the range in the current financial year, as the Company continued to focus on strengthening the brand reach of its existing range. However, R & D activities to support the new product pipeline continued. Given the Company’s global expansion drive, the GMP certification was upgraded to comply with more stringent requirements outlined by the Code of Federal Regulation 111 (CFR 111) in the USA. Steps were also taken to secure the intellectual property rights of key export brands.
Future OutlookThe demand for Pharmaceuticals and Medical Devices from the state sector is expected to grow, considerably over the next few years in line with the government’s efforts to raise the standard of public healthcare in the Country. Private sector demand too is likely to normalise during 2021 as the general public begin to adjust to the new normal.
Proposed Action Pharmaceuticals Medical Devices Personal Care
Seek out new strategic partnerships to expand the product portfolio
Invest in technology to streamline island-wide distribution
Increase manufacturing capacity to increase the proportion of products produced locally
Develop new strategic partners who have the capability to offer high end niche products to cater to gap areas in the local market
Strengthen the brand presence in key export markets
Diversify the product rage to support efforts to penetrate new export markets
The delay in obtaining approvals remains an ongoing challenge for the Medical Devices segment. The situation was further exacerbated in the current financial year due to pandemic related wok disruptions at the approving bodies. On a positive note however, submissions made in the past for a post-operative orthopedic support device was officially approved in 2020.
Personal CareWhile the pandemic did pose some setbacks for the Personal Care segment in the current financial year, the focus on uninterrupted production coupled with aggressive efforts to grow local and export business saw the Company recording its best ever performance to date.
The Company’s flagship brand - LINK continued to maintain its growth momentum, with both local and export volumes for the LINK range showing a solid year on year improvement. In yet another notable development for the year, the Company succeeded in diversifying into several new export markets. The range of high quality products manufactured in line with HACCP and GMP standards, proved to be a

31TIDES OF CHANGE
IndustrialSolutions
A window of opportunity to grow volumes also emerged in the rubber-latex sector, enabling us to introduce new targeted solutions for the dry rubber segment.
CIC’s Industrial Solutions business offers a wide range of solutions to support several key industries in the Country. The segments’ core business is the supply of Binders for the local paint industry. Binders produced at the state-of-the-art plant in Panagoda in line with global standards, gives CIC a significant competitive edge and a strong leadership position in the local Binder market. Meanwhile access to quality raw material supply sources across the globe helps the Industrial Solutions segment to diversify its offering to cater to a number of major industries.
The pandemic environment in the year under review, brought some notable challenges for the Industrial Solutions business. With the pandemic induced economic slow down impacting different industries in unplanned ways the demand for industrial solutions varied considerably, making the year under review a tough one for the segment.
The demand for Binders declined significantly as a cascading effect of the slow down in the construction industry. With the construction industry at a standstill for a good part of the year the demand for paints also progressively deteriorated causing the Binder market to shrink in the first nine months of the year. However, a visible uptick in demand for Binders from January 2021 onwards provided a strong opportunity to grow volumes in the last quarter of the year.
Lower volumes were noted in several other product categories amidst weak demand from textile and flexible packaging industries as well as the beverage sector. While the demand for water treatment solutions declined as the Leisure sector came under pressure in the first half of the year, the broad based revival of industry in the latter part of 2020 helped boost volumes in the last two quarters of the FY 2020/21.

CIC HOLDINGS PLC Annual Report 2020/2132
Sector Review - Industrial Solution
A window of opportunity to grow volumes also emerged on the back of good growth in the rubber-latex sector. Moving swiftly to capitalise on these trends, the Industrial Solutions secured a new strategic tie up which enabled the introduction of new targeted solutions specifically for the dry rubber segment.
Our packaging sector which manufactures and supplies speciality plastic packaging mainly to local industries performed well during the year due to increased volumes from several sectors including, Oil, Pharmaceuticals and
Future OutlookWith the economic revival seen from January 2021 showing signs of gathering momentum, most industries are expected to grow steadily over the next 12 - 18 months.
Proposed Action
Diversify the Binder range to further consolidate captive market share
Deepen the penetration into selected sectors that demonstrate growth potential in the post COVID economic revival
reduced raw material prices in early parts of the year. However, the pandemic situation had a negative impact on performance in some sectors. Demand for water bottles and soft drinks were very low as the leisure sector came under pressure. Demand for these bottles from local consumers also got affected as there were no social events or functions during the first half of the year.
Going forward, the government decision to restrict single use PET bottles in certain sectors will have a significant impact on future performance of the Company.

33TIDES OF CHANGE
CropSolutions
Favourable weather conditions and the government’s efforts to boost cultivation activities created a solid growth opportunity.
CIC’s Crop Solutions division provides vital support for the Country’s agriculture sector through the provision of key agriculture inputs such as Plant Protection Solutions, Plant Nutrients and Seeds.
Strategic partnerships with a wide network of international suppliers formed over the years has enabled the Crop Solutions segment to consistently expand its portfolio of branded Plant Protection and Plant Nutrition solutions. Offering a combination of organic and non-organic solutions, CIC’s Crop Solutions segment dominates the local market and is the market leader in both the Plant Protection space and the Plant Nutrition area.
CIC Crop Solutions segment is also the leading supplier of Seeds to the local market. Offering a wide range of seeds, from several different varieties of paddy to a host of vegetables and fruits, the segment has been fueling the growth of Sri Lanka’s agriculture sector for many years.
Favourable weather patterns coupled with the government’s efforts to boost cultivation activity amidst COVID-19 related food security concerns led to a heightened demand for all types of agricultural inputs in 2020, and creating a solid growth opportunity for all three verticals under CIC’s Crop Solutions umbrella to grow aggressively in the year under review.
Plant ProtectionBenefiting from the favourable market conditions, the Plant Protection vertical registered outstanding results for the FY 2020/21. With the demand for its conventional Plant Protection range growing steadily throughout the year, and new products launched in the latter part of the previous year also gaining traction, a significant volume increase was noted over the previous year.

CIC HOLDINGS PLC Annual Report 2020/2134
Sector Review - Crop Solutions
The segment did however face its share of challenges in the year under review owing to price volatility and raw material shortages due to COVID related global supply chain disruptions. Exchange rate fluctuations along with logistics delays attributed to COVID protocols on the ground were a few of the other concerns.
Competitive pressures also intensified as market expansion appeared to be drawing in new players offering low quality generic products. Amidst this backdrop a concerted effort was made to reinforce CIC’s top of the range portfolio of high quality, branded Plant Protection Solutions. In this regard, awareness building sessions were undertaken in partnership with a number of agricultural bodies, while channel management activities were further strengthened with additional resources mobilised to enable the doorstep delivery service to be implemented across all regions in the Country.
The product range was also further augmented with the launch of a highly efficient product variant for the protection of paddy crops. The new product which is the result of CIC’s latest strategic tie up with a leading European supplier, is the first of its kind in the local market and thus giving CIC first mover advantage in this space.
Plant NutritionThe Plant Nutrition vertical too performed exceedingly well in FY 2020/21, supported by a solid expansion in the market for bulk Fertilizers - the segment’s main product line. With the demand for bulk fertilizers reaching a record high in 2020, the segments’ import quota allocation was fully utilised, prompting immediate action to secure an additional quota enhancement in order to
ensure uninterrupted supply to the market. At the same time, procurement and logistics activities were further streamlined, with a view to reducing time to market.
Meanwhile having already taken the first steps towards diversifying the portfolio, the compound fertilizer business was further expanded in the year under review and accompanied by aggressive field promotional activities to raise awareness regarding the versatile new compound fertilizer business. .
Future OutlookThe recent government policy directive in advocating organic food production in the country is expected to have a negative impact on both Plant Protection and Plant Nutrient businesses as most of their current product portfolios are not compatible with organic farming. Whilst this major policy shift will temporarily unsettle these two key businesses of the Group, it would open up a host of new opportunities for all three verticals. The management is already in contact with its international principals to source an appropriate product range to support the organic agriculture drive initiated by the government.
Current indications appear to suggest a very compelling future for Sri Lanka’s agriculture sector, assuming of course that weather conditions remain favourable for the most part. Average annual cultivation is thus expected to grow at a steady pace over the medium term. Consequently, the market for Plant Protection solutions, Plant Nutrients and Seeds is likely to skyrocket over the next 3 -5 years, which would open up a host of very credible opportunities for all three verticals under CIC’s Crop Solutions segment to grow captive market share and re-affirm their leadership status.
Proposed Action Plant Protection Plant Nutrition Seeds
Continuously update the product portfolio
Strengthen the supplier base to gain access to new generation of molecules that are compatible to organic farming.
Enhance the storage and warehousing infrastructure
Tap into global supplier networks to source organically based plant nutrients.
Invest in producing value added organic solutions, locally.
Redirect R & D to focus on developing high value specialty seed varieties
Invest in suitable automation and mechanisation to improve overall efficiency of farm operations.
SeedsThe Seeds business tabled good results for the FY 2020/21 amidst the heightened demand for its imported (fruit and vegetable) seeds as well as the locally produced paddy seed. The response for the new hybrid seed range introduced during the year was also very encouraging. In an effort to respond more firmly to emerging demand for hybrid seed, additional resources were deployed towards local R & D activities in the current financial year.

Waves OFGrowth
1st Quarter Financial Results Released on 22nd July 20202ndQuarter Financial Results Released on 21st October 20203rd Quarter Financial Results Released on 22nd January 20214th Quarter Financial Results Released on 21st May 2021
2020/21 Interim Dividend Paid 09th April 20212020/21 Final Dividend Payment Date if approved at AGM 22nd July 202158th Annual General Meeting 30th June 2021
FINANCIAL CALENDAR
FINANCIAL REPORTS
Annual Report of the Directors on the Affairs of the Company 36
Directors’ Responsibility for Financial Reporting 41
Chief Operating Officer’s and Chief Financial Officer’s Responsibility Statement 42
Independent Auditor’s Report 43
Statement of Profit or Loss and Other Comprehensive Income 46
Statement of Financial Position 47
Statement of Changes in Equity 49
Statement of Cash Flow 51
Notes to the Financial Statements 53

CIC HOLDINGS PLC Annual Report 2020/2136
ANNUAL REPORT OF THE DIRECTORS ON THE AFFAIRS OF THE COMPANYThe Directors have pleasure in presenting to members the 58th Annual Report together with the Audited Financial Statements for the year ended 31st March 2021 of CIC Holdings PLC, a public limited liability Company.
GENERALCIC Holdings PLC (formerly known as Chemical Industries (Colombo) PLC) was incorporated on 12th May 1964 under the Companies Ordinance No. 51 of 1938 quoted in the Colombo Brokers Association (now Colombo Stock Exchange) from 1964 and re-registered as per the Companies Act No. 7 of 2007 on 21st November 2007. The name of the company was changed to CIC Holdings PLC from 14th January 2011.
The registered office of the Company is at 199, Kew Road, Colombo 02, at which the Company’s head office is situated.
REVIEW OF THE YEAR The Audited Financial Statements were approved by the Board of Directors on 21st May 2021. The Chairman’s Statement and Review of the Business set out the state of affairs and performance of the Company during the year and incorporate events subsequent to the reporting date.
PRINCIPAL ACTIVITIESThe Company carries on the business of merchandising and manufacturing as its principal activities. There were no significant changes in the activities of the Company during the year under review.
The Group operates in Agri Produce, Crop Solutions, Livestock, Industrial Solution and Health & Personal Care market segments and during the year under review there were no changes in the activities of subsidiary companies which include Chemanex PLC and its subsidiaries, CIC Agri Businesses (Pvt) Limited and its subsidiaries, CISCO Speciality Packaging (Pvt) Limited, CIC Feeds (Pvt) Limited and its subsidiaries, Link Natural Products (Pvt) Limited, CIC CropGuard (Pvt) Limited, Crop Management Services (Pvt) Limited, Colombo Industrial Agencies Limited, CIC Lifesciences Limited, CIC Properties (Private) Limited, Cropwiz (Pvt) Ltd, Unipower (Pvt) Ltd and CIC Healthcare (Pvt) Ltd. Subsidiary company Precision Agricultural Technologies (Pvt) Ltd is under liquidation
ULTIMATE PARENTThe ultimate holding company is Paints & General Industries Limited.
SUBSIDIARIESCIC Agri Businesses (Private) Limited and its subsidiaries blend and market fertilizer, seed, planting material, fruit, vegetable, animal based farm produce and grains, namely, Rice and Corn.
Subsidiary companies of CIC Agri Businesses (Private) Limited are:
CIC Seeds (Private) Limited, Wayamba Agro Fertilizers Company Limited, CIC Agri Biotech (Private) Limited, CIC Agri Produce Exports (Private) Limited, CIC Dairies (Pvt) Ltd and CIC Grains (Pvt) Ltd. CIC Dairy Breeding & Management (Private) Limited and CIC Agri Produce Marketing (Private) Limited are subsidiaries of CIC Seeds (Private) Limited.
CIC Feeds (Private) Limited markets animal feed and day-old chicks, while its subsidiaries market Veterinary Medicines and produce and process Poultry products. The subsidiary companies of CIC Feeds (Private) Limited are, CIC Vetcare (Private) Limited, CIC Poultry Farms Limited and CIC Bio Security Breeder Farms Limited.
Chemanex PLC carries on the business of merchandising and manufacturing as its principal activity. The subsidiary companies of Chemanex PLC, Chemanex Exports (Private) Limited and Chemcel (Private) Limited are under liquidation. Rainforest Eco Lodge (Private) Limited is an associate company.
CISCO Speciality Packaging (Private) Limited manufactures speciality plastic packaging.
Link Natural Products (Private) Limited manufactures and markets Herbal Pharmaceuticals, Herbal Healthcare products and essential oils.
Colombo Industrial Agencies Limited owns and manages a Store Complex at Ekala.
Crop Management Services (Private) Limited remains as an investment company since losing the management contract of Maturata Plantations Limited.
CIC CropGuard (Private) Limited markets a range of Pesticides from principals other than Syngenta.
CIC Lifesciences Limited manufactures and markets Pharmaceuticals.
CIC Properties (Private) Limited owns properties for the Group.
Cropwiz (Private) Limited grows and exports vegetables.
Unipower (Pvt) Limited imports, blends and markets specialised fertilizers
CIC Healthcare (Private) Limited merchandising healthcare products
EQUITY ACCOUNTED INVESTEESAkzo Nobel Paints Lanka (Pvt) Ltd markets Surface Coatings, Automotive Paints and Ancillaries.
CORPORATE DONATIONSDonations made during the year amounted to Rs. 998,000/-. (2020– Rs. 633,000/-)
COVID RESPONSEAs Covid-19 spread across the globe, we set up dedicated task forces charged with keeping our people safe and our operations running. We reinforced safety and hygiene protocols across our offices and facilities, shielding high-risk employees, protecting frontline workers and moving office employees to ‘remote work mode’. As a result, and with the support of local authorities, all our key assets operated with only minor interruptions, and we helped keep essential food and feed supply chains moving.
With many employees across CIC working from home, and social distancing measures in place everywhere, we brought training courses and activities online through forums and digital interactions, to support the continued development of our people despite restrictions on travel and meetings.
In business relationships, true to our customer-centric approach, we shared market intelligence with customers, digitized transactions and processes, and worked closely with partners to meet our commitments despite operational challenges presented by the pandemic.
While Covid-19 presented significant challenges for our usual interaction with farmers and suppliers, continuing to offer them direct support and training remained a

37TIDES OF CHANGE
priority for CIC in 2020. Observing local safety and hygiene measures, and using innovative remote training alternatives, we ensured that the important work to support farming communities, working with customers, peers, and partners.
FUTURE DEVELOPMENTSThe Government has announced its intension to substitute organic fertilizer in place of chemical fertilizer as a policy. We have been marketing small quantities of organic fertilizer and with the new Policy will accelerate our operations in the organic fertilizer sector. We have also made an acquisition in a supplier of organic fertilizer. We are also accelerating our efforts to procure Organic Agrochemicals in line with policies currently indicated by the Government.
The Group will also seek to consolidate its market share in respect of adhesives and speciality chemicals and will further seek to strengthen and broad base its presence in the local pharmaceutical manufacturing space by also accessing the private market while conforming and supporting the Government’s policy to promote locally manufactured pharmaceuticals.
FINANCIAL STATEMENTSThe Financial Statements of the Company and the Group which are duly certified by the General Manager - Finance and approved by the Board of Directors and signed by two directors of the Company in compliance with the requirements of the Sections 151, 152
and 168 of the Companies Act No 07 of 2007 are given on pages 46 to 127 of the Annual Report.
SUBDIVISION OF SHARESDuring the year on recommendation of the Board the shareholders of the company approved subdivision of one (01) ordinary voting share into four (04) ordinary voting shares and one (01) non-voting (class x) share into four (04) non-voting (class x) shares resulting in an increase of the total number of shares of the Company to 379,080,000 shares from 94,770,000 shares
PROFITS AND APPROPRIATIONS
Company GroupFor the year ended 31st March 2021
Rs. ‘0002020
Rs. ‘0002021
Rs. ‘0002020
Rs. ‘000
Profit for the year after depreciation 1,339,635 644,529 4,912,052 1,871,732
From which a deduction is made for taxation and (307,493) (261,738) (975,188) (535,597)for discontinued operations 11,785 18,803 (90,771) (256,735)
1,043,927 401,594 3,846,093 1,079,400From which a deduction is made for non-controlling interest (713,682) (246,816)
1,043,927 401,594 3,132,411 832,584
To which must be added/ (deducted) other comprehensive income 16,651 (20,213) (45,310) (22,259)Total comprehensive income 1,060,578 381,381 3,087,101 810,325To which must be added the unappropriated profit brought forward from the previous year and
940,443 748,602 5,639,021 5,100,447
Adjustment on initial application of SLFRS 09, 15 & 16 - - - (731)
De-recognition of financial assets due to disposal - - 103,667 (80,267)
Realisation of revaluation reserve and deferred tax due to disposal 128,520 - 296,122 -
Adjustment due to change in holding - - (42,917) -
Liquidation of subsidiary - - - 185
Transferred from General Reserve - - 122,172 -
Adjustment due to share repurchase of a subsidiary - - - (1,398)
Making available for appropriation amount of 2,001,021 1,129,983 9,205,166 5,828,561Out of which a dividend was paid (2021 - Rs 1.25) (473,850) (189,540) (473,850) (189,540)So that the unappropriated profit carried forward will be 1,655,691 940,443 8,731,316 5,639,021

CIC HOLDINGS PLC Annual Report 2020/2138
ANNUAL REPORT OF THE DIRECTORS ON THE AFFAIRS OF THE COMPANY
DIVIDENDSFor the year ended 31st March 2021, an interim dividend of Rs. 1.00 per share amounting to Rs. 379.08Mn on Ordinary & Non-Voting (Class X) shares was paid on 09th April 2021.
The Board of Directors has recommended a final dividend of Rs. 1.25 per share amounting to Rs.473.85Mn on the issued capital of Ordinary and Non - Voting (Class X) shares which is payable on 22nd July 2021 if approved by the shareholders at the Annual General Meeting.
As required by Section 56(2) and 56(3) of the Companies Act No. 7 of 2007, the Board of Directors confirms that the Company, based on the information available as at present, satisfies the solvency test immediately after the distribution and in accordance with Section 57 of the Companies Act No. 7 of 2007, have obtained a certificate from Auditors prior to recommending the final dividend of Rs. 1.25 per share for this year, which is to be approved by the shareholders at the Annual General Meeting to be held on 30th June 2021.
INDEPENDENT AUDITOR’S REPORTThe Company’s Auditors Messrs. KPMG, Chartered Accountants performed the audit on the Consolidated Financial Statements for the year ended 31st March 2021 and the Independent Auditor’s Report on the Financial Statements is given on page 43 of the Annual Report as required by Section 168(1) (C) of the Companies Act No 07 of 20.
SIGNIFICANT ACCOUNTING POLICIES AND CHANGES DURING THE YEARThe Company and the Group prepared their Financial Statements in accordance with Sri Lanka Accounting Standards (SLFRS/ LKAS). The significant Accounting Policies adopted in the Financial Statement is given on pages 53 to 70 of the Annual Report as required by the Section 168 (1)(d) of the Companies Act No. 7 of 2007, the Board of Directors wish to confirm that there were no changes to the Accounting Policies used by the Company and the Group during the year.
INTERESTS REGISTERThe Interests Register is maintained by the Company as per the Companies Act No. 7 of 2007. All Directors have made declarations as provided for in Section 192 (2) of the said Act. The related entries were made in the Interests Register during the year under review.
The share ownership of the Directors is indicated on page 39 of the Annual Report.
Directors interest in contracts and remuneration paid to Directors, etc., have been included in the Interests Register which is made available for inspection under the Companies Act No. 7 of 2007 under reference. The details are given on page 114 and 116 of this Annual Report.
DIRECTORSThe qualifications and experience of the Directors are provided on page 10 The following persons were Directors of the Company at the end of the financial year.
S. H. Amarasekera – Chairman
S. Fernando – COO/ Company Secretary
R. S. Captain
S. M. Enderby
J. R. Gunaratne
M. P. Jayawardena
D. T. S. H Mudalige
P. R. Saldin
APPOINTMENTS & RESIGNATIONSDuring the year Mr D. T. S. H. Mudalige and Mr J. R. Gunaratne were appointed to the Board of Directors.
RETIREMENT BY ROTATION AND RE-ELECTIONMr. J. R. Gunaratne retires in terms of Article 25 (2) of the Articles of Association of the Company and being eligible, offers himself for re-election with the unanimous support of the Board.
Mr D. T. S. H. Mudalige retires in terms of Article 25 (2) of the Articles of Association of the Company and being eligible, offers himself for re- election with the unanimous support of the Board.
Mr. R. S. Captain retires in terms of Article 25 (6) of the Articles of Association of the Company and being eligible, offers himself for re-election with the unanimous support of the Board.
Mr. M. P. Jayawardena retires in terms of Article 25 (6) of the Articles of Association of the Company and being eligible, offers himself for re- election with the unanimous support of the Board.
DIRECTORS’ REMUNERATIONDirectors’ remuneration in respect of the Group and the Company, for the financial year ended 31st March 2021 are given in Note 11 of the Financial Statement on page 75 of this Annual Report.
LIST OF DIRECTORS OF SUBSIDIARIES AND ASSOCIATES OF THE COMPANYNames of Directors of all Subsidiaries and Associates of the Company are given on page 134 of this Annual Report.
RELATED PARTY TRANSACTIONSRelated party transactions have been declared at meetings of the Directors and are detailed in Note 44 to the Financial Statements.
EMPLOYEE SHARE OPTION PLAN (ESOP)ESOP of the Company was approved by the shareholders of the Company on 30th June 2016. Under this plan the company was authorised to issue up to 20% of Non- Voting share capital. The option granted under this plan has to be exercised within 10 years of such grant. No employees have been provided with any financial assistance to exercise the option.
DIRECTORS’ SHAREHOLDINGThe Directors together with their close family members’ shareholdings in the Company are as follows:

39TIDES OF CHANGE
As at 31st March 2021 2020Voting Non-Voting Voting Non-Voting
S.H. Amarasekera - - - -R.S. Captain 320 556 80 139S.M. Enderby - - - -S. Fernando - 144,840 - 36,210J. R. Gunaratne (appointed w.e.f. 06 Jan 2021) - N/A - N/AM.P. Jayawardena - 20,000 - 16,200D. T. S. H. Mudalige (appointed w.e.f. 16 Oct 2020) - N/A - N/AP. R. Saldin - 2,000 500
DIRECTORS’ RESPONSIBILITY FOR FINANCIAL REPORTINGThe Directors are responsible for the preparation of the Financial Statements of the Company and the Group, which reflect a true and fair view of the state of affairs. The Directors’ Responsibility in relation to the Financial Statements is detailed on page 41.
AUDIT COMMITTEEThe following Non-Executive Directors of the Board are members of the Audit Committee.
Mr. P. R. Saldin (Chairman), Mr. S. M. Enderby, Mr. M. P. Jayawardena and Mr. D. T. S. H. Mudalige.
Mr. S. H. Amarasekera and Mr. S. Fernando attend the meetings by invitation. Details of the Audit Committee are given on page 18.
HUMAN CAPITAL & COMPENSATION COMMITTEE (REMUNERATION COMMITTEE)The following Non-Executive Directors of the Board are members of the Remuneration Committee.
Mr. P. R. Saldin (Chairman), Mr. S. H. Amarasekera, Mr. R. S. Captain, Mr. S. M. Enderby and Mr. M. P. Jayawardena.
Mr. S. Fernando attends the Meetings by invitation.
NOMINATIONS COMMITTEEThe following Non-Executive Directors of the Board are members of the Nominations Committee.
Mr. S. H. Amarasekera (Chairman), Mr. R. S. Captain and Mr. P. R. Saldin.
Mr. S. Fernando attends the Meetings by invitation.
RELATED PARTY REVIEW COMMITTEEThe following Non-Executive Directors of the Board are members of the Related Party Review Committee.
Mr. M P Jayawardena (Chairman), and S.M. Enderby.
Mr. S. Fernando attends the Meetings by invitation.
Compliance with section 9 of Listing RulesThe Directors confirm compliance with Section 9 of the Listing Rules in relation to Related Party Transactions
ENTERPRISE GOVERNANCESystems and procedures which are in place as good Enterprise Governance is an essential component in today’s corporate culture.
The practices in this regard are given in Enterprise Governance of this Annual Report on pages 14 to 17.
VISION, MISSION AND CORPORATE CONDUCTThe Company’s Vision and Mission are given on page 3 of this Report. The business activities of the Company are conducted with the highest level of ethical standards in achieving its Vision and Mission. The Company issues a copy of its code of ethics to each and every employee who are required to abide by the Company’s code of conduct.
EQUITABLE TREATMENT TO SHAREHOLDERSThe Company has made all endeavours to ensure equitable treatment to all shareholders.
SYSTEMS AND INTERNAL CONTROLSThe Directors acknowledge their responsibility for the Group’s system of internal control. The system is designed to give assurance, inter alia, regarding the safeguarding of assets, the maintenance of proper accounting records and the reliability of the financial information generated. However, any system can only ensure reasonable but not absolute assurance that errors and irregularities are either prevented or detected within a reasonable time period.
The Board having reviewed the system of internal control, is satisfied with the Group’s adherence to and effectiveness of these controls for the period up to the date of signing the Financial Statements.
INCOME TAX EXPENSESIncome Tax expenses have been computed at the rates given in Note 12 to the Financial Statements. The Group has also provided deferred tax on all known temporary differences under the liability method, as permitted by the Sri Lanka Accounting standards – LKAS 12 on “Income Taxes”
REVENUEThe revenue of the Group was Rs 37.23Bn (2020 – Rs 30.53Bn). A detailed analysis of the Group revenue that identifies the contributions from different segments of the Group businesses is given in Note 06 to the Financial Statements.

CIC HOLDINGS PLC Annual Report 2020/2140
CAPITAL EXPENDITUREDetails of property, plant and equipment and their movements during the year are listed in Note 16 to the Financial Statements. Capital Expenditure approved and contracted for are given page 82.
MARKET VALUE OF FREEHOLD PROPERTIESAll freehold lands of the Group Companies were re-valued by professionally qualified independent valuers as at 31st December 2020 and brought into Financial Statements. The Directors are of the opinion that the re-valued amounts are not in excess of the current market values of such properties. Details of revaluations are listed in Note 16 to the Financial Statements.
INVESTMENTSDetails of investments and their movements during the year are listed in Notes 22,23,24 and 29 to the Financial Statements.
RESERVESTotal reserves of the Group stood at Rs 12.22 Bn as at 31st March 2021 (Rs. 8.6Bn as at 31st March 2020) details of which are given in the Statement of Changes in Equity.
STATED CAPITALThe Stated Capital is the total of all amounts received by the Company in respect of the issue of shares. The Stated Capital of the Company amounts to Rs. 1,008,450,000/- comprising of 291,600,000 Ordinary Shares and 87,480,000 Non-Voting (Class X) Shares.
SHARE INFORMATIONInformation relating to earnings, dividends, net assets per share, market value of a share and information on share trading are stated under Shareholder and Investor Information.
SHAREHOLDINGA list of top 20 shareholders for both Voting and Non-Voting is given on pages 129 to 130 of the Annual Report.
ENVIRONMENTAL PROTECTIONThe Company has not engaged in any activity which is harmful to the environment.
ANNUAL REPORT OF THE DIRECTORS ON THE AFFAIRS OF THE COMPANY
ANNUAL REPORTThe Board of Directors approved the Consolidated financial Statements on 21st May 2021. The appropriate number of copies of this Report will be submitted to the Colombo Stock Exchange and the Sri Lanka Accounting Standards and Monitoring Board. As required by the Section 170 (1) of the Companies Act No 07 of 2007 duly signed Financial Statement of the Company and the Group together with Auditors’ Report will also be delivered to Register of Companies for registration within 20 working days after the Financial Statements of the Company and Group are signed.
COMPLIANCE WITH LAWS AND REGULATIONSThe Company has not engaged in any activity against the prevailing laws and regulations. Compliances with provisions in laws and regulations are confirmed to the Board of Directors at all Board Meetings.
STATUTORY PAYMENTSThe Directors are satisfied that all Statutory Payments to the Government and other Statutory Institutions including employee related payments have been made on time to the best of their knowledge and belief.
HUMAN RESOURCEThe Company’s Human Resource Management Policies and Practices are designed to improve efficiency, effectiveness and productivity and also nurture collaborative teams that enrich the work and learning environment of all our staff.
GOING CONCERNAfter considering the financial position, operating conditions, regulatory and other factors and such matters required to be addressed in the Corporate Governance Code, the Directors have reasonable expectation that the Company possesses adequate resources to continue to be in operation for the foreseeable future. For this reason, they continue to adopt the going concern basis in preparing the Financial Statements.
EVENTS AFTER THE REPORTING DATENo material events have taken place after the reporting date which require an adjustment to or a disclosure other than those disclosed in Note 41 to the Financial Statements.
AUDITORS’ REMUNERATION AND INTEREST IN CONTRACTS WITH THE COMPANYThe Company’s auditors during the period under review were Messrs. KPMG, Chartered Accountants. A sum of Rs. 6.03Mn was paid to them as consolidated audit fees during the year under review (Company– Rs. 2.40Mn) and a sum of Rs. 0.65Mn was paid by the Company for tax and other related services.
Based on the declaration from Messrs. KPMG, and as far as the Directors are aware, the auditors do not have any relationship or interest in the Company or its subsidiaries other than those disclosed in the above paragraph.
RE-APPOINTMENT OF AUDITORSThe retiring auditors Messrs. KPMG have intimated their willingness to continue in office and a resolution to re-appoint them as auditors and authorising the Directors to fix their remuneration will be proposed at the upcoming Annual General Meeting.
NOTICE OF MEETINGNotice of Meeting of the Fifty Eigth Annual General Meeting is enclosed herewith.
As required by the Section 168 (1) (k) of the Companies Act No 07 of 2007, the Board of Directors does acknowledge the contents of this Annual Report.
By Order of the Board,
S. H. Amarasekera Chairman
P. R. Saldin Director
S. FernandoCOO/Company Secretary
21st May 2021

41TIDES OF CHANGE
DIRECTORS’ RESPONSIBILITYFOR FINANCIAL REPORTINGThe Directors’ responsibility in relation to the Financial Statements is detailed below. The Report of the Auditors sets out their responsibility in relation to the Financial Statements.
The Companies Act No. 07 of 2007 requires that the Directors prepare the Financial Statements for each financial year, which reflect a true and fair view of the state of affairs of the Company and the Group as at the end of the financial year and the profit/ loss for that financial year. In preparation of these statements, the Directors are required to ensure that,
1. Appropriate accounting policies have been selected and applied based on the new financial reporting framework on a consistent basis while reasonable and prudent judgements have been made so that the form and substance of transactions are properly reflected. Material departures, if any, are disclosed and explained. The Board of Directors accepts responsibility for the integrity and objectivity of the Financial Statements presented in this Annual Report.
2. Financial Statements prepared and presented in this Annual Report have been prepared based on new Sri Lanka Accounting Standards (SLFRS/LKAS) which came to effect from 1st January 2012 and are in agreement with the underlying books of account and in conformity with the requirements of the Sri Lanka Accounting Standards, Companies Act No. 07 of 2007, Sri Lanka Accounting and Auditing Standards Act No.15 of 1995, the Listing Rules of the Colombo Stock Exchange and the Code on Corporate Governance issued by the Securities and Exchange Commission (SEC) of Sri Lanka.
3. The Company keeps sufficient accounting records to disclose, with reasonable accuracy, the financial position of the Company and that of the Group and to enable them to ensure that the Financial Statements comply with the Companies Act No. 07 of 2007. Also, reasonable steps are taken to safeguard the assets of the Company and to establish appropriate systems of internal controls, which provide reasonable though not absolute assurance to the Directors that assets are safeguarded and internal controls are in place with a view to the prevention and detection of frauds and errors.
4. The Directors are required to prepare the Financial Statements and the Company’s External Auditors, Messrs. KPMG who were appointed in terms of Section 158 of the Companies Act No. 7 of 2007 and in accordance with a resolution passed at the last Annual General Meeting, were provided with every opportunity to undertake the inspections they considered appropriate. They carried out reviews and sample checks on the system of internal controls as they considered appropriate and necessary for expressing their opinion on the Financial Statements and maintaining accounting records. They have examined the Financial Statements made available to them by the Board of Directors of the Company together with all the financial records, related data and Minutes of shareholders’ and Directors’ meetings and expressed their opinion which appears as reported by them on page 43 to 45.
5. The Company and its quoted subsidiaries, have met all the requirements under Section 7 on the Continuing Listing Requirements of the Listing Rules of the Colombo Stock Exchange, wherever applicable.
As required by Section 56(2) of the Companies Act No. 7 of 2007, the Board of Directors confirms that the Company, based on the information available as at present, satisfies the solvency test immediately after the distribution and in accordance with Section 57 of the Companies Act No. 7 of 2007, have obtained a certificate from Auditors prior to recommending the final dividend of Rs. 1.25 per share for this year, which is to be approved by the shareholders at the Annual General Meeting to be held on 30th June 2021.
The Directors are of the view that they have discharged their responsibilities as set out in this statement.
COMPLIANCE REPORTThe Directors confirm that to the best of their knowledge, all taxes, duties and levies payable by the Company and its Group companies, all contributions, levies and taxes payable on behalf of and in respect of the employees of the Company and its Group companies, and all other known statutory dues as were due and payable by the Company and its Group companies as at the reporting date have been paid or where relevant provided for.
By Order of the Board,
S. FernandoChief Operating Officer/Company Secretary
21st May 2021

CIC HOLDINGS PLC Annual Report 2020/2142
CHIEF OPERATING OFFICER’S ANDCHIEF FINANCIAL OFFICER’SRESPONSIBILITY STATEMENT
The Financial Statements of CIC Holdings PLC and the Consolidated Financial Statements of the Group are prepared in conformity with requirements of the
• Sri Lanka Accounting Standards issued by The Institute of Chartered Accountants of Sri Lanka,
• Companies Act No. 07 of 2007,
• Sri Lanka Accounting & Auditing Standards Act No 15 of 1995,
• Listing Rules of the Colombo Stock Exchange and
• Code of Corporate Governance issued by Securities and Exchange Commission of Sri Lanka.
The Board of Directors and the management of our Company accept responsibility for the integrity and objectivity of these Financial Statements. The estimates and judgements relating to the Financial Statements were made on a prudent and reasonable basis, in order that the Financial Statements reflect in a true and fair manner, the form and substance of transactions, and reasonably present the Company’s state of affairs. To ensure this, the Company has taken proper and sufficient care in installing a system of internal controls and accounting records, for safeguarding assets, and for preventing and detecting frauds as well as other irregularities, which is reviewed, evaluated and updated on an ongoing basis. Our Internal Auditors have conducted periodic audits to provide reasonable assurance that the established
policies and procedures of the Company were consistently followed. However, there are inherent limitations that should be recognised in weighing the assurances provided by any system of internal controls and accounting.
The Financial Statements were audited by Messrs. KPMG, Chartered Accountants, the Independent Auditors.
The Audit Committee of our Company meets periodically with the Internal Auditors and the Independent Auditors to review the manner in which these auditors are performing their responsibilities, and to discuss auditing, internal control and reporting issues. To ensure complete independence, the Independent Auditors and the Internal Auditors have full and free access to the members of the Audit Committee to discuss any matter of substance.
S. FernandoChief Operating Officer
G. P. S. SamarakoonGeneral Manager - Finance
21st May 2021
KPMG Tel +94 - 11 542 6426 (Chartered Accountants) Fax +94 - 11 244 5872 32A, Sir Mohamed Macan Markar Mawatha, +94 - 11 244 6058 P. 0. Box 186, Internet www.kpmg.com/lk Colombo 00300, Sri Lanka.
M.R. Mihular FCA T.J.S. Rajakarier FCA Ms. S.M.B. Jayasekara ACA G.A.U. Karunaratne FCA R.H. Rajan FCA A.M.R.P. Alahakoon ACA
P.Y.S. Perera FCA W.W.J.C. Perera FCA W.K.D.C Abeyrathne FCA R.M.D.B. Rajapakse FCA M.N.M. Shameel ACA
C.P. Jayatilake FCA Ms. S. Joseph FCA S.T.D.L. Perera FCA Ms. B.K.D.T.N. Rodrigo FCA Ms. C.T.K.N. Perera ACA
Principals - S.R.I. Perera FCMA(UK), LLB, Attorney-at-Law, H.S. Goonewardene ACA Ms. P. M. K. Sumanasekara FCA, W. A. A. Weerasekara CFA, ACMA, MRICS
KPMG, a Sri Lankan partnership and a member firm of the KPMG global organization of independent member firms affiliated with KPMG International Limited, a private English company limited by guarantee. All rights reserved

43TIDES OF CHANGE
INDEPENDENTAUDITOR’S REPORT
TO THE SHAREHOLDERS OF CIC HOLDINGS PLC
Report on the Audit of the Financial Statements
OpinionWe have audited the financial statements of CIC Holdings PLC (“the Company”) and the consolidated financial statements of the Company and its subsidiaries (“the Group”), which comprise the statement of financial position as at 31st March 2021, and the statements of profit or loss and other comprehensive income, changes in equity and cash flows for the year then ended, and notes to the financial statements, including a summary of significant accounting policies and other explanatory information as set out on pages 46 to 127 of the annual report.
In our opinion, the accompanying financial statements of the Company and the Group give a true and fair view of the financial position of the Company and the Group as at 31st March 2021, and of their financial performance and its cash flows for the year then ended in accordance with Sri Lanka Accounting Standards.
Basis for OpinionWe conducted our audit in accordance with Sri Lanka Auditing Standards (SLAuSs). Our responsibilities under those standards are further described in the Auditor’s Responsibilities for the Audit of the Financial Statements section of our report. We are independent of the Group in accordance with the Code of Ethics issued by CA Sri Lanka (“Code of Ethics”) and we have fulfilled our other ethical responsibilities in accordance
KPMG Tel +94 - 11 542 6426 (Chartered Accountants) Fax +94 - 11 244 5872 32A, Sir Mohamed Macan Markar Mawatha, +94 - 11 244 6058 P. 0. Box 186, Internet www.kpmg.com/lk Colombo 00300, Sri Lanka.
M.R. Mihular FCA T.J.S. Rajakarier FCA Ms. S.M.B. Jayasekara ACA G.A.U. Karunaratne FCA R.H. Rajan FCA A.M.R.P. Alahakoon ACA
P.Y.S. Perera FCA W.W.J.C. Perera FCA W.K.D.C Abeyrathne FCA R.M.D.B. Rajapakse FCA M.N.M. Shameel ACA
C.P. Jayatilake FCA Ms. S. Joseph FCA S.T.D.L. Perera FCA Ms. B.K.D.T.N. Rodrigo FCA Ms. C.T.K.N. Perera ACA
Principals - S.R.I. Perera FCMA(UK), LLB, Attorney-at-Law, H.S. Goonewardene ACA Ms. P. M. K. Sumanasekara FCA, W. A. A. Weerasekara CFA, ACMA, MRICS
KPMG, a Sri Lankan partnership and a member firm of the KPMG global organization of independent member firms affiliated with KPMG International Limited, a private English company limited by guarantee. All rights reserved
with the Code of Ethics. We believe that the audit evidence we have obtained is sufficient and appropriate to provide a basis for our opinion.
Key Audit Matters Key audit matters are those matters that, in our professional judgment, were of most significance in our audit of the company financial statements and the consolidated financial statements of the current period. These matters were addressed in the context of our audit of the company financial statements and the consolidated financial statement as a whole, and in forming our opinion thereon, and we do not provide a separate opinion on these matters.
1. Impairment of investments in subsidiaries and equity accounted investees
Refer to the significant accounting policy in Note 3.13 and explanatory Notes 22 and 23 to the financial statements.
Risk DescriptionThe Company has recorded Rs. 1.62 Bn as investments in subsidiaries and Rs. 36 Mn as equity accounted investees as at 31st March 2021. The carrying amount of each investments in Subsidiaries have been tested for impairment as individual Cash Generating Units. The carrying amount of these investments could be materially misstated if inappropriate judgments and estimates were used by the management in calculating the recoverable amount for each cash generating unit (‘CGU’) as part of their impairment assessment. The impairment of investments
in subsidiaries and equity accounted investees has increased since some investments have not provided the required return.
We identified assessment of impairment of investment in subsidiaries and equity accounted investees as a key audit matter due to significant degree of management judgment involved in making this assessment and in forecasting the future cash flows of the Companies which could have significant impact on the financial statements. Further, impact of COVID-19 pandemic on the business operations resulted in increased estimates and judgements involved in the assessment of impairment of investment in subsidiaries and equity accounted investees.
Our audit procedures included:
• Evaluating the indications of possible impairment of investments in subsidiaries and equity accounted investees.
• Reviewing the work carried out by component auditors on the assessment of the credibility of business plan and the reasonableness of the discounted cash flow models considered for the going concern assessment of components and impairment of investment in subsidiaries.
• Obtaining the forecasted cash flow projections of the subsidiaries and assessing the reasonableness of the forecasts and challenging the assumptions used in the valuation.
• Assessing the adequacy of disclosures made in the financial statements with the relevant accounting standards.

CIC HOLDINGS PLC Annual Report 2020/2144
2. Provision for impairment of Trade Receivables
Refer to the significant accounting policy in Note 3.14.5 and explanatory Note 26 to the financial statements.
Risk DescriptionThe Group has recognised trade receivable balance of Rs 4.8 Bn as at 31st March 2021, after provision for impairment of Rs. 1.2 Bn.
As described in Note 3.14.5 to the financial statements, management’s provisioning methodology is based on an expected credit loss model as required under SLFRS 9 ‘Financial Instruments’. The Group’s customers operate in number of sectors, having different credit profiles. The determination of provision for impairment using expected credit loss model is subject to number of key judgments and assumptions such as forward looking probability of default (PD), loss given default (LGD), macroeconomic scenarios including their weighting and judgments over the use of data inputs required.
Impairment of trade receivables remains one of the most significant judgements made by management particularly in light of the uncertain economic outlook in Sri Lanka and the impact of COVID-19 pandemic on each sectors the Group operates.
We identified impairment of trade receivables as a key audit matter for our audit, as it requires management to exercise subjective judgment in making assumptions and estimates for the assessment of provision for impairment of trade receivables.
Our audit procedures included:
• Evaluating the appropriateness of the impairment methodology adopted by the Group in accordance with SLFRS 9 and challenging the key assumptions and evaluating the reasonableness of the key judgments and methodology used by the management.
• Assessing the appropriateness of impairment provision by considering the estimation uncertainties by management pursuant to the COVID-19 outbreak in determining loss allowances, including assessing the appropriateness of the key parameters and assumptions used in the expected credit loss model.
• Evaluating the completeness, accuracy and relevance of data used in preparation of the impairment provision.
• Comparing the economic factors used in the models to market information to assess whether they are aligned with the market and economic development.
• Assessing the adequacy of the disclosures in the financial statements in accordance with the relevant accounting standards.
3. Revaluation of LandsRefer to the significant accounting policy in Note 3.8.3 and explanatory Note 16 to the financial statements.
Risk DescriptionThe Group has revalued its lands amounting to Rs. 4 Bn as at 31st March 2021 and recognised a revaluation gain of Rs. 895 Mn, for the year ended 31st March 2021.
The Group has engaged an independent professional valuer with appropriate expertise to determine the fair value of these properties in accordance with recognised industry standards. Further, the Group has considered COVID-19 Pandemic for the land valuation to reflect the associated risks in the valuation model based on reasonable and supportable information available to management at the reporting date. We identified this as a key audit matter because of the significant judgments and estimates involved such as per perch price as disclosed in Note 16 E to the financial statements in assessing the fair values of the lands.
Our audit procedures included:
• Assessing the objectivity, independence, competency and capability of the external valuer engaged by the Group.
• Reading the professional valuer’s reports and assessing the key estimates made by external valuer in deriving the fair values of the lands and comparing the same with evidence of current market values.
• Reviewing the work performed by the component auditors on the revaluation of lands, where necessary.
• Engaging our own internal specialised resources to assess the reasonability of the valuation technique and per perch prices.
• Assessing the adequacy of disclosures made in relation to the valuation technique, sensitivity and estimates used by the external expert in the financial statements.
Other InformationManagement is responsible for the other information. The other information comprises the information included in the annual report, but does not include the financial statements and our auditor’s report thereon.
Our opinion on the financial statements does not cover the other information and we will not express any form of assurance conclusion thereon.
In connection with our audit of the financial statements, our responsibility is to read the other information identified above when it becomes available and, in doing so, consider whether the other information is materially inconsistent with the financial statements or our knowledge obtained in the audit, or otherwise appears to be materially misstated. If based on the work we have performed, we conclude that there is a material misstatement therein, we are required to report that fact.
Responsibilities of Management and Those Charged with Governance for the Financial StatementsManagement is responsible for the preparation of financial statements that give a true and fair view in accordance with Sri Lanka Accounting Standards, and for such internal control as management determines is necessary to enable the preparation of financial statements that are free from material misstatement, whether due to fraud or error.
In preparing the financial statements, management is responsible for assessing the Group’s ability to continue as a going concern, disclosing, as applicable, matters related to going concern and using the going concern basis of accounting unless management either intends to liquidate the Group or to cease operations, or has no realistic alternative but to do so.
Those charged with governance are responsible for overseeing the Company’s and Group’s financial reporting process.

45TIDES OF CHANGE
Auditor’s Responsibilities for the Audit of the Financial StatementsOur objectives are to obtain reasonable assurance about whether the financial statements as a whole are free from material misstatement, whether due to fraud or error, and to issue an auditor’s report that includes our opinion. Reasonable assurance is a high level of assurance, but is not a guarantee that an audit conducted in accordance with SLAuSs will always detect a material misstatement when it exists. Misstatements can arise from fraud or error and are considered material if, individually or in the aggregate, they could reasonably be expected to influence the economic decisions of users taken on the basis of these financial statements.
As part of an audit in accordance with SLAuSs, we exercise professional judgment and maintain professional skepticism throughout the audit. We also:
• Identify and assess the risks of material misstatement of the financial statements, whether due to fraud or error, design and perform audit procedures responsive to those risks, and obtain audit evidence that is sufficient and appropriate to provide a basis for our opinion. The risk of not detecting a material misstatement resulting from fraud is higher than for one resulting from error, as fraud may involve collusion, forgery, intentional omissions, misrepresentations, or the override of internal control.
• Obtain an understanding of internal control relevant to the audit in order to design audit procedures that are appropriate in the circumstances, but not for the purpose of expressing an opinion on the effectiveness of the Company’s internal control.
• Evaluate the appropriateness of accounting policies used and the reasonableness of accounting estimates and related disclosures made by management.
• Conclude on the appropriateness of management’s use of the going concern basis of accounting and, based on the audit evidence obtained, whether a material uncertainty exists related to events or conditions that may cast significant doubt on the Group’s ability to continue
as a going concern. If we conclude that a material uncertainty exists, we are required to draw attention in our auditor’s report to the related disclosures in the financial statements or, if such disclosures are inadequate, to modify our opinion. Our conclusions are based on the audit evidence obtained up to the date of our auditor’s report. However, future events or conditions may cause the Group to cease to continue as a going concern.
• Evaluate the overall presentation, structure and content of the financial statements, including the disclosures, and whether the financial statements represent the underlying transactions and events in a manner that achieves fair presentation.
• Obtain sufficient appropriate audit evidence regarding the financial information of the entities or business activities within the Group to express an opinion on the consolidated financial statements. We are responsible for the direction, supervision and performance of the group audit. We remain solely responsible for our audit opinion.
We communicate with those charged with governance regarding, among other matters, the planned scope and timing of the audit and significant audit findings, including any significant deficiencies in internal control that we identify during our audit.
We also provide those charged with governance with a statement that we have complied with ethical requirements in accordance with the Code of Ethics regarding independence, and to communicate with them all relationships and other matters that may reasonably be thought to bear on our independence, and where applicable, related safeguards.
From the matters communicated with those charged with governance, we determine those matters that were of most significance in the audit of the financial statements of the current period and are therefore the key audit matters. We describe these matters in our auditor’s report unless law or regulation precludes public disclosure about the matter or when, in extremely rare circumstances, we determine that a matter should not be
communicated in our report because the adverse consequences of doing so would reasonably be expected to outweigh the public interest benefits of such communication.
Report on Other Legal and Regulatory RequirementsAs required by section 163 (2) of the Companies Act No. 07 of 2007, we have obtained all the information and explanations that were required for the audit and, as far as appears from our examination, proper accounting records have been kept by the Company.
CA Sri Lanka membership number of the engagement partner responsible for signing this independent auditor’s report is 3029.
Chartered AccountantsColombo
21st May 2021

CIC HOLDINGS PLC Annual Report 2020/2146
STATEMENT OF PROFIT OR LOSS AND OTHER COMPREHENSIVE INCOME
Company GroupFor the year ended 31st March Notes 2021 2020 2021 2020
Rs.’000 Rs.’000 Rs.’000 Rs.’000
Continuing operationsRevenue 6 9,817,814 8,755,565 37,233,343 30,535,563 Cost of sales (7,194,537) (6,386,943) (27,573,794) (22,728,743)Gross profit 2,623,277 2,368,622 9,659,549 7,806,820
Other income 7 647,695 437,280 305,125 360,906 Distribution expenses (1,246,035) (1,195,669) (2,876,836) (3,009,148)Impairment loss on trade receivables (47,892) (43,406) (84,805) (272,593)Administrative expenses (337,630) (295,381) (1,601,744) (1,662,661)Other expenses 8 (37,000) (64,584) (7,582) (36,522)Results from operating activities 1,602,415 1,206,862 5,393,707 3,186,802 Finance income 9.1 49,904 22,826 192,606 200,643 Finance cost 9.2 (312,684) (585,159) (1,140,749) (1,905,726)Finance cost (net) 9 (262,780) (562,333) (948,143) (1,705,083)Share of profit of equity accounted investees (net of tax) 10 - - 466,488 390,013 Profit before tax 11 1,339,635 644,529 4,912,052 1,871,732 Income tax expense 12 (307,493) (261,738) (975,188) (535,597)Profit from continuing operations 1,032,142 382,791 3,936,864 1,336,135 Discontinued operationsProfit/(loss) from discontinued operations (net of tax) 13 11,785 18,803 (90,771) (256,735)Profit for the year 1,043,927 401,594 3,846,093 1,079,400
Other comprehensive incomeItems that will never be reclassified to profit or lossActuarial gains/(losses) on retirement benefit obligations 21,909 (28,074) (3,805) (31,467)Surplus on revaluation of land 231,486 - 894,971 - Deferred tax charge on revaluation surplus (55,557) - (180,863) - Deferred tax impact on revaluation reserve due to rate change 29,264 - 128,396 - Realisation of deferred tax due to disposal - - 69,342 - Income tax on other comprehensive income (5,258) 7,861 (70,371) 8,738 Net gain/(loss) from fair value change in financial assets 60,730 (82,761) 555,957 (422,945)Equity-accounted investees- share of OCI - - (1,986) - Other comprehensive income/ (loss) for the year 282,574 (102,974) 1,391,641 (445,674)Total comprehensive income for the year 1,326,501 298,620 5,237,734 633,726
Profit attributable to : Equity holders of the Company 1,043,927 401,594 3,132,411 832,584 Non- Controlling interests - - 713,682 246,816 Profit for the year 1,043,927 401,594 3,846,093 1,079,400
Total comprehensive income attributable to : Equity holders of the Company 1,326,501 298,620 4,132,671 549,614 Non- Controlling interests - - 1,105,063 84,112 Total comprehensive income for the year 1,326,501 298,620 5,237,734 633,726
Earnings per share Basic/diluted earnings per share (Rs.) 14 2.75 1.06 8.26 2.20 Earnings per share -continuing operationsBasic/diluted earnings per share (Rs.) 2.72 1.01 8.38 2.55
Notes from pages 53 to 127 form an integral part of the Financial Statements
Figures in brackets indicate deductions

47TIDES OF CHANGE
STATEMENT OF FINANCIAL POSITION
Company Group
As at 31st March Notes 2021 2020 2021 2020 Rs.’000 Rs.’000 Rs.’000 Rs.’000
ASSETSNon- current assetsProperty, plant & equipment 16 2,151,100 2,083,159 12,193,664 12,359,815 Investment property 17 - - 2,400 2,400 Capital work-in-progress 18 - - 21,614 21,260 Biological assets 19 - - 221,125 179,610 Intangible assets 20 52,454 29,301 390,480 366,982 Deferred tax assets 21 - - 58,697 20,111 Investment in subsidiaries 22 1,619,543 1,456,208 - - Equity accounted investees 23 36,000 36,000 1,135,730 951,428 Equity investments at fair value through OCI 24 254,841 198,038 263,409 203,603
4,113,938 3,802,706 14,287,119 14,105,209
Current assetsInventories 25 2,341,619 2,438,947 8,297,159 7,318,874 Biological assets 19.7 - - 192,970 194,380 Trade receivables 26 2,635,502 2,642,370 4,835,066 5,538,507 Contract assets 54,607 51,080 82,560 77,847 Investment in sub-lease 27 - 6,876 - 1,906 Other receivables 28 389,550 640,271 5,967,035 6,893,685 Equity investments at fair value through OCI 29 25,844 21,230 1,971,669 764,927 Deposits with banks 689,612 - 923,252 - Cash in hand and at bank 30 237,499 569,919 1,355,112 2,107,659
6,374,233 6,370,693 23,624,823 22,897,785 Assets classified as held for sale 13.2 1,050,060 1,195,628 2,084,000 2,234,135 Assets classified as held for distribution 13.5 197 197 35,237 31,743
7,424,490 7,566,518 25,744,060 25,163,663 Total assets 11,538,428 11,369,224 40,031,179 39,268,872
EQUITY AND LIABILITIESEquity attributable to equity holders of the companyStated capital 31 1,008,450 1,008,450 1,008,450 1,008,450 Capital reserves 32 1,554,197 1,477,524 2,818,526 2,360,463 Revenue reserves 33 2,401,523 1,625,545 9,397,491 6,206,615
4,964,170 4,111,519 13,224,467 9,575,528 Non controlling Interests - - 3,078,520 2,136,220 Total equity 4,964,170 4,111,519 16,302,987 11,711,748
Non-current liabilitiesLoans and borrowings 34.1 78,575 79,791 328,876 965,361 Retirement benefit obligations 35 163,249 171,266 769,585 701,286 Grants 36 - - 7,831 8,663 Deferred tax liabilities 21 334,344 288,433 1,392,554 1,431,923
576,168 539,490 2,498,846 3,107,233

CIC HOLDINGS PLC Annual Report 2020/2148
Company Group
As at 31st March Notes 2021 2020 2021 2020 Rs.’000 Rs.’000 Rs.’000 Rs.’000
Current liabilitiesTrade payables 37 1,656,760 1,285,241 8,308,468 5,547,064 Contract liabilities 75,928 72,486 126,560 121,344 Income tax payable 38 125,907 - 458,310 103,180 Accruals and other payables 617,641 472,346 1,672,411 1,487,774 Loans and borrowings 34.4 3,521,854 4,888,142 9,512,128 16,135,860
5,998,090 6,718,215 20,077,877 23,395,222 Liabilities classified as held for sale 13.2 - - 1,148,394 1,049,121 Liabilities classified as held for distribution 13.5 - - 3,075 5,548
5,998,090 6,718,215 21,229,346 24,449,891 Total liabilities 6,574,258 7,257,705 23,728,192 27,557,124 Total equity and liabilities 11,538,428 11,369,224 40,031,179 39,268,872
Net assets per share (Rs.) 13.10 10.85 34.89 25.26
Notes from pages 53 to 127 form an integral part of the Financial Statements.
It is certified that the Financial Statements have been prepared in accordance with the requirements of the Companies Act No 07 of 2007.
G. P. S. Samarakoon General Manager - Finance
The Board of Directors is responsible for the preparation and presentation of these Financial Statements.
Signed for and on behalf of the Board.
S. H. Amarasekera P. R. Saldin Chairman Director
21st May 2021, Colombo
STATEMENT OF FINANCIAL POSITION
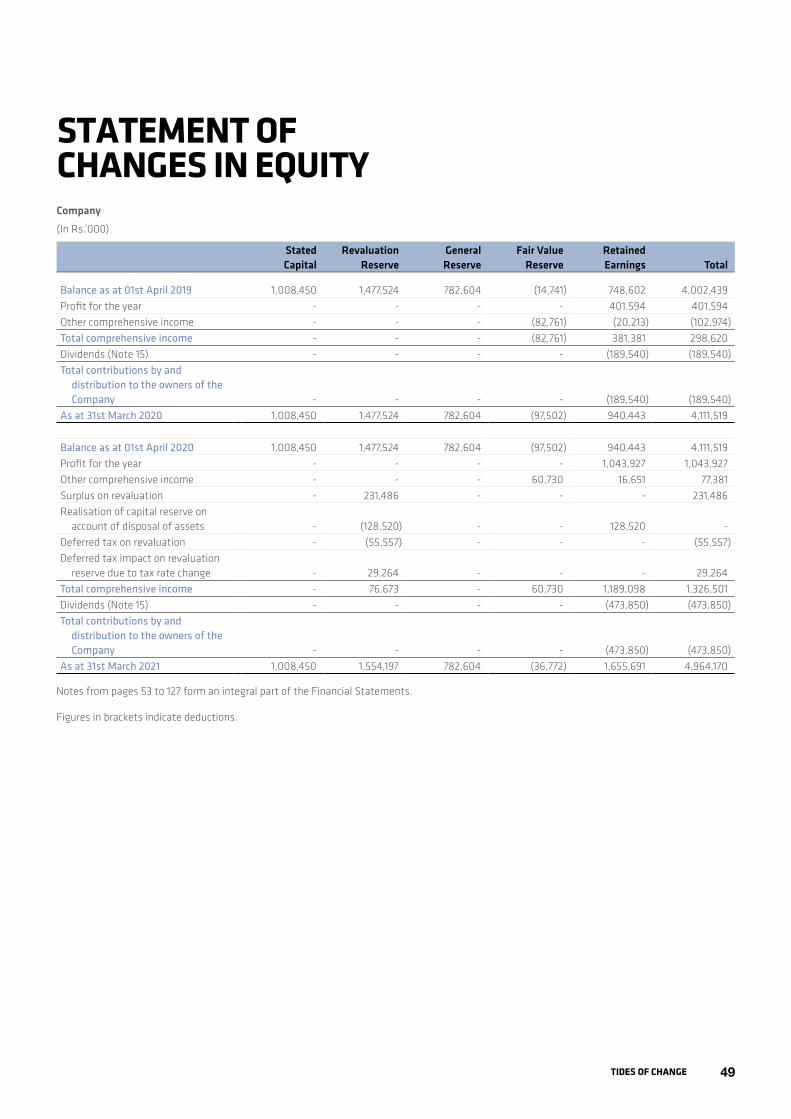
49TIDES OF CHANGE
STATEMENT OF CHANGES IN EQUITYCompany(In Rs.’000)
Stated Capital
Revaluation Reserve
General Reserve
Fair Value Reserve
Retained Earnings Total
Balance as at 01st April 2019 1,008,450 1,477,524 782,604 (14,741) 748,602 4,002,439 Profit for the year - - - - 401,594 401,594 Other comprehensive income - - - (82,761) (20,213) (102,974)Total comprehensive income - - - (82,761) 381,381 298,620 Dividends (Note 15) - - - - (189,540) (189,540)Total contributions by and
distribution to the owners of the Company - - - - (189,540) (189,540)
As at 31st March 2020 1,008,450 1,477,524 782,604 (97,502) 940,443 4,111,519
Balance as at 01st April 2020 1,008,450 1,477,524 782,604 (97,502) 940,443 4,111,519 Profit for the year - - - - 1,043,927 1,043,927 Other comprehensive income - - - 60,730 16,651 77,381 Surplus on revaluation - 231,486 - - - 231,486 Realisation of capital reserve on
account of disposal of assets - (128,520) - - 128,520 - Deferred tax on revaluation - (55,557) - - - (55,557)Deferred tax impact on revaluation
reserve due to tax rate change - 29,264 - - - 29,264 Total comprehensive income - 76,673 - 60,730 1,189,098 1,326,501 Dividends (Note 15) - - - - (473,850) (473,850)Total contributions by and
distribution to the owners of the Company - - - - (473,850) (473,850)
As at 31st March 2021 1,008,450 1,554,197 782,604 (36,772) 1,655,691 4,964,170
Notes from pages 53 to 127 form an integral part of the Financial Statements.
Figures in brackets indicate deductions.

CIC HOLDINGS PLC Annual Report 2020/2150
Group
(In Rs.’000)
Attributable to the equity holders of the company Non- controlling interest
Total Equity
Stated Capital
RevaluationReserves
Fair Value Reserve
General Reserves
Retained Earnings
Total
Balance as at 01st April 2019 1,008,450 2,360,463 (113,562) 861,598 5,099,716 9,216,665 2,060,660 11,277,325 Profit for the year - - - - 832,584 832,584 246,816 1,079,400 Other comprehensive income - - (260,709) - (22,259) (282,968) (162,706) (445,674)De-recognition of financial assets due to disposal - - 80,267 - (80,267) - - - Total comprehensive income for the year - - (180,442) - 730,058 549,616 84,110 633,726 Transactions with shareholders Dividend paid to equity holders of the parent (Note 15) - - - - (189,540) (189,540) - (189,540)Subsidiary dividend to non controlling- interest - - - - - - (7,583) (7,583)Liquidation of sub-subsidiary - - - - 185 185 324 509 Adjustment due to share re-purchase of a subsidiary - - - - (1,398) (1,398) (1,291) (2,689)Transaction with owners of the Company - - - - (190,753) (190,753) (8,550) (199,303)As at 31st March 2020 1,008,450 2,360,463 (294,004) 861,598 5,639,021 9,575,528 2,136,220 11,711,748
Balance as at 01st April 2020 1,008,450 2,360,463 (294,004) 861,598 5,639,021 9,575,528 2,136,220 11,711,748 Profit for the year - - - - 3,132,411 3,132,411 713,682 3,846,093 Other comprehensive income - - 321,978 - (45,310) 276,668 203,127 479,795 Surplus on revaluation - 717,260 - - - 717,260 177,711 894,971 Deferred tax on revaluation - (147,527) - - - (147,527) (33,336) (180,863)Deferred tax impact on revaluation reserve due to tax rate change
- 106,931 - - 106,931 21,465 128,396
Realisation of capital reserve on account of disposal of assets
- (249,194) - - 249,194 - - -
Realisation of deferred tax on account of disposal of assets - - - - 46,928 46,928 22,414 69,342 Transfer between general reserve and retained earnings in a subsidiary
- - - (122,172) 122,172 - - -
De- recognition of financial assets due to disposal - - (103,667) - 103,667 - - - Total comprehensive income for the year - 427,470 218,311 (122,172) 3,609,062 4,132,671 1,105,063 5,237,734 Transactions with shareholders Dividend paid to equity holders of the parent (Note 15) - - - - (473,850) (473,850) - (473,850)Adjustment due to change in holding - 30,593 (1,448) 3,890 (42,917) (9,882) 9,882 - Subsidiary dividend to non controlling- interest - - - - - - (172,645) (172,645)Transaction with owners of the Company - 30,593 (1,448) 3,890 (516,767) (483,732) (162,763) (646,495)As at 31st March 2021 1,008,450 2,818,526 (77,141) 743,316 8,731,316 13,224,467 3,078,520 16,302,987
Notes from pages 53 to 127 form an integral part of the Financial Statements.
Figures in brackets indicate deductions.
STATEMENT OF CHANGES IN EQUITY
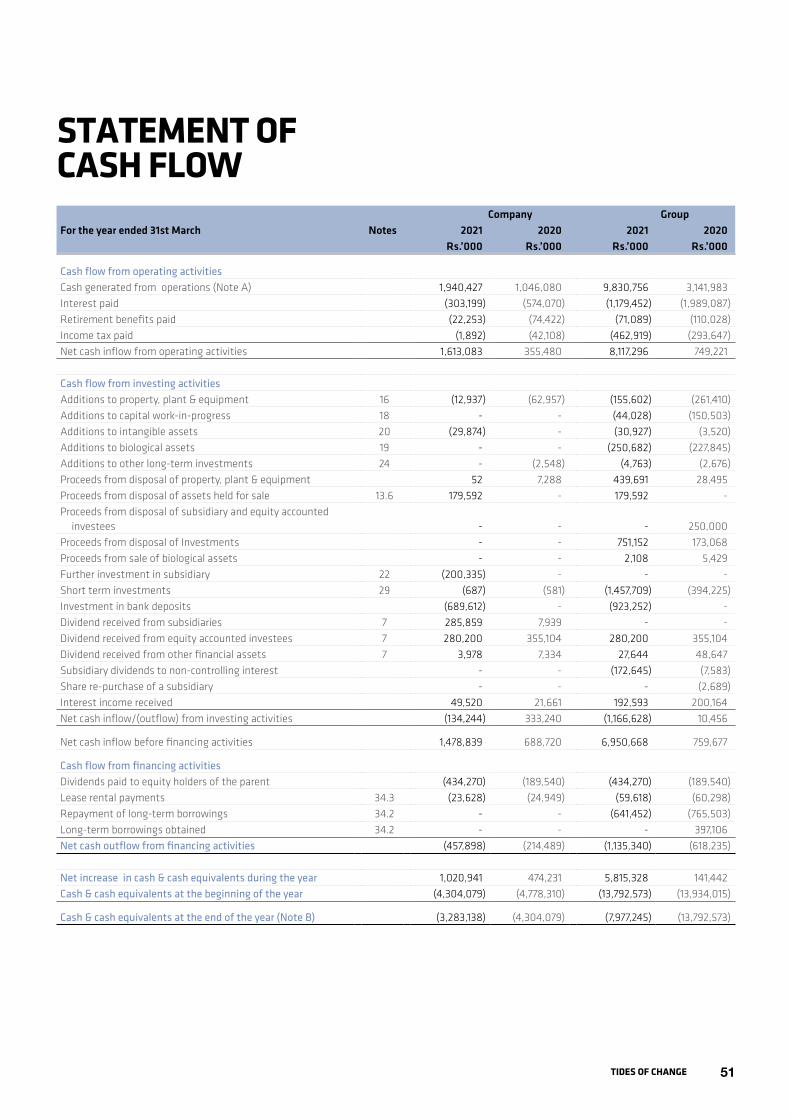
51TIDES OF CHANGE
STATEMENT OF CASH FLOW
Company GroupFor the year ended 31st March Notes 2021 2020 2021 2020
Rs.’000 Rs.’000 Rs.’000 Rs.’000
Cash flow from operating activitiesCash generated from operations (Note A) 1,940,427 1,046,080 9,830,756 3,141,983 Interest paid (303,199) (574,070) (1,179,452) (1,989,087)Retirement benefits paid (22,253) (74,422) (71,089) (110,028)Income tax paid (1,892) (42,108) (462,919) (293,647)Net cash inflow from operating activities 1,613,083 355,480 8,117,296 749,221
Cash flow from investing activitiesAdditions to property, plant & equipment 16 (12,937) (62,957) (155,602) (261,410)Additions to capital work-in-progress 18 - - (44,028) (150,503)Additions to intangible assets 20 (29,874) - (30,927) (3,520)Additions to biological assets 19 - - (250,682) (227,845)Additions to other long-term investments 24 - (2,548) (4,763) (2,676)Proceeds from disposal of property, plant & equipment 52 7,288 439,691 28,495 Proceeds from disposal of assets held for sale 13.6 179,592 - 179,592 - Proceeds from disposal of subsidiary and equity accounted
investees - - - 250,000 Proceeds from disposal of Investments - - 751,152 173,068 Proceeds from sale of biological assets - - 2,108 5,429 Further investment in subsidiary 22 (200,335) - - - Short term investments 29 (687) (581) (1,457,709) (394,225)Investment in bank deposits (689,612) - (923,252) - Dividend received from subsidiaries 7 285,859 7,939 - - Dividend received from equity accounted investees 7 280,200 355,104 280,200 355,104 Dividend received from other financial assets 7 3,978 7,334 27,644 48,647 Subsidiary dividends to non-controlling interest - - (172,645) (7,583)Share re-purchase of a subsidiary - - - (2,689)Interest income received 49,520 21,661 192,593 200,164 Net cash inflow/(outflow) from investing activities (134,244) 333,240 (1,166,628) 10,456
Net cash inflow before financing activities 1,478,839 688,720 6,950,668 759,677
Cash flow from financing activitiesDividends paid to equity holders of the parent (434,270) (189,540) (434,270) (189,540)Lease rental payments 34.3 (23,628) (24,949) (59,618) (60,298)Repayment of long-term borrowings 34.2 - - (641,452) (765,503)Long-term borrowings obtained 34.2 - - - 397,106 Net cash outflow from financing activities (457,898) (214,489) (1,135,340) (618,235)
Net increase in cash & cash equivalents during the year 1,020,941 474,231 5,815,328 141,442 Cash & cash equivalents at the beginning of the year (4,304,079) (4,778,310) (13,792,573) (13,934,015)
Cash & cash equivalents at the end of the year (Note B) (3,283,138) (4,304,079) (7,977,245) (13,792,573)

CIC HOLDINGS PLC Annual Report 2020/2152
Company GroupFor the year ended 31st March Notes 2021 2020 2021 2020
Rs.’000 Rs.’000 Rs.’000 Rs.’000
Note A - Cash generated from operationsProfit before tax from continuing businesses 1,339,635 644,529 4,912,052 1,871,732 Profit/(loss) before tax from discontinued businesses 11,785 18,803 (90,618) (256,624)
Adjustments for:Depreciation on property, plant & equipment 16 164,441 171,615 866,388 889,232 Impairment of property, plant & equipment 8 - - 5,715 103,004 Write off of property, plant & equipment 8 - - - 35 Write off of capital work-in-progress 8 - - 1,002 - Capital work-in-progress expensed 18 - - 194 - (Gain) /loss on disposal of property, plant & equipment 7 (52) 13,674 (109,017) (3,186)Gain on disposal of assets held for sale 7 (34,024) - (34,024) - Gain on disposal of equity accounted investees 7 - - - (157,020)Provision for retirement benefit 35 36,145 38,244 135,583 133,542 Provision for impairment of investment against subsidiaries 8 37,000 17,200 - - Amortisation of intangible assets 20 6,721 5,401 24,798 20,900 Amortisation of right-of-use assets 42.1.1 12,041 12,634 41,891 49,699 Amortisation of biological assets - - 210,704 245,408 Net provision for inter-company receivables - 27,311 - - Provision for impairment of trade receivables 26.2 55,421 38,912 114,557 269,094 (Reversal) / Provision for inventories 25.1 75,320 (6,429) 77,016 122,316 (Gain)/loss from changes in fair value of - biological assets 19.1 - - (3,645) 4,996 Grants amortised 36 - - (832) (961)Rent income waive off received 34.3 - - (615) - Share of profit of equity accounted investees 10 - - (466,488) (390,013)Interest income 9.2 (49,904) (22,826) (192,606) (200,643)Interest expense 9.1, 13.1 312,684 585,159 1,233,543 2,016,477 Dividend income 7 (570,037) (370,377) (27,644) (48,647)Operating profit before working capital changes 1,397,176 1,173,850 6,697,954 4,669,341
(Increase)/decrease in trade and other receivables 40,567 (213,979) 1,226,831 (2,183,094)(Increase)/decrease in inventories 22,008 (53,992) (1,053,891) (66,874)Increase in trade and other payables 480,676 140,201 2,959,862 722,610
Cash generated from operations 1,940,427 1,046,080 9,830,756 3,141,983
Note B - Analysis of cash & cash equivalents at the end of the yearCash in hand and at bank 237,499 569,919 1,388,544 2,138,623 Interest bearing short-term borrowings (3,520,637) (4,873,998) (9,365,789) (15,931,196)
30.2 (3,283,138) (4,304,079) (7,977,245) (13,792,573)
Notes from pages 53 to 127 form an integral part of the Financial Statements.
Figures in brackets indicate deductions.
STATEMENT OF CASH FLOW

53TIDES OF CHANGE
NOTES TO THE FINANCIAL STATEMENTS1. REPORTING ENTITY
CIC Holdings PLC (formerly known as Chemical Industries (Colombo) PLC) is a limited liability Company incorporated and domiciled in Sri Lanka. The address of the Company’s registered office and the principal place of business is 199, Kew Road, Colombo 2.
The Consolidated Financial Statements of CIC Holdings PLC, as at and for the year ended 31st March 2021 comprise of Company and its subsidiaries (together referred to as the ‘Group’ and individually as ‘Group entities’) and the Group’s interest in equity accounted investees. Descriptions of the nature of the operations and principal activities of the Company, its subsidiaries and equity accounted investees are given on page 134.
Ultimate Parent Company of CIC Holdings PLC is Paints & General Industries Limited, a Company domiciled in Sri Lanka.
The Financial Statements of all Companies in the Group as mentioned in Notes 22 and 23 to the Financial Statements are prepared for a common financial year, which ends on 31st March.
2. BASIS OF PREPARATION
2.1 Statement of ComplianceThe Consolidated Financial Statements have been prepared in accordance with Sri Lanka Accounting Standards (Here in after referred to as SLFRS/LKAS ), issued by The Chartered Accountants of Sri Lanka (CASL) and the requirements of the Companies Act No. 7 of 2007.
The Board of Directors of the Company is responsible for the preparation and presentation of the Financial Statements. The Consolidated Financial Statements were authorised for issue by the Directors on 21st May 2021.
2.2 Basis of MeasurementThe Consolidated Financial Statements have been prepared on the historical cost basis, except that land and biological assets, assets held for sales and distribution and short & long term investments are measured at fair value and the retirement benefit obligations are measured at the present value of the defined benefit plans as explained in the respective Notes to the Financial Statements.
2.3 Functional and Presentation CurrencyThe Consolidated Financial Statements are presented in Sri Lankan Rupees, which is the Group’s functional currency. All financial information presented in Sri Lankan Rupees has been rounded to the nearest thousand, unless stated otherwise.
2.4 Use of Estimates and Judgments and Assumptions.The preparation of Consolidated Financial Statements in conformity with Sri Lanka Accounting Standards (SLFRS/LKAS) requires management to make judgments, estimates and assumptions that affect the application of accounting policies and the reporting amounts of assets, liabilities, income and expenses. Actual results may differ from these estimates.
Estimates and underlying assumptions are reviewed on an ongoing basis. Revisions to accounting estimates are recognised in the period in which the estimates are revised in any future periods effected.
2.4.1 JudgmentsInformation about judgements made in applying accounting policies that have the most significant effects on the amounts recognised in the Consolidated Financial Statements is included in the following notes.
• Note 07 – commission income: whether the Group acts as an agent in the transaction rather as a principal;
• Note 23 – equity accounted investees: whether the Group has significant influence over an investee:
• Note 22 – consolidation: whether the Group has control over an investee; and
• Note 34 – lease term; whether the Group is reasonably certain to exercise extension options.
2.4.2 Assumptions and estimation uncertaintiesInformation about the assumptions and estimation uncertainties that have a significant risk of resulting in a material adjustments in the year ended 31st March 2021 is included in the following notes.
• Note 35 – measuring of defined benefit obligations: key actuarial assumptions;
• Note 21 – recognition of deferred tax assets: availability of future taxable profit against which deductible temporary differences and tax losses carried forward can be utilised;
• Note 16 : the Group measured the freehold land at revalued amounts, with changes in fair value being recognised in OCI. The freehold land were revalued by reference to transactions involving properties of similar nature, location and conditions. The Group engaged a valuation specialist to assess fair values as at 31st December 2020 for the freehold land.
• Note 19 – determining the fair value of biological assets on the basis of significant unobservable inputs;
• Note 13.2 – determining the fair value less cost to sell of the disposal group on the basis of significant unobservable input data;
• Note 3.13 - impairment test of the intangible assets and goodwill: key

CIC HOLDINGS PLC Annual Report 2020/2154
assumptions underlying recoverable amounts , including recoverability of development costs;
• Note 40 – recognition and measurement of provisions and contingencies: key assumptions about the likelihood and magnitude;
• Note 46 - measurement of ECL allowance for trade receivables and contract assets: key assumptions in determining the weighted- average loss rate;
• Note 22 – acquisition of subsidiary: fair value measured on a provisional basis:
• Note 42 - leases (incremental borrowing rate) – the basis used when determining the incremental borrowing rate used to measure the lease liability is described in the Note 3.9.1 to these Financial Statements.
• Note 12 - income taxes and deferred tax rates
As per the Guideline issued by Financial Reporting Standards Implementation and Interpretation Committee (IFRIC) of CA Sri Lanka on 23rd April 2021, regarding the “Application of Tax Rates in Measurement of Current and Deferred Tax in LKAS 12”, Financial Statements having a period on or after 26th March 2021, should use the proposed tax rules and rates in the Bill for determination of current and deferred tax.
Accordingly, the Company and the Group have decided to apply the revised income tax rates for both income tax and deferred tax computation for the period ended 31st March 2021.
Management has used its judgment on the application of tax laws including transfer pricing regulations involving identification of associated undertakings, estimation of the respective arm’s length prices and selection of appropriate pricing mechanisms. The Group has complied
with the arm’s length principles relating to transfer pricing as prescribed in the Inland Revenue Act.
2.4.3 Measurement of fair valuesA number of the Group’s accounting policies and disclosures require the measurement of fair values, for both financial and non-financial assets and liabilities.
‘Fair value’ is the price that would be received to sell an asset or paid to transfer a liability in an orderly transaction between market participants at the measurement date in the principal or, in its absence, the most advantageous market to which the Group has access at that date. The fair value of a liability reflects its non-performance risk.
The best evidence of the fair value of a financial instrument on initial recognition is normally the transaction price – i.e. the fair value of the consideration given or received. If the Group determines that the fair value on initial recognition differs from the transaction price and the fair value is evidenced neither by a quoted price in an active market for an identical asset or liability nor based on a valuation technique for which any unobservable inputs are judged to be insignificant in relation to the measurement, then the financial instrument is initially measured at fair value, adjusted to defer the difference between the fair value on initial recognition and the transaction price. Subsequently, that difference is recognised in profit or loss on an appropriate basis over the life of the instrument but no later than when the valuation is wholly supported by observable market data or the transaction is closed out.
The Group has an established control framework with respect to the measurement of fair values. This includes a valuation team that has overall responsibility for overseeing all significant fair value measurements, including Level 3 fair values, and reports directly to the General Manager Finance.
When measuring fair value of an asset or liability, the Group uses observable market data as far as possible. Fair Values are categorised into different levels in a fair value hierarchy based on the inputs used in the valuation techniques as follows,
Level 1: quoted prices (unadjusted) in active markets for identical assets or liabilities
Level 2: inputs other than quoted prices included in Level 1 that are observable for the asset or liability either directly (i.e. as prices) or indirectly (i.e. derived from prices)
Level 3: inputs for the asset or liability that are not based on observable market data (unobservable inputs)
If inputs used to measure the fair value of an asset or liability fall into different levels of the fair value hierarchy, then the fair value measurement is categorised in its entirety in the same level of the fair value hierarchy as the lowest level input that is significant to the entire measurement.
Further information about the assumptions made in measuring fair values included in the following notes;
• Note 19 - Biological Assets
• Note 13.2 - Disposable Group Held for Sale and Distribution
• Note 24, 29 – Financial Instruments.
• Note 16.E – Revaluation of Lands
2.4.4 Retirement BenefitsThe cost of defined benefit plan is determined using actuarial valuations. An actuarial valuation involves making various assumptions that may differ from actual developments in the future. These include the determination of the discount rate, future salary increases, mortality rates. Due to the complexity of the valuation, the underlying assumptions and its long-term nature, a defined benefit obligation is highly sensitive to changes in these assumptions. All assumptions are reviewed at
NOTES TO THE FINANCIAL STATEMENTS

55TIDES OF CHANGE
each reporting date. In determining the appropriate discount rate, management considers the weighted average cost of capital. The mortality rate is based on publicly available mortality tables for the specific country. Future salary increases are based on expected future inflation rates for the respective country.
2.4.5 Fair Value of Financial InstrumentsWhen the fair value of financial assets and financial liabilities recorded in the Statement of Financial Position cannot be derived from the active markets, their fair value is determined using valuation techniques including the discounted cash flow model. The inputs to these models are taken from observable markets where possible, but where this is not feasible, a degree of judgment is required in establishing fair values. The judgments include considerations of inputs such as liquidity risk, credit risk and volatility. Changes in the assumptions about these factors could affect the reported fair value of financial instruments.
2.4.6 Development Costs Development costs are capitalised in accordance with the accounting policy. Initial capitalisation of cost is based on management’s judgment that technological and economical feasibility is confirmed, usually when a product development project has reached a defined milestone according to an established project management model. In determining the amounts to be capitalised, management makes assumptions regarding the expected future cash generation of the project, discount rates to be applied and the expected period of benefits.
2.4.7 Recognition of Deferred Tax AssetsManagement applies significant judgement on the extent to which deferred tax assets can be recognised based on an assessment of the probability of the Group’s future taxable income against which the deferred tax assets can be utilised.
In addition, significant judgment is required in assessing the impact of any legal or economic limits or uncertainties.
2.5 Comparative InformationComparative information including quantitative, narrative and descriptive information as relevant is disclosed in respect of previous period in the Financial Statements. The presentation and classification of the Financial Statements in the previous year are amended, where relevant for better presentation and to be comparable with those of the current year.
In addition, the Group presents an additional Statement of Financial Position at the beginning of the receding period when there is a retrospective application of an accounting policy, a retrospective restatement, or a reclassification of items in Financial Statements.
2.6 Materiality, aggregation, offsetting
Materiality and aggregationEach material class of similar items is presented separately in the Financial Statements. Items of dissimilar nature or function are presented separately unless they are treated immaterial as permitted by the Sri Lanka Accounting Standard - LKAS 1 on ‘Presentation of Financial Statements’.
Understandability of the Financial Statements is not compromised by obscuring material information with immaterial information or by aggregating material items that have different natures or functions. Notes to the Financial Statements are presented in a systematic manner that ensures the understandability and comparability of Financial Statements.
OffsettingAssets and liabilities or income and expenses are not set off unless required or permitted by a Sri Lanka Accounting Standard.
3. SUMMARY OF SIGNIFICANT ACCOUNTING POLICIES The accounting policies set out below have been consistently applied to all periods presented in these Consolidated Financial Statements and have been applied consistently by Group entities, unless otherwise indicated. The Directors have made an assessment of the Group’s ability to continue as a going concern in the foreseeable future, and they do not intend either to liquidate or cease trading.
The assessment includes the existing and anticipated effects of the COVID-19 pandemic on the significant assumptions that are sensitive or susceptible to change or are in consistent with historical trends. As most of the business segments operate in essential service category, management evaluated the resilience of its businesses considering factors such as profitability, cash reserves, and potential sources of financing facilities including the possibility of differing non-essential capital expenditure. Having considered the above, management is satisfied that the Company/Group has adequate resources to continue in operational existence of foreseeable future. Therefore, the Financial Statements continue to be prepared on the going concern basis.
3.1. Basis of Consolidation
3.1.1 Business CombinationsThe Group accounts for business combinations using the acquisition method when the acquired set of activities and assets meet the definition of a business and control is transferred to the Group. In determining whether a particular set of activities and assets is a business, the Group assesses whether the set of assets and activities acquired includes, at a minimum, an input and substantive process and whether the acquired set has the ability to produce outputs. The Group has an option to apply a ‘concentration test’ that permits a simplified assessment of

CIC HOLDINGS PLC Annual Report 2020/2156
whether an acquired set of activities and assets is not a business. The optional concentration test is met if substantially all of the fair value of the gross assets acquired is concentrated in a single identifiable asset or group of similar identifiable asset.
The Group measures goodwill at the acquisition date as:
• the fair value of the consideration transferred; plus
• the recognised amount of any non-controlling interests in the acquire; less
• if the business combination is achieved in stages, the fair value of the pre-existing equity interest in the acquire; less
• the net recognised amount (generally fair value) of the identifiable assets acquired and liabilities assumed.
When the excess is negative, a bargain purchase gain is recognised immediately in profit or loss.
The consideration transferred does not include amounts related to the settlement of pre-existing relationships. Such amounts are generally recognised in the profit or loss.
Transaction costs, other than those associated with the issue of debt or equity securities, that the Group incurs in connection with a business combination are expensed as incurred.
Any contingent consideration payable is measured at fair value at the acquisition date. If the contingent consideration is classified as equity, then it is not remeasured and settlement is accounted for within equity. Otherwise, subsequent changes in the fair value of the contingent consideration are recognised in profit or loss.
If share based payment awards (replacement awards) are required to be exchanged for awards held by the acquiree’s employees (acquiree’s
awards) and relate to past services, then all or portion of the amount of the acquirer’s replacement awards is included in measuring the consideration transferred in the business combination. This determination is based on the market based value of the replacement awards compared with the market based value of the acquiree’s awards and the extent to which the replacement awards relate to past and/or future service.
3.1.2 Non-Controlling InterestsFor each business combination, the Group elects to measure any non-controlling interests in the acquiree either:
• at fair value; or
• at their proportionate share of the acquiree’s identifiable net assets, which are generally at fair value.
The acquisition of an additional ownership interest or a disposal of ownership interest in a subsidiary without a change of control is accounted for as an equity transaction. Any excess or deficit of consideration paid over the carrying amount of the non-controlling interests is recognised in equity of the parent. No adjustment is made to goodwill as a result of such transactions.
3.1.3 SubsidiariesSubsidiaries are entities controlled by the Group. The group controls an investee when it is exposed, or has rights, to variable returns from its involvement with the investee and has the ability to affect those returns through its power over the investee. The financial statements of subsidiaries are included in the Consolidated Financial Statements from the date that control commences until the date that control ceases.
The Group considers all relevant facts and circumstances in assessing whether it has power over an investee which includes; The contractual
arrangement with the other vote holders of the investee, Rights arising from other contractual arrangements and The Group’s voting rights and potential voting rights over the investee.
The Group re-assesses whether or not it controls an investee if facts and circumstances indicate that there are changes to one or more of the three elements of control. Consolidation of a subsidiary begins when the Group obtains control over the subsidiary and ceases when the Group loses control of the subsidiary. Assets, liabilities, income and expenses of a subsidiary acquired or disposed of during the year are included in the Consolidated Financial Statements from the date the Group gains control until the date the Group ceases to control the subsidiary.
Summarised financial Information in respect of subsidiaries that have non-controlling interests that are material to the reporting entity (i.e., the Group) are disclosed separately when applicable.
3.1.4 Loss of ControlOn the loss of control, the Group derecognises the assets and liabilities of the subsidiary, any non-controlling interests and the other components of equity related to the subsidiary. Any surplus or deficit arising on the loss of control is recognised in profit or loss. If the Group retains any interest in the previous subsidiary, then such interest is measured at fair value as at the date that control is lost. Subsequently it is accounted for as an equity accounted investee or as an FVOCI depending on the level of influence retained.
3.1.5 Associates and Joint VentureAn associate is an entity in which the Group has significant influence, but no control over the financial and operating policies. Significant influence is the power to participate in the financial and operating policy decisions of the investee, but does
NOTES TO THE FINANCIAL STATEMENTS

57TIDES OF CHANGE
not have the control or joint control over those policies.
Joint venture is a type of joint arrangement whereby the parties that have joint control of the arrangement have rights to the net assets of the joint venture. Joint control is the contractually agreed sharing of control of an arrangement, which exists only when decisions about the relevant activities require unanimous consent of the parties sharing control.
The Group determines significant influence or joint control by taking into account similar considerations necessary to determine control over subsidiaries.
The Group’s investment in associate and joint venture are accounted for using the equity method and are recognised initially at cost which includes the transaction cost. The carrying amount of the investment is adjusted to recognise changes in the Group’s share of net assets of the associate or joint venture since the acquisition date. Goodwill relating to the associate or joint venture is included in the carrying amount of the investment and is not tested for impairment individually.
The Statement of Profit or Loss reflects the Group’s share of the results of operations of the associate or joint venture. Any change in OCI of those investees is presented as part of the Group’s OCI. In addition, when there has been a change recognised directly in the equity of the associate or joint venture, the Group recognises its share of any changes, when applicable, in the statement of changes in equity. Unrealised gains and losses resulting from transactions between the Group and the associate or joint venture are eliminated to the extent of the interest in the associate or joint venture.
The aggregate of the Group’s share of profit or loss of an associate and a joint venture is shown on the face of the statement of profit or loss outside
operating profit and represents profit or loss after tax and non-controlling interests in the subsidiaries of the associate or joint venture.
The financial statements of the associate or joint venture are prepared for the same reporting period as the Group. When necessary, adjustments are made to bring the accounting policies in line with those of the Group.
At each reporting date, the Group determines whether there is objective evidence that the investment in associate or joint venture is impaired. If there is such evidence, the Group calculates the amount of impairment as the difference between the recoverable amount of the associate or joint venture and its carrying value, and then recognises the loss as ‘Share of profit of an associate and a joint venture’ in the income statement.
When the Group’s share of losses exceeds its interest in the associate, the carrying amount of that interest, including any long term investments, is reduced to nil and the recognition of further losses is discontinued except to the extent that the Group has an obligation or has made payments on behalf of the associate. If the associate subsequently reports profits, the Group resumes recognising its share of those profits only after its share of the profits equals the share of losses not recognised.
The Group discontinues the use of the equity method from the date that it ceases to have significant influence over an associate or joint control over the joint venture and accounts for the investment in accordance with the Group’s accounting policy for financial instruments. Any difference between the carrying amount of the associate or joint venture upon loss of significant influence or joint control and the fair value of the retained investment and proceeds from disposal is recognised in profit or loss.
There are no significant restrictions on the ability of the associate to transfer funds to the Group in the form of cash dividends or repayment of loans and advances.
Details of the associates within the Group are provided in Note 23 to the Financial Statements and the details of the joint venture are provided in Note 23 to the Financial statements.
3.1.6 Intra-Group transactionsPricing policies of all intra-group sales are identical to those adopted for normal trading transactions, which are at market prices.
3.1.7 Transactions Eliminated on Consolidation Intra-group balances and transactions, and any unrealised income and expenses arising from intra-group transactions are eliminated in preparing the consolidated financial statements. Unrealised gains arising from transactions with equity accounted investees are eliminated against the investment to the extent of the Group’s interest in the investee. Unrealised losses are eliminated in the same way as unrealised gains, but only to the extent that there is no evidence of impairment.
3.2 Foreign Currency
3.2.1 Foreign Currency Transactions Transactions in foreign currencies are initially recorded by the Group entities at their respective functional currency spot rates at the date the transaction first qualifies for recognition. Monetary assets and liabilities denominated in foreign currencies are retranslated at the functional currency spot rate of exchange at the reporting date. All differences arising on settlement or translation of monetary items are taken to the profit or loss with the exception of monetary items that are designated as part of the hedge of the Group’s net investment of a foreign operation. These are recognised in other

CIC HOLDINGS PLC Annual Report 2020/2158
comprehensive income until the net investment is disposed, at which time, the cumulative amount is reclassified to the income statement. Tax charges and credits attributable to exchange differences on those monetary items are also recorded in other comprehensive income.
Non-monetary items that are measured in terms of historical cost in a foreign currency are translated using the exchange rates as at the dates of the initial transactions. Non-monetary items measured at fair value in a foreign currency are translated using the exchange rates at the date when the fair value is determined. The gain or loss arising on retranslation of non-monetary items is treated in line with the recognition of gain or loss on change in fair value of the item (i.e., translation differences on items whose fair value gain or loss is recognised in other comprehensive income or profit or loss is also recognised in other comprehensive income or profit or loss, respectively).
3.2.2 Group CompaniesOn consolidation the assets and liabilities of foreign operations are translated into Sri Lankan rupees at the rate of exchange prevailing at the reporting date and their income statements are translated at exchange rates prevailing at the dates of the transactions. The exchange differences arising on translation for consolidation are recognised in Other Comprehensive Income. On disposal of a foreign operation, the component
NOTES TO THE FINANCIAL STATEMENTS
of Other Comprehensive Income relating to that particular foreign operation is recognised in the Income Statement.
3.3 Revenue
A. Revenue streamsThe Group generates revenue primarily from sale of goods under revenue from contracts with customers. The rental income and repair income are the other sources of income included under revenue.
B. Disaggregation of revenue from contract with customers
Revenue from contract with customers (including revenue related to a discontinuing operation) is disaggregated by primary geographical Market, major products and service lines and timing of revenue recognition under Note 06.
C. Contract balances
Contract Assets
Cost to obtain contract
The Group capitalises incremental costs to obtain a contract with a customer for the assets with more than one year amortisation period and if it expects to recover those costs. The Costs that will be incurred regardless of whether the contract is obtained – including costs that are incremental to trying to obtain a contract, are expensed as they are incurred. The cost to obtain contract will be amortised over the contract period on a systematic basis.
Cost of fulfilling a contract
The Group capitalises the costs incurred in fulfilling a contract with a customer for which are not in the scope of other guidance and only if the fulfillment costs meet the following criteria:
• relate directly to an existing contract or specific anticipated contract;
• generate or enhance resources that will be used to satisfy performance obligations in the future; and
• are expected to be recovered.
The cost of fulfilling a contract will be amortised over the contract period on a systematic basis.
Contract Liabilities
The Group recognises a contract liability for the deferred revenue on the extended warranty provided for the customers.
The Contract liability shall be realised to revenue on the basis of utilising the warranty by the customers or on a systematic basis accordingly.
D. Performance obligations and revenue recognition policies
Revenue is measured based on the consideration specified in a contract with a customer. The Group recognises revenue when it transfers control over a good or services to a contract.

59TIDES OF CHANGE
The following table provides information about the nature and timing of the satisfaction of performance obligations in contracts with customers, including significant payment terms, and the related revenue recognition policies.
Type of product/service
Nature and timing of satisfaction of performance obligations, including significant payment terms
Revenue recognition policies
Sale of Goods & services
The Group operates in different divisions and engaged in varieties of sale of goods under each divisions / clusters.
The revenue is recognised based on the identified performance obligation. The transaction price is determined taking into account of variable considerations. The transaction price is allocated to performance obligations and recognised the revenue either over the time of the contract or point in time upon analysis of each sale of goods under separate divisions.
Distributor & dealer volume rebates
Distributors and dealers are entitled to volume rebates.
Volume rebates are given based on the yearly and daily sales quantities over different slabs.
The Group estimates the amount of variable consideration to which it expects to be entitled, giving consideration to the risk of revenue reversal in making the estimate for volume rebates.
The transaction price under revenue is adjusted for the provision of volume rebates and recognised as revenue.
Issue of free goods The Group offers free goods to their dealers as a promotion.
The free goods granted to customer is a material right of the customer and is accounted as a separate performance obligation.
The revenue is allocated for the performance obligation on their relative stand-alone selling price and the revenue is recognised at the point in time when the performance obligation is met.
Distributor allowance on transportation
The Group pays an agreed daily distribution allowance to its distributors on an agreed distribution value.
This allowance is paid for the transportation cost incurred from the point of distributor to end consumer location.
The transport cost paid to the dealer / distributor is not in exchange for a distinct goods or services and it is recognised as a reduction to transaction price under revenue recognition.
Slotting Fees The Group pays slotting fees to identified supermarket chains for use of shelf spaces.
The Slotting fees are either incurred by the Company or reimbursed by the principal.
The slotting fees are identified as a variable consideration payable to customer and recognised as a reduction to the transaction price for the slotting fees incurred by the Company.
A receivable from principal is recognised for the slotting fees which are reimbursed by the principal.
OTHER INCOME SOURCES
3.3.1 Interest IncomeInterest income is recognised in profit or loss as it accrues and is calculated by using the effective interest rate method.
3.3.2 Dividend IncomeDividend Income is recognised when the Group’s right to receive the payment is established.
3.3.3 Rental IncomeRental income arising from operating leases on investment properties or renting out of premises are recognised as revenue on a straight-line basis over the term of the lease or agreement.
3.3.4 CommissionsWhen the Group acts in the capacity of an agent rather than as the principal in a transaction, the revenue recognised is the net amount of commission made by the Group.
3.3.5 OthersOther income is recognised on an accrual basis.
Net gains and losses on the disposal of property, plant & equipment and other non-current assets including investments have been accounted for in profit or loss, having deducted from proceeds on disposal, the carrying amount of the assets and related selling expenses.
3.4 GrantsGrants are recognised where there is reasonable assurance that the grant will be received and all attached conditions will be complied with. When the grant relates to an expense item, it is recognised in profit or loss as other income over the period necessary to match the grant on a systematic basis to the costs that it is intended to compensate. When the grant relates to an asset, it is recognised as deferred income and released to income in equal amounts over the expected useful life of the related asset. When the Group receives non-monetary grants, the asset and the grant are recorded gross at nominal amounts and released to the profit or loss over the expected useful life and pattern of
CIC HOLDINGS PLC Annual Report 2020/2160
consumption of the benefit of the underlying asset by equal annual installments.
3.5 Finance income and finance costs The Group’s finance income and finance costs include
• Interest income,
• Interest expenses
• Foreign currency gain or loss on financial assets and liabilities,
Interest income or expense is recognised using the effective interest method. The “effective interest rate” is the rate that exactly discounts estimated future cash payments or receipts through the expected life of the financials instrument to:
• The gross carrying amount of the financials assets: or
• The amortised cost of the financial liability.
Foreign currency gains and losses are reported on a net basis as either finance income or finance cost depending on whether the foreign currency movements are in net gain or net loss position.
3.6 Tax
3.6.1 Current Income TaxCurrent tax is recognised in profit or loss except to the extent that it relates to a business combination, or items recognised directly in equity or in other comprehensive income.
Current tax is the expected tax payable or receivable on the taxable income or loss for the year, using tax rates and tax laws enacted or substantively enacted at the reporting date in the countries where the Group operates and generates taxable income, and any adjustment to tax payable in respect of previous years. Current tax payable also includes any tax liability arising from the declaration of dividends, if applicable.
Current income tax relating to items recognised directly in equity is recognised in equity and not in profit
or loss. Management periodically evaluates positions taken in the tax returns with respect to situations in which applicable tax regulations are subject to interpretation and establishes provisions where appropriate.
3.6.2 Deferred TaxDeferred tax is recognised in respect of the temporary differences between the assets and liabilities for financial reporting purposes and the amounts used for taxation purposes. Deferred tax is recognised for all taxable temporary differences, except for:
• Temporarily differences on the initial recognition of asset or liability in a transaction that is not a business combination and, at the time of the transaction, that affects neither the accounting profit nor taxable profit or loss;
• Temporary differences associated with investments in subsidiaries and jointly controlled entities to the extent that it is probable that they will not reverse in the foreseeable future; and
• Taxable temporary differences arising on the initial recognition of goodwill.
The carrying amount of deferred tax assets is reviewed at each reporting date and reduced to the extent that it is no longer probable that sufficient taxable profit will be available to allow all or part of the deferred tax asset to be utilised. Unrecognised deferred tax assets are reassessed at each reporting date and are recognised to the extent that it has become probable that future taxable profits will allow the deferred tax asset to be recovered.
Deferred tax is measured at the tax rates that are expected to be applied to temporary differences when they reverse, using tax rates (and tax laws) enacted or substantively enacted at the reporting date.
Deferred tax relating to items recognised outside profit or loss is recognised outside profit or loss.
Deferred tax items are recognised in correlation to the underlying transaction either in other comprehensive income or directly in equity. Deferred tax assets and deferred tax liabilities are offset if a legally enforceable right exists to set off current tax assets against current income tax liabilities and the deferred taxes relate to the same taxable entity and the same taxation authority.
Tax benefits acquired as part of a business combination, but not satisfying the criteria for separate recognition at that date, would be recognised subsequently if new information about facts and circumstances changed. The adjustment would either be treated as a reduction to goodwill (as long as it does not exceed goodwill) if it was incurred during the measurement period or in profit or loss.
A deferred tax asset is recognised for unused tax losses, tax credits and deductible temporary differences to the extent that it is probable that future taxable profits will be available against which they can be utilised. Deferred tax assets are reviewed at each reporting date and are reduced to the extent that it is no longer probable that the related tax benefit will be realised.
3.7 Discontinued Operations and Assets Held for Sale/Distribution
3.7.1 Discontinued operationsA discontinued operation is a component of the Group’s business, the operations and cash flows of which can be clearly distinguished from the rest of the Group and which:
• represents a separate major line of business or geographical area of operations;
• is part of a single co-ordinated plan to dispose of a separate major line of business or geographical area of operations; or
• is a subsidiary acquired exclusively with a view to re-sale.
NOTES TO THE FINANCIAL STATEMENTS

61TIDES OF CHANGE
Classification as a discontinued operation occurs on disposal or when the operation meets the criteria to be classified as held-for-sale, if earlier.
When an operation is classified as a discontinued operation, the comparative statement of comprehensive income is re-presented as if the operation had been discontinued from the start of the comparative year.
3.7.2 Assets held for saleBefore the classification as held for sale non current assets and liabilities in the disposal group are measured in accordance with relevant SLFRSs.
Non-current assets and disposal groups classified as held for sale are measured at the lower of their carrying amount and fair value less costs to sell. Non-current assets and disposal groups are classified as held for sale if their carrying amounts will be recovered principally through a sale transaction rather than through continuing use. This condition is regarded as met only when the sale is highly probable and the asset or disposal group is available for immediate sale in its present condition. Management must be committed to the sale, which should be expected to qualify for recognition as a completed sale within one year from the date of classification.
Non-current assets are classified as held for distribution when the Company/Group committed to distribute the assets or disposal group to its owners.
Impairment losses on initial classification as held-for-sale and subsequent gains and losses on remeasurement are recognised in profit or loss. Gains are not recognised in excess of any cumulative impairment loss. Property, plant & equipment and intangible assets once classified as held for sale are not depreciated or amortised.
3.7.3 Cease to be classified as assets held for sale and distribution When an operation is ceased to classify as held for sale, the results of the operations of the component previously presented in discontinued operations shall be reclassified and included in income from continuing operations for all presented periods. The amounts for prior periods shall be described as having been re-presented.
The amounts presented for the assets and liabilities of the disposal group classified as held for sale in the comparative Statements of Financial Position shall not be reclassified or re-presented.
3.8 Property, Plant & Equipment
3.8.1 Initial Recognition and Measurement Items of property, plant & equipment are measured at cost, net of accumulated depreciation and/or accumulated impairment losses, if any. Such cost includes expenditure that is directly attributable to the acquisition of the asset and includes the cost of replacing part of the property, plant & equipment and borrowing costs for long-term construction projects if the recognition criteria are met.
The cost of self-constructed assets includes the following:
• the cost of materials and direct labour;
• any other costs directly attributable to bringing the assets to a working condition for their intended use;
• when the Group has an obligation to remove the asset or restore the site, an estimate of the costs of dismantling and removing the items and restoring the site on which they are located; and
• capitalised borrowing costs.
When significant parts of property, plant & equipment are required to be replaced at intervals, the Group recognises such parts as individual assets with specific useful lives and depreciates them accordingly.
3.8.2 Subsequent CostsSubsequent expenditure is capitalised only when it is probable that the future economic benefits associated with the expenditure will flow to the Group. Ongoing repairs and maintenance is expensed as incurred.
The present value of the expected cost for the decommissioning of an asset after its use is included in the cost of the respective asset if the recognition criteria for a provision are met. Refer to Significant accounting judgements, estimates and assumptions (Note 2.4) and Provisions (Note 3.17) for further information about the recorded decommissioning provision.
3.8.3 RevaluationLands are measured at fair value. Valuations are performed frequently to ensure that the fair value of a revalued asset does not differ materially from its carrying amount. Any revaluation surplus is recorded in other comprehensive income and hence, credited to the asset revaluation reserve in equity, except to the extent that it reverses a revaluation decrease of the same asset previously recognised in the profit or loss, in which case, the increase is recognised in the profit or loss. A revaluation deficit is recognised in the profit or loss, except to the extent that it offsets an existing surplus on the same asset recognised in the asset revaluation reserve.
3.8.4 DepreciationItems of property, plant & equipment are depreciated on a straight-line basis over the estimated useful lives of each component.
Items of property, plant & equipment are depreciated from the month that they are installed and are ready for use, or in respect of internally constructed assets, from the month that the asset is completed and ready for use.

CIC HOLDINGS PLC Annual Report 2020/2162
The estimated useful lives for the current and comparative years of significant items of property, plant & equipment are as follows:
• Buildings 10 - 40 years
• Plant and equipment 5 - 50 years
• Computers and allied equipment 3-8 years
• Motor Vehicles 3-30 years
• Furniture & Fittings 5-20 years
The assets’ residual values, useful lives and methods of depreciation are reviewed at each financial year end and adjusted prospectively, if appropriate.
3.8.5 De-recognitionAn item of property, plant & equipment is de-recognised upon disposal of or when no future economic benefits are expected from its use or disposal. Gains and losses arising on de-recognition of assets are determined by comparing the proceeds from the disposal with the carrying amount of property, plant & equipment and are recognised net within “Other Income” in profit or loss.
3.9 Leases At inception of contract, the Group assesses whether a contract is, or contains, a lease. A contract is, or contains, a lease if the contract conveys the right to control the use of an identifiable asset for a period of time in the exchange of for consideration.
This policy is applied to contracts entered into on or after 01st April 2020.
3.9.1 As a lesseeAt commencement or on modification of a contract that contains a lease component, the Group allocates the consideration in the contract to each lease component on the basis of its relative stand-alone prices. However, for the leases of property the Group has elected not to separate non-lease components and account for the lease
and non-lease components as a single lease component.
The Group recognises a right-of-use asset and a lease liability at the lease commencement date. The right - of - use asset is initially measured at cost, which comprises the initial amount of the lease liability adjusted for any lease payments made at or before the commencement date, plus any initial direct costs incurred and an estimate of costs to dismantle and remove the underlying asset or to restore the underlying asset or the site in which it is located, less any lease incentives received.
The right-of-use asset is subsequently depreciated using the straight-line method from the commencement date to the end of the lease term, unless the lease transfers ownership of the underlying asset to the Group by the end of the lease term or the cost of the right-of-use asset reflects that the Group will exercise a purchase option. In that case the right-of-use asset will be depreciated over the useful life of the underlying asset, which is determined on the same basis as those of property and equipment. In addition, the right-of-use asset is periodically reduced by impairment losses, if any, and adjusted for certain premeasurements of the lease liability.
The lease liability is initially measured at the present value of the lease payments that are not paid at the commencement date, discounted using the interest rate implicit in the lease or, if that rate cannot be readily determined, the Group’s incremental borrowing rate. Generally, the Group uses its incremental borrowing rate as the discount rate.
The Group determines its incremental borrowing rate by obtaining interest rate from various external financial sources and makes certain adjustments to reflect the terms of the lease and type of the asset leased.
Lease payments included in the measurement of the lease liability comprise of the following;
• Fixed payments, including in-substances fixed payments;
• Variable lease payments that depend on an index or a rate, initially measured using the index or the rate as at the commencement date;
• Amounts expected to be payable under a residential value guarantee; and
• The exercise price under a purchase option that the Group is reasonably certain to exercise, lease payments in an option renewal period if the Group is reasonably certain to exercise an extension option, and penalties for early termination of a lease unless the Group is reasonably certain not to terminate early.
The lease liability is measured at amortised cost using the effective interest method. It is remeasured when there is a change in future lease payments arising from a change in an index or rate, if there is a change in the Group’s estimate of the amount expected to be payable under the residual value guarantee, if the Group changes its assessment of whether it will exercise a purchase, extension or termination option or if there is revised in-substance fixed lease payment.
When the lease liability is remeasured in this way, a corresponding adjustment is made to the carrying amount of the right-of-use asset, or is recorded in profit or loss if the carrying amount of the right-of-use asset has been reduced to zero.
The Group presents right-of-use assets that do not meet the definition of net investment in sublease in “property, plant & equipment” and lease liabilities in “loans and borrowings” in the Statement of Financial Position.
NOTES TO THE FINANCIAL STATEMENTS

63TIDES OF CHANGE
Short term leases and leases of low value assets
The Group has elected not to recognise right-of-use assets and lease liabilities for leases of low-value assets and short-term leases, including IT equipment. The Group recognises the lease payments associated with these leases as an expense on straight-line basis over the lease term.
3.9.2 As a lessorAt inception or on modification of a contract that contains a lease component, the Group allocates the consideration in the contract to each lease component on the basis of their relative stand-alone prices.
When the Group acts as a lessor, it determines at lease inception whether each lease is a finance lease or an operating lease.
To classify each lease, the Group makes an overall assessment of whether the lease transfers substantially all of the risks and rewards incidental to ownership of the underlying asset. If this is the case, then the lease is a finance lease. If not, then it is an operating lease. As part of this assessment, the Group considers certain indicators such as whether the lease is for the major part of the economic life of the asset.
When the Group is an intermediate lessor, it accounts for its interests in the head lease and the sub-lease separately. It assesses the lease classification of a sub-lease with reference to the right-of-use asset arising from the head lease, not with reference to the underlying asset. If a head lease is a short-term lease to which the Group applies the exemption described above, then it classifies the sub-lease as an operating lease.
If an arrangement contains lease and non-lease components, then the Group applies SLFRS 15 to allocate the consideration in the contract.
The Group applies the derecognition and impairment requirements in SLFRS 9 to the net investment in the lease. The Group further regularly reviews the estimated unguaranteed residual values used in calculating the gross investment in the lease.
The Group recognises lease payments received under operating leases as income on a straight-line basis over the lease term as part of “other income”.
Generally, the accounting policies applicable to the Group as a lessor in the comparative period were not different from SLFRS 16 except for the classification of the sub-lease entered into during current reporting period that resulted in a finance lease classification.
3.10 Borrowing costsBorrowing costs directly attributable to the acquisition, construction or production of an asset that necessarily takes a substantial period of time to get ready for its intended use or sale are capitalised as part of the cost of the asset. All other borrowing costs are expensed in the period they occur. Borrowing costs consist of interest and other costs that an entity incurs in connection with the borrowing of funds.
3.11 Investment propertiesInvestment property is property held either to earn rental income or for capital appreciation or for both, but not for sale in the ordinary course of business, use in the production or supply of goods or services or for administrative purposes.
The Group adopts cost model to measure investment. Investment properties are measured initially at cost. Subsequently to initial recognition investment property is measured at cost less accumulated depreciation and impairment losses.
Cost includes expenditure that is directly attributable to the acquisition of the investment property. The
cost of self-constructed investment property includes the cost of materials and direct labour, any other costs directly attributable to bringing the investment property to a working condition for their intended use and capitalised borrowing costs.
Investment properties are de-recognised when either they have been disposed of or when the investment property is permanently withdrawn from use and no future economic benefit is expected from its disposal. The difference between the net disposal proceeds and the carrying amount of the asset is recognised in profit or loss in the period of de-recognition. When an investment property that was previously classified as property, plant & equipment is sold, any related amount included in the revaluation reserve is transferred to retained earnings.
Transfers are made to or from investment property only when there is a change in use. For a transfer from investment property to owner-occupied property, the deemed cost for subsequent accounting is the fair value at the date of change in use. If owner-occupied property becomes an investment property, the Group accounts for such property in accordance with the policy stated under property, plant & equipment up to the date of change in use.
3.12 Intangible assetsIntangible assets acquired separately are measured on initial recognition at cost. The cost of intangible assets acquired in a business combination is their fair value as at the date of acquisition.
Following initial recognition, intangible assets are carried at cost less any accumulated amortisation and accumulated impairment losses. Expenditure on internally generated intangible assets, excluding capitalised development costs, is recognised in profit or loss in the year in which the expenditure is incurred.

CIC HOLDINGS PLC Annual Report 2020/2164
The useful lives of intangible assets are assessed as either finite or indefinite. Except for goodwill, intangible assets with finite lives are amortised on a straight-line basis in profit or loss over the useful economic life and assessed for impairment whenever there is an indication that the intangible asset may be impaired. The amortisation period, residual value and the amortisation method for an intangible asset with a finite useful life are reviewed at least at the end of each reporting period and adjusted accordingly. Changes in the expected useful life or the expected pattern of consumption of future economic benefits embodied in the asset is accounted for by changing the amortisation period or method, as appropriate, and are treated as changes in accounting estimates. The amortisation expense on intangible assets with finite lives is recognised in profit or loss in the expense category consistent with the function of the intangible assets.
Intangible assets with indefinite useful lives are not amortised, but are tested for impairment annually, either individually or at the cash-generating unit level. The assessment of indefinite life is reviewed annually to determine whether the indefinite life continues to be supportable. If not, the change in useful life from indefinite to finite is made on a prospective basis.
Gains or losses arising from derecognition of an intangible asset are measured as the difference between the net disposal proceeds and the carrying amount of the asset and are recognised in profit or loss when the asset is derecognised.
3.12.1 ERP Implementation costThe initial cost incurred for ERP implementation has been capitalised and amortised over a period of 10 years.
3.12.2 Research and development costsExpenditure on research activities is recognised in profit or loss as incurred. Development expenditures on an individual project are recognised as an intangible asset when the Group can demonstrate:
• The technical feasibility of completing the intangible asset so that it will be available for use or sale
• The intention to complete and the ability to use or sell the asset
• Probability of generating future economic benefits
• The availability of resources to complete the asset
• The ability to measure reliably the expenditure during development
The expenditure capitalised includes the cost of materials, direct labour, overhead costs that are directly attributable to preparing the asset for its intended use, and capitalised borrowing costs. Other development expenditure is recognised in profit or loss as incurred.
Following initial recognition of the development expenditure as an asset, the asset is carried at cost less any accumulated amortisation and accumulated impairment losses. Amortisation of the asset begins when development is complete and the asset is available for use. It is amortised over the period of expected future benefit. Amortisation is recorded in cost of sales. During the period of development, the asset is tested for impairment annually.
3.13. Impairment of non-financial assets The carrying amounts of the Group’s non-financial assets, other than inventories and deferred tax assets are reviewed at each reporting date to determine whether there is any indication of impairment. If any such indication exists, the recoverable amounts of such assets are estimated.
An asset’s recoverable amount is the higher of an asset’s or cash generating unit’s (CGU) fair value less costs to sell and its value in use and is determined for an individual asset, unless the asset does not generate cash inflows that are largely independent of those from other assets or groups of assets. (A cash generating unit is the smallest identifiable asset group that generates cash flows that are largely independent from other assets)
An impairment loss is recognised if the carrying amount of an asset or its cash generating unit exceeds its recoverable amount. Impairment losses are recognised in the profit or loss. Impairment losses recognised in respect of cash generating units on acquisition of subsidiaries are allocated first to reduce the carrying amount of any goodwill allocated to the unit, and then to reduce the carrying amount of the other assets in the unit (or group of units) on a pro rata basis.
In assessing value in use, the estimated future cash flows are discounted to their present value using a pre-tax discount rate that reflects current market assessments of the time value of money and the risks specific to the asset. In determining fair value less costs to sell, recent market transactions are taken into account, if available. If no such transactions can be identified, an appropriate valuation model is used. These calculations are corroborated by valuation multiples, quoted share prices for publicly traded subsidiaries or other available fair value indicators. The Group bases its impairment calculation on detailed budgets and forecast calculations, which are prepared separately for each of the Group’s CGUs to which the individual assets are allocated. These budgets and forecast calculations generally cover a period of five years. For longer periods, a long-term growth rate is calculated and applied to project future cash flows after the fifth year. Impairment losses of continuing
NOTES TO THE FINANCIAL STATEMENTS

65TIDES OF CHANGE
operations, including impairment on inventories, are recognised in profit or loss in expense categories consistent with the function of the impaired asset, except for a property previously revalued and the revaluation was taken to other comprehensive income. In this case, the impairment is also recognised in other comprehensive income up to the amount of any previous revaluation.
An impairment loss in respect of goodwill is not reversed. In respect of other assets, impairment losses recognised in prior periods are assessed at each reporting date for any indications that the loss has decreased or no longer exists. An impairment loss is reversed if there has been a change in the estimates used to determine the recoverable amount.
A previously recognised impairment loss is reversed only if there has been a change in the assumptions used to determine the asset’s recoverable amount since the last impairment loss was recognised. The reversal is limited so that the carrying amount of the asset does not exceed its recoverable amount, nor exceed the carrying amount that would have been determined, net of depreciation, had no impairment loss been recognised for the asset in prior years. Such reversal is recognised in profit or loss unless the asset is carried at a revalued amount, in which case, the reversal is treated as a revaluation increase.
The following assets have specific characteristics for impairment testing:
a) GoodwillGoodwill is tested for impairment annually (as at 31 March) and when circumstances indicate that the carrying value may be impaired. Impairment is determined for goodwill by assessing the recoverable amount of each CGU (or group of CGUs) to which the goodwill relates. When the recoverable amount of the CGU is less than its carrying amount,
an impairment loss is recognised. Impairment losses relating to goodwill cannot be reversed in future periods.
b) Intangible assetsIntangible assets with indefinite useful lives are tested for impairment annually as at 31 March either individually or at the CGU level, as appropriate, and when circumstances indicate that the carrying value may be impaired.
3.14. Financial instruments
3.14.1. Initial recognition and measurementTrade receivables and debt securities issued are initially recognised when they are originated. All other financial assets and financial liabilities are initially recognised when the Group becomes a party to the contractual provisions of the instrument.
A financial asset (unless it is trade receivable without a significant financing component) or financial liabilities initially measured at fair value plus for an item not at FVTPL, transaction costs that are directly attributable to its acquisitions or issue. A trade receivable without a significant financing component is initially measured at the transaction price.
3.14.2. Classification and Subsequent MeasurementOn initial recognition a financial asset is classified as measured at amortised cost, FVOCI - debt investment; FVOCI - equity investments; or FVTPL.
Financial assets are not reclassified subsequent to their initial recognition unless Group changes its business model for managing financial assets, in which case all affected financial assets are reclassified on the first day of the first reporting period following the changes in the business model.
Financial asset is measured at amortised cost if it meets both of the following conditions and it not designated as at FVTPL:
• It is held within the business model
whose objective is to hold asset to collect contractual cash flows; and
• Its contractual terms give rise on specified dates to cash flows that are solely payments of principal and interest on the principal amount outstanding.
A debt investment is measured at FVOCI if it meets both of the following conditions and is not designated as at FVTPL:
• It is held within the business model whose objective is achieved both collecting contractual cash flows and selling financial assets: and
• Its contractual terms give rise on specified dates to cash flows that are solely payments of principal and interest on the principal amount outstanding.
On initial recognition of equity investment that is not held for trading, the Group may irrevocably elect to present subsequent changes in the investment’s fair value in OCI. This election is made on an investment- by-investment basis.
All financial assets not classified as measured at amortised cost or FVOCI as described above are measured at FVTPL. This included all derivative financial assets. On initial recognition, the Group may irrevocably designate a financial asset that otherwise meets the requirements to be measured at amortised cost or at FVOCI as at FVTPL if doing so eliminates or significantly reduces an accounting mismatch that would otherwise arise.
Financial assets – Business model assessmentThe Group makes an assessment of the objective of the business model in which a financial asset is held at a portfolio level because this best reflects the way the business is managed and information is provided to management. The information considered include;
• The stated policies and objectives for the portfolio and the operation of those policies in practice. These

CIC HOLDINGS PLC Annual Report 2020/2166
include whether management’s strategy focuses on earning contractual income, maintain a particular interest rate profile, matching the duration of the financial asset to the duration of any related liabilities or expected cash outflows or realising cash flows through the sale of the asset;
• How the performance of the portfolio is evaluated and reported to the Group’s management;
• The risk that affect the performance of the business model (and the financial assets held within that business model) and how those risks are managed;
• How mangers of business are compensated – eg: whether compensation is based on the fair value of the assets managed or the contractual cash flows collected; and
• The frequency, volume and timing of sales of financial assets in prior periods, the reason for such sales are expectations about future sales activity.
Transfers of financial assets to third parties in transaction that do not qualify for de- recognition are not considered sales for this purpose, consistent with the Group’s continuing recognition of the assets.
NOTES TO THE FINANCIAL STATEMENTS
Financial assets that are held for trading or are managed and whose performance is evaluated on fair value basis are measured at FVTPL.
Financial assets – Assessment whether contractual cash flows are solely payments of principal and interestFor the purpose of this assessment, “principal” is defined as the fair value of the financial asset on initial recognition, “interest” is defined as the consideration for the time value of money and for the credit risk associated with the principal amount outstanding during a particular period of time and for other basic lending risks and cost (example liquidity risk and administrative costs), as well as a profit margin.
In assessing whether the contractual cash flows are solely payments of principal and interest, the Group considers the contractual terms of the instrument. This include assessing whether the financial assets contains a contractual term that could change the timing or amount of contractual cash flows such that it would not meet this condition in making assessment, the Group considers:
• Contingent events that would change the amount and the timing if cash flows;
• Terms that may adjust the contractual coupon rate, including variable rate features;
• Prepayment and extension features: and
• Terms that limit the Group’s claim to cash flows form specified assets (example non resource features)
A prepayment feature is consistent with the solely payments of principles and interests criterion if the prepayment amounts substantially represents unpaid amounts of principal and interest on the principal amount outstanding, which may include reasonable additional compensation for early termination of the contract. Additionally, for a financial asset acquired at a discount or premium to its contractual par amount, a feature that permits or requires prepayments at an amount that substantially represents the contractual par amount plus accrued (but unpaid) contractual interest (which may also include reasonable additional compensation for early termination) is treated as consistent with this criterion if the fair value of the prepayment feature is insignificant at initial recognition.
Financial asset – Subsequent measurement and gain and losses
Financial assets at FVTPL These assets are subsequently measured at fair value. Net gain and losses including any interest or dividend income, are recognised in profit or loss.
Financial assets at amortised cost
These assets are subsequently measured at amortised cost using the effective interest method. The amortised cost is reduced by impairment losses. Interest income, foreign exchange gains and losses and impairment are recognised in profit or loss. Any gain or loss re recognition is recognised in profit or loss.
Debt investment at FVOCI These assets are subsequently measured at fair value. Interest income calculated using the effective interest method, foreign exchange gain and losses and impairment are recognised in profit or loss. Other net gain and losses are recognised in OCI capital. On de-recognition, gain and losses accumulated in OCI capital are reclassified to profit or loss.
Equity investment at FVOCI These assets are subsequently measured at fair value. Dividends are recognised as income in profit or loss unless the dividend clearly represents a recovery of part of the cost of the investment. Other net gains and losses are recognised in OCI and are never reclassified to profit or loss.

67TIDES OF CHANGE
Financial liabilities- Classification, subsequent measurement and gains and lossesFinancial liabilities are classified as measured at amortised cost or FVTPL. A financial liability is classified as at FVTPL if it is classified as held for trading, it is a derivative or it is designated as such on initial recognition. Financial liabilities at FVTPL are measured at fair value and net gains and losses, including any interest expense, are recognised in profit or loss. Other financial liabilities are subsequently measured at amortised cost using effective interest method. Interest expenses and foreign exchange gains and losses are recognised in profit or loss. Any gain or loss on derecognition is also recognised in profit or loss.
3.14.3. De-recognition
Financial asset The Group de recognises a financial asset when the contractual rights to the cash flow from the financial assets expire, or it transfers the rights to receive the contractual cash flows in a transaction in which substantially all of the risks and rewards of ownership of the financial assets are transferred or in which the Group neither transfers nor retains substantially all of the risks and rewards of ownership and it does not retain control of the financial assets.
The Group enters into transaction whereby it transfers assets recognised in its statements of financial position, but retains either all or substantially all of the risks and rewards of the transferred assets. In these cases, the transferred assets are not derecognised.
Financial liabilities
The Group de-recognises a financial liability when its contractual obligations are discharged or cancelled, or expire. The Group also de recognises a financial liability when its terms are modified and the cash flows of the modified liability are substantially different, in which case
a new financial liability based on the modified terms is recognised at fair value.
On de-recognition of a financial liability the difference between the carrying amount extinguished and the consideration paid (including any non-cash assets transferred or liabilities assumed) is recognised in profit or loss.
3.14.4. OffsettingFinancial assets and financial liabilities are offset and the net amount presented in the statement of financial position when and only when the Group currently has the legally enforceable right to set off the amounts and it intends either to settle them on a net basis or to realise the asset and settle the liability simultaneously.
3.14.5. Impairment of financial assets
a) Financial instruments and contract assets
The Group recognises a loss allowance for ECLs on:
- Financial assets measured at amortised cost;
- Debt investments measured at FVOCI; and
- Contract assets.
The Group measures loss allowances at an amount equal to lifetime ECLs, except for the following which are measured at 12 months ECLs:
- Debt securities that are determined to have no credit risk at the reporting date; and
- Other debt securities and bank balances for which credit risk (i.e. the risk of default occurring over the expected life of the financial instrument) has not increased significantly since the initial recognition.
Loss allowance for trade receivables and contract assets are always measured at an amount equal to lifetime ECLs.
When determining whether a credit risk of financial asset has increased significantly since initial recognition and when estimating ECLs, the Group considers reasonable and supportable information that is relevant and available without undue cost of effort. This includes both quantitative and qualitative information and analysis, based on Group’s historical experience and informed credit assessment and including forward – looking information.
The Group assumes that a credit risk on a financial asset has increased significantly if it is more than 180 days past due.
The Group considers financial asset to be in default when:
• The borrower unlikely to pay its credit obligations to the Group in full, without recourse by the Group to actions such as realising security “ if any is held”; or
• The financial asset is more than 365 days past due.
The Group considers a debt security to have no credit risk when its credit risk rating is equivalent to the globally understood definition of “investment grade”.
Lifetime ECLs are the ECLs that result from all possible events over the expected life of a financial instrument.
12 months ECLs are the portion of ECLs that result from default events that are possible within the 12 months after the reporting date (or a shorter period if the expected life of the instrument is less than 12 months).
The maximum period considered when estimating ECLs is the maximum contractual period over which the Group is exposed to credit risk.
b) Measurement of ECLsECLs are a probability- weighted estimate of credit loss. Credit losses are measured as the present value of all cash short falls (i.e. the difference between the cash flows due to the

CIC HOLDINGS PLC Annual Report 2020/2168
entity in accordance with the contract and the cash flows that the Group expects to receive).
ECLs are discounted at the effective interest rates of the financial asset.
c) Credit-impaired financial assets At each reporting date, the Group assess whether the financial assets carried at amortised cost and debt securities at FVOCI are credit- impaired. A financial asset is “credit impaired” when one or more events that have detrimental impact on the estimated future cash flows of the financial assets have occurred.
Evidence that a financial asset is credit impaired includes the following observable data;
• Significant financial difficulty of the borrower or the issuer
• A breach of contract such as default or being more than 365 days being past due;
• The restructuring of a loan or advance by the Group on terms that the Group would not consider otherwise;
• It is probable that the borrower enter bankruptcy or other financial reorganisation or
• The disappearance of the active market for a security because of financial difficulty
d) Presentation of allowance for ECL in the statement of financial position
Loss allowances for financial assets measured at amortised cost are deducted from the gross carrying amount of the asset.
For debt securities at FVOCI, the loss allowance is charged to profit or loss and is recognised in OCI.
e) Write offThe gross carrying amount of a financial asset is written off when the Group has no reasonable expectation of recovery of financial asset in its entirety or a portion thereof. For corporate customers,
the Group individually makes an assessment with respect to the timing and amount of write- off based on whether there is a reasonable expectation of recovery. The Group expects no significant recovery from the written off. However, financial assets that are written off could still be subject to enforcement activities in order to comply with the Group procedures for recovery of amounts due.
3.15 Biological assetsThe Group’s biological assets consist of poultry, teak and livestock. Except for parent birds, biological assets are measured at fair value less cost to sell, with any change therein recognised in profit or loss. Parent birds are valued at cost less accumulated amortisation.
3.16 InventoriesInventories are measured at the lower of cost or net realisable value. The cost of finished goods is computed, based on the weighted average cost method and includes material, labour and appropriate share of production overheads, based on normal operating capacity. In the case of purchased inventories, cost includes expenditure incurred in acquiring the inventories, production or conversion costs, and other costs incurred in bringing them to their existing location and condition. The cost of raw material is computed at weighted average cost.
Net realisable value is the estimated selling price in the ordinary course of business, less the estimated costs of completion and selling expenses.
Provision for obsolete and slow moving inventorySpecific provision are made giving considerations to the condition of inventory held by the Company/Group.
3.17 ProvisionsA provision is recognised if, as a result of a past event, the Group has a present legal or constructive obligation that an outflow of
economic benefits will be required to settle the obligations.
3.18 Employment benefits
Defined Benefit Plans
A defined benefit plan is a post-employment benefit plan, other than a defined contribution plan. The liability recognised in the Financial Statements in respect of defined benefit plans is calculated separately for each plan by estimating the amount of future benefit that employees have earned in return for their service in the current and prior periods; that benefit is discounted to determine its present value. Any unrecognised past service costs and the fair value of any plan assets are deducted.
The calculation is performed annually by a qualified actuary using the projected unit credit method.
The Group recognises all actuarial gains and losses arising from defined benefit plans immediately in other comprehensive income and all expenses related to defined benefit plans in personnel expenses in profit or loss.
Provision has been made for retirement gratuities from the first year of service of all employees, in conformity with LKAS 19 “Employee Benefit”. However, under the Payment of Gratuity Act No.12 of 1983, the liability to an employee arise only on completion of five years of continued service.
Gratuity was calculated based on the below basis
Period of Service (Years)
Basis
5-9 inclusive 1/2 month salary for each completed year
10-14 inclusive 3/4 month salary for each completed year
15-16 inclusive 15 months salary in total
17-18 inclusive 16 months salary in total
NOTES TO THE FINANCIAL STATEMENTS

69TIDES OF CHANGE
Period of Service (Years)
Basis
19-20 inclusive 17 months salary in total
21-22 inclusive 18 months salary in total
23-24 inclusive 19 months salary in total
25 - 40 inclusive
20 months salary in total
41 years and over
1/2 month salary for each completed year
Defined Contribution Plan - Employees’ Provident Fund/ Mercantile Services Provident Society and Employees’ Trust Fund A defined contribution plan is a post-employment benefit plan under which an entity pays fixed contributions into a separate entity and has no further legal or constructive obligation to pay further amounts. The Group contributes 12%, 12% and 3% of gross emoluments of employees to the Employees’ Provident Fund, Mercantile Services Provident Society and the Employees’ Trust Fund respectively. Obligations for contributions to defined contribution plans are recognised as an employee benefit expense in profit or loss in the periods during which services are rendered by employees.
Short-Term Benefits
Short-term employee benefit obligations are measured on an undiscounted basis and are expensed as the related service is provided. A liability is recognised for the amount expected to be paid under short-term cash bonus if the Group has a present legal or constructive obligation to pay this amount as a result of past serviced provided by the employee and the obligation can be measured reliably.
3.19 Share-based payment transactions - ESOS Shareholders of the Company resolved on 30th June 2016 the issue of Four Million Three Hundred Seventy Four Thousand Non-Voting (Class
X), Ordinary Shares (constituting approximately 20% of the issued Non-Voting (Class X) shares as at 24th May 2016) to all executive officers in the level premier managers and above in CIC Group under and Employee Share Option Scheme (ESOS). Options were granted for no consideration. The shares would be issued to employees during a period of 5 years commencing from 2017. The shares under ESOS were priced at average of volume weighted average market price of the Company’s shares for thirty (30) market days immediately preceding the grant date.
There will be no financial assistance granted to employees with regard to the ESOS.
“Group” for the purpose of ESOS will consist of CIC Holdings PLC, CIC Agri businesses Group, CIC CropGuard (Private) Limited and CIC Feeds (Private) Limited and it’s subsidiaries.
The cost of equity – settled transactions is recognised, together with a corresponding increase in other capital reserves in equity if management intends that the eligible employees will exercise the option right in foreseeable future.
During the year no options were granted/exercised under ESOS.
3.20 Fair Value“Fair Value” is the price that would be received to sell an asset or paid to transfer a liability in an orderly transaction between market participants at the measurement date in the principal or, in its absence, the most advantageous market to which the Group has the access at that dare. The fair value of a liability reflects its non-performance risk.
A number of the Group’s accounting policies and disclosures require the measurement of fair values, for both financials and non-financials assets and liabilities.
When one is available, the Group measures the fair value of an
instrument using the quoted price in an active market for that instrument. A market is regarded as “active” if transactions for the asset or liability take place with sufficient frequency and volume to provide pricing information on an ongoing basis.
If there is no quoted price in an active market, then the Group uses valuation techniques that maximise the use of relevant observable inputs and minimise the use of the unobservable inputs. The chose valuation technique incorporates all of the factors that market participants would take into account in pricing transactions.
If an asset or liability measured at fair value has a bid price and an ask price, then the Group measures assets and long positions at a bid price and liabilities and short positions at an ask price.
The best evidence of the fair value of financial instrument on initial recognition is normally the transaction price- ie. The fair value of the consideration given or received. If the Group determines that the fair value on initial recognition differs from the transaction price and the fair value is evidenced neither by a quoted price in an active market for an identical asset or liability nor based on a valuation technique for which any unobservable inputs are judged to be insignificant in relation to the measurement, then the financial instrument is initially measured at fair value, adjusted to defer the difference between the fair value on initial recognition and the transaction price. Subsequently, that difference is recognsied in profit or loss on an appropriate basis over the life of the instrument but not later than when the valuation is wholly supported by observable market data or the transaction is closed out.
3.21 Expenditure RecognitionExpenses are recognised in Profit and Loss on the basis of a direct association between the cost incurred and the earning of specific items of
CIC HOLDINGS PLC Annual Report 2020/2170
income. All expenditure incurred in the running of the business and in maintaining the Property, Plant and Equipment in a state of efficiency has been charged to income in arriving at the profit for the year.
For the purpose of presentation of the profit or loss, the Directors are of the opinion that “function of expenses method” presents fairly the elements of the Group’s performance and hence such presentation method is adopted.
3.22 Earnings Per ShareThe Group presents basic Earnings Per Share (EPS) for its Ordinary Shares. Basic EPS is calculated by dividing the profit or loss attributable to ordinary shareholders of the Company by the weighted number of ordinary shares outstanding during the period.
3.23 Cash Flow StatementThe Cash Flow Statement has been prepared using the indirect method.
Cash and cash equivalents comprise short-term, highly liquid investments that are readily convertible to known amounts of cash and are subject to an insignificant risk of changes in value.
3.24 Segment Reporting The Group has the following four strategic divisions, which are its reportable segments. These divisions offer different products and services, and are managed separately because they require different technology and marketing strategies.
A summary describing the operations of each reportable segment is given in pages 71.
Segment results that are reported to the Group’s COO (the chief operating decision maker) include items directly attributable to a segment as well as those that can be allocated on a reasonable basis. Unallocated expenses comprise mainly corporate assets (primarily the Company’s head office), head office expenses and tax assets and liabilities.
3.25 Events Occurring after the Reporting DateAll material events occurring after the reporting date have been considered and where appropriate adjustment or disclosures have been made in these Financial Statements.
4. NEW ACCOUNTING STANDARD AMENDMENTS ISSUED BUT NOT EFFECTIVE AS AT THE REPORTING DATEThe following amendments and improvements which are effective for annual periods beginning on or after 01st April 2021 do not expect to have a significant impact on the Group’s Financial Statements.
• Amendments to LKAS 1 : Classification of liabilities as Current or NoN-ncurrent.
• Amendments to SLFRS 3: Reference to the Conceptual Framework.
• Amendments to LKAS 16 : Property, Plant & Equipment - Proceeds before Intended Use
• Amendments to LKAS 37 : Onerous Contracts - Cost of Fulfilling a Contract.
• Amendments to SLFRS 7, SLFRS 9 and LKAS 39 : Interest Rate Benchmark Reform - Phase 2.
• Amendments to SLFRS 9, LKAS 39, SLFRS 7, SLFRS 4 and SLFRS 16 : Interest Rate Benchmark Reform - Phase 2.
NOTES TO THE FINANCIAL STATEMENTS

71TIDES OF CHANGE
5.
SEGM
ENTA
L IN
FORM
ATIO
NGr
oup
has
five
stra
tegi
c di
visi
ons,
whi
ch a
re it
s re
port
able
seg
men
ts. T
hese
div
isio
ns o
ffer
diff
eren
t pro
duct
s an
d se
rvic
es, w
hich
are
man
aged
sep
arat
ely
as th
ey re
quire
diff
eren
t te
chno
logy
and
mar
keti
ng s
trat
egie
s.
Segm
ent
Prod
uct a
nd s
ervi
ces
Crop
Sol
utio
ns
Law
n an
d ga
rden
, Pla
nt n
utrit
ion,
Pla
nt p
rote
ctio
n, S
eeds
A
gri P
rodu
ce
Agr
i pro
duce
reta
il ch
ain,
Agr
i res
ort,
Dai
ry, F
arm
s, F
ruit
and
veg
etab
les,
Gra
ins,
Ric
e Li
ve S
tock
Sol
utio
ns
Feed
s, P
oult
ry, V
etca
re, D
airy
bre
edin
g In
dust
rial S
olut
ions
Co
nstr
ucti
on M
ater
ial,
Indu
stria
l Raw
Mat
eria
l, Pa
ckag
ing
Hea
lth
& P
erso
nal c
are
Her
bal c
are,
Med
ical
Dev
ices
, Per
sona
l Car
e, P
harm
aceu
tica
ls
Crop
Sol
utio
nsAg
ri Pr
oduc
eLi
ves S
tock
Sol
utio
nsIn
dust
rial S
olut
ions
Heal
th &
Per
sona
l Car
eGr
oup
2021
2020
2021
2020
2021
2020
2021
2020
2021
2020
2021
2020
Rs ‘0
00Rs
‘000
Rs ‘0
00Rs
‘000
Rs ‘0
00Rs
‘000
Rs ‘0
00Rs
‘000
Rs ‘0
00Rs
‘000
Rs ‘0
00Rs
‘000
Profi
t or l
oss
Reve
nue
12,6
53,7
36
8,6
11,22
9 3
,224
,910
2
,896
,799
9
,144,
411
7,07
5,70
3 3
,934
,668
4
,066
,212
8
,513
,810
8
,262
,825
3
7,471
,535
3
0,91
2,76
8 In
ter s
egm
enta
l rev
enue
(7
9,22
4) (1
87,8
79)
-
(32,
621)
(27,8
22)
(31,1
23)
(119
,407
) (1
21,9
92)
(11,7
39)
(3,5
90)
(238
,192)
(377
,205
)To
tal r
even
ue to
ext
erna
l cus
tom
ers
12,5
74,5
12
8,4
23,3
50
3,2
24,9
10
2,8
64,17
8 9
,116,
589
7,04
4,58
0 3
,815
,261
3
,944
,220
8
,502
,071
8
,259
,235
3
7,233
,343
30
,535
,563
Segm
enta
l res
ults
2,3
92,4
47
1,23
2,23
7 2
11,84
4 10
7,092
9
11,31
4 5
2,47
0 6
90,3
80
705,
082
1,18
7,722
1,
089,
921
5,3
93,70
7 3
,186,
802
Fina
nce
cost
(net
) (4
87,8
16)
(615
,815
) (6
9,42
7) (2
11,97
2) (2
73,0
13)
(460
,118)
(57,2
91)
(57,4
40)
(60,
596)
(359
,738
) (9
48,14
3)(1,
705,
083)
Shar
e of
pro
fit o
f equ
ity a
ccou
nted
in
vest
ees
-
-
-
-
-
-
466
,488
3
90,0
13
-
-
466
,488
3
90,0
13
Profi
t/(lo
ss) b
efor
e ta
x 1,
904,
631
616
,422
14
2,41
7 (1
04,8
80)
638
,301
(4
07,6
48)
1,09
9,57
7 1,
037,6
55
1,12
7,126
73
0,18
3 4
,912
,052
1,8
71,7
32In
com
e ta
x (5
61,3
85)
(137
,535
) (3
6,28
7) (4
,143)
(25,
906)
(101
,949
) (9
1,225
) (1
43,8
28)
(260
,385
) (1
48,14
2) (9
75,18
8) (5
35,5
97)
Profi
t/(lo
ss) a
fter
tax
1,34
3,24
6 4
78,8
87
106,
130
(109
,023
) 6
12,3
95
(509
,597
) 1,
008,
352
893
,827
8
66,74
1 58
2,04
1 3
,936
,864
1,3
36,13
5Pr
ofit/
(loss
) fro
m d
isco
ntin
ued
oper
atio
ns
(51)
1,36
3 (1
06,8
83)
(279
,119)
-
-
16,16
3 14
,064
-
6
,957
(9
0,77
1) (2
56,7
35)
Profi
t/(lo
ss) f
or th
e ye
ar 1,
343,
195
480
,250
(7
53)
(388
,142)
612
,395
(5
09,5
97)
1,02
4,51
5 9
07,8
91
866
,741
588,
998
3,8
46,0
93
1,079
,400
Attri
buta
ble
to :
Equi
ty h
olde
rs o
f the
Com
pany
1,
326,
290
476
,946
(2
23,4
54)
(353
,692
) 5
46,3
08
(397
,823
) 8
05,14
7 6
82,6
79
678
,120
424,
474
3,13
2,41
1 83
2,58
4No
n-co
ntro
lling
inte
rest
s 16
,905
3
,304
2
22,70
1 (3
4,45
0) 6
6,08
7 (1
11,77
4) 2
19,3
68
225
,212
18
8,62
1 16
4,52
4 7
13,6
82
246,
816
Profi
t /(lo
ss) f
or th
e ye
ar 1,
343,
195
480
,250
(7
53)
(388
,142)
612
,395
(5
09,5
97)
1,02
4,51
5 9
07,8
91
866
,741
588,
998
3,8
46,0
93
1,079
,400
Asse
ts a
nd li
abili
ties
Non-
curre
nt a
sset
sPr
oper
ty, p
lant
& e
quip
men
ts 9
52,3
42
1,17
0,21
7 1,
029,
758
1,27
6,52
6 4
,506
,248
4
,475
,743
1,45
8,26
5 1,
344,
465
2,7
27,6
04
2,6
79,5
57
10,6
74,2
17
10,9
46,5
08
Unal
loca
ted
prop
erty
, pl
ant &
equ
ipm
ent
-
-
-
-
-
-
-
-
-
-
1,51
9,44
7 1,
413,
307
Othe
r non
-cur
rent
ass
ets
57,3
80
11,3
74
21,8
19
51,9
83
283
,872
2
15,6
21
1,65
4,40
7 1,
393,
449
75,9
77
72,9
67
2,0
93,4
55
1,74
5,39
4 To
tal n
on-c
urre
nt a
sset
s 1,
009,
722
1,18
1,591
1,
051,5
77
1,32
8,50
9 4
,790
,120
4,6
91,3
64
3,11
2,67
2 2
,737
,914
2
,803
,581
2
,752
,524
14
,287
,119
14,10
5,20
9
Curre
nt a
sset
s 10
,254
,739
10
,667
,332
1,
995,
613
1,98
1,986
2
,670
,653
2
,799
,442
4
,379
,397
3
,476
,677
6
,443
,658
6
,238
,226
2
5,74
4,06
0 2
5,16
3,66
3 To
tal a
sset
s 11
,264
,461
11
,848
,923
3
,047
,190
3,3
10,4
95
7,46
0,77
3 7,
490,
806
7,49
2,06
9 6
,214
,591
9
,247
,239
8
,990
,750
4
0,03
1,179
39
,268
,872
Non-
curre
nt li
abili
ties
462
,059
4
48,4
47
220
,781
330
,163
713
,667
8
10,5
59
341
,826
3
98,6
36
760,
513
1,119
,428
2
,498
,846
3
,107,2
33
Curre
nt li
abili
ties
11,0
17,39
7 12
,920
,642
1,
889,
958
1,89
3,12
4 4
,194,
812
4,9
88,8
32
914
,744
1,04
7,064
3
,212
,435
3
,600
,229
2
1,229
,346
24
,449
,891
To
tal l
iabi
litie
s 11
,479
,456
13
,369
,089
2
,110,
739
2,2
23,2
87
4,9
08,4
79
5,7
99,3
91
1,25
6,57
0 1,
445,
700
3,9
72,9
48
4,7
19,6
57
23,
728,
192
27,5
57,12
4
Inte
r seg
men
t pric
ing
on th
e ba
sis
of a
rm’s
leng
th tr
ansa
ctio
ns.
Seco
ndar
y ge
ogra
phic
al s
egm
enta
tion
is n
ot g
iven
sin
ce th
e di
sper
sion
of t
he G
roup
ope
rati
ons
does
not
con
stru
e an
obj
ecti
ve s
egm
enta
tion
.

CIC HOLDINGS PLC Annual Report 2020/2172
6 REVENUE
Company Group
For the year ended 31st March 2021 2020 2021 2020 Rs.’000 Rs.’000 Rs.’000 Rs.’000
Revenue 9,817,814 8,755,565 37,233,343 30,535,563 Net Revenue 9,817,814 8,755,565 37,233,343 30,535,563 Local 9,817,814 8,755,565 36,568,490 30,113,189 Exports - - 664,853 422,374 Total 9,817,814 8,755,565 37,233,343 30,535,563
6.1 Disaggregation of Revenue from Contracts with Customers.
Crop Solutions Agri Produce Live Stock Solutions Industrial Solutions Health & Personal CareFor the year ended 31st March 2021 2020 2021 2020 2021 2020 2021 2020 2021 2020
Rs.'000 Rs.'000 Rs.'000 Rs.'000 Rs.'000 Rs.'000 Rs.'000 Rs.'000 Rs.'000 Rs.'000
Primary geographical markets
Local 12,574,512 8,423,350 3,097,016 2,785,698 9,116,589 7,044,580 3,814,312 3,944,220 7,966,061 7,915,341 Export - - 127,894 78,480 - - 949 - 536,010 343,894
12,574,512 8,423,350 3,224,910 2,864,178 9,116,589 7,044,580 3,815,261 3,944,220 8,502,071 8,259,235
Major product linesAgro chemicals 5,612,451 3,955,688 - - - - - - - - Fertilizer 5,322,408 3,183,170 - - - - - - - - Grains - - 1,497,293 1,283,360 - - - - - - Feeds - - - - 6,941,000 4,214,306 - - - - Pharmaceuticals and
medical devices - - - - - - - - 5,180,219 4,133,362 Herbal health and
personal care - - - - - - - - 3,321,852 4,125,873 Industrial chemicals - - - - - - 2,209,222 2,287,549 - - Consumer & packaging - - - - - - 1,606,039 1,656,671 - - Others 1,639,653 1,284,492 1,727,617 1,580,818 2,175,589 2,830,274 - - - -
12,574,512 8,423,350 3,224,910 2,864,178 9,116,589 7,044,580 3,815,261 3,944,220 8,502,071 8,259,235
Timing of revenue recognition
Products transferred at a point in time 12,574,512 8,423,350 3,224,910 2,864,178 9,116,589 7,044,580 3,815,261 3,944,220 8,502,071 8,259,235
6.2 Disaggregation of Export Revenue from Contracts with Customers.
For the year ended 31st March 2021 2020 Rs.’000 Rs.’000
Asia 263,354 196,473 Europe 192,118 126,151 Middle East 27,437 14,259 Australia 52,999 40,514 Others 128,945 44,977 Total 664,853 422,374
NOTES TO THE FINANCIAL STATEMENTS

73TIDES OF CHANGE
7 OTHER INCOME
Company Group
For the year ended 31st March 2021 2020 2021 2020 Rs.’000 Rs.’000 Rs.’000 Rs.’000
Rent 22,017 21,006 8,592 4,638 Dividend Income Quoted 19,857 15,273 27,644 48,647 Unquoted 550,180 355,104 - - Net gain on disposal of property, plant & equipment 52 - 109,882 16,816 Gain on disposal of asset held for sale 34,024 - 34,024 - Reversal of provision against inter company receivable - 6,399 - - Net gain on disposal of investment - - - 157,020 Changes in fair value of biological assets - - 10,102 2,172 Grants amortised - - 832 961 Direct sales commission 21,565 39,293 34,893 51,015 Sundry income - 205 79,156 79,637 Total 647,695 437,280 305,125 360,906
8 OTHER EXPENSES
Company Group
For the year ended 31st March 2021 2020 2021 2020 Rs.’000 Rs.’000 Rs.’000 Rs.’000
Impairment loss on property, plant & equipment - - 5,715 6,107 Loss on disposal of property, plant & equipment - 13,674 865 13,674 Changes in fair value of biological assets - - 16,706 Impairment of investment in Crop Management Services (Private)
Limited - 17,200 - -
Impairment of investment in CIC Properties (Private) Limited 37,000 - - - Provision for impairment of inter-company receivables - 33,710 - - Write- off of property, plant & equipment and
capital work- in - progress - - 1,002 35
Total 37,000 64,584 7,582 36,522

CIC HOLDINGS PLC Annual Report 2020/2174
9 FINANCE COST (NET)
Company Group
For the year ended 31st March 2021 2020 2021 2020
Rs.’000 Rs.’000 Rs.’000 Rs.’000
9.1 Finance CostLong -term loans - - 46,577 132,992 Lease interest 9,485 11,089 23,924 27,390 Short- term loans and overdrafts 303,199 574,070 922,058 1,729,094 Staff loans - - 3,594 4,506 Foreign exchange loss - - 144,596 11,744
312,684 585,159 1,140,749 1,905,726
9.2 Finance Income Staff loan 386 339 5,633 6,332 Foreign exchange gain 22,270 14,274 89,752 107,207 Interest on repo investments - - 10,780 1,868 Interest income on sub-leasing 384 1,165 13 479 Deposits 26,864 7,048 86,428 84,757
49,904 22,826 192,606 200,643 Finance Cost (Net) 262,780 562,333 948,143 1,705,083
10 SHARE OF PROFIT OF EQUITY ACCOUNTED INVESTEES (NET OF TAX)
Company Group
For the year ended 31st March 2021 2020 2021 2020 Rs.’000 Rs.’000 Rs.’000 Rs.’000
Commercial Insurance Brokers (Private) Limited - - - 8,938 Akzo Nobel Paints Lanka (Private) Limited - - 507,110 381,075 Rainforest Ecolodge (Private) Limited - - (40,622) - Total - - 466,488 390,013
NOTES TO THE FINANCIAL STATEMENTS

75TIDES OF CHANGE
11 PROFIT BEFORE TAX
Company Group
For the year ended 31st March 2021 2020 2021 2020 Rs.’000 Rs.’000 Rs.’000 Rs.’000
Stated after charging all expenses including the following:Directors' emoluments and retirement benefits 36,138 41,130 183,179 158,970 Depreciation on property, plant & equipment and amortisation of right of use asset 176,482 184,249 908,279 938,931 Directors' fees 17,477 17,204 35,849 31,354 Donations 1,000 1,000 1,142 1,632 Legal fees 5,019 2,712 8,535 9,582 Auditors' remuneration
Statutory audit fees 2,400 2,185 13,426 13,343Audit related fees 660 729 2,821 2,921 Non- audit fees 1,416 2,756 2,762 4,773
Professional fees 4,848 5,162 17,487 39,919 Provision/ (reversal) for obsolete and slow moving inventories 75,320 (6,429) 77,016 122,316 Personnel Costs* (Note 11.1) 415,772 437,313 2,292,297 2,169,540
* Includes Directors’ emoluments and retirement benefits.
11.1 Personnel Costs
Company Group
For the year ended 31st March 2021 2020 2021 2020 Rs.’000 Rs.’000 Rs.’000 Rs.’000
Salaries 300,989 315,003 1,752,150 1,611,466 EPF/MSPS - Defined contribution plan 35,481 36,567 160,579 158,754 ETF - Defined contribution plan 8,876 9,142 39,913 39,628 Bonus 34,281 38,357 204,000 211,565 Provision for retirement benefits 36,145 38,244 135,583 133,542 Voluntary retirement scheme - - 72 14,585 Total 415,772 437,313 2,292,297 2,169,540
Number of employees as at the end of the year 449 398 2,137 2,088

CIC HOLDINGS PLC Annual Report 2020/2176
12 INCOME TAX EXPENSE
Company Group
For the year ended 31st March 2021 2020 2021 2020 Rs.’000 Rs.’000 Rs.’000 Rs.’000
Current tax expenses on ordinary activities for the yearCurrent tax expenses on profit for the year ( Note 12.2)Continued operations 210,484 - 864,390 229,486 Under provision in respect of previous years - - 1,789 15,501 Irrecoverable ESC written off 35,307 65,175 124,009 128,916 Irrecoverable tax written off 47,342 - 47,342 -Tax on dividend income - - - 16,318
293,133 65,175 1,037,530 390,221 Deferred tax expense/(reversals)Origination of temporary differences (Note 12.1)Continued operations 14,360 196,563 (62,342) 145,376
14,360 196,563 (62,342) 145,376 Total 307,493 261,738 975,188 535,597
12.1 Deferred Tax Expense
Company Group
For the year ended 31st March 2021 2020 2021 2020 Rs.’000 Rs.’000 Rs.’000 Rs.’000
Profit or LossDeferred tax expense arising from : Property, plant & equipment (46,921) (1,090) (513,792) 125,192 Intangible assets - - (3,335) 1,723 Biological assets - - (12,463) (9,058)Provision for impairment of trade receivables (22,931) - 20,370 (25,711)Provision for obsolete and slow moving inventories (4,787) - (10,295) 3,724 Provision for others (22,738) - (21,916) (604)Accumulated tax losses 109,144 189,070 440,958 63,670 Contract assets - - (2,464) 1,423 Right-of-use asset (6,151) 22,829 (4,777) 19,881 Net investment in sublease (1,925) 1,925 (533) 7,149 Lease liability 7,152 (26,302) 6,372 (31,817)Contract liability - - 4,567 (1,564)Employee benefits 3,517 10,131 34,966 (8,632)
14,360 196,563 (62,342) 145,376 Other Comprehensive IncomeDeferred tax expense arising from : Actuarial losses/( gain) on defined benefit obligations 5,258 (7,861) 1,262 (8,738)Revaluation of property, plant & equipment 26,293 - (16,875) -
31,551 (7,861) (15,613) (8,738)Total 45,911 188,702 (77,955) 136,638
NOTES TO THE FINANCIAL STATEMENTS

77TIDES OF CHANGE
12.2 Reconciliation of the Accounting Profit and Taxable Profit
Company Group
For the year ended 31st March 2021 2020 2021 2020 Rs.’000 Rs.’000 Rs.’000 Rs.’000
Profit before tax-continuing operations 1,339,635 644,529 4,912,052 1,871,732 Profit / (loss) before tax-discontinued operations 11,785 18,803 (90,618) (256,624)Intra - group adjustments - - 69,844 (7,908)
1,351,420 663,332 4,891,278 1,607,200
Share of profit of equity accounted investee - - (466,488) (390,013)Other sources of income (34,378) - 64,701 (242,025)Disallowable expenses 1,199,654 405,073 3,621,150 3,334,697 Tax deductible expenses (380,228) (340,916) (2,100,171) (2,974,847)Tax exempt income (26,510) (112,830) (414,732) (212,673)Tax loss for the year - - (643,905) 327,953 Tax loss utilised during the year (377,351) (614,659) (844,081) (1,584,725)Taxable profit 1,732,607 - 4,290,790 (134,433)
Income tax @ 14% 77,213 - 130,199 2,722 Income tax @ 18% 40,650 - 155,291 18,763 Income tax @ 24% 92,621 - 579,053 24,600 Income tax @ 28% - - - 183,512
Current tax expense on continued operations 210,484 - 864,390 229,486 Current tax expense on discontinued operations - - 153 111
210,484 - 864,543 229,597
Accumulated tax lossesTax loss brought forward 389,801 1,065,051 3,780,278 4,181,136 Adjustment to brought forward tax losses (12,450) (60,591) (212,905) 855,914 Tax loss for the year - - (643,905) 327,953 Tax loss utilised during the year (377,351) (614,659) (844,081) (1,584,725)Tax loss carried forward - 389,801 2,079,387 3,780,278
Effective tax rate 11% - 20% -
12.3 Corporate income taxes of the companies in the Group have been computed in accordance with the Inland Revenue Act No.24 of 2017 and proposed amendments to the same.
Group’s tax expense is based on the taxable profit of each Company in the Group. At present the tax laws of Sri Lanka do not provide for Group Taxation.
12.4 Irrecoverable Economic Service Charge (ESC) has been charged to the Profit or Loss.
12.5 Deferred tax has been computed using the substantively enacted tax rates of 24%, 18% and 14% applicable for the entities within the Group. The effect of change in revaluation reserve has been accounted in the other comprehensive income.
12.6 Details of the Current Tax Computation The profits of CIC Poultry Farms Limited, were taxable at a concessionary rate of 15% in terms of the agreement entered into with the
Board of Investment and other income was liable for income tax at the rate of 28%. As per the changes made to the income tax rates from 1st January 2020 onwards, CIC Vetcare (Private) Limited and CIC Bio Security Breeder Farms Limited were liable for income tax at the rate of 24% and CIC Feeds (Private) Limited was taxable under dual tax rates i.e. feed division at 18% and day old chicks division at 0%. Further CIC Poultry Farms Limited was also taxable at 14% for processed chicken and 0% for live birds.
CIC Agri Produce Marketing (Private) Limited engaged in Agriculture, which was taxed at 10 % up to 31st March 2019, is exempted from Income Tax under Agro – farming with effect from 1st April 2019 as per the amendment Act number 10 of 2021 with retrospective effect. CIC Agri Produce Export (Private) Limited engaged in Rice Milling which was taxed at 18% from 01st January 2020 to 31st March 2020 is taxed at 14% with effect from 01.04.2020 under Agro- processing as per the amendment act number 10 of 2021.
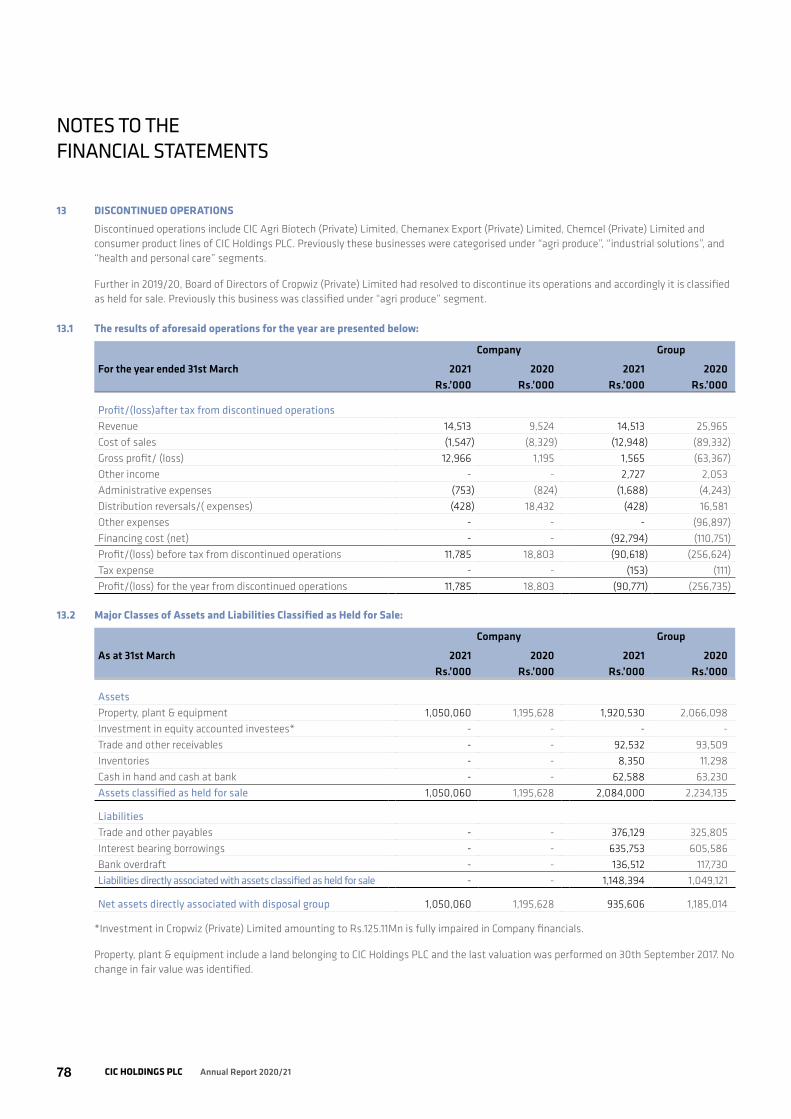
CIC HOLDINGS PLC Annual Report 2020/2178
13 DISCONTINUED OPERATIONSDiscontinued operations include CIC Agri Biotech (Private) Limited, Chemanex Export (Private) Limited, Chemcel (Private) Limited and consumer product lines of CIC Holdings PLC. Previously these businesses were categorised under “agri produce”, “industrial solutions”, and “health and personal care” segments.
Further in 2019/20, Board of Directors of Cropwiz (Private) Limited had resolved to discontinue its operations and accordingly it is classified as held for sale. Previously this business was classified under “agri produce” segment.
13.1 The results of aforesaid operations for the year are presented below:
Company Group
For the year ended 31st March 2021 2020 2021 2020 Rs.’000 Rs.’000 Rs.’000 Rs.’000
Profit/(loss)after tax from discontinued operations Revenue 14,513 9,524 14,513 25,965 Cost of sales (1,547) (8,329) (12,948) (89,332)Gross profit/ (loss) 12,966 1,195 1,565 (63,367)Other income - - 2,727 2,053 Administrative expenses (753) (824) (1,688) (4,243)Distribution reversals/( expenses) (428) 18,432 (428) 16,581 Other expenses - - - (96,897)Financing cost (net) - - (92,794) (110,751)Profit/(loss) before tax from discontinued operations 11,785 18,803 (90,618) (256,624)Tax expense - - (153) (111)Profit/(loss) for the year from discontinued operations 11,785 18,803 (90,771) (256,735)
13.2 Major Classes of Assets and Liabilities Classified as Held for Sale:
Company Group
As at 31st March 2021 2020 2021 2020 Rs.’000 Rs.’000 Rs.’000 Rs.’000
AssetsProperty, plant & equipment 1,050,060 1,195,628 1,920,530 2,066,098 Investment in equity accounted investees* - - - - Trade and other receivables - - 92,532 93,509 Inventories - - 8,350 11,298 Cash in hand and cash at bank - - 62,588 63,230 Assets classified as held for sale 1,050,060 1,195,628 2,084,000 2,234,135
LiabilitiesTrade and other payables - - 376,129 325,805 Interest bearing borrowings - - 635,753 605,586 Bank overdraft - - 136,512 117,730 Liabilities directly associated with assets classified as held for sale - - 1,148,394 1,049,121
Net assets directly associated with disposal group 1,050,060 1,195,628 935,606 1,185,014
*Investment in Cropwiz (Private) Limited amounting to Rs.125.11Mn is fully impaired in Company financials.
Property, plant & equipment include a land belonging to CIC Holdings PLC and the last valuation was performed on 30th September 2017. No change in fair value was identified.
NOTES TO THE FINANCIAL STATEMENTS

79TIDES OF CHANGE
13.3 Cash Flows Generated From/(Used in) Discontinued Operations
Company Group
For the year ended 31st March 2021 2020 2021 2020 Rs.’000 Rs.’000 Rs.’000 Rs.’000
Net cash generated from/(used in) operating activities 25,230 11,609 (119,431) (71,395)Net cash generated from investing activities - - - 993 Net cash generated from financing activities - - - 45,426 Net cash inflow/(outflow) 25,230 11,609 (119,431) (24,976)
13.4 Earnings/(Deficit) per Share:
Company Group
For the year ended 31st March 2021 2020 2021 2020 Rs. Rs. Rs. Rs.
Basic/diluted earnings/(deficit) per share for the year, from discontinued operations (Rs.)
0.03 0.05 (0.12) (0.35)
13.5 Assets classified as Held for Distribution
Company Group
As at 31st March 2021 2020 2021 2020 Rs.’000 Rs.’000 Rs.’000 Rs.’000
Major classes of assets and liabilities classified as held for distribution
AssetsOther receivables - - 436 781 Investments 197 197 3,957 3,228 Cash in hand and at bank - - 30,844 27,734 Assets classified as held for distribution 197 197 35,237 31,743
LiabilitiesTrade and other payables - - 3,075 5,548 Liabilities directly associated with assets classified as held for
distribution- - 3,075 5,548
Assets and liabilities which belong to CIC Agri Biotech (Private) Limited , Chemanex Exports (Private) Limited and Chemcel (Private) Limited have been categorised under “assets and liabilities held for distribution”.
13.6 Disposal of Assets Held for Sale During the year During the year Company disposed a part of property, plant & equipment which was classified as “held for sale”. Following table summarises the effect of the said disposal on the financial position of the Company and the Group.
For the year ended 31st March 2021 Rs.’000
Property, plant & equipment (145,568)
Consideration received (net of tax) 185,150 Commission paid (5,558)Gain on disposal 34,024
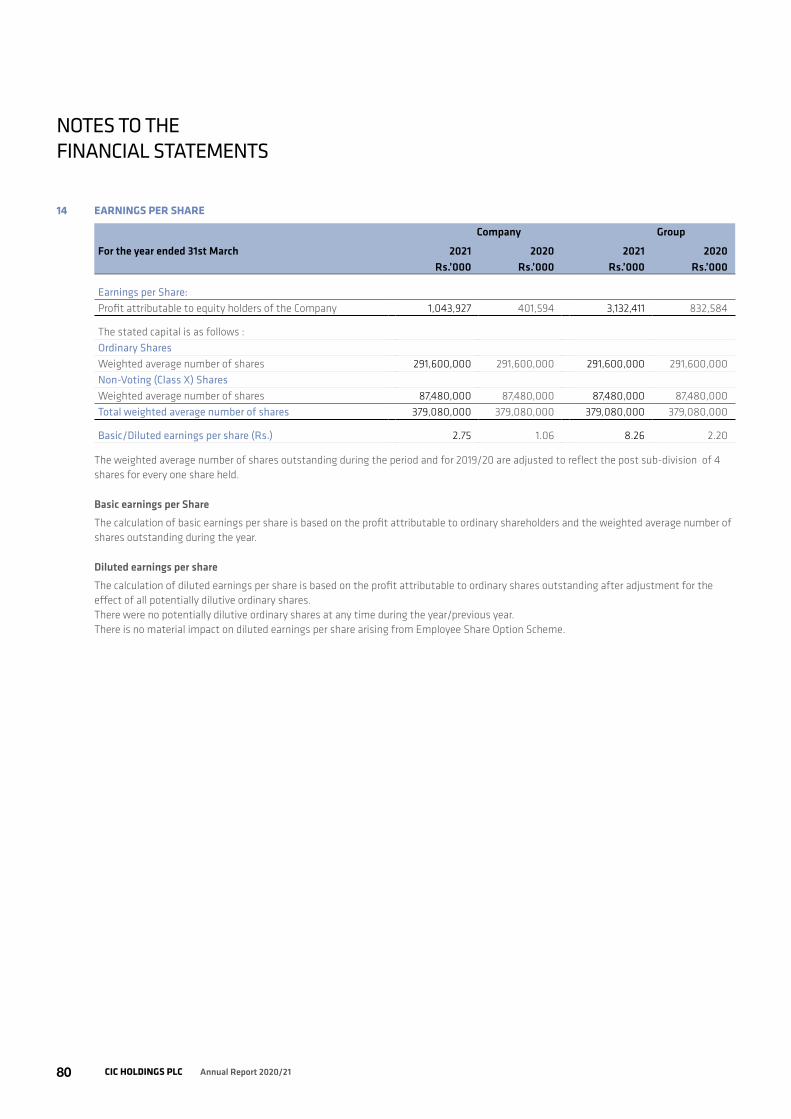
CIC HOLDINGS PLC Annual Report 2020/2180
14 EARNINGS PER SHARE
Company Group
For the year ended 31st March 2021 2020 2021 2020 Rs.’000 Rs.’000 Rs.’000 Rs.’000
Earnings per Share:Profit attributable to equity holders of the Company 1,043,927 401,594 3,132,411 832,584
The stated capital is as follows :Ordinary SharesWeighted average number of shares 291,600,000 291,600,000 291,600,000 291,600,000 Non-Voting (Class X) Shares Weighted average number of shares 87,480,000 87,480,000 87,480,000 87,480,000 Total weighted average number of shares 379,080,000 379,080,000 379,080,000 379,080,000
Basic/Diluted earnings per share (Rs.) 2.75 1.06 8.26 2.20
The weighted average number of shares outstanding during the period and for 2019/20 are adjusted to reflect the post sub-division of 4 shares for every one share held.
Basic earnings per ShareThe calculation of basic earnings per share is based on the profit attributable to ordinary shareholders and the weighted average number of shares outstanding during the year.
Diluted earnings per shareThe calculation of diluted earnings per share is based on the profit attributable to ordinary shares outstanding after adjustment for the effect of all potentially dilutive ordinary shares. There were no potentially dilutive ordinary shares at any time during the year/previous year. There is no material impact on diluted earnings per share arising from Employee Share Option Scheme.
NOTES TO THE FINANCIAL STATEMENTS

81TIDES OF CHANGE
15 GROSS DIVIDEND
Company Group
For the year ended 31st March 2021 2020 2021 2020 Rs.’000 Rs.’000 Rs.’000 Rs.’000
Interim Dividend Ordinary Shares 1st interim dividend paid Rs.1.00 (2020/21) post sub-division,
Rs.1.00 (2019/20) pre sub-division 291,600 72,900 291,600 72,900
2nd interim dividend paid Rs.1.00 ( 2019/20) pre sub-division 72,900 - 72,900 - Non-Voting (Class X) Shares 1st interim dividend paid Rs.1.00 (2020/21) post sub-division,
Rs.1.00 (2019/20) pre sub-division 87,480 21,870 87,480 21,870
2nd interim dividend paid Rs.1.00 ( 2019/20) pre sub-division 21,870 - 21,870 - 473,850 94,770 473,850 94,770
Final DividendFinal dividend proposed and paid - (2019/20)- Nil, Rs.1.00
(2018/19) pre sub-division Ordinary Shares - 72,900 - 72,900 Non-Voting ( Class X) Shares - 21,870 - 21,870
- 94,770 - 94,770 Total 473,850 189,540 473,850 189,540
Post sub-division no. of shares Ordinary Shares 291,600,000 291,600,000 291,600,000 291,600,000 Non-Voting ( Class X) Shares 87,480,000 87,480,000 87,480,000 87,480,000
379,080,000 379,080,000 379,080,000 379,080,000 Dividend per share 1.25 0.50 1.25 0.50
During the year, Rs.1.25 dividend was paid to the shareholders (2019/20- Rs.0.50).
Directors have recommended the payment of a final dividend of Rs.1.25 per share on Ordinary and Non-Voting (Class X) shares for the year ended 31st March 2021. This proposed dividend has not yet been recognised as a liability as at 31st March 2021.
This would result in a total dividend per share of Rs.2.25 (2019/20 - Rs.0.50) once it is approved at the Annual General Meeting.

CIC HOLDINGS PLC Annual Report 2020/2182
16 PROPERTY, PLANT & EQUIPMENT
A. Company
As at 31st March Land Buildings Plant & Machinery
Equipment Computers Furniture & Fittings
Motor Vehicles
Total 2021
Total 2020
Rs.'000 Rs.'000 Rs.'000 Rs.'000 Rs.'000 Rs.'000 Rs.'000 Rs.'000 Rs.'000
Freehold(a) Cost/Valuation
At the beginning of the year 864,603 1,050,322 177,870 642,464 157,161 44,174 16,362 2,952,956 2,930,729 Additions - 2,662 404 6,101 3,770 - - 12,937 62,957 Revaluation Surplus 231,486 - - - - - - 231,486 - Disposals - - - - - - (242) (242) (40,730)At the end of the year 1,096,089 1,052,984 178,274 648,565 160,931 44,174 16,120 3,197,137 2,952,956
(b) Depreciation/ImpairmentAt the beginning of the year - 287,263 99,628 386,457 128,486 33,131 16,362 951,327 799,480 Depreciation - 49,157 12,265 83,321 15,602 4,096 - 164,441 171,615 On disposals - - - - - - (242) (242) (19,768)At the end of the year - 336,420 111,893 469,778 144,088 37,227 16,120 1,115,526 951,327
LeaseholdCost/ValuationAt the beginning of the year - 94,164 - - - - - 94,164 94,164 At the end of the year - 94,164 - - - - - 94,164 94,164
Depreciation/ImpairmentAt the beginning of the year - 12,634 - - - - - 12,634 12,634 Amortisiation - 12,041 - - - - - 12,041 - At the end of the year - 24,675 - - - - - 24,675 12,634
Carrying value as at 31st March 2021
1,096,089 786,053 66,381 178,787 16,843 6,947 - 2,151,100
Carrying value as at 31st March 2020
864,603 844,589 78,242 256,007 28,675 11,043 - 2,083,159
i Carrying amount of property, plant and equipment is not pledged as securities for bank facilities obtained.
ii Property, plant & equipment includes right-of-use assets of Rs.69.49 Mn (2020- Rs.81.53 Mn) related to leased properties that do not meet the definition of the investment property.
NOTES TO THE FINANCIAL STATEMENTS

83TIDES OF CHANGE
B. Group
As at 31st March Land Buildings Plant & Machinery
Equipment Computers Furniture & Fittings
Motor Vehicles
Total 2021
Total 2020
Rs.'000 Rs.'000 Rs.'000 Rs.'000 Rs.'000 Rs.'000 Rs.'000 Rs.'000 Rs.'000
Freehold(a) Cost/Valuation
At the beginning of the year 3,395,835 5,646,482 4,992,891 2,241,510 366,001 339,462 536,172 17,518,353 18,062,336 Additions - 8,319 78,012 43,779 20,076 2,766 2,650 155,602 261,410 Revaluation surplus 894,971 - - - - - - 894,971 - On disposals (296,670) (85,079) (8,555) (8,991) (4,657) (2,377) (18,550) (424,879) (202,941)Transferred from capital work in
progress (Note 18) - 19,369 12,839 2,693 238 7,339 - 42,478 482,267 Transfers-Other - - - - - - - - (102,164)Transfers from leasehold - - - - - - - - 7,568 Transfer to asset held for sale - - - - - - - - (870,470)Impairment - - - - - - - - (119,618)Transferred to intangible assets - - - - (22,919) - - (22,919) - Write- off - - - - - - - - (35)At the end of the year 3,994,136 5,589,091 5,075,187 2,278,991 358,739 347,190 520,272 18,163,606 17,518,353
(b) Depreciation/ImpairmentAt the beginning of the year 8,700 1,331,207 2,316,631 1,268,688 291,156 169,017 450,294 5,835,693 5,263,863 Depreciation - 186,987 323,748 242,505 31,975 26,331 27,110 838,656 861,478 Impairment - - 5,390 325 - - - 5,715 (16,614)Transfers from leasehold - - - - - - - - 6,762 On disposals (8,700) (47,443) (7,476) (8,734) (3,968) (2,202) (15,682) (94,205) (177,632)Transfers-other - - - - - - - - (102,164)Transferred to intangible assets - - - - (5,550) - - (5,550) - At the end of the year - 1,470,751 2,638,293 1,502,784 313,613 193,146 461,722 6,580,309 5,835,693
Leasehold Cost/ValuationAt the beginning of the year 414,100 740,411 - - - - 24,599 1,179,110 1,186,678 Additions 69,510 5,733 - - - - - 75,243 - Transferred to freehold - - - - - - - - (7,568)On disposal of right-of-use asset - (14,533) - - - - - (14,533) - Adjustment - 1,034 - - - - - 1,034 - De recognition of right-of-use assets (69,780) - - - - - - (69,780) - Transferred from investment in sub
lease - 1,436 - - - - - 1,436 - At the end of the year 413,830 734,081 - - - - 24,599 1,172,510 1,179,110
Depreciation/ImpairmentAt the beginning of the year 62,636 414,721 - - - - 24,598 501,955 431,264 Depreciation 2,571 25,161 - - - - - 27,732 27,754 Amortisiation 8,273 33,618 - - - - - 41,891 49,699 Transferred to freehold - - - - - - - - (6,762)On disposal of right-of-use asset - (6,321) - - - - - (6,321) - De recognition of right-of-use assets (3,114) - - - - - - (3,114) - At the end of the year 70,366 467,179 - - - - 24,598 562,143 501,955 Carrying value as at 31st March 2021 4,337,600 4,385,242 2,436,894 776,207 45,126 154,044 58,551 12,193,664 Carrying value as at 31st March 2020 3,738,599 4,640,965 2,676,260 972,822 74,845 170,445 85,879 12,359,815
i Carrying amount of property, plant & equipment pledged as securities for bank facilities obtained amounted to Rs.1,191.62 Mn (2020 Rs.1,273.00 Mn).
ii During the year Group has not capitalised the borrowing cost.(2020 - Rs.12.48 Mn).
iii Unexpired lease period of land belonging to CIC Agri Businesses (Private) Limited is 70 years
iv Property, plant & equipment includes right-of-use assets of Rs.185.70 Mn (2020 - Rs.224.76 Mn ) related to leased properties that do not meet the definition of the investment property.

CIC HOLDINGS PLC Annual Report 2020/2184
16 PROPERTY, PLANT & EQUIPMENT (Contd.)
C. Carrying value of the property, plant & equipment
Company Group
As at 31st March 2021 2020 2021 2020 Rs.’000 Rs.’000 Rs.’000 Rs.’000
At Cost 985,522 1,174,522 7,589,161 8,286,825 At Valuation 1,096,089 826,950 3,994,136 3,395,835 On Lease 69,489 81,530 610,367 677,155 Total 2,151,100 2,083,159 12,193,664 12,359,815
D. The values of the lands if it had been carried under cost model
Company Group
As at 31st March 2021 2020 2021 2020 Rs.’000 Rs.’000 Rs.’000 Rs.’000
Land 133.00 133.00 878.52 918.83 Total 133.00 133.00 878.52 918.83
E. Value of land and ownership
Company Location Land Extent Number of buildings
Carrying Value
in Acres/Perches/Roods Rs. Mn
CIC Holdings PLC Kew Road, Colombo 02 1 rood and 30.25 perches 1 843.00 Lenagala Estate, Dedigamuwa 12 acres, 6 roods and 73.5 perches 20 253.09
CIC Agri Businesses (Private) Limited Mahiella, Kurunegala 2 acres, 3 roods and 31.25 perches 4 165.00 Wayamba Agro Fertilizer Company Limited Maho 16 acres and 30.8 perches 15 165.60 CIC Properties (Private) Limited Katuwahenawatta, Walpita, Waradala 50 acres, 1rood - 169.44 CISCO Speciality Packaging (Private) Limited Pellanwatta, Pannipitiya 4 acres,3 roods and 28.80 perches 14 230.30 CIC Vetcare (Private) Limited Madampalle Estate, Madampalle 15 acres - 52.50
Galla Estate, Ekala 3 roods and 1.00 perch 3 37.50 CIC Poultry Farms Limited Molahena Estate, Badalgama 25 acres and 29.95 perches 31 88.15
Iswetiya Elies, Horakandawila, Dunagaha
17 acres and 16.8 perches 17 165.80
Amunuwela Estate,Kuliyapitiya 48 acres 1 roods and 19.63 perches 25 172.05 CIC Bio Security Breeder Farms Limited Molahena Estate, Badalgama 28 acres and 39.49 perches 99.00 CIC Feeds (Private) Limited Galla Estate, Ekala 6 acres and 32.9 perches 17 276.00
Heeralugedara, Kotadeniyawa 18 acres and 2 roods 17 64.75 Madampalle Estate, Madampalle 25 acres 25 87.50 Nabirithankadawara, Welipennagahamulla, Pannala
50 acres and 32.5 perches 18 178.50
Colombo Industrial Agencies Limited Temple Lane, Ekala 3 acres, 2 roods, 7.62 perches 4 307.80 Link Natural Products (Private) Limited Malinda, Kapugoda 13 acres, 1 roods and 19.50 perches 39 538.68
Kapugoda, Giridara 39.1perches - 11.73 Dambukanda 20 acres, 5 roods and 64 perches 2 79.50 Parakaduwa 23 acres, 2 roods and 5.8 perches - 8.25
3,994.14
NOTES TO THE FINANCIAL STATEMENTS

85TIDES OF CHANGE
Last valuation of the lands has been as follows:
Company Date of Revaluation Significant unobservable inputs estimated price
Revalued Amount Rs. Mn
Sensitivity of fair value to unobservable inputs
CIC Holdings PLC 31st December 2020 Per perch Rs.12,000,000 843.00 Positively correlated sensitivity31st December 2020 Per perch Rs.25,000 - Rs.195,000 253.09 Positively correlated sensitivity
CIC Agri Businesses (Private) Limited 31st December 2020 Per perch Rs.350,000 165.00 Positively correlated sensitivityCIC Properties (Private) Limited 31st December 2020 Per acre Rs.1,000,000-Rs.3,500,000 169.44 Positively correlated sensitivityWayamba Agro Fertilizer Company Limited 31st December 2020 Per perch Rs.65,000 165.60 Positively correlated sensitivityCISCO Speciality Packaging (Private) Limited
31st December 2020 Per perch Rs.330,000 230.30 Positively correlated sensitivity
CIC Vetcare (Private) Limited 31st December 2020 Per perch Rs.300,000 - Rs.325,000 37.50 Positively correlated sensitivity31st December 2020 Per perch Rs.21,875 52.50 Positively correlated sensitivity
CIC Poultry Farms Limited 31st December 2020 Per perch Rs.21,875 - Rs.80,000 426.00 Positively correlated sensitivityCIC Bio Security Breeder Farms Limited 31st December 2020 Per perch Rs.21,875 99.00 Positively correlated sensitivityCIC Feeds (Private) Limited 31st December 2020 Per perch Rs.275,000 - Rs.325,000 276.00 Positively correlated sensitivity
31st December 2020 Per perch Rs.20,313 - Rs.48,000 330.75 Positively correlated sensitivityColombo Industrial Agencies Limited 31st December 2020 Per perch Rs.550,000 - Rs.575,000 307.80 Positively correlated sensitivityLink Natural Products (Private) Limited 31st December 2020 Per perch Rs.2,191 8.25 Positively correlated sensitivity
31st December 2020 Per perch Rs.20,267 - Rs.24,679 79.50 Positively correlated sensitivity31st December 2020 Per perch Rs.250,000 - Rs. 300,000 550.41 Positively correlated sensitivity
All above revaluations are based on market value and were carried out by Perera Sivaskantha & Company, an independent professional valuer.
The revalued figures were incorporated in these Financial Statements.
Market Comparable MethodThis method considers the selling price of a similar property within a reasonably recent period of time in determining the fair value of the property being revalued.
This involves evaluation of recent active market prices of similar assets, making appropriate adjustments for differences in size, nature, location, condition of specific property.
In this process, outlier transactions, indicative of particularly motivated buyers or sellers are too compensated for since the price may not adequately reflect the fair market value.
Considering the COVID- 19 impact, valuation is reported on the basis of “material valuation uncertainty”. Consequently, less certainty and a higher degree of caution are attached to valuation than would normally be the case.
The revalued figures were incorporated in these Financial Statements.
No change in fair value was identified between 31st December 2020 and 31st March 2021.
F. Depreciation has been provided on a straight-line basis at the following rates:
Company Buildings Plant & Machinery
Equipment Computers Furniture & Fittings
Motor Vehicles
Years Years Years Years Years Years
CIC Holdings PLC 20 8,15,30,40 4,5,8,10,15,30 3 5,10 5 Chemanex PLC 10-20 6 3 3 4 4 CISCO Speciality Packaging (Private) Limited 20 20,12,10,5 20,5,3 3 20,10 5 CIC Agri Businesses (Private) Limited
and Subsidiaries* 20,30 5,15 3,8 3,8 5,10 3,5
Colombo Industrial Agencies Limited 20 - - - - - CIC Feeds (Private) Limited and Subsidiaries 10,20,40 10,15,20 5,8,10,12.5 5 5,8 4,5 Link Natural Products (Private) Limited 40,25 10,15,20,40 10,8,5 3 10 4,8,10,20,25 CIC CropGuard (Private) Limited - - 5 5 10 5 CIC Lifesciences Limited - 8 4 4 4 - Cropwiz (Private) Limited 20-30 5-15 3-8 3-8 5-10 3-5 Unipower (Private) Limited 20 - 5 4 5 7
* Land development cost is depreciated over 30 years.

CIC HOLDINGS PLC Annual Report 2020/2186
G. Cost of fully depreciated property, plant & equipment still in use at the reporting date as follows:
Company Group
As at 31st March 2021 2020 2021 2020 Rs.’000 Rs.’000 Rs.’000 Rs.’000
Buildings 32,399 32,399 183,017 203,467 Plant & Machinery 38,647 35,869 473,302 423,980 Equipment 219,258 175,442 766,654 650,615 Computers 125,812 70,004 277,412 202,824 Furniture & Fittings 12,623 6,068 61,146 94,845 Motor Vehicles 16,115 16,358 367,892 352,941Leased hold land improvements - - 23,148 11,745 Total 444,854 336,140 2,152,571 1,940,417
H. Lands transferred to held for sale
Company Location Land extent in Acres/Perches/Roods
Date of revaluation Significant unobservarable inputs-Estimated price
Revalued amount
Rs.Mn
Sensitivity of fair value to unobserverable inputs
CIC Holdings PLC Sri Sasanajothi Mawatha, Rathmalana
4 acres,2 roods and 18.30 perches
30th September 2017 Per perch Rs.1,100,000
812.00 Positively correlated sensitivity
Pellanwatta, Piliyandala 1 acres,2 roods and 9.83 perches
30th September 2017 Per perch Rs.227,500-Rs.450,000
71.95 Positively correlated sensitivity
Immediately before the initial classification of the above two lands as “assets held for sale”, a revaluation was carried out by Messrs. Perera Sivaskantha & Company, as incorporated valuer. Details are given above.
I. Plant & equipment transferred to assets held for saleHatton National Bank PLC, issued a Parate Notice to Cropwiz (Private) Limited on 13 June 2019 and Auction Sale Gazette Notifications were issued on 09 August 2019 and 25 October 2019 (Under the Section 4 of the Recovery of Loans by Banks [Special Provisions] Act, No. 04 of 1990). However the auction did not take place on the said date. Based on this, charging depreciation was discontinued and on 31 March 2020 the total value of the assets under non - current assets were transferred to “assets held for sale” after determining the lower of its carrying amount and fair values less cost to sell.
The fair value of the property, plant & equipment as at 31st March 2020, was determined by Messrs. Perera Sivaskantha & Company, an accredited independent valuer. Fair value is determined by reference to market-based evidence. Valuations are based on active market prices, adjusted for any differences in the nature, location or condition of the specific property. Accordingly, an impairment loss was recognised in 2019/20 under discontinued operations amounting to Rs.96.90Mn.
NOTES TO THE FINANCIAL STATEMENTS

87TIDES OF CHANGE
17 INVESTMENT PROPERTY
Company Group
As at 31st March 2021 2020 2021 2020 Rs.’000 Rs.’000 Rs.’000 Rs.’000
Cost - - 2,400 2,400 Carrying value - - 2,400 2,400
A. Details of investment Property
Market Value Carrying value
As as 31st March Location Land extent Number of buildings
2021 2020 2021 2020Ownership Rs.’000 Rs.’000 Rs.’000 Rs.’000
CIC Agri Businesses (Private) Limited
Bogahapitiya Estate, Kegalle
2 roods, 12.0 perches - 4,200 4,200 2,400 2,400
B. During the year, no income was generated or expenses were incurred with relating to the above investment property.
C. Fair ValueThe fair value of the investment property determined by external valuer M/s. Perera Sivaskantha and Company, an incorporated external valuer.
Valuation Technique Significant unobservable inputs - estimated price
Inter-relationship between key unobservable inputs and fair value measurements
Market comparable method Per perch Rs.350,000 Positively correlated
18 CAPITAL WORK-IN-PROGRESS
Group
As at 31st March 2021 2020 Rs.’000 Rs.’000
At the beginning of the year 21,260 353,024 Expenditure incurred 44,028 150,503 Amount capitalised in property, plant & equipment (42,478) (482,267)Transferred to expenditure (194) - Assets written off (1,002) - At the end of the year 21,614 21,260
Capital work-in-progress is comprised of the expenditure incurred relating to building, machinery and furniture.
19 BIOLOGICAL ASSETS
19.1 Non-current biological assets
Group
As at 31st March 2021 2020 Rs.’000 Rs.’000
As at the beginning of the year 179,610 208,082 Additions 250,682 227,845 Re- classified as inventory - (484)Gain/(loss) from changes in fair value 3,645 (4,996)Disposals / amortisation (212,812) (250,837)At the end of the year Note (19.3) 221,125 179,610

CIC HOLDINGS PLC Annual Report 2020/2188
19.2 Measurement of Fair Values
a) Fair Value Hierarchy The fair value measurements of the standing biological assets have been categorised under Level 3 fair value hierarchy
b) Level 3 Fair Values The breakdown of the total gains/(losses) in respect of Level 3 fair values is shown below
Group
For the year ended 31st March 2021 2020 Rs.’000 Rs.’000
Gain included in other incomeChange in fair value (unrealised) 3,645 2,172 Loss included in other operating expenseChange in fair value (realised) - (7,168)
19.3 Biological Assets
As at 31st March Buffaloes Poultry Highland Crops
Teaks Total
Matured(Rs.'000) 14,166 82,511 14,780 224 111,681 Immatured(Rs.'000) 6,844 83,118 - 19,482 109,444 Total 21,010 165,629 14,780 19,706 221,125
19.4 Nature of Group’s Biological Assets The Group has biological assets comprising poultry breeder for producing Day Old Chicks (DOC), cattle for raw milk and teak for timber.
19.5 Non-Financial Measures of Biological Assets
Quantities Buffaloes Poultry Teaks At the end of the period No of animals No. of birds Cubic meters
2021 396 69,052 164,909 2020 379 75,844 164,909
Quantities Buffaloes Poultry Breeder Produced during the year No of animals No. of birds No. of Eggs
2021 9 5,059,080 18,889,915 2020 128 4,065,650 16,638,009
19.6 Valuation of biological assets CIC Agri Businesses (Private) Limited uses the following valuation techniques to measure their biological assets
Description Valuation Technique Valuation Input Discount Rate Inter-relationship between key unobservable inputs and fair value measurements
Cattle weight in relation to category
weight and rate published by NLDB
positively correlated with weight and negative correlation with rate
Teak Discounted cashflow Annual marginal increase of timber content (0.55-1.5cm per year for a tree of diameter girth over 10cm)
13% positively correlated with diameter and negative correlation with interest
CIC Feeds (Private) Limited uses cost model to value their non-current biological assets and following valuation techniques to measure their current biological assets.
NOTES TO THE FINANCIAL STATEMENTS

89TIDES OF CHANGE
19.7 Current biological assets
Group
As at 31st March 2021 2020 Rs.’000 Rs.’000
At the beginning of the year 194,380 174,082 Additions during the year 2,327,465 1,791,051 Expensed during the year (1,605,412) (1,455,768)Disposals (729,920) (305,447)Gain/(loss) from change in fair value 6,457 (9,538)
192,970 194,380
Part of these consumables biological assets represent growing birds (Broilers) which are usually processed and sold within 40 to 42 days. Age group of 1 to 28 days are valued at cost. Birds aging from 29 to 42 days are valued based on fair value which is determined based on the market value prevailing as at the reporting date. The valuation basis and the significant unobservable data used for the valuations are given below.
Type Valuation Techniques Significant Unobservable Data
Inter-relationship between key unobservable inputs and fair value measurements
Consumable biological assets
Growing birds (broilers)
The Company has identified six aging categories such as 1-7, 8-14, 15-21, 22-28, 29-35, 36-42 and depending on the aging, the standard weight per bird is identified. Average cost is calculated for each category according to the age by analysing the Feed, DOC, Drug Vaccine and other overhead usages. Fair Value is calculated by using the prevailing market price per bird and Cost to sell includes commission expenditure made for marketing representatives. However, the market prices for the first four age categories are not available and therefore those age categories are measured at cost. Further, a positive yield can be determined only for the last two categories that is 29-35 and 36-42 and therefore those age categories are measured at fair value.
Selling price (Rs.480/- - Rs.530/-)
Average bird weight (1.75kg - 2kg)
Increase when selling price increasesDecrease when selling price decreases
Increase when average weight increasesDecrease when average weight decreases
19.8 Sensitivity AnalysisSensitivity variation on selling price values as appearing in the Statement of Financial Position are sensitive to sales price changes with regard to the average price applied. Simulations made for livestock show that an increase or a decrease by 10% of the estimated future selling price has the following effect on the net present value of biological assets
Group -10% 10%As at 31st March 2021 2020
Rs.'000 Rs.'000
Biological assets 52,478 70,844 52,478 70,844
Sensitivity variation on average animal weight values as appearing in the statement of Financial Position are sensitive to average animal weight changes. Simulations made for livestock show that an increase or a decrease by 10kg of average animal weight has the following effect on the net present value of biological assets.
Group -10% 10%As at 31st March 2021 2020
Rs.'000 Rs.'000
Biological assets 55,108 67,637 55,108 67,637

CIC HOLDINGS PLC Annual Report 2020/2190
20 INTANGIBLE ASSETS
Company Group
As at 31st March 2021 2020 2021 2020 Rs.’000 Rs.’000 Rs.’000 Rs.’000
GoodwillGross amount - - 375,372 375,372 Less ; provision for impairment - - (139,610) (139,610)Net goodwill (Note 20.1) - - 235,762 235,762
Software cost capitalisedAt the beginning of the year 29,301 34,702 131,220 148,600 During the year addition 29,874 - 30,927 3,520 Re-classification - - 17,369 - Amortisation for the year (6,721) (5,401) (24,798) (20,900)Net software cost capitalised (Note 20.2) 52,454 29,301 154,718 131,220 Total 52,454 29,301 390,480 366,982
20.1 Aggregate carrying amounts of net goodwill allocated to each cash generating unit are as follows:
Group
As at 31st March 2021 2020 Rs. Mn Rs. Mn
Unipower (Private) Limited 208.08 208.08 Chemanex PLC 11.06 11.06 CIC Feeds (Private) Limited 16.62 16.62
235.76 235.76
The recoverable amounts of all cash generating units have been determined based on the fair value, less cost to sell or the value in use (VIU) calculation.
Impairment exists when the carrying value of an asset or cash generating unit exceeds its recoverable amount, which is the higher of its fair value less costs to sell and its value in use (VIU). The fair value less costs to sell calculation is based on available data from an active market, in an arm’s length transaction, of similar assets or observable market prices less incremental costs for disposing of the asset. The value in use calculation is based on a discounted cash flow model. The cash flows are derived from the budget for the next five years and do not include restructuring activities that the Group is not yet committed to or significant future investments that will enhance the asset’s performance of the cash generating unit being tested. The recoverable amount is most sensitive to the discount rate used for the discounted cash flow model as well as the expected future cash inflows and the growth rate used for extrapolation purposes.
The key assumptions used to determine the recoverable amount for the different cash generating units, are as follows;
Gross marginsThe basis used to determine the value assigned to the budgeted gross margins is the gross margins achieved in the year preceding the budgeted year adjusted for projected market conditions.
Discount ratesThe discount rate used is the risk free rate, adjusted by the addition of an appropriate risk premium.
InflationThe basis used to determine the value assigned to the budgeted cost inflation, is the inflation rate, based on projected economic conditions.
Volume growthVolume growth has been budgeted on a reasonable and realistic basis by taking into account the industry growth rates of one to four years immediately subsequent to the budgeted year. Cash flows beyond the five year period are extrapolated using 1% growth rate.
20.2 The Company/Group capitalised the ERP implementation cost as at the year-end. This will be depreciated over 10 years.
20.3 There has been no permanent impairment of software cost capitalised that requires provision.
NOTES TO THE FINANCIAL STATEMENTS

91TIDES OF CHANGE
21 DEFERRED TAX
Company Group
As at 31st March 2021 2020 2021 2020 Rs.’000 Rs.’000 Rs.’000 Rs.’000
At the beginning of the year 288,433 99,731 1,411,812 1,275,174Recognised in profit or loss 14,360 196,563 (62,342) 145,376 Recognised in other comprehensive income 31,551 (7,861) (15,613) (8,738)At the end of the year 334,344 288,433 1,333,857 1,411,812
Deferred Tax asset - - 58,697 20,111 Deferred Tax liabilities 334,344 288,433 1,392,554 1,431,923 Net liability 334,344 288,433 1,333,857 1,411,812
B Movement in Deferred Tax Balances
Company
2021
Net balances as at 01st April
Recognised in Profit or loss
Recognised in OCI
Balance at 31 March
Net Deferred tax assets
Deferred tax liabilities
Rs'000 Rs'000 Rs'000 Rs'000 Rs'000 Rs'000
Property, plant & equipment 242,233 (46,921) - 195,312 - 195,312 Revaluation reserves 204,846 - 26,293 231,139 - 231,139 Right-of-use assets 22,829 (6,151) - 16,678 - 16,678 Net investment in sub-lease 1,925 (1,925) - - - - Lease liability (26,302) 7,152 - (19,150) (19,150) - Accumulated tax losses (109,144) 109,144 - - - - Provision for obsolete and slow moving inventories - (4,787) - (4,787) (4,787) - Provision for impairment of trade receivables - (22,931) - (22,931) (22,931) - Other provisions - (22,738) - (22,738) (22,738) - Retirement benefit obligations (47,954) 3,517 5,258 (39,179) (39,179) - Net liabilities/(assets) 288,433 14,360 31,551 334,344 (108,785) 443,129
Company
2020
Net balances as at 01st April
Recognised in Profit or loss
Recognised in OCI
Balance at 31 March
Net Deferred tax assets
Deferred tax liabilities
Rs'000 Rs'000 Rs'000 Rs'000 Rs'000 Rs'000
Property, plant & equipment 243,323 (1,090) - 242,233 - 242,233 Revaluation reserves 204,846 - - 204,846 - 204,846 Right-of-use assets - 22,829 - 22,829 - 22,829 Net investment in sub-lease - 1,925 - 1,925 - 1,925 Lease liability - (26,302) - (26,302) (26,302) - Accumulated tax losses (298,214) 189,070 - (109,144) (109,144) - Retirement benefit obligations (50,224) 10,131 (7,861) (47,954) (47,954) - Net liabilities/(assets) 99,731 196,563 (7,861) 288,433 (183,400) 471,833

CIC HOLDINGS PLC Annual Report 2020/2192
21 DEFERRED TAX (CONTD)
Group
2021
Net balances as at 01st April
Recognised in profit or loss
Recognised in OCI
Balance at 31 March
Net Deferred tax assets
Deferred tax liabilities
Rs'000 Rs'000 Rs’000 Rs'000 Rs'000 Rs'000
Property, plant & equipment 1,510,874 (513,792) - 997,082 - 997,082 Revaluation reserves 685,882 - (16,875) 669,007 - 669,007 Intangible assets 13,737 (3,335) - 10,402 - 10,402 Right-of-use assets 7,011 (4,777) - 2,234 - 2,234 Net investment in sub-lease 533 (533) - - - - Lease liability (11,945) 6,372 - (5,573) (5,573) - Biological assets 47,233 (12,463) - 34,770 - 34,770 Provision for impairment of trade receivables (101,503) 20,370 - (81,133) (81,133) - Provision for obsolete and slow moving
inventories (22,290) (10,295) - (32,585) (32,585) -
Accumulated tax losses (514,877) 440,958 - (73,919) (73,919) - Other provisions (2,310) (21,916) - (24,226) (24,226) - Contract assets 7,496 (2,464) - 5,032 - 5,032 Contract liability (13,680) 4,567 - (9,113) (9,113) - Retirement benefit obligation (194,349) 34,966 1,262 (158,121) (158,121) - Net liabilities/(assets) 1,411,812 (62,342) (15,613) 1,333,857 (384,670) 1,718,527
Group
2020
Net balances as at 01st April
Recognised in profit or loss
Recognised in OCI
Balance at 31 March
Net Deferred tax assets
Deferred tax liabilities
Rs'000 Rs'000 Rs’000 Rs'000 Rs'000 Rs'000
Property, plant & equipment 1,385,682 125,192 - 1,510,874 - 1,510,874 Revaluation reserves 685,882 - - 685,882 - 685,882 Intangible assets 12,014 1,723 - 13,737 - 13,737 Right-of-use assets (12,870) 19,881 - 7,011 - 7,011 Net investment in sub-lease (6,616) 7,149 - 533 - 533 Lease liability 19,872 (31,817) - (11,945) (11,945) - Biological assets 56,291 (9,058) - 47,233 - 47,233 Provision for impairment of trade receivables (75,792) (25,711) - (101,503) (101,503) - Provision for obsolete and slow moving
inventories (26,014) 3,724 - (22,290) (22,290) -
Accumulated tax losses (578,547) 63,670 - (514,877) (514,877) - Other provisions (1,706) (604) - (2,310) (2,310) - Contract assets 6,073 1,423 - 7,496 - 7,496 Contract liability (12,116) (1,564) - (13,680) (13,680) - Retirement benefit obligation (176,979) (8,632) (8,738) (194,349) (194,349) - Net liabilities/(assets) 1,275,174 145,376 (8,738) 1,411,812 (860,954) 2,272,766
NOTES TO THE FINANCIAL STATEMENTS

93TIDES OF CHANGE
Deferred Tax Effect of Temporary Differences 2021 2020 Temporary Difference
Tax Effect Temporary Difference
Tax Effect
Company Rs.’000 Rs.’000 Rs.’000 Rs.’000
Property, plant & equipment 813,799 195,312 865,117 242,233 Revaluation reserves 963,082 231,139 731,591 204,846 Accumulated tax losses - - (389,801) (109,144)Retirement benefit obligations (163,249) (39,179) (171,266) (47,954)Right-of-use assets 69,489 16,678 81,530 22,829 Provision for obsolete and slow moving inventories (19,944) (4,787) - - Provision for impairment of trade receivables (95,545) (22,931) - - Other provisions (94,741) (22,738) - - Net investment in sub-lease - - 6,879 1,925 Lease liability (79,791) (19,150) (93,935) (26,302)Net liabilities 334,344 288,433
Deferred Tax Effect of Temporary Differences 2021 2020 Temporary Difference
Tax Effect Temporary Difference
Tax Effect
Group Rs.’000 Rs.’000 Rs.’000 Rs.’000
Property, plant & equipment 5,689,435 997,082 6,229,252 1,554,787 Revaluation reserves 3,217,734 669,007 2,395,143 641,035 Intangible assets 55,024 10,402 56,480 14,744 Biological assets 216,818 34,770 168,956 47,233 Other provision (103,007) (24,226) (8,251) (2,310)Right-of-use assets 9,312 2,234 25,040 7,011 Net investment in sub-lease - - 1,906 533 Lease liability (28,915) (5,573) (43,192) (12,023)Contract liability (50,632) (9,113) (48,858) (13,679)Contract assets 27,954 5,032 26,767 7,495 Provision for impairment of trade receivables (372,325) (81,133) (252,762) (70,745)Provision for obsolete and slow moving inventories (171,800) (32,585) (189,700) (53,046)Accumulated tax losses (410,654) (73,919) (1,838,842) (514,874)Retirement benefit obligations (769,585) (158,121) (701,286) (194,349)Net liabilities 1,333,857 1,411,812
D. Unrecognised Deferred Tax Assets
As at 31st March 2021 2020 Temporary Difference
Tax Effect Temporary Difference
Tax Effect
Group Rs.’000 Rs.’000 Rs.’000 Rs.’000
Accumulated tax losses 1,668,733 467,245 1,748,753 489,650
Deferred tax asset has not been recognised in respect of the Group’s brought forward tax losses as at 31st March 2021 amounting to Rs.1,668.73 Mn (2020- Rs.1,748.75 Mn) since it is not probable that the future taxable profit will be available against which the Group can use the benefit therein.
Unremitted income from subsidiaries and associates.The Group has determined that the undistributed profits of its subsidiaries or associate will not be distributed in the foreseeable future. The Group has an agreement with its associate that the profit of the associate will not be distributed until it obtains the consent of the Group. The Group does not anticipate giving such consent at the reporting date.

CIC HOLDINGS PLC Annual Report 2020/2194
22 INVESTMENT IN SUBSIDIARIES
2021 2020
As at 31st March Market Value
Holding No. of Shares
Cost No. of Shares
Cost
Company Rs. ‘000 % Rs.’000 Rs. 000
Quoted Chemanex PLC 610,538 50.55 7,939,373 136,683 7,939,373 136,683
610,538 7,939,373 136,683 7,939,373 136,683
Unquoted - SubsidiariesCrop Management Services (Private) Limited 100.00 780,000 202,144 780,000 202,144 CISCO Speciality Packaging (Private) Limited 50.00 5,525,005 55,250 5,525,005 55,250 CIC Agri Businesses (Private) Limited 67.68 10,720,001 263,135 8,040,000 62,800 Colombo Industrial Agencies Limited 83.06 830,598 9,130 830,598 9,130 CIC Feeds (Private) Limited 82.44 3,710,000 217,434 3,710,000 217,434 Link Natural Products (Private) Limited 70.21 5,570,858 512,487 5,570,858 512,487 CIC CropGuard (Private) Limited 100.00 500,000 5,000 500,000 5,000 CIC Lifesciences Limited 99.89 132,625,435 191,205 132,625,435 191,205 Unipower (Private) Limited 70.00 376,000 238,075 376,000 238,075 CIC Properties (Private) Limited 100.00 4,500,000 45,000 4,500,000 45,000 CIC Precision Agricultural Technologies (Private) Limited 60.00 840,000 8,400 840,000 8,400
1,883,943 1,683,608 Provision for impairment of subsidiaries (264,400) (227,400)Total 1,619,543 1,456,208
NOTES TO THE FINANCIAL STATEMENTS

95TIDES OF CHANGE
i) During the year, the Company has made an additional provision of Rs.37.0Mn against its investment in CIC Properties (Private) Limited. This has increased the total provision against the said investment to Rs.45.0 Mn.
Further, other investments were also tested for impairment and no provision was required. Moreover, based on the evaluation performed by the management, no additional impairment is required due to the effect of COVID -19.
ii) In 2018/19, the Company impaired its investment in CIC Agri Businesses (Private) Limited amounting to Rs.62.8Mn due to negative net assets position. Further, the Company has made a provision of Rs.8Mn and Rs.148.2Mn on the investment in CIC Properties (Private) Limited and Crop Management Services (Private) Limited due to reduction of net assets.
iii) In 2017/18, the Company has made a provision of Rs.8.4Mn on the investment of CIC Precision Agricultural Technologies (Private) Limited due to the re-assignment of promotion of latest agricultural technologies to the respective entities of CIC Agri Businesses Group.
iv) All subsidiaries of the Company are incorporated in Sri Lanka.
v) The company has neither contingent liabilities nor capital commitment in respect of subsidiaries.
vi) The main activities of the subsidiary companies are given in page 134.
C. Investment in Subsidiaries made during the yearDuring the year Company purchased 2,680,001 shares of CIC Agri Businesses (Private) Limited from Chemanex PLC, for a consideration of Rs.200.33Mn.
D. Inter Company Shareholdings
2021 2020
As at 31st March Investor Investee
% Holding No. of Shares
% Holding No. of Shares
Chemanex PLC CIC Agri Businesses (Private) Limited - - 16.92 2,680,001 CIC Feeds (Private) Limited 11.11 500,000 11.11 500,000
CIC Agri Businesses (Private) Limited Chemanex PLC 2.84 444,604 2.84 444,604 Crop Management Services (Private) Limited CIC Feeds (Private) Limited 6.44 290,100 6.44 290,100
E. Material Non Controlling Interest The Group has assessed each subsidiary that has non-controlling interest based on contributions made to the Group revenue, profit, total assets and net assets. Following table summarises the information relating to the subsidiary which has a material non-controlling interest.
CIC Agri Businesses (Private) Limited Group
As at 31st March 2021 2020 Rs.’000 Rs.’000
NCI percentage 32.3% 40.5%Non-current assets 2,039,636 2,505,505 Current assets 8,651,253 8,397,954 Non - current liabilities 589,327 774,945 Current liabilities 9,253,772 10,129,194 Profit after tax 751,143 190,021 Net cash flows generated from /(used in) in operating activities 3,156,129 (677,158)Net cash flows generated from investing activities 398,379 1,437 Net cash flows used in financing activities (225,409) (168,583)

CIC HOLDINGS PLC Annual Report 2020/2196
23 EQUITY ACCOUNTED INVESTEES
2021 2020
As at 31st March Holding No. of Shares
Cost No. of Shares
Cost
Company % Rs.’000 Rs.’000
Unquoted Akzo Nobel Paints Lanka (Private) Limited Ordinary Shares 49.37 2,340,000 23,400 2,340,000 23,400 Non-Voting Shares 100.00 1,260,000 12,600 1,260,000 12,600 Cropwiz (Private) Limited 40.00 - - 86,880 125,109 CIC Grains (Private) Limited 49.00 26,313,000 263,131 26,313,000 263,131 Total 299,131 424,240
Transferred to assets held for sale (Note 13.2) - (125,109) 299,131 299,131
Provision for impairment of equity accounted investees (263,131) (263,131)Total 36,000 36,000
2021 2020
As at 31st March Holding No. of Shares
Cost No. of Shares
Cost
Group % Rs.’000 Rs.’000
Unquoted Akzo Nobel Paints Lanka (Private) LimitedOrdinary Shares 49.37 2,340,000 23,400 2,340,000 23,400 Non-Voting Shares 100.00 1,260,000 12,600 1,260,000 12,600 Group share of net assets on deemed disposal - 280,922 - 280,922 Rainforest Ecolodge (Private) Limited. 20.89 9,950,868 99,510 9,950,868 99,510 Rahimafrooz CIC Agro Limited 49.00 212,928 32,573 212,928 32,573
449,005 449,005
Share of equity accounted investees retained earnings 704,423 520,121 Share of equity accounted investees other reserves 14,875 14,875 Share of losses absorbed -Rahimafrooz CIC Agro Limited (32,573) (32,573)Total 1,135,730 951,428
The Group’s interest in equity accounted investee relates to CIC Agri Businesses (Private) Limited’s 49% interest in equity shareholding of Rahimafrooz CIC Agro Limited, an entity established in 2011/12 in Bangladesh. In adopting SLFRS 11- Joint Arrangements, the Group was required to recognise its interest in a joint venture using the equity method in accordance with LKAS 28- Investment in Associates and Joint Ventures. When changing from proportionate consolidation to the equity method, the Group recognised its investment in the joint venture as at the beginning of the immediately preceding period. Such was measured at the aggregate of the carrying amounts of the assets and liabilities that the entity had previously proportionately consolidated. The opening balance of the investment determined is regarded as the deemed cost of the investment at initial recognition. As the total of proportionately consolidated assets and liabilities resulted in negative net assets, CIC Agri Businesses (Private) Limited assessed whether it has legal or constructive obligations in relation to the negative net assets. The Consolidated Financial Statements have disclosed the cumulative unrecognised share of losses of its joint ventures as at 31 March 2015 of Rs. 112Mn. and other required disclosures in these Financial Statements.
23.1 Except for Rahimafrooz CIC Agro Limited incorporated in Bangladesh, all the other equity accounted investees are incorporated in Sri Lanka.
NOTES TO THE FINANCIAL STATEMENTS

97TIDES OF CHANGE
23.2 Though the Group continues to hold 49% of Rahimafrooz CIC Agro Limited, management has decided to withdraw from the operations carried out by the investee. In having withdrawn from the joint venture, the group has been unable to obtain the information pertaining to the losses incurred by Rahimafrooz CIC Agro Limited as well as information pertaining to assets/ liabilities as at the reporting date and for the previous year, amounts relating to the year 2015 have been disclosed herein.
As at 31st March 2015 Rs.’000
Current assets 356,699 Non current assets 10,920 Current liabilities (473,943)Non current liabilities (124,089)Net assets (230,413)
23.3 The main activities of the equity accounted investees are given in page 134. Registered business place of Rainforest Ecolodge (Private) Limited is No 50, Nawam Mawatha, Colombo 02 and Akzo Nobel Paints Lanka (Private) Limited is located at Level 10, Maga one,200, Nawala Road, Narahenpita, Colombo 05.
23.4 The Group has neither contingent liabilities nor capital commitments in respect of equity accounted investees.
23.5 In 2019/20, Group disposed its investment in Commercial Insurance Brokers (Private) Limited for Rs.250Mn while generating a profit of Rs. 157.02Mn.
23.6 In 2018/19 Directors of CIC Holdings PLC and CIC Agri Businesses (Private) Limited decided to impair its investment in Cropwiz (private) Limited amounting to Rs.125.11Mn and Rs.78.19Mn due to the reduction of net assets.
23.7 CIC Grains (Private) Limited made losses which reduced its net assets to negative Rs.170.85Mn. Therefore in 2017/18 the Directors of CIC Holdings PLC and CIC Agri Businesses (Private) Limited decided to fully impair the investment made in the respective entities i.e. Rs. 263.13Mn and Rs. 273.87Mn respectively
23.8 Summarised financial information of equity accounted investees
As at 31st March 2021 2020 Rs.’000 Rs.’000
Revenue 5,558,808 5,703,030 Expenses (4,772,862) (5,086,510)Profit after tax 785,946 616,520
Non- current assets 648,116 677,878 Current assets 3,693,978 2,765,775 Total assets 4,342,094 3,443,653
Non- current liabilities 229,697 189,475 Current liabilities 2,222,540 1,666,439 Total liabilities 2,452,237 1,855,914
Net Assets 1,889,857 1,587,739

CIC HOLDINGS PLC Annual Report 2020/2198
23.9 The below table reconciles the carrying amount of the Group’s interest in Associate
As at 31st March 2021 2020 Rs.’000 Rs.’000
At the beginning of the year 951,428 1,025,795 Share of profit of equity accounted investees 466,488 390,013 Share of other comprehensive income (1,986) - Dividend received (280,200) (371,400)Disposals - (92,980)At the end of the year 1,135,730 951,428
24 EQUITY INVESTMENT AT FAIR VALUE THROUGH OCI The Company designated the investments shown below as equity investments at FVOCI because these equity investments represent
investments that the Company intends to hold for strategic purpose.
Company Group
As at 31st March 2021 2020 2021 2020 Rs.’000 Rs.’000 Rs.’000 Rs.’000
Carrying value at the beginning of the year 198,038 264,904 203,603 272,775 Additions - 2,548 4,763 2,676 Fair value gain/ (loss) 56,803 (69,414) 60,459 (71,848)Disposal - - (5,416) - Carrying value at the end of the year 254,841 198,038 263,409 203,603
2021 2020
As at 31st March No of shares Share Price Fair Value No of shares Share Price Fair Value Company (Rs.) Rs.’000 (Rs.) Rs.’000
QuotedJohn Keells Holdings PLC 1,716,100 148.50 198,038 1,716,100 115.40 276,415 Fair value gain/(loss) during the year 56,803 (78,377)
254,841 198,038
2021 2020
As at 31st March No of shares Share Price Fair Value No of shares Share Price Fair Value Group (Rs.) Rs.’000 (Rs.) Rs.’000
QuotedCommercial Bank of Ceylon PLCNon-Voting - - - 50,603 58.50 2,960 Voting - - - 24,254 60.10 1,457 Muller & Phipps (Ceylon) PLC 300 1 0 300 1 0 Chevron Lubricants Lanka PLC - - - 16,000 53.50 856 Dipped Products PLC - - - 2,500 57.00 142 John Keells Holdings PLC 1,772,800 148.50 263,259 1,716,100 115.40 198,038
263,259 203,453
UnquotedEquity Investments (Lanka) Limited 15,000 150 15,000 150
150 150 Total 263,409 203,603
The fair value of financial instruments traded in active market is based on quoted market prices as at the reporting date. The disclosures relating to fair value measurement are given in Note 2.4.3 to the Financial Statements.
NOTES TO THE FINANCIAL STATEMENTS

99TIDES OF CHANGE
25 INVENTORIES
Company Group
As at 31st March 2021 2020 2021 2020 Rs.’000 Rs.’000 Rs.’000 Rs.’000
Raw materials and consumables 457,935 522,106 3,531,367 3,076,324 Packing materials - - 245,273 199,041 Work-in-progress 94,431 52,165 362,885 344,845 Finished goods 1,682,634 1,714,765 2,974,471 3,078,287 Goods-in-transit 407,024 539,393 1,788,992 1,328,477
2,642,024 2,828,429 8,902,988 8,026,974 Provision for obsolete and slow moving inventories (Note 25.1) (300,405) (389,482) (605,829) (708,100)Total 2,341,619 2,438,947 8,297,159 7,318,874
Inventories are stated at cost or net realisable value, whichever is lower. The breakup of the carrying value of inventories is as follows:
Company Group
As at 31st March 2021 2020 2021 2020 Rs.’000 Rs.’000 Rs.’000 Rs.’000
At Cost 2,341,619 2,438,947 8,297,159 7,318,874 At Net Realisable Value - - - - Total 2,341,619 2,438,947 8,297,159 7,318,874
25.1 Provision for obsolete and slow moving inventories
Company Group
As at 31st March 2021 2020 2021 2020 Rs.’000 Rs.’000 Rs.’000 Rs.’000
At the beginning of the year 389,482 405,970 708,100 742,279 Provision/(reversal) made during the year 75,320 (6,429) 77,016 122,316 Written off during the year (164,397) (10,059) (179,287) (156,495)At the end of the year 300,405 389,482 605,829 708,100
25.2 The Group has obtained bank facilities on the negative pledge on inventories.
26 TRADE RECEIVABLES
Company Group
As at 31st March 2021 2020 2021 2020 Rs.’000 Rs.’000 Rs.’000 Rs.’000
Trade receivables from Group Companies (Note 26.1) 844 791 - - Other trade receivables 3,142,967 3,121,319 5,947,041 6,594,290 Bills receivable - - 80,784 58,869 Total 3,143,811 3,122,110 6,027,825 6,653,159
Less : Provision for impairment for trade receivables (Note 26.2) (508,309) (479,740) (1,192,759) (1,114,652)Total 2,635,502 2,642,370 4,835,066 5,538,507
* Bank facilities have been obtained on negative pledge on trade receivables
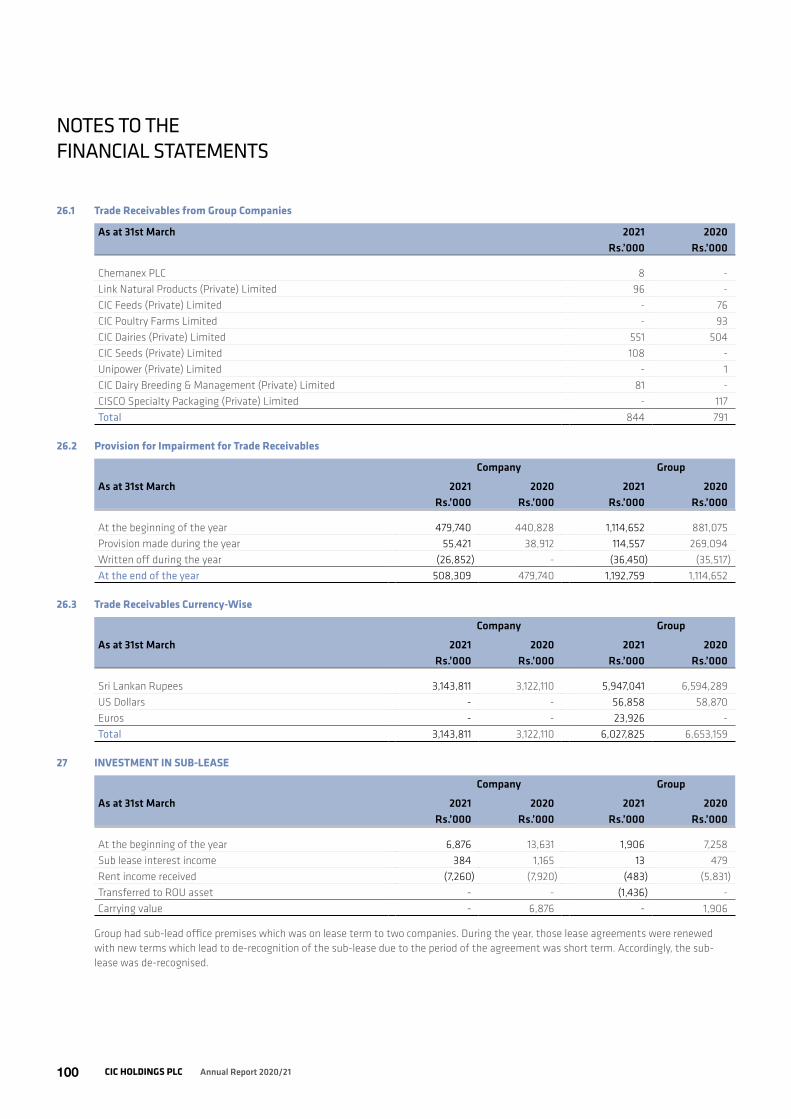
CIC HOLDINGS PLC Annual Report 2020/21100
26.1 Trade Receivables from Group Companies
As at 31st March 2021 2020 Rs.’000 Rs.’000
Chemanex PLC 8 - Link Natural Products (Private) Limited 96 - CIC Feeds (Private) Limited - 76 CIC Poultry Farms Limited - 93 CIC Dairies (Private) Limited 551 504 CIC Seeds (Private) Limited 108 - Unipower (Private) Limited - 1 CIC Dairy Breeding & Management (Private) Limited 81 - CISCO Specialty Packaging (Private) Limited - 117 Total 844 791
26.2 Provision for Impairment for Trade Receivables
Company Group
As at 31st March 2021 2020 2021 2020 Rs.’000 Rs.’000 Rs.’000 Rs.’000
At the beginning of the year 479,740 440,828 1,114,652 881,075 Provision made during the year 55,421 38,912 114,557 269,094 Written off during the year (26,852) - (36,450) (35,517)At the end of the year 508,309 479,740 1,192,759 1,114,652
26.3 Trade Receivables Currency-Wise
Company Group
As at 31st March 2021 2020 2021 2020 Rs.’000 Rs.’000 Rs.’000 Rs.’000
Sri Lankan Rupees 3,143,811 3,122,110 5,947,041 6,594,289 US Dollars - - 56,858 58,870 Euros - - 23,926 - Total 3,143,811 3,122,110 6,027,825 6,653,159
27 INVESTMENT IN SUB-LEASE
Company Group
As at 31st March 2021 2020 2021 2020 Rs.’000 Rs.’000 Rs.’000 Rs.’000
At the beginning of the year 6,876 13,631 1,906 7,258 Sub lease interest income 384 1,165 13 479 Rent income received (7,260) (7,920) (483) (5,831)Transferred to ROU asset - - (1,436) -Carrying value - 6,876 - 1,906
Group had sub-lead office premises which was on lease term to two companies. During the year, those lease agreements were renewed with new terms which lead to de-recognition of the sub-lease due to the period of the agreement was short term. Accordingly, the sub-lease was de-recognised.
NOTES TO THE FINANCIAL STATEMENTS

101TIDES OF CHANGE
28 OTHER RECEIVABLES
Company Group
As at 31st March 2021 2020 2021 2020 Rs.’000 Rs.’000 Rs.’000 Rs.’000
Non trade receivables from Group companies (Note 28.1) 66,153 98,551 - - Other non trade receivables (Net) 309,704 398,031 835,970 967,170 Short term loans granted to subsidiaries ( Note A) 55,000 55,000 - - Subsidy receivables - - 4,988,075 5,513,482 VAT receivables 54,548 22,095 94,105 63,611 Income tax receivables (Note 38) - 165,334 120,959 409,702 Loans to employees 7,231 7,535 47,907 48,366 Pre-paid staff cost 1,805 3,031 12,150 22,154
494,441 749,577 6,099,166 7,024,485 Less : Provision for impairment of other receivables (Note 28.2) (104,891) (109,306) (132,131) (130,800)Total 389,550 640,271 5,967,035 6,893,685
A. Short term loans granted to subsidiaries include Rs. 55Mn of CIC Properties (Private) Limited at an interest rate of 12.26% which is payable on demand.
28.1 Non Trade Receivable from Group Companies
Company
As at 31st March 2021 2020 Rs.’000 Rs.’000
Chemanex PLC 3,032 9,917 CISCO Speciality Packaging (Private) Limited - 1,185 CIC Agri Businesses (Private) Limited 1,066 5,525 CIC Feeds (Private) Limited 1,139 3,029 CIC CropGuard (Private) Limited - 2,182 Crop Management Services (Private) Ltd 380 252 CIC Agri Produce Export (Private) Limited 573 5,408 CIC Agri Produce Marketing (Private ) Limited 40 101 CIC Grains (Private) Limited 856 547 CIC Seeds(Private) Limited 177 1,729 CIC Dairies (Private) Limited 693 7,139 CIC Lifesciences Limited 1,185 1,088 CIC Dairy Breeding & Management (Private) Limited 1,711 729 CIC Properties (Private) Limited 55,563 55,291 Cropwiz (Private) Limited 80 80 Link Natural Products (Private) Limited 220 4,066 Unipower (Private) Limited 1,154 1,999
67,869 100,267 Less: Provision for impairment (1,716) (1,716)Total 66,153 98,551

CIC HOLDINGS PLC Annual Report 2020/21102
28.2 Provision for impairment of other receivables
Company Group
As at 31st March 2021 2020 2021 2020 Rs.’000 Rs.’000 Rs.’000 Rs.’000
At the beginning of the year 109,306 109,351 130,800 109,351 Provision/(reversal) made during the year (4,381) 488 1,365 21,982 Write-off during the year (34) (533) (34) (533)At the end of the year 104,891 109,306 132,131 130,800
29 EQUITY INVESTMENT AT FAIR VALUE THROUGH OCI
Company Group
As at 31st March 2021 2020 2021 2020 Rs.’000 Rs.’000 Rs.’000 Rs.’000
Carrying value at the beginning of the year 21,230 33,996 764,927 892,839 Additions 687 581 1,457,601 394,225 Fair value gain/(loss) 3,927 (13,347) 494,877 (349,069)Disposal - - (745,736) (173,068)Carrying value at the end of the year 25,844 21,230 1,971,669 764,927
2021 2020
As at 31st March No of shares
Share Price
Fair Value
No of shares
Share Price
Fair Value
Company Rs. Rs.’000 Rs. Rs.’000
QuotedCeylon Hospitals PLC 5,628 101.25 570 5,628 73.00 411 Renuka Agri Foods PLC 153,200 3.50 537 153,200 1.90 291 Hatton National Bank PLC - Voting 181,889 126.00 22,918 177,911 105.10 18,698 Hatton National Bank PLC - Non-Voting 18,719 97.20 1,819 18,242 100.30 1,830 Total 25,844 21,230
2021 2020
As at 31st March No of shares
Share Price
Fair Value
No of shares
Share Price
Fair Value
Group Rs. Rs.’000 Rs. Rs.’000
QuotedCeylon Hospitals PLC 5,628 101.25 570 5,628 73.00 411 Renuka Agri Foods PLC 153,200 3.50 537 153,200 1.90 291 Hatton National Bank PLC- Voting 1,443,556 126.00 181,888 1,411,980 105.10 148,399 Hatton National Bank PLC - Non-Voting 18,719 97.20 1,819 18,242 100.30 1,830 John Keells Holdings PLC 11,417,835 148.50 1,695,549 5,250,569 115.40 605,916 National Development Bank PLC - - - 106,977 66.20 7,081 Lanka Orix Leasing Company PLC 312,692 292.00 91,306 11,000 90.80 999 Total 1,971,669 764,927
All short term fair value through OCI financial assets are designated as level 1 in the fair value hierarchy as the mentioned investments are all quoted and actively traded in the Colombo Stock Exchange. There have been no transfers between level 1 and level 2 during the year.
NOTES TO THE FINANCIAL STATEMENTS

103TIDES OF CHANGE
30 CASH AND CASH EQUIVALENTS
30.1 Favourable cash and cash equivalents
Company Group
As at 31st March 2021 2020 2021 2020 Rs.’000 Rs.’000 Rs.’000 Rs.’000
Cash and bank balances 237,499 90,375 1,192,112 1,097,514 Short term deposits - 479,544 163,000 1,010,145
237,499 569,919 1,355,112 2,107,659
Cash and cash equivalents classified as assets held for sale - - 2,588 3,230 Cash and cash equivalents classified as assets
held for distribution - - 30,844 27,734 Cash in hand and at bank for the purpose of
cash flow statement 237,499 569,919 1,388,544 2,138,623
30.2 Unfavourable cash and cash equivalents
Company Group
As at 31st March 2021 2020 2021 2020 Rs.’000 Rs.’000 Rs.’000 Rs.’000
Bank overdrafts (2,714) (65,244) (488,854) (896,318)Short term bank loans (3,517,923) (4,808,754) (8,740,423) (14,917,148)
(3,520,637) (4,873,998) (9,229,277) (15,813,466)Cash and cash equivalents classified as assets held for sale - - (136,512) (117,730)Interest bearing short-term borrowings
for the purpose of cash flow statement (3,520,637) (4,873,998) (9,365,789) (15,931,196)Cash and cash equivalents for the purpose of
cash flow statements (3,283,138) (4,304,079) (7,977,245) (13,792,573)

CIC HOLDINGS PLC Annual Report 2020/21104
31 STATED CAPITAL
Company
As at 31st March 2021 2020 No.of shares Rs. No.of shares Rs.
Ordinary SharesAs at the beginning of the year 72,900,000 789,750,000 72,900,000 789,750,000 As at the end of the year 291,600,000 789,750,000 72,900,000 789,750,000
Non-Voting (Class X ) SharesAs at the beginning of the year 21,870,000 218,700,000 21,870,000 218,700,000 As at the end of the year 87,480,000 218,700,000 21,870,000 218,700,000 Total 379,080,000 1,008,450,000 94,770,000 1,008,450,000
The holders of Ordinary shares ( Voting) are entitled to receive dividend as declared from time to time and are entitled to one vote per share at meetings of the Company
On 05th January 2021, a special resolution stating sub-division of shares has been duly passed by the shareholders unanimously at the Extra Ordinary General Meeting of the Company held on the said date. Accordingly, number of shares of the Company, after the subdivision is as follows:
Ordinary Voting shares
Non-Voting (Class-X) Shares
Total Shares
No.of shares
No of shares prior to the sub-division 72,900,000 21,870,000 94,770,000 No of shares after the sub-division 291,600,000 87,480,000 379,080,000
32 CAPITAL RESERVES
Company Group
As at 31st March 2021 2020 2021 2020 Rs.’000 Rs.’000 Rs.’000 Rs.’000
At the beginning of the year 1,477,524 1,477,524 2,360,463 2,360,463 Surplus on revaluation 231,486 - 717,260 - Realisation of capital reserve on account of disposal of assets (128,520) - (249,194) - Deferred tax on revaluation of land (55,557) - (147,527) - Deferred tax on tax rate change 29,264 - 106,931 - Adjustment due to change in holding - - 30,593 - Total 1,554,197 1,477,524 2,818,526 2,360,463
Capital reserves consist of revaluation reserves and reserves on scrip issue.
Revaluation reserves relates to revaluation of lands and represents the increase in the fair value of the lands.
Reserves on scrip issue is originated from post-acquisition scrip issues made by the subsidiaries.
NOTES TO THE FINANCIAL STATEMENTS
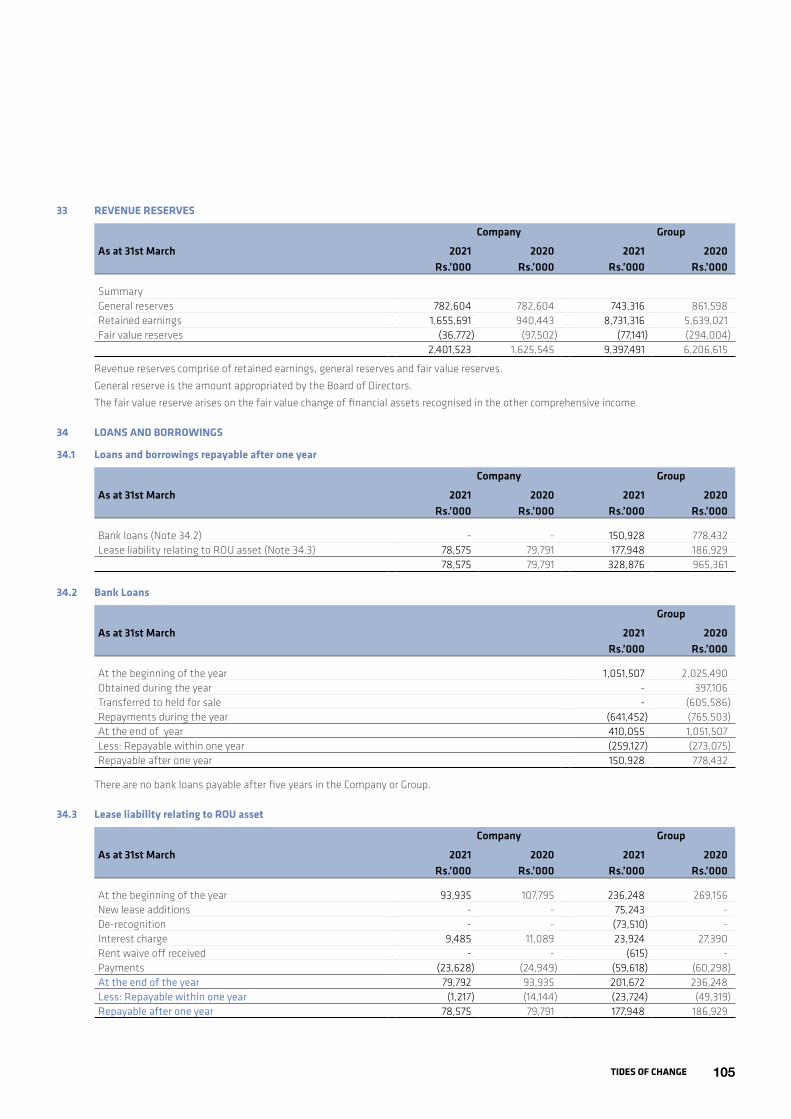
105TIDES OF CHANGE
33 REVENUE RESERVES
Company Group
As at 31st March 2021 2020 2021 2020 Rs.’000 Rs.’000 Rs.’000 Rs.’000
SummaryGeneral reserves 782,604 782,604 743,316 861,598 Retained earnings 1,655,691 940,443 8,731,316 5,639,021 Fair value reserves (36,772) (97,502) (77,141) (294,004)
2,401,523 1,625,545 9,397,491 6,206,615
Revenue reserves comprise of retained earnings, general reserves and fair value reserves.
General reserve is the amount appropriated by the Board of Directors.
The fair value reserve arises on the fair value change of financial assets recognised in the other comprehensive income.
34 LOANS AND BORROWINGS
34.1 Loans and borrowings repayable after one year
Company Group
As at 31st March 2021 2020 2021 2020 Rs.’000 Rs.’000 Rs.’000 Rs.’000
Bank loans (Note 34.2) - - 150,928 778,432 Lease liability relating to ROU asset (Note 34.3) 78,575 79,791 177,948 186,929
78,575 79,791 328,876 965,361
34.2 Bank Loans
Group
As at 31st March 2021 2020 Rs.’000 Rs.’000
At the beginning of the year 1,051,507 2,025,490 Obtained during the year - 397,106 Transferred to held for sale - (605,586)Repayments during the year (641,452) (765,503)At the end of year 410,055 1,051,507 Less: Repayable within one year (259,127) (273,075)Repayable after one year 150,928 778,432
There are no bank loans payable after five years in the Company or Group.
34.3 Lease liability relating to ROU asset
Company Group
As at 31st March 2021 2020 2021 2020 Rs.’000 Rs.’000 Rs.’000 Rs.’000
At the beginning of the year 93,935 107,795 236,248 269,156 New lease additions - - 75,243 - De-recognition - - (73,510) - Interest charge 9,485 11,089 23,924 27,390 Rent waive off received - - (615) -Payments (23,628) (24,949) (59,618) (60,298)At the end of the year 79,792 93,935 201,672 236,248 Less: Repayable within one year (1,217) (14,144) (23,724) (49,319)Repayable after one year 78,575 79,791 177,948 186,929

CIC HOLDINGS PLC Annual Report 2020/21106
34.4 Loans and borrowings repayable within one year from the year end
Company Group
As at 31st March 2021 2020 2021 2020 Rs.’000 Rs.’000 Rs.’000 Rs.’000
Bank loans - - 259,127 273,075 Lease liability relating to ROU asset 1,217 14,144 23,724 49,319 Bank overdrafts 2,714 65,244 488,854 896,318 Short term loans 3,517,923 4,808,754 8,740,423 14,917,148Total 3,521,854 4,888,142 9,512,128 16,135,860
34.5 Analysis of loans and borrowings payable after one year
Company Lender Interest Rate 2021 2020 SecurityRs.Mn Rs. Mn
CIC Dairies (Private) Limited DFCC Bank AWPLR+0.75% - 16.67 Seylan Bank AWPLR+2%p.a. 115.5 162.50
CISCO Speciality Packaging (Private) Limited
Commercial Bank AWPLR 20.43 45.42 Plant Machinery
Link Natural Products (Private) Limited
State Bank of India AWPLR+0.5% 15.00 553.84 Mortgaged Land & Building
150.93 778.43
NOTES TO THE FINANCIAL STATEMENTS

107TIDES OF CHANGE
35 RETIREMENT BENEFIT OBLIGATIONS
Company Group
As at 31st March 2021 2020 2021 2020 Rs.’000 Rs.’000 Rs.’000 Rs.’000
Present value of the gratuityAt the beginning of the year 171,266 179,370 701,286 646,305 Current service cost 18,163 17,616 63,720 59,812 Benefits paid by the plan (22,253) (74,422) (71,089) (110,028)Interest cost 17,982 20,628 71,863 73,730 Actuarial (gains)/ losses (21,909) 28,074 3,805 31,467 As at the end of the year 163,249 171,266 769,585 701,286
A Retirement benefit cost is recognised in the following line items in the Statements of Profit or Loss and Other Comprehensive Income
Company Group
As at 31st March 2021 2020 2021 2020 Rs.’000 Rs.’000 Rs.’000 Rs.’000
Cost of Sales 560 525 24,581 23,598 Distribution expenses 17,752 18,634 33,016 30,992 Administrative expenses 17,833 19,085 77,986 78,952
36,145 38,244 135,583 133,542
Other comprehensive income (21,909) 28,074 3,805 31,467 Total 14,236 66,318 139,388 165,009
The gratuity liability of the Company, and the Group is based on the actuarial valuation carried out by Actuarial and Management Consultants (Private) Limited, a firm of professional acturies. The liability is not externally funded and it is a non-contributory defined benefit plan.
B LKAS 19 requires the use of actuarial techniques to make a reliable estimate of the amount of retirement benefits that employees have earned in return for their service in the current and prior periods and discount that benefit using projected unit credit method in order to determine the present value of the retirement benefit obligation and the current service cost. This requires an entity to determine how much benefit is attributable to the current and prior periods and to make estimates about demographic variables and financial variables that will influence the cost of the benefit. The following key assumptions were made in arriving at the above figure.
Rate of discount 8% (2020 -10.5%)
Salary increase 7% (2020- 10%)
Retirement age Management staff 55 years
Assumptions regarding future mortality are based on a 67/70 mortality table, issued by Institute of Actuaries, London.
The demographic assumptions underlying the valuation with respect to retirement age, early withdrawals from the services and retirement on medical grounds.
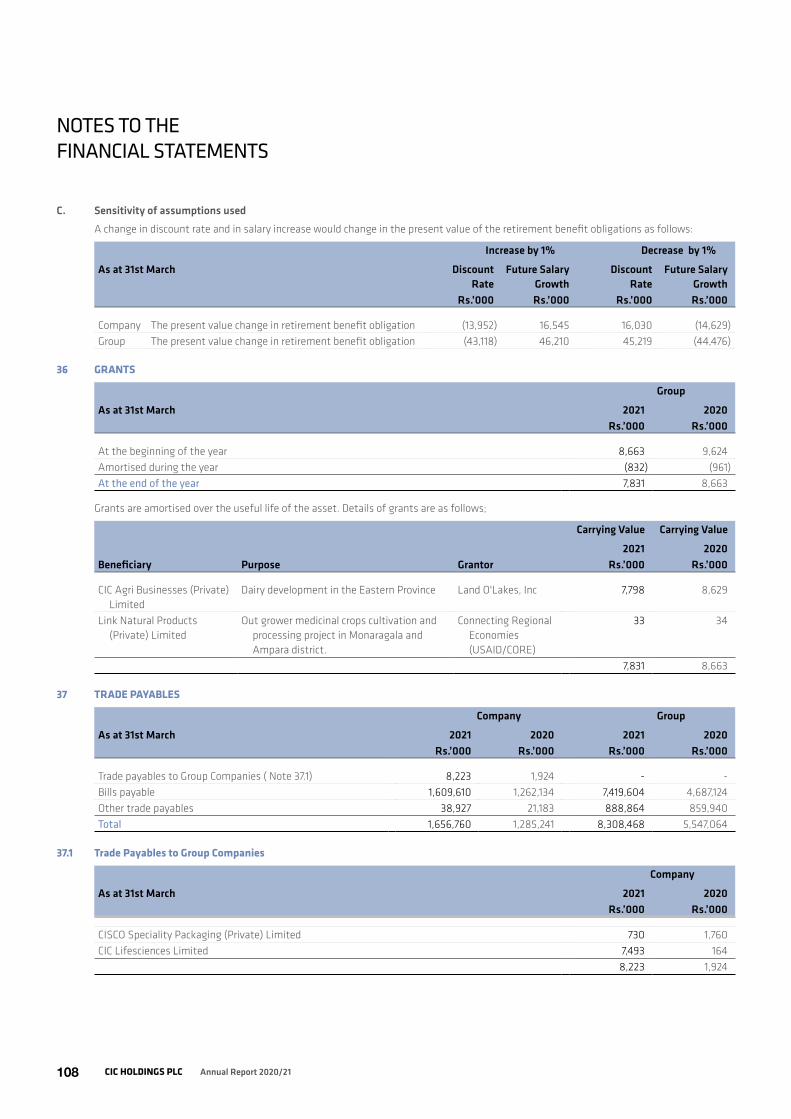
CIC HOLDINGS PLC Annual Report 2020/21108
C. Sensitivity of assumptions usedA change in discount rate and in salary increase would change in the present value of the retirement benefit obligations as follows:
Increase by 1% Decrease by 1%
As at 31st March Discount Rate
Future Salary Growth
Discount Rate
Future Salary Growth
Rs.’000 Rs.’000 Rs.’000 Rs.’000
Company The present value change in retirement benefit obligation (13,952) 16,545 16,030 (14,629)Group The present value change in retirement benefit obligation (43,118) 46,210 45,219 (44,476)
36 GRANTS
Group
As at 31st March 2021 2020 Rs.’000 Rs.’000
At the beginning of the year 8,663 9,624 Amortised during the year (832) (961)At the end of the year 7,831 8,663
Grants are amortised over the useful life of the asset. Details of grants are as follows;
Carrying Value Carrying Value
2021 2020Beneficiary Purpose Grantor Rs.’000 Rs.’000
CIC Agri Businesses (Private) Limited
Dairy development in the Eastern Province Land O'Lakes, Inc 7,798 8,629
Link Natural Products (Private) Limited
Out grower medicinal crops cultivation and processing project in Monaragala and Ampara district.
Connecting Regional Economies (USAID/CORE)
33 34
7,831 8,663
37 TRADE PAYABLES
Company Group
As at 31st March 2021 2020 2021 2020 Rs.’000 Rs.’000 Rs.’000 Rs.’000
Trade payables to Group Companies ( Note 37.1) 8,223 1,924 - - Bills payable 1,609,610 1,262,134 7,419,604 4,687,124 Other trade payables 38,927 21,183 888,864 859,940 Total 1,656,760 1,285,241 8,308,468 5,547,064
37.1 Trade Payables to Group Companies
Company
As at 31st March 2021 2020 Rs.’000 Rs.’000
CISCO Speciality Packaging (Private) Limited 730 1,760 CIC Lifesciences Limited 7,493 164
8,223 1,924
NOTES TO THE FINANCIAL STATEMENTS

109TIDES OF CHANGE
37.2 Currency-wise Trade Payable
Company Group
As at 31st March 2021 2020 2021 2020 Rs.’000 Rs.’000 Rs.’000 Rs.’000
US Dollars 1,180,122 747,351 6,960,614 4,191,349 Euros 93,346 87,085 200,334 147,114 Sterling Pounds 199 1,517 1,210 4,074 Singapore Dollars 28,960 14,601 40,862 14,601 Swiss Franc 365 27 365 27 Sri Lankan Rupees 353,768 434,660 1,105,083 1,189,899
1,656,760 1,285,241 8,308,468 5,547,064
38 INCOME TAX PAYABLE/ (RECEIVABLE)
Company Group
As at 31st March 2021 2020 2021 2020 Rs.’000 Rs.’000 Rs.’000 Rs.’000
As at the beginning of the year (165,334) (188,401) (306,522) (386,800)Provision made during the year - continuing operations 210,484 - 864,390 245,804 - discontinued operations - - 153 111 Under provisions in respect of previous years - - 1,789 15,501 Irrecoverable ESC written off 82,649 65,175 171,351 128,916 Tax on dividends received from associates - - - (16,296)Payments made during the year (1,892) (42,108) (462,919) (293,647)Income tax on other comprehensive income - - 69,109 - Disposal/liquidation of subsidiary - - - (111)As at the end of the year 125,907 (165,334) 337,351 (306,522)
Income tax payable 125,907 - 458,310 103,180 Income tax receivable - (165,334) (120,959) (409,702)Total 125,907 (165,334) 337,351 (306,522)

CIC HOLDINGS PLC Annual Report 2020/21110
39 CAPITAL COMMITMENTSThere were no material capital commitments, which have been approved or contracted for as at the reporting date.
40 CONTINGENT LIABILITIESIn 2016/17 the Group has received a claim of USD 668,154 on the alleged premise that a product supplied did not confirm to technical specification. The Group having sought legal advice has refused the claim and no provision for any related liability has been made in these Financial Statements.
CIC Feeds (Private) Limited provided Corporate Guarantee of Rs.600 Mn to Bank of Ceylon on behalf of its subsidiary CIC Poultry Farms Limited.
There are no other material contingent liabilities as at the reporting date, which require adjustment and / or disclosure in the Financial Statements.
41 EVENTS AFTER THE REPORTING DATE
Final dividend declarationThe Board of Directors has recommended a final dividend of Rs. 1.25 per share amounting to Rs.473.85 Mn on the issued capital of both Ordinary and Non-Voting (Class X) shares which is payable on 22nd July 2021 if approved by the Shareholders at the Annual General Meeting.
As required by section 56 of the Companies Act No.07 of 2007, the Board of Directors of the Company satisfied the solvency test in accordance with section 57, prior to declaring the final dividend.
Change in government policy on importation of chemical fertilizersIn addition to the above, further to gazette no. 2226/48 published on 6th May 2021, the importation of chemical fertilizers including mixtures & agrochemicals have been banned forthwith with exceptions to a limited number of products allowed under special license. The gazette has been published subsequent to the policy direction of the government of Sri Lanka to move towards the use of organic fertilizer & biopesticides in agricultural activities. Agrochemicals & fertilizers are falling under the Crop Solutions Segment of the Group. The Group is presently in the process of strengthening its organic fertilizer & biopesticides supply chains, with a view to meet the demand in alignment with the government policy. The Group has identified opportunities available in connection with the government policy direction; and with its experience in the trade, is confident that the business would overcome the challenges posed. Clarifications in relation to certain aspects connected to the implementation of the policy are forthcoming, and the Group is working to realign the strategies accordingly. Due to lack of clarity in practical implementation of the policy direction at present, it would be premature to make an estimate of any potential financial implication arising from the said matter.
Other than the above, no other events have taken place which require adjustments to or disclosure in the Financial Statements
NOTES TO THE FINANCIAL STATEMENTS

111TIDES OF CHANGE
42 LEASES See accounting policy in Note 3.9.
42.1 Leases as lessee (SLFRS 16)Group has entered in to lease agreements with several parties to use their lands and buildings. A subsidiary has rented out its leased premises to outsiders for a shorter period.
Lessee Location Nature Period
CIC Agri Businesses (Private) Limited Welimada Office Premises 01/11/2020 -31/10/2023CIC Agri Businesses (Private) Limited Rathnapura Office Premises 01/04/2017 -31/03/2022CIC Agri Businesses (Private) Limited Kandy Office Premises 01/07/2020 -30/06/2025CIC Agri Businesses (Private) Limited Midigama Office Premises 01/07/2019 -30/06/2024CIC Agri Produce Marketing (Private) Limited Pelwehera Land (100 acres) 02/07/2008 - 02/07/2038CIC Seeds (Private) Limited Hingurakgoda Land/Farm 8/17/1998 - 8/16/2048CIC Seeds (Private) Limited Pelwehera Land/Farm 8/31/2001 - 8/30/2051CIC Seeds (Private) Limited Talawa Land/Farm 11/13/2002 - 11/12/2032CIC Seeds (Private) Limited Jawatta Sales Outlet 5/1/2017 - 4/30/2021CIC Seeds (Private) Limited Central Hos. P Sales Outlet 06/01/2020 - 05/31/2021CIC Seeds (Private) Limited NCC Sales Outlet 7/1/2017 - 6/30/2022CIC Seeds (Private) Limited Orion city Sales Outlet 2/1/2018 - 1/31/2021CIC Seeds (Private) Limited Ex way Side A Sales Outlet 4/1/2017 - 3/31/2022CIC Seeds (Private) Limited Ex way Side B Sales Outlet 4/1/2017 - 3/31/2022CIC Seeds (Private) Limited WTC Sales Outlet 5/15/2018 - 5/14/2021CIC Dairies (Private) Limited Dambulla Factory Land 9/9/2011 - 8/9/2041CIC Dairy Breeding & Management (Private) Limited
Muthuwella & Siddhapura Land - Farms 6/11/2008 - 5/11/2038
Chemanex PLC Galle Face Court -2 Office Premises 01/01/2019 - 12/31/2022Link Natural Products (Private) Limited Palugama Agricultural Land 13/09/2017 - 12/09/2022Link Natural Products (Private) Limited Palugama Agricultural Land 17/05/2019 - 16/05/2024Link Natural Products (Private) Limited Nallathanniya - Sripada Promotional Activities - Sripada
Relief Zone Land31/12/2018- 31/12/2021
Link Natural Products (Private) Limited Nallathanniya - Sripada Promotional Activities - Sripada Relief Zone Land
31/12/2018 - 31/12/2021
Link Natural Products (Private) Limited Nallathanniya - Sripada Promotional Activities - Sripada Relief Zone Land
31/12/2018 - 31/12/2021
Link Natural Products (Private) Limited Jaffna Agricultural Land 31/12/2018 - 31/12/2021Link Natural Products (Private) Limited Jaffna Agricultural Land 01/08/2017 - 31/07/2022Link Natural Products (Private) Limited Nallathanniya - Sripada Promotional Activities - Sripada
Relief Zone Building31/12/2016 - 31/12/2021
Link Natural Products (Private) Limited Nallathanniya - Sripada Promotional Activities - Sripada Relief Zone Building
01/10/2017 - 30/09/2024
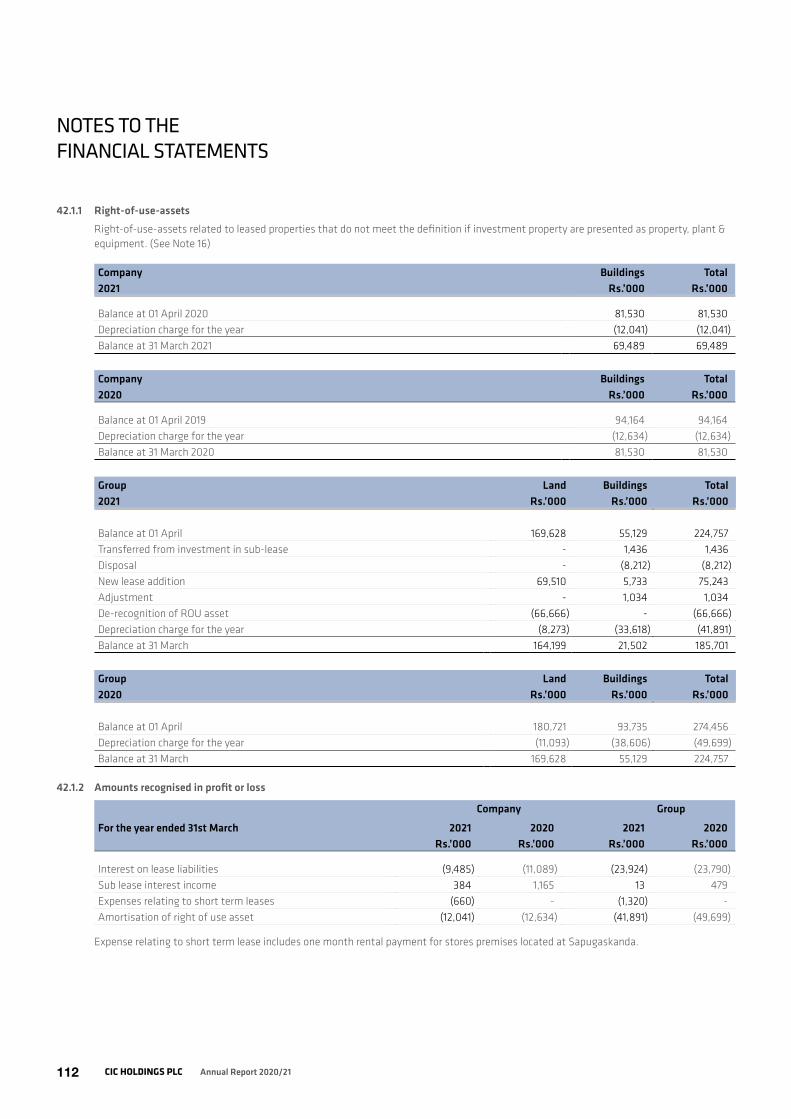
CIC HOLDINGS PLC Annual Report 2020/21112
42.1.1 Right-of-use-assets Right-of-use-assets related to leased properties that do not meet the definition if investment property are presented as property, plant & equipment. (See Note 16)
Company Buildings Total2021 Rs.’000 Rs.’000
Balance at 01 April 2020 81,530 81,530 Depreciation charge for the year (12,041) (12,041)Balance at 31 March 2021 69,489 69,489
Company Buildings Total2020 Rs.’000 Rs.’000
Balance at 01 April 2019 94,164 94,164 Depreciation charge for the year (12,634) (12,634)Balance at 31 March 2020 81,530 81,530
Group Land Buildings Total2021 Rs.’000 Rs.’000 Rs.’000
Balance at 01 April 169,628 55,129 224,757 Transferred from investment in sub-lease - 1,436 1,436 Disposal - (8,212) (8,212)New lease addition 69,510 5,733 75,243 Adjustment - 1,034 1,034 De-recognition of ROU asset (66,666) - (66,666)Depreciation charge for the year (8,273) (33,618) (41,891)Balance at 31 March 164,199 21,502 185,701
Group Land Buildings Total2020 Rs.’000 Rs.’000 Rs.’000
Balance at 01 April 180,721 93,735 274,456 Depreciation charge for the year (11,093) (38,606) (49,699)Balance at 31 March 169,628 55,129 224,757
42.1.2 Amounts recognised in profit or loss
Company Group
For the year ended 31st March 2021 2020 2021 2020 Rs.’000 Rs.’000 Rs.’000 Rs.’000
Interest on lease liabilities (9,485) (11,089) (23,924) (23,790)Sub lease interest income 384 1,165 13 479 Expenses relating to short term leases (660) - (1,320) - Amortisation of right of use asset (12,041) (12,634) (41,891) (49,699)
Expense relating to short term lease includes one month rental payment for stores premises located at Sapugaskanda.
NOTES TO THE FINANCIAL STATEMENTS

113TIDES OF CHANGE
42.1.3 Amounts recognised in Statement of Cash Flow
Company Group
For the year ended 31st March 2021 2020 2021 2020 Rs.’000 Rs.’000 Rs.’000 Rs.’000
Payment of lease rentals (23,628) (24,949) (59,618) (60,298)Expenses relating to short term leases (660) - (1,320) -
42.1.4 Extension options Some property leases contain extension options exercisable by the Group before the end of the non-cancellable contract period. Where practicable, the Group seeks to include extension options in new leases to provide operational flexibility. The Group assesses at lease commencement date whether it is reasonably certain to exercise the extension options. The Group reassess whether it is reasonably certain to exercise the options if there is a significant event or significant changes in circumstances within the control.
42.1.5 Maturity analysis - Contractual undiscounted cash flows
Company Group Rs.’000 Rs.’000
Less than one year 9,860 35,000 Later than one year and not later than five years 43,723 103,758 More than five years 98,194 390,310 Total undiscounted lease liability 151,777 529,068
42.2 Leases as lessorThe Group leases out its leased properties. All leases are classified as operating leases from a lessor perspective with the exception of a sub-lease, which the Group has classified as a finance sub-lease.
42.2.1 LeaseDuring 2020, the Group has sub-leased a building that has been presented as part of right-of-use asset-property, plant & equipment. In mid 2021, Group has classified these leases as operating leases, as they do not transfer substantially all of the risks and rewards incidental to the ownership of the assets and the lease period is also for a shorter term.
During 2021, the Group recognised interest income on lease receivable of Rs.0.01Mn (2020-Rs.0.48Mn).
Rental income recognised by the Group during 2021 was Rs.5.06Mn
Un discounted lease payments to be received within less than five months after the year end is Rs.2.15Mn
43 COMPARATIVE INFORMATIONFollowing comparative figures have been reclassified to conform with current year presentation.
43.1 Reclassification of current biological assets from inventory
GroupAs reported previously Rs.’000
Current AssetsInventories 7,513,254
Group GroupCurrent Presentation 2021 2020
Current AssetsInventories 8,297,159 7,318,874Biological Assets 192,970 194,380
Current biological assets amounting to Rs. 194 Mn disclosed under inventories in the Statement of Financial Position in 2020 have now been disclosed seperately as biological assets for better presentation.
The above reclassification adjustments do not result in changes to the net assets previously reported by the Group. Therefore, the statement of financial position as at 1st April 2019 are not presented.
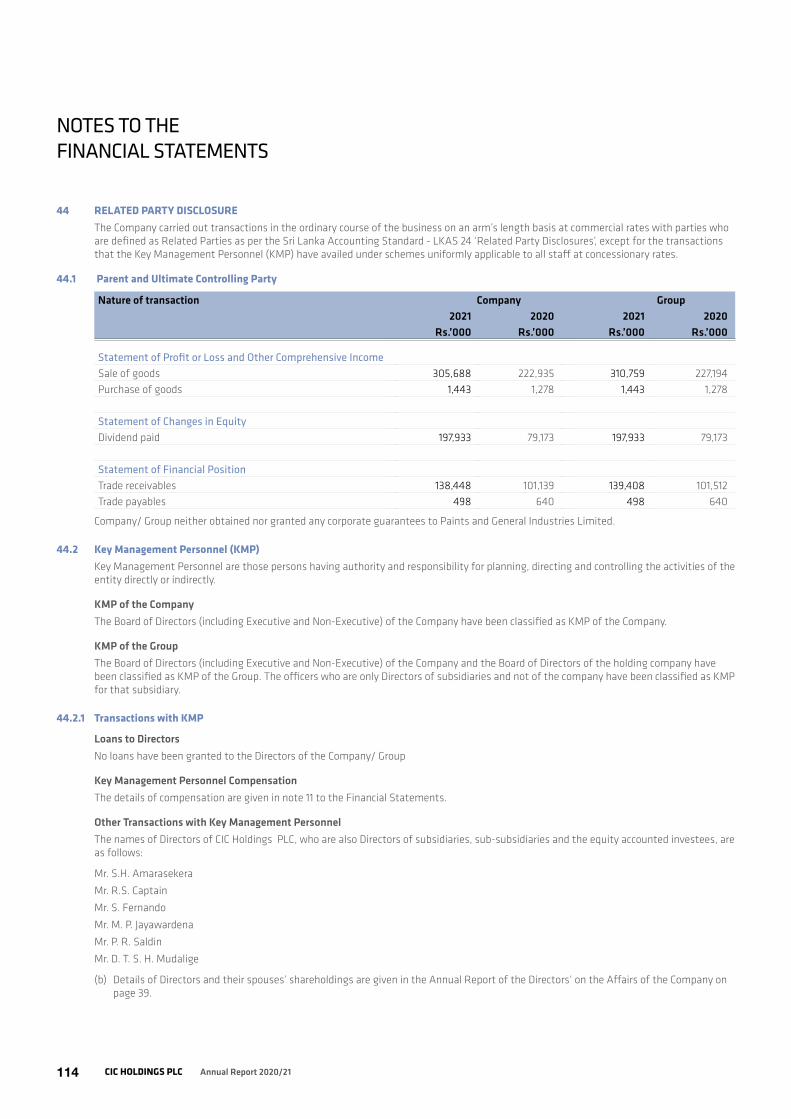
CIC HOLDINGS PLC Annual Report 2020/21114
44 RELATED PARTY DISCLOSUREThe Company carried out transactions in the ordinary course of the business on an arm’s length basis at commercial rates with parties who are defined as Related Parties as per the Sri Lanka Accounting Standard - LKAS 24 ‘Related Party Disclosures’, except for the transactions that the Key Management Personnel (KMP) have availed under schemes uniformly applicable to all staff at concessionary rates.
44.1 Parent and Ultimate Controlling Party
Nature of transaction Company Group2021 2020 2021 2020
Rs.’000 Rs.’000 Rs.’000 Rs.’000
Statement of Profit or Loss and Other Comprehensive IncomeSale of goods 305,688 222,935 310,759 227,194Purchase of goods 1,443 1,278 1,443 1,278
Statement of Changes in EquityDividend paid 197,933 79,173 197,933 79,173
Statement of Financial PositionTrade receivables 138,448 101,139 139,408 101,512Trade payables 498 640 498 640
Company/ Group neither obtained nor granted any corporate guarantees to Paints and General Industries Limited.
44.2 Key Management Personnel (KMP)Key Management Personnel are those persons having authority and responsibility for planning, directing and controlling the activities of the entity directly or indirectly.
KMP of the CompanyThe Board of Directors (including Executive and Non-Executive) of the Company have been classified as KMP of the Company.
KMP of the GroupThe Board of Directors (including Executive and Non-Executive) of the Company and the Board of Directors of the holding company have been classified as KMP of the Group. The officers who are only Directors of subsidiaries and not of the company have been classified as KMP for that subsidiary.
44.2.1 Transactions with KMP
Loans to DirectorsNo loans have been granted to the Directors of the Company/ Group
Key Management Personnel CompensationThe details of compensation are given in note 11 to the Financial Statements.
Other Transactions with Key Management PersonnelThe names of Directors of CIC Holdings PLC, who are also Directors of subsidiaries, sub-subsidiaries and the equity accounted investees, are as follows:
Mr. S.H. Amarasekera
Mr. R.S. Captain
Mr. S. Fernando
Mr. M. P. Jayawardena
Mr. P. R. Saldin
Mr. D. T. S. H. Mudalige
(b) Details of Directors and their spouses’ shareholdings are given in the Annual Report of the Directors‘ on the Affairs of the Company on page 39.
NOTES TO THE FINANCIAL STATEMENTS

115TIDES OF CHANGE
44.3 Transactions with Subsidiaries(i) Companies within the Group engage in trading transactions under normal commercial terms and conditions.
(ii) Company provides office space to some of its subsidiaries and charge rent. In addition, the Company provides certain shared services such as data processing and administration functions. The related costs are allocated to subsidiaries and equity accounted investees.
Nature of transaction Company 2021 2020
Rs.’000 Rs.’000
Statement of Profit or Loss and Other Comprehensive IncomeHandling commission 84,358 78,147 Interest on short term loan 1,186 - Network charges received 420 420 Purchase of goods 51,428 25,868 Rent paid 9,108 9,108 Rent received 21,237 20,226 Royalty 90 52 Sale of goods 3,812 2,150 Secretarial fees paid - 448 Service charge 83,102 95,684 Staff cost paid 48,895 46,036 Staff cost received 22,826 21,288
Statement of Cash FlowDividend received 285,859 7,939
Statement of Financial PositionPayables - non- trade 41,047 16,844 Payables short term loan 400,000 - Payables - trade 8,223 1,924 Receivable - non - trade 67,869 100,267 Receivables - trade 844 791 Receivables short term loan 55,000 55,000
Transactions relating to Corporate Guarantees have been disclosed under Contingent Liabilities Note 40.

CIC HOLDINGS PLC Annual Report 2020/21116
NOTES TO THE FINANCIAL STATEMENTS
44.4 Transactions with Other Related Companies
Nature of transaction Company Group2021 2020 2021 2020
Rs.’000 Rs.’000 Rs.’000 Rs.’000
Statement of Profit or Loss and Other Comprehensive IncomePurchases of goods 153,929 115,092 11,106 5,895 Sale of Goods 8,926 8,098 7,997 8,098 Rent received 157 157 157 157
Statement of Cash FlowDividend received 280,200 355,104 280,200 355,104
Statement of Financial PositionReceivables - non trade 354 184 354 184 Receivables - trade 2,614 1,180 1,685 1,180 Payables -trade 25,258 26,698 2,177 2,028
Transactions relating to Corporate Guarantees have been disclosed in Contingent Liabilities Note 40.
During the year there were no recurring related party transactions of the Company which require disclosures in the Annual Report as per the requirements of section 9.3.2(b) of the CSE Listing rules.
44.5 Non recurring related party transaction Company purchased 16.92% of shares of CIC Agri Businesses (Private) Limited owned by Chemanex PLC on 10 August 2020 for a consideration of Rs.200.33Mn.
Other than the above, there were no non-recurrent related party transactions which in aggregate value exceeds 10% of the equity or 5% of the total assets, whichever is lower, of the Company as at 31st March 2020 audited Financial Statements, which required additional disclosures in the 2020/21 Annual Report under Colombo Stock Exchange Listing Rule 9.3.2 and Code of Best Practices on Related Party Transactions issued by the Securities and Exchange Commission.
45. CORONAVIRUS (COVID - 19) PANDEMICThe outbreak of the COVID-19 pandemic and the measures adopted by Government to mitigate the pandemic’s spread and economic stability have moderately impacted the Group.
Since, most of the business segments operate in essential service category the COVID-19 Pandemic had a moderate impact on the Group’s general business routines and the Group evaluated the resilience of its businesses considering factors such as profitability, cash reserves, and potential sources of financing facilities: if required and possibility of differing non-essential capital expenditure. Having considered the above, management is satisfied that the Company/Group has adequate resources to continue in operational existence for foreseeable future.
Due to the uncertainty of the economic condition of the businesses and the individuals of the country due to COVID-19, there is a possibility of high credit risk.
To address the said risk, Group, at each business unit level a disciplined approach has been adopted to optimise the collection via a rigid credit control management process. Group did not extend the credit terms other than in the normal business terms.
Further, the Group has negotiated financial liabilities with better terms and has adopted a control over the expenditure. Therefore the Group is confident that there are no material uncertainties that may cast significant doubt on its ability to continue as a going concern which arise due to liquidity risk.
The Group has not determined impairment on property, plant & equipment as at the reporting date due to COVID-19 pandemic, and the operations are carrying forward under the business continuity plan as per Group’s Covid-19 risk management strategy, allowing operations to function through alternate working arrangements, whilst strictly adhering to and supporting government directives. Where it is not feasible to operate in full or partial capacity in the immediate to short term under the current environment, the management has taken necessary steps to safeguard the assets.
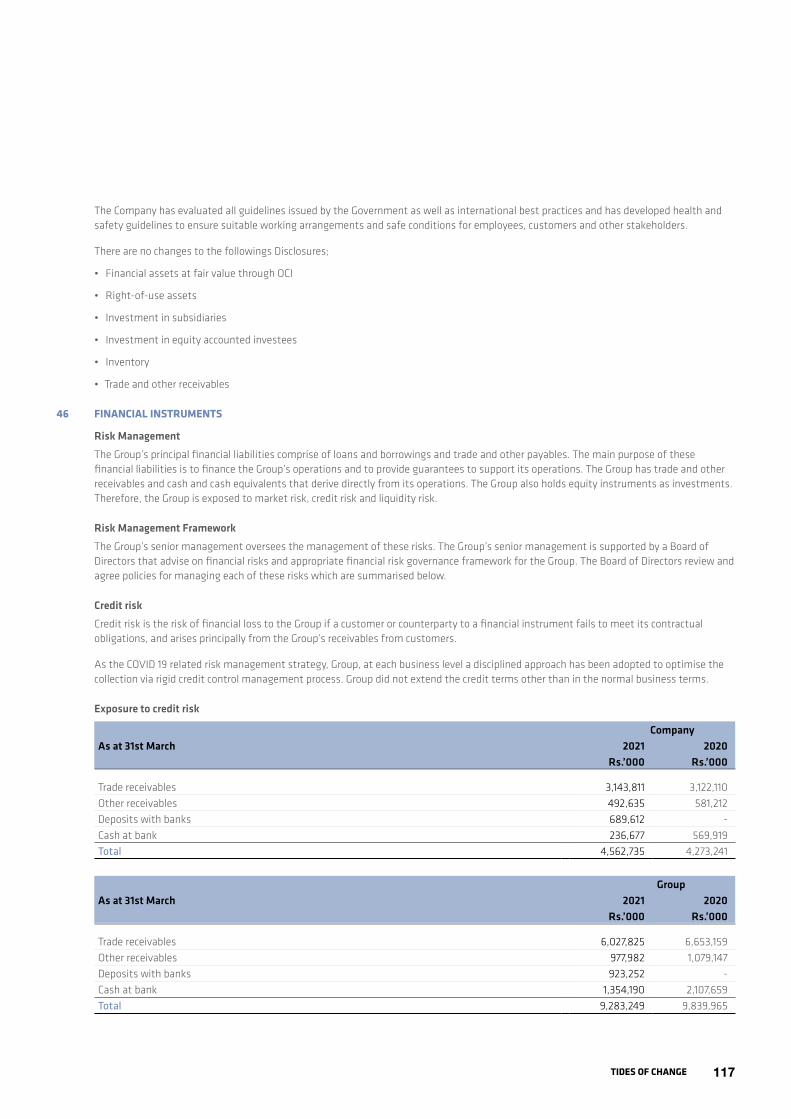
117TIDES OF CHANGE
The Company has evaluated all guidelines issued by the Government as well as international best practices and has developed health and safety guidelines to ensure suitable working arrangements and safe conditions for employees, customers and other stakeholders.
There are no changes to the followings Disclosures;
• Financial assets at fair value through OCI
• Right-of-use assets
• Investment in subsidiaries
• Investment in equity accounted investees
• Inventory
• Trade and other receivables
46 FINANCIAL INSTRUMENTS
Risk ManagementThe Group’s principal financial liabilities comprise of loans and borrowings and trade and other payables. The main purpose of these financial liabilities is to finance the Group’s operations and to provide guarantees to support its operations. The Group has trade and other receivables and cash and cash equivalents that derive directly from its operations. The Group also holds equity instruments as investments. Therefore, the Group is exposed to market risk, credit risk and liquidity risk.
Risk Management FrameworkThe Group’s senior management oversees the management of these risks. The Group’s senior management is supported by a Board of Directors that advise on financial risks and appropriate financial risk governance framework for the Group. The Board of Directors review and agree policies for managing each of these risks which are summarised below.
Credit riskCredit risk is the risk of financial loss to the Group if a customer or counterparty to a financial instrument fails to meet its contractual obligations, and arises principally from the Group’s receivables from customers.
As the COVID 19 related risk management strategy, Group, at each business level a disciplined approach has been adopted to optimise the collection via rigid credit control management process. Group did not extend the credit terms other than in the normal business terms.
Exposure to credit risk
Company As at 31st March 2021 2020
Rs.’000 Rs.’000
Trade receivables 3,143,811 3,122,110 Other receivables 492,635 581,212 Deposits with banks 689,612 - Cash at bank 236,677 569,919 Total 4,562,735 4,273,241
GroupAs at 31st March 2021 2020
Rs.’000 Rs.’000
Trade receivables 6,027,825 6,653,159 Other receivables 977,982 1,079,147 Deposits with banks 923,252 - Cash at bank 1,354,190 2,107,659 Total 9,283,249 9,839,965

CIC HOLDINGS PLC Annual Report 2020/21118
Trade and other receivablesThe Group’s exposure to credit risk is influenced mainly by the individual characteristics of each customer. However, management also considers the demographics of the Group’s customer base, including the default risk of the industry and area in which customers operate, as these factors may have an influence on credit risk.
The senior management has established a credit policy under which each new customer is analysed individually for creditworthiness before the Group’s standard payment and delivery terms and conditions are offered. The Group’s review includes external ratings, when available, and in some cases bank references. Purchase limits are established for each customer, which represents the maximum open amount without requiring approval from the senior management. Customers that fail to meet the Group’s benchmark credit worthiness may transact with the company only on a prepayment basis.
A significant percentage of the Group’s customers are transacting with the Group for more than four years. In monitoring customer credit risk, customers are grouped according to their credit characteristics, including whether they are institutes, government or non-government, whether they are wholesale, retail or end-customer, their geographic location, industry, aging profile, maturity and existence of previous financial difficulties Customers that are graded as ‘high risk’ are placed on a restricted customer list and monitored by the management, and future sales are made on a prepayment basis.
The Group establishes an allowance for impairment that represents its estimate of expected losses in respect of trade and other receivables. The main components of this allowance are specific loss component that relates to individually significant exposures, and a collective loss component established for Group of similar assets in respect of losses that have been incurred but not yet identified. The collective loss allowance is determined based on historical data of payment statistics of those receivables and future macro economic conditions.
The Group is closely monitoring the economic environment in the country and is taking necessary measures to limit its exposure to customers experiencing particular economic volatility.
Although the credit model inputs and assumptions, including forward-looking macroeconomic assumptions, were revised in response to the COVID-19 pandemic, the fundamental credit model mechanics and methodology underpinning the Group’s calculation of ECL have remained consistent with prior periods.
GroupAs at 31st March 2021 2020
Rs.’000 Rs.’000
Domestic 5,947,041 6,594,289 Foreign 80,784 58,870 Total 6,027,825 6,653,159
NOTES TO THE FINANCIAL STATEMENTS
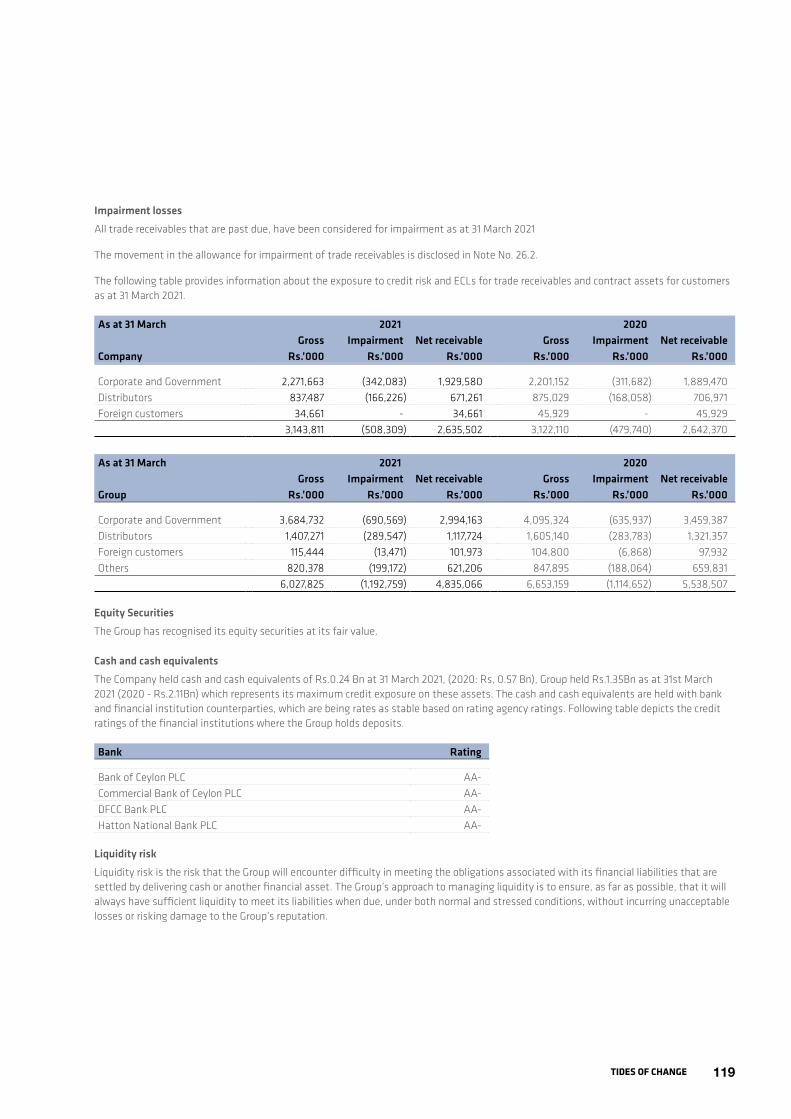
119TIDES OF CHANGE
Impairment losses All trade receivables that are past due, have been considered for impairment as at 31 March 2021
The movement in the allowance for impairment of trade receivables is disclosed in Note No. 26.2.
The following table provides information about the exposure to credit risk and ECLs for trade receivables and contract assets for customers as at 31 March 2021.
As at 31 March 2021 2020Gross Impairment Net receivable Gross Impairment Net receivable
Company Rs.’000 Rs.’000 Rs.’000 Rs.’000 Rs.’000 Rs.’000
Corporate and Government 2,271,663 (342,083) 1,929,580 2,201,152 (311,682) 1,889,470 Distributors 837,487 (166,226) 671,261 875,029 (168,058) 706,971 Foreign customers 34,661 - 34,661 45,929 - 45,929
3,143,811 (508,309) 2,635,502 3,122,110 (479,740) 2,642,370
As at 31 March 2021 2020Gross Impairment Net receivable Gross Impairment Net receivable
Group Rs.’000 Rs.’000 Rs.’000 Rs.’000 Rs.’000 Rs.’000
Corporate and Government 3,684,732 (690,569) 2,994,163 4,095,324 (635,937) 3,459,387 Distributors 1,407,271 (289,547) 1,117,724 1,605,140 (283,783) 1,321,357 Foreign customers 115,444 (13,471) 101,973 104,800 (6,868) 97,932 Others 820,378 (199,172) 621,206 847,895 (188,064) 659,831
6,027,825 (1,192,759) 4,835,066 6,653,159 (1,114,652) 5,538,507
Equity Securities The Group has recognised its equity securities at its fair value.
Cash and cash equivalents The Company held cash and cash equivalents of Rs.0.24 Bn at 31 March 2021, (2020: Rs, 0.57 Bn), Group held Rs.1.35Bn as at 31st March 2021 (2020 - Rs.2.11Bn) which represents its maximum credit exposure on these assets. The cash and cash equivalents are held with bank and financial institution counterparties, which are being rates as stable based on rating agency ratings. Following table depicts the credit ratings of the financial institutions where the Group holds deposits.
Bank Rating
Bank of Ceylon PLC AA-Commercial Bank of Ceylon PLC AA-DFCC Bank PLC AA-Hatton National Bank PLC AA-
Liquidity riskLiquidity risk is the risk that the Group will encounter difficulty in meeting the obligations associated with its financial liabilities that are settled by delivering cash or another financial asset. The Group’s approach to managing liquidity is to ensure, as far as possible, that it will always have sufficient liquidity to meet its liabilities when due, under both normal and stressed conditions, without incurring unacceptable losses or risking damage to the Group’s reputation.

CIC HOLDINGS PLC Annual Report 2020/21120
FINANCIAL INSTRUMENTS CONTD:The Group aims to maintain the level of its cash and cash equivalents and other highly marketable debt investments at an amount in excess of expected cash outflows on financial liabilities.
A Risk Management policy is set so as to limit the net financial liabilities to a pre-approved amount. The Group maintains the net financial liabilities to these specified upper limits and any deviation to these upper limits require prior approval.
The Company and the Group held the following short term financial liabilities as at 31st March 2021; (Refer Note 42.1.5 for maturity analysis of contractual un- discounted cash flows of lease payments).
CompanyAs at 31st March 2021 On Demand Less than
90 days 90-365 days
Rs.’000 Rs.’000 Rs.’000
Trade payables - 1,656,760 - Accruals and other payables - 617,641 - Lease liabilities - - 9,860Short term loans - 3,517,923 - Bank overdrafts 2,714 - -
CompanyAs at 31st March 2020 On Demand Less than
90 days 90-365 days
Rs.’000 Rs.’000 Rs.’000
Trade payables - 1,285,241 - Accruals and other payables - 472,346 - Lease liabilities - - 14,144 Short term loans - 4,808,754 - Bank overdrafts 65,244 - -
GroupAs at 31st March 2021 On Demand Less than
90 days 90-365 days
Rs.’000 Rs.’000 Rs.’000
Trade payables - 2,734,539 5,573,929 Accruals and other payables - 1,672,411 - Lease liabilities - - 35,000Short term loans - 8,740,423 - Bank overdrafts 488,854 - -
GroupAs at 31st March 2020 On Demand Less than
90 days 90-365 days
Rs.’000 Rs.’000 Rs.’000
Trade payables - 5,547,064 - Accruals and other payables - 1,487,774 - Lease liabilities - - 49,319 Short term loans - 14,917,148 - Bank overdrafts 896,318 - -
NOTES TO THE FINANCIAL STATEMENTS

121TIDES OF CHANGE
Market risk Market risk is the risk that changes in market prices, such as foreign exchange rates, interest rates and equity prices will affect the group’s income or the value of its holdings of financial instruments. The objective of market risk management is to manage and control market risk exposures within acceptable parameters, while optimising the return.
Summary of the Company and Group’s investment in equity market is as follows
As at 31st march 2021 2020 Rs.’000 Rs.’000
Equity Securities - FVOCI Company 280,685 219,268 Equity Securities - FVOCI Group 2,235,078 968,530
The Group manages the equity price risk through diversification and by managing through pre-approved ratios between cash and equity investments. Reports on the equity portfolio are submitted to the Group’s senior management on a regular basis. The Board of Directors reviews and approves all equity investment decisions.
For such investments classified at FVOCI, 1% increase in the price index , would have increased the equity by Rs.22.35Mn at the Group level (2020: Rs.9.68Mn increase) and equal change to the opposite side would have decreased the equity by Rs.22.35Mn (2020: Rs.9.68Mn decrease).
Currency risk The Group is exposed to currency risk on sales, purchases that are denominated in a currency other than the respective functional currencies of entities. The currencies in which these transactions primarily are denominated are Euro, USD and Sterling Pound.
Effects of currency rate fluctuations of imported materials and finished goods are transferred in a reasonable manner keeping in line with the prices in the market.
Subsidiary companies of the Group settle majority of their import bills and the financial liabilities denominated in a currency other than functional currency.

CIC HOLDINGS PLC Annual Report 2020/21122
Exposure to currency risk The summary quantitative data about the Company and Groups’ exposure to currency risk as reported to the management of the Company and Group is as follows:
As at 31 March 2021 2020EURO USD GBP EURO USD GBP
Company ’000 ’000 ’000 ’000 ’000 ’000
Trade receivables - 177 - - 253 - Trade payables (393) (5,841) (1) (408) (3,883) (6)
As at 31 March 2021 2020EURO USD GBP EURO USD GBP
Group ’000 ’000 ’000 ’000 ’000 ’000
Trade receivables 104 465 - - 551 - Trade payables (844) (34,452) (4) (689) (21,779) (17)
Followings are the exchange rate used for the translation of transaction denominated in foreign currencies.
Period end spot rate- Buying Period end spot rate- SellingAs at 31 March 2021 2020 2021 2020
USD 197.62 187.36 202.04 192.45 Euro 229.87 205.27 237.40 213.56 GBP 269.88 230.01 278.24 238.79
As at 31st march 2021 2020 Average rate Average rate
Rs. Rs.
USD 199.04 188.62 Euro 233.09 207.96 GBP 273.23 232.67
NOTES TO THE FINANCIAL STATEMENTS
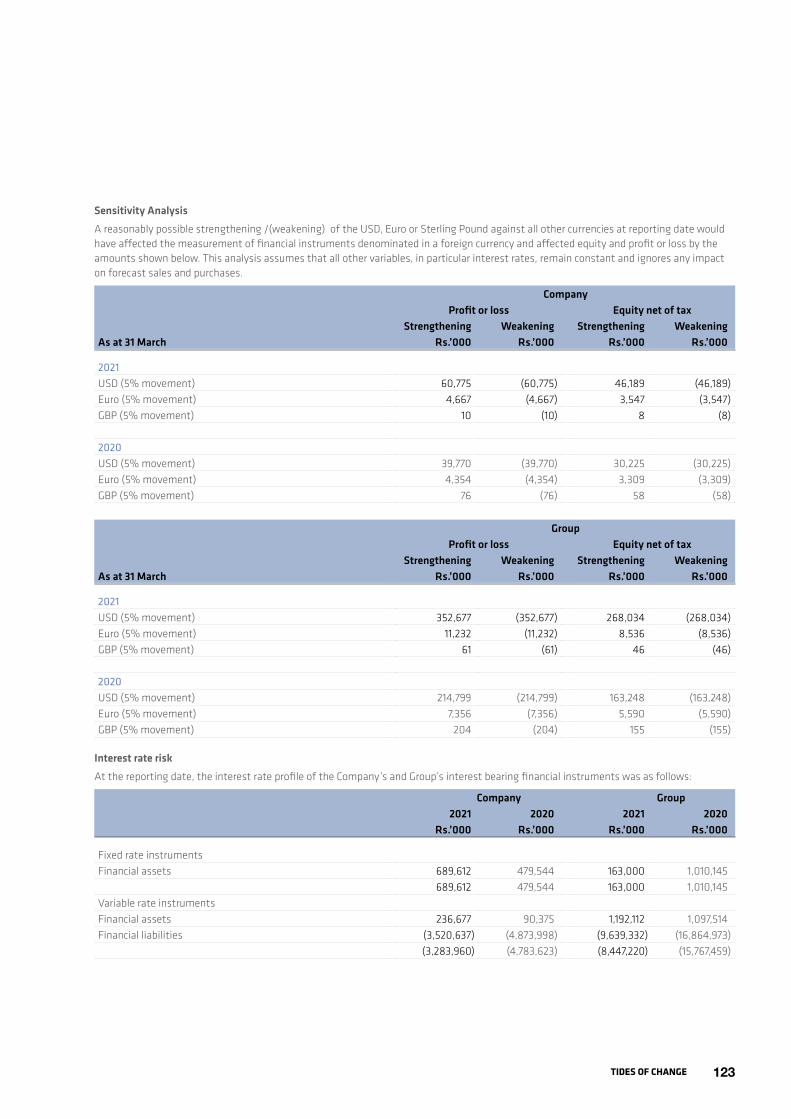
123TIDES OF CHANGE
Sensitivity Analysis A reasonably possible strengthening /(weakening) of the USD, Euro or Sterling Pound against all other currencies at reporting date would have affected the measurement of financial instruments denominated in a foreign currency and affected equity and profit or loss by the amounts shown below. This analysis assumes that all other variables, in particular interest rates, remain constant and ignores any impact on forecast sales and purchases.
CompanyProfit or loss Equity net of tax
Strengthening Weakening Strengthening WeakeningAs at 31 March Rs.’000 Rs.’000 Rs.’000 Rs.’000
2021USD (5% movement) 60,775 (60,775) 46,189 (46,189)Euro (5% movement) 4,667 (4,667) 3,547 (3,547)GBP (5% movement) 10 (10) 8 (8)
2020USD (5% movement) 39,770 (39,770) 30,225 (30,225)Euro (5% movement) 4,354 (4,354) 3,309 (3,309)GBP (5% movement) 76 (76) 58 (58)
GroupProfit or loss Equity net of tax
Strengthening Weakening Strengthening WeakeningAs at 31 March Rs.’000 Rs.’000 Rs.’000 Rs.’000
2021USD (5% movement) 352,677 (352,677) 268,034 (268,034)Euro (5% movement) 11,232 (11,232) 8,536 (8,536)GBP (5% movement) 61 (61) 46 (46)
2020USD (5% movement) 214,799 (214,799) 163,248 (163,248)Euro (5% movement) 7,356 (7,356) 5,590 (5,590)GBP (5% movement) 204 (204) 155 (155)
Interest rate riskAt the reporting date, the interest rate profile of the Company’s and Group’s interest bearing financial instruments was as follows:
Company Group2021 2020 2021 2020
Rs.’000 Rs.’000 Rs.’000 Rs.’000
Fixed rate instrumentsFinancial assets 689,612 479,544 163,000 1,010,145
689,612 479,544 163,000 1,010,145 Variable rate instrumentsFinancial assets 236,677 90,375 1,192,112 1,097,514 Financial liabilities (3,520,637) (4,873,998) (9,639,332) (16,864,973)
(3,283,960) (4,783,623) (8,447,220) (15,767,459)

CIC HOLDINGS PLC Annual Report 2020/21124
Fair value sensitivity for fixed rate instruments
CompanyProfit or loss Equity net of tax
Strengthening Weakening Strengthening Weakening Rs.’000 Rs.’000 Rs.’000 Rs.’000
2021Fixed rate instrumentsFair value sensitivity (Net) 6,896 (6,896) 5,241 (5,241)
2020Fixed rate instrumentsFair value sensitivity (Net) 4,795 (4,795) 3,645 (3,645)
GroupProfit or loss Equity net of tax
Strengthening Weakening Strengthening Weakening Rs.’000 Rs.’000 Rs.’000 Rs.’000
2021Fixed rate instrumentsFair value sensitivity (Net) 1,630 (1,630) 1,239 (1,239)
2020Fixed rate instrumentsFair value sensitivity (Net) 10,101 (10,101) 7,677 (7,677)
Cash flow sensitivity for variable rate instruments A reasonably change of 100 basis points in interest rate at the reporting date would have increased (decreased) equity and profit or loss by the amounts shown below. This analysis assumes that all other variables remain constant:
CompanyProfit or loss Equity net of tax
Strengthening Weakening Strengthening Weakening Rs.’000 Rs.’000 Rs.’000 Rs.’000
2021Variable rate instrumentsCash flow sensitivity (Net) 32,840 (32,840) 24,958 (24,958)
2020Variable rate instrumentsCash flow sensitivity (Net) 47,836 (47,836) 36,355 (36,355)
GroupProfit or loss Equity net of tax
Strengthening Weakening Strengthening Weakening Rs.’000 Rs.’000 Rs.’000 Rs.’000
2021Variable rate instrumentsCash flow sensitivity (Net) 84,472 (84,472) 64,199 (64,199)
2020Variable rate instrumentsCash flow sensitivity (Net) 157,675 (157,675) 119,833 (119,833)
NOTES TO THE FINANCIAL STATEMENTS

125TIDES OF CHANGE
Capital Management The Group’s policy is to maintain a strong capital base so as to maintain investor, creditor and market confidence and to sustain future development of the business. Capital consists of total equity. The Board of Directors monitors the return on capital as well as the level of dividends to ordinary shareholders.
The Board of Directors seeks to maintain a balance between the higher returns that might be possible with higher levels borrowings and the advantages and security afforded by a sound capital position.
The Group monitors capital using an adjusted net debt to equity ratio, which is adjusted net debt divided by adjusted equity. For this purpose, adjusted net debt is defined as total liabilities (which includes interest bearing borrowings and obligations under finance leases excluding lease liability under SLFRS 16) plus unaccrued proposed dividends, less cash and equivalents and deposits with banks. Adjusted equity comprises all components of equity other than amounts recognised in equity relating to cash flow hedges, less unaccrued proposed dividends.
The Company’s and Group’s adjusted net debt to equity ratio at the end of the reporting period was as follows;
Company GroupAs at 31st March 2021 2020 2021 2020
Total debts (Rs'000) 3,600,429 4,967,933 9,841,004 17,101,220 Less: Cash and cash equivalents and deposits with banks
(Rs'000) (927,111) (569,919) (2,278,364) (2,107,659)Net debt (Rs'000) 2,673,318 4,398,014 7,562,640 14,993,561 Adjusted net debt (Rs'000) 3,067,376 4,398,849 7,834,818 14,852,084 Total equity (Rs'000) 4,964,170 4,111,519 16,302,987 11,711,748 Adjusted equity (Rs'000) 4,490,320 4,016,749 15,829,137 11,616,978 Net debt to adjusted equity ratio (Times) 0.68 1.10 0.49 1.28
Accounting classifications and fair valueThe value of financial assets and liabilities, together with carrying amounts shown in the statement of financial position as follows:
Company
As at 31st March 2021
Fair value through OCI
Financial assets at amortised cost
Other financial liabilities
Carrying amount
Fair Value
Rs.’000 Rs.’000 Rs.’000 Rs.’000 Rs.’000
Cash and cash equivalents - 237,499 - 237,499 237,499 Deposits with banks - 689,612 - 689,612 689,612 Trade receivables - 2,635,502 - 2,635,502 2,635,502 Other receivables - 389,550 - 389,550 389,550 Equity investments at fair value through OCI 280,685 - - 280,685 280,685
280,685 3,952,163 - 4,232,848 4,232,848
Trade payables - - (1,656,760) (1,656,760) (1,656,760)Other payables - - (617,641) (617,641) (617,641)Loans and borrowings - - (3,600,429) (3,600,429) (3,600,429)
- - (5,874,830) (5,874,830) (5,874,830)
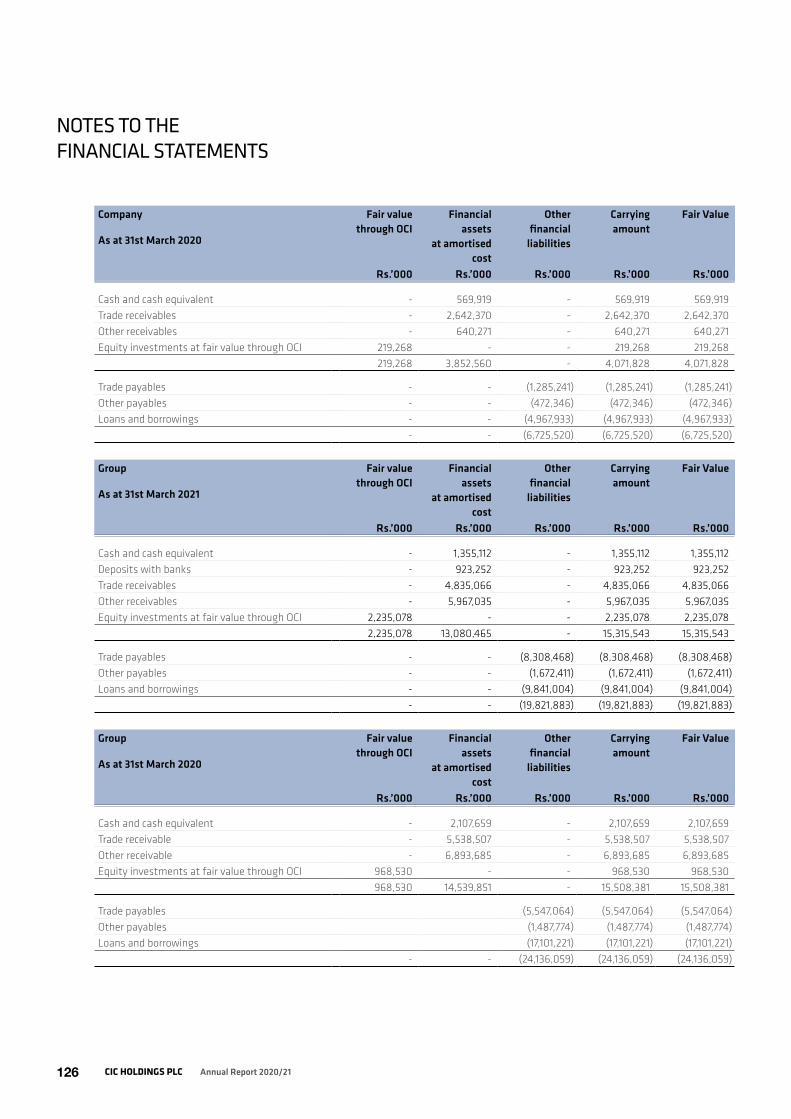
CIC HOLDINGS PLC Annual Report 2020/21126
Company
As at 31st March 2020
Fair value through OCI
Financial assets at amortised cost
Other financial liabilities
Carrying amount
Fair Value
Rs.’000 Rs.’000 Rs.’000 Rs.’000 Rs.’000
Cash and cash equivalent - 569,919 - 569,919 569,919 Trade receivables - 2,642,370 - 2,642,370 2,642,370 Other receivables - 640,271 - 640,271 640,271 Equity investments at fair value through OCI 219,268 - - 219,268 219,268
219,268 3,852,560 - 4,071,828 4,071,828
Trade payables - - (1,285,241) (1,285,241) (1,285,241)Other payables - - (472,346) (472,346) (472,346)Loans and borrowings - - (4,967,933) (4,967,933) (4,967,933)
- - (6,725,520) (6,725,520) (6,725,520)
Group
As at 31st March 2021
Fair value through OCI
Financial assets at amortised cost
Other financial liabilities
Carrying amount
Fair Value
Rs.’000 Rs.’000 Rs.’000 Rs.’000 Rs.’000
Cash and cash equivalent - 1,355,112 - 1,355,112 1,355,112 Deposits with banks - 923,252 - 923,252 923,252 Trade receivables - 4,835,066 - 4,835,066 4,835,066 Other receivables - 5,967,035 - 5,967,035 5,967,035 Equity investments at fair value through OCI 2,235,078 - - 2,235,078 2,235,078
2,235,078 13,080,465 - 15,315,543 15,315,543
Trade payables - - (8,308,468) (8,308,468) (8,308,468)Other payables - - (1,672,411) (1,672,411) (1,672,411)Loans and borrowings - - (9,841,004) (9,841,004) (9,841,004)
- - (19,821,883) (19,821,883) (19,821,883)
Group
As at 31st March 2020
Fair value through OCI
Financial assets at amortised cost
Other financial liabilities
Carrying amount
Fair Value
Rs.’000 Rs.’000 Rs.’000 Rs.’000 Rs.’000
Cash and cash equivalent - 2,107,659 - 2,107,659 2,107,659 Trade receivable - 5,538,507 - 5,538,507 5,538,507 Other receivable - 6,893,685 - 6,893,685 6,893,685 Equity investments at fair value through OCI 968,530 - - 968,530 968,530
968,530 14,539,851 - 15,508,381 15,508,381
Trade payables (5,547,064) (5,547,064) (5,547,064)Other payables (1,487,774) (1,487,774) (1,487,774)Loans and borrowings (17,101,221) (17,101,221) (17,101,221)
- - (24,136,059) (24,136,059) (24,136,059)
NOTES TO THE FINANCIAL STATEMENTS

127TIDES OF CHANGE
Level 01 Level 02 Level 03
As at 31st March 2021 2020 2021 2020 2021 2020Company Rs.’000 Rs.’000 Rs.’000 Rs.’000 Rs.’000 Rs.’000
Recurring fair value measurements-
Assets measured at fair valueNon-FinancialFreehold land - - - - 1,096,089 864,603 FinancialEquity Investment 280,685 219,268 - - - -
280,685 219,268 - - 1,096,089 864,603
Non - recurring fair value measurements-
Net asset classified as held for sale and distribution - - - - 1,050,257 1,195,825
Level 01 Level 02 Level 03
As at 31st March 2021 2020 2021 2020 2021 2020Group Rs.’000 Rs.’000 Rs.’000 Rs.’000 Rs.’000 Rs.’000
Recurring fair value measurements-
Assets measured at fair valueNon-FinancialFreehold land - - - - 3,994,136 3,387,135 Biological Assets - - - - 414,095 373,990 FinancialEquity Investment 2,235,078 968,530 - - - -
2,235,078 968,530 - - 4,408,231 3,761,125
Assets for which fair values are disclosed:
Investment property - - - - 2,400 2,400
Non-recurring fair value measurements
Net asset classified as held for sale and distribution - - - - 967,768 1,211,209
Operational Risk Operational risk is the risk of direct or indirect loss arising from a wide variety of causes associated with the Group’s processes, personnel, technology and infrastructure, and from external factors other than credit, market and liquidity risks, such as those arising from legal and regulatory requirements and generally accepted standards of corporate behaviour. Operational risks arise from all of the Group’s operations. The Group’s objective is to manage operational risk so as to balance the avoidance of financial losses and damage to the Group’s reputation with overall cost effectiveness and to avoid control procedures that restrict initiative and creativity. Impact of COVID-19 is disclosed in the separate note to the Financial Statements

CIC HOLDINGS PLC Annual Report 2020/21128
SHAREHOLDERS & INVESTORS INFORMATION1 STOCK EXCHANGE LISTING
CIC Holdings PLC is a Public Quoted Company. The issued share capital of the Company consists of 291,600,000 (2020 - 72,900,000) Ordinary Shares and 87,480,000 (2020 - 21,870,000) Non-Voting (Class X) Shares listed in the Colombo Stock Exchange.
2 SHAREHOLDERS There were 3,824 (2020 - 2,362) Ordinary shareholders and 3,717 (2020 - 2546) Non-Voting (Class X) shareholders as at 31st March 2021, distributed into different categories as follows:
Ordinary Shares
2021 2020Shares held No. of
Shareholders Total Shareholding
% No. of Shareholders
Total Shareholding
%
1 - 1000 1,850 563,091 0.19 1,536 401,159 0.55 1001 - 10000 1,253 5,091,905 1.75 591 2,221,718 3.05 10001 - 100000 550 18,039,639 6.19 189 5,974,981 8.20100001 - 1000000 155 46,584,761 15.98 40 9,163,011 12.56 Over - 1000000 16 221,320,604 75.89 6 55,139,131 75.64
3,824 291,600,000 100.00 2,362 72,900,000 100.00
2021 2020Shares held No. of
Shareholders Total Shareholding
% No. of Shareholders
Total Shareholding
%
Resident 3,793 290,714,272 99.70 2,341 72,751,927 99.80 Non-Resident 31 885,728 0.30 21 148,073 0.20
3,824 291,600,000 100.00 2,362 72,900,000 100.00
The below information of distribution of shares as at 31st March 2021, has been furnished to Colombo Stock Exchange (CSE) and Securities Exchange Commission (SEC) in accordance with CSE Listing Rule 7.3.
Percentage of shares held by public - 46.62%
Percentage of shares held by the Directors together with the members of their families - 0.0001%
Percentage of shares held by the Parent Company - 53.31%
Percentage of shares held by the Employees - 0.07%
Percentage of shares held by Employees’ Provident Fund - 9.06%
Non-Voting (Class X) Shares
2021 2020Shares held No. of
Shareholders Total Shareholding
% No. of Shareholders
Total Shareholding
%
1 - 1000 1,386 501,071 0.57 1,544 479,825 2.19 1001 - 10000 1,517 6,156,885 7.04 738 2,814,765 12.87 10001 - 100000 673 20,742,697 23.71 235 7,166,288 32.78100001 - 1000000 132 32,083,939 36.68 27 7,084,628 32.39 Over - 1000000 9 27,995,408 32.00 2 4,324,494 19.77
3,717 87,480,000 100.00 2,546 21,870,000 100.00

129TIDES OF CHANGE
2021 2020Shares held No. of
Shareholders Total Shareholding
% No. of Shareholders
Total Shareholding
%
Resident 3,671 84,557,402 96.66 2,497 20,724,689 94.76 Non-Resident 46 2,922,598 3.34 49 1,145,311 5.24
3,717 87,480,000 100.00 2,546 21,870,000 100.00
Percentage of shares held by public - 96.27%
Percentage of shares held by the Directors’ together with the members of their families - 0.19%
Percentage of shares held by the Parent Company - 3.32%
Percentage of shares held by the Employees - 0.22%
Percentage of shares held by Employees’ Provident Fund - 12.70%
3 TWENTY LARGEST SHAREHOLDERS - ORDINARY SHARES
2021 2020Name No. of shares % No. of shares %
1 Paints & General Industries Limited 155,441,396 53.31 38,860,349 53.31 2 Employees Provident Fund 26,417,892 9.06 6,604,473 9.06 3 Chacra Capital Holdings (Private) Limited 13,104,960 4.49 3,276,240 4.49 4 Seylan Bank PLC/ ARRC Capital (Private) Limited 6,218,069 2.13 3,054,657 4.19 5 Hotel International (Private) Limited 3,914,602 1.34 2,303,412 3.16 6 Dawi Investment Trust (Private) Limited 2,061,150 0.71 - - 7 Mrs. L.K. Goonewardena 2,005,828 0.69 426,399 0.58 8 Dr. H.R. & Mr. V.K. Wickremasinghe Custodian
Trustees Martin Wickremasinghe Trust Fund 1,767,316 0.61 441,829 0.61 9 Mr. S.R.S. De Saram 1,654,980 0.57 12,500 0.02 10 Bank of Ceylon No. 1 Account 1,473,660 0.51 770,657 1.06 11 Seylan Bank PLC / Janashakthi Capital Limited 1,405,000 0.48 - - 12 S.K. Wickremesinghe Trust (Guarantee) Limited 1,360,000 0.47 340,000 0.47 13 Commercial Bank of Ceylon / Colombo Fort Investments PLC 1,200,000 0.41 300,000 0.41 14 Miss. N.K.R.H. De Silva 1,135,700 0.39 283,925 0.39 15 Mr. G. Ramanan 1,135,051 0.39 - - 16 Peoples Leasing Finance PLC / Hi Line Trading (Private) Limited 1,025,000 0.35 282,546 0.39 17 Mr. A.R. Hettiarachchi 1,000,000 0.34 39 0.00 18 Mercantile Investments and Finance PLC 1,000,000 0.34 - - 19 Seylan Bank PLC / Andaradeniya Estate (Private) Limited 1,000,000 0.34 - - 20 DFCC Bank PLC A/C 01 991,600 0.34 247,900 0.34
225,312,204 77.27 57,204,926 78.47

CIC HOLDINGS PLC Annual Report 2020/21130
4 TWENTY LARGEST SHAREHOLDERS - NON VOTING (CLASS -X) SHARES
2021 2020Name No. of shares % No. of shares %
1 Employees Provident Fund 11,113,696 12.70 2,778,424 12.70 2 Chacra Capital Holdings (Private) Limited 6,184,280 7.07 1,546,070 7.07 3 Paints & General Industries Limited 2,905,204 3.32 726,301 3.32 4 Mrs. M.S.E.V.E.A.U. Von Stumm 1,596,876 1.83 399,219 1.83 5 DFCC Bank A/C No.01 1,557,600 1.78 389,400 1.78 6 Mr. S.A. Cooray 1,285,000 1.47 - - 7 Mr. S Vamathevan 1,263,000 1.44 35,000 0.16 8 DFCC Bank PLC/ Mr. H.M. Hettiarachchi 1,054,600 1.21 - - 9 Hatton National Bank PLC/ Mr. G.S. Niranjan 1,035,152 1.18 - - 10 E.W. Balasuriya & Co. (Private) Limited 870,009 0.99 672,600 3.08 11 Mr. M.A. Jafferjee 814,656 0.93 378,664 1.73 12 Commercial Bank of Ceylon PLC/ Mr. G.S.N. Peiris 715,640 0.82 - - 13 Amana Bank PLC/ Mr. M.Z. Deen 660,689 0.76 - - 14 Mr. D.A. Cabraal 600,000 0.69 150,000 0.69 15 Sen-Saal (Private) Limited 600,000 0.69 45,000 0.21 16 Mr. M.Z. Deen 585,000 0.67 - - 17 Genesiis Software (Private) Limited 565,044 0.65 201,868 0.92 18 Aruna Equity Care (Private) Limited 532,768 0.61 188,942 0.86 19 Mr. M.A.A.H. Esufally & Mrs. A.M. Moonesinghe 488,400 0.56 - - 20 Seylan Bank PLC/ Hiline Towers (Private) Limited 482,928 0.55 - -
34,910,542 39.91 7,511,488 34.35
5 MARKET VALUE SHARE
Ordinary Shares Non-voting Shares2021 2020 *** 2021 2020 ***
Share price (Rs.) As at the end of the year 50.90** 35.00 42.40 28.90 Highest price traded 188.80* 64.40 157.50 50.90 Lowest price traded 36.00** 33.80 25.00 24.00
* Highest share price reported prior to the sub-division of shares** Lowest share price reported post to the sub-division of shares*** Original share prices reported prior to the sub-division of shares
6 SHARE TRADING
Ordinary Shares Non-voting Shares2021 2020 2021 2020
No. of shares traded 72,981,091 3,730,001 80,519,365 5,128,199 No. of transactions 30,195 2,248 33,440 3,106 Value of shares traded (Rs.) 6,021,693,712 209,902,497 5,069,528,360 215,170,527
SHAREHOLDERS & INVESTORS INFORMATION
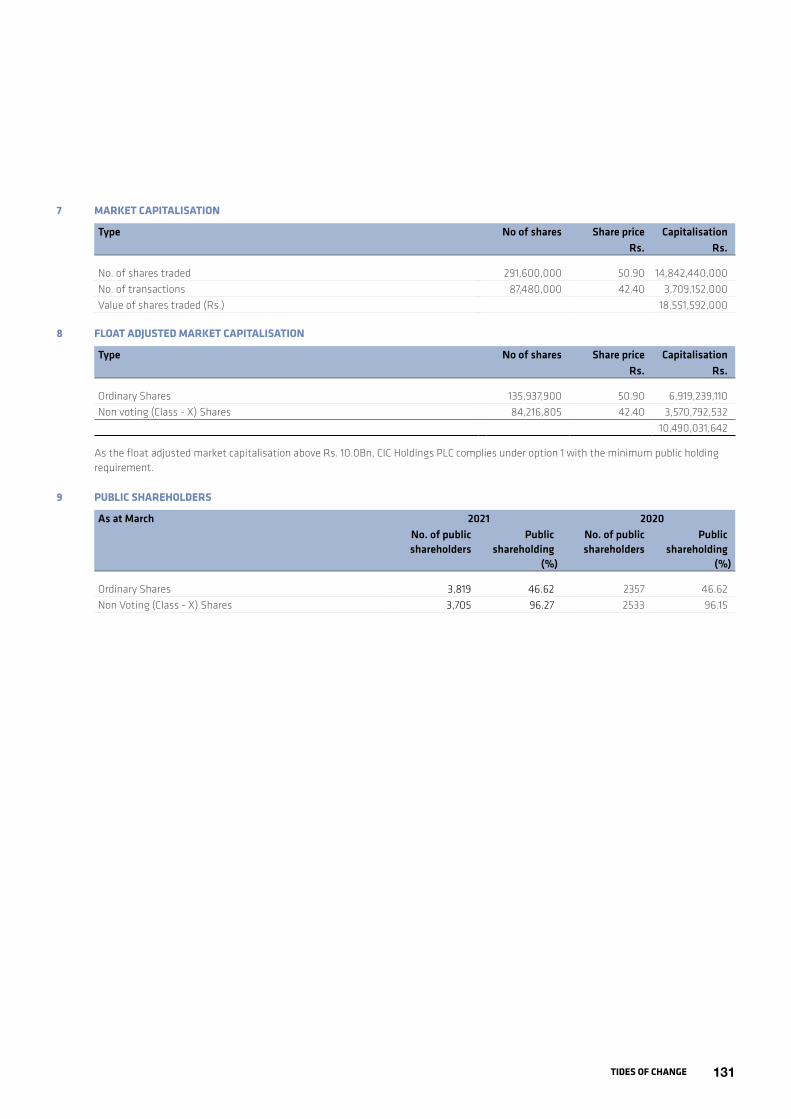
131TIDES OF CHANGE
7 MARKET CAPITALISATION
Type No of shares Share price Capitalisation Rs. Rs.
No. of shares traded 291,600,000 50.90 14,842,440,000 No. of transactions 87,480,000 42.40 3,709,152,000 Value of shares traded (Rs.) 18,551,592,000
8 FLOAT ADJUSTED MARKET CAPITALISATION
Type No of shares Share price Capitalisation Rs. Rs.
Ordinary Shares 135,937,900 50.90 6,919,239,110 Non voting (Class - X) Shares 84,216,805 42.40 3,570,792,532
10,490,031,642
As the float adjusted market capitalisation above Rs. 10.0Bn, CIC Holdings PLC complies under option 1 with the minimum public holding requirement.
9 PUBLIC SHAREHOLDERS
As at March 2021 2020 No. of public shareholders
Public shareholding (%)
No. of public shareholders
Public shareholding (%)
Ordinary Shares 3,819 46.62 2357 46.62Non Voting (Class - X) Shares 3,705 96.27 2533 96.15

CIC HOLDINGS PLC Annual Report 2020/21132
MOVEMENT IN ISSUED CAPITAL AND DIVIDEND DISTRIBUTION
Bonus Issue (No. of Shares) Share Capital (No. of Shares) Dividend Year to 31st March Proportion Voting Non-Voting Voting Non-Voting Rs.
1965 (Initial issue) 50,000
1966 50,000 2.00
1967 50,000 2.00
1968 1:1 50,000 100,000 2.00
1969 100,000 2.00
1970 1:2 50,000 150,000 2.00
1971 150,000 1.75
1972 150,000 2.00
1973 150,000 2.00
1974 150,000 2.00
1975 1:3 50,000 200,000 2.00
1976 1:2 100,000 300,000 2.00
1977 300,000 2.00
1978 300,000 2.00
1979 1:2 150,000 450,000 2.00
1980 7:9 350,000 800,000 2.00
1981 800,000 2.00
1982 800,000 2.00
1983 800,000 2.00
1984 800,000 2.00
1985 1:2 400,000 1,200,000 2.00
1986 1:2 600,000 1,800,000 2.50
1987 1:1 1,800,000 3,600,000 2.50
1988 3,600,000 2.75
1989 3,600,000 2.50
1990 1:2 1,800,000 5,400,000 3.00
1991 5,400,000 3.25
1992 5,400,000 4.00
1993 3 N-V:10 V (Rights) 1,620,000 5,400,000 1,620,000 3.50
1994 5,400,000 1,620,000 4.00
1995 5,400,000 1,620,000 4.00
1996 5,400,000 1,620,000 4.00
1997 5,400,000 1,620,000 4.00
1998 5,400,000 1,620,000 2.50
1999 5,400,000 1,620,000 3.50
2000 1:6 900,000 270,000 6,300,000 1,890,000 3.75
2001 6,300,000 1,890,000 4.00
2002 6,300,000 1,890,000 4.00
2003 1:7 900,000 270,000 7,200,000 2,160,000 4.25
2004 7,200,000 2,160,000 4.75

133TIDES OF CHANGE
Bonus Issue (No. of Shares) Share Capital (No. of Shares) Dividend Year to 31st March Proportion Voting Non-Voting Voting Non-Voting Rs.
2005 1:08 900,000 270,000 8,100,000 2,430,000 4.75
2006 8,100,000 2,430,000 4.75
2007 1:1 (Rights) 8,100,000 2,430,000 16,200,000 4,860,000 1.44*
3:2 (Bonus) 24,300,000 7,290,000 40,500,000 12,150,000
2008 4:5 (Bonus) 32,400,000 9,720,000 72,900,000 21,870,000 1.50
2009 72,900,000 21,870,000 1.50
2010 72,900,000 21,870,000 1.85
2011 72,900,000 21,870,000 2.75
2012 72,900,000 21,870,000 3.20
2013 72,900,000 21,870,000 1.63
2014 72,900,000 21,870,000 -
2015 72,900,000 21,870,000 3.00
2016 72,900,000 21,870,000 4.00
2017 72,900,000 21,870,000 2.00
2018 72,900,000 21,870,000 1.00
2019 72,900,000 21,870,000 1.00
2020 72,900,000 21,870,000 2.00
2021 291,600,000 87,480,000 2.25
* Effective rate (Rs.1.44 per share)

CIC HOLDINGS PLC Annual Report 2020/21134
SUBSIDIARIES ANDEQUITY ACCOUNTED INVESTEESCompany Directors Principal Activity Segment Stated Capital
Rs. Mn
Chemanex PLC P.R. Saldin - Chairman Manufacturing and Marketing of value added speciality compounds and intermediates
Industrial Solutions 126.25S. FernandoE.M.M. BoyagodaDr. S.A.B. Ekanayake
CIC Agri Businesses (Private) Limited
S.H. Amarasekera - Chairman Importing, Blending and Marketing of Fertilizer
Crop Solutions 205.5S. FernandoW.P. MadawanaarachchiJ.D. PierisJ.M. Swaminathan
CIC Feeds (Private) Limited D.A. Cabraal - Chairman Manufacturing of Animal Feeds and Hatchery
Livestock Solutions 450.5S. FernandoD.T.S.H. Mudalige
Link Natural Products (Private) Limited
Dr. D. Nugawela - Chairman Manufacturing of Natural Healthcare Products, Ayurvedic Pharmaceuticals, Herbal Cosmetics and Neutraceuticals
Health & Personal Care 102.67S.H. AmarasekeraR.S. CaptainProf. T. de SilvaDr. S.A.B. EkanayakeS. FernandoD.T.S.H. MudaligeP.R .SaldinK. Shakthidasan
CISCO Speciality Packaging (Private) Limited
P.R. Saldin - Chairman Manufacturing of Polyethylene Terephthalate Containers for Domestic and Export Markets
Industrial Solutions 110.5R.S. Captain Ms. L.A. CaptainS. FernandoL. de MelD.P.G.C.P. Wegiriya
CIC CropGuard (Private) Limited S. Fernando Importing, Repacking and Marketing of Agro Chemicals
Crop Solutions 5R. Ganesalingam
Crop Management Services (Private) Limited
W.P. Madawanaarachchi Investment Company Agri Produce 199.2D.P. Senadheera
Colombo Industrial Agencies Limited
Ms. L.I. Fernando - Chairperson Owning a Store Complex at Ekala
Industrial Solutions 10.57S. Fernando
CIC Lifesciences Limited S. Fernando Manufacturing and Importing of Pharmaceuticals
Health and Personal Care
196.36H.C. AhangamaK.A.V. Manatunga
CIC Properties (Private) Limited S. Fernando Renting Properties to Group Companies
Agri Produce 45W.P. Madawanaarachchi
Akzo Nobel Paints Lanka (Private) Limited
O.C.M.J. Wezenbeek - Chairman Trading Paints and Surface Coatings
Industrial Solutions 88.8K.A.W. Heenatigala S. FernandoP.R. SaldinS.F. Teng

135TIDES OF CHANGE
Company Directors Principal Activity Segment Stated Capital Rs. Mn
Cropwiz (Private) Limited S. Fernando Cultivating and Exporting of Vegetables and Herbs
Agri Produce 312.74K.A.V. Manatunga D.P. Senadheera E. Shaked
CIC Precision Agricultural Technologies (Private) Limited
S.P.S. Ranatunga - Chairman Agri Technologies Agri Produce 8.4M.S. Goonewardena A. HettiarachchiProf. P.W.M.B.B. Marambe K.A. Rutnam
Unipower (Private) Limited K.J.M. De A. Rajapakse - Chairman Importing, Blending and Marketing of Specialised Fertilizer
Crop Solutions 5.38W.P. MadawanaarachchiS. Fernando
CIC Healthcare (Private) Limited S. Fernando Importing & Merchandising of Healthcare Products
Health and Personal Care
-H.C. AhangamaK.A.V. Manatunga

CIC HOLDINGS PLC Annual Report 2020/21136
TEN YEARGROUP PERFORMANCE
Re-classified Re-classified Restated Restated Restated2021 2020 2019 2018 2017 2016 2015 2014 2013 2012
SLFRS SLFRS SLFRS SLFRS SLFRS SLFRS SLFRS SLFRS SLFRS SLFRSRs’000 Rs’000 Rs’000 Rs’000 Rs’000 Rs’000 Rs’000 Rs’000 Rs’000 Rs’000
Income StatementTurnover 37,233,343 30,535,563 30,701,977 33,148,257 32,210,546 26,666,284 23,496,259 21,559,839 21,582,348 22,477,151 Operating profit after interest 4,140,439 1,120,813 303,337 (251,921) 852,073 1,117,701 1,005,508 (832,986) 144,176 943,637 Other income 305,125 360,906 202,417 673,963 311,298 534,705 209,971 577,839 133,902 152,888 Share of profit of equity accounted investees 466,488 390,013 394,788 267,053 334,728 362,478 207,636 270,071 291,716 277,896 Profit before tax 4,912,052 1,871,732 900,542 689,095 1,498,099 2,014,884 1,423,115 14,924 605,324 1,374,421 Taxation (975,188) (535,597) (40,428) (491,865) (384,066) (366,777) (397,697) (72,047) (174,818) (353,890)Profit for the year from continuing operations 3,936,864 1,336,135 860,114 197,230 1,114,033 1,648,107 1,025,418 (57,123) 430,506 1,020,531 Profit/(loss) for the year from discontinued operations (90,771) (256,735) (402,784) (575,123) (227,116) (14,273) 15,425 (1,069,716) (246,530) - Non-controlling interest 713,682 246,816 (25,909) 35,182 333,419 279,542 278,916 (155,126) (49,339) 157,447 Profit attributable to equity holders of the Company 3,132,411 832,584 483,239 (413,075) 553,498 1,354,292 761,927 (971,713) 233,315 863,084
Statement of Financial PositionStated capital 1,008,450 1,008,450 1,008,450 1,008,450 1,008,450 1,008,450 1,008,450 1,008,450 1,008,450 1,008,450 Capital reserves 2,818,526 2,360,463 2,360,463 1,917,975 1,815,568 2,281,833 1,711,501 1,718,327 1,737,451 1,231,163 Revenue reserves 9,397,491 6,206,615 5,848,483 5,611,505 6,237,214 5,564,815 4,400,987 3,984,249 5,033,888 5,060,352 Non-controlling interests 3,078,520 2,136,220 2,061,339 2,174,725 2,354,316 2,029,199 1,722,310 1,398,512 1,663,008 1,683,939 Total equity 16,302,987 11,711,748 11,278,735 10,712,655 11,415,548 10,884,297 8,843,248 8,109,538 9,442,797 8,983,904
Property, plant & equipment 12,193,664 12,359,815 13,279,431 12,275,229 12,645,808 12,275,004 10,610,666 9,414,735 8,706,775 7,504,776 Investment property 2,400 2,400 2,400 13,900 54,147 51,400 51,400 51,400 14,607 98,999 Biological assets 221,125 179,610 208,082 181,028 248,508 226,382 307,728 67,366 86,262 78,737 Deposit on leasehold property - - - - - - - - 16,152 13,678 Capital work-in-progress 21,614 21,260 353,024 382,247 301,036 72,153 353,518 763,412 1,072,154 531,459 Intangible assets 390,480 366,982 384,362 391,938 168,809 137,140 27,683 27,683 147,911 159,017 Investments 1,399,139 1,155,031 1,298,570 1,376,659 1,339,958 945,217 1,457,106 1,449,913 798,468 712,909 Net current assets 4,514,714 713,772 (1,004,411) (785,319) (1,124,166) (1,929,784) (2,084,183) (2,158,904) 261,136 1,237,260
18,743,136 14,798,870 14,521,458 13,835,683 13,634,100 11,777,512 10,723,918 9,615,605 11,103,465 10,336,835
Deferred liabilities (1,333,857) (1,411,812) (1,274,866) (1,280,408) (431,580) 105,275 (773,775) (648,946) (662,939) (701,318)Long-term liabilities (1,106,292) (1,675,310) (1,967,857) (1,842,620) (1,786,972) (998,490) (1,106,895) (857,121) (997,729) (651,613)
16,302,987 11,711,748 11,278,735 10,712,655 11,415,548 10,884,297 8,843,248 8,109,538 9,442,797 8,983,904
Cash Flow StatementNet cash inflow/(outflow) from operating activities 8,117,296 749,221 (1,713,963) 2,236,464 (132,541) (451,359) 1,998,599 2,343,127 (1,001,983) (1,307,519)Net cash inflow/(outflow) from investing activities (1,166,628) 10,456 (1,315,568) (2,368,100) (353,331) (1,436,441) (1,420,071) (1,219,656) (1,499,063) (1,663,267)Net cash inflow/(outflow) from financing activities (1,135,340) (618,235) 227,624 (297,636) (246,839) (2,473,931) 1,261,253 77,112 552,409 (94,104)
Other InformationEarning per share (Rs.) 8.26 2.20 5.10 (4.36) 5.84 14.29 8.04 (10.25) 2.46 9.11 Dividend per share (Rs.) 1.25 0.50 - 1.00 2.00 4.00 3.00 - 1.63 3.20 Net assets per share (Rs.) 34.89 25.26 97.26 90.09 95.61 93.44 75.14 70.81 82.08 77.02 Market capitalisation (Rs. Mn) 18,551.59 3,183.54 3,366.52 5,179.55 7,203.98 8,525.66 6,800.11 4,132.70 5,466.04 8,392.98 Interest cover (No.of times) 6.18 2.10 1.50 1.47 1.73 3.73 3.04 0.29 1.22 2.98 Current ratio (No.of times) 1.21 1.03 0.96 0.96 0.94 0.90 0.86 0.87 1.02 1.08 Dividend cover (No.of times) 6.61 4.39 - - 2.92 3.57 2.68 - 1.51 2.85 Price earnings ratio (No.of times) Ordinary 6.16 15.94 7.55 - 13.71 6.68 9.46 - 26.75 10.49 Non-voting (Class X) 5.13 13.16 5.02 - 10.68 5.00 7.17 - 20.44 7.15

137TIDES OF CHANGE
Re-classified Re-classified Restated Restated Restated2021 2020 2019 2018 2017 2016 2015 2014 2013 2012
SLFRS SLFRS SLFRS SLFRS SLFRS SLFRS SLFRS SLFRS SLFRS SLFRSRs’000 Rs’000 Rs’000 Rs’000 Rs’000 Rs’000 Rs’000 Rs’000 Rs’000 Rs’000
Income StatementTurnover 37,233,343 30,535,563 30,701,977 33,148,257 32,210,546 26,666,284 23,496,259 21,559,839 21,582,348 22,477,151 Operating profit after interest 4,140,439 1,120,813 303,337 (251,921) 852,073 1,117,701 1,005,508 (832,986) 144,176 943,637 Other income 305,125 360,906 202,417 673,963 311,298 534,705 209,971 577,839 133,902 152,888 Share of profit of equity accounted investees 466,488 390,013 394,788 267,053 334,728 362,478 207,636 270,071 291,716 277,896 Profit before tax 4,912,052 1,871,732 900,542 689,095 1,498,099 2,014,884 1,423,115 14,924 605,324 1,374,421 Taxation (975,188) (535,597) (40,428) (491,865) (384,066) (366,777) (397,697) (72,047) (174,818) (353,890)Profit for the year from continuing operations 3,936,864 1,336,135 860,114 197,230 1,114,033 1,648,107 1,025,418 (57,123) 430,506 1,020,531 Profit/(loss) for the year from discontinued operations (90,771) (256,735) (402,784) (575,123) (227,116) (14,273) 15,425 (1,069,716) (246,530) - Non-controlling interest 713,682 246,816 (25,909) 35,182 333,419 279,542 278,916 (155,126) (49,339) 157,447 Profit attributable to equity holders of the Company 3,132,411 832,584 483,239 (413,075) 553,498 1,354,292 761,927 (971,713) 233,315 863,084
Statement of Financial PositionStated capital 1,008,450 1,008,450 1,008,450 1,008,450 1,008,450 1,008,450 1,008,450 1,008,450 1,008,450 1,008,450 Capital reserves 2,818,526 2,360,463 2,360,463 1,917,975 1,815,568 2,281,833 1,711,501 1,718,327 1,737,451 1,231,163 Revenue reserves 9,397,491 6,206,615 5,848,483 5,611,505 6,237,214 5,564,815 4,400,987 3,984,249 5,033,888 5,060,352 Non-controlling interests 3,078,520 2,136,220 2,061,339 2,174,725 2,354,316 2,029,199 1,722,310 1,398,512 1,663,008 1,683,939 Total equity 16,302,987 11,711,748 11,278,735 10,712,655 11,415,548 10,884,297 8,843,248 8,109,538 9,442,797 8,983,904
Property, plant & equipment 12,193,664 12,359,815 13,279,431 12,275,229 12,645,808 12,275,004 10,610,666 9,414,735 8,706,775 7,504,776 Investment property 2,400 2,400 2,400 13,900 54,147 51,400 51,400 51,400 14,607 98,999 Biological assets 221,125 179,610 208,082 181,028 248,508 226,382 307,728 67,366 86,262 78,737 Deposit on leasehold property - - - - - - - - 16,152 13,678 Capital work-in-progress 21,614 21,260 353,024 382,247 301,036 72,153 353,518 763,412 1,072,154 531,459 Intangible assets 390,480 366,982 384,362 391,938 168,809 137,140 27,683 27,683 147,911 159,017 Investments 1,399,139 1,155,031 1,298,570 1,376,659 1,339,958 945,217 1,457,106 1,449,913 798,468 712,909 Net current assets 4,514,714 713,772 (1,004,411) (785,319) (1,124,166) (1,929,784) (2,084,183) (2,158,904) 261,136 1,237,260
18,743,136 14,798,870 14,521,458 13,835,683 13,634,100 11,777,512 10,723,918 9,615,605 11,103,465 10,336,835
Deferred liabilities (1,333,857) (1,411,812) (1,274,866) (1,280,408) (431,580) 105,275 (773,775) (648,946) (662,939) (701,318)Long-term liabilities (1,106,292) (1,675,310) (1,967,857) (1,842,620) (1,786,972) (998,490) (1,106,895) (857,121) (997,729) (651,613)
16,302,987 11,711,748 11,278,735 10,712,655 11,415,548 10,884,297 8,843,248 8,109,538 9,442,797 8,983,904
Cash Flow StatementNet cash inflow/(outflow) from operating activities 8,117,296 749,221 (1,713,963) 2,236,464 (132,541) (451,359) 1,998,599 2,343,127 (1,001,983) (1,307,519)Net cash inflow/(outflow) from investing activities (1,166,628) 10,456 (1,315,568) (2,368,100) (353,331) (1,436,441) (1,420,071) (1,219,656) (1,499,063) (1,663,267)Net cash inflow/(outflow) from financing activities (1,135,340) (618,235) 227,624 (297,636) (246,839) (2,473,931) 1,261,253 77,112 552,409 (94,104)
Other InformationEarning per share (Rs.) 8.26 2.20 5.10 (4.36) 5.84 14.29 8.04 (10.25) 2.46 9.11 Dividend per share (Rs.) 1.25 0.50 - 1.00 2.00 4.00 3.00 - 1.63 3.20 Net assets per share (Rs.) 34.89 25.26 97.26 90.09 95.61 93.44 75.14 70.81 82.08 77.02 Market capitalisation (Rs. Mn) 18,551.59 3,183.54 3,366.52 5,179.55 7,203.98 8,525.66 6,800.11 4,132.70 5,466.04 8,392.98 Interest cover (No.of times) 6.18 2.10 1.50 1.47 1.73 3.73 3.04 0.29 1.22 2.98 Current ratio (No.of times) 1.21 1.03 0.96 0.96 0.94 0.90 0.86 0.87 1.02 1.08 Dividend cover (No.of times) 6.61 4.39 - - 2.92 3.57 2.68 - 1.51 2.85 Price earnings ratio (No.of times) Ordinary 6.16 15.94 7.55 - 13.71 6.68 9.46 - 26.75 10.49 Non-voting (Class X) 5.13 13.16 5.02 - 10.68 5.00 7.17 - 20.44 7.15

CIC HOLDINGS PLC Annual Report 2020/21138
NOTES

139TIDES OF CHANGE

CIC HOLDINGS PLC Annual Report 2020/21140
NOTICE OF MEETING
NOTICE IS HEREBY GIVEN THAT the Fifty Eighth Annual General Meeting of CIC Holdings PLC will be held by way of audio visual means on Wednesday the 30th day of June 2021 at 9.00 a.m. centered from the Company’s Registered Office at 199, Kew Road, Colombo 2 for the following purposes;
AGENDA1. To receive and adopt the Statements of
Accounts of the Company and of the Group for the year ended 31st March 2021 together with the Reports of the Directors and Auditors thereon.
2. To declare a dividend
3. To re-elect Mr. J. R. Gunaratne who retires in terms of Article 25(2) of the Articles of Association of the Company.
4. To re-elect Mr. D. T. S. H. Mudalige who retires in terms of Article 25(2) of the Articles of Association of the Company
5. To re-elect Mr. R. S. Captain who retires in terms of Article 25(6) of the Articles of Association of the Company
6. To re-elect Mr. M. P. Jayawardena who retires in terms of Article 25(6) of the Articles of Association of the Company
7. To vote a sum as donations.
8. To re-appoint M/s. KPMG, Chartered Accountants as Auditors of the Company and to authorise the Directors to determine their remuneration.
By order of the Board of,CIC HOLDINGS PLC
Shermal FernandoCompany Secretary
21st May 2021
Notes:
• A Member entitled to attend through the online platform and vote at the meeting is entitled to appoint a proxy to virtually participate and vote in his/her place in the manner provided for by completing the form of proxy
• A proxy need not be a Member of the Company.
• The Board of Directors, having taken note of the health and safety guidelines issued by Health Authorities in view of the Covid- 19 pandemic and the Colombo Stock Exchange issuing guidelines to listed entities to hold Shareholder Meetings virtually, has decided to hold the Annual General Meeting (AGM) through Audio or Audio/Visual means in conformity with the regulatory provisions of the Company.
• Shareholders who wish to participate in the Annual General Meeting through the online platform are kindly requested to complete and forward the Annexure 1- Registration of Shareholder Information to the email address [email protected] with the email subject titled “CIC AGM 2021” or post it to the registered address of the Company to be received not less than 3 days before the date of the meeting.
Shareholders are requested to provide their email address in the space provided in Annexure 1 to enable us to forward the web link so that they may participate in the meeting through the online platform.
• The Chairman and certain members of the Board and key officials essential for the administration of formalities and conduct the meeting will be physically present at the Registered Office.
• Voting on the items listed in the Agenda will be registered via the online platform or a designated ancillary online application. All such procedures will be explained to the shareholders prior to the commencement of the meeting.
• Shareholders who wish to appoint a member of the Board of Directors as his/ her proxy to represent them at the AGM may do so by completing the Form of Proxy. In such event the email address of the proxyholder will not be required.
• Shareholders may send their questions/ comments on the items listed in the Agenda of the Notice convening the AGM by email to [email protected] or by post to the Company Secretary, 199, Kew Road, Colombo 2 to be received not less than 3 days before the date of the meeting.
• The instrument appointing a proxy should be deposited at the Registered Office of the Company at 199, Kew Road, Colombo 02 or scanned and emailed to [email protected] not less than 48 hours before the date of the meeting.
• Only registered shareholders and registered proxy holders will be permitted to log in and participate in the AGM on- line.
• The date fixed for the AGM will not be affected even if a public holiday is declared on such a date since arrangements will be in place to proceed via online platform.

141TIDES OF CHANGE
FORM OF PROXYAnnual General MeetingI/We ..............................................................................................................................................................................................................................................
of .........................................................................................................................................................................................................................................being
a member/members of CIC Holdings PLC hereby appoint;
Shiran Harsha Amarasekera of Colombo or failing him
Shermal Fernando of Colombo or failing him
Rusi Sohli Captain of Colombo or failing him
Steven Mark Enderby of Colombo or failing him
Jitendra Romesh Gunaratne of Colombo or failing him
Mahinda Preethiraj Jayawardena of Colombo or failing him
Don Tiburtius Sujeewa Handapangoda Mudalige of Colombo or failing him
Prawira Rimoe Saldin of Colombo or failing him
.......................................................................................................................................................................................................................................................as *my/our Proxy to *speak and/to vote for *me/us on *my/our behalf at the Fifty Eighth Annual General Meeting of CIC Holdings PLC to be held as an online meeting on Wednesday the 30th June 2021 at 9.00 a.m. and at any adjournment thereof.
...................................... ......................................Date Signature
* Note: Please delete inappropriate words.
Instructions as to Completion1. Kindly perfect the Form of Proxy after filling in legibly your full name and address and by signing in the space provided. Please fill in the date of
signature.
2. A Shareholder entitled to attend and vote at the Meeting is entitled to appoint a Proxy to attend and vote instead of him/her. A shareholder who appoints a Director as his/her proxy to represent him/her need not fill the email address of the proxy holder.
3. In the case of Corporate Shareholder, the Form of Proxy must be completed under the Common Seal, which should be affixed and attested in the manner prescribed by the Articles of Association.
4. If the Form of Proxy is signed by an attorney, the relevant Power of Attorney should also accompany the completed Form of Proxy.
5. The completed Form of Proxy should either be;
(i) addressed to the “Company Secretary” and posted or hand delivered to the registered office of the Company; CIC House, No.199, Kew Road, Colombo 2;
or
(ii) scanned and emailed to the email address: “[email protected]” with the email subject titled “Proxy – CIC Holdings PLC” not less than 48 hours before the time appointed for the holding of the AGM, together with the following information.
CDS Account Number of the Shareholder(s)
Shareholder’s contact number/s
Email address to which the online link should be forwarded to for the proxy holder’s participation at the AGM
Proxy holder’s NIC number
CIC House, 199, Kew Road, Colombo 2

CIC HOLDINGS PLC Annual Report 2020/21142

143TIDES OF CHANGE
FORM OF PROXYAnnual General Meeting - Non-Voting (Class X) SharesI/We ..............................................................................................................................................................................................................................................
of .........................................................................................................................................................................................................................................being
a member/members of CIC Holdings PLC hereby appoint;
Shiran Harsha Amarasekera of Colombo or failing him
Shermal Fernando of Colombo or failing him
Rusi Sohli Captain of Colombo or failing him
Steven Mark Enderby of Colombo or failing him
Jitendra Romesh Gunaratne of Colombo or failing him
Mahinda Preethiraj Jayawardena of Colombo or failing him
Don Tiburtius Sujeewa Handapangoda Mudalige of Colombo or failing him
Prawira Rimoe Saldin of Colombo or failing him
.......................................................................................................................................................................................................................................................as *my/our Proxy to *speak for *me/us on *my/our behalf at the Fifty Eighth Annual General Meeting of CIC Holdings PLC to be held as an online meeting on Wednesday the 30th June 2021 at 9.00 a.m. and at any adjournment thereof.
...................................... ......................................Date Signature
* Note: Please delete inappropriate words.
Instructions as to Completion1. Kindly perfect the Form of Proxy after filling in legibly your full name and address and by signing in the space provided. Please fill in the date of
signature.
2. A Shareholder entitled to attend and vote at the Meeting is entitled to appoint a Proxy to attend and vote instead of him/her. A shareholder who appoints a Director as his/her proxy to represent him/her need not fill the email address of the proxy holder.
3. In the case of Corporate Shareholder, the Form of Proxy must be completed under the Common Seal, which should be affixed and attested in the manner prescribed by the Articles of Association.
4. If the Form of Proxy is signed by an attorney, the relevant Power of Attorney should also accompany the completed Form of Proxy.
5. The completed Form of Proxy should either be;
(i) addressed to the “Company Secretary” and posted or hand delivered to the registered office of the Company; CIC House, No.199, Kew Road, Colombo 2;
or
(ii) scanned and emailed to the email address: “[email protected]” with the email subject titled “Proxy – CIC Holdings PLC” not less than 48 hours before the time appointed for the holding of the AGM, together with the following information.
CDS Account Number of the Shareholder(s)
Shareholder’s contact number/s
Email address to which the online link should be forwarded to for the proxy holder’s participation at the AGM
Proxy holder’s NIC number
CIC House, 199, Kew Road, Colombo 2

CIC HOLDINGS PLC Annual Report 2020/21144

Designed & produced by
Digital Plates & Printing bySoftwave Printing and Publishing (Pvt) Ltd
NAME OF THE COMPANYCIC Holdings PLC
COMPANY REGISTRATION NO.PQ 88
LEGAL FORMA Public Quoted Company with limitedliability incorporated in Sri Lanka in 1964.Re-registered under the CompaniesAct No. 07 of 2007 on 21st November 2007.
REGISTERED OFFICE199, Kew Road, Colombo 2.
DIRECTORSS. H. Amarasekera (Chairman)S. Fernando (COO)R. S. CaptainS. M. EnderbyJ. R . GunaratneM. P. JayawardenaD. T. S. H MudaligeP. R. Saldin
COMPANY SECRETARYS. Fernando
AUDITORSKPMGChartered Accountants32A, Sir Mohamed MacanMarkar Mawatha, Colombo 3.
BANKERSBank of CeylonCommercial Bank of Ceylon PLCDFCC BankHatton National Bank PLCNDB Bank PLCNations Trust Bank PLCPeople’s BankSampath Bank PLCSeylan Bank PLCStandard Chartered Bank
CORPORATEINFORMATION
LEGAL ADVISERSNithya PartnersAttorneys-at-Law97A, Galle Road, Colombo 3.
Julius & CreasyAttorneys-at-Law371, R A De Mel Mawatha, Colombo 03
EXECUTIVE DIRECTORSS. Fernando (COO)
NON-EXECUTIVE DIRECTORSS. H. Amarasekera (Chairman)R. S. CaptainS. M. EnderbyJ. R . GunaratneM. P. JayawardenaD. T. S. H MudaligeP. R. Saldin
AUDIT COMMITTEEP. R. Saldin (Chairman)S. M. EnderbyM. P. JayawardenaD. T. S. H Mudalige
HUMAN CAPITAL & COMPENSATION COMMITTEEP. R. Saldin (Chairman)S. H. AmarasekeraR. S. CaptainS. M. EnderbyM. P. Jayawardena
NOMINATIONS COMMITTEES. H. Amarasekera (Chairman)R. S. CaptainP. R. Saldin
RELATED PARTY TRANSACTIONSREVIEW COMMITTEEM. P. Jayawardena (Chairman)S. M. Enderby

CIC Holdings PLC199, Kew Road, Colombo 2, Sri lankawww.cic.lk