Embed Size (px)
Citation preview

Journal of Hydrology 416–417 (2012) 28–38
Contents lists available at SciVerse ScienceDirect
Journal of Hydrology
journal homepage: www.elsevier .com/locate / jhydrol
Tidal pumping of water between Bahamian blue holes, aquifers, and the ocean
Jonathan B. Martin ⇑, Jason Gulley 1, Patricia SpellmanDepartment of Geological Sciences, University of Florida, Gainesville, FL 32611-2120, United States
a r t i c l e i n f o s u m m a r y
Article history:Received 25 April 2011Received in revised form 21 October 2011Accepted 16 November 2011Available online 25 November 2011This manuscript was handled by PhilippeBaveye, Editor-in-Chief
Keywords:Blue holesCenotesBahamasCarbonate platformsTidal pumpingEogenetic karst
0022-1694/$ - see front matter � 2011 Elsevier B.V. Adoi:10.1016/j.jhydrol.2011.11.033
⇑ Corresponding author. Tel.: +1 352 392 6219.E-mail address: [email protected] (J.B. Martin).
1 Present address: The University of Texas InstituResearch Campus, Bldg. 196, 10100 Burnet Rd. (R22United States.
Exchange of water between conduits and aquifers occurs in many continental karst settings becauseallogenic recharge from confined catchments causes hydraulic heads in conduits to increase faster thanin the aquifer. Most modern carbonate platforms lack allogenic catchments, allowing rainfall to rechargethe aquifer uniformly without sufficiently altering head gradients to drive exchange between conduitsand aquifers. Some modern carbonate platforms experience tidal variations which could lead to head gra-dients that drive exchange. To determine the impact of tides on exchange, we measured water elevationsat high temporal resolution in the ocean, blue holes and wells on San Salvador Island and Rum Cay,Bahamas. Dampened tidal amplitudes inland indicate diffusivity values (transmissivity/storativity) atwells were around 1.3 � 106 m2/day and at blue holes were around 76.9 � 106 m2/day, assuming damp-ening results only from head loss. These diffusivity values were used to estimate hydraulic conductivityvalues of around 4.0–294 � 104 m/day although they may be lower if the aquifer thickness is greater thanthe estimated 10 m. We assume wells provide values representing greater influence of matrix permeabil-ity than values from blue holes, which represent a greater influence of conduit permeability. Differencesin permeability drive exchange because hydraulic head in the aquifer lags the head in the conduits andblue hole through a tidal cycle. If negligible head loss occurs with flow through conduits, as reflected inlag times less than 10 min, then differences in elevation at the blue holes and the ocean may representexchange of water between the blue hole and matrix porosity. With this assumption, about 0.9 m3 ofwater is exchanged per half tidal cycle, or about 1% of the complete change in volume of water in the bluehole per half tidal cycle. This volume represents an average penetration into the aquifer of 6–8 mmalthough it could be further in zones with elevated permeability. Exchange is reflected in systematicchanges in specific conductivity and pH between high and low tide and the pH changes reflect reactionwith the surrounding aquifer material. Since exchange occurs twice daily, cumulative alteration of aqui-fer porosity could be large. Tidal exchange should decrease away from the coast on large carbonate plat-forms so that tidally driven alteration will be enhanced at the rims over interior of carbonate platforms.
� 2011 Elsevier B.V. All rights reserved.
1. Introduction
Carbonate banks and islands are characterized by complexhydrogeology (e.g., Vacher and Quinn, 1997), which stems fromthe lack of organized surface drainage, water compositions thatvary from fresh to hypersaline, a wide range of water densities,and rapid diagenetic alteration of aquifer rocks. Alteration formspore volumes that range from microscopic to cavernous andhydraulic conductivities that vary between 10�1 and 106 m/dayand (e.g., Oberdorfer et al., 1990; Whitaker and Smart, 1997b).Young carbonate platforms (referred to as eogenetic karst, Vacherand Mylroie, 2002) may retain primary porosity in the matrix rocks
ll rights reserved.
te for Geophysics, JJ Pickle00), Austin, TX 78758-4445,
because they have not been fully cemented during burial. In largecarbonate platforms subject to wet climates, such as the YucatanPeninsula, fluxes of fresh water form integrated networks of con-duits that efficiently discharge water from the matrix porosity onregional scales (Smart et al., 2006). Cavernous porosity also formson small platforms that experience drier climates, but this porositymost frequently occurs as isolated macroporous voids (e.g., flankmargin caves, Mylroie and Carew, 1990), which only locally influ-ence flow paths within the matrix. Small platforms may also con-tain zones of elevated permeability that could affect flow, as shownby tidal amplitudes on inland lakes and blue holes, but may be toosmall to be traversed by humans.
In continental settings, conduits can receive large volumes ofallogenic recharge as precipitation drains from catchments formedon confining units. This drainage causes hydraulic heads to in-crease more rapidly in conduits than in the aquifer and driveswater into the aquifer matrix porosity (Martin and Dean, 2001;Moore et al., 2009; Gulley et al., 2011). Gradients reverse during
J.B. Martin et al. / Journal of Hydrology 416–417 (2012) 28–38 29
flood recession, allowing water to drain back to the conduits andultimately to the surface. Modern carbonate platforms commonlylack confining units to focus allogenic water into the aquifers(although see for example, Ayers and Vacher, 1986; Vacher and Myl-roie, 2002), and recharge generally flows directly and diffusely to theaquifer. Because recharge is uniformly distributed, allogenic re-charge cannot increase hydraulic head in conduits faster than headsin the matrix porosity to drive exchange. Consequently, little workhas been done to estimate the exchange of water between conduits,zones of elevated permeability, and matrix porosity on carbonateplatforms. Carbonate platforms experience tidal fluctuations, whichdecrease with distance from the ocean, but could be sufficientlylarge to drive exchange (e.g., Ferris, 1951; Townley, 1995). Head dif-ferences between the ocean, conduits, and matrix porosity mayestablish gradients that could facilitate exchange between conduitsand matrix. Since tidally driven exchange would occur once or twiceper day, its cumulative effects might be capable of extensive ex-change between the conduits and matrix porosity with associatedinfluence over diagenetic alteration of the platforms.
The exchange of water between conduits or other higher per-meability zones and the aquifer matrix has important implicationsfor the diagenetic alteration of aquifers through cementation anddissolution. Dissolution of unstable minerals such as aragonitecan drive precipitation of more stable minerals such as calcite,thereby redistributing solid phase material, and creating macrop-ores while retaining the bulk porosity (e.g., Budd, 1988). Cementa-tion can form confining layers with reduced permeabilitycompared to the remainder of the aquifer (Ayers and Vacher,1986; Vacher and Mylroie, 2002). Dissolution results when the re-charged water is undersaturated with respect to carbonate miner-als (e.g., Moore et al., 2010), for example when organic matter isoxidized by microbes using dissolved oxygen or sulfate to producecarbonic and sulfuric acids (e.g., Bottrell et al., 1990; Stoessell et al.,2002; Whitaker and Smart, 2007a, 2007b; Moore, 2009; McGeeet al., 2010). Undersaturation also may result from mixing of waterwith different chemical compositions (mixing corrosion, e.g.,Runnells, 1969; Wigley and Plummer, 1976; Mylroie and Carew,1995), though the importance of mixing corrosion has been ques-tioned (e.g., Whitaker and Smart, 1997b; Melim et al., 2002; Mooreet al., 2010). Mixing corrosion may be focused at tops and bottomsof fresh water lenses, where vadose infiltration mixes with lenswater and lens water mixes with underlying saltwater, respec-tively (Cant and Weech, 1986). Dispersion between salt and freshwater forms a halocline of variable thickness, which depends onthe size of islands and permeability of aquifer rocks (Whitakerand Smart, 1997b). Tidal pumping may expand mixing zones aswell as increase dispersion of undersaturated water resulting fromoxidation of organic matter.
Water-filled vertical depressions, which are referred to as blueholes or black holes in the Bahamas and cenotes in the YucatanPeninsula, form by dissolution and/or conduit collapse (Mylroieet al., 1995; Perry et al., 1995; Schwabe and Herbert, 2004). Manyblue holes are density stratified and particulate organic carbonaccumulates at the density interface (Bottrell et al., 1990; Stoessellet al., 2002), which when oxidized could dissolve aquifer rocks ifwater exchanges between the blue hole and aquifer. Exchange ofwater occurs between blue holes and the matrix along a bank mar-gin fracture along the coast of Andros Island, Bahamas (Stringfieldand LeGrand, 1971; Whitaker and Smart, 1997a). These conduitsreverse flow through a tidal cycle, resulting in the discharge offresh water to the ocean during ebbing tides and inflow of saltwa-ter to the aquifer during flooding tides. Based on lags in tidal cyclesbetween the blue holes and the ocean, mixed water was estimatedto be injected into the aquifer a distance of up to 200 m around thefracture system creating a halo of diagenetically altered rock (Whi-taker and Smart, 1997a).
Profiles of chemical composition in the water column of blueholes and cenotes have been used previously to estimate water–rockreactions and hydraulic parameters (e.g., Stoessell, 1995; Whitakerand Smart, 1997a; Beddows et al., 2007) and variations in headresulting from tidal fluctuations have been used to estimate hydrau-lic parameters (e.g., Stringfield and LeGrand, 1971). No geochemicalobservations have been conducted at tidal time scales or madesequentially through numerous tidal cycles. In this paper, we pres-ent measurements of water levels and limited chemical data (spe-cific conductivity, dissolved oxygen concentrations, and pH) thatwere collected at high spatial and temporal resolution over severaltidal cycles from blue holes on San Salvador Island and Rum Cay,Bahamas using logging environmental sensors. The data provideestimates of aquifer properties, provide constraints on how tidalpumping affects exchange between the ocean, blue holes, and theaquifer, and reflect diagenetic alteration of the aquifer rocks.
2. Field areas
San Salvador Island and Rum Cay are located in the southeast-ern Bahamas on two small individual carbonate platforms, whichare covered almost entirely by the islands (Fig. 1). Both islandshave numerous outcrops and multiple water-filled blue holes andlakes. The exposed rocks on both islands fit the stratigraphy pro-posed by Carew and Mylroie (1995). This stratigraphy splits theoriginally defined Lucayan Limestone (Beach and Ginsburg, 1980)into three separate formations: the Holocene Rice Bay Formation,the Pleistocene Grotto Beach (Marine Isotope Stage (MIS) 5e) andOwl’s Hole (pre-MIS5e) formations. These formations are sepa-rated by terra rossa paleosols that were deposited when the topsof the platforms were exposed during interglacial times. Exposureled to dissolution and reprecipitation of the original detrital car-bonate minerals during the conversion from aragonite to calcite,with an associated increase in the bulk permeability of the rock(e.g., Vacher, 1988; Vacher and Wallis, 1992). San Salvador Islandand Rum Cay contain numerous flank margin caves that formedduring MIS5e and do not greatly influence groundwater flow(e.g., Mylroie and Carew, 1990). Tidal fluctuations in lakes and blueholes in the interior of the islands suggest there may be conduitconnections with the ocean (Davis and Johnson, 1989).
The two islands are separated by about 30 km and, despite shar-ing similar climates, have differing amounts of surface water. Morethan half of the surface of San Salvador Island is covered by hypersa-line lakes in swales between dune ridges. The dunes contain freshwater lenses that drain to the lakes (Davis and Johnson, 1989). Incontrast, few dunes occur on Rum Cay, and consequently, it containsfew lakes (Fig. 1). Geomorphologic differences between the two is-lands could result from their orientations (Martin and Gulley,2010). The main axis of San Salvador is oriented north–south, per-pendicular to the trade winds, which allowed development of dunesand associated lakes. In contrast, Rum Cay is oriented parallel to thetrade winds and thus dunes are found only along the northeasternand southwestern coasts. Most of the interior of Rum Cay was clas-sified as being deposited in a large tidal creek system during MIS5e(Mitchell, 1987). This tidal creek system resulted in flat topographythroughout the interior of the island, which is now slightly above sealevel (Fig. 1). Surface water is confined mostly to small (1–2 m diam-eter) dissolution features that intersect the groundwater table,although a few larger (tens of m) blue holes are present.
3. Methods
Data were collected during two sampling trips, one to both SanSalvador Island and Rum Cay between April 22 and May 1, 2010and the other to San Salvador Island between June 15 and June
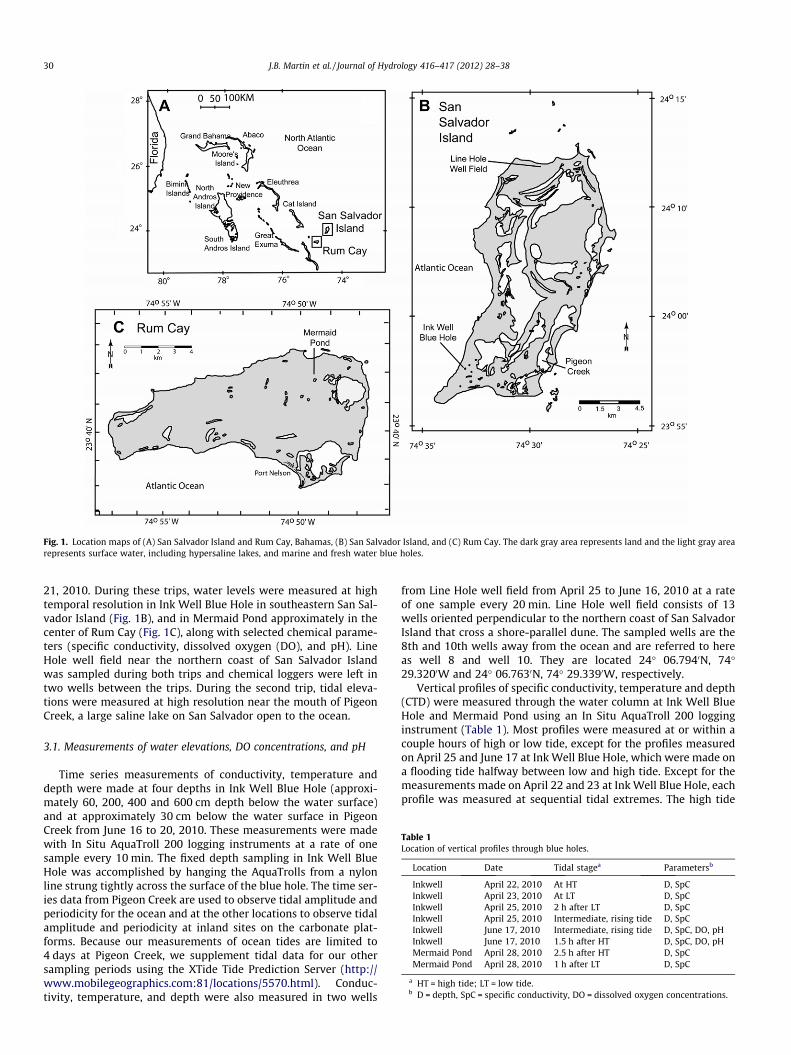
Fig. 1. Location maps of (A) San Salvador Island and Rum Cay, Bahamas, (B) San Salvador Island, and (C) Rum Cay. The dark gray area represents land and the light gray arearepresents surface water, including hypersaline lakes, and marine and fresh water blue holes.
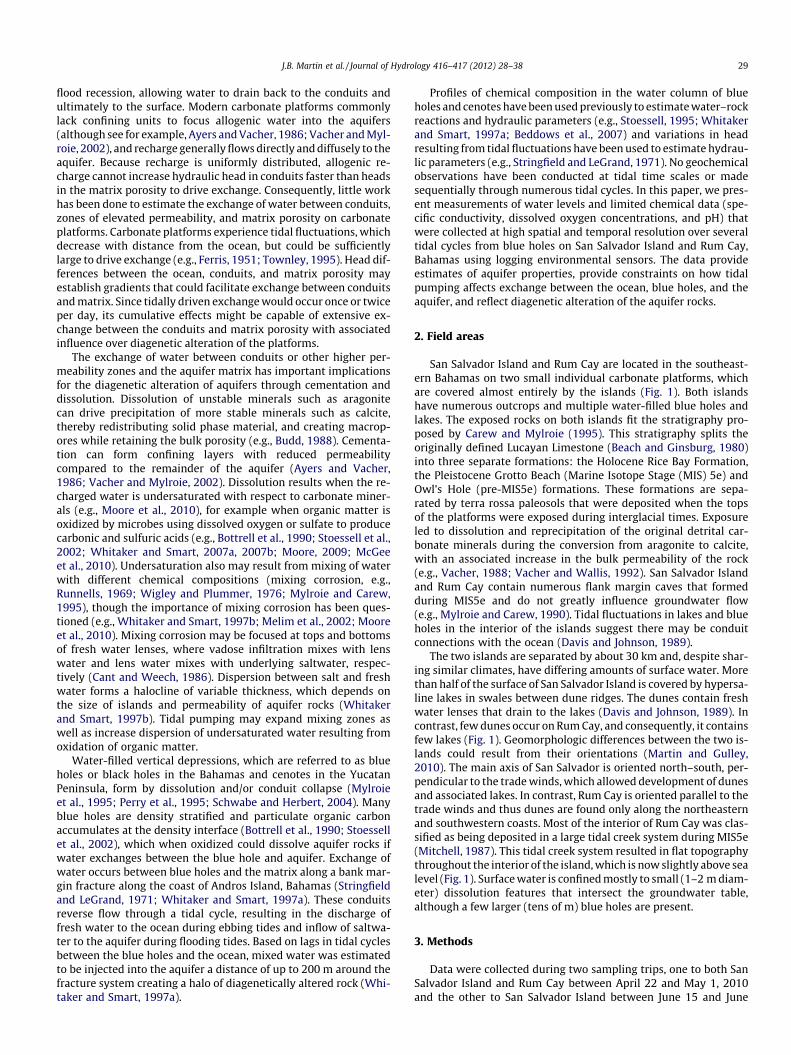
Table 1Location of vertical profiles through blue holes.
Location Date Tidal stagea Parametersb
Inkwell April 22, 2010 At HT D, SpCInkwell April 23, 2010 At LT D, SpCInkwell April 25, 2010 2 h after LT D, SpCInkwell April 25, 2010 Intermediate, rising tide D, SpCInkwell June 17, 2010 Intermediate, rising tide D, SpC, DO, pHInkwell June 17, 2010 1.5 h after HT D, SpC, DO, pHMermaid Pond April 28, 2010 2.5 h after HT D, SpCMermaid Pond April 28, 2010 1 h after LT D, SpC
a HT = high tide; LT = low tide.b D = depth, SpC = specific conductivity, DO = dissolved oxygen concentrations.
30 J.B. Martin et al. / Journal of Hydrology 416–417 (2012) 28–38
21, 2010. During these trips, water levels were measured at hightemporal resolution in Ink Well Blue Hole in southeastern San Sal-vador Island (Fig. 1B), and in Mermaid Pond approximately in thecenter of Rum Cay (Fig. 1C), along with selected chemical parame-ters (specific conductivity, dissolved oxygen (DO), and pH). LineHole well field near the northern coast of San Salvador Islandwas sampled during both trips and chemical loggers were left intwo wells between the trips. During the second trip, tidal eleva-tions were measured at high resolution near the mouth of PigeonCreek, a large saline lake on San Salvador open to the ocean.
3.1. Measurements of water elevations, DO concentrations, and pH
Time series measurements of conductivity, temperature anddepth were made at four depths in Ink Well Blue Hole (approxi-mately 60, 200, 400 and 600 cm depth below the water surface)and at approximately 30 cm below the water surface in PigeonCreek from June 16 to 20, 2010. These measurements were madewith In Situ AquaTroll 200 logging instruments at a rate of onesample every 10 min. The fixed depth sampling in Ink Well BlueHole was accomplished by hanging the AquaTrolls from a nylonline strung tightly across the surface of the blue hole. The time ser-ies data from Pigeon Creek are used to observe tidal amplitude andperiodicity for the ocean and at the other locations to observe tidalamplitude and periodicity at inland sites on the carbonate plat-forms. Because our measurements of ocean tides are limited to4 days at Pigeon Creek, we supplement tidal data for our othersampling periods using the XTide Tide Prediction Server (http://www.mobilegeographics.com:81/locations/5570.html). Conduc-tivity, temperature, and depth were also measured in two wells
from Line Hole well field from April 25 to June 16, 2010 at a rateof one sample every 20 min. Line Hole well field consists of 13wells oriented perpendicular to the northern coast of San SalvadorIsland that cross a shore-parallel dune. The sampled wells are the8th and 10th wells away from the ocean and are referred to hereas well 8 and well 10. They are located 24� 06.7940N, 74�29.3200W and 24� 06.7630N, 74� 29.3390W, respectively.
Vertical profiles of specific conductivity, temperature and depth(CTD) were measured through the water column at Ink Well BlueHole and Mermaid Pond using an In Situ AquaTroll 200 logginginstrument (Table 1). Most profiles were measured at or within acouple hours of high or low tide, except for the profiles measuredon April 25 and June 17 at Ink Well Blue Hole, which were made ona flooding tide halfway between low and high tide. Except for themeasurements made on April 22 and 23 at Ink Well Blue Hole, eachprofile was measured at sequential tidal extremes. The high tide
Fig. 2. Comparison of frequency of tides measured in Pigeon Creek with tidespredicted from XTide Tide Prediction Server. Points represent the time (days) sincethe first low tide measured in Pigeon Creek.
J.B. Martin et al. / Journal of Hydrology 416–417 (2012) 28–38 31
profile measured on April 22 was separated by intervening low andhigh tides before the low tide profile was measured on April 23(Table 1). The profiles were measured from a raft floated to approx-imately the center of the blue holes. No bathymetric maps areavailable of the blue holes, but several soundings were made inan attempt to locate their greatest depth. During the April 2010sampling time, the raft was not attached to shore and its positionwas maintained by paddling the water. These samples may havevariations within and between profiles caused by lateral motionof the raft. During the June sampling, the raft was attached tothe nylon line used to hang the AquaTrolls and thus both profileswere collected at identical locations in the blue hole.
Profiles were measured by manually lowering the AquaTrollsthrough the water column. The sampling rate was set to one mea-surement per minute, which is their fastest logging rate. Measure-ments were made at increments of approximately 30 cm duringthe April sampling trip and approximately 20 cm during the Junesampling trip, although plotted depths are derived from the loggerdata. The loggers were held at each depth for 1 min to ensureequilibration of the instrument with the ambient characteristics.Depth profiles of DO concentrations and pH were measured atInk Well Blue Hole at high and low tide using an YSI model 6920logging instrument with an attached Schlumberger CTD-diverused to measure depth. The sampling rate was 10 s, the depthincrements were approximately 20 cm, and measurements werefor 1–2 min at each depth. All values were averaged at eachdepth, but there was little difference within each depth intervalindicating that equilibration from one depth to the next is rapid.Depth was measured relative to the water surface, profiles werecorrected to an arbitrary benchmark 1 m above mean low lowwater (MLLW).
3.2. Estimates of aquifer diffusivity
Aquifer diffusivity, the ratio of aquifer transmissivity to aquiferstorage coefficient, can be estimated through comparison of the lagin tidal phase, L, described by
L ¼ Rh � Fh ð1Þ
where Rh is the phase of the tidal response in the inland site, forexample a well or blue hole and Fh is the phase of the forcingat the tidal boundary, for example the shoreline. Aquifer diffusiv-ity can also be derived from the decrease in the amplitude ofthe tidal height, which is described by the tidal efficiency, E,defined by
E ¼ Ra
Fað2Þ
where Fa is the amplitude of the forcing at the tidal boundary, forexample the shoreline, and Ra is the response at the inland site,for example a well or blue hole (Ferris, 1951; Townley, 1995). Thegoverning equation for 1D transient groundwater flow with tidalboundary conditions is
@2h@x2 ¼
ST@h@t
ð3aÞ
with boundary condition
hð0; tÞ ¼ Ha cosðxt � HhÞ ð3bÞ
where x is the horizontal distance from the shoreline to the inlandlocation, S is aquifer storage coefficient, T is the aquifer transmis-sivity, h is the water elevation, t is time, Ha is the amplitude ofthe tidal fluctuation at the shoreline, x is the tidal frequencyand Hh is the phase measured in radians. An analytical solutionto Eq. (3) provides expressions for E and L (Ferris, 1951; Townley,1995)
E ¼ e�xffiffiffipSTP
pð4aÞ
L ¼ x
ffiffiffiffiffiffiffiffiffiSP
4pT
rð4 bÞ
where P is the tidal period, which for these islands is about0.52 days. These solutions can be rearranged into expressions foraquifer diffusivity in terms of the tidal efficiency and lag:
TS¼ px2
ðlnEÞ2Pð5aÞ
TS¼ x2P
4pL2 ð5 bÞ
We use these equations below to estimate the aquifer diffusiv-ity based on measured tidal data at the blue holes, wells and theocean.
4. Results
4.1. Tidal variations
We assess the compatibility of the two sources of tidal data bycomparing the time from high and low tides measured in PigeonCreek to the time of the corresponding high and low tide providedby the XTide Tide Prediction Server (Fig. 2). Times are consistentbetween the two measurements over the seven tidal cycles thatwe measured at Pigeon Creek, indicating that these data may beused interchangeably. The average difference for the time of thehigh and low tides for the two measurements is about 20 min, witha standard deviation of about 17 min.
Ink Well Blue Hole shows tidal periodicity in both its water le-vel and the specific conductivity of water at fixed depths withinwater column from about 1500 h on June 16, 2010 through around1400 h on June 20, 2010 (Fig. 3). The amplitude and periodicity ofthe tidal variations at Ink Well Blue Hole appear similar to theamplitude and periodicity of tidal variations at Pigeon Creek(Fig. 3B). This inference is supported by cross correlations of the ti-dal frequencies at Pigeon Creek and Ink Well Blue Hole, whichshow that tidal frequencies are identical within a 10 min lag atthe blue hole and Pigeon Creek (Fig. 4). This lag is smaller thanthe sampling rate used to measure the water elevations at thetwo locations.
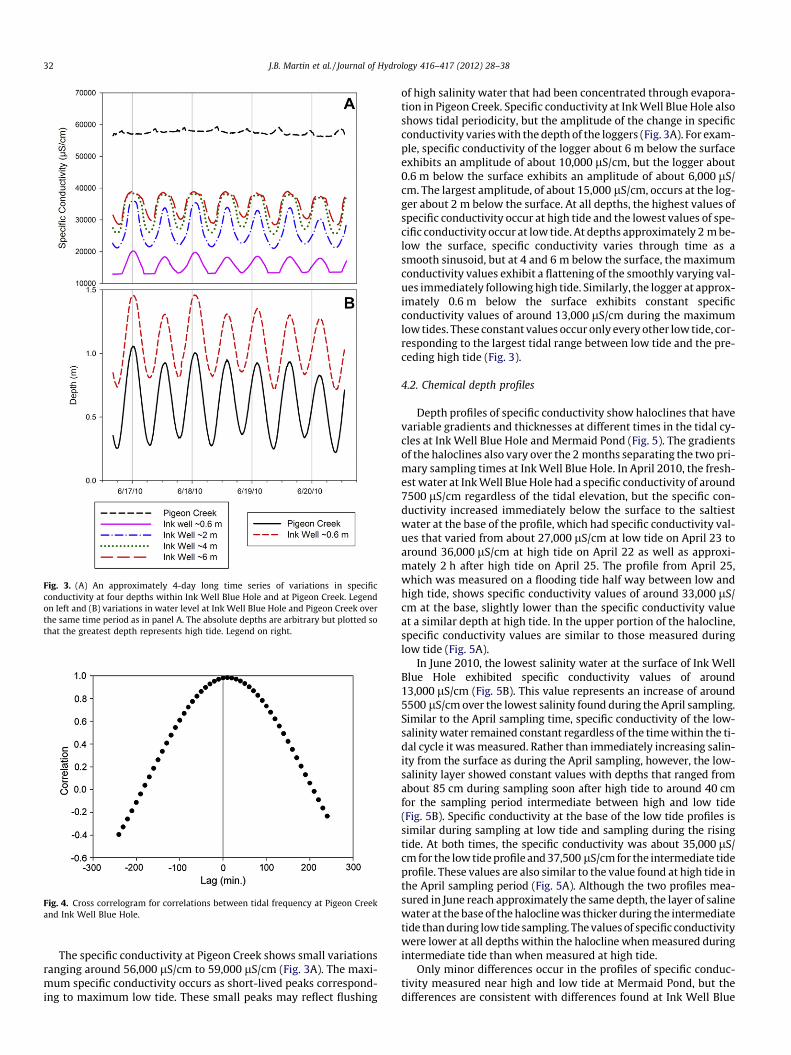
Fig. 3. (A) An approximately 4-day long time series of variations in specificconductivity at four depths within Ink Well Blue Hole and at Pigeon Creek. Legendon left and (B) variations in water level at Ink Well Blue Hole and Pigeon Creek overthe same time period as in panel A. The absolute depths are arbitrary but plotted sothat the greatest depth represents high tide. Legend on right.
Fig. 4. Cross correlogram for correlations between tidal frequency at Pigeon Creekand Ink Well Blue Hole.
32 J.B. Martin et al. / Journal of Hydrology 416–417 (2012) 28–38
The specific conductivity at Pigeon Creek shows small variationsranging around 56,000 lS/cm to 59,000 lS/cm (Fig. 3A). The maxi-mum specific conductivity occurs as short-lived peaks correspond-ing to maximum low tide. These small peaks may reflect flushing
of high salinity water that had been concentrated through evapora-tion in Pigeon Creek. Specific conductivity at Ink Well Blue Hole alsoshows tidal periodicity, but the amplitude of the change in specificconductivity varies with the depth of the loggers (Fig. 3A). For exam-ple, specific conductivity of the logger about 6 m below the surfaceexhibits an amplitude of about 10,000 lS/cm, but the logger about0.6 m below the surface exhibits an amplitude of about 6,000 lS/cm. The largest amplitude, of about 15,000 lS/cm, occurs at the log-ger about 2 m below the surface. At all depths, the highest values ofspecific conductivity occur at high tide and the lowest values of spe-cific conductivity occur at low tide. At depths approximately 2 m be-low the surface, specific conductivity varies through time as asmooth sinusoid, but at 4 and 6 m below the surface, the maximumconductivity values exhibit a flattening of the smoothly varying val-ues immediately following high tide. Similarly, the logger at approx-imately 0.6 m below the surface exhibits constant specificconductivity values of around 13,000 lS/cm during the maximumlow tides. These constant values occur only every other low tide, cor-responding to the largest tidal range between low tide and the pre-ceding high tide (Fig. 3).
4.2. Chemical depth profiles
Depth profiles of specific conductivity show haloclines that havevariable gradients and thicknesses at different times in the tidal cy-cles at Ink Well Blue Hole and Mermaid Pond (Fig. 5). The gradientsof the haloclines also vary over the 2 months separating the two pri-mary sampling times at Ink Well Blue Hole. In April 2010, the fresh-est water at Ink Well Blue Hole had a specific conductivity of around7500 lS/cm regardless of the tidal elevation, but the specific con-ductivity increased immediately below the surface to the saltiestwater at the base of the profile, which had specific conductivity val-ues that varied from about 27,000 lS/cm at low tide on April 23 toaround 36,000 lS/cm at high tide on April 22 as well as approxi-mately 2 h after high tide on April 25. The profile from April 25,which was measured on a flooding tide half way between low andhigh tide, shows specific conductivity values of around 33,000 lS/cm at the base, slightly lower than the specific conductivity valueat a similar depth at high tide. In the upper portion of the halocline,specific conductivity values are similar to those measured duringlow tide (Fig. 5A).
In June 2010, the lowest salinity water at the surface of Ink WellBlue Hole exhibited specific conductivity values of around13,000 lS/cm (Fig. 5B). This value represents an increase of around5500 lS/cm over the lowest salinity found during the April sampling.Similar to the April sampling time, specific conductivity of the low-salinity water remained constant regardless of the time within the ti-dal cycle it was measured. Rather than immediately increasing salin-ity from the surface as during the April sampling, however, the low-salinity layer showed constant values with depths that ranged fromabout 85 cm during sampling soon after high tide to around 40 cmfor the sampling period intermediate between high and low tide(Fig. 5B). Specific conductivity at the base of the low tide profiles issimilar during sampling at low tide and sampling during the risingtide. At both times, the specific conductivity was about 35,000 lS/cm for the low tide profile and 37,500 lS/cm for the intermediate tideprofile. These values are also similar to the value found at high tide inthe April sampling period (Fig. 5A). Although the two profiles mea-sured in June reach approximately the same depth, the layer of salinewater at the base of the halocline was thicker during the intermediatetide than during low tide sampling. The values of specific conductivitywere lower at all depths within the halocline when measured duringintermediate tide than when measured at high tide.
Only minor differences occur in the profiles of specific conduc-tivity measured near high and low tide at Mermaid Pond, but thedifferences are consistent with differences found at Ink Well Blue
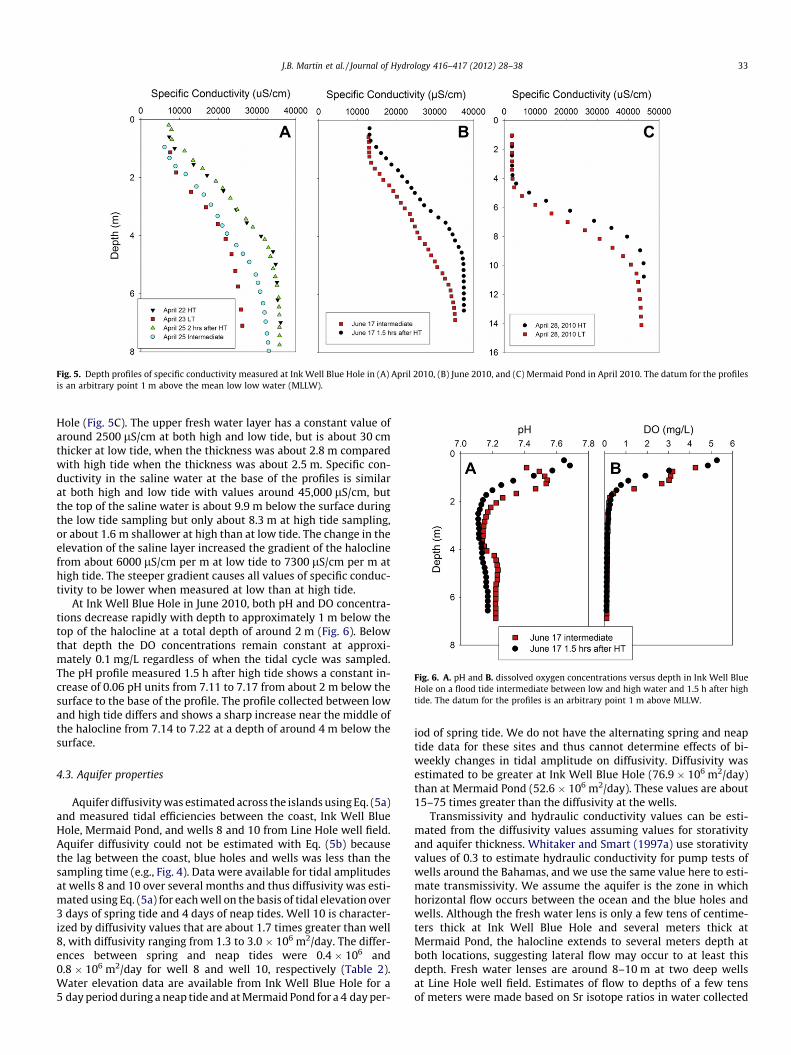
Fig. 5. Depth profiles of specific conductivity measured at Ink Well Blue Hole in (A) April 2010, (B) June 2010, and (C) Mermaid Pond in April 2010. The datum for the profilesis an arbitrary point 1 m above the mean low low water (MLLW).
Fig. 6. A. pH and B. dissolved oxygen concentrations versus depth in Ink Well BlueHole on a flood tide intermediate between low and high water and 1.5 h after hightide. The datum for the profiles is an arbitrary point 1 m above MLLW.
J.B. Martin et al. / Journal of Hydrology 416–417 (2012) 28–38 33
Hole (Fig. 5C). The upper fresh water layer has a constant value ofaround 2500 lS/cm at both high and low tide, but is about 30 cmthicker at low tide, when the thickness was about 2.8 m comparedwith high tide when the thickness was about 2.5 m. Specific con-ductivity in the saline water at the base of the profiles is similarat both high and low tide with values around 45,000 lS/cm, butthe top of the saline water is about 9.9 m below the surface duringthe low tide sampling but only about 8.3 m at high tide sampling,or about 1.6 m shallower at high than at low tide. The change in theelevation of the saline layer increased the gradient of the haloclinefrom about 6000 lS/cm per m at low tide to 7300 lS/cm per m athigh tide. The steeper gradient causes all values of specific conduc-tivity to be lower when measured at low than at high tide.
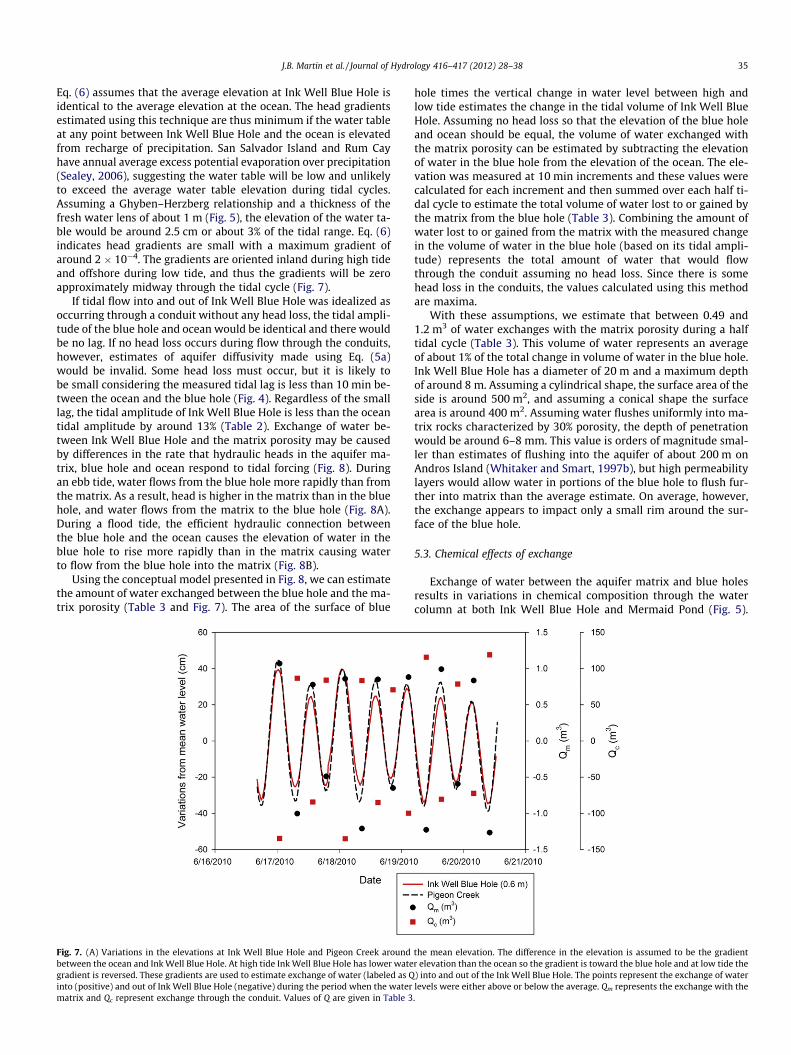
At Ink Well Blue Hole in June 2010, both pH and DO concentra-tions decrease rapidly with depth to approximately 1 m below thetop of the halocline at a total depth of around 2 m (Fig. 6). Belowthat depth the DO concentrations remain constant at approxi-mately 0.1 mg/L regardless of when the tidal cycle was sampled.The pH profile measured 1.5 h after high tide shows a constant in-crease of 0.06 pH units from 7.11 to 7.17 from about 2 m below thesurface to the base of the profile. The profile collected between lowand high tide differs and shows a sharp increase near the middle ofthe halocline from 7.14 to 7.22 at a depth of around 4 m below thesurface.
4.3. Aquifer properties
Aquifer diffusivity was estimated across the islands using Eq. (5a)and measured tidal efficiencies between the coast, Ink Well BlueHole, Mermaid Pond, and wells 8 and 10 from Line Hole well field.Aquifer diffusivity could not be estimated with Eq. (5b) becausethe lag between the coast, blue holes and wells was less than thesampling time (e.g., Fig. 4). Data were available for tidal amplitudesat wells 8 and 10 over several months and thus diffusivity was esti-mated using Eq. (5a) for each well on the basis of tidal elevation over3 days of spring tide and 4 days of neap tides. Well 10 is character-ized by diffusivity values that are about 1.7 times greater than well8, with diffusivity ranging from 1.3 to 3.0 � 106 m2/day. The differ-ences between spring and neap tides were 0.4 � 106 and0.8 � 106 m2/day for well 8 and well 10, respectively (Table 2).Water elevation data are available from Ink Well Blue Hole for a5 day period during a neap tide and at Mermaid Pond for a 4 day per-
iod of spring tide. We do not have the alternating spring and neaptide data for these sites and thus cannot determine effects of bi-weekly changes in tidal amplitude on diffusivity. Diffusivity wasestimated to be greater at Ink Well Blue Hole (76.9 � 106 m2/day)than at Mermaid Pond (52.6 � 106 m2/day). These values are about15–75 times greater than the diffusivity at the wells.
Transmissivity and hydraulic conductivity values can be esti-mated from the diffusivity values assuming values for storativityand aquifer thickness. Whitaker and Smart (1997a) use storativityvalues of 0.3 to estimate hydraulic conductivity for pump tests ofwells around the Bahamas, and we use the same value here to esti-mate transmissivity. We assume the aquifer is the zone in whichhorizontal flow occurs between the ocean and the blue holes andwells. Although the fresh water lens is only a few tens of centime-ters thick at Ink Well Blue Hole and several meters thick atMermaid Pond, the halocline extends to several meters depth atboth locations, suggesting lateral flow may occur to at least thisdepth. Fresh water lenses are around 8–10 m at two deep wellsat Line Hole well field. Estimates of flow to depths of a few tensof meters were made based on Sr isotope ratios in water collected
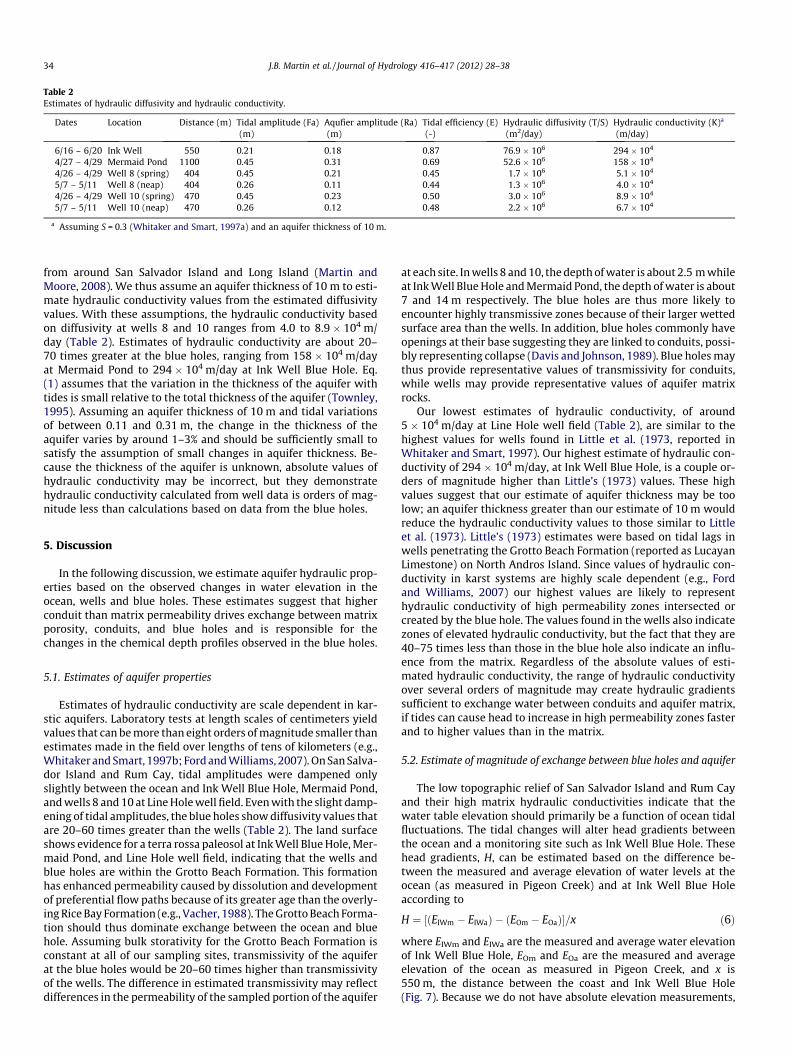
Table 2Estimates of hydraulic diffusivity and hydraulic conductivity.
Dates Location Distance (m) Tidal amplitude (Fa)(m)
Aqufier amplitude (Ra)(m)
Tidal efficiency (E)(-)
Hydraulic diffusivity (T/S)(m2/day)
Hydraulic conductivity (K)a
(m/day)
6/16 – 6/20 Ink Well 550 0.21 0.18 0.87 76.9 � 106 294 � 104
4/27 – 4/29 Mermaid Pond 1100 0.45 0.31 0.69 52.6 � 106 158 � 104
4/26 – 4/29 Well 8 (spring) 404 0.45 0.21 0.45 1.7 � 106 5.1 � 104
5/7 – 5/11 Well 8 (neap) 404 0.26 0.11 0.44 1.3 � 106 4.0 � 104
4/26 – 4/29 Well 10 (spring) 470 0.45 0.23 0.50 3.0 � 106 8.9 � 104
5/7 – 5/11 Well 10 (neap) 470 0.26 0.12 0.48 2.2 � 106 6.7 � 104
a Assuming S = 0.3 (Whitaker and Smart, 1997a) and an aquifer thickness of 10 m.
34 J.B. Martin et al. / Journal of Hydrology 416–417 (2012) 28–38
from around San Salvador Island and Long Island (Martin andMoore, 2008). We thus assume an aquifer thickness of 10 m to esti-mate hydraulic conductivity values from the estimated diffusivityvalues. With these assumptions, the hydraulic conductivity basedon diffusivity at wells 8 and 10 ranges from 4.0 to 8.9 � 104 m/day (Table 2). Estimates of hydraulic conductivity are about 20–70 times greater at the blue holes, ranging from 158 � 104 m/dayat Mermaid Pond to 294 � 104 m/day at Ink Well Blue Hole. Eq.(1) assumes that the variation in the thickness of the aquifer withtides is small relative to the total thickness of the aquifer (Townley,1995). Assuming an aquifer thickness of 10 m and tidal variationsof between 0.11 and 0.31 m, the change in the thickness of theaquifer varies by around 1–3% and should be sufficiently small tosatisfy the assumption of small changes in aquifer thickness. Be-cause the thickness of the aquifer is unknown, absolute values ofhydraulic conductivity may be incorrect, but they demonstratehydraulic conductivity calculated from well data is orders of mag-nitude less than calculations based on data from the blue holes.
5. Discussion
In the following discussion, we estimate aquifer hydraulic prop-erties based on the observed changes in water elevation in theocean, wells and blue holes. These estimates suggest that higherconduit than matrix permeability drives exchange between matrixporosity, conduits, and blue holes and is responsible for thechanges in the chemical depth profiles observed in the blue holes.
5.1. Estimates of aquifer properties
Estimates of hydraulic conductivity are scale dependent in kar-stic aquifers. Laboratory tests at length scales of centimeters yieldvalues that can be more than eight orders of magnitude smaller thanestimates made in the field over lengths of tens of kilometers (e.g.,Whitaker and Smart, 1997b; Ford and Williams, 2007). On San Salva-dor Island and Rum Cay, tidal amplitudes were dampened onlyslightly between the ocean and Ink Well Blue Hole, Mermaid Pond,and wells 8 and 10 at Line Hole well field. Even with the slight damp-ening of tidal amplitudes, the blue holes show diffusivity values thatare 20–60 times greater than the wells (Table 2). The land surfaceshows evidence for a terra rossa paleosol at Ink Well Blue Hole, Mer-maid Pond, and Line Hole well field, indicating that the wells andblue holes are within the Grotto Beach Formation. This formationhas enhanced permeability caused by dissolution and developmentof preferential flow paths because of its greater age than the overly-ing Rice Bay Formation (e.g., Vacher, 1988). The Grotto Beach Forma-tion should thus dominate exchange between the ocean and bluehole. Assuming bulk storativity for the Grotto Beach Formation isconstant at all of our sampling sites, transmissivity of the aquiferat the blue holes would be 20–60 times higher than transmissivityof the wells. The difference in estimated transmissivity may reflectdifferences in the permeability of the sampled portion of the aquifer
at each site. In wells 8 and 10, the depth of water is about 2.5 m whileat Ink Well Blue Hole and Mermaid Pond, the depth of water is about7 and 14 m respectively. The blue holes are thus more likely toencounter highly transmissive zones because of their larger wettedsurface area than the wells. In addition, blue holes commonly haveopenings at their base suggesting they are linked to conduits, possi-bly representing collapse (Davis and Johnson, 1989). Blue holes maythus provide representative values of transmissivity for conduits,while wells may provide representative values of aquifer matrixrocks.
Our lowest estimates of hydraulic conductivity, of around5 � 104 m/day at Line Hole well field (Table 2), are similar to thehighest values for wells found in Little et al. (1973, reported inWhitaker and Smart, 1997). Our highest estimate of hydraulic con-ductivity of 294 � 104 m/day, at Ink Well Blue Hole, is a couple or-ders of magnitude higher than Little’s (1973) values. These highvalues suggest that our estimate of aquifer thickness may be toolow; an aquifer thickness greater than our estimate of 10 m wouldreduce the hydraulic conductivity values to those similar to Littleet al. (1973). Little’s (1973) estimates were based on tidal lags inwells penetrating the Grotto Beach Formation (reported as LucayanLimestone) on North Andros Island. Since values of hydraulic con-ductivity in karst systems are highly scale dependent (e.g., Fordand Williams, 2007) our highest values are likely to representhydraulic conductivity of high permeability zones intersected orcreated by the blue hole. The values found in the wells also indicatezones of elevated hydraulic conductivity, but the fact that they are40–75 times less than those in the blue hole also indicate an influ-ence from the matrix. Regardless of the absolute values of esti-mated hydraulic conductivity, the range of hydraulic conductivityover several orders of magnitude may create hydraulic gradientssufficient to exchange water between conduits and aquifer matrix,if tides can cause head to increase in high permeability zones fasterand to higher values than in the matrix.
5.2. Estimate of magnitude of exchange between blue holes and aquifer
The low topographic relief of San Salvador Island and Rum Cayand their high matrix hydraulic conductivities indicate that thewater table elevation should primarily be a function of ocean tidalfluctuations. The tidal changes will alter head gradients betweenthe ocean and a monitoring site such as Ink Well Blue Hole. Thesehead gradients, H, can be estimated based on the difference be-tween the measured and average elevation of water levels at theocean (as measured in Pigeon Creek) and at Ink Well Blue Holeaccording to
H ¼ ½ðEIWm � EIWaÞ � ðEOm � EOaÞ�=x ð6Þ
where EIWm and EIWa are the measured and average water elevationof Ink Well Blue Hole, EOm and EOa are the measured and averageelevation of the ocean as measured in Pigeon Creek, and x is550 m, the distance between the coast and Ink Well Blue Hole(Fig. 7). Because we do not have absolute elevation measurements,
J.B. Martin et al. / Journal of Hydrology 416–417 (2012) 28–38 35
Eq. (6) assumes that the average elevation at Ink Well Blue Hole isidentical to the average elevation at the ocean. The head gradientsestimated using this technique are thus minimum if the water tableat any point between Ink Well Blue Hole and the ocean is elevatedfrom recharge of precipitation. San Salvador Island and Rum Cayhave annual average excess potential evaporation over precipitation(Sealey, 2006), suggesting the water table will be low and unlikelyto exceed the average water table elevation during tidal cycles.Assuming a Ghyben–Herzberg relationship and a thickness of thefresh water lens of about 1 m (Fig. 5), the elevation of the water ta-ble would be around 2.5 cm or about 3% of the tidal range. Eq. (6)indicates head gradients are small with a maximum gradient ofaround 2 � 10�4. The gradients are oriented inland during high tideand offshore during low tide, and thus the gradients will be zeroapproximately midway through the tidal cycle (Fig. 7).
If tidal flow into and out of Ink Well Blue Hole was idealized asoccurring through a conduit without any head loss, the tidal ampli-tude of the blue hole and ocean would be identical and there wouldbe no lag. If no head loss occurs during flow through the conduits,however, estimates of aquifer diffusivity made using Eq. (5a)would be invalid. Some head loss must occur, but it is likely tobe small considering the measured tidal lag is less than 10 min be-tween the ocean and the blue hole (Fig. 4). Regardless of the smalllag, the tidal amplitude of Ink Well Blue Hole is less than the oceantidal amplitude by around 13% (Table 2). Exchange of water be-tween Ink Well Blue Hole and the matrix porosity may be causedby differences in the rate that hydraulic heads in the aquifer ma-trix, blue hole and ocean respond to tidal forcing (Fig. 8). Duringan ebb tide, water flows from the blue hole more rapidly than fromthe matrix. As a result, head is higher in the matrix than in the bluehole, and water flows from the matrix to the blue hole (Fig. 8A).During a flood tide, the efficient hydraulic connection betweenthe blue hole and the ocean causes the elevation of water in theblue hole to rise more rapidly than in the matrix causing waterto flow from the blue hole into the matrix (Fig. 8B).
Using the conceptual model presented in Fig. 8, we can estimatethe amount of water exchanged between the blue hole and the ma-trix porosity (Table 3 and Fig. 7). The area of the surface of blue
Fig. 7. (A) Variations in the elevations at Ink Well Blue Hole and Pigeon Creek aroundbetween the ocean and Ink Well Blue Hole. At high tide Ink Well Blue Hole has lower wategradient is reversed. These gradients are used to estimate exchange of water (labeled as Qinto (positive) and out of Ink Well Blue Hole (negative) during the period when the watermatrix and Qc represent exchange through the conduit. Values of Q are given in Table 3
hole times the vertical change in water level between high andlow tide estimates the change in the tidal volume of Ink Well BlueHole. Assuming no head loss so that the elevation of the blue holeand ocean should be equal, the volume of water exchanged withthe matrix porosity can be estimated by subtracting the elevationof water in the blue hole from the elevation of the ocean. The ele-vation was measured at 10 min increments and these values werecalculated for each increment and then summed over each half ti-dal cycle to estimate the total volume of water lost to or gained bythe matrix from the blue hole (Table 3). Combining the amount ofwater lost to or gained from the matrix with the measured changein the volume of water in the blue hole (based on its tidal ampli-tude) represents the total amount of water that would flowthrough the conduit assuming no head loss. Since there is somehead loss in the conduits, the values calculated using this methodare maxima.
With these assumptions, we estimate that between 0.49 and1.2 m3 of water exchanges with the matrix porosity during a halftidal cycle (Table 3). This volume of water represents an averageof about 1% of the total change in volume of water in the blue hole.Ink Well Blue Hole has a diameter of 20 m and a maximum depthof around 8 m. Assuming a cylindrical shape, the surface area of theside is around 500 m2, and assuming a conical shape the surfacearea is around 400 m2. Assuming water flushes uniformly into ma-trix rocks characterized by 30% porosity, the depth of penetrationwould be around 6–8 mm. This value is orders of magnitude smal-ler than estimates of flushing into the aquifer of about 200 m onAndros Island (Whitaker and Smart, 1997b), but high permeabilitylayers would allow water in portions of the blue hole to flush fur-ther into matrix than the average estimate. On average, however,the exchange appears to impact only a small rim around the sur-face of the blue hole.
5.3. Chemical effects of exchange
Exchange of water between the aquifer matrix and blue holesresults in variations in chemical composition through the watercolumn at both Ink Well Blue Hole and Mermaid Pond (Fig. 5).
the mean elevation. The difference in the elevation is assumed to be the gradientr elevation than the ocean so the gradient is toward the blue hole and at low tide the) into and out of the Ink Well Blue Hole. The points represent the exchange of waterlevels were either above or below the average. Qm represents the exchange with the.
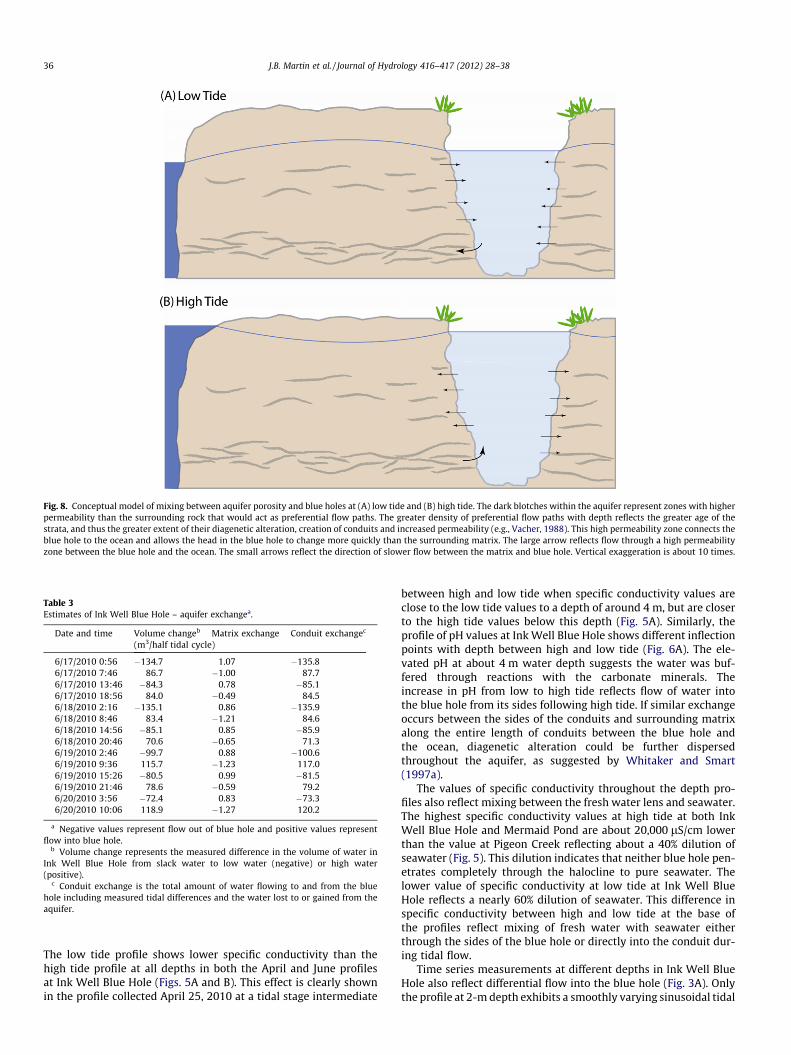
Fig. 8. Conceptual model of mixing between aquifer porosity and blue holes at (A) low tide and (B) high tide. The dark blotches within the aquifer represent zones with higherpermeability than the surrounding rock that would act as preferential flow paths. The greater density of preferential flow paths with depth reflects the greater age of thestrata, and thus the greater extent of their diagenetic alteration, creation of conduits and increased permeability (e.g., Vacher, 1988). This high permeability zone connects theblue hole to the ocean and allows the head in the blue hole to change more quickly than the surrounding matrix. The large arrow reflects flow through a high permeabilityzone between the blue hole and the ocean. The small arrows reflect the direction of slower flow between the matrix and blue hole. Vertical exaggeration is about 10 times.
Table 3Estimates of Ink Well Blue Hole – aquifer exchangea.
Date and time Volume changeb Matrix exchange Conduit exchangec
(m3/half tidal cycle)
6/17/2010 0:56 �134.7 1.07 �135.86/17/2010 7:46 86.7 �1.00 87.76/17/2010 13:46 �84.3 0.78 �85.16/17/2010 18:56 84.0 �0.49 84.56/18/2010 2:16 �135.1 0.86 �135.96/18/2010 8:46 83.4 �1.21 84.66/18/2010 14:56 �85.1 0.85 �85.96/18/2010 20:46 70.6 �0.65 71.36/19/2010 2:46 �99.7 0.88 �100.66/19/2010 9:36 115.7 �1.23 117.06/19/2010 15:26 �80.5 0.99 �81.56/19/2010 21:46 78.6 �0.59 79.26/20/2010 3:56 �72.4 0.83 �73.36/20/2010 10:06 118.9 �1.27 120.2
a Negative values represent flow out of blue hole and positive values representflow into blue hole.
b Volume change represents the measured difference in the volume of water inInk Well Blue Hole from slack water to low water (negative) or high water(positive).
c Conduit exchange is the total amount of water flowing to and from the bluehole including measured tidal differences and the water lost to or gained from theaquifer.
36 J.B. Martin et al. / Journal of Hydrology 416–417 (2012) 28–38
The low tide profile shows lower specific conductivity than thehigh tide profile at all depths in both the April and June profilesat Ink Well Blue Hole (Figs. 5A and B). This effect is clearly shownin the profile collected April 25, 2010 at a tidal stage intermediate
between high and low tide when specific conductivity values areclose to the low tide values to a depth of around 4 m, but are closerto the high tide values below this depth (Fig. 5A). Similarly, theprofile of pH values at Ink Well Blue Hole shows different inflectionpoints with depth between high and low tide (Fig. 6A). The ele-vated pH at about 4 m water depth suggests the water was buf-fered through reactions with the carbonate minerals. Theincrease in pH from low to high tide reflects flow of water intothe blue hole from its sides following high tide. If similar exchangeoccurs between the sides of the conduits and surrounding matrixalong the entire length of conduits between the blue hole andthe ocean, diagenetic alteration could be further dispersedthroughout the aquifer, as suggested by Whitaker and Smart(1997a).
The values of specific conductivity throughout the depth pro-files also reflect mixing between the fresh water lens and seawater.The highest specific conductivity values at high tide at both InkWell Blue Hole and Mermaid Pond are about 20,000 lS/cm lowerthan the value at Pigeon Creek reflecting about a 40% dilution ofseawater (Fig. 5). This dilution indicates that neither blue hole pen-etrates completely through the halocline to pure seawater. Thelower value of specific conductivity at low tide at Ink Well BlueHole reflects a nearly 60% dilution of seawater. This difference inspecific conductivity between high and low tide at the base ofthe profiles reflect mixing of fresh water with seawater eitherthrough the sides of the blue hole or directly into the conduit dur-ing tidal flow.
Time series measurements at different depths in Ink Well BlueHole also reflect differential flow into the blue hole (Fig. 3A). Onlythe profile at 2-m depth exhibits a smoothly varying sinusoidal tidal
J.B. Martin et al. / Journal of Hydrology 416–417 (2012) 28–38 37
signal as the halocline moved past the AquaTroll during the tidal cy-cle. Specific conductivity recorded at the shallowest AquaTroll, at adepth of around 0.6 m, shows flattening of the profiles at low tideand at the two deepest AquaTrolls, at depths around 4 and 6 m, showflattening of the profiles at high tide. The constant salinity with timeat high tide in the deepest AquaTrolls reflects its position in the deepand approximately constant salinity water with a flood tide. Simi-larly, the constant salinity with time at low tide in the uppermostAquaTroll reflects its position in the upper portion of the fresh waterlens with ebb tide. The specific conductivity also differs between ris-ing and falling tides for the two deepest AquaTrolls. The profilesoverlap while conductivity values increase on the rising tide, butduring the falling tide the drop in specific conductivity value at 4-m depth decreases earlier than the drop in specific conductivity va-lue in the AquaTroll at 6-m depth (Fig. 3A). The similar specific con-ductivity values during the rising tide reflect loss of water from theblue hole to the aquifer rocks (Fig. 8), which would not change thespecific conductivity of the water. The earlier decrease in the specificconductivity at 4-m depth reflects inflow of freshwater through thesides of the blue hole.
5.4. Implications for exchange
Circulation through carbonate platforms has been suggested toresult from Kohout convection (Kohout, 1965), differences in theelevation head caused by oceanic circulation, buoyancy circulationfrom the fresh water lens, reflux driven by density differences fromevaporative concentration of seawater (Whitaker and Smart,1990). None of these mechanisms is likely to drive flow throughsmall isolated platforms similar to Rum Cay and San SalvadorIsland (e.g., Martin and Moore, 2008). The specific conductivity,DO concentration and pH profiles from Mermaid Pond and InkWell Blue Hole indicate the chemical compositions of groundwaterflow in these small islands are modified by exchange processesdriven by differences in hydraulic conductivity throughout theaquifer. Although this tidal pumping appears to exchange only asmall fraction of water between blue holes and the surroundingmatrix rocks, differences in composition of the blue hole water(e.g., Fig. 6A) suggests the exchange is important for carbonateplatform diagenesis. Much alteration could be the transformationof less stable aragonite to more stable calcite (e.g., Budd, 1988).Other mineralogical transformations, such as formation of dolo-mite, are less likely because changes in water chemistry at theseshallow depths are small and thus unlikely to overcome kineticinhibitions to dolomite formation (e.g., Baker and Kastner, 1981).
Previous work on blue holes and cenotes on large carbonateplatforms have found stable haloclines that affect alteration ofthe carbonate minerals through redox alteration of organic carbontrapped on the pycnoclines (Stoessell, 1995; Beddows et al., 2007).Even in systems with stable pycnoclines, tidal pumping causes theexchange of water undersaturated with respect to carbonate min-erals through oxidation of organic carbon in the blue holes. Suchfocusing could cause deeper penetration of undersaturated waterinto the matrix than the 6–8 mm estimated above for Ink Well BlueHole. This undersaturated water would dissolve aquifer rocksalong preferential flow paths and within matrix porosity. Horizon-tal flow occurs over long distances in integrated conduit systems inthe Yucatan Peninsula that have aggregate lengths up to hundredsof kilometers (Smart et al., 2006). This flow will be influenced bytidal pumping and mixing with seawater since coastal springs inthe Yucatan are known to have tidally driven ebb and flood cycles,although it is not known how far inland these flow reversals ex-tend (Beddows, 2003). Assuming tidal exchange between blueholes, conduits and matrix porosity occurs in the Yucatan, similardissolution reactions should also be important to the diageneticalteration of large platforms.
To our knowledge, no previous work has estimated how halo-clines evolve through a tidal cycle in carbonate platforms. Evenin large platforms such as the Yucatan, exchange between the aqui-fer matrix and the water column may be sufficient to influence dia-genetic alteration of the platform. Bottrell et al. (1990) suggestedthat eddy diffusion was sufficient to drive sulfur reactions in thewater column and alter pH sufficiently for carbonate dissolutionreactions. Our work suggests that this exchange may also be influ-enced by advective exchange of blue hole and aquifer water, aswell as diffusive processes in the water column. Exchange betweenthe water column in blue holes and the aquifer matrix could influ-ence the diagenetic evolution of these platforms. Large fresh waterlenses and long distances from the coast on large platforms willdampen the tidal mixing, but tidal pumping into and out of con-duits and coupled exchange with the matrix porosity should beimportant factors in the alteration of the platforms nearer to thecoast similar to the exchange observed on San Salvador Islandand Rum Cay. Detailed measurements of chemical profiles of com-ponents involved in carbonate mineral reactions will be neededthrough tidal cycles, either within conduits or at blue holes distrib-uted throughout the platform to test this hypothesis.
6. Conclusions
Tidal pumping of conduits in small carbonate islands provides amechanism to drive the exchange of surface water with water in ma-trix porosity. This mixing can be observed in variations in composi-tion of the water column of blue holes through a tidal cycle. At sitesobserved in this study, only about 1% of the total tidal change involume of water in the blue hole exchanged with water within theaquifer rocks and penetrated into the matrix to average depths of6–8 mm, although focusing could cause deeper penetration.Although the volume of water exchanged through tidal cycles issmall relative to the total volume of water in the blue holes, specificconductivity of water differed by up to 25% between high and lowtide. Since exchange occurs twice daily, its time-integrated impacton diagenetic alteration of the aquifer could be large. Tidally drivenexchange of surface water and aquifer water could impact dissolu-tion patterns on carbonate platforms by supplying organic carbonto the matrix where subsequent microbial oxidation would increasematrix porosity, but since tides are dampened with distance inland,this dissolution should decrease away from the coast.
Acknowledgments
We gratefully acknowledge field and logistical support providedby Tom Rothfus and the staff at the Gerace Research Centre, SanSalvador Island, and by Josie Harding on Rum Cay. We thank theBahamas Environment, Science and Technology Commission forpermission to conduct this research. We thank David Budd andan anonymous reviewer for their helpful reviews. Acknowledg-ment is made to the Donors of the American Chemical SocietyPetroleum Research Fund for support of this research. Additionalsupport was provided to JG in the form of a National Science Foun-dation Graduate Fellowship and an NSF EAR Postdoctoral ResearchFellowship (#0946767).
References
Ayers, J.F., Vacher, H.L., 1986. Hydrogeology of an atoll island: a conceptual modelfrom detailed study of a Micronesian example. Ground Water 24, 185–198.
Baker, P.A., Kastner, M., 1981. Contraints on the formation of sedimentary dolomite.Science 213, 214–216.
Beach, D.K., Ginsburg, R.N., 1980. Facies succession of pliocene–pleistocenecarbonates, northwestern Great Bahama Bank. Am. Assoc. Petrol. Geol. Bull.64, 1634–1642.
Beddows, P.A., 2003. Cave hydrology of the Caribbean Yucatan coast. Assoc. Mex.Cave Stud. Bull. 11, 96.
38 J.B. Martin et al. / Journal of Hydrology 416–417 (2012) 28–38
Beddows, P.A., Smart, P.L., Whitaker, F.F., Smith, S.L., 2007. Decoupled fresh–salinegroundwater circulation of a coastal carbonate aquifer: spatial patterns oftemperature and specific electrical conductivity. J. Hydrol. 346 (1–2), 18–32.
Bottrell, S.H., Smart, P.L., Whitaker, F.F., Raiswell, R., 1990. Geochemistry andisotope systematics of sulphur in the mixing zone of Bahamian blue holes. Appl.Geochem. 6, 97–103.
Budd, D.A., 1988. Aragonite-to-calcite transformation during fresh-water diagenesisof carbonates: insights from pore-water chemistry. Geol. Soc. Am. Bull. 100,1260–1270.
Cant, R.V., Weech, P.S., 1986. A review of the factors affecting the development ofGhyben–Hertzberg lenses in the Bahamas. J. Hydrol. 84, 333–343.
Carew, J.L., Mylroie, J.E., 1995. Depositional model and stratigraphy for thequaternary geology of the Bahama islands. Geol. Soc. Am. 1, 5–32.
Davis, R.L., Johnson, J., C.R., 1989. Karst Hydrology of San Salvador. In: Mylroie, J.E.(Ed.). In: Proceedings, Fourth Symposium on the Geology of the Bahamas.Bahamian Field Station, San Salvador Island, Bahamas, pp. 118–135.
Ferris, J.G., 1951. Cyclic fluctuations of water level as a basis for determiningaquifer transmissibility. Assem. Gen. Bruxelles, Assoc. Int. Hydrol. Sci. 2,149–155.
Ford, D., Williams, P., 2007. Karst Hydrogeology and Geomorphology. John Wileyand Sons, West Sussex, p. 562.
Gulley, J., Martin, J.B., Screaton, E.J., Moore, P.J., 2011. River reversals into karstsprings: a model for cave enlargement in eogenetic karst aquifers. Geol. Soc.Am. Bull. 123, 467.
Kohout, F.A., 1965. A hypothesis concerning the cyclic flow of salt water related togeothermal heating in the Florida aquifer. NY Acad. Sci. Trans. 28, 249–271.
Little, B.G., Buckley, D.K., Jefferiss, A., Stark, J., Young, R.N., 1973. Land resources ofthe commonwealth of the Bahamas, 4, Andros island. Ministry of OverseasDevelopment, Surbiton, England.
Martin, J.B., Dean, R.W., 2001. Exchange of water between conduits and matrix inthe Floridan aquifer. Chem. Geol. 179, 145–165.
Martin, J.B., Gulley, J., 2010. Distribution of fresh water on Rum Cay andimplications for generation of secondary porosity. In: Siewers, F.E., Martin, J.B.(Eds.), Proceedings of the 14th Symposium on the Geology of the Bahamas andOther Carbonate Regions. Gerace Research Centre, San Salvador Island,Bahamas, pp. 140–149.
Martin, J.B., Moore, P.J., 2008. Sr concentrations and isotope ratios as tracers ofground-water circulation in carbonate platforms: examples from San Salvadorisland and long island, Bahamas. Chem. Geol. 249, 52–65.
McGee, D.K., Wynn, J.G., Onac, B.P., Harries, P.J., Rothfus, E.A., 2010. Tracinggroundwater geochemistry using d13C on San Salvador island (southeasternBahamas): implications for carbonate island hydrogeology and dissolution.Carbonates Evaporites, doi: 10.1007/s13146-010-0013-6.
Melim, L.A., Westphal, H., Swart, P.K., Eberli, G.P., Munnecke, A., 2002. Questioningcarbonate diagenetic paradigms: evidence from the Neogene of the Bahamas.Mar. Geol. 185 (1–2), 27–53.
Mitchell, S.W., 1987. Surficial geology of Rum Cay, Bahama islands. In: Curran, H.A.(Ed.). In: Proceedings of the Third Symposium on the Geology of the Bahamas.CCFL Bahamian Field Station, Fort Lauderdale, Florida, pp. 231–241.
Moore, P.J., 2009. Controls on the Generation of Secondary Porosity in EogeneticKarst: Examples from San Salvador Island, Bahamas and North-Central Florida.University of Florida, Gainesville, FL, p. 140.
Moore, P.J., Martin, J.B., Screaton, E.J., 2009. Geochemical and statistical evidence ofrecharge, mixing, and controls on spring discharge in an eogenetic karst aquifer.J. Hydrol. 376 (3–4), 443–455.
Moore, P.J., Martin, J.B., Screaton, E.J., Neuhoff, P.S., 2010. Conduit enlargement in aneogenetic karst aquifer. J. Hydrol. 393, 143–155.
Mylroie, J.E., Carew, J.L., 1990. The flank margin model for dissolution cavedevelopment in carbonate platforms. Earth Surf. Proc. Land. 15, 413–424.
Mylroie, J.E., Carew, J.L., 1995. Karst Development on Carbonate Islands. In: Budd,D.A., Harris, P.M., Saller, A. (Eds.), Unconformities and Porosity in CarbonateStrata. American Association of Petroleum Geologists, pp. 55–76.
Mylroie, J.E., Carew, J.L., Moore, A.I., 1995. Blue holes: definition and genesis.Carbonates Evaporites 10, 225–233.
Oberdorfer, J., Hogan, P., Buddemeier, R., 1990. Atoll island hydrogeology: flow andfreshwater occurrence in a tidally dominated system. J. Hydrol. 120, 327–340.
Perry, E., Marin, L., McClain, J., Velazquez, G., 1995. Ring of cenotes (sinkholes)northwest Yucatan, Mexico: its hydrogeologic characteristics and possibleassociation with the chicxulub impact crater. Geology 23, 17–20.
Runnells, D.D., 1969. Diagenesis, chemical sediments, and the mixing of naturalwaters. J. Sediment. Petrol. 39, 1188–1201.
Schwabe, S., Herbert, R.A., 2004. Black holes of the Bahamas: what they are and whythey are black. Quatern. Int. 121 (1), 3–11.
Sealey, N.E., 2006. Bahamian LANDSCAPES; an introduction to the physicalgeography of the Bahamas. Macmillan Publishers, Oxford, p. 174.
Smart, P.L. et al., 2006. Cave Development on the Caribbean Coast of the YucatanPeninsula, Quintana Roo, Mexico. In: Harmon, R.S., Wicks, C. (Eds.), Perspectiveson Karst Geomorphology, Hydrology, and Geochemistry – A Tribute Volume toDerek C. Ford and William B. White. Geological Society of America, Denver, CO,pp. 105–128.
Stoessell, R., 1995. Dampening of transverse dispersion in the halocline in karstlimestone int he northeastern Yucatan Peninsula. Ground Water 33, 366–371.
Stoessell, R.K., Coke, J.G., Easley, D.H., 2002. Localized thermal anomalies inhaloclines of coastal Yucatan sinkholes. Ground Water 40, 416–424.
Stringfield, V.T., LeGrand, H.E., 1971. Effects of karst features on circulation of waterin carbonate rocks in coastal areas. J. Hydrol. 14 (2), 139–157.
Townley, L.R., 1995. The response of aquifers to periodic forcing. Adv. Water Resour.18, 125–146.
Vacher, H.L., 1988. Dupuit–Ghyben–Herzberg analysis of strip-island lenses. Geol.Soc. Am. Bull. 100, 580–591.
Vacher, H.L., Mylroie, J.E., 2002. Eogenetic karst from the perspective of anequivalent porous medium. Carbonates Evaporites 17, 182–196.
Vacher, H.L., Quinn, T.M., 1997. Geology and Hydrogeology of Carbonate Islands.Elsevier, Amsterdam, p. 948.
Vacher, H.L., Wallis, T.N., 1992. Comparative hydrogeology of fresh-water lenses ofBermuda and Great Exumas island, Bahamas. Ground Water 30, 15–20.
Whitaker, F.F., Smart, P.L., 1990. Active circulation of saline ground waters incarbonate platforms: evidence from the Great Bahama Bank. Geology 18 (3),200–204.
Whitaker, F.F., Smart, P.L., 1997a. Groundwater circulation and geochemistry of akarstified bank-marginal fracture system, south Andros island, Bahamas. J.Hydrol. 197 (1–4), 293–315.
Whitaker, F.F., Smart, P.L., 1997b. Hydrogeology of the Bahamian Archipelago. In:Vacher, H.L., Quinn, T. (Eds.), Geology and Hydrogeology of Carbonate Islands.Developments in Sedimentology 54. Elsevier Science B.V., Amsterdam, pp. 183–216.
Whitaker, F.F., Smart, P.L., 2007a. Geochemistry of meteoric diagenesis in carbonateislands of the northern Bahamas: 1. Evidence from field studies. Hydrol. Process.21, 949–966.
Whitaker, F.F., Smart, P.L., 2007b. Geochemistry of meteoric diagenesis in carbonateislands of the northern Bahamas: 2. Geochemical modelling and budgeting ofdiagenesis. Hydrol. Process. 21, 967–982.
Wigley, T.M.L., Plummer, L.N., 1976. Mixing of carbonate waters. Geochim.Cosmochim. Acta 40 (9), 989–995.