Embed Size (px)
Citation preview
Submitted for publication in the inaugural issue of IEEE Transactions on Terahertz Science and Technology, April 5, 2011 1
Abstract—The THz spectral regime provides a wide range of
spectral lines that are invaluable probes of star formation and
AGN activity in galaxies both in the local Universe and at the
earliest times. We review the utility of these lines, give examples
of the science they deliver, and detail the properties of successful
low resolution direct detection spectrometers for work in the THz
regime. We finish with a discussion of the exciting new science
we expect with the next direct detection generation spectrometers
on new facilities such as SOFIA, CCAT, SPICA, and ALMA.
Index Terms—direct detection receivers, extragalactic
spectroscopy, fine-structure lines, TH spectroscopy
I. INTRODUCTION
HE THz spectrum, here loosely defined as frequencies
between 600 GHz and 6 THz, contains a plethora of
readily detectable spectral lines that are important diagnostics
for both the physical and chemical conditions of the gas and
the sources of energy within astrophysical environments.
These spectral probes include rotational lines from simple
molecules (e.g. HD, CH, OH, CO, NH3, H2O), and the ground
state fine-structure lines from abundant atoms and ions. These
lines are well explored in both galactic and extragalactic
environments, and indeed the molecular lines can be important
probes of planetary atmospheres in the solar system. Important
results are obtained with both coherent (heterodyne) and
incoherent (direct detection) spectrometers. Here we focus on
work done with direct detection spectrometers whose natural
niche is the broad spectral line environment of extragalactic
studies. In this context, line widths are ~50 to 500 km/sec, the
smaller values typical for low mass dwarf galaxies and spiral
galaxies viewed “face-on” and the larger values more typical
for more massive systems with more arbitrary presentations on
the sky. This narrows our focus to the lines with large
luminosities on galactic scales, these are the lines that are
important coolants of the interstellar medium (ISM) including
the fine-structure lines of C, C+, N
+, N
++, O, and O
++, and the
mid-J rotational lines of CO.
This paper is divided into five sections. Following this
introduction, Sec. II discusses these spectral lines and their
utility as probes of astrophysical environments, Sec. III is a
brief history of observations of these lines which also
Manuscript received March 28, 2011. This work was supported in part by
NSF grants AST-0705256, and AST-0722220. Gordon J. Stacey is in the
Department of Astronomy, Cornell University, Ithaca, NY 14850 USA.
(phone: 607-255-5900; fax: 607-255-5875; e-mail: [email protected]).
summarizes some exciting new astrophysical discoveries, Sec.
IV is a discussion of the merits of direct detection systems,
Sec. V gives examples of moderate resolving power direct
detection systems that are used for astrophysical experiments
today, and Sec. VI discusses some of the prospects for future
work.
II. ASTROPHYSICAL PROBES WITHIN THE THZ BANDS
A. Fine-Structure Lines
Atoms or ions with ground state electronic configurations
that contain valence electrons will have their configurations
ordered by the residual electrostatic interaction into terms that
differ in the total (vector) orbital angular momentum (L li)
and total (vector) spin angular momentum (S si). These
terms are donated by 2S+1
P, where the superscript 2S+1 is
equivalent to the number of levels into which the term is split,
and P denotes the total orbital angular momentum of the
electronic term and follows the usual convention where
S,P,D,F… refer to terms of L = 0,1,2,3…. These terms are
further split by the spin-orbit interaction into levels 2S+1
PJ
where the subscript J denotes the magnitude of the vector sum
of L and S: J L+S. Each of these levels, J, has a degeneracy
given by gJ = 2J+1. When an atom or ion has 1, 2, 4, or 5
equivalent p electrons in its ground state configuration, the
ordering and selection rules dictate that its ground state term
will be 3P or
2P terms, so that it has ground state fine-structure
lines. After H and He, which have no low-lying energy levels,
the three most abundant elements in the Universe are oxygen,
carbon, and nitrogen with relative abundances ~ 6, 3, and
1×10⁻⁴
with respect to hydrogen respectively. Amongst these
elements, the O, O++
, C, C+, N
+, and N
++ ionization states have
ground term split into fine-structure levels that emit photons in
the THz range (Table 1). Since transitions within a term
involve no change in the electronic configuration, they are
forbidden to electronic dipole radiation and decay by magnetic
dipole transitions. As such, the excited fine-structure levels are
metastable with lifetimes measured in days.
Since they lie in the THz range, where the corresponding
wavelengths (~100 µm) are large compared to the typical sizes
of interstellar dust grains (~ 0.1 µm), these lines are totally
unaffected by the interstellar extinction by grains that hinders
optical and near infrared observations. With weak Einstein A
coefficients, the lines are also not usually affected by self-
absorption (they are optically thin) so that typical photons will
THz Low Resolution Spectroscopy for
Astronomy
Gordon J. Stacey
T
Submitted for publication in the inaugural issue of IEEE Transactions on Terahertz Science and Technology, April 5, 2011 2
escape an emitting gas cloud. Furthermore, the energy levels
that emit the lines lie within a few hundred K of the ground
state, so that they are easily collisionally excited by e-1
, H, or
H2 impacts in many astrophysical environments. The
combination makes these THz lines important coolants for
many phases of the ISM and excellent probes of the physical
conditions of the gas clouds and probes of the sources of heat,
be it the radiation fields from nearby stars or AGN, cosmic
rays, X-rays or interstellar shocks.
B. Ionized Gas Lines
It takes 13.6 eV photons to ionize hydrogen, so species that
require more than 13.6 eV photons to form will be found
exclusively within HII regions (O++
, N+, N
++), and those with
ionization potentials less than 13.6 eV (O, C) will be found
exclusively in neutral gas clouds. C+ takes only 11.3 eV
photons to form, but 24.4 eV to further ionize so that it is
found both in neutral and ionized gas clouds. Fine-structure
lines are excellent probes of gas density. Within a species, two
fine-structure lines will have different A coefficients, hence
different critical densities (ncrit) for thermalization of the
emitting levels1. In the low density limit (n<<ncrit), every
collisional excitation leads to the emission of a photon, so that
the line ratio is constant (Fig. 1). In the high density limit
(n>>ncrit), the levels populations are thermalized, and given by
the Boltzman formula therefore yielding a second constant line
ratio. Between the low and high density limits the ratios vary
1 The critical density for thermalization of an emitting level is defined as
the density at which collisional de-excitations of the level equal radiative de-
excitations.
strongly with gas density as first one, and then the other
emitting level is thermalized. For the lines that arise in ionized
gas regions, the level excitation potentials (energy above
ground state) are much less than the ionized gas temperatures
(~ 8000 K), so that level excitation is very insensitive to gas
temperature. However, neutral oxygen and carbon are found
in neutral gas regions where gas temperatures are typically
between 50 and 1000 K. Therefore, their line ratios are
sensitive to gas temperature. The critical density of the carbon
lines are relatively modest so that the levels are typically
thermalized at the densities found in interstellar gas clouds.
As such, the [CI] line ratio has proven to be a good
temperature probe, and the lines trace gas column density,
hence mass.
The THz frequency fine-structure lines are also excellent
probes of the hardness of the ambient interstellar radiation
fields. The vast majority (~90%) of stars in galaxies like the
Milky Way are on the main sequence (MS) where they are
fusing hydrogen into helium in their cores. Within the main
sequence, stellar luminosities, LMS are strongly dependent on
stellar mass, M: LMS ~ M3 to 3.5
, so that the most massive stars
dominate the interstellar radiation fields. Due to this steep
dependence of L on M, the most massive stars also have the
shortest lifetimes on the main sequence, MS ~ M-2.5
. More
massive MS stars also have much higher effective surface
temperatures, Teff so they put out much harder radiation fields.
Therefore, presuming a stellar photospheric origin, a harder
ambient radiation field indicates more massive stars on the
main sequence, hence a younger stellar population. The fine-
structure lines trace the radiation field hardness, hence the age
of the starburst. It takes 14.5 eV photons to form N+
(equivalent Teff~ 33,000 K, or a B0 star), and 29.6 eV photons
to form N++
(Teff~ 39,000 K or an O8 star), so that the
[NII]/[NIII] line ratios are strongly indicative of the hardness
of the ambient interstellar radiation field (Fig. 2). With an
ionization potential of 35 eV, O++
takes even harder UV
photons to form than N++
. Therefore, the [OIII]/[NII] line
Table 1: Selected THz Spectral Lines
Species Trans. E.P.1 (m) (GHz) A (s
-1) ncrit (cm
-3)
2
Oo 3
P1 - 3P2
3P0 -
3P1
228
329
63.18
145.53
4745
2060
9.010-5
1.710-5
4.7105(*)
9.4104(*)
O++ 3
P2 - 3P1
3P1 -
3P0
440
163
51.82
88.36
5786
3393
9.8×10⁻⁵
2.610-5
3.6×10³
510
C+
2P3/2-
2P1/2 91 157.74 1901 2.110
-6
2.8103(*)
50
N+
3P2 -
3P1
3P1 -
3P0
188
70
121.90
205.18
2459
1461
7.5×10⁻⁶
2.110-6
310
48
N++ 2
P3/2-2P1/2 251 57.32 5230 4.810
-5 2.110
3
Co
3P2 -
3P1
3P1 -
3P0
63
24
370.42
609.14
809.3
492.2
2.710-7
7.910-8
1.2103
4.7102
12CO
13CO
J =13-12
J =11-10
J = 9 - 8
J = 7 - 6
J = 6 - 5
J =12-11
J = 8 - 7
J = 6 - 5
503
365
249
155
116
413
190
111
200.23
236.60
289.12
371.65
433.56
226.89
340.17
453.48
1497
1267
1037
806.7
691.5
1321
881.3
661.1
2.2×10⁻⁴
1.3×10⁻⁴
7.3×10⁻⁵
3.410-5
2.110-5
1.5×10⁻⁴
4.510-5
1.910-5
2.5×10⁶
1.4×10⁶
8.4105
3.9105
2.6105
1.6×10⁶
1.7105
2.3105
1Excitation potential, energy (K) of upper level above ground.
2Collision partner for atoms are electrons except those marked
with a (*)
. These have collision partners of H and H2 (100 K).
Fig. 1. Ratio of the [NII] 122 µm to 205 µm fine-structure lines as a
function of gas density (solid line). The line ratio is a sensitive probe of gas
density for HII regions with electron densities between 20 and 2000 cm-3.
Also shown is the ratio of the [CII] 158 µm/[NII] 205 µm lines as a function
of gas density. This line ratio can be used to discern the fraction of the
observed [CII] line that arises from ionized gas regions [1].
Submitted for publication in the inaugural issue of IEEE Transactions on Terahertz Science and Technology, April 5, 2011 3
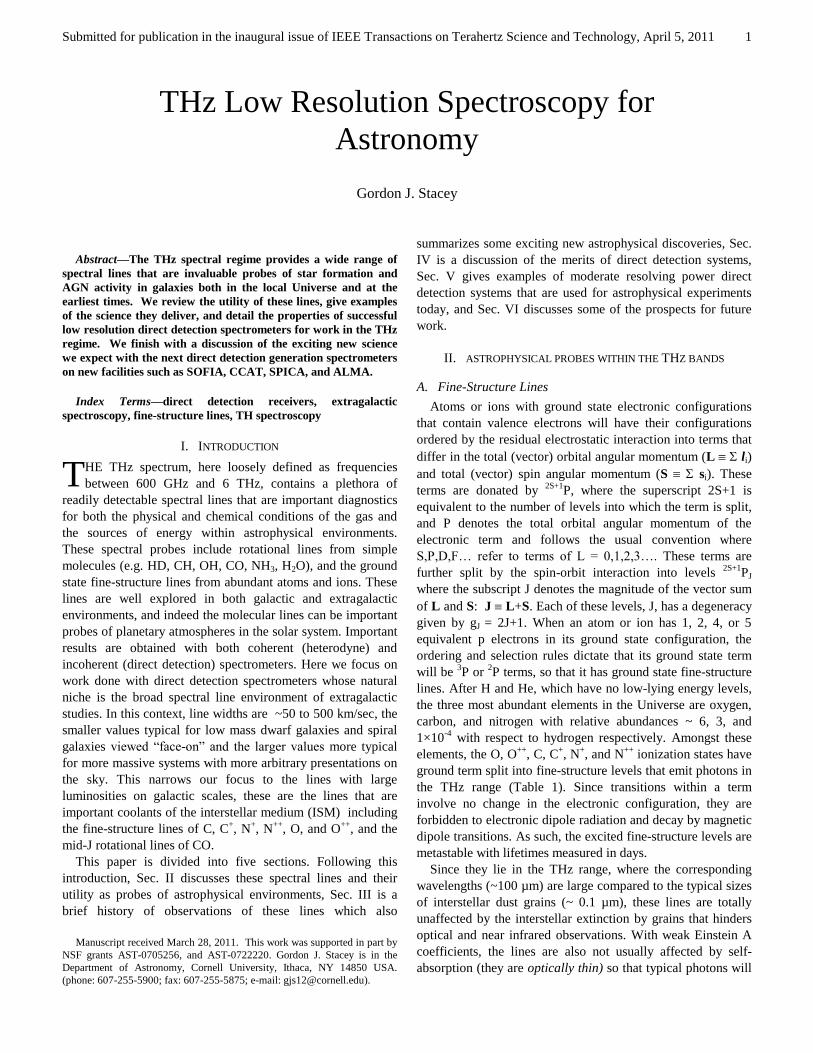
ratios are even stronger indicators of Teff. The [OII] 88/[NII]
122 µm line is especially useful since the levels that emit these
lines have similar critical densities, so that the resulting line
ratio is very insensitive to density as well (Fig. 3).
C. Neutral Gas Lines
In astrophysical environments, as one moves away from the
source of ionizing photons there is a transition from regions
where hydrogen is fully ionized (the HII region) to the neutral
gas clouds beyond. While HII regions and neutral gas clouds
have size-scales of the order parsecs (3.1×10¹⁸
cm), the
transition between the two is fairly abrupt. It is roughly given
by the mean free path of a photon that is capable of ionizing H,
or ~0.01 pc for typical interstellar gas densities. Photons with
energies less than 13.6 eV escape the HII region and penetrate
the neutral gas clouds beyond where they can ionize elements
with ionization potentials less than 13.6 eV (e.g. C), and
photodissociate molecules with dissociation energies less than
13.6 eV (e.g. CO, H2, H2O ) forming a photodissociation
region (PDR) (see [4]). The depth of the PDR into the cloud
can be defined as the depth of penetration of photons capable
of ionizing carbon. This depth is typically determined by the
extinction of these photons by dust, and is roughly given by a
visual extinction, AV~3, which corresponds to a hydrogen
column density of 6×10²¹
cm-2
, or ~1 pc for a typical gas
density of 2000 cm-3
. Within the PDR gas is heated by the
photo-electric (PE) effect – whereby hot electrons are ejected
from grains by FUV photons (6< h < 13.6 eV) and transfer
their excess kinetic energy to the gas before recombining with
grains. The efficiency of this heating mechanism depends on
the grain charge. If the charge gets larger, more of the next
photon’s energy is expended in freeing the electron from the
positive potential of the grain, leaving less excess kinetic
energy for heating the gas, thereby lowering gas heating
efficiency. Therefore, the gas heating efficiency goes down as
the ambient radiation field strength goes up. However, this can
be mitigated by larger gas densities that will increase electron-
grain recombination rates, lowering the grain charge. The PE
heating efficiency is typically 0.1 to 1%. The rest of the FUV
radiation field goes into heating the grains which then emit in
the THz continuum. The gas is primarily cooled through
collisional excitation of the ground state fine-structure levels
of C+ and O and subsequent emission in their THz lines. To a
lesser extent, the neutral carbon fine-structure lines and the
mid-J CO rotational lines are also important coolants for these
PDRs. The combination of the [CII] (158 µm), and [OI] (63
and 146 µm) fine-structure lines enables unique determination
of PDR gas temperature and density. Since the combined
luminosity of these lines gives the gas heating, and the
luminosity of the THz dust continuum radiation is directly
proportional to the luminosity of the ambient radiation fields,
the ratio of the two yields the PE heating efficiency, hence
strength of the ambient FUV radiation fields. It can be shown
(see [5-8]) that for most astrophysical environments that apply
over kilo-parsec (kpc) scales in galaxies, the [CII]/far-IR
continuum ratio in of itself is an excellent indicator of the FUV
field strength and can be used as an indicator of the physical
size of the astrophysical source.
A challenge with the [CII] line is that it arises from both
ionized and neutral gas regions, so that its diagnostic potential
can be problematic. Fortunately, the [NII] 205 µm line has the
same critical density for excitation by electron impacts as [CII]
so that the [CII]/[NII] 205 µm line ratio from HII regions is
only a function of the assumed N+/C
+ abundances within the
HII region (see Fig. 1). Therefore, the 205 µm [NII] line
strength yields the fraction of the observed [CII] emission that
arises from ionized gas ([1]), and the [CII]/[NII] combination
constrains the physical conditions and cooling of two major
components (ionized and PDR) of the ISM.
D. The Importance of the THz Fine-Structure Lines
The THz fine-structure lines are bright. For star forming
galaxies, the brightest of these lines is typically the 158 µm
[CII] line which can be the brightest single spectral line from
the galaxy as a whole, and typically accounts for between 0.1
and 1% of far-IR luminosity of the system ([6]). From the
Milky Way galaxy this amounts to 70 million solar
Lin
e R
ati
o
Teff (1000 K)
B2V O7.5V
Fig. 2. Ratio of the [NIII] 57 µm to [NII] 122 µm and 205 µm lines as a
function of effective temperature of the ionizing star. This line ratio is a
very strong diagnostic of the most massive star on the main sequence with
line ratios that grow by factors of 1000 when the stellar type changes from
B2 to O7.5 stars (based on [2]).
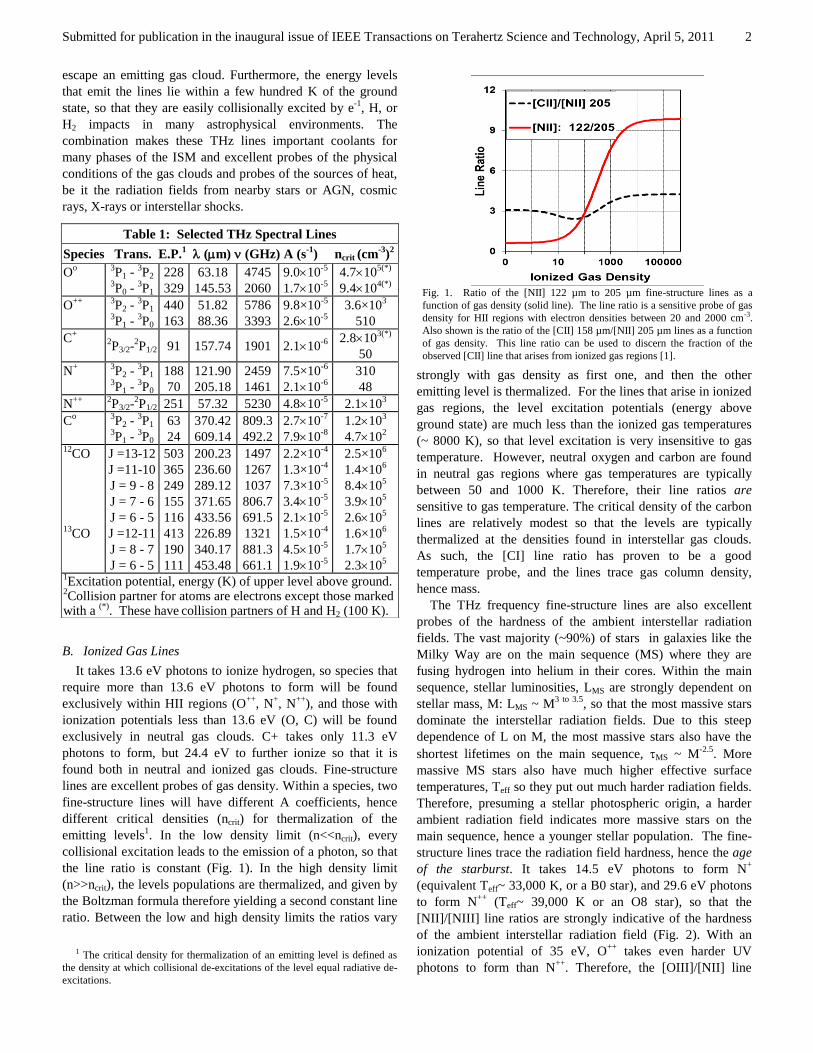
Fig. 3. Ratio of the [OIII] 88 µm to [NII] 122 µm and 205 µm lines for three
ionized gas densities as a function of Teffr of the ionizing star. This ratio is
extremely sensitive to Teff and very insensitive to gas density, especially the
[OIII] 88 to/[NII] 122 µm ratio [3], based on [2].
Submitted for publication in the inaugural issue of IEEE Transactions on Terahertz Science and Technology, April 5, 2011 4
luminosities (L
) [9,10], for nearby ultraluminous infrared
galaxies, those with far-IR luminosities exceeding 1012
L
the
[CII] line can have luminosities of 109 L
([11]), while in
distant hyper- luminous galaxy (Lfar-IR > 1013
L
), ten billion
solar luminosities of power often emerges in this single line
([8,12])! Other lines, in particular [OI] 63 µm and the [OIII]
lines often are nearly equal in luminosity to the [CII] line with
the [NIII], [NII], and [OI] 146 µm lines only a factor of 5 to
10 fainter [13]. These lines are bright because they are cooling
lines. Cooling lines are important as an interstellar cloud must
cool to enable it to collapse to form the next generation of
stars. It is the extinction free nature, and powerful diagnostic
utility of these lines, together with their intrinsic brightness
that makes their study so compelling, even from the most
distant sources in the Universe.
E. Molecular Lines
The brightest of the molecular lines in the THz regime are
the mid-J rotational lines of CO. These lines probe the warm,
dense gas immediately interior to the atomic regions in PDRs
and can be quite strong in molecular shocks. The run of line
intensity with J constrains the physical conditions of the
emitting gas. Several of the rotational lines can be optically
thick, so that radiative transfer effects must be considered.
Typically radiative transfer is handled within a “large-velocity
gradient” model. These models have degeneracies between
optical depth effects, and those of gas excitation (density and
temperature), so that it is important to measure low optical
depth isotopologues of CO, most commonly 13
CO transitions
to break these degeneracies. The absolute strength of the lines
compared to the THz continuum and fine-structure lines can
reveal the source of heat. For example, strong CO lines and
relatively weak THz lines indicates non-PDR origins for the
CO emission: the gas may be heated by super-sonic shocks,
cosmic rays or X-rays [14-17].
F. The Importance of the THz Molecular Lines
Stars form from dense molecular clouds. To enable
sustained collapse, clouds must cool through THz line
radiation. Studies have shown that up to half of the molecular
ISM in starburst galaxies is warm and dense [14-15],[17-19],
so that it it is important to study this gas through it mid-CO
cooling line emission to understand the interplay between star
formation and the natal molecular clouds. For example, for
some starburst nuclei, supernovae blasts might compress the
ISM leading to the formation of the next generation of stars so
that the starburst is self-sustaining, while for others far-UV and
cosmic ray heating, and molecular flows may energize or
disrupt the ISM making the starburst self-limiting [15]. Notice
that since the low J (J< 4) lines have smaller excitation
requirements, their line ratios are relatively insensitive to the
physical parameters of the gas.
III. ASTROPHYSICAL OBSERVATIONS
A. A Short History
The far-IR fine-structure lines discussed above were
recognized as important astrophysical coolants long before
their detection, cf. [20-22], but their astrophysical detection
was hindered by (1) the strong telluric absorption from water
vapor which makes detection of all but the [CI] lines nearly
impossible from ground based telescopes, (2) the uncertain
transition frequencies of the major lines, and (3) the still
emerging state of detector technology at this time. With the
advent of NASA’s airborne observatories including the 12
inch telescope on the Lear Jet Observatory and 36 inch
telescope on the Kuiper Airborne Observatory (KAO) in the
early 1970’s, which enabled observations above 99.8% of the
atmospheric water vapor, most of the lines were rapidly
detected including the [OIII], [OI], and [CII] lines by Martin
Harwit’s group at Cornell University using a grating
spectrometer on the Lear Jet [23-27], the [NIII] line using a
Michelson Fourier transform spectrometer (FTS) on the KAO
[28], the [NII] lines with the FIRAS FTS on COBE [10], and
by Edwin Erickson’s group at NASA Ames using a grating
spectrometer on the KAO [29], and the [CI] lines using
heterodyne receivers on the KAO [30] (492 GHz), and from
the ground [31], (809 GHz). At about the same time, several
of these lines were also detected by balloon-borne experiments
including mapping of the galaxy in [CII] with an Fabry-Perot
interferometer (FPI) [32], and the Orion Nebula in several
lines with a Michelson interferometer [33]. These galactic
observations were soon followed up by extragalactic FPI work
in the Townes/Genzel group at UC Berkeley and at MPE
Garching (e.g. [6],[34-36]) and within Edwin Erickson’s group
at NASA Ames ([37-39]). Nearly all of these observations
were obtained with direct detection spectrometers (gratings,
FTS, and FPI) that utilized Ga:Ga photoconductors as
detective devices. The exceptions were the [CI] lines that were
first detected using heterodyne techniques using hot electron
bolometers ([30]) or Schottky-diodes as mixers ([31]).
The first THz molecular lines detected from external
galaxies were the bright mid-J CO rotational lines. These lines
were first detected using heterodyne receivers from galactic
sources. The first extra-galactic detection of a mid-J line, the
CO(6-5) line at 690 GHz was detected from the nearby
starburst nuclei of NGC 253, M82, and IC 342 using a
Schottky-diode based receiver [18]. The CO(7-6) (809 GHz)
line was first detected and mapped from an extragalactic
source in the local Universe, NGC 253 using a direct detection
spectrometer, SPIFI ([14] see below). (The line had previously
been detected from high redshift sources, e.g. [40]). The first
extra-galactic mid-J line of 13
CO detected was the 6-5 line,
also detected from NGC 253, using the ZEUS grating
spectrometer, ([15] see below).
In 1996, ESA launched the Infrared Space Observatory, a
60 cm cooled telescope in Earth orbit that contained both a
FPI and a grating spectrometer for THz spectroscopy. The
space-based platform opened an un-obscured view of these
lines, albeit at wavelengths short-ward of the long wavelength
cut-off of stressed Ge:Ga photoconductors, near 200 µm. An
example of ISO based fine-structure line science is outlined
Submitted for publication in the inaugural issue of IEEE Transactions on Terahertz Science and Technology, April 5, 2011 5
below. ISO also for the first time detected several molecules in
absorption against the THz continuum from an extragalactic
source [41-42]. (OH and CH, and 18
OH had previously been
reported in absorption against the THz continuum of Sgr B2
[43-45]). The THz spectrum of the heavily imbedded nucleus
of Arp 220 in particular shows many absorption lines (e.g. OH,
H2O, CH, NH, NH3) which are excellent tracers of very small
gas column densities, and gas phase molecular abundances
[41]. As these rotational lines are permitted transitions, they
are well coupled to the local radiation fields and have been
used to constrain source geometry and the properties of the
sources of the THz continuum radiation [42].
B. M82: A Case Study
There have been many excellent studies of nearby galaxies
in the THz fine-structure lines since the discovery observations
outlined above. For brevity, we focus on studies of M82, the
brightest extragalactic THz source in the sky, and the nearest
starburst galaxy. A starburst galaxy is that is forming stars at
such a high rate that it will exhaust is supply of star forming
gas in a timescale short compared to the lifetime of the
Universe. In normal star forming galaxies like the Milky Way
about half the ISM is in molecular clouds with size-scales of
10 to 20 pc, 5 to 10% of the ISM is contained within PDRs on
these cloud surfaces, and <1% is in the ionized medium.
However, KAO studies of M82 that included the [OI], [OIII],
[NII], [NIII], and [CII] lines revealed an ISM fragmented by
the powerful starburst into tiny ~1 pc diameter molecular
cloudlets [39]. These cloudlets are substantially warmer and
denser than Milky Way counterparts, and only half the mass of
these cloudlets is molecular. The rest – nearly half the total
ISM -- is contained within PDRs on the cloud surfaces formed
by the intense FUV radiation field from the starburst. This
radiation field is about 1000 times stronger than that of the
solar neighborhood and extends over 125 pc scales. The high
pressure clouds are in near pressure equilibrium with ionized
gas and a hot inter-cloud medium that is 10 to 20% of the total
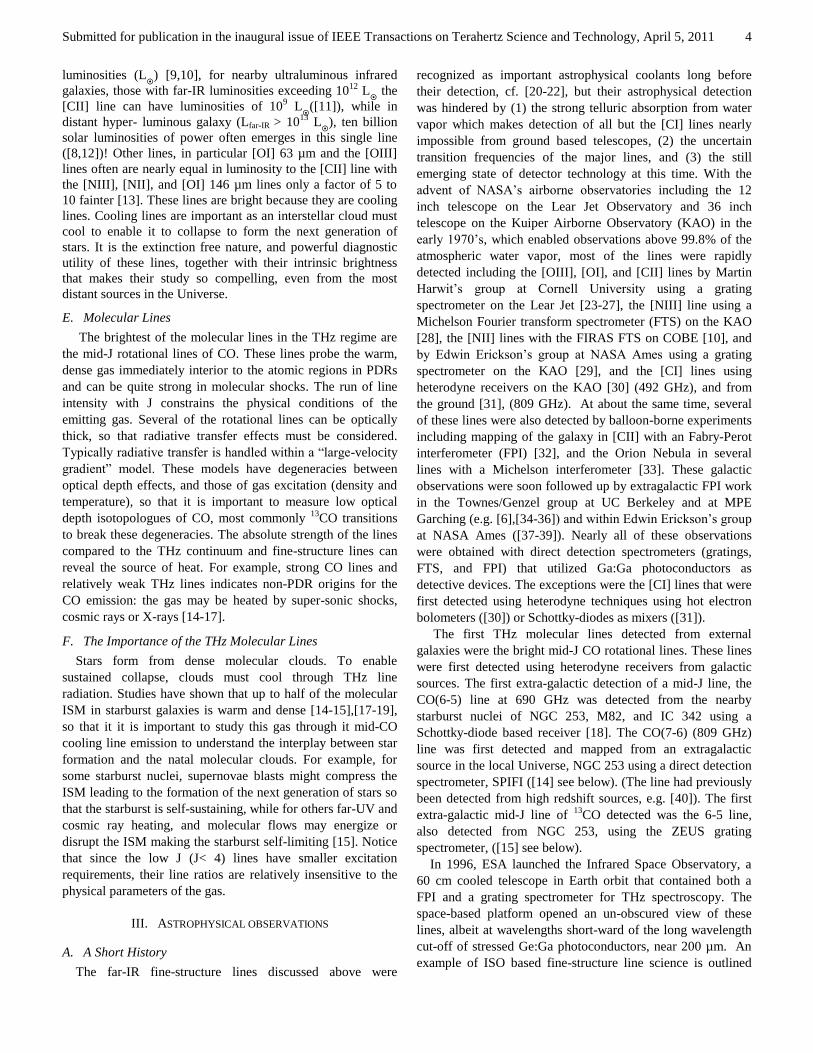
interstellar gas mass. Subsequent studies based on ISO LWS
spectroscopy (Fig. 4) of these lines strongly constrained the
stellar mass function. It is best modeled as a 3 to 5 million year
old instantaneous starburst with a 100 solar mass upper limit to
the initial mass function [46].
C. Recent Results: Herschel and Markarian 231
ESA launched the 3.5 m aperture passively cooled Herschel
Space Observatory (HSO) on May 14, 2009. It is expected to
operate until its cryogen supply runs out sometime in early
2013. Herschel is dedicated to far-IR and submm wavelength
photometry and spectroscopy and is performing at or beyond
expectations in nearly every mode. Of relevance to the
discussion here are the PACs and SPIRE spectrometers
operating respectively in the 55 to 210 and 194 to 671 µm
spectral regions (see Sec. V). These direct detection
spectrometers have been enormously successful delivering a
wide variety of science from studies of the planets to star
formation in galaxies at redshifts beyond 2.2 – when the
Universe was less than 3 Giga years old. In this section, we
briefly describe the SPIRE results obtained on Mrk 231.
Mrk 231 is a representative of the ULIRG class of galaxies
that were originally discovered by the IRAS satellite. These
galaxies emit most (up to 99%!) of their bolometric luminosity
in the THz dust continuum and by definition have THz dust
continuum luminosities in excess of 1012
L
. The large THz to
optical luminosity ratio means their source(s) of radiant
energy, be it stellar photospheres or accretion disks enveloping
super-massive black holes, are enshrouded in many
magnitudes of extinction by dust. The obscuring dust absorbs
the optical radiation, heats up, and re-radiates the energy in the
THz continuum. Most (~70%) of the ULIRGs are thought to
be powered primarily by star formation, with the rest powered
primary by AGN [47]. Mrk 231 is from the “mixed” class, so
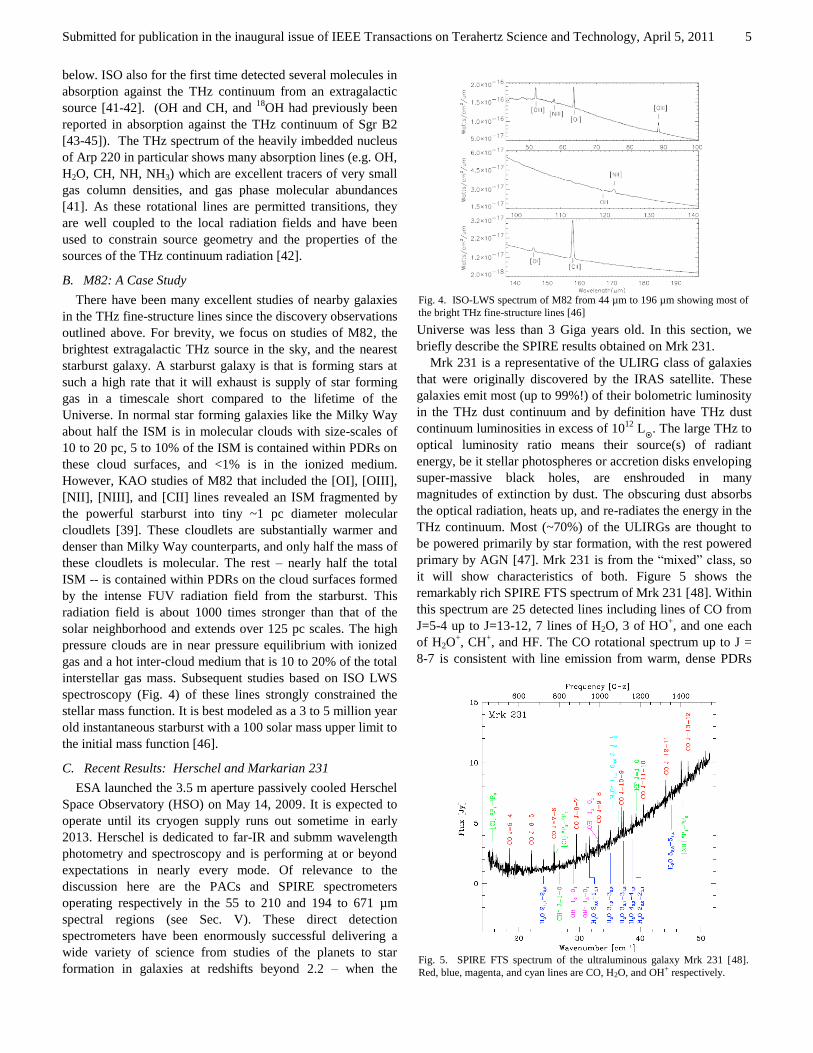
it will show characteristics of both. Figure 5 shows the
remarkably rich SPIRE FTS spectrum of Mrk 231 [48]. Within
this spectrum are 25 detected lines including lines of CO from
J=5-4 up to J=13-12, 7 lines of H2O, 3 of HO+, and one each
of H2O+, CH
+, and HF. The CO rotational spectrum up to J =
8-7 is consistent with line emission from warm, dense PDRs
Fig. 4. ISO-LWS spectrum of M82 from 44 µm to 196 µm showing most of
the bright THz fine-structure lines [46]
Fig. 5. SPIRE FTS spectrum of the ultraluminous galaxy Mrk 231 [48].
Red, blue, magenta, and cyan lines are CO, H2O, and OH+ respectively.
Submitted for publication in the inaugural issue of IEEE Transactions on Terahertz Science and Technology, April 5, 2011 6
enveloping intense regions of star formation. At higher J, the
spectrum flattens out with near uniform intensity. This
flattening of intensity at the highest J is predicted for an X-ray
dominated region (XDR) – a molecular region whose primary
source of heat is intense X-ray illumination [49]. The XDR is
very likely associated with the “confining torus” of molecular
gas thought to envelope the AGN, and the source of X-ray
radiation is most likely the AGN itself. The strong OH+ and
H2O+
line emission strongly support the XDR heating
mechanism. This is the first direct detection of the hot
molecular torus long thought to circulate about the
supermassive black holes that power AGN.
D. Recent Results: The Early Universe
The COBE satellite discovered that integrated over the
history of the universe, half of the photospheric emission from
stars is absorbed by dust in their nascent molecular clouds [50-
51]. The heated dust then reradiates its energy in the FIR, with
power typically peaking in a broad band centered near 60-100
µm. Much of this cosmic infrared background was
subsequently resolved by large and sensitive telescopes into
several classes of luminous star forming galaxies that emit
primarily in the FIR to submm bands (~30 µm < < 1 mm,
S3), most of which lie at redshifts beyond 1 or look-back times
beyond 7.7 Giga years (Gyr) [52], and indeed, the peak of star
formation activity per unit co-moving volume occurred
between redshifts 1 and 3 (2 to 6 Gyr after the Big Bang) at a
rate 10-20 times the current value [53]. Continuum surveys are
the means of discovery for these distant galaxies, but
spectroscopy is the only method for unraveling the physics of
the interstellar medium and the properties of the stellar
populations. Since these systems are highly obscured,
FIR/submm spectroscopy is key to these studies.
The [CI] lines were the first THz fine-structure line detected
at high redshift, detected from the lensed Cloverleaf quasar at
z = 2.56 [40],[54]. These lines, together with CO lines, were
used to show that the molecular disk is surprisingly modest
mass within this system. The brightest THz fine-structure line,
the [CII] line was first observed at high redshift from the very
high redshift (z=6.42) quasar, SDSS J1148+5251 [55]. The
line was subsequently detected in two other high z (z > 4.4)
quasar dominated systems, each of which show a low
L[CII]/LFIR ratio reminiscent of that found in some ULIRG
galaxies in the local Universe [56-57]. In local ULIRGs this
low ratio is interpreted as either intense FUV fields lowering
the L[CII]/LFIR luminosity ratio since [CII] line saturates, while
continuum does not, or due to presence of additional non-PDR
origin for the FIR continuum [11].
The first detection of a high z [CII] line from the z = 1-3
epoch of peak star formation in the Universe, and also the first
detection of [CII] from a high z galaxy not association with a
quasar was made from MIPS J1428 at z =1.33 using the ZEUS
spectrometer [7]. Here the L[CII]/LFIR ratio is large, comparable
to nearby starburst galaxies, and when combined with the
CO(1-0) line, indicates the ISM in MIPS J1428 contains
molecular clouds with similar gas densities and exposed to
similar radiation fields as those found in M82. But, since
MIPS J1428 is forming stars at the rate of 1800/year compared
to ~5/year for M82, the starburst must be enormous in this
source, with an estimated diameter of 3-8 kpc, essentially
involving the entire galaxy. This first detection was followed
up by a [CII] survey containing 12 detections of galaxies in the
z ~1 to 2 interval in the [CII] line quadrupling the numbers of
systems then reported [7] (Fig. 6). Within this survey, those
systems dominated energetically by star formation (SBD) have
a L[CII]/LFIR luminosity ratio eight times that of those
dominated by AGN activity, so this ratio picks out systems
dominated by AGN. As for MIPS J1428, the SBD systems
have starbursts similar in intensity to that of M82, but the
starbursts extend over kiloparsec scales – very unlike the
confined (few hundred pc scales) found for starbursts in local
starburst or ULIRG galaxies. Essentially the entire galaxy is
erupting in a super-massive starburst. Clearly the mode of star
formation is quite different at early times than it is today.
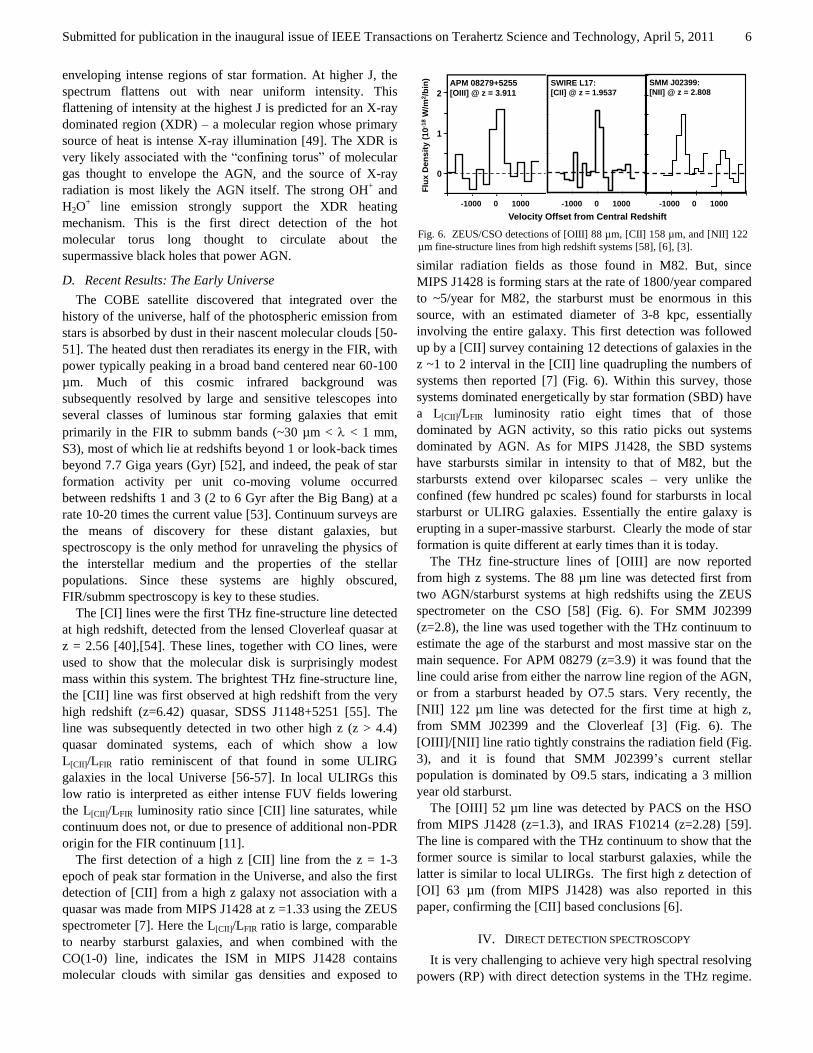
The THz fine-structure lines of [OIII] are now reported
from high z systems. The 88 µm line was detected first from
two AGN/starburst systems at high redshifts using the ZEUS
spectrometer on the CSO [58] (Fig. 6). For SMM J02399
(z=2.8), the line was used together with the THz continuum to
estimate the age of the starburst and most massive star on the
main sequence. For APM 08279 (z=3.9) it was found that the
line could arise from either the narrow line region of the AGN,
or from a starburst headed by O7.5 stars. Very recently, the
[NII] 122 µm line was detected for the first time at high z,
from SMM J02399 and the Cloverleaf [3] (Fig. 6). The
[OIII]/[NII] line ratio tightly constrains the radiation field (Fig.
3), and it is found that SMM J02399’s current stellar
population is dominated by O9.5 stars, indicating a 3 million
year old starburst.
The [OIII] 52 µm line was detected by PACS on the HSO
from MIPS J1428 (z=1.3), and IRAS F10214 (z=2.28) [59].
The line is compared with the THz continuum to show that the
former source is similar to local starburst galaxies, while the
latter is similar to local ULIRGs. The first high z detection of
[OI] 63 µm (from MIPS J1428) was also reported in this
paper, confirming the [CII] based conclusions [6].
IV. DIRECT DETECTION SPECTROSCOPY
It is very challenging to achieve very high spectral resolving
powers (RP) with direct detection systems in the THz regime.
-0.75
0
0.75
1.5
2.25
3
3.75
-2000 -1000 0 1000 2000
SMM J02399:
[NII] @ z = 2.808
-0.5
0
0.5
1
1.5
2
2.5
-2000 -1000 0 1000 2000
SWIRE L17: [CII] @ z = 1.9537
-0.5
0
0.5
1
1.5
2
2.5
-2000 -1000 0 1000 2000
SWIRE L17: [CII] @ z = 1.9537
-0.5
0.5
1.5
2.5
-2000 0 2000
APM 08279+5255
[OIII] @ z = 3.911
T (M
B) (m
K)
Flu
x D
en
sit
y (
10
-18
W/m
2/b
in)
v (km/sec)
2
6
0
2
14
0
-0.5
0.5
1.5
2.5
-2000 0 2000
-0.5
0.5
1.5
2.5
-2000 0 2000
APM 08279+5255
[OIII] @ z = 3.911
T (M
B) (m
K)
Flu
x D
en
sit
y (
10
-18
W/m
2/b
in)
v (km/sec)
2
6
0
2
14
0
-0.5
0
0.5
1
1.5
2
2.5
-2000 -1000 0 1000 2000
SWIRE L17: [CII] @ z = 1.9537
Velocity Offset from Central Redshift
-0.5
0
0.5
1
1.5
2
2.5
-2000 -1000 0 1000 2000
SWIRE L17:
[CII] @ z = 1.9537
Fig. 6. ZEUS/CSO detections of [OIII] 88 µm, [CII] 158 µm, and [NII] 122
µm fine-structure lines from high redshift systems [58], [6], [3].
Submitted for publication in the inaugural issue of IEEE Transactions on Terahertz Science and Technology, April 5, 2011 7
For instance, in a single pass configuration, a grating
spectrometer with RP /~105 at 1 THz (=300 µm) needs
an effective delay path, d~105300 µm/2 = 15 meters. Even
within a multiple pass system, like a Fabry-Perot with finesse
~30 the path is still a challenging 50 cm. Therefore, the only
reasonable way to achieve these very high RP at THz
frequencies is with heterodyne detection techniques. However,
for the modest RP required for extragalactic spectroscopy
(1000), delay paths are modest (~15 cm) so that direct
detection spectrometers are straightforward to construct.
In an incoherent, or direct detection spectrometer the energy
of the incoming photon is used to create a signal either by
heating a detector (as in a bolometer) or in causing an electron
to make a quantum transition from a valence to conduction
band in a semi-conductor (as in a photoconductor). A
coherent, or indirect detection system relies on the wave nature
of light. The advantage of a coherent receivers is that the
spectral RP can be made extremely high, and the preservation
of phase makes them easy use for aperture synthesis. The
systems we compare to in the THz band are heterodyne
receivers, where the THz wave from the astronomical source is
beat against a local oscillator to mix the signal down to
gigahertz frequencies where it is efficiently detected in a
square law device such as an SIS mixer. Coherent detection
preserves photon phase and requires signal amplification
before detection. This results in an uncertainty in photon
occupation number of one photon/Hz/sec. This “quantum
noise” when expressed in terms of temperature of a radiation
field that produces the same noise, is given by TQN = h/k = 48
(/THz) K, where h and k are Planck’s and Boltzman’s
constants respectively. The quantum noise is unavoidable, and
provides a sensitivity floor for the receiver noise temperature
of a heterodyne receiver: Trec > TQN. The best modern
receivers come within a factor of ~4 of the QN limit at low
frequencies (e.g. Trec (DSB) ~50 K @ 345 GHz [60], and 75 K
at 670 GHz [61]), and within a factor of 15-25 of the QN limit
at frequencies above 1.2 THz (e.g. Trec (DSB) ~1000 K @ 1.3
THz [62], and ~3000 K at 2.55 THz [63]).
Arguably, one of the most exciting applications of moderate
RP THz spectroscopy today is the detection of the THz fine-
structure lines from high redshift galaxies. This entails
maximizing point source sensitivity over broad bandwidths.
Here we compare the relative utility of coherent and
incoherent receivers for this work, and demonstrate a
compelling case for direct detection at THz frequencies. In
terms of the receiver temperature in the presence of
background with equivalent noise temperature Tbkg, the rms
noise temperature at the front end of a coherent receiver, TFE
in a bandwidth , in integration time, t is given by:
2/1
t
TTaT
recbkg
FE
where a=1 or 2 depending on whether the receiver is
configured for single-side-band or double-side-band detection.
Clearly if the background is large, and the receiver
temperature is small, the effect of the receiver temperature on
the overall sensitivity is small. This would be the case for a
receiver at 100 GHz, with noise temperature ~ 4TQN ~19 K,
operating from the ground where the combined emissivity of
the telescope and the sky might be 15%, i.e. Tbkg = 0.15*300 K
= 45 K. However, in space, where Tbkg can approach 2.73 K,
and at THz frequencies, where 4 to 15TQN = 190 to 720 K, the
receiver noise can easily dominate that of the background.
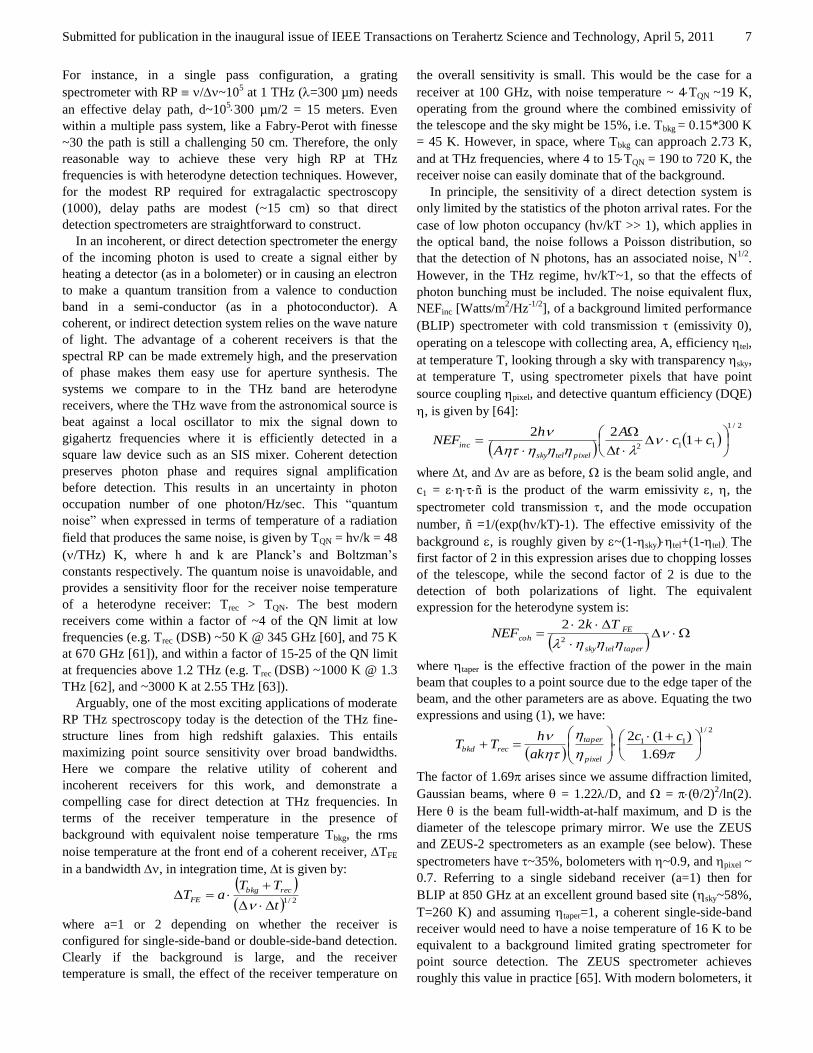
In principle, the sensitivity of a direct detection system is
only limited by the statistics of the photon arrival rates. For the
case of low photon occupancy (h/kT >> 1), which applies in
the optical band, the noise follows a Poisson distribution, so
that the detection of N photons, has an associated noise, N1/2
.
However, in the THz regime, h/kT~1, so that the effects of
photon bunching must be included. The noise equivalent flux,
NEFinc [Watts/m2/Hz
-1/2], of a background limited performance
(BLIP) spectrometer with cold transmission (emissivity 0),
operating on a telescope with collecting area, A, efficiency tel,
at temperature T, looking through a sky with transparency sky,
at temperature T, using spectrometer pixels that have point
source coupling pixel, and detective quantum efficiency (DQE)
, is given by [64]:
2/1
1121
22
cc
t
A
A
hNEF
pixeltelsky
inc
where t, and are as before, is the beam solid angle, and
c1 = ñ is the product of the warm emissivity , , the
spectrometer cold transmission , and the mode occupation
number, ñ =1/(exp(h/kT)-1). The effective emissivity of the
background , is roughly given by ~(1-sky)tel+(1-tel). The
first factor of 2 in this expression arises due to chopping losses
of the telescope, while the second factor of 2 is due to the
detection of both polarizations of light. The equivalent
expression for the heterodyne system is:
tapertelsky
FE
coh
TkNEF
2
22
where taper is the effective fraction of the power in the main
beam that couples to a point source due to the edge taper of the
beam, and the other parameters are as above. Equating the two
expressions and using (1), we have:
2/1
11
69.1
)1(2
cc
ak
hTT
pixel
taper
recbkd
The factor of 1.69 arises since we assume diffraction limited,
Gaussian beams, where = 1.22/D, and = (/2)2/ln(2).
Here is the beam full-width-at-half maximum, and D is the
diameter of the telescope primary mirror. We use the ZEUS
and ZEUS-2 spectrometers as an example (see below). These
spectrometers have ~35%, bolometers with ~0.9, and pixel ~
0.7. Referring to a single sideband receiver (a=1) then for
BLIP at 850 GHz at an excellent ground based site (sky~58%,
T=260 K) and assuming taper=1, a coherent single-side-band
receiver would need to have a noise temperature of 16 K to be
equivalent to a background limited grating spectrometer for
point source detection. The ZEUS spectrometer achieves
roughly this value in practice [65]. With modern bolometers, it
Submitted for publication in the inaugural issue of IEEE Transactions on Terahertz Science and Technology, April 5, 2011 8
is straight-forward to achieve BLIP in the THz bands for RPs
~10,000, from the ground and airborne facilities so that direct
detection systems are the spectrometers of choice for detecting
broad spectral lines.
V. DIRECT DETECTION THZ SPECTROMETERS IN USE TODAY
In this section we describe four current state-of-the-art
spectrometers in use at THz frequencies today, including a
Fabry-Perot interferometer (SPIFI), a long-slit grating
spectrometer (ZEUS), an image slicing grating spectrometer
(PACS), and a Fourier transform spectrometer (SPIRE). Each
of these spectrometers performs close to the fundamental
limits, and due to their unique architecture, has a unique niche
of scientific excellence.
A. Comparisons Between Direct Detection Spectrometers
The choice of direct detection spectrometer strongly
depends on the science at hand. An FPI or an FTS have much
larger luminosity-resolution products at a given R than grating
spectrometers that require entrance and exit slits [66]. The
FPI/FTS are also readily adapted to imaging spectroscopy so
that within limits given by the angular divergence of rays in the
beam, large, 2-dimensional focal plane arrays of detectors are
easily implemented into these spectrometers creating
spectroscopic imagers. For detection of a single isolated line
over broad regions, the FPI will win over an FTS since, in a
BLIP environment, the narrow band of the FPI will deliver
much higher sensitivity than the broadband FTS (below). If,
however, one wishes to detect many lines over a very broad
range, this sensitivity advantage of the FPI becomes small, and
an FTS becomes competitive. However, in terms of raw
sensitivity for point source detection, a spectrally multiplexed
grating spectrometer is the instrument of choice.
Let us compare a monochrometer (FPI or grating
spectrometer) to an FTS of the same RP (see also [67]). We
desire to obtain a spectrum with overall bandwidth B, split into
N spectral resolution elements, : B=N. Suppose both
instruments have BLIP with noise per resolution element in the
monochrometer given by mono. The FTS takes in the entire
bandwidth, B at the same time, encoding the power of all
spectral elements into each step of the interferogram. Since the
FTS detector therefore sees the full bandwidth, the noise per
unit time is larger than that of the monochrometer by
FTS=(B/)1/2mono=N
1/2mono. However, if the monochro-
meter is an FPI, one has to scan N resolution elements to
deliver the equivalent spectrum as the FTS does in a single
inteferogram. Therefore, the total time to deliver the same
spectrum is N times longer, so that N interferograms are
obtained in the same time as one FPI scan. In this case, then
the noise of the FTS spectrum goes done by N1/2
, and the two
systems are equal.2 However, a spectrally multiplexed grating
2 Note that we have ignored the factor of 2 encoding losses of the FTS in
this argument. This loss is because the average signal of the interferogram is
half the white light signal. However, the FPI will likely have smaller
transmission than the FTS due to etalon absorption or the extra filtration
needed, so this encoding loss is at least in part cancelled in the comparison.
spectrometer can have N detectors in the dispersion direction,
so that it need not spectrally scan. For this case then, the
grating spectrometer is more sensitive than the FTS by N1/2
. If,
however, the detectors are not background limited – i.e. the
noise is independent of bandwidth – the sensitivities become
equal again. In this case, the FTS becomes a very interesting
choice since it delivers the same N resolution element
spectrum as the grating spectrometer, but with just one
detector, not N so that it provides a much more effective use of
what is often the rarest commodity, the numbers of pixels.
B. SPIFI – A Bolometer-based Imaging Fabry-Perot
The South Pole Imaging Fabry-Perot Interferometer
(SPIFI) is the first direct detection imaging spectrometer for
use in the submillimeter bands [64], [68-69]. Unlike previous
THz astronomical spectrometers that used either heterodyne
techniques, or photoconductors, SPIFI employed bolometers
as detectors for the first time. Bolometers have several clear
advantages over photoconductors: (1) Ge:Ga photoconductors
have DQE’s of the order 3 to 26% [70-71]. In contrast, it is
easy to design a bolometer with 50% DQE over very large
bandwidths, or by using tuned backshorts, > 90% DQE over
broad (/ ~ 3) bandwidths [72]. (2) Photoconductors detect
photons by discretely generating photoelectrons (or holes).
The generation and recombination of these photoelectrons
generates shot noise, commonly termed generation
recombination (GR) noise. Bolometers are thermal devices so
that they do not suffer from GR noise. Therefore, for a given
DQE, a bolometer will be twice as sensitive as a
photoconductor. (3) Bolometers are inherently broad-band
with nearly constant DQE over this band. Unlike
photoconductors, bolometers do not have long wavelength
cut-offs due to minimum energy requirements for promotion of
electrons from the conduction to valence bands, or poor short-
wavelength performance due to strong frequency dependence
of ionization cross sections. The photoconductor with the
longest wavelength cut-off is stressed Ge:Ga, which has a
long-wavelength cut-off near 210 m or 1.43 THz. The
combined sensitivity advantage of bolometers as detectors
over photoconductor goes as NEP ½(PC/bol)1/2
, and can
be large. As a working demonstration, under similar
background conditions, SPIFI at 1.5 THz (200 m) is a factor
of ~10 more sensitive than background limited spectrometers
that employed stressed Ge:Ga photoconductors as detective
devices [1],[29],[70].
SPIFI is an imaging Fabry-Perot interferometer designed to
work in the 850 GHz window available to the JCMT on
Mauna Kea, and the 1.5 THz window available to the AST/RO
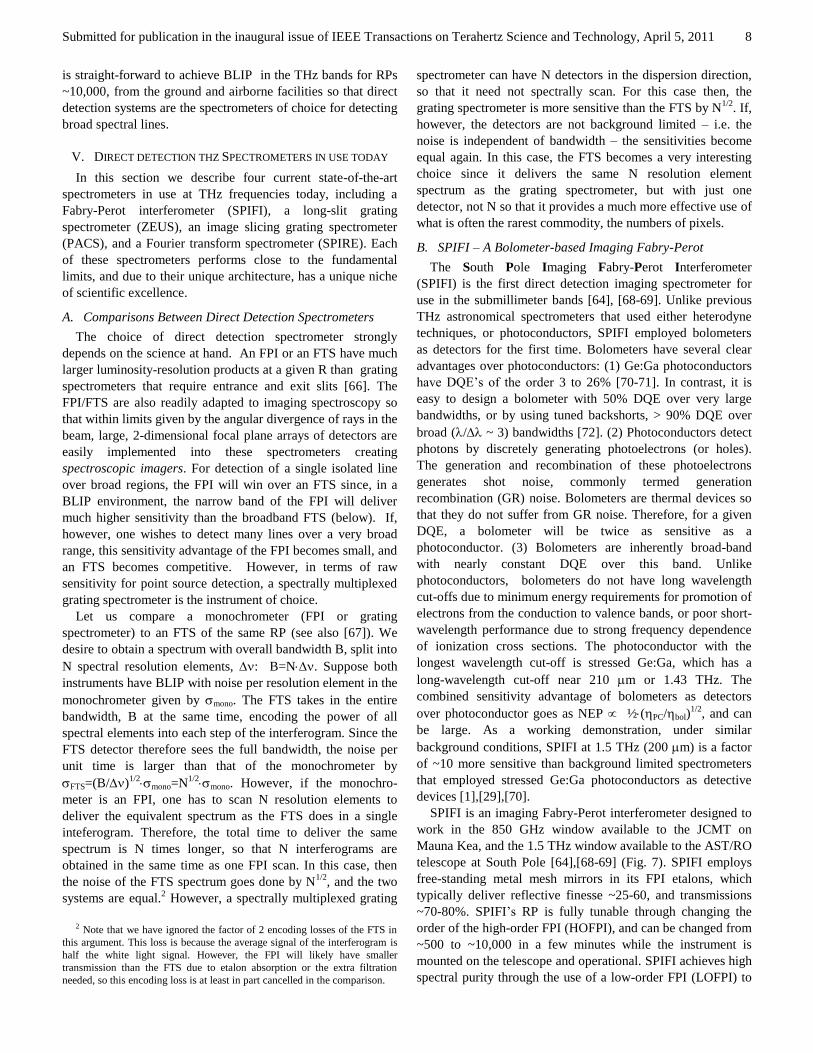
telescope at South Pole [64],[68-69] (Fig. 7). SPIFI employs
free-standing metal mesh mirrors in its FPI etalons, which
typically deliver reflective finesse ~25-60, and transmissions
~70-80%. SPIFI’s RP is fully tunable through changing the
order of the high-order FPI (HOFPI), and can be changed from
~500 to ~10,000 in a few minutes while the instrument is
mounted on the telescope and operational. SPIFI achieves high
spectral purity through the use of a low-order FPI (LOFPI) to
Submitted for publication in the inaugural issue of IEEE Transactions on Terahertz Science and Technology, April 5, 2011 9
select the desired order of the HOFPI, and a fixed bandpass
filter to select the desired order of the LOFPI, enabling
operation of the LOFPI in orders as high as 10 to 20. The
detective devices in SPIFI are a 5×5 array of bolometers from
Goddard Space Flight Center (GSFC), that are held at 60 mK
in an adiabatic demagnetization refrigerator (ADR). SPIFI was
deployed 6 times on the 15 m JCMT. Scientific highlights
from these runs included the first detection and mapping of the
CO(7-6) line from NGC 253, and the first large-scale map of
the CO(7-6) and [CI] lines from the Galactic Center
circumnuclear ring [14],[73-74].
SPIFI was also deployed on the 1.7 m AST/RO telescope at
South Pole over the 2004 and 2005 Austral winter. The first
season was cut short due to an unexpected rapid depletion of
the liquid helium supply for the base, but the second season
was quite successful. SPIFI was used in both the 859 GHz and
1.5 THz telluric windows. The highlight of the deployment
was the detection and mapping of the [NII] 205 µm line from
the Carina star formation region [1]. This was the first
detection of this astrophysically important line from the
ground, and its strength, when compared with the ISO [CII]
and [NII] 122 µm mapping of the nebula demonstrates that the
HII regions enveloping the Carina Nebula are low density (ne
~ 30 cm_3
), and that only 30% of the observed [CII] line
radiation comes from the ionized medium (Fig. 1). Most
(70%) of the [CII] radiation arises from PDRs.
SPIFI was close to background limited in both bands of
operation: within a factor of 2 at 850 GHz [68], and within a
factor of 1.4 at 1.5 THz [69]. The equivalent single-side-band
receiver temperature was Trec(SSB) ~ 310 K (40 K DSB) at
850 GHz, and Trec(SSB) ~ 610 K (190 K DSB) at 1.5 THz,
which compare quite favorably with the best heterodyne
systems today [62],[75].
C. ZEUS/ZEUS-2: Bolometer Based Grating Spectrometers
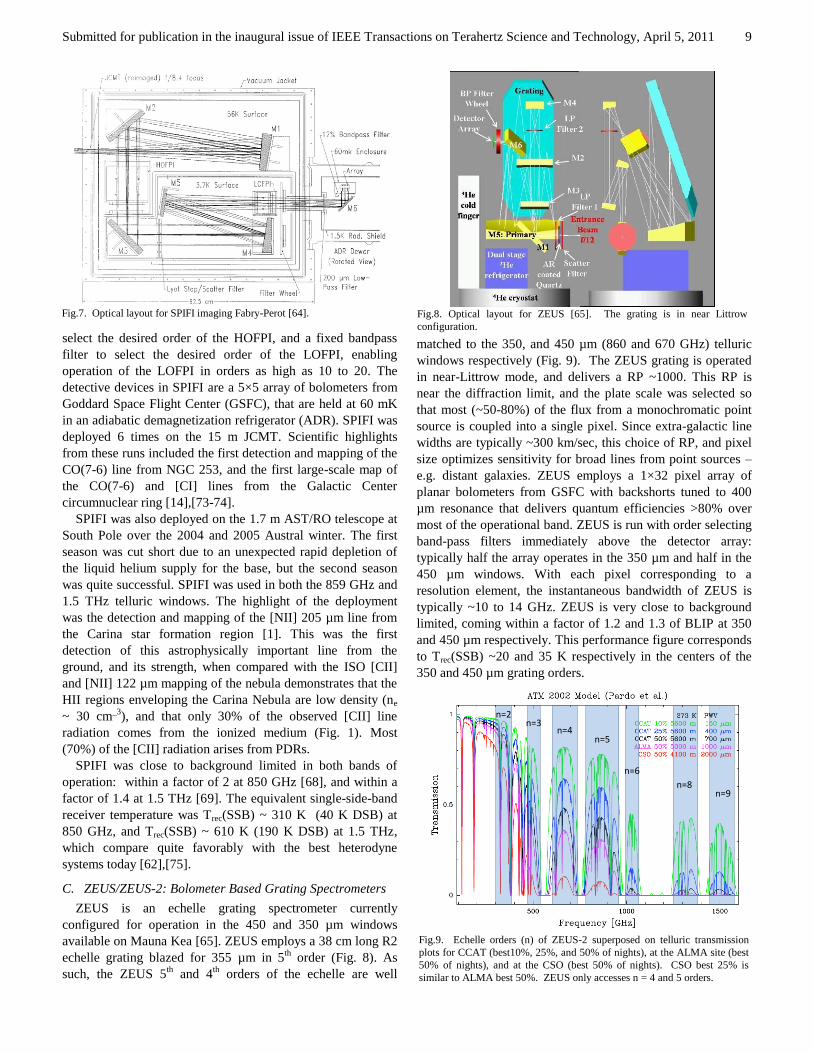
ZEUS is an echelle grating spectrometer currently
configured for operation in the 450 and 350 µm windows
available on Mauna Kea [65]. ZEUS employs a 38 cm long R2
echelle grating blazed for 355 µm in 5th
order (Fig. 8). As
such, the ZEUS 5th
and 4th
orders of the echelle are well
matched to the 350, and 450 µm (860 and 670 GHz) telluric
windows respectively (Fig. 9). The ZEUS grating is operated
in near-Littrow mode, and delivers a RP ~1000. This RP is
near the diffraction limit, and the plate scale was selected so
that most (~50-80%) of the flux from a monochromatic point
source is coupled into a single pixel. Since extra-galactic line
widths are typically ~300 km/sec, this choice of RP, and pixel
size optimizes sensitivity for broad lines from point sources –
e.g. distant galaxies. ZEUS employs a 1×32 pixel array of
planar bolometers from GSFC with backshorts tuned to 400
µm resonance that delivers quantum efficiencies >80% over
most of the operational band. ZEUS is run with order selecting
band-pass filters immediately above the detector array:
typically half the array operates in the 350 µm and half in the
450 µm windows. With each pixel corresponding to a
resolution element, the instantaneous bandwidth of ZEUS is
typically ~10 to 14 GHz. ZEUS is very close to background
limited, coming within a factor of 1.2 and 1.3 of BLIP at 350
and 450 µm respectively. This performance figure corresponds
to Trec(SSB) ~20 and 35 K respectively in the centers of the
350 and 450 µm grating orders.
Fig.8. Optical layout for ZEUS [65]. The grating is in near Littrow
configuration.
n=5
n=6
n=4n=3
n=2
n=9n=8
Fig.9. Echelle orders (n) of ZEUS-2 superposed on telluric transmission
plots for CCAT (best10%, 25%, and 50% of nights), at the ALMA site (best
50% of nights), and at the CSO (best 50% of nights). CSO best 25% is
similar to ALMA best 50%. ZEUS only accesses n = 4 and 5 orders.
Fig.7. Optical layout for SPIFI imaging Fabry-Perot [64].
Submitted for publication in the inaugural issue of IEEE Transactions on Terahertz Science and Technology, April 5, 2011 10
ZEUS has been a regular on the 10.4 m CSO telescope since
spring of 2006. Highlights of ZEUS/CSO include the detection
of the 13
CO(6-5) line from the starburst nucleus of NGC 253 –
the first detection of the 13
CO(6-5) line from an external
galaxy, and the first detection of any 13
CO transition greater
than J=3-2 from a source beyond the Magellanic clouds [15],
and the several high redshift firsts mentioned above including
(1) the first detection of the a THz fine-structure line of [OIII]
at redshifts beyond 0.05 [58]; (2) the first detection of the
[CII] line from the epoch of maximum star formation in the
early Universe [7]; (4) the first survey of the [CII] line at high
redshift [8]; and (5) the first detection of a THz [NII] line from
a source at redshift beyond 0.05 [3]
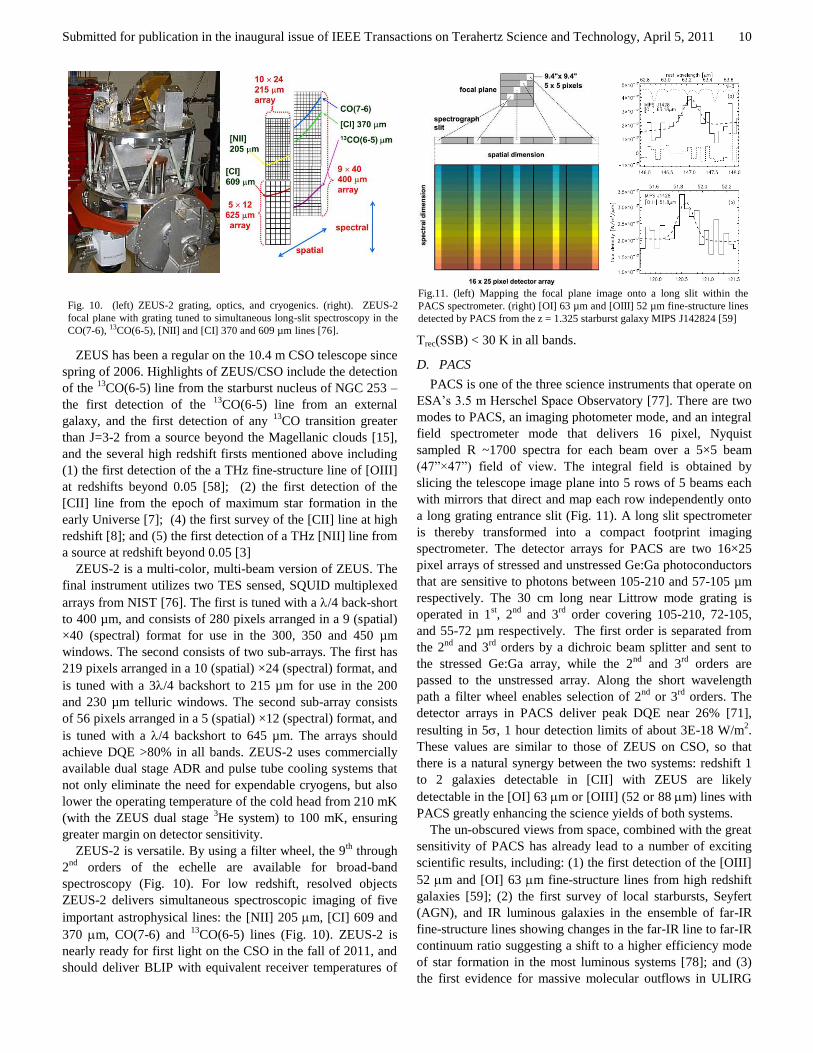
ZEUS-2 is a multi-color, multi-beam version of ZEUS. The
final instrument utilizes two TES sensed, SQUID multiplexed
arrays from NIST [76]. The first is tuned with a /4 back-short
to 400 µm, and consists of 280 pixels arranged in a 9 (spatial)
×40 (spectral) format for use in the 300, 350 and 450 µm
windows. The second consists of two sub-arrays. The first has
219 pixels arranged in a 10 (spatial) ×24 (spectral) format, and
is tuned with a 3/4 backshort to 215 µm for use in the 200
and 230 µm telluric windows. The second sub-array consists
of 56 pixels arranged in a 5 (spatial) ×12 (spectral) format, and
is tuned with a /4 backshort to 645 µm. The arrays should
achieve DQE >80% in all bands. ZEUS-2 uses commercially
available dual stage ADR and pulse tube cooling systems that
not only eliminate the need for expendable cryogens, but also
lower the operating temperature of the cold head from 210 mK
(with the ZEUS dual stage 3He system) to 100 mK, ensuring
greater margin on detector sensitivity.
ZEUS-2 is versatile. By using a filter wheel, the 9th
through
2nd
orders of the echelle are available for broad-band
spectroscopy (Fig. 10). For low redshift, resolved objects
ZEUS-2 delivers simultaneous spectroscopic imaging of five
important astrophysical lines: the [NII] 205 m, [CI] 609 and
370 m, CO(7-6) and 13
CO(6-5) lines (Fig. 10). ZEUS-2 is
nearly ready for first light on the CSO in the fall of 2011, and
should deliver BLIP with equivalent receiver temperatures of
Trec(SSB) < 30 K in all bands.
D. PACS
PACS is one of the three science instruments that operate on
ESA’s 3.5 m Herschel Space Observatory [77]. There are two
modes to PACS, an imaging photometer mode, and an integral
field spectrometer mode that delivers 16 pixel, Nyquist
sampled R ~1700 spectra for each beam over a 5×5 beam
(47”×47”) field of view. The integral field is obtained by
slicing the telescope image plane into 5 rows of 5 beams each
with mirrors that direct and map each row independently onto
a long grating entrance slit (Fig. 11). A long slit spectrometer
is thereby transformed into a compact footprint imaging
spectrometer. The detector arrays for PACS are two 16×25
pixel arrays of stressed and unstressed Ge:Ga photoconductors
that are sensitive to photons between 105-210 and 57-105 µm
respectively. The 30 cm long near Littrow mode grating is
operated in 1st, 2
nd and 3
rd order covering 105-210, 72-105,
and 55-72 µm respectively. The first order is separated from
the 2nd
and 3rd
orders by a dichroic beam splitter and sent to
the stressed Ge:Ga array, while the 2nd
and 3rd
orders are
passed to the unstressed array. Along the short wavelength
path a filter wheel enables selection of 2nd
or 3rd
orders. The
detector arrays in PACS deliver peak DQE near 26% [71],
resulting in 5, 1 hour detection limits of about 3E-18 W/m2.
These values are similar to those of ZEUS on CSO, so that
there is a natural synergy between the two systems: redshift 1
to 2 galaxies detectable in [CII] with ZEUS are likely
detectable in the [OI] 63 m or [OIII] (52 or 88 m) lines with
PACS greatly enhancing the science yields of both systems.
The un-obscured views from space, combined with the great
sensitivity of PACS has already lead to a number of exciting
scientific results, including: (1) the first detection of the [OIII]
52 m and [OI] 63 m fine-structure lines from high redshift
galaxies [59]; (2) the first survey of local starbursts, Seyfert
(AGN), and IR luminous galaxies in the ensemble of far-IR
fine-structure lines showing changes in the far-IR line to far-IR
continuum ratio suggesting a shift to a higher efficiency mode
of star formation in the most luminous systems [78]; and (3)
the first evidence for massive molecular outflows in ULIRG
Fig. 10. (left) ZEUS-2 grating, optics, and cryogenics. (right). ZEUS-2
focal plane with grating tuned to simultaneous long-slit spectroscopy in the
CO(7-6), 13CO(6-5), [NII] and [CI] 370 and 609 µm lines [76].
Fig.11. (left) Mapping the focal plane image onto a long slit within the
PACS spectrometer. (right) [OI] 63 µm and [OIII] 52 µm fine-structure lines
detected by PACS from the z = 1.325 starburst galaxy MIPS J142824 [59]
Submitted for publication in the inaugural issue of IEEE Transactions on Terahertz Science and Technology, April 5, 2011 11
galaxies that may quench their star formation activity [79].
E. SPIRE
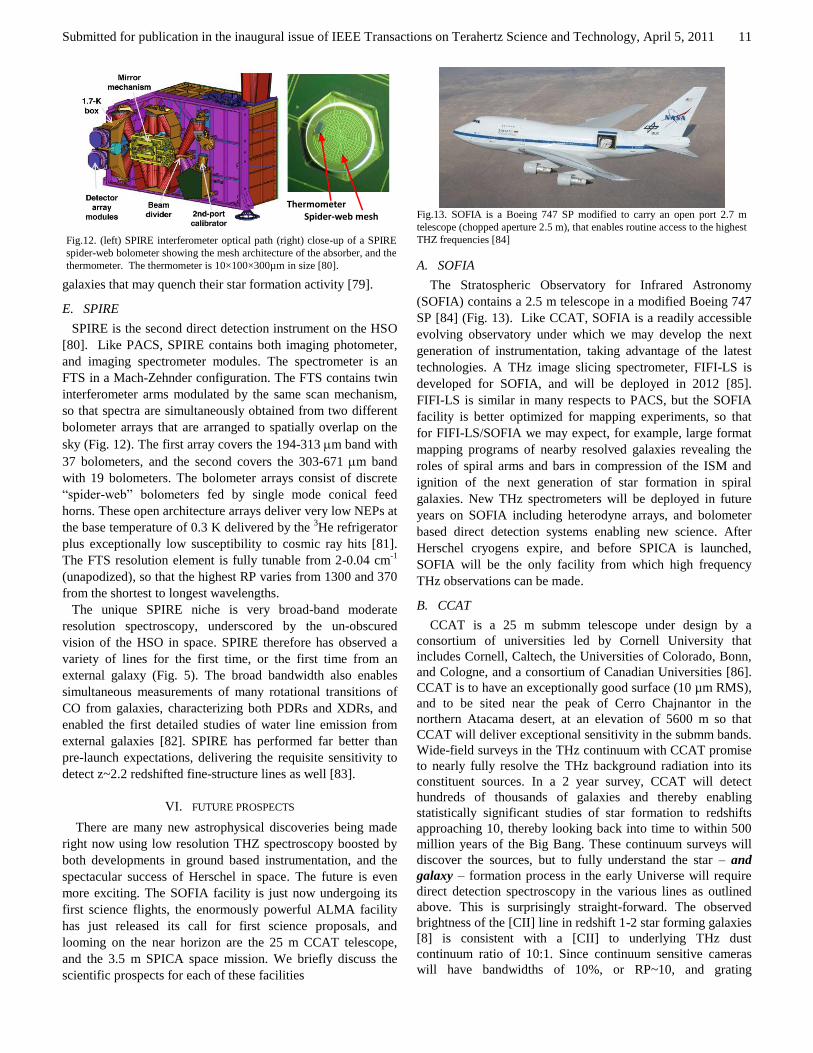
SPIRE is the second direct detection instrument on the HSO
[80]. Like PACS, SPIRE contains both imaging photometer,
and imaging spectrometer modules. The spectrometer is an
FTS in a Mach-Zehnder configuration. The FTS contains twin
interferometer arms modulated by the same scan mechanism,
so that spectra are simultaneously obtained from two different
bolometer arrays that are arranged to spatially overlap on the
sky (Fig. 12). The first array covers the 194-313 m band with
37 bolometers, and the second covers the 303-671 m band
with 19 bolometers. The bolometer arrays consist of discrete
“spider-web” bolometers fed by single mode conical feed
horns. These open architecture arrays deliver very low NEPs at
the base temperature of 0.3 K delivered by the 3He refrigerator
plus exceptionally low susceptibility to cosmic ray hits [81].
The FTS resolution element is fully tunable from 2-0.04 cm-1
(unapodized), so that the highest RP varies from 1300 and 370
from the shortest to longest wavelengths.
The unique SPIRE niche is very broad-band moderate
resolution spectroscopy, underscored by the un-obscured
vision of the HSO in space. SPIRE therefore has observed a
variety of lines for the first time, or the first time from an
external galaxy (Fig. 5). The broad bandwidth also enables
simultaneous measurements of many rotational transitions of
CO from galaxies, characterizing both PDRs and XDRs, and
enabled the first detailed studies of water line emission from
external galaxies [82]. SPIRE has performed far better than
pre-launch expectations, delivering the requisite sensitivity to
detect z~2.2 redshifted fine-structure lines as well [83].
VI. FUTURE PROSPECTS
There are many new astrophysical discoveries being made
right now using low resolution THZ spectroscopy boosted by
both developments in ground based instrumentation, and the
spectacular success of Herschel in space. The future is even
more exciting. The SOFIA facility is just now undergoing its
first science flights, the enormously powerful ALMA facility
has just released its call for first science proposals, and
looming on the near horizon are the 25 m CCAT telescope,
and the 3.5 m SPICA space mission. We briefly discuss the
scientific prospects for each of these facilities
A. SOFIA
The Stratospheric Observatory for Infrared Astronomy
(SOFIA) contains a 2.5 m telescope in a modified Boeing 747
SP [84] (Fig. 13). Like CCAT, SOFIA is a readily accessible
evolving observatory under which we may develop the next
generation of instrumentation, taking advantage of the latest
technologies. A THz image slicing spectrometer, FIFI-LS is
developed for SOFIA, and will be deployed in 2012 [85].
FIFI-LS is similar in many respects to PACS, but the SOFIA
facility is better optimized for mapping experiments, so that
for FIFI-LS/SOFIA we may expect, for example, large format
mapping programs of nearby resolved galaxies revealing the
roles of spiral arms and bars in compression of the ISM and
ignition of the next generation of star formation in spiral
galaxies. New THz spectrometers will be deployed in future
years on SOFIA including heterodyne arrays, and bolometer
based direct detection systems enabling new science. After
Herschel cryogens expire, and before SPICA is launched,
SOFIA will be the only facility from which high frequency
THz observations can be made.
B. CCAT
CCAT is a 25 m submm telescope under design by a
consortium of universities led by Cornell University that
includes Cornell, Caltech, the Universities of Colorado, Bonn,
and Cologne, and a consortium of Canadian Universities [86].
CCAT is to have an exceptionally good surface (10 µm RMS),
and to be sited near the peak of Cerro Chajnantor in the
northern Atacama desert, at an elevation of 5600 m so that
CCAT will deliver exceptional sensitivity in the submm bands.
Wide-field surveys in the THz continuum with CCAT promise
to nearly fully resolve the THz background radiation into its
constituent sources. In a 2 year survey, CCAT will detect
hundreds of thousands of galaxies and thereby enabling
statistically significant studies of star formation to redshifts
approaching 10, thereby looking back into time to within 500
million years of the Big Bang. These continuum surveys will
discover the sources, but to fully understand the star – and
galaxy – formation process in the early Universe will require
direct detection spectroscopy in the various lines as outlined
above. This is surprisingly straight-forward. The observed
brightness of the [CII] line in redshift 1-2 star forming galaxies
[8] is consistent with a [CII] to underlying THz dust
continuum ratio of 10:1. Since continuum sensitive cameras
will have bandwidths of 10%, or RP~10, and grating
ThermometerSpider-web mesh
Fig.12. (left) SPIRE interferometer optical path (right) close-up of a SPIRE
spider-web bolometer showing the mesh architecture of the absorber, and the
thermometer. The thermometer is 10×100×300µm in size [80].
Fig.13. SOFIA is a Boeing 747 SP modified to carry an open port 2.7 m
telescope (chopped aperture 2.5 m), that enables routine access to the highest
THZ frequencies [84]
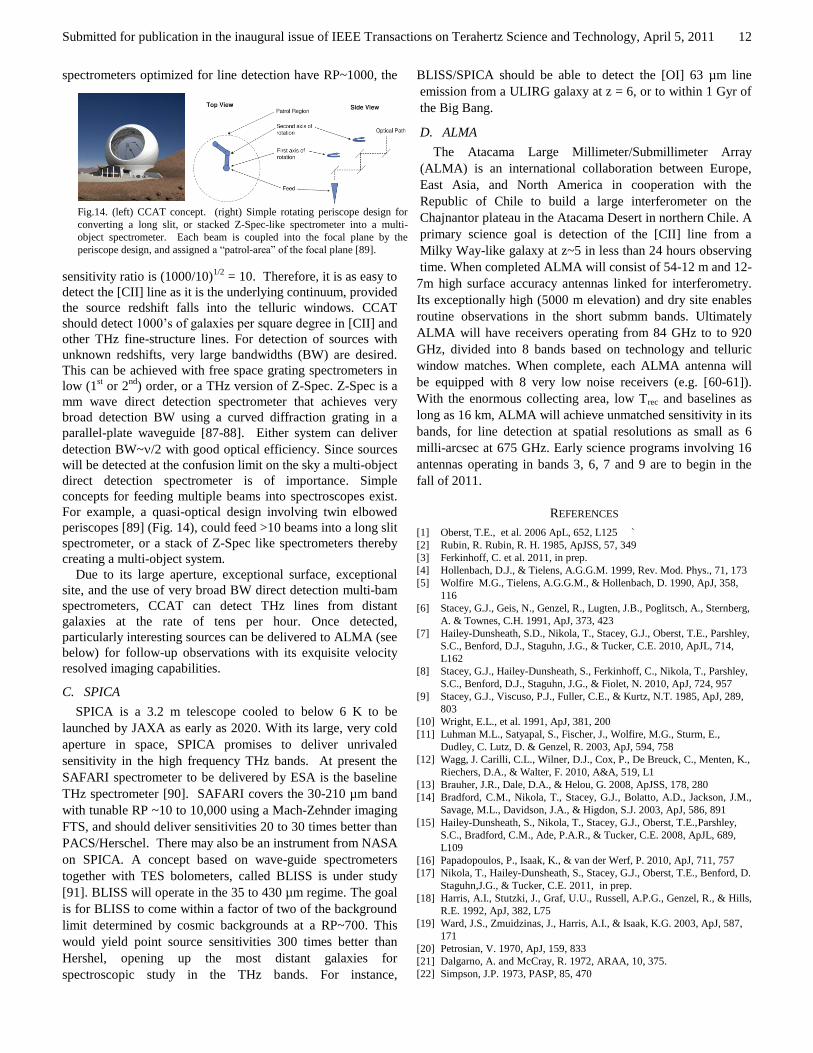
Submitted for publication in the inaugural issue of IEEE Transactions on Terahertz Science and Technology, April 5, 2011 12
spectrometers optimized for line detection have RP~1000, the
sensitivity ratio is (1000/10)1/2
= 10. Therefore, it is as easy to
detect the [CII] line as it is the underlying continuum, provided
the source redshift falls into the telluric windows. CCAT
should detect 1000’s of galaxies per square degree in [CII] and
other THz fine-structure lines. For detection of sources with
unknown redshifts, very large bandwidths (BW) are desired.
This can be achieved with free space grating spectrometers in
low (1st or 2
nd) order, or a THz version of Z-Spec. Z-Spec is a
mm wave direct detection spectrometer that achieves very
broad detection BW using a curved diffraction grating in a
parallel-plate waveguide [87-88]. Either system can deliver
detection BW~/2 with good optical efficiency. Since sources
will be detected at the confusion limit on the sky a multi-object
direct detection spectrometer is of importance. Simple
concepts for feeding multiple beams into spectroscopes exist.
For example, a quasi-optical design involving twin elbowed
periscopes [89] (Fig. 14), could feed >10 beams into a long slit
spectrometer, or a stack of Z-Spec like spectrometers thereby
creating a multi-object system.
Due to its large aperture, exceptional surface, exceptional
site, and the use of very broad BW direct detection multi-bam
spectrometers, CCAT can detect THz lines from distant
galaxies at the rate of tens per hour. Once detected,
particularly interesting sources can be delivered to ALMA (see
below) for follow-up observations with its exquisite velocity
resolved imaging capabilities.
C. SPICA
SPICA is a 3.2 m telescope cooled to below 6 K to be
launched by JAXA as early as 2020. With its large, very cold
aperture in space, SPICA promises to deliver unrivaled
sensitivity in the high frequency THz bands. At present the
SAFARI spectrometer to be delivered by ESA is the baseline
THz spectrometer [90]. SAFARI covers the 30-210 µm band
with tunable RP ~10 to 10,000 using a Mach-Zehnder imaging
FTS, and should deliver sensitivities 20 to 30 times better than
PACS/Herschel. There may also be an instrument from NASA
on SPICA. A concept based on wave-guide spectrometers
together with TES bolometers, called BLISS is under study
[91]. BLISS will operate in the 35 to 430 µm regime. The goal
is for BLISS to come within a factor of two of the background
limit determined by cosmic backgrounds at a RP~700. This
would yield point source sensitivities 300 times better than
Hershel, opening up the most distant galaxies for
spectroscopic study in the THz bands. For instance,
BLISS/SPICA should be able to detect the [OI] 63 µm line
emission from a ULIRG galaxy at z = 6, or to within 1 Gyr of
the Big Bang.
D. ALMA
The Atacama Large Millimeter/Submillimeter Array
(ALMA) is an international collaboration between Europe,
East Asia, and North America in cooperation with the
Republic of Chile to build a large interferometer on the
Chajnantor plateau in the Atacama Desert in northern Chile. A
primary science goal is detection of the [CII] line from a
Milky Way-like galaxy at z~5 in less than 24 hours observing
time. When completed ALMA will consist of 54-12 m and 12-
7m high surface accuracy antennas linked for interferometry.
Its exceptionally high (5000 m elevation) and dry site enables
routine observations in the short submm bands. Ultimately
ALMA will have receivers operating from 84 GHz to to 920
GHz, divided into 8 bands based on technology and telluric
window matches. When complete, each ALMA antenna will
be equipped with 8 very low noise receivers (e.g. [60-61]).
With the enormous collecting area, low Trec and baselines as
long as 16 km, ALMA will achieve unmatched sensitivity in its
bands, for line detection at spatial resolutions as small as 6
milli-arcsec at 675 GHz. Early science programs involving 16
antennas operating in bands 3, 6, 7 and 9 are to begin in the
fall of 2011.
REFERENCES
[1] Oberst, T.E., et al. 2006 ApL, 652, L125 `
[2] Rubin, R. Rubin, R. H. 1985, ApJSS, 57, 349
[3] Ferkinhoff, C. et al. 2011, in prep.
[4] Hollenbach, D.J., & Tielens, A.G.G.M. 1999, Rev. Mod. Phys., 71, 173
[5] Wolfire M.G., Tielens, A.G.G.M., & Hollenbach, D. 1990, ApJ, 358,
116
[6] Stacey, G.J., Geis, N., Genzel, R., Lugten, J.B., Poglitsch, A., Sternberg,
A. & Townes, C.H. 1991, ApJ, 373, 423
[7] Hailey-Dunsheath, S.D., Nikola, T., Stacey, G.J., Oberst, T.E., Parshley,
S.C., Benford, D.J., Staguhn, J.G., & Tucker, C.E. 2010, ApJL, 714,
L162
[8] Stacey, G.J., Hailey-Dunsheath, S., Ferkinhoff, C., Nikola, T., Parshley,
S.C., Benford, D.J., Staguhn, J.G., & Fiolet, N. 2010, ApJ, 724, 957
[9] Stacey, G.J., Viscuso, P.J., Fuller, C.E., & Kurtz, N.T. 1985, ApJ, 289,
803
[10] Wright, E.L., et al. 1991, ApJ, 381, 200
[11] Luhman M.L., Satyapal, S., Fischer, J., Wolfire, M.G., Sturm, E.,
Dudley, C. Lutz, D. & Genzel, R. 2003, ApJ, 594, 758
[12] Wagg, J. Carilli, C.L., Wilner, D.J., Cox, P., De Breuck, C., Menten, K.,
Riechers, D.A., & Walter, F. 2010, A&A, 519, L1
[13] Brauher, J.R., Dale, D.A., & Helou, G. 2008, ApJSS, 178, 280
[14] Bradford, C.M., Nikola, T., Stacey, G.J., Bolatto, A.D., Jackson, J.M.,
Savage, M.L., Davidson, J.A., & Higdon, S.J. 2003, ApJ, 586, 891
[15] Hailey-Dunsheath, S., Nikola, T., Stacey, G.J., Oberst, T.E.,Parshley,
S.C., Bradford, C.M., Ade, P.A.R., & Tucker, C.E. 2008, ApJL, 689,
L109
[16] Papadopoulos, P., Isaak, K., & van der Werf, P. 2010, ApJ, 711, 757
[17] Nikola, T., Hailey-Dunsheath, S., Stacey, G.J., Oberst, T.E., Benford, D.
Staguhn,J.G., & Tucker, C.E. 2011, in prep.
[18] Harris, A.I., Stutzki, J., Graf, U.U., Russell, A.P.G., Genzel, R., & Hills,
R.E. 1992, ApJ, 382, L75
[19] Ward, J.S., Zmuidzinas, J., Harris, A.I., & Isaak, K.G. 2003, ApJ, 587,
171
[20] Petrosian, V. 1970, ApJ, 159, 833
[21] Dalgarno, A. and McCray, R. 1972, ARAA, 10, 375.
[22] Simpson, J.P. 1973, PASP, 85, 470
Fig.14. (left) CCAT concept. (right) Simple rotating periscope design for
converting a long slit, or stacked Z-Spec-like spectrometer into a multi-
object spectrometer. Each beam is coupled into the focal plane by the
periscope design, and assigned a “patrol-area” of the focal plane [89].
Submitted for publication in the inaugural issue of IEEE Transactions on Terahertz Science and Technology, April 5, 2011 13
[23] Ward, D.B., Dennison, B., Gull, G., and Harwit, M., 1975, ApJ, 202,
L31.
[24] Melnick, G., Gull, G.E., & Harwit, M. 1978, ApJ, 222, L137
[25] Melnick, G., Gull, G.E., & Harwit, M. 1979, ApJ, 227, L29
[26] Stacey, G.J., Smyers, S.D., Kurtz, N.T., & Harwit, M. 1983, ApJ 265,
L7
[27] Russell, R.W., Melnick, G., Gull, G.E., & Harwit, M. 1980, ApJ, 240,
L99
[28] Moorwood, A.F.M., Baluteau, J.-P., Anderegg, M., Coron, N., Biraud,
Y., & Fitton, B. 1980, ApJ 238, 565
[29] Colgan, S.W.J., Haas, M.R., Erickson, E.F., Rubin, R.H., Simpson, J.P.,
& Russell, R.W. 1993, ApJ, 413, 237
[30] Phillips, T.G., Huggins, P.J., Kuiper, T.B.H., & Miller, R.E. 1980, ApJ,
238, L103
[31] Jaffe, D.T., Harris, A.I., Silber, M., Genzel, R., & Betz, A.L. 1985, ApJ,
209, L59
[32] Shibai, H., et al. 1991, ApJ, 374, 522
[33] Furniss, I., Jennings, R.E., King, K.J., Lightfoot, J.F., Emery, R.J.,
Naylor, D.A., & Fitton, B. 1983, MNRAS, 202, 859
[34] Watson, D.M., Genzel, R., Townes, C.H., Werner, M.W., & Storey,
J.W.V. 1984, ApJ, 279, L1
[35] Crawford, M.K., Genzel, R., Townes, C.H., & Watson, D.M. 1985, ApJ,
291, 755
[36] Madden, S.C., Geis, N., Genzel, R., Herrmann, F., Jackson, J.,
Poglitsch, A., Stacey, G.J., & Townes, C.H. 1993, ApJ, 407, 579
[37] Duffy, P.B, Erickson, E.F., Haas, M.R., & Houck, R.J. 1987, ApJ, 315,
68
[38] Carral,, P., Hollenbach, D., Lord, S.D., Colgan, S.W.J., Haas, M.R.,
Rubin, R.H., & Erickson, E. 1994, ApJ, 423, 223
[39] Lord, S.D., Hollenbach, D.J., Haas, M.R., Rubin, R.H., Colgan, S.W.J.,
& Erickson, E.F. 1996, ApJ, 465, 703
[40] Barvainis, R., Maloney, P., Antonucci, R., & Alloin, D., 1997, ApJ,
484, 695
[41] Gonzalez-Alfonso, E., Smith, H.A., Fischer, J. & Chernicharo, J. 2004,
ApJ, 613, 247
[42] Skinner, C.J., Smith, H.A., Sturm, E., Barlow, M.J., Cohen, R.J., &
Stacey, G.J. 1997, Nature, 386, 472
[43] Storey, J.W.V., Watson, D.M., & Townes, C.H. 1981, ApJL, 244, L27
[44] Stacey, G.J. Lugten, J.B., & Genzel, R. 1987, ApJ, 313, 859
[45] Lugten, J.B. 1987, PhD Thesis, University of California, Berkeley
[46] Colbert, J.W., et al. 1999, ApJ, 511, 721
[47] Genzel, R., et al. 1998, ApJ 498, 579
[48] Van der Werf, P. et al. 2010, A&A, 518, L42
[49] Meijerink, R., Spaans, M., & Israel, F.P. 2007, ApJ, 668, 815
[50] Puget, J.-L., Abergel, A., Bernard, J.-P., Boulanger, F., Burton, W.B.,
Desert, F.-X., Hartmann, D., 1996, A&A, 308, L5
[51] Fixsen, D. J, Dwek, E., Mather, J. C., Bennett, C. L.& Shafer, R. A.,
1998, ApJ, 508, 123
[52] Devlin, M.J., et al. 2009, Nature, 458, 737
[53] Smail, I., Chapman, S.C., Blain, A.W., & Ivison, R.J., 2004, ApJ, 616,
71
[54] Wei, A., Henkel, C., Downes, D., & Walter, F. 2003, A&A, 409, L41
[55] Maiolino, R., et a. 2005, A&A 440, L51.
[56] Iono, D., et al. 2006, ApJ, 645, L97
[57] Maiolino, R., Caselli, P., Nagao, T. Walmsley, M., De Breuck, C., &
Meneghetti, M. 2009, A&A, 500, L1
[58] Ferkinhoff, C., Hailey-Dunsheath, S.D., Nikola, T., Parshley, S.C.,
Stacey, G.J., Benford, D.J., & Staguhn, J.G. 2010, ApJ, 714, L147
[59] Sturm, E. et al. 2010, A&A, 518, L36
[60] Risacher, C. et al., 2006, A&A, 454, L17
[61] Baryshev, A.M., et al. 2008, in Proceedings of the Nineteenth
International Symposium on Space Terahertz Technology, Wolfgang
Wild Ed., 258 (2008)
[62] Weidner, M.C. et al. 2007, IAU Symposium #237, Cambridge
University Press, 495
[63] GREAT instrument sensitivity found at:
http://www.sofia.usra.edu/Science/instruments/instruments_great.html
[64] Bradford, C.M. 2001 PhD Thesis, Cornell University
[65] Hailey-Dunsheath, S. 2009, PhD Thesis, Cornell University
[66] Jacquinot, P. 1954, Journal of the Optical Society of America, 44, 761
[67] Watson, D.M. 1982, PhD thesis, University of California, Berkeley
[68] Bradford, C.M., Stacey, G.J., Swain, M.R., Nikola, T., Bolatto, A.D.,
Jackson, J.M., Savage, M.L., Davidson, J.A., & Ade, P.A.R. 2002,
Appl. Opt. 41, 2561
[69] Oberst, T.E. 2009, PhD Thesis, Cornell University
[70] Stacey, G.J., Beeman, J.W., Haller, E.E., Geis, N., Pogitsch, A. &
Rumitz, M. 1992, IJIMW, 13, 1689
[71] PACS online observing manual http://www.iac.es/proyecto/herschel/pacs/pacs_om.pdf
[72] Reike, G. H. 1994, “Detection of Light from the Ultraviolet to the
Submillimeter”, Cambridge University Press, ISBN 0521410282
[73] Bradford, C.M., Stacey, G.J., Nikola, T., Bolatto, A.D. Jackson, J.M.,
Savage, M.L., & Davidson, J.A. 2005, ApJ., 623, 866
[74] Brisbin, D. et al. 2011, in prep.
[75] Yngvesson, S., et al. 2004, in 15th Int. Symp. Space THz Technology,
ed. G. Narayanan, 365
[76] Ferkinhoff, C. Nikola, T., Parshley, S.C., Stacey, G.J., Irwin, K.D., Cho,
H-M., & Halpern, M. 2010, SPIE, 7741, E..26F
[77] Poglitsch, A., et al. 2010, A&A 518. L2
[78] Gracia-Carpio, J.. et al. 2011 ApJ, 728, L7
[79] Sturm, E., et al. 2011, accepted for publication in A&A
[80] Griffin, M., et al. 2010, A&A, 518, L3
[81] Turner, A.D., et al. 2001, Appl. Opt. 40, 4921
[82] Gonzalex-Alfonso, E. et al. 2010, A&A, 518, L43
[83] Ivison, R. J., Papopoulos, P.P., Smail, I., Greve, T.R., Thomson, A.P.,
Xilouris, E.M., & Chapman, S.C., 2010, A&A, 518, L31
[84] Becklin, E. E., & Gehrz, R.D. 2009, SPIE, 7453, 745302
[85] Klein, R., et al. 2010, SPIE 7735, 77351T
[86] Giovanelli, R., Carpenter, J., Radford, S. Sebring, T., Soifer, T., Stacey,
G., Zmuidzinas, R., et al. Astro2010 White Paper
http://www.submm.org/sci/astro2010/Giovanelli-CCAT.pdf
[87] Bradford, C.M., et al. 2004, SPIE, 5498, 257
[88] Bradford, C.M., et al. 2009, ApJ, 705, 112
[89] Goldsmith, P.F., & Seiffert, M. 2009, PASP, 121, 735
[90] Swinyard, B. et al. 2008, SPIE, 7010, 70100I
[91] Bradford, C.M. et al. 2010, SPIE, 7731, 77310S


![Phase-matched scalable THz generation in two-color ... THz 10 THz 100 THz 1 PHz 10 PHz 300 m 30 m ... Kim presentation at Argonne 2012_no backup.ppt [Compatibility Mode] Author:](https://img.pdfslide.us/doc/110x75/5ac2b9eb7f8b9aca388e95a7/phase-matched-scalable-thz-generation-in-two-color-thz-10-thz-100-thz-1-phz.jpg)