Embed Size (px)
Citation preview

ThyssenKrupp
Presentation ThyssenKrupp, February 2007 0

ThyssenKrupp
Presentation ThyssenKrupp, February 2007 1
Q1 2006/2007 – Overview
Order intake: €13.3 billion, +15% yoy
Sales: €12.3 billion, +13% yoy
EBT: €1,062 million compared to €425 million (Q1 2005/2006)
EPS: €1.31 compared to €0.49 (Q1 2005/2006)
Net financial liabilities: €391 million (Dec 31, 2006) compared tonet financial receivables of €747 million (Sep 30, 2006)
Excellent start to fiscal year 2006/2007

ThyssenKrupp
Presentation ThyssenKrupp, February 2007 2
Highlights
Record quarterly EBT of €1,062 million• Profit contribution by all segments, especially by Steel and Stainless• Crude steel output increased by 3%• Services with strong improvement due to favorable market environment• Technologies and Elevator increased already high earnings levels• Remaining Automotive activities show a slight profit
Significant value creation already in Q1ThyssenKrupp Value Added of €773 million
Continued top-line growth• Double-digit increase in order intake and sales,
especially at Steel and Stainless
Portfolio optimization remains top priority for management

ThyssenKrupp
Presentation ThyssenKrupp, February 2007 3
Group in Figures (I): Quarterly EBT Development and Analysis
Q4 05/06
Q1 05/06
Q2 05/06
Q3 05/06
Q1 06/07
425
773 806
849
1,062
9324
680 830
as reported 425 619
230excl. majornonrecurringitems
positive major nonrecurring effects
>100%
72%
negative major nonrecurring effects
YoYSignificant increase in EBT driven by all segments, mainly by Stainless and Services
QoQDiscontinuation of restructuring costs for remaining Automotive activities; improved internal efficiency;small disposal gains at Automotive and Services
1,032
30

ThyssenKrupp
Presentation ThyssenKrupp, February 2007 4
Group in Figures (II) Net income million € Earnings per share €
540
661
255
441
468
2005/06 2006/07
Q1
Q2
Q3
1,704
1.31
0.49
0.84
0.87
1.04
2005/06 2006/07
Q1
Q2
Q3
3.24
Q4 Q4
>100% >100%

ThyssenKrupp
Presentation ThyssenKrupp, February 2007 5
661
(654)
Others
320
D/A
346
(195)
(568)
Change inaccruedpensions
23
Netincome
(306)
Change innet workingcapital Steel
(187)
Change innet working
capitalCorporate/
cons.
(98)
(478)
Group Overview – Operating Cash Flow
Development of operating cash flow in Q1 2006/2007 million €
Change innet working
capital Stainless
Change innet working
capitalTechnologies
Change innet working
capital Elevator
Change innet working
capitalServices
Operatingcash flow

ThyssenKrupp
Presentation ThyssenKrupp, February 2007 6
747
(832)
8
(568)
272
Free Cash Flow: (1,146)
391
(18)
Group Overview – Net Financial Liabilities
Development of net financial position million €
Net financialreceivables(net cash)Sep 2006
Net financialliabilitiesDec 2006
Operatingcash flow
Divest-ments
Cash acquired/divested
Capex Others
Gearing(8.4%)
Gearing4.1%

ThyssenKrupp
Presentation ThyssenKrupp, February 2007 7
2001/02* 2002/03* 2003/04* 2004/05
(352)(414)
WACC: 9%
ROCE and ThyssenKrupp Value Added (TKVA, incl. discontinued operations) % / million €
Mid-cycletarget
16%
1,300
* US GAAP
Group Overview – ThyssenKrupp continues the Delta EVA® Story
2005/06
Target ROCE: 12%
14%
Δ 425
Q12006/07
Δ 513
1,510
17.9%
997
14.4%
12.0%
572 773
Δ 924
Δ 62
14%
TKVAROCE Δ TKVA
7.2%7.0%

ThyssenKrupp
Presentation ThyssenKrupp, February 2007 8
Group Overview – EBT Track RecordEBT million €
421
800
1,477EBT target range: €1.5 bn
2004/05
* excluding major non-recurring items ** US GAAP
2001/02*/** 2002/03** 2003/04** 2005/06
1,677
€2.0 bn
€2.5 bn2,623CAGR:58.0% p.a.
2006/07
Q1
619
806
773
425
1,062

ThyssenKrupp
Presentation ThyssenKrupp, February 2007 9
57.2% 55.2%
7,671
177
8,3278,287
4,2354,742
2,833
34.0% 2.2%
Ratio of net financial liabilities to equity (gearing) million €
Group Overview – Gearing
Equity
Net financial liabilities
Gearing
(8.4%)
2005/062004/052003/04*2002/03*2001/02*
8,927
(747)
7,944
* US GAAP
ThyssenKrupp
Presentation ThyssenKrupp, February 2007 10
Capital Goods
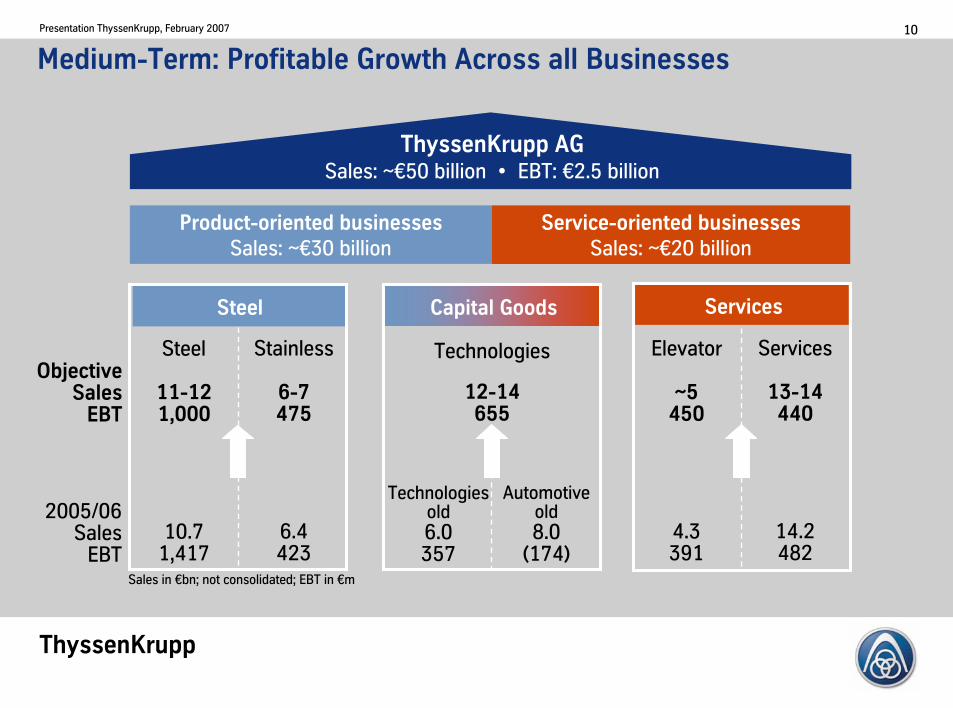
Medium-Term: Profitable Growth Across all Businesses
Services
2005/06Sales
EBT
Steel
Steel
11-121,000
10.71,417
ThyssenKrupp AGSales: ~€50 billion • EBT: €2.5 billion
Product-oriented businessesSales: ~€30 billion
Service-oriented businessesSales: ~€20 billion
ObjectiveSales
EBT
Sales in €bn; not consolidated; EBT in €m
Technologiesold6.0357
Automotiveold8.0
(174)
Technologies
12-14655
Stainless
6-7475
6.4423
Elevator
~5450
4.3391
Services
13-14440
14.2482

ThyssenKrupp
Presentation ThyssenKrupp, February 2007 11
Value Indicators by Segment – Sustainable (Mid-cycle) Targets
Groupthereof
Steel
Stainless
Technologies
Automotive**
Elevator
Services
WACCin %
9.0
9.5
9.5
9.5
9.5
8.5
9.0
ROCEin %
2005/06 Target
17.9
24.9
16.0
31.6
(14.8)
22.6
19.2
Capital Employedin million €
17,056
5,937
3,048
1,427
2,938
1,876
2,884
All figures incl. discontinued operations (except EBT).* including risk buffer and Corporate (pensions etc.), excluding Dofasco/greenfield ** Automotive part of Technologies effective Oct 1, ’06; Targets as contribution to Technologies;
transparency provided by continued disclosure of pro-forma numbers for the former Automotive segment
TKVAin million €
2005/06 Target
1,510
913
199
316
(331)
264
294
1,300
470
260
470
170
325
210
EBTin million €
2005/06 Target
2,623
1,417
423
357
(174)
391
482
2,500
1,000
475
655
300
450
440
ave. 2005/06
*16.0
17.5
18.5
24.0
15.5
25.0
14.5
*

ThyssenKrupp
Presentation ThyssenKrupp, February 2007 12
Segment Overview – Quarterly EBT for 2005/06 and 2006/07
2006/2007
million € Q1 Q2 Q3 Q4 FY Q1
Steel 272 416 382 347 1,417 409Stainless 7 52 126 238 423 325Technologies 118 141 155 (15) 399 138Elevator 85 94 98 114 391 97Services 85 91 168 138 482 192Corporate (137) (17) (119) (173) (446) (93)Consolidation (5) (4) (4) (30) (43) (6)
Group 425 773 806 619 2,623 1,062
2005/2006

ThyssenKrupp
Presentation ThyssenKrupp, February 2007 13
Others 910
Steel 2,005 440
Automotive* 2,105 1,155
Services 2,8651,405
Technologies 2,400 1,915
Stainless 95 235
Active Portfolio Management at ThyssenKruppSignificant change in portfolio since the merger (as at January 2007)
Disposals(Total: €9.0 billion)
Acquisitions(Total: €8.0 billion)
Elevator 1,355120
Sales in €m * since Oct 1, 2006 integrated into Technologies segment

ThyssenKrupp
Presentation ThyssenKrupp, February 2007 14
* 75.1% / ** 51% / *** 80% / **** 61% / + closing not yet completed
DisposalSpecial Profile operations (DE)*Steel
DisposalNoske-Kaeser group (DE)DisposalTK Fundicoes (BR)
Disposal +BVI Defense Technology (DE)
AcquisitionAtlas Elektronik (DE)**DisposalBVI Steam Turbine division (DE)
AcquisitionMaerz Ofenbau (CH)
AcquisitionDRE/CON Slewing Bearings (DE)
Technologies
AcquisitionAlcoa Aerospace Serv. (US, GB, BE)AcquisitionAT.PRO tec (DE)****
DisposalTK Servicios Técnicos (ES)Acquisition+Schöbel Technik & Service (DE)
DisposalHommel group (DE)AcquisitionVPK Metals (CA)
AcquisitionHearn group (CA)AcquisitionMetalfast (GB)
AcquisitionStandardkessel (DE)DisposalKrupp Druckereibetriebe (DE)
AcquisitionRIP (BR)**AcquisitionCoferal (DE)AcquisitionJupiter Stomana (BG)***
Services
AcquisitionSCAM (IT)AcquisitionDVG (SL)AcquisitionTEAM/TRABOSA (ES)AcquisitionSIAR (IT)
AcquisitionGeneral Elevator Maintenance (CA)AcquisitionAtlantic Elevator (US)AcquisitionKR Liften (NL)
AcquisitionSun Rhine Enterprises (TW)Elevator
34 Portfolio Optimizations since October 2005
DisposalBudd Plastics division (US, MX)Disposal+TK Bilstein Wagenheber (DE)
DisposalAluminiumfeinguss Soest (DE)DisposalTK Stahl Company (US)
DisposalBody&Chassis NA (US, CA)
Automotive
ThyssenKrupp
Presentation ThyssenKrupp, February 2007 15
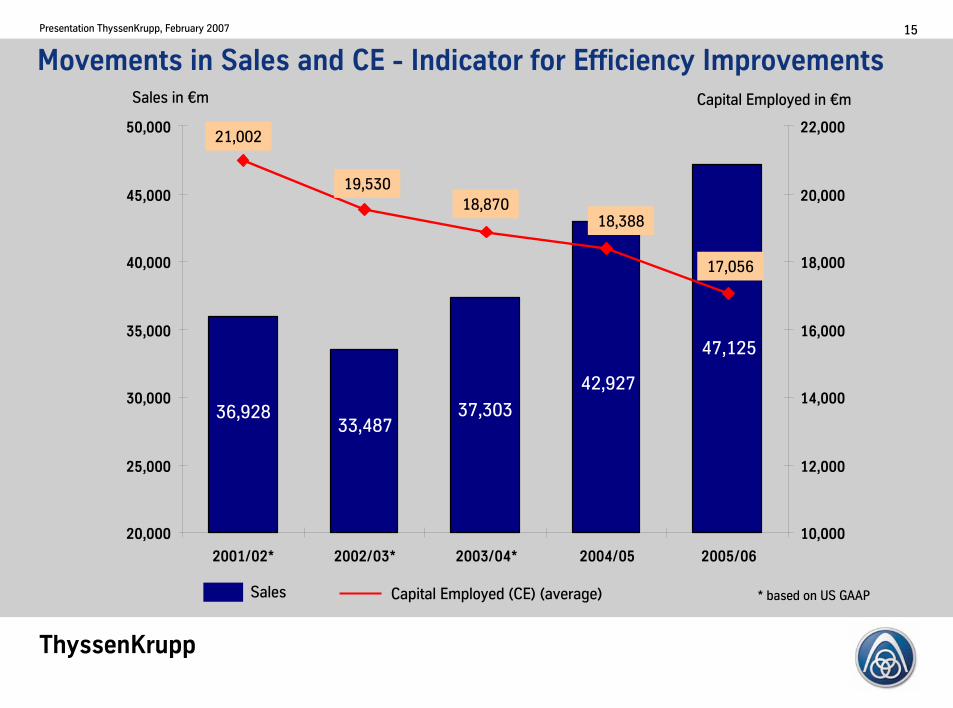
Movements in Sales and CE - Indicator for Efficiency ImprovementsSales in €m
Sales Capital Employed (CE) (average)
20,000
25,000
30,000
35,000
40,000
45,000
50,000
2001/02* 2002/03* 2003/04* 2004/05 2005/06
10,000
12,000
14,000
16,000
18,000
20,000
22,00021,002
19,53018,870
18,388
17,056
36,92833,487
37,303
42,927
47,125
* based on US GAAP
Capital Employed in €m

ThyssenKrupp
Presentation ThyssenKrupp, February 2007 16
Investment Grade Rating with Every Rating Agency is KeyThe underlying principle for all our growth initiatives
High degree of flexibility due to
Cash (€3.3 billion as of Dec 31, 2006)
Available credit lines (€4.3 billion as of Sept 30, 2006)
Treasury stock (25.7 million shares at cost of €697 million)
Authorized capital (€500 million)
Estimated OCF (approx. €19 billion from 2005/06 - 2009/10)
and
Continuous revision of current business portfolio remainstop priority for management

ThyssenKrupp
Presentation ThyssenKrupp, February 2007 17
Capex per segment (in %)
Steel
Stainless
Technologies
Elevator
Services
Capex per region (in %)
North America
Asia
Europe(excl.
Germany)
SouthAmerica
Germany
Corporate
5720
9
9
4
134
26 13
18
9
Group Growth Strategy – €17-20 billion of Capex within 5 Years

ThyssenKrupp
Presentation ThyssenKrupp, February 2007 18
Focus on organic growth
Long-term assets in € billion
Growth• TKCS (Brazil) 3.0• Greenfields TKS (1.8) / TKL (0.5) 2.3• Capacity increase Duisburg 0.4• TK Services 0.4• Expansion/Modernization 4.6 - 6.0Subtotal 10.7 - 12.1
Maintenance (esp. Steel) 4.0
Total 14.7 - 16.1
Financial investments• TK Technologies >0.5• TK Elevator >0.4• TK Services 0.5• Other 0.9 - 2.5
Total 2.3 - 3.9
Total investments 17.0 - 20.0
Investment plan (2005/06 - 2009/10) Breakdown of investments (2005/06 - 2009/10)
Long-term assets Total investments
Long-term assets
Financial investmentsGrowth (incl. TKCS)
Maintenance
4.0
14.7 – 16.1
10.7-12.1
2.3 – 3.9
14.7 - 16.1
17.0 - 20.0
Group Growth Strategy – Investment Overview
ThyssenKrupp
Presentation ThyssenKrupp, February 2007 19
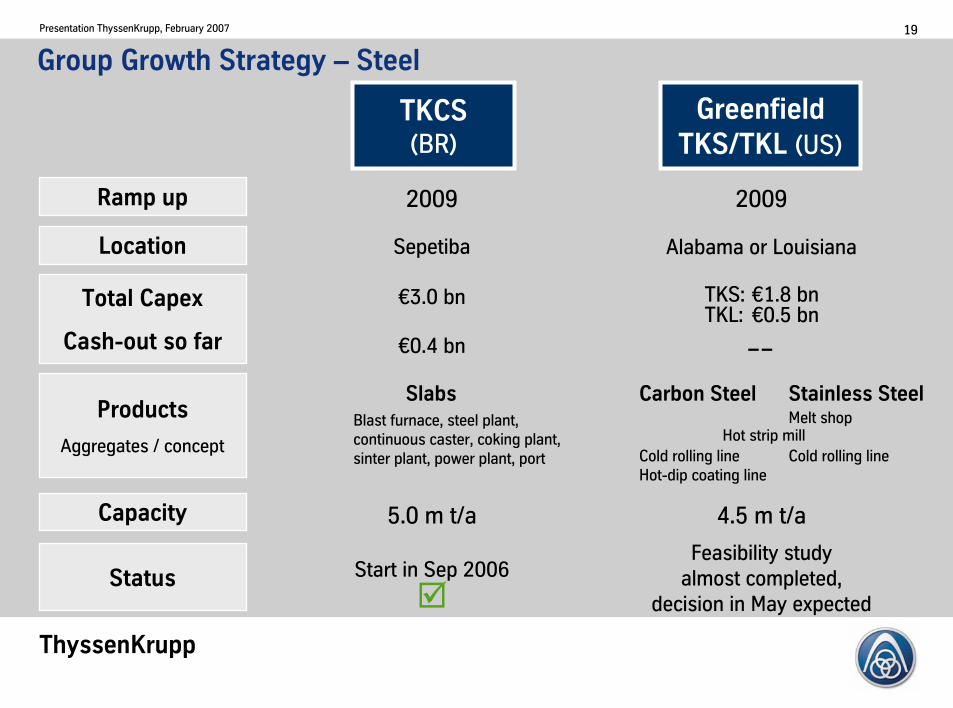
Group Growth Strategy – Steel
TKCS (BR)
Greenfield TKS/TKL (US)
Products
Aggregates / concept
Total Capex
Cash-out so far
Capacity
Ramp up 2009 2009
€3.0 bn TKS: €1.8 bnTKL: €0.5 bn
Status
5.0 m t/a 4.5 m t/a
SlabsBlast furnace, steel plant, continuous caster, coking plant, sinter plant, power plant, port
Carbon Steel
Cold rolling lineHot-dip coating line
Start in Sep 2006Feasibility study
almost completed,decision in May expected
€0.4 bn −−
Location Sepetiba Alabama or Louisiana
Stainless SteelMelt shop
Cold rolling lineHot strip mill
ThyssenKrupp
Presentation ThyssenKrupp, February 2007 20
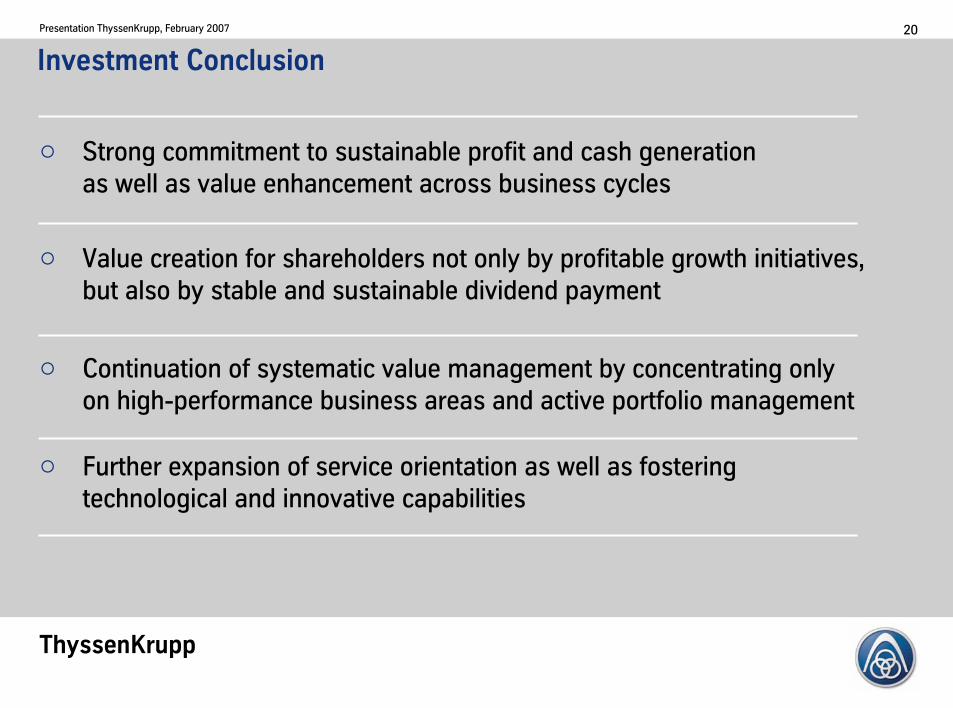
Strong commitment to sustainable profit and cash generationas well as value enhancement across business cycles
Value creation for shareholders not only by profitable growth initiatives,but also by stable and sustainable dividend payment
Continuation of systematic value management by concentrating onlyon high-performance business areas and active portfolio management
Further expansion of service orientation as well as fostering technological and innovative capabilities
Investment Conclusion

ThyssenKrupp
Presentation ThyssenKrupp, February 2007 21
March 20/21, 2007 ThyssenKrupp Field Day: Services(Krakow/Katowice, Poland)
April 24, 2007 Quiet Period to May 10, 2007
May 11, 2007 Interim Report 2nd quarter 2006/2007 (Jan to Mar)
May 15, 2007 Analysts’ and Investors’ Conference (London, UK)
July 24, 2007 Quiet Period to August 9, 2007
August 10, 2007 Interim Report 3rd quarter 2006/2007 (Apr to Jun)Conference call with analysts and investors
Financial Calendar 2007

ThyssenKrupp
Presentation ThyssenKrupp, February 2007 22
October 25, 2007 Quiet Period to December 3, 2007
December 4, 2007 Annual Press ConferenceAnalysts’ and Investors’ Conference
January 18, 2008 Annual General Meeting
February 13, 2008 Interim Report 1st quarter 2007/2008 (Oct to Dec)Conference call with analysts and investors
Financial Calendar 2007/2008

ThyssenKrupp
Presentation ThyssenKrupp, February 2007 23
How to Contact ThyssenKrupp Investor Relations
Institutional Investors and Analysts:
Phone: +49 211 824-36464
Fax: +49 211 824-36467
E-mail: [email protected]
Internet: www.thyssenkrupp.com
To be added to the IR mailing list, send us a
brief e-mail with your details!

ThyssenKrupp
Presentation ThyssenKrupp, February 2007 24
Appendix

ThyssenKrupp
Presentation ThyssenKrupp, February 2007 25
Group sales €47.1 billion • EBT €2,623 million • TKVA €1,510 million • Free cash flow €1,771 million
ThyssenKrupp AG
Services
• Materials Services International
• Materials Services North America
• Industrial Services• Special Products
Sales €14.2 bnEBT €482 mTKVA €294 m FCF €147 m
•PlantTechnology
•Marine Systems
•Mechanical Components
•Automotive Solutions
•Transrapid
• 4 regional business units
• Escalators/Passenger Boarding Bridges
• Accessibility
Sales €12.7 bnEBT €399 mTKVA €178 mFCF €378 m
Elevator
Sales €4.3 bnEBT €391 mTKVA €264 mFCF €87 m
StainlessSteel
Sales €10.7 bnEBT €1,417 mTKVA €913 mFCF €1,185 m
Sales €6.4 bnEBT €423 mTKVA €199 mFCF €243 m
ThyssenKrupp Group Overview
Inter-segment sales not consolidated; organizational structure as at Oct 1, 2006; figures and employees as at Sep 30, 2006
• Steelmaking• Industry• Auto• Processing
• Nirosta• Acciai Speciali
Terni• Mexinox• Shanghai Krupp
Stainless• Stainless Int.• VDM
Technologies

ThyssenKrupp
Presentation ThyssenKrupp, February 2007 26
Steel: Segment Overview (I)Summary of quarterly business development
2005/2006 2006/2007 Change Change in %Order intake €m 2,641 2,806 165 6.2Sales €m 2,484 2,816 332 13.4EBITDA €m 440 580 140 31.8EBIT €m 290 432 142 49.0EBT €m 272 409 137 50.4Free cash flow €m (7) (422) -415 --Employees (Dec 31) 31,439 30,654 -785 -2.5
1st quarter
Value of new orders increased, driven by higher average prices; this, together with higher shipments and a more favourable product mix resulted in clear rise in sales; Industry business unit with biggest sales contribution; major improvement at Auto business unit due to higher call-offs and impact of price increases under annual contracts; Processing business unit also strong mainly due to medium-wide strip and grain-oriented electrical steel
Overall shipments higher (+4%), especially for hot-rolled coil (+6%, basically starting material for large diameter welded pipes); crude steel production up 3%, despite repairs to one of the blast furnaces in Duisburg-Schwelgern

ThyssenKrupp
Presentation ThyssenKrupp, February 2007 27
Steel: Segment Overview (II)EBT development and analysis
Q4 05/06
Q1 05/06
Q2 05/06
Q3 05/06
Q1 06/07
272 416 382 347 409
18%
50%
YoYEBT improvement generated by the operating business units Industry, Auto and Processing;overall, increased revenues absorbed higher prices for raw materials and energy; significant improvement at Auto business unit mainly due to continuous efficiency enhancement as wellas higher sales volumes and revenues
QoQImprovement in EBT mainly due to higher shipments and improved product mix; further efficiency enhancements while average revenues only slightly higher

ThyssenKrupp
Presentation ThyssenKrupp, February 2007 28
High Value Added Products Strengthen Market Position
* sales of flat products only
• Full product range in flat carbonsteels
• Permanent development of newgrades and products
• Joint R&D with major customers
Secures dealing in a premium market
4%
13%
13%
7%
12%
26%
6%
10%
6%
6%
3%
Tailored blanks
Constructionelements
Steel service
Tin-plate
Coated products
Cold strip
Heavy plate
Hot strip forelectrical steels
Hot strip/narrow strip
Medium-wide strip
4%
13%
13%
7%
12%
26%
6%
10%
6%
6%
3%
Tailored blanks
Constructionelements
Steel service
Tin-plate
Coated products
Cold strip
Heavy plate
Hot strip forelectrical steels
Hot strip/narrow strip
Medium-wide strip
Product Portfolio Steel (FY 2005/06)* in %

ThyssenKrupp
Presentation ThyssenKrupp, February 2007 29
High Quality Requirements and Long-term Relationships
Sales by Industry
Others Automotive industry (incl. suppliers)Construction
Packaging
Trade
• Customer relationship in focus:Long-term relationships foster sustainable value performance
• About 60% long-term contractexposure as an indicator ofreliability and trustworthiness
• Short-term business is not an opportunity business
Price premium over the cycleQuarterly
Half-year
Multi-year
Annual
Spot
Mechanical Engineering
293
15
Sales by Maturity/Contracts
Key Drivers of ThyssenKrupp Steel
in %, FY 2005/06
in %, FY 2005/06
2414
11
9
10
Steel and steel-related processing
4211
22
10

ThyssenKrupp
Presentation ThyssenKrupp, February 2007 30
60
80
100
120
140
160
180
200
All date incl. Q4 2006Sources: CRU and own calculations based on CRU, TKS
Lower Earnings Volatility
Price index flat steel world (CRU)
Price index carbon flat steel ThyssenKrupp Steel AG
Q4 2006
Index (Q3 1997 = 100)
Q3 1997
CRU
ThyssenKrupp Steel

ThyssenKrupp
Presentation ThyssenKrupp, February 2007 31
Low-cost slab sourcing as ideal basisfor further processing in North America
Location
• Sepetiba, Brazil
• Link to iron ore logistics from Minas Gerais(CVRD South System ore mines)
• Rail connection and own dock
Blastfurnace
Sinterplant
Cokingplant
Powerplant
Steelplant
Continuouscaster Port
Plant configuration
• Capacity: 5.0 million t/a
Timeline• Laying of the cornerstone on Sept 29, 2006
• Production of first slab at the beginning of 2009
• Secured high-qualityiron ore supply
• Location advantages
• Modern and efficient technology and processes
• Optimal logistic setting
Competitive advantages
Outstanding cost position
Planned Slab Plant in Brazil Creates Competitive Advantages

ThyssenKrupp
Presentation ThyssenKrupp, February 2007 32
Growth Strategy
ThyssenKrupp Companiha Siderurgica (TKCS), Brazil5.0 m t/a
Strengthening of TK Steel in domestic market, increasing market share to >13%
15m t/a finished products
Current measures:• Expansion of Duisburg plant
(liquid phase, hot rolling mill,downstream operations)
• Preparation of the European market for additional volumes
Europe NAFTA
2.0m t/a
Positioning in the NAFTA with a market share of min. 5%
Focus on high-quality market segment
Strategy:
• Greenfield TK Steel*
(need for slabs: 3–5 m t/a)
3.0m t/a
* feasibility study almost completed

ThyssenKrupp
Presentation ThyssenKrupp, February 2007 33
Stainless: Segment Overview (I)Summary of quarterly business development
2005/2006 2006/2007 Change Change in %Order intake €m 1,529 1,913 384 25.1Sales €m 1,352 1,971 619 45.8EBITDA €m 57 380 323 +EBIT €m 23 343 320 +EBT €m 7 325 318 +Free cash flow €m (188) (441) -253 --Employees (Dec 31) 12,157 12,221 64 0.5
1st quarter
Considerably improved business situation at Stainless: Continuing robust demand, higher base prices andalloy surcharges driving up order intake and sales in value, with all business units contributing; major sales improvement at Shanghai Krupp Stainless, mainly attributable to production support for Nirosta
Shipments on prior-year level with increase in cold-rolled deliveries (+5%); good visibility for H1 2006/07 with first orders booked already for Q3 2006/07
Customer orders for the most part fulfilled despite fire at Krefeld mill in June 2006 (production support by Acciai Speciali Terni (Italy) and Shanghai Krupp Stainless business units); increased expenditures compensated by insurance payments, but time lag may occur

ThyssenKrupp
Presentation ThyssenKrupp, February 2007 34
Stainless: Segment Overview (II)EBT development and analysis
Q4 05/06
Q1 05/06
Q2 05/06
Q3 05/06
Q1 06/07
7 52126
238 325
37%
YoYEarnings significantly improved at all business units on the back of considerably higher base price levels, but extreme raw material cost increases running counter; main improvement at Nirosta and Acciai SpecialiTerni business units; Shanghai Krupp Stainless with slight profit due to better capacity utilization and improved product mix
QoQIncrease in EBT mainly due to slight positive impact from price-cost gap and internal efficiency enhancement; insurance payment of €30m ahead of occurring costs in upcoming months
>100%

ThyssenKrupp
Presentation ThyssenKrupp, February 2007 35
Tight Market Conditions Boosting Base Prices and EBT
12597
72 52
126
238
323
7(8)
-20
30
80
130
180
230
280
330
Q1 Q2 Q3 Q4 Q1 Q2 Q3 Q4
FY 2004/05 FY 2005/06
100
80
60
120
%EBT in €m
EBT Stainless Stainless Steel Base price (index Q1 2004/05 = 100)
Q1
FY 2006/07
140
160

ThyssenKrupp
Presentation ThyssenKrupp, February 2007 36
Demanding but Longer-term Customers
Sales by Industry
Others
Service Centers/ Trade
Metal Processing
Automotive
White Goods
• Lively demand from almost all customer sectors
• Higher predictability of business through a comparatively higher exposure to longer-term contracts
• Keen price increase in raw materials in particular nickel
• Strong focus on ferritic grades(35% of ThyssenKrupp’s Stainless product portfolio)
• Reduction in stainless steel capacities (Outokumpu’s Sheffield plant, fire at ThyssenKrupp plant in Krefeld,…)
• No disruptions from the inventory side (customers’inventories at normal level)
Quarterly
Half-year
Multi-year
AnnualSpot
Pipes 1350
8
9
15
5
26
34
9
18
13
Sales by Maturity/Contracts
Key Drivers of ThyssenKrupp Stainless
in %, FY 2005/06
in %, FY 2005/06

ThyssenKrupp
Presentation ThyssenKrupp, February 2007 37
Technologies: Segment Overview (I)
2005/2006 2006/2007 Change Change in %Order intake €m 3,201 3,770 569 17.8Sales €m 3,219 3,110 -109 -3.4EBITDA €m 226 238 12 5.3EBIT €m 124 138 14 11.3EBT €m 118 138 20 16.9Free cash flow €m (107) (137) -30 --Employees (Dec 31) 63,801 61,137 -2,664 -4.2
1st quarter
Summary of quarterly business development
Clear rise in order intake mainly attributable to Plant Technology (projects driven by excavationand processing of raw materials); overall sales impacted by negative US$ exchange rate effectsand disposal at Mechanical Components (Brazilian foundry) as well as lower volume of billings atAutomotive Solutions; order book of almost €14 bn (Dec 31, 2006) covering one year’s sales
Integration of remaining Automotive activities into Technologies effective Oct 1, 2006; new Technologies segment comprises 4 main business units: Plant Technology, Marine Systems, Mechanical Components, Automotive Solutions; pro-forma reporting on remaining automotive activities to be continued throughout the fiscal year

ThyssenKrupp
Presentation ThyssenKrupp, February 2007 38
Technologies: Segment Overview (II)EBT development and analysis
Q4 05/06
Q1 05/06
Q2 05/06
Q3 05/06
Q1 06/07
118 141 155 (15) 138
+
17%
YoYIncrease in EBT mainly attributable to Plant Technology, Marine Systems and Mechanical Components - clear two-digit million profit each; Mechanical Components still main earnings contributor; Automotive Solutions with minor loss due to start-up costs for major orders (German stamping plants) and restructuring costs (steering gear activities)
QoQDiscontinuation of costs for restructuring of remaining Automotive activities (booked in Q4, e.g. DrauzNothelfer, steering business, European stamping business); disposal of TK Fundicoes (small 2-digit amount)

ThyssenKrupp
Presentation ThyssenKrupp, February 2007 39
Organizational Overview Technologies as of Oct 1, 2006
ThyssenKrupp Technologies AGSales old: €6.0 bn • Sales new: ~€12 bn*
Olaf Berlien, Chairman
Plant TechnologySales: €2.3 bn
Automotive SolutionsSales old: --Sales new: €4.4 bn*
Transrapid
• Uhde
• Polysius
• Fördertechnik
• Assembly Plant (Krause)
• Presta Steering
• Umformtechnik
• Automotive Systems
• Bilstein Federn
• Drauz Nothelfer
MechanicalComponentsSales old: €1.8 bnSales new: €4.1 bn*
• Rothe Erde
• Berco
• Presta Camshafts
• TKMCL/Gerlach
• Präzisionsschmiede
• Waupaca
• Sales & Technical Center
Marine SystemsSales: €1.9 bn
• Surface Vessels
• Submarine
• Marine Services
H.-Chr. Atzpodien Klaus BorgschulteWolfram MörsdorfVice Chairman
Karsten Kroos
Business Unit • Operating Group former TK Automotive
* pro forma combined figures, not consolidated, unaudited

ThyssenKrupp
Presentation ThyssenKrupp, February 2007 40
Divestment of Body & Chassis NA plus minor activities in the US completed(€1.5 bn sales)
Related restructuring charges with no further impact on remaining Automotive activities in the current fiscal year
Sale of TK Fundicoes (foundry, Brazil)
Due to weak performance of remaining activities (e.g. Drauz Nothelfer) further restructuring efforts needed; expected charges €50 m to €100 m in 2006/07
New management started the processof systematic revision of all under-performing Automotive activities
18
FY2005/06
Q12006/07
Update on Automotive Restructuring – Status Quo
(174)
EBT million € Restructuring

ThyssenKrupp
Presentation ThyssenKrupp, February 2007 41
Elevator: Segment Overview (I)Summary of quarterly business development
2005/2006 2006/2007 Change Change in %Order intake €m 1,261 1,299 38 3.0Sales €m 1,008 1,083 75 7.4EBITDA €m 106 118 12 11.3EBIT €m 92 104 12 13.0EBT €m 85 97 12 14.1Free cash flow €m (34) (37) -3 --Employees (Dec 31) 34,843 37,279 2,436 7.0
1st quarter
Encouraging order intake and sales growth despite continued margin pressure and negative exchange rate effects; improvement in orders mainly at Asia/Pacific business unit (new installations China, India, Australasia); increase in sales at all business units, especiallyat SEAME* business unit (new installations Spain) and ES/PBB*
Continued difficult situation on South Korean market (especially for new installations) with negative impact on performance; refit measures for concerned activities have been implemented
Overall fitness program to enhance operational margins at top of the management agenda* Southern Europe/Africa/Middle East; Escalators/Passenger Boarding Bridges

ThyssenKrupp
Presentation ThyssenKrupp, February 2007 42
Elevator: Segment Overview (II)EBT development and analysis
Q4 05/06
Q1 05/06
Q2 05/06
Q3 05/06
Q1 06/07
85 94 98 114 97
14%
-15%
YoYIncrease in profit attributable to higher sales volume and internal efficiency enhancement programs; Americas business unit with major earnings improvement; Asia/Pacific and ES/PBB business unit weaker (restructuring South Korea, margin pressure in escalator business)
QoQDecline in EBT mainly reflects volume effects from fiscal year end invoicing

ThyssenKrupp
Presentation ThyssenKrupp, February 2007 43
Services: Segment Overview (I)Summary of quarterly business development
2005/2006 2006/2007 Change Change in %Order intake €m 3,127 4,207 1,080 34.5Sales €m 3,066 3,972 906 29.5EBITDA €m 127 245 118 92.9EBIT €m 100 212 112 +EBT €m 85 192 107 +Free cash flow €m (129) (386) -257 --Employees (Dec 31) 34,940 40,690 5,750 16.5
1st quarter
Strong rise in order intake at all business units; record sales driven by extensive sales initiatives, successful integration/development of acquisitions/newly established companiesand improved cyclical situation; Materials Services North America with major sales improvement due to favourable demand and price levels
Global business expansion led to clear increase in workforce; all companies acquired and activities established performing well
Expansion in business volume also reflected in working capital increase

ThyssenKrupp
Presentation ThyssenKrupp, February 2007 44
Services: Segment Overview (II)EBT development and analysis
YoYOverall EBT more than doubled with all business units contributing; Materials Services International with highest earnings; likewise Materials Services North America profits more than tripled on the back of stronger demand and high prices
QoQImprovement in EBT mainly due to internal efficiency enhancement; positive contribution by newly acquired companies
Q4 05/06
Q1 05/06
Q2 05/06
Q3 05/06
Q1 06/07
85 91 168 138 192
39%
>100%

ThyssenKrupp
Presentation ThyssenKrupp, February 2007 45
Group in Figures (I)
13,30111,555
12,776
12,439
14,012
2005/06 2006/07
Q1
Q2
Q3
Q4
Order intake million €
50,782
15%
12,138
12,259
10,942 12,332
11,786
2005/06 2006/07
Sales million €
Q1
Q2
Q3
Q4
47,125
13%

ThyssenKrupp
Presentation ThyssenKrupp, February 2007 46
1,290
1,234
898 1,5071,278
2005/06 2006/07
911
700
1,161551
882
2005/06 2006/07
479
428
832492
678
2005/06 2006/07
Group in Figures (II)
Q1
2,351
Q3
Q1
Q2
Q3
Q4
2,077
Q1
Q2
Q3
Q4
EBITDA million €
Operating cash flow million € Capital expenditures million €
* incl. financial investments
3,467
Q2
Q4
EBIT million €
Q1
Q2
Q3
Q4
3,0444,700
1,004
1,521
59883
2005/06 2006/07
68% >100%
-
74%
2005/06 2006/07
(568)

ThyssenKrupp
Presentation ThyssenKrupp, February 2007 47
Disclaimer
In this presentation all figures are prepared in accordance with IFRS unless otherwise stated.
This document contains forward-looking statements that reflect management’s current views with respect to future events. Such statements are subject to risks and uncertainties that are beyond ThyssenKrupp’s ability to control or estimate precisely, such as future market and economic conditions, the behavior of other market participants, the ability to successfully integrate acquired businesses and achieve anticipated synergies and the actions of government regulators. If any of these or other risks and uncertainties occur, or if the assumptions underlying any of these statements prove incorrect, then actual results may be materially different from those expressed or implied by such statements. ThyssenKrupp does not intend or assume any obligation to update any forward-looking statements to reflect events or circumstances after the date of these materials.