Embed Size (px)
Citation preview
1/17
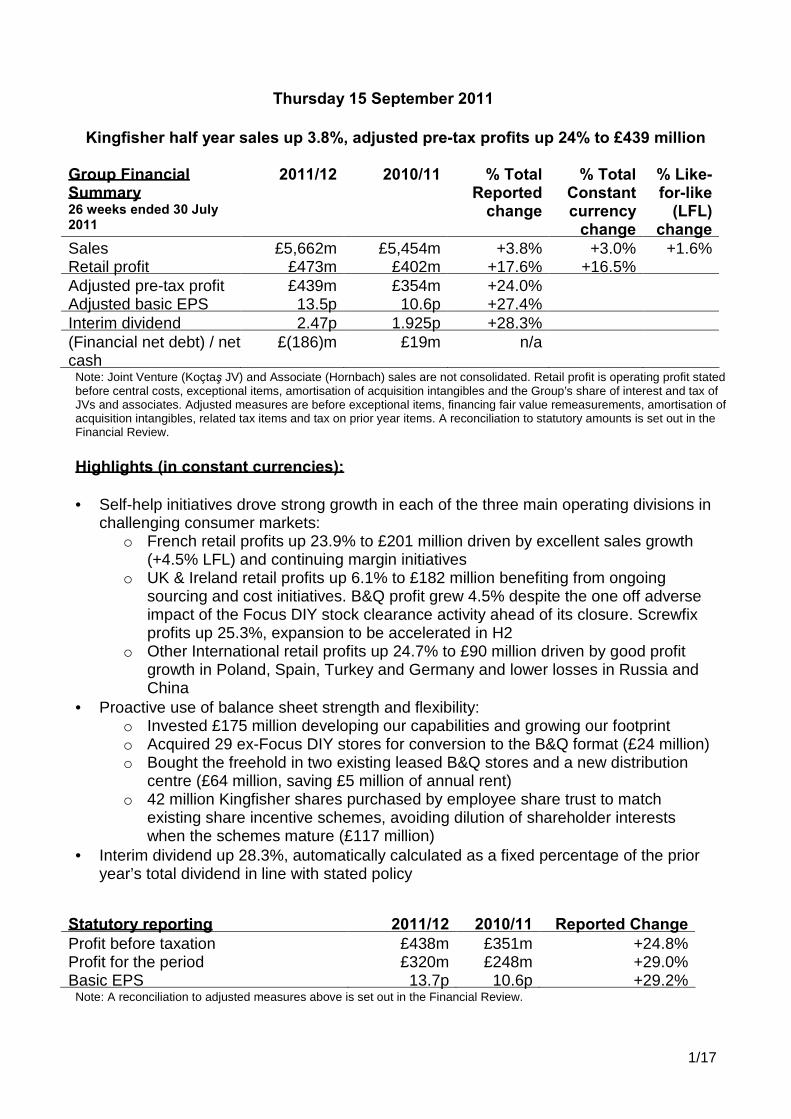
Thursday 15 September 2011
Kingfisher half year sales up 3.8%, adjusted pre-tax profits up 24% to £439 million
Group Financial Summary 26 weeks ended 30 July 2011
2011/12
2010/11 % Total Reported
change
% Total Constant currency
change
% Like-for-like
(LFL) change
Sales £5,662m £5,454m +3.8% +3.0% +1.6% Retail profit £473m £402m +17.6% +16.5% Adjusted pre-tax profit £439m £354m +24.0% Adjusted basic EPS 13.5p 10.6p +27.4% Interim dividend 2.47p 1.925p +28.3% (Financial net debt) / net cash
£(186)m £19m n/a
Note: Joint Venture (Koçtaş JV) and Associate (Hornbach) sales are not consolidated. Retail profit is operating profit stated before central costs, exceptional items, amortisation of acquisition intangibles and the Group’s share of interest and tax of JVs and associates. Adjusted measures are before exceptional items, financing fair value remeasurements, amortisation of acquisition intangibles, related tax items and tax on prior year items. A reconciliation to statutory amounts is set out in the Financial Review. Highlights (in constant currencies): • Self-help initiatives drove strong growth in each of the three main operating divisions in
challenging consumer markets: o French retail profits up 23.9% to £201 million driven by excellent sales growth
(+4.5% LFL) and continuing margin initiatives o UK & Ireland retail profits up 6.1% to £182 million benefiting from ongoing
sourcing and cost initiatives. B&Q profit grew 4.5% despite the one off adverse impact of the Focus DIY stock clearance activity ahead of its closure. Screwfix profits up 25.3%, expansion to be accelerated in H2
o Other International retail profits up 24.7% to £90 million driven by good profit growth in Poland, Spain, Turkey and Germany and lower losses in Russia and China
• Proactive use of balance sheet strength and flexibility: o Invested £175 million developing our capabilities and growing our footprint o Acquired 29 ex-Focus DIY stores for conversion to the B&Q format (£24 million) o Bought the freehold in two existing leased B&Q stores and a new distribution
centre (£64 million, saving £5 million of annual rent) o 42 million Kingfisher shares purchased by employee share trust to match
existing share incentive schemes, avoiding dilution of shareholder interests when the schemes mature (£117 million)
• Interim dividend up 28.3%, automatically calculated as a fixed percentage of the prior year’s total dividend in line with stated policy
Statutory reporting 2011/12 2010/11 Reported Change Profit before taxation £438m £351m +24.8% Profit for the period £320m £248m +29.0% Basic EPS 13.7p 10.6p +29.2%
Note: A reconciliation to adjusted measures above is set out in the Financial Review.

2/17
Ian Cheshire, Group Chief Executive, said: “We have delivered very strong profit growth in what are difficult times for all retailers. With around two thirds of our profit coming from outside the UK, these results clearly show the value of geographic spread and the benefits of operating our market leading international businesses in a more unified way. We delivered improvements right across the group including excellent sales and profit growth in France. Our concerted efforts over the last few years to strengthen our balance sheet are paying off dividends, reducing our financing costs and creating the flexibility to take opportunities as they arise, such as our purchase of 29 great new sites for B&Q from the administrators of Focus DIY. We continued to progress with our successful ‘Delivering Value’ programme and work is well under way as we continue our transition to the next phase of our self-help growth plan, called ‘Creating the Leader’. “Looking ahead, economic uncertainty throughout Europe is likely to impact consumer confidence, meaning conditions will remain challenging for retailers. However, our plans already assumed little help from our markets and I am confident we will continue to outperform, benefiting from our well-established programme of self-help initiatives, international scale and breadth, and robust balance sheet.” Enquiries:
Ian Harding, Group Communications Director 020 7644 1029 Sarah Gerrand, Head of Investor Relations 020 7644 1032 Nigel Cope, Head of Media Relations 020 7644 1030 Clare Haines, Media Relations Officer 020 7644 1286 Brunswick 020 7404 5959 Further copies of this announcement can be downloaded from www.kingfisher.com. A video interview with Ian Cheshire and Kevin O’Byrne is available on the website. We can also be followed on the day on twitter @kingfisherplc and a new Kingfisher iPad App for Investor Relations is now available at the Apple App store. Company Profile: Kingfisher plc is Europe’s leading home improvement retail group and the third largest in the world, with 875 stores in eight countries in Europe and Asia. Its main retail brands are B&Q, Castorama, Brico Dépôt and Screwfix. Kingfisher also has a 50% joint venture business in Turkey with Koç Group, and a 21% interest in, and strategic alliance with Hornbach, Germany’s leading large format DIY retailer.
The remainder of this release has five main sections: • Trading review by division • ‘Delivering Value’ progress • Sustainability progress • Country data • Financial Review and, in part 2 of the announcement, the interim condensed Financial
Statements
3/17
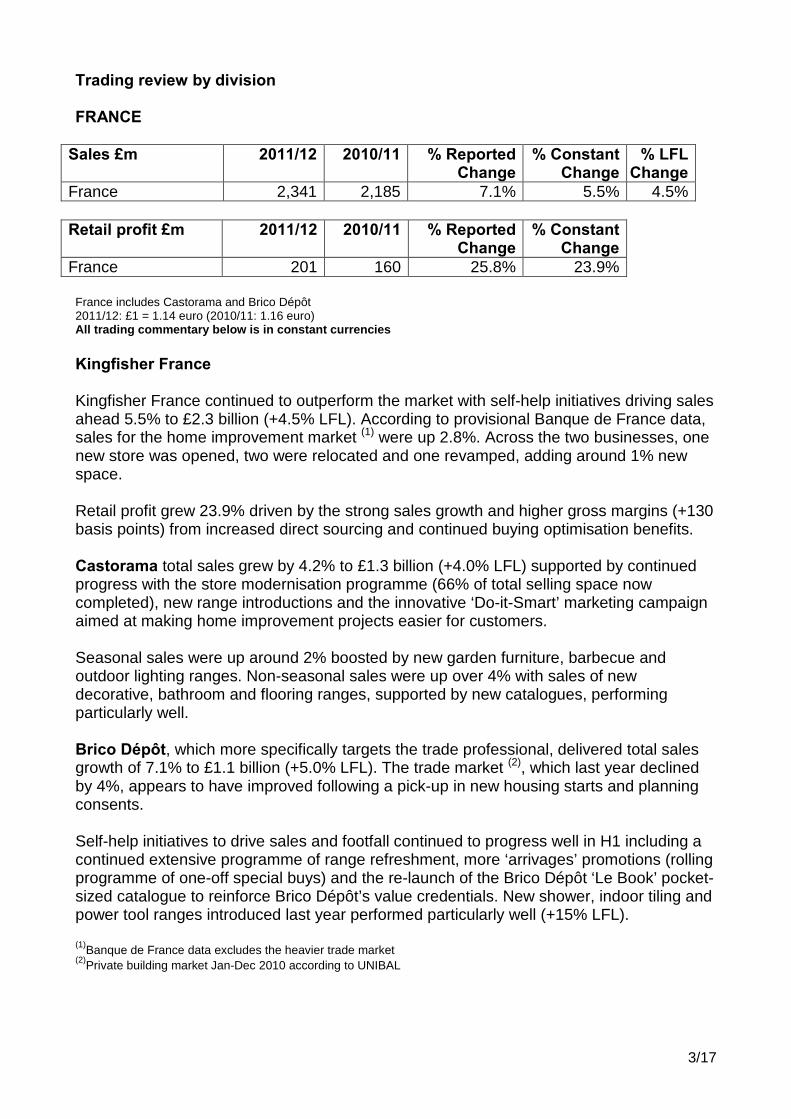
Trading review by division FRANCE
Sales £m 2011/12 2010/11 % Reported Change
% Constant Change
% LFL Change
France 2,341 2,185 7.1% 5.5% 4.5%
Retail profit £m 2011/12 2010/11 % Reported Change
% Constant Change
France 201 160 25.8% 23.9% France includes Castorama and Brico Dépôt 2011/12: £1 = 1.14 euro (2010/11: 1.16 euro) All trading commentary below is in constant currencies Kingfisher France Kingfisher France continued to outperform the market with self-help initiatives driving sales ahead 5.5% to £2.3 billion (+4.5% LFL). According to provisional Banque de France data, sales for the home improvement market (1) were up 2.8%. Across the two businesses, one new store was opened, two were relocated and one revamped, adding around 1% new space. Retail profit grew 23.9% driven by the strong sales growth and higher gross margins (+130 basis points) from increased direct sourcing and continued buying optimisation benefits. Castorama total sales grew by 4.2% to £1.3 billion (+4.0% LFL) supported by continued progress with the store modernisation programme (66% of total selling space now completed), new range introductions and the innovative ‘Do-it-Smart’ marketing campaign aimed at making home improvement projects easier for customers. Seasonal sales were up around 2% boosted by new garden furniture, barbecue and outdoor lighting ranges. Non-seasonal sales were up over 4% with sales of new decorative, bathroom and flooring ranges, supported by new catalogues, performing particularly well. Brico Dépôt, which more specifically targets the trade professional, delivered total sales growth of 7.1% to £1.1 billion (+5.0% LFL). The trade market (2), which last year declined by 4%, appears to have improved following a pick-up in new housing starts and planning consents. Self-help initiatives to drive sales and footfall continued to progress well in H1 including a continued extensive programme of range refreshment, more ‘arrivages’ promotions (rolling programme of one-off special buys) and the re-launch of the Brico Dépôt ‘Le Book’ pocket-sized catalogue to reinforce Brico Dépôt’s value credentials. New shower, indoor tiling and power tool ranges introduced last year performed particularly well (+15% LFL). (1)Banque de France data excludes the heavier trade market (2)Private building market Jan-Dec 2010 according to UNIBAL

4/17
UK & IRELAND
Sales £m 2011/12 2010/11 % Reported Change
% Constant Change
% LFL Change
UK & Ireland 2,306 2,328 (1.0)% (1.0)% (1.5)%
Retail profit £m 2011/12 2010/11 % Reported Change
% Constant Change
UK & Ireland 182 171 6.1% 6.1% UK & Ireland includes B&Q in the UK & Ireland and Screwfix 2011/12: £1 = 1.14 euro (2010/11: 1.16 euro) All trading commentary below is in constant currencies Kingfisher UK & Ireland Total sales were down 1.0% to £2.3 billion (-1.5% LFL) in a declining home improvement market (1) which was further impacted by stock clearance activity at Focus DIY (the UK’s fourth largest DIY operator with 177 stores) ahead of its closure. Retail profit grew by 6.1% benefiting from continued gross margin and cost initiatives. B&Q UK & Ireland’s total sales were down 2.0% (-2.0% LFL) to £2.1 billion. Sales of outdoor seasonal products were down around 4% impacted by less favourable summer season weather and the Focus DIY stock clearance activity. Non-seasonal product sales were down around 1% reflecting the generally weak consumer backdrop. The new in-store trade-only ‘TradePoint’ offer continues to grow and attract new customers. Around 650,000 professional tradesmen are now registered as ‘TradePoint’ customers, triple the number previously registered with the B&Q Trade Discount Card. This growing database enables B&Q to identify and directly market to this important customer segment for the first time. Retail profit grew by 4.5% to £165 million. Gross margin was up 20 basis points against tough comparatives (2010/11: +140 basis points) driven by sales of higher margin products and more direct sourcing. A strong focus on operating cost efficiencies also continued with costs (SG&A(2)) percentage to sales held broadly flat across the first half. During H1 Kingfisher paid £24 million to buy up to 31 leasehold properties from the administrator of Focus DIY and, following regulatory approval and discussions with landlords, 29 will reopen in the B&Q format, creating 230 extra jobs at these stores, in addition to the nearly 600 jobs saved in these communities. During H2, 28 of these stores will be converted into the B&Q format for a capital cost of around £20 million and an additional £11 million exceptional charge will be incurred integrating the stores before they open. The overall full year impact from the closure of Focus DIY is expected to be retail profit neutral before exceptional charges (H1 clearance disruption offset by H2 trading benefit). (Note: of the 177 Focus DIY stores trading before its administration, 29 were subsequently acquired by Kingfisher, 13 by other home improvement businesses, resulting in 135 having ceased trading).

5/17
Screwfix grew total sales by 7.7% to £251 million in a challenging smaller tradesman market (3). Initiatives that drove market share gains included new ranges (e.g. safety and work wear), the addition of specialist trade desks exclusive to plumbers and electricians within Screwfix outlets and the continued roll out of new outlets. Thirteen net new outlets were opened during H1, taking the total to 175, now accounting for around two thirds of total sales. Retail profit was up 25.3% to £17 million, reflecting the strong sales growth, gross margins benefiting from more direct sourcing and distribution efficiencies and continued tight cost control. During H1 Screwfix developed a smaller format outlet (400 sq m compared with the typical 700 sq m) in order to access smaller or more densely populated urban catchments. Having now successfully trialled several of these smaller outlets in H1 Screwfix will now accelerate its UK expansion plans. In H2, it is intended that up to a further 40 Screwfix outlets will now open, 30 in the newer, smaller format. This accelerated expansion will cost an additional £5 million capital and add £3 million of further pre-opening costs in H2. A total of 1,000 new jobs will be created in the UK for the full year. (1)This GfK data is only for five months to June and includes new space added but excludes private retailers e.g. IKEA and smaller independents (2) Selling, General and Administrative Expenses (3) Based on the Builders’ Merchants Federation data April-June 2011
6/17
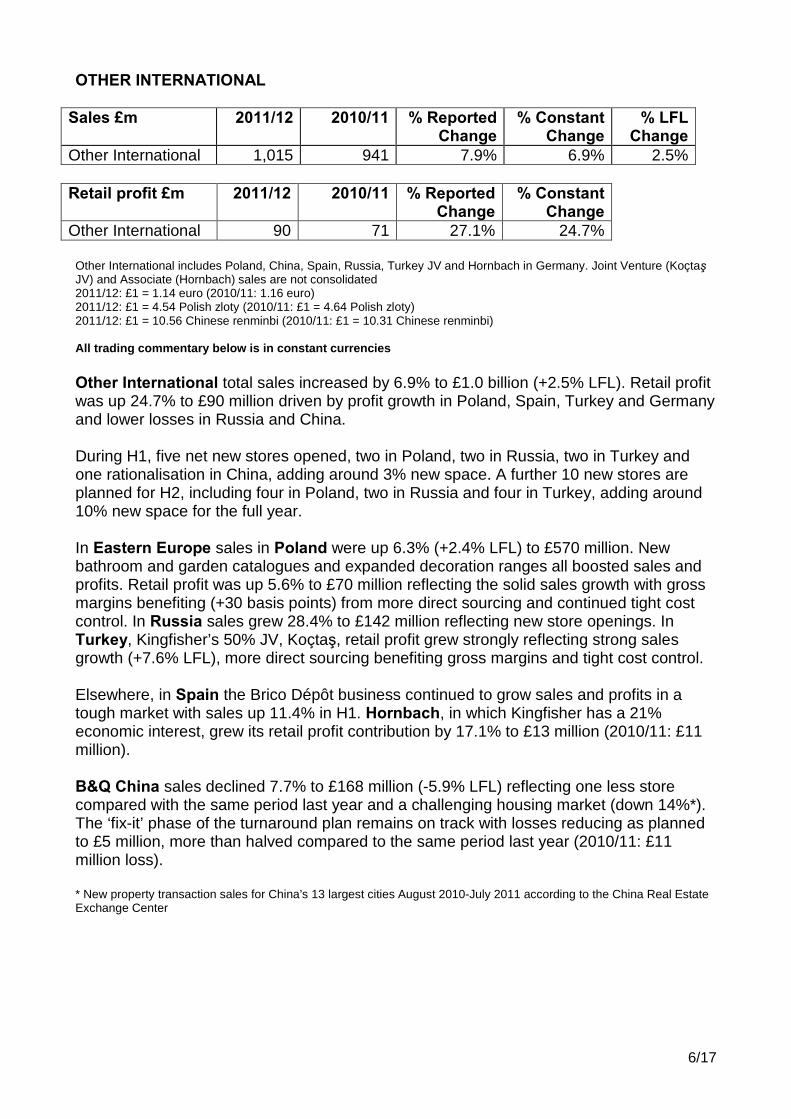
OTHER INTERNATIONAL
Sales £m 2011/12 2010/11 % Reported Change
% Constant Change
% LFL Change
Other International 1,015 941 7.9% 6.9% 2.5%
Retail profit £m 2011/12 2010/11 % Reported Change
% Constant Change
Other International 90 71 27.1% 24.7% Other International includes Poland, China, Spain, Russia, Turkey JV and Hornbach in Germany. Joint Venture (Koçtaş JV) and Associate (Hornbach) sales are not consolidated 2011/12: £1 = 1.14 euro (2010/11: 1.16 euro) 2011/12: £1 = 4.54 Polish zloty (2010/11: £1 = 4.64 Polish zloty) 2011/12: £1 = 10.56 Chinese renminbi (2010/11: £1 = 10.31 Chinese renminbi) All trading commentary below is in constant currencies Other International total sales increased by 6.9% to £1.0 billion (+2.5% LFL). Retail profit was up 24.7% to £90 million driven by profit growth in Poland, Spain, Turkey and Germany and lower losses in Russia and China. During H1, five net new stores opened, two in Poland, two in Russia, two in Turkey and one rationalisation in China, adding around 3% new space. A further 10 new stores are planned for H2, including four in Poland, two in Russia and four in Turkey, adding around 10% new space for the full year. In Eastern Europe sales in Poland were up 6.3% (+2.4% LFL) to £570 million. New bathroom and garden catalogues and expanded decoration ranges all boosted sales and profits. Retail profit was up 5.6% to £70 million reflecting the solid sales growth with gross margins benefiting (+30 basis points) from more direct sourcing and continued tight cost control. In Russia sales grew 28.4% to £142 million reflecting new store openings. In Turkey, Kingfisher’s 50% JV, Koçtaş, retail profit grew strongly reflecting strong sales growth (+7.6% LFL), more direct sourcing benefiting gross margins and tight cost control. Elsewhere, in Spain the Brico Dépôt business continued to grow sales and profits in a tough market with sales up 11.4% in H1. Hornbach, in which Kingfisher has a 21% economic interest, grew its retail profit contribution by 17.1% to £13 million (2010/11: £11 million). B&Q China sales declined 7.7% to £168 million (-5.9% LFL) reflecting one less store compared with the same period last year and a challenging housing market (down 14%*). The ‘fix-it’ phase of the turnaround plan remains on track with losses reducing as planned to £5 million, more than halved compared to the same period last year (2010/11: £11 million loss). * New property transaction sales for China’s 13 largest cities August 2010-July 2011 according to the China Real Estate Exchange Center

7/17
‘Delivering Value’ progress Progress to date (Feb 2011 to July 2011) and milestones for the remainder of the year
1. Driving up B&Q UK & Ireland’s profit
Self-help measures to rebuild B&Q’s retail margin continued to deliver results. B&Q remains on track to achieve a sustainable 7% operating margin . 2011/12 first half progress
• Stores
o Revamped 4 large stores o 1 ‘showroom only’ revamp (kitchen, bathroom and bedroom areas) o Acquired and processed regulatory approval on 29 leasehold stores from the
administrator of Focus DIY
• Product and Service o Rolled out a new storage range nationally o Established ‘You can do it’ DIY centres in 15 large stores, delivering classes
to 10,000 customers o Created around 16 new ‘how to’ videos available in-store, on diy.com and
Youtube.com, taking the total to 50 o Introduced a national van hire service (in partnership with Hertz) to make it
easier for customers to take away large purchases themselves
• Margin and Costs o Direct sourced shipments continued to provide gross margin benefit o Costs as a percentage of sales held flat reflecting tight controls
2011/12 second half milestones
• Stores
o Revamp 2 large stores and relocate one medium store (1) o 2 ‘showroom only’ revamps (kitchen, bathroom and bedroom areas) (1) o Reopen 28 acquired ex-Focus DIY stores in the B&Q format
• Product and Service
o Open ‘You can do it’ DIY centres in a further 19 large stores o Create a further 40 ‘how to’ videos available in-store and on diy.com and
Youtube.com
• Margin and Costs o Open new distribution centre in Swindon (as part of the supply chain
efficiency project previously announced)
(1) Store revamp milestones announced in March 2011 now adjusted as priority being given to the H2 revamp of ex-Focus DIY stores

8/17
2. Exploiting our UK Trade opportunity
On target to grow sales to the professional tradesman to £1 billion in 2011/12. 2011/12 first half progress
• Added new services for trade professionals including:
o development of a ‘click, pay and collect in 15 minutes’ offer for all Screwfix trade counters, already taking over 10,000 orders a week
o bulky goods delivery to further extend the ‘TradePoint’ and Screwfix offer o an improved third-party credit and insurance offer that can be used across all
Kingfisher UK formats • Opened 13 further Screwfix net new outlets • Developed smaller version of Screwfix outlet, providing access to smaller or more
densely populated urban catchments • Over 650,000 ‘TradePoint’ customers now registered
2011/12 second half milestones
• Add new services for trade professionals including a ‘TradePoint’ call centre and a smart phone transactional application for Screwfix to allow easier online shopping
• Accelerate the opening of new Screwfix outlets adding up to a further 40 in H2, of which 30 will be the in new smaller format
• Launch specialist websites for both ‘Plumbfix’ and Electricfix’
3. Expanding our total French business
Good sales growth, buying optimisation and increased direct sourcing delivering strong profit growth (up 24% in constant currencies). 2011/12 first half progress
• Opened 1 new store, completed 2 relocations and 1 revamp • Continued extensive programme of new product launches across both businesses • Re-launched the Brico Dépôt ‘Le Book’ pocket-sized catalogue • Extended buying optimisation programme, to include Brico Dépôt Spain • Rolled out successful common incentive schemes to all store staff across both
businesses incorporating new operational measures • Direct sourced shipments continue to grow ahead of target
2011/12 second half milestones
• Open 1 new store, 2 relocations and 1 revamp, adding around 2% net new space
for the full year • Continue with up-weighted new product launches across both businesses • Continue to extend buying optimisation programme
9/17
4. Rolling out in Eastern Europe 6% space added since last year end. Double-digit profit and sales growth.
2011/12 first half progress
• Opened 6 new stores, 2 in Poland, 2 in Russia and 2 in Turkey • Direct sourcing shipments in Poland and Turkey ahead of full year target (to
increase by over 50%), benefiting gross margin • Opened ‘city store’ format in Moscow (housing 90% of current product ranges in
65% of the space) 2011/12 second half milestones
• Open a further 10 new stores, 4 in Poland, 2 in Russia and 4 in Turkey, adding around 17% new space for the full year
• Direct sourcing shipments in Poland and Turkey to continue to grow ahead of target
5. Turning around B&Q China
Repositioning plan remains on track. 2011/12 first half progress
• Prior year first half losses more than halved • Continued the new format trial and introduction of new ranges • Direct sourced group own brands up over 50% on last year, still at early stages
2011/12 second half milestones
• Continue the new format trial • Continue the work on re-engineering ranges including more direct sourced group
own brands • Full year break-even target, subject to a stable Chinese home improvement market
6. Growing Group sourcing Direct sourcing shipments through the Kingfisher Sourcing Organisation (KSO) continued to grow. 2011/12 first half progress
• Commenced roll-out of group-wide common ranges under the Blooma, Blyss and
Verve ‘superbrands’ • Direct sourced shipments running in line with full year target

10/17
2011/12 second half milestones
• Finalise common range planning and range review alignment between B&Q UK and
Castorama France • Finalise three year direct sourcing and product innovation development plans • Continue to roll-out group-wide common ranges • Increase volume of direct sourced shipments for the full year by 15% to around
US$1.5 billion
7. Reducing working capital
Since 2007/08 net working capital reduced by over £400 million excluding around £260 million negative impact of French LME (2). 2011/12 first half progress
• Working capital increased as planned in H1 reflecting new stores and on-going French LME (2) impacts. Stock level 3 days higher than anticipated primarily due to slow sales of seasonal product
• On track to further extend average payment terms on direct sourced product by another 5 days (to 90 days)
2011/12 second half milestones
• Eliminate the 3 days of additional stock • Keep ‘Like-for-like’ working capital constant before the impacts of French LME (2)
and investment required for new stores
(2) Legislative changes shortening French payment terms, implemented over the 3 years to 2012
‘Creating the Leader’ We also made progress mobilising the next stage of our development known as ‘Creating the Leader’. This phase will focus on a number of self-help initiatives to drive sales, margin and cost productivity across the Group under three general themes - making home improvement easier for customers (‘Easy’), developing a world class core common range (‘Common’) and accelerating our expansion (‘Expand’). Examples of key progress made in the first half include the establishment of a new, 50 strong, Group innovation and design team in France and the creation of a new group commercial organisation (referred to internally as the ‘Kingfisher Brands Network’) which will lead the development of and implementation in store of a best in class group-wide common range.
11/17
Sustainability Sustainability will be an essential part of our ‘Creating the Leader’ strategy. We are already helping customers make their homes more sustainable at lower cost, whilst also making our own business more sustainable by reducing our environmental and social impact. As well as being good for the environment, sustainable businesses have a long and successful future ahead of them, making them attractive places to work and more valuable investments for shareholders. Building on our strong heritage in sustainability we have identified four key priorities where we believe we can make the most difference:
• Innovation: the place to shop for sustainable products • Energy: the best at providing energy-saving solutions for our customers and
ourselves • Communities: to have a positive impact on all the communities we operate in • Timber: to sell timber only from proven well-managed forests or recycled sources
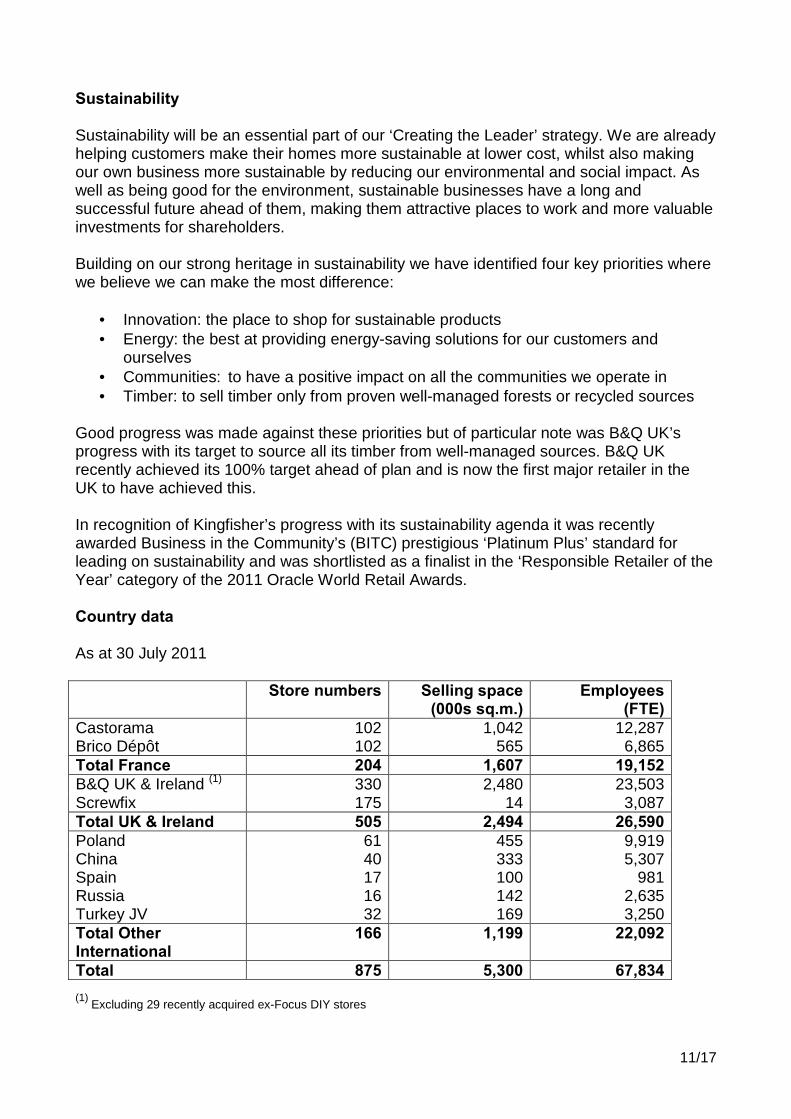
Good progress was made against these priorities but of particular note was B&Q UK’s progress with its target to source all its timber from well-managed sources. B&Q UK recently achieved its 100% target ahead of plan and is now the first major retailer in the UK to have achieved this. In recognition of Kingfisher’s progress with its sustainability agenda it was recently awarded Business in the Community’s (BITC) prestigious ‘Platinum Plus’ standard for leading on sustainability and was shortlisted as a finalist in the ‘Responsible Retailer of the Year’ category of the 2011 Oracle World Retail Awards. Country data As at 30 July 2011 Store numbers Selling space
(000s sq.m.) Employees
(FTE) Castorama 102 1,042 12,287 Brico Dépôt 102 565 6,865 Total France 204 1,607 19,152 B&Q UK & Ireland (1) 330 2,480 23,503 Screwfix 175 14 3,087 Total UK & Ireland 505 2,494 26,590 Poland 61 455 9,919 China 40 333 5,307 Spain Russia Turkey JV
17 16 32
100 142 169
981 2,635 3,250
Total Other International
166 1,199 22,092
Total 875 5,300 67,834 (1)
Excluding 29 recently acquired ex-Focus DIY stores

12/17
Financial review A summary of the reported financial results for the six months ended 30 July 2011 is set out below:
2011/12 £m
2010/11 £m
Increase
Sales 5,662 5,454 3.8% Adjusted pre-tax profit 439 354 24.0% Profit before taxation after exceptional items 438 351 24.8% Adjusted basic earnings per share 13.5p 10.6p 27.4% Dividends 2.47p 1.925p 28.3% A reconciliation of statutory profit to adjusted profit is set out below:
2011/12 £m
2010/11 £m
Increase
Profit before taxation 438 351 24.8% Exceptional items (net) - 7 Profit before exceptional items and taxation 438 358 22.3% Financing fair value remeasurements 1 (4) Adjusted pre-tax profit 439 354 24.0% Income tax expense on pre-exceptional profit (118) (107) Impact of prior year items on income tax (6) (2) Income tax on fair value remeasurements - 1 Adjusted post-tax profit 315 246 28.0% Minority interests 1 2 Adjusted post-tax profit attributable to equity shareholders
316
248 27.4%
Profit after tax and EPS including all exceptional items for the six months ended 30 July 2011 is set out below:
2011/12
2010/11 Increase
Profit after tax £320m £248m 29.0% Basic EPS 13.7p 10.6p 29.2% Overview Total sales grew by 3.0% on a constant currency basis and 3.8% to £5.7 billion on a reported rate basis. On a like-for-like basis, Group sales were up 1.6% (2010/11: down 1.3%). During the period, a net additional 17 new stores were opened taking the store network to 843 stores (excluding 32 Turkey JV stores). During H1 we received clearance for B&Q UK to acquire 29 stores from Focus DIY, with 28 opening due to open in H2. Retail profit before exceptional items grew by 17.6% to £473 million (2010/11: £402 million), and by 19.7% to £473 million (2010/11: £395 million) including exceptional items. The net interest charge for the six months was £5 million, down £11 million on the prior period. A breakdown of this is shown below.
13/17
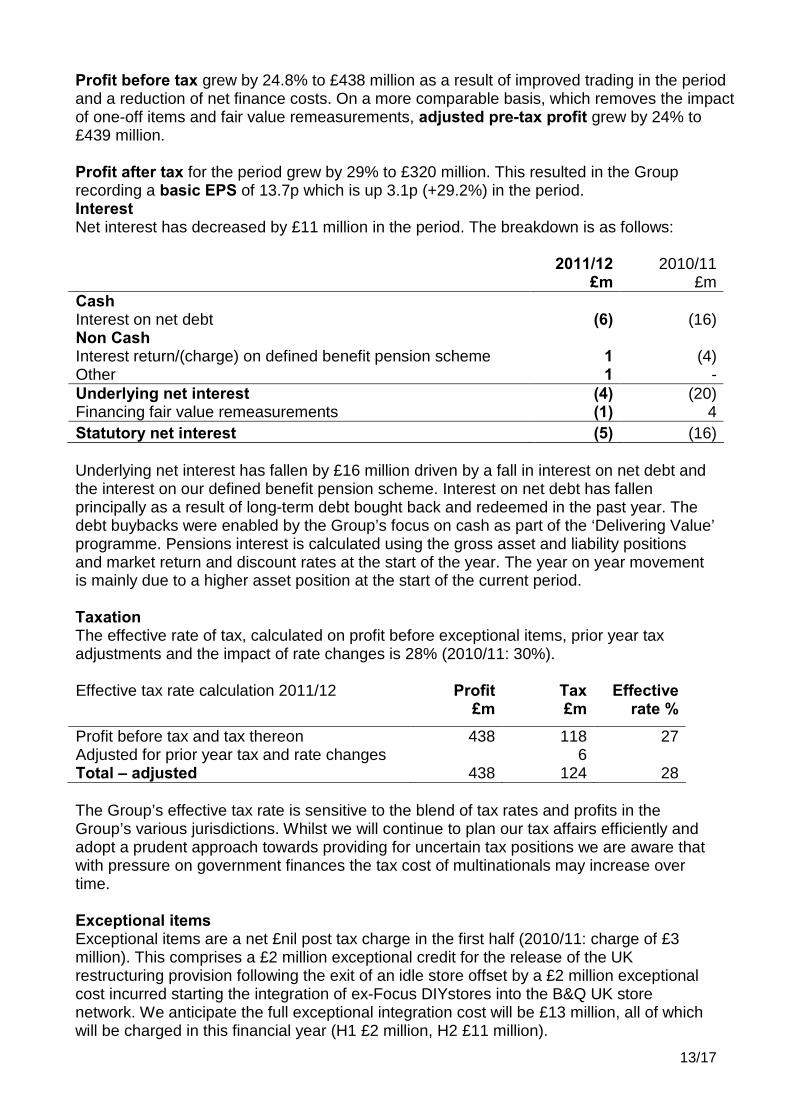
Profit before tax grew by 24.8% to £438 million as a result of improved trading in the period and a reduction of net finance costs. On a more comparable basis, which removes the impact of one-off items and fair value remeasurements, adjusted pre-tax profit grew by 24% to £439 million. Profit after tax for the period grew by 29% to £320 million. This resulted in the Group recording a basic EPS of 13.7p which is up 3.1p (+29.2%) in the period. Interest Net interest has decreased by £11 million in the period. The breakdown is as follows:
2011/12
£m 2010/11
£m Cash Interest on net debt (6) (16) Non Cash Interest return/(charge) on defined benefit pension scheme 1 (4) Other 1 - Underlying net interest (4) (20) Financing fair value remeasurements (1) 4 Statutory net interest (5) (16) Underlying net interest has fallen by £16 million driven by a fall in interest on net debt and the interest on our defined benefit pension scheme. Interest on net debt has fallen principally as a result of long-term debt bought back and redeemed in the past year. The debt buybacks were enabled by the Group’s focus on cash as part of the ‘Delivering Value’ programme. Pensions interest is calculated using the gross asset and liability positions and market return and discount rates at the start of the year. The year on year movement is mainly due to a higher asset position at the start of the current period. Taxation The effective rate of tax, calculated on profit before exceptional items, prior year tax adjustments and the impact of rate changes is 28% (2010/11: 30%). Effective tax rate calculation 2011/12 Profit
£m Tax £m
Effective rate %
Profit before tax and tax thereon 438 118 27 Adjusted for prior year tax and rate changes 6 Total – adjusted 438 124 28 The Group’s effective tax rate is sensitive to the blend of tax rates and profits in the Group’s various jurisdictions. Whilst we will continue to plan our tax affairs efficiently and adopt a prudent approach towards providing for uncertain tax positions we are aware that with pressure on government finances the tax cost of multinationals may increase over time. Exceptional items Exceptional items are a net £nil post tax charge in the first half (2010/11: charge of £3 million). This comprises a £2 million exceptional credit for the release of the UK restructuring provision following the exit of an idle store offset by a £2 million exceptional cost incurred starting the integration of ex-Focus DIYstores into the B&Q UK store network. We anticipate the full exceptional integration cost will be £13 million, all of which will be charged in this financial year (H1 £2 million, H2 £11 million).

14/17
Earnings per share Basic earnings per share have increased by 29.2% to 13.7p (2010/11: 10.6p). On a more comparable basis, removing the impact of exceptional items, prior year tax items and financing fair value remeasurements, adjusted basic earnings per share have increased by 27.4% to 13.5p (2010/11: 10.6p). 2011/12 2010/11 Basic earnings per share 13.7p 10.6p Exceptional items - 0.3p Tax on exceptional and prior year items (0.3)p (0.2)p Financing fair value remeasurements (net of tax) 0.1p (0.1)p Adjusted earnings per share 13.5p 10.6p Dividends The interim dividend has been calculated, as in the prior year, automatically as 35% of the prior year’s total dividend. Any increase in the full year dividend is considered annually in March. As announced at the year end, the interim dividend is proposed at 2.47p per share (2010/11: 1.925p per share). The ex-dividend date will be 5 October 2011 and the dividend will be paid on 11 November 2011, to those shareholders who are on the Register of Members at the close of business on 7 October 2011. Shareholders are able to take this dividend as cash or in shares, through the Dividend Reinvestment Plan (DRIP). Shareholders who wish to elect for the DRIP for the forthcoming interim dividend but have not already done so must notify the Registrars, Computershare Investor Services plc, by 21 October 2011. Free cash flow A reconciliation of free cash flow and cash flow movement in financial net debt/cash is set out below:
2011/12
£m 2010/11
£m Operating profit (before exceptional items) 443 374 Other non-cash items1 134 135 Change in working capital pre-exceptionals (170) 25 Pensions and provisions pre-exceptionals (26) (30) Operating cash flow 381 504 Net interest paid (5) (12) Tax paid (68) (51) Gross capital expenditure (175) (127) Disposal of assets - 73 Free cash flow 133 387 Dividends paid (121) (84) Share purchase for employee incentive schemes (117) - Strategic capex investments 2 - Focus (24) - - UK (64) - Other 3 (4) (5) Cash flow movement in net (debt)/cash (197) 298 Opening net (debt)/cash 14 (250) FX impacts (3) (29) Closing net (debt)/cash (186) 19 1 Includes depreciation and amortisation, share-based compensation charge, pre-exceptional non cash movement in pensions and provisions, share of post-tax results of JVs and associates and profit/loss on retail disposals. 2 Investments of a one-off nature, such as bolt-on acquisitions and buy outs of freehold in existing leased stores
3 Includes dividends received from JVs and associates, issue of share capital to equity shareholders, disposal of own shares, business acquisitions and cash utilisation of exceptional items.
15/17
Free cash flow of £133 million was generated in the period, a decrease of £254 million year on year due to increases in working capital and net capex which were partially offset by the increase in operating profit. As anticipated working capital has increased during the period driven by new stores, higher import stock holdings and LME 1 (impact £80 million in the period). The opportunity exists to reduce stock in certain territories and categories and we will continue to focus on this area. Gross capex has increased by £48 million year on year as a result of investment in our store networks in Poland and Russia, and in our group IT systems. During the prior year we received £73 million net proceeds principally on property sales. During the period we have invested additional funds outside of our normal ‘free cash flow’ with £88 million allocated to strategic capex investments and £117 million on the employee share trust acquiring 42 million Kingfisher shares to match existing share incentive schemes, avoiding dilution of shareholder interests when the schemes mature. The strategic capex spend includes £64 million in the UK where we have actively decided to purchase freeholds already occupied and £24 million on the acquisition of 29 Focus stores. Further capex of £20 million is anticipated on the Focus stores during the year and £13 million of exceptional costs will be incurred whilst we integrate the stores before they open. 1
Legislative changes shortening French payment terms, implemented over the 3 years to 2012
Financial net debt at the end of the period was £186 million (29 January 2011: £14 million net cash; 31 July 2010: £19 million net cash). The Group maintains a stable investment grade credit rating of BBB -. The Group refinanced its £500 million 2012 facility with a £200 million 2016 committed facility in the period with no changes to the covenant terms. This facility was undrawn at 30 July 2011. The next significant debt maturity arises in November 2012. During the period, the Group has bought back December 2014 bonds with a nominal value of £9.4 million. The maturity profile of Kingfisher’s debt is illustrated at: www.kingfisher.com/index.asp?pageid=76 Pensions The IAS 19 net pension position at 30 July 2011 was a deficit of £68 million, compared with £58 million at 29 January 2011. The decline in the position since 29 January 2011 is due principally to updating the financial assumptions based on market conditions at 30 July 2011. This has led to the discount rate assumption being reduced from 5.6% to 5.3%. In the previous financial year the Group established a partnership, giving the UK defined benefit pension scheme recourse to property assets in the event of Kingfisher’s insolvency and a regular income stream forming part of the Group’s annual cash contributions. In the period a further two UK properties with a combined market value of £119 million were transferred into the partnership and leased back to B&Q plc bringing the total contribution to £184 million to date.

16/17
Risks The Board considers risk assessment, identification of mitigating actions and internal control to be fundamental to achieving Kingfisher’s strategic objectives. The Board considers that the principal risks to achieving its objectives, which remain principally unchanged from those set in the 2010/11 Annual Report and Accounts, are set out below: • Sustainable model for emerging markets • Fragility of economic recovery continuing to undermine consumer confidence and
restricting opportunities for growth • Failure to take advantage of the Group’s combined buying power, synergies and
economies of scale • Systems and supply chain infrastructure lacking the flexibility and capability to support
the delivery of the Group’s strategic plans • Failure to adapt the Group’s formats and models to meet ongoing changes in
consumer trends, particularly given the impact of developments in the multi-channel sphere
• Impact of a major health and safety failure on the Group’s reputation, resulting in harm to employees, penalties or prosecution
• Not making the necessary investment in people to ensure the Group has the appropriate calibre of staff, skills and experience
• Risk of penalties or punitive damages arising from failure to comply with new legislative or regulatory requirements
• Impact on Group’s reputation from a major ethical or environmental failure • Not implementing the measures and disciplines to effectively assess the shareholder
value delivered through the Delivering Value programme Further details of the Group risks and risk management process can be found on pages 26 to 28 of the 2010/11 Annual Report and Accounts.
17/17
Forward-looking statements This press release contains certain statements that are forward-looking and are therefore subject to risks, assumptions and uncertainties that could cause actual results to differ materially from those expressed or implied because they relate to future events. These forward-looking statements include, but are not limited to, statements relating to the Company’s expectations around its three key priorities of Management, Capital and Returns and the associated seven steps to ‘Delivering Value’ objectives and the next phase of the Company’s development known as ‘Creating the Leader’. Forward-looking statements can be identified by the use of relevant terminology including the words: “believes”, “estimates”, “anticipates”, “expects”, “intends”, “plans”, “goal”, “target”, “aim”, “may”, “will”, “would”, “could” or “should” or, in each case, their negative or other variations or comparable terminology and include all matters that are not historical facts. They appear in a number of places throughout this press release and include statements regarding our intentions, beliefs or current expectations and those of our officers, directors and employees concerning, amongst other things, our results of operations, financial condition, changes in tax rates, liquidity, prospects, growth, strategies and the businesses we operate. Other factors that could cause actual results to differ materially from those estimated by the forward-looking statements include, but are not limited to, global economic business conditions, monetary and interest rate policies, foreign currency exchange rates, equity and property prices, the impact of competition, inflation and deflation, changes to regulations, taxes and legislation, changes to consumer saving and spending habits; and our success in managing these factors. Consequently, our actual future financial condition, performance and results could differ materially from the plans, goals and expectations set out in our forward-looking statements. The Company undertakes no obligation to publicly update any forward- looking statement, whether as a result of new information, future events or otherwise.
1/17
KINGFISHER PLC
2011/12 INTERIM CONDENSED FINANCIAL STATEMENTS (UNA UDITED)
CONSOLIDATED INCOME STATEMENT
Half year ended 30 July 2011 Half year ended 31 July 2010
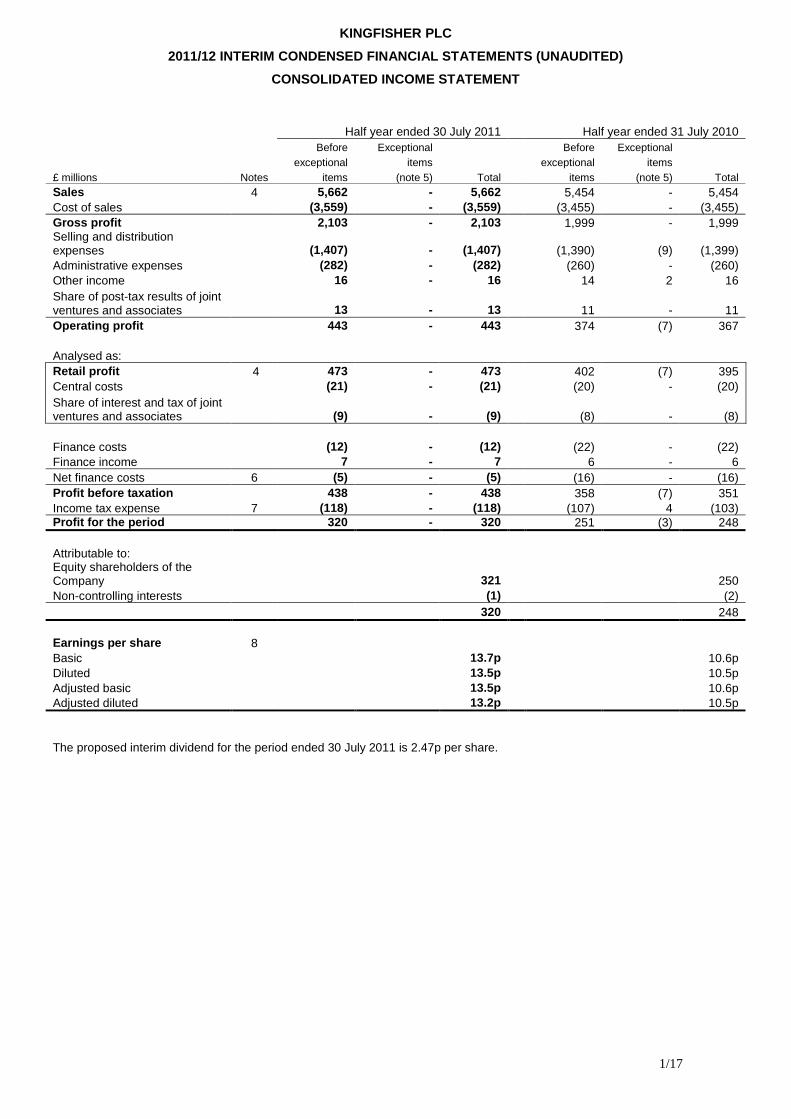
Before Exceptional Before Exceptional exceptional items exceptional items £ millions Notes items (note 5) Total items (note 5) Total Sales 4 5,662 - 5,662 5,454 - 5,454 Cost of sales (3,559) - (3,559) (3,455) - (3,455) Gross profit 2,103 - 2,103 1,999 - 1,999 Selling and distribution expenses (1,407) - (1,407) (1,390) (9) (1,399) Administrative expenses (282) - (282) (260) - (260) Other income 16 - 16 14 2 16 Share of post-tax results of joint ventures and associates
13 - 13 11 - 11
Operating profit 443 - 443 374 (7) 367 Analysed as: Retail profit 4 473 - 473 402 (7) 395 Central costs (21) - (21) (20) - (20) Share of interest and tax of joint ventures and associates (9) - (9) (8) - (8) Finance costs (12) - (12) (22) - (22) Finance income 7 - 7 6 - 6 Net finance costs 6 (5) - (5) (16) - (16) Profit before taxation 438 - 438 358 (7) 351 Income tax expense 7 (118) - (118) (107) 4 (103) Profit for the period 320 - 320 251 (3) 248 Attributable to: Equity shareholders of the Company 321 250 Non-controlling interests (1) (2) 320 248 Earnings per share 8 Basic 13.7p 10.6p Diluted 13.5p 10.5p Adjusted basic 13.5p 10.6p Adjusted diluted 13.2p 10.5p The proposed interim dividend for the period ended 30 July 2011 is 2.47p per share.

2/17
KINGFISHER PLC
2011/12 INTERIM CONDENSED FINANCIAL STATEMENTS (UNA UDITED)
CONSOLIDATED INCOME STATEMENT
Year ended 29 January 2011 Before Exceptional exceptional items £ millions Notes items (note 5) Total Sales 4 10,450 - 10,450 Cost of sales (6,545) - (6,545) Gross profit 3,905 - 3,905 Selling and distribution expenses (2,739) (9) (2,748) Administrative expenses (527) - (527) Other income 34 3 37 Share of post-tax results of joint ventures and associates 31 - 31 Operating profit 704 (6) 698 Analysed as: Retail profit 4 762 (6) 756 Central costs (41) - (41) Share of interest and tax of joint ventures and associates (17) - (17) Finance costs (46) - (46) Finance income 19 - 19 Net finance costs 6 (27) - (27) Profit before taxation 677 (6) 671 Income tax expense 7 (183) 3 (180) Profit for the year 494 (3) 491 Attributable to: Equity shareholders of the Company 494 Non-controlling interests (3) 491 Earnings per share 8 Basic 21.0p Diluted 20.7p Adjusted basic 20.5p Adjusted diluted 20.2p

3/17
KINGFISHER PLC
2011/12 INTERIM CONDENSED FINANCIAL STATEMENTS (UNA UDITED)
CONSOLIDATED STATEMENT OF COMPREHENSIVE INCOME
£ millions Half year ended
30 July 2011 Half year ended
31 July 2010 Year ended
29 January 2011 Profit for the period 320 248 491 Actuarial (losses)/gains on post employment benefits (19) 67 128 Currency translation differences
Group 16 (71) 32 Joint ventures and associates 3 (2) -
Cash flow hedges Fair value (losses)/gains (13) 11 5 Losses/(gains) transferred to inventories 12 (11) (14)
Tax on other comprehensive income 5 (15) (33) Other comprehensive income for the period 4 (21) 118 Total comprehensive income for the period 324 227 609
Attributable to: Equity shareholders of the Company 325 229 611
Non-controlling interests (1) (2) (2)
324 227 609

4/17
KINGFISHER PLC
2011/12 INTERIM CONDENSED FINANCIAL STATEMENTS (UNA UDITED)
CONSOLIDATED STATEMENT OF CHANGES IN EQUITY
Attributable to equity shareholders of the Company
£ millions
Share capital
Share
premium
Own shares
held
Retained earnings
Other reserves (note 12) Total
Non-controlling
interests Total
equity
At 30 January 2011 371 2,194 (42) 2,390 539 5,452 8 5,460 Profit for the period - - - 321 - 321 (1) 320 Actuarial losses on post employment benefits - - - (19) - (19) - (19) Currency translation differences
Group - - - - 16 16 - 16 Joint ventures and associates - - - - 3 3 - 3
Cash flow hedges Fair value losses - - - - (13) (13) - (13) Losses transferred to inventories - - - - 12 12 - 12
Tax on other comprehensive income - - - 6 (1) 5 - 5 Other comprehensive income for the period - - - (13) 17 4 - 4 Total comprehensive income for the period - - - 308 17 325 (1) 324 Share-based compensation - - - 17 - 17 - 17 Shares issued under share schemes 1 - - - - 1 - 1 Own shares purchased - - (117) - - (117) - (117) Own shares disposed - - 21 (20) - 1 - 1 Dividends - - - (121) - (121) - (121) Purchase of non-controlling interests - - - (7) - (7) - (7) At 30 July 2011 372 2,194 (138) 2,567 556 5,551 7 5,558
At 31 January 2010 371 2,191 (54) 1,921 516 4,945 10 4,955 Profit for the period - - - 250 - 250 (2) 248 Actuarial gains on post employment benefits - - - 67 - 67 - 67 Currency translation differences
Group - - - - (71) (71) - (71) Joint ventures and associates - - - - (2) (2) - (2)
Cash flow hedges Fair value gains - - - - 11 11 - 11 Gains transferred to inventories - - - - (11) (11) - (11)
Tax on other comprehensive income - - - (20) 5 (15) - (15) Other comprehensive income for the period - - - 47 (68) (21) - (21) Total comprehensive income for the period - - - 297 (68) 229 (2) 227 Share-based compensation - - - 12 - 12 - 12 Own shares disposed - - 8 (8) - - - - Dividends - - - (84) - (84) - (84) At 31 July 2010 371 2,191 (46) 2,138 448 5,102 8 5,110

5/17
KINGFISHER PLC
2011/12 INTERIM CONDENSED FINANCIAL STATEMENTS (UNA UDITED)
CONSOLIDATED STATEMENT OF CHANGES IN EQUITY
Attributable to equity shareholders of the Company £ millions
Share capital
Share
premium
Own shares
held
Retained earnings
Other reserves (note 12) Total
Non-controlling
interests Total
equity
At 31 January 2010 371 2,191 (54) 1,921 516 4,945 10 4,955
Profit for the year - - - 494 - 494 (3) 491 Actuarial gains on post employment benefits - - - 128 - 128 - 128 Currency translation differences
Group - - - - 31 31 1 32 Cash flow hedges
Fair value gains - - - - 5 5 - 5 Gains transferred to inventories - - - - (14) (14) - (14)
Tax on other comprehensive income - - - (34) 1 (33) - (33) Other comprehensive income for the year - - - 94 23 117 1 118 Total comprehensive income for the year - - - 588 23 611 (2) 609 Share-based compensation - - - 21 - 21 - 21 Shares issued under share schemes - 3 - - - 3 - 3 Own shares disposed - - 12 (11) - 1 - 1 Dividends - - - (129) - (129) - (129) At 29 January 2011 371 2,194 (42) 2,390 539 5,452 8 5,460
6/17
KINGFISHER PLC
2011/12 INTERIM CONDENSED FINANCIAL STATEMENTS (UNA UDITED)
CONSOLIDATED BALANCE SHEET
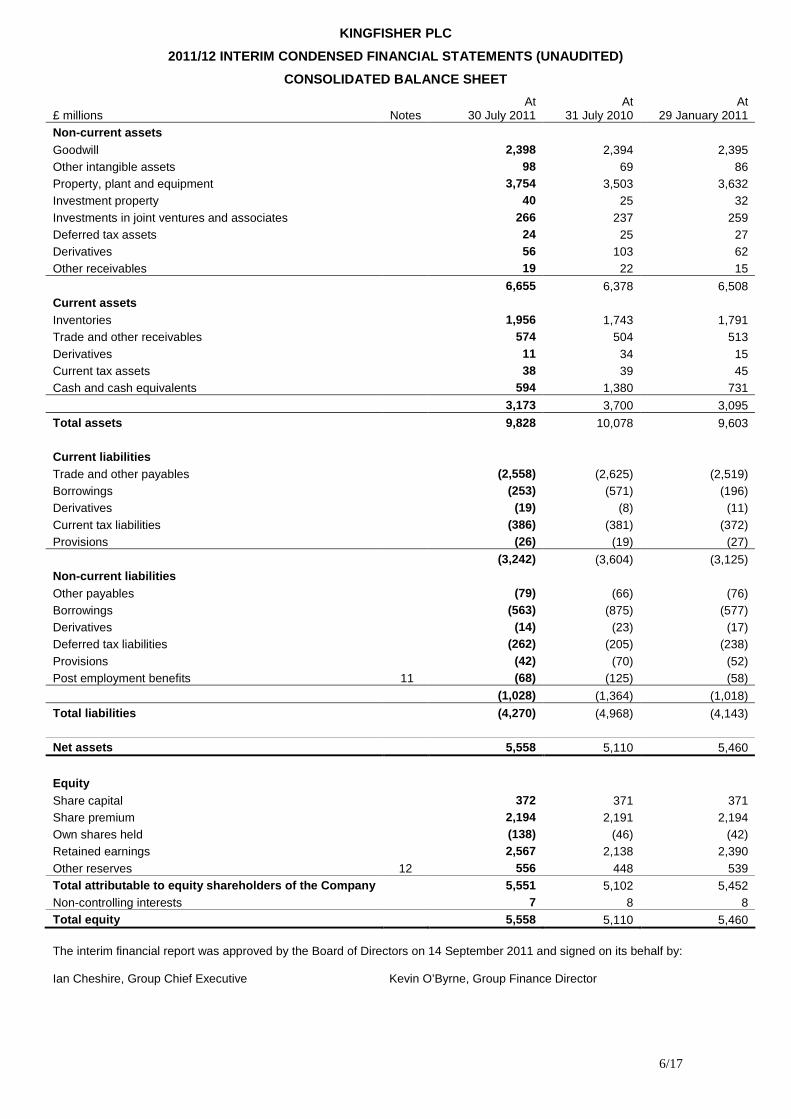
£ millions Notes At
30 July 2011 At
31 July 2010 At
29 January 2011 Non-current assets Goodwill 2,398 2,394 2,395 Other intangible assets 98 69 86 Property, plant and equipment 3,754 3,503 3,632 Investment property 40 25 32 Investments in joint ventures and associates 266 237 259 Deferred tax assets 24 25 27 Derivatives 56 103 62 Other receivables 19 22 15
6,655 6,378 6,508 Current assets Inventories 1,956 1,743 1,791 Trade and other receivables 574 504 513 Derivatives 11 34 15 Current tax assets 38 39 45 Cash and cash equivalents 594 1,380 731
3,173 3,700 3,095
Total assets 9,828 10,078 9,603 Current liabilities Trade and other payables (2,558) (2,625) (2,519) Borrowings (253) (571) (196) Derivatives (19) (8) (11) Current tax liabilities (386) (381) (372) Provisions (26) (19) (27)
(3,242) (3,604) (3,125) Non-current liabilities Other payables (79) (66) (76) Borrowings (563) (875) (577) Derivatives (14) (23) (17) Deferred tax liabilities (262) (205) (238) Provisions (42) (70) (52) Post employment benefits 11 (68) (125) (58)
(1,028) (1,364) (1,018)
Total liabilities (4,270) (4,968) (4,143) Net assets 5,558 5,110 5,460
Equity Share capital 372 371 371 Share premium 2,194 2,191 2,194 Own shares held (138) (46) (42) Retained earnings 2,567 2,138 2,390 Other reserves 12 556 448 539 Total attributable to equity shareholders of the Co mpany 5,551 5,102 5,452 Non-controlling interests 7 8 8 Total equity 5,558 5,110 5,460 The interim financial report was approved by the Board of Directors on 14 September 2011 and signed on its behalf by: Ian Cheshire, Group Chief Executive Kevin O’Byrne, Group Finance Director
7/17
KINGFISHER PLC
2011/12 INTERIM CONDENSED FINANCIAL STATEMENTS (UNA UDITED)
CONSOLIDATED CASH FLOW STATEMENT
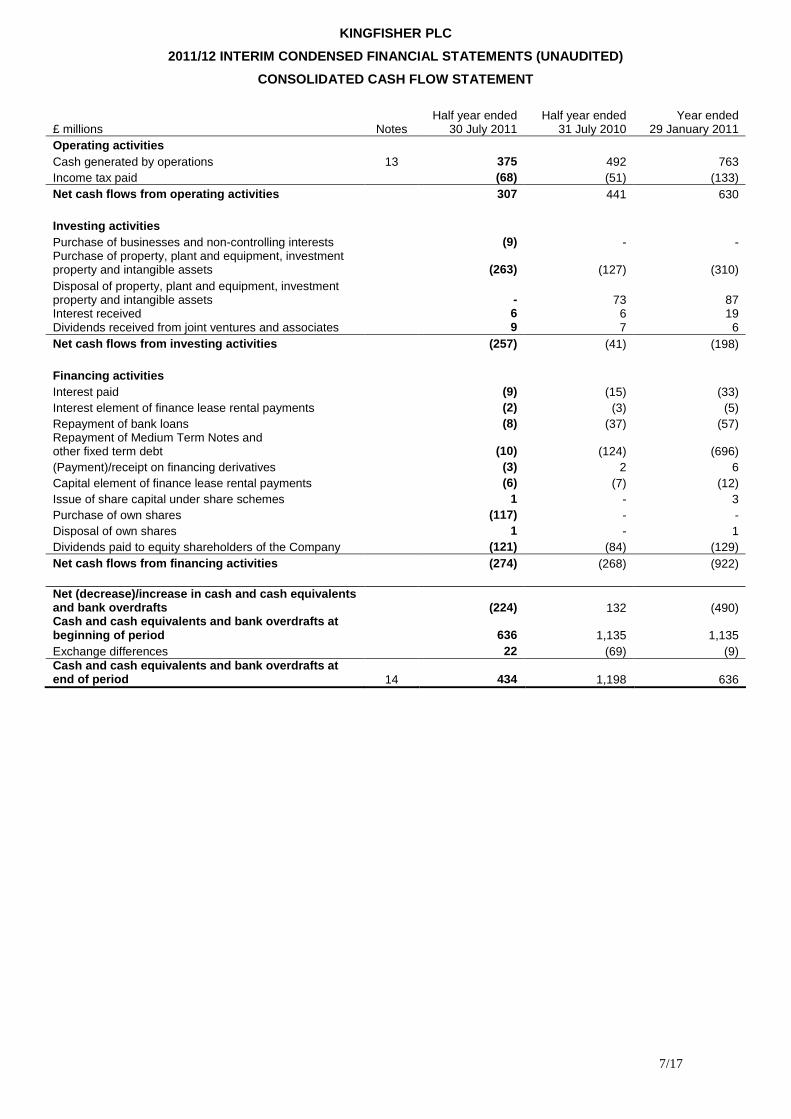
£ millions Notes Half year ended
30 July 2011 Half year ended
31 July 2010 Year ended
29 January 2011 Operating activities Cash generated by operations 13 375 492 763 Income tax paid (68) (51) (133) Net cash flows from operating activities 307 441 630 Investing activities Purchase of businesses and non-controlling interests (9) - - Purchase of property, plant and equipment, investment property and intangible assets (263) (127) (310) Disposal of property, plant and equipment, investment property and intangible assets - 73 87 Interest received 6 6 19 Dividends received from joint ventures and associates 9 7 6 Net cash flows from investing activities (257) (41) (198) Financing activities Interest paid (9) (15) (33) Interest element of finance lease rental payments (2) (3) (5) Repayment of bank loans (8) (37) (57) Repayment of Medium Term Notes and other fixed term debt (10) (124) (696) (Payment)/receipt on financing derivatives (3) 2 6 Capital element of finance lease rental payments (6) (7) (12) Issue of share capital under share schemes 1 - 3 Purchase of own shares (117) - - Disposal of own shares 1 - 1 Dividends paid to equity shareholders of the Company (121) (84) (129) Net cash flows from financing activities (274) (268) (922) Net (decrease)/increase in cash and cash equivalent s and bank overdrafts (224) 132 (490) Cash and cash equivalents and bank overdrafts at beginning of period 636 1,135 1,135 Exchange differences 22 (69) (9) Cash and cash equivalents and bank overdrafts at end of period 14 434 1,198 636
8/17
KINGFISHER PLC
2011/12 INTERIM CONDENSED FINANCIAL STATEMENTS (UNA UDITED)
NOTES TO THE CONDENSED CONSOLIDATED FINANCIAL STATE MENTS
1. General information
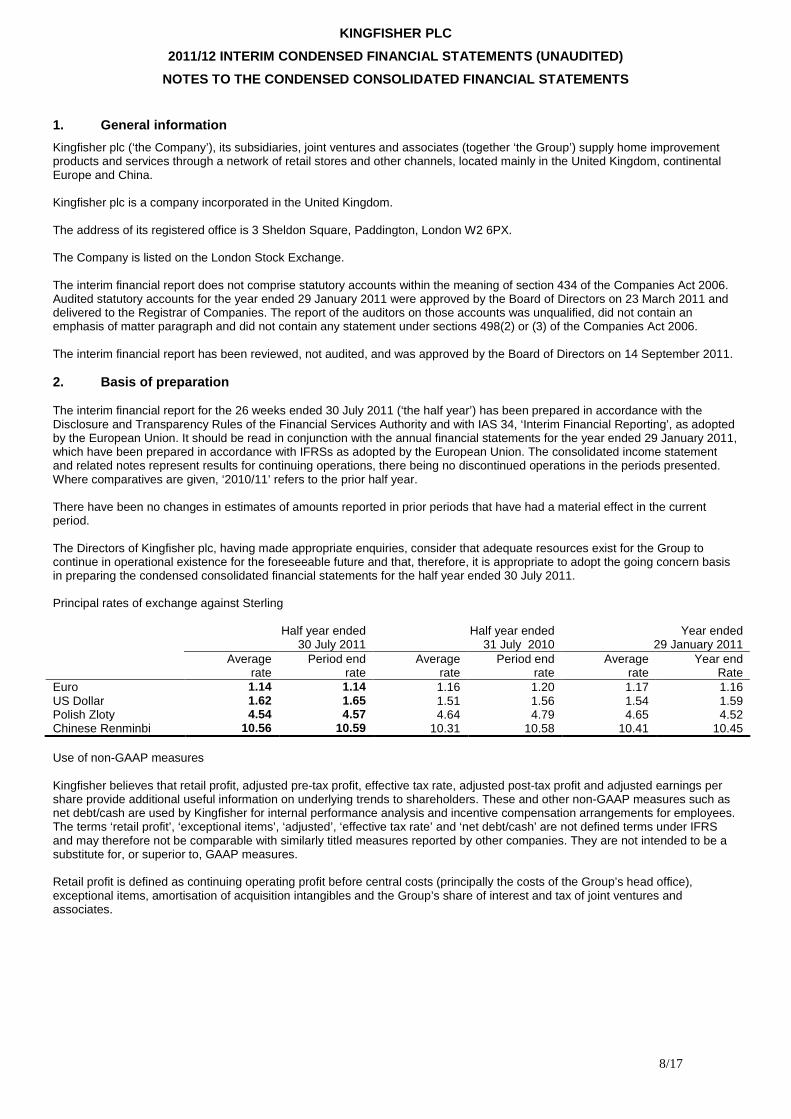
Kingfisher plc (‘the Company’), its subsidiaries, joint ventures and associates (together ‘the Group’) supply home improvement products and services through a network of retail stores and other channels, located mainly in the United Kingdom, continental Europe and China. Kingfisher plc is a company incorporated in the United Kingdom. The address of its registered office is 3 Sheldon Square, Paddington, London W2 6PX. The Company is listed on the London Stock Exchange. The interim financial report does not comprise statutory accounts within the meaning of section 434 of the Companies Act 2006. Audited statutory accounts for the year ended 29 January 2011 were approved by the Board of Directors on 23 March 2011 and delivered to the Registrar of Companies. The report of the auditors on those accounts was unqualified, did not contain an emphasis of matter paragraph and did not contain any statement under sections 498(2) or (3) of the Companies Act 2006. The interim financial report has been reviewed, not audited, and was approved by the Board of Directors on 14 September 2011. 2. Basis of preparation The interim financial report for the 26 weeks ended 30 July 2011 (‘the half year’) has been prepared in accordance with the Disclosure and Transparency Rules of the Financial Services Authority and with IAS 34, ‘Interim Financial Reporting’, as adopted by the European Union. It should be read in conjunction with the annual financial statements for the year ended 29 January 2011, which have been prepared in accordance with IFRSs as adopted by the European Union. The consolidated income statement and related notes represent results for continuing operations, there being no discontinued operations in the periods presented. Where comparatives are given, ‘2010/11’ refers to the prior half year. There have been no changes in estimates of amounts reported in prior periods that have had a material effect in the current period. The Directors of Kingfisher plc, having made appropriate enquiries, consider that adequate resources exist for the Group to continue in operational existence for the foreseeable future and that, therefore, it is appropriate to adopt the going concern basis in preparing the condensed consolidated financial statements for the half year ended 30 July 2011. Principal rates of exchange against Sterling Half year ended
30 July 2011 Half year ended
31 July 2010 Year ended
29 January 2011 Average
rate Period end
rate Average
rate Period end
rate Average
rate Year end
Rate Euro 1.14 1.14 1.16 1.20 1.17 1.16 US Dollar 1.62 1.65 1.51 1.56 1.54 1.59 Polish Zloty 4.54 4.57 4.64 4.79 4.65 4.52 Chinese Renminbi 10.56 10.59 10.31 10.58 10.41 10.45 Use of non-GAAP measures Kingfisher believes that retail profit, adjusted pre-tax profit, effective tax rate, adjusted post-tax profit and adjusted earnings per share provide additional useful information on underlying trends to shareholders. These and other non-GAAP measures such as net debt/cash are used by Kingfisher for internal performance analysis and incentive compensation arrangements for employees. The terms ‘retail profit’, ‘exceptional items’, ‘adjusted’, ‘effective tax rate’ and ‘net debt/cash’ are not defined terms under IFRS and may therefore not be comparable with similarly titled measures reported by other companies. They are not intended to be a substitute for, or superior to, GAAP measures. Retail profit is defined as continuing operating profit before central costs (principally the costs of the Group’s head office), exceptional items, amortisation of acquisition intangibles and the Group’s share of interest and tax of joint ventures and associates.

9/17
The separate reporting of non-recurring exceptional items, which are presented as exceptional within their relevant income statement category, helps provide an indication of the Group’s underlying business performance. The principal items which are included as exceptional items are: • non trading items included in operating profit such as profits and losses on the disposal, closure or impairment of
subsidiaries, joint ventures, associates and investments which do not form part of the Group’s trading activities; • profits and losses on the disposal of properties; and • the costs of significant restructuring and incremental acquisition integration costs. The term ‘adjusted’ refers to the relevant measure being reported for continuing operations excluding exceptional items, financing fair value remeasurements, amortisation of acquisition intangibles, related tax items and prior year tax items. Financing fair value remeasurements represent changes in the fair value of financing derivatives, excluding interest accruals, offset by fair value adjustments to the carrying amount of borrowings and other hedged items under fair value hedge relationships. Financing derivatives are those that relate to underlying items of a financing nature. The effective tax rate represents the effective income tax expense as a percentage of continuing profit before taxation excluding exceptional items. Effective income tax expense is the continuing income tax expense excluding tax on exceptional items and tax adjustments in respect of prior years and changes in tax rates. Net debt (or net cash) comprises borrowings and financing derivatives (excluding accrued interest), less cash and cash equivalents and current other investments. 3. Accounting policies The accounting policies adopted are consistent with those of the annual financial statements for the year ended 29 January 2011, as described in note 2 of those financial statements. Taxes on income for interim periods are accrued using the tax rate that would be applicable to expected total annual earnings. There are no standards, amendments to standards or interpretations that are both mandatory for the first time for the financial year ending 28 January 2012 and expected to have a material impact on the Group’s results.
10/17
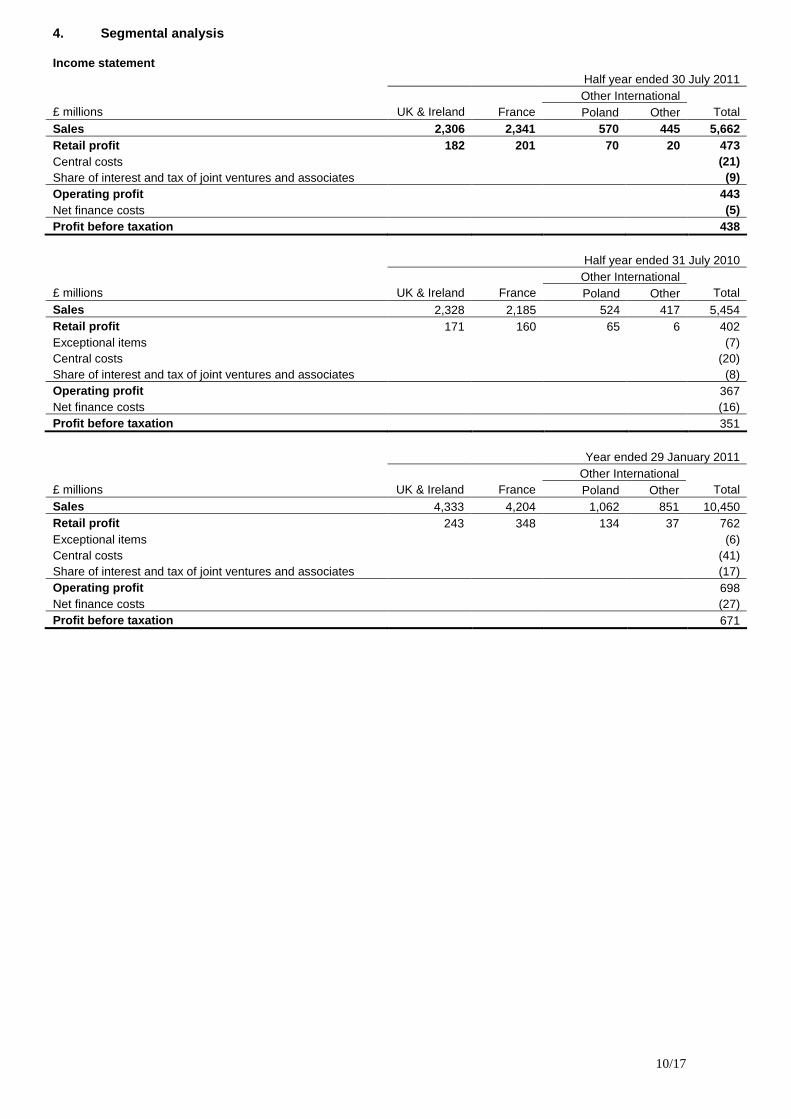
4. Segmental analysis Income statement Half year ended 30 July 2011
Other International £ millions UK & Ireland
France Poland Other
Total
Sales 2,306 2,341 570 445 5,662 Retail profit 182 201 70 20 473 Central costs (21) Share of interest and tax of joint ventures and associates (9) Operating profit 443 Net finance costs (5) Profit before taxation 438 Half year ended 31 July 2010
Other International £ millions UK & Ireland
France Poland Other
Total
Sales 2,328 2,185 524 417 5,454 Retail profit 171 160 65 6 402 Exceptional items (7) Central costs (20) Share of interest and tax of joint ventures and associates (8) Operating profit 367 Net finance costs (16) Profit before taxation 351 Year ended 29 January 2011
Other International £ millions UK & Ireland
France Poland Other
Total
Sales 4,333 4,204 1,062 851 10,450 Retail profit 243 348 134 37 762 Exceptional items (6) Central costs (41) Share of interest and tax of joint ventures and associates (17) Operating profit 698 Net finance costs (27) Profit before taxation 671
11/17
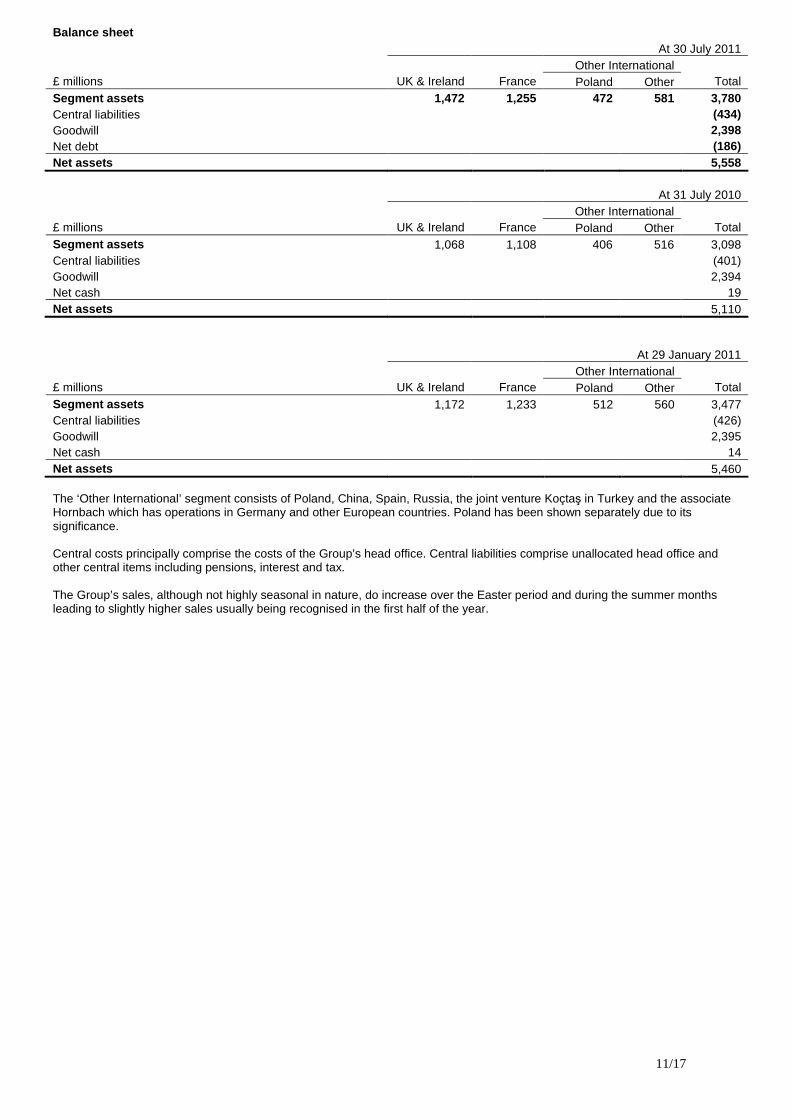
Balance sheet At 30 July 2011
Other International £ millions UK & Ireland
France Poland Other
Total
Segment assets 1,472 1,255 472 581 3,780 Central liabilities (434) Goodwill 2,398 Net debt (186) Net assets 5,558
At 31 July 2010
Other International £ millions UK & Ireland
France Poland Other
Total
Segment assets 1,068 1,108 406 516 3,098 Central liabilities (401) Goodwill 2,394 Net cash 19 Net assets 5,110
At 29 January 2011
Other International £ millions UK & Ireland
France Poland Other
Total
Segment assets 1,172 1,233 512 560 3,477 Central liabilities (426) Goodwill 2,395 Net cash 14 Net assets 5,460 The ‘Other International’ segment consists of Poland, China, Spain, Russia, the joint venture Koçtaş in Turkey and the associate Hornbach which has operations in Germany and other European countries. Poland has been shown separately due to its significance. Central costs principally comprise the costs of the Group’s head office. Central liabilities comprise unallocated head office and other central items including pensions, interest and tax. The Group’s sales, although not highly seasonal in nature, do increase over the Easter period and during the summer months leading to slightly higher sales usually being recognised in the first half of the year.

12/17
5. Exceptional items Half year ended Half year ended Year ended £ millions 30 July 2011 31 July 2010 29 January 2011 Included within selling and distribution expenses UK stores acquisition integration (2) - - UK restructuring 2 (9) (9) - (9) (9) Included within other income Profit on disposal of properties - 2 3 - 2 3
Exceptional items before tax - (7) (6)
Tax on exceptional items - 4 3
Exceptional items - (3) (3) The Group acquired 29 Focus stores in the UK in May 2011 and has incurred £2m of costs during the period integrating these into the B&Q store network. The UK restructuring credit of £2m reflects the release of an onerous property contract provision for an idle store previously included as part of the B&Q UK store closure and downsizing programme in 2005/06. This release followed the purchase of the store freehold in the period. The UK restructuring charge of £9m in the prior year reflected plans announced by the Group to consolidate its distribution network in the UK through the construction of a new regional distribution centre in the south of England and the closure of other sites. The provision covered primarily future costs of redundancies and dilapidations on the sites to be exited. The profit on disposal of properties is £nil (2010/11: £2m) and for the year ended 29 January 2011 was £3m. 6. Net finance costs Half year ended Half year ended Year ended £ millions 30 July 2011 31 July 2010 29 January 2011
Bank overdrafts and bank loans (5) (8) (18) Medium Term Notes and other fixed term debt (5) (11) (21) Finance leases (2) (3) (5) Financing fair value remeasurements (1) 4 7 Unwinding of discount on provisions - (1) (3) Expected net interest charge on defined benefit pension schemes - (4) (7) Capitalised interest 1 1 1 Finance costs (12) (22) (46)
Cash and cash equivalents and current other investments 6 6 19 Expected net interest return on defined benefit pension schemes 1 - -
Finance income 7 6 19
Net finance costs (5) (16) (27)
13/17
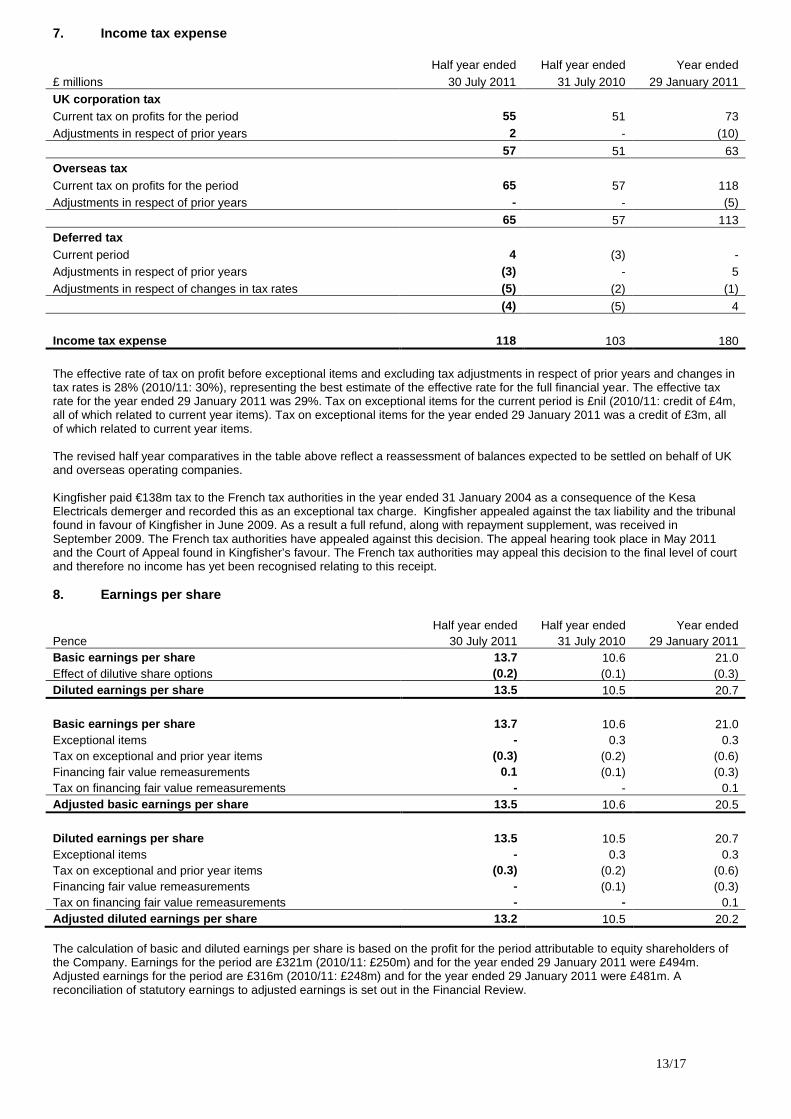
7. Income tax expense Half year ended Half year ended Year ended £ millions 30 July 2011 31 July 2010 29 January 2011 UK corporation tax Current tax on profits for the period 55 51 73 Adjustments in respect of prior years 2 - (10)
57 51 63 Overseas tax Current tax on profits for the period 65 57 118 Adjustments in respect of prior years - - (5) 65 57 113
Deferred tax Current period 4 (3) - Adjustments in respect of prior years (3) - 5 Adjustments in respect of changes in tax rates (5) (2) (1)
(4) (5) 4
Income tax expense 118 103 180
The effective rate of tax on profit before exceptional items and excluding tax adjustments in respect of prior years and changes in tax rates is 28% (2010/11: 30%), representing the best estimate of the effective rate for the full financial year. The effective tax rate for the year ended 29 January 2011 was 29%. Tax on exceptional items for the current period is £nil (2010/11: credit of £4m, all of which related to current year items). Tax on exceptional items for the year ended 29 January 2011 was a credit of £3m, all of which related to current year items. The revised half year comparatives in the table above reflect a reassessment of balances expected to be settled on behalf of UK and overseas operating companies. Kingfisher paid €138m tax to the French tax authorities in the year ended 31 January 2004 as a consequence of the Kesa Electricals demerger and recorded this as an exceptional tax charge. Kingfisher appealed against the tax liability and the tribunal found in favour of Kingfisher in June 2009. As a result a full refund, along with repayment supplement, was received in September 2009. The French tax authorities have appealed against this decision. The appeal hearing took place in May 2011 and the Court of Appeal found in Kingfisher’s favour. The French tax authorities may appeal this decision to the final level of court and therefore no income has yet been recognised relating to this receipt. 8. Earnings per share Half year ended Half year ended Year ended Pence 30 July 2011 31 July 2010 29 January 2011 Basic earnings per share 13.7 10.6 21.0 Effect of dilutive share options (0.2) (0.1) (0.3) Diluted earnings per share 13.5 10.5 20.7
Basic earnings per share 13.7 10.6 21.0 Exceptional items - 0.3 0.3 Tax on exceptional and prior year items (0.3) (0.2) (0.6) Financing fair value remeasurements 0.1 (0.1) (0.3) Tax on financing fair value remeasurements - - 0.1 Adjusted basic earnings per share 13.5 10.6 20.5
Diluted earnings per share 13.5 10.5 20.7 Exceptional items - 0.3 0.3 Tax on exceptional and prior year items (0.3) (0.2) (0.6) Financing fair value remeasurements - (0.1) (0.3) Tax on financing fair value remeasurements - - 0.1 Adjusted diluted earnings per share 13.2 10.5 20.2 The calculation of basic and diluted earnings per share is based on the profit for the period attributable to equity shareholders of the Company. Earnings for the period are £321m (2010/11: £250m) and for the year ended 29 January 2011 were £494m. Adjusted earnings for the period are £316m (2010/11: £248m) and for the year ended 29 January 2011 were £481m. A reconciliation of statutory earnings to adjusted earnings is set out in the Financial Review.
14/17
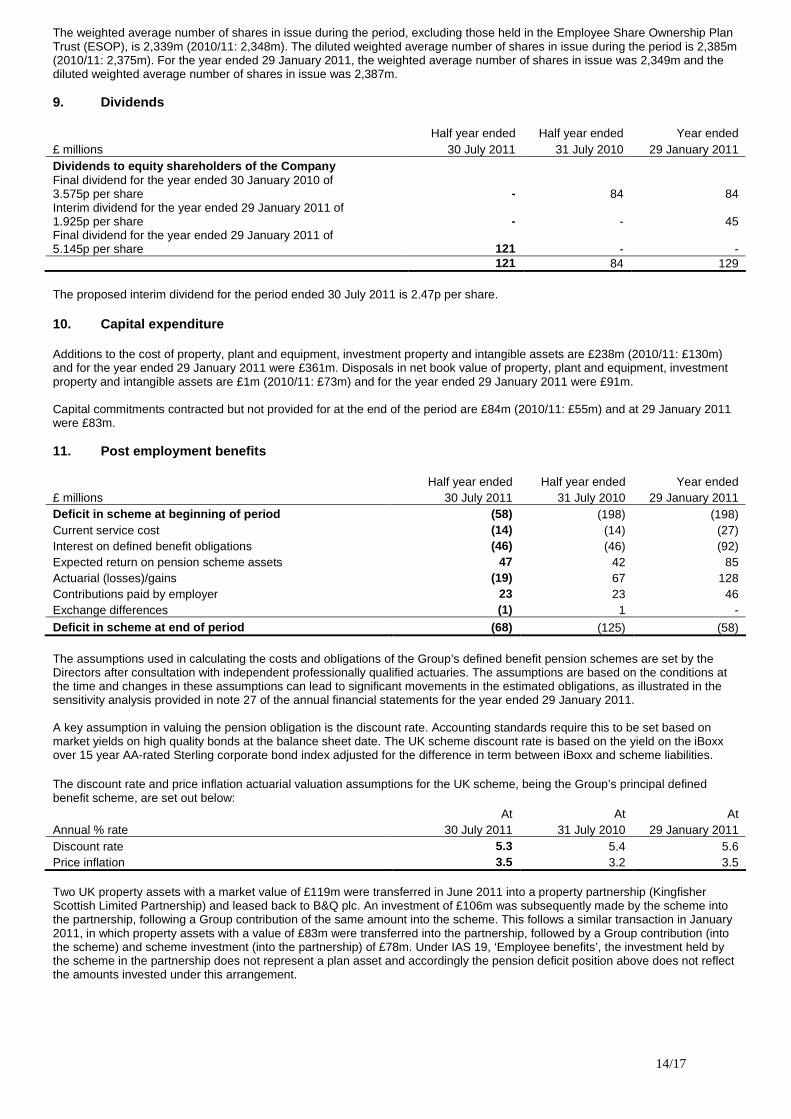
The weighted average number of shares in issue during the period, excluding those held in the Employee Share Ownership Plan Trust (ESOP), is 2,339m (2010/11: 2,348m). The diluted weighted average number of shares in issue during the period is 2,385m (2010/11: 2,375m). For the year ended 29 January 2011, the weighted average number of shares in issue was 2,349m and the diluted weighted average number of shares in issue was 2,387m. 9. Dividends
Half year ended Half year ended Year ended
£ millions 30 July 2011 31 July 2010 29 January 2011 Dividends to equity shareholders of the Company Final dividend for the year ended 30 January 2010 of 3.575p per share - 84 84 Interim dividend for the year ended 29 January 2011 of 1.925p per share - - 45 Final dividend for the year ended 29 January 2011 of 5.145p per share 121 - -
121 84 129 The proposed interim dividend for the period ended 30 July 2011 is 2.47p per share. 10. Capital expenditure Additions to the cost of property, plant and equipment, investment property and intangible assets are £238m (2010/11: £130m) and for the year ended 29 January 2011 were £361m. Disposals in net book value of property, plant and equipment, investment property and intangible assets are £1m (2010/11: £73m) and for the year ended 29 January 2011 were £91m. Capital commitments contracted but not provided for at the end of the period are £84m (2010/11: £55m) and at 29 January 2011 were £83m. 11. Post employment benefits Half year ended Half year ended Year ended £ millions 30 July 2011 31 July 2010 29 January 2011 Deficit in scheme at beginning of period (58) (198) (198) Current service cost (14) (14) (27) Interest on defined benefit obligations (46) (46) (92) Expected return on pension scheme assets 47 42 85 Actuarial (losses)/gains (19) 67 128 Contributions paid by employer 23 23 46 Exchange differences (1) 1 - Deficit in scheme at end of period (68) (125) (58) The assumptions used in calculating the costs and obligations of the Group’s defined benefit pension schemes are set by the Directors after consultation with independent professionally qualified actuaries. The assumptions are based on the conditions at the time and changes in these assumptions can lead to significant movements in the estimated obligations, as illustrated in the sensitivity analysis provided in note 27 of the annual financial statements for the year ended 29 January 2011. A key assumption in valuing the pension obligation is the discount rate. Accounting standards require this to be set based on market yields on high quality bonds at the balance sheet date. The UK scheme discount rate is based on the yield on the iBoxx over 15 year AA-rated Sterling corporate bond index adjusted for the difference in term between iBoxx and scheme liabilities. The discount rate and price inflation actuarial valuation assumptions for the UK scheme, being the Group’s principal defined benefit scheme, are set out below: At At At Annual % rate 30 July 2011 31 July 2010 29 January 2011 Discount rate 5.3 5.4 5.6 Price inflation 3.5 3.2 3.5 Two UK property assets with a market value of £119m were transferred in June 2011 into a property partnership (Kingfisher Scottish Limited Partnership) and leased back to B&Q plc. An investment of £106m was subsequently made by the scheme into the partnership, following a Group contribution of the same amount into the scheme. This follows a similar transaction in January 2011, in which property assets with a value of £83m were transferred into the partnership, followed by a Group contribution (into the scheme) and scheme investment (into the partnership) of £78m. Under IAS 19, ‘Employee benefits’, the investment held by the scheme in the partnership does not represent a plan asset and accordingly the pension deficit position above does not reflect the amounts invested under this arrangement.
15/17
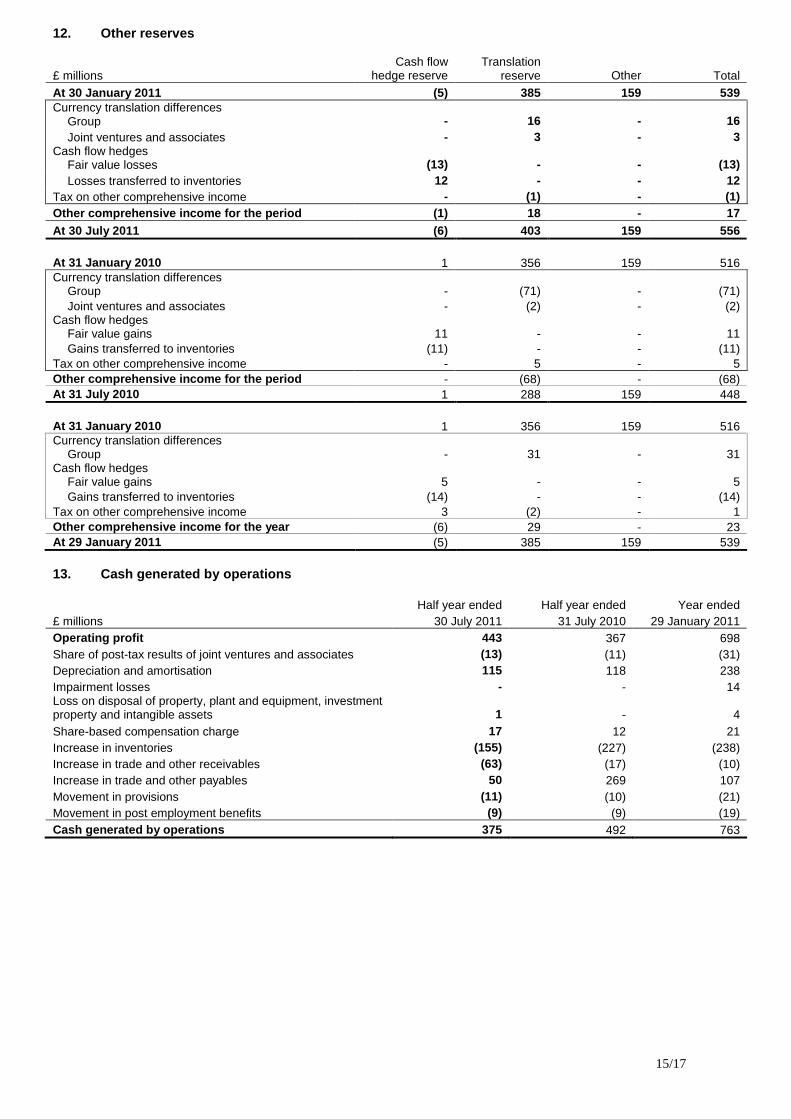
12. Other reserves £ millions
Cash flow hedge reserve
Translation
reserve
Other
Total At 30 January 2011 (5) 385 159 539 Currency translation differences
Group - 16 - 16 Joint ventures and associates - 3 - 3
Cash flow hedges Fair value losses (13) - - (13) Losses transferred to inventories 12 - - 12
Tax on other comprehensive income - (1) - (1) Other comprehensive income for the period (1) 18 - 17 At 30 July 2011 (6) 403 159 556 At 31 January 2010 1 356 159 516 Currency translation differences
Group - (71) - (71) Joint ventures and associates - (2) - (2)
Cash flow hedges Fair value gains 11 - - 11 Gains transferred to inventories (11) - - (11)
Tax on other comprehensive income - 5 - 5 Other comprehensive income for the period - (68) - (68) At 31 July 2010 1 288 159 448 At 31 January 2010 1 356 159 516 Currency translation differences
Group - 31 - 31 Cash flow hedges
Fair value gains 5 - - 5 Gains transferred to inventories (14) - - (14)
Tax on other comprehensive income 3 (2) - 1 Other comprehensive income for the year (6) 29 - 23 At 29 January 2011 (5) 385 159 539 13. Cash generated by operations
Half year ended Half year ended Year ended £ millions 30 July 2011 31 July 2010 29 January 2011 Operating profit 443 367 698 Share of post-tax results of joint ventures and associates (13) (11) (31) Depreciation and amortisation 115 118 238 Impairment losses - - 14 Loss on disposal of property, plant and equipment, investment property and intangible assets 1 - 4 Share-based compensation charge 17 12 21 Increase in inventories (155) (227) (238) Increase in trade and other receivables (63) (17) (10) Increase in trade and other payables 50 269 107 Movement in provisions (11) (10) (21) Movement in post employment benefits (9) (9) (19) Cash generated by operations 375 492 763

16/17
14. Net debt At At At £ millions 30 July 2011 31 July 2010 29 January 2011 Cash and cash equivalents 594 1,380 731 Bank overdrafts (160) (182) (95) Cash and cash equivalents and bank overdrafts 434 1,198 636 Bank loans (96) (122) (104) Medium Term Notes and other fixed term debt (493) (1,079) (504) Financing derivatives 36 85 56 Finance leases (67) (63) (70) Net (debt)/cash (186) 19 14
Half year ended Half year ended Year ended £ millions 30 July 2011 31 July 2010 29 January 2011 Net cash/(debt) at beginning of period 14 (250) (250) Net (decrease)/increase in cash and cash equivalents and bank overdrafts (224) 132 (490) Repayment of bank loans 8 37 57 Repayment of Medium Term Notes and other fixed term debt 10 124 696 Payment/(receipt) on financing derivatives 3 (2) (6) Capital element of finance lease rental payments 6 7 12 Cash flow movement in net debt (197) 298 269 Exchange differences and other non-cash movements (3) (29) (5) Net (debt)/cash at end of period (186) 19 14 During the prior year the Group repaid £679m nominal value of gross debt by repaying maturing debt, and by repurchasing significant proportions of 2014 Euro Medium Term Notes and US Private Placement debt. 15. Contingent assets and liabilities Kingfisher plc has an obligation to provide a bank guarantee for £50m (2010/11: £50m) to the liquidators of Kingfisher International France Limited in the event that Kingfisher plc’s credit rating falls below ‘BBB’. The obligation arises from an indemnity provided in June 2003 as a result of the demerger of Kesa Electricals. At 29 January 2011 the amount was £50m. A guarantee of £58m (€66m) (2010/11: £55m) denominated in Euros has been provided to the Italian tax authorities in respect of a tax credit. This has been covered by a guarantee for the term of the contingent liability. At 29 January 2011 the amount was £57m. The Group has arranged for certain bank guarantees to be provided to third parties in the ordinary course of business, which if realised are not expected to result in a material liability to the Group. The Group is subject to claims and litigation arising in the ordinary course of business and provision is made where liabilities are considered likely to arise on the basis of current information and legal advice. 16. Related party transactions The Group’s significant related parties are its joint ventures, associates and pension schemes as disclosed in note 35 of the annual financial statements for the year ended 29 January 2011. There have been no significant changes in related parties or related party transactions in the period.
17/17
STATEMENT OF DIRECTORS’ RESPONSIBILITIES
The Directors confirm that this set of interim condensed financial statements has been prepared in accordance with IAS 34, ‘Interim Financial Reporting’, as adopted by the European Union and that the interim management report includes a fair review of the information required by DTR 4.2.7 and DTR 4.2.8, namely: • an indication of important events that have occurred during the period and their impact on the interim condensed financial
statements, and a description of the principal risks and uncertainties for the remainder of the financial year; and • material related party transactions in the period and any material changes in the related party transactions described in the
last annual report. The Directors of Kingfisher plc were listed in the Kingfisher plc Annual Report for the year ended 29 January 2011, with the only change up to the date of approval of the interim financial report being the resignation of John Nelson on 8 September 2011. By order of the Board Ian Cheshire Kevin O’Byrne Group Chief Executive Group Finance Director 14 September 2011 14 September 2011
INDEPENDENT REVIEW REPORT TO KINGFISHER PLC
We have been engaged by the Company to review the condensed set of financial statements in the interim financial report for the half year ended 30 July 2011 which comprises the consolidated income statement, the consolidated statement of comprehensive income, the consolidated statement of changes in equity, the consolidated balance sheet, the consolidated cash flow statement and related notes 1 to 16. We have read the other information contained in the interim financial report and considered whether it contains any apparent misstatements or material inconsistencies with the information in the condensed set of financial statements. This report is made solely to the Company in accordance with International Standard on Review Engagements (UK and Ireland) 2410 “Review of Interim Financial Information Performed by the Independent Auditor of the Entity” issued by the Auditing Practices Board. Our work has been undertaken so that we might state to the Company those matters we are required to state to it in an independent review report and for no other purpose. To the fullest extent permitted by law, we do not accept or assume responsibility to anyone other than the Company, for our review work, for this report, or for the conclusions we have formed. Directors’ responsibilities The interim financial report is the responsibility of, and has been approved by, the Directors. The Directors are responsible for preparing the interim financial report in accordance with the Disclosure and Transparency Rules of the United Kingdom’s Financial Services Authority. As disclosed in note 2, the annual financial statements of Kingfisher plc are prepared in accordance with IFRSs as adopted by the European Union. The condensed set of financial statements included in this interim financial report has been prepared in accordance with International Accounting Standard 34, “Interim Financial Reporting”, as adopted by the European Union. Our responsibility Our responsibility is to express to the Company a conclusion on the condensed set of financial statements in the interim financial report based on our review. Scope of review We conducted our review in accordance with International Standard on Review Engagements (UK and Ireland) 2410 “Review of Interim Financial Information Performed by the Independent Auditor of the Entity” issued by the Auditing Practices Board for use in the United Kingdom. A review of interim financial information consists of making inquiries, primarily of persons responsible for financial and accounting matters, and applying analytical and other review procedures. A review is substantially less in scope than an audit conducted in accordance with International Standards on Auditing (UK and Ireland) and consequently does not enable us to obtain assurance that we would become aware of all significant matters that might be identified in an audit. Accordingly, we do not express an audit opinion. Conclusion Based on our review, nothing has come to our attention that causes us to believe that the condensed set of financial statements in the interim financial report for the half year ended 30 July 2011 is not prepared, in all material respects, in accordance with International Accounting Standard 34 as adopted by the European Union and the Disclosure and Transparency Rules of the United Kingdom’s Financial Services Authority. Deloitte LLP Chartered Accountants and Statutory Auditor London, United Kingdom 14 September 2011