Embed Size (px)
Citation preview
University of Wollongong University of Wollongong
Research Online Research Online
Faculty of Science, Medicine and Health - Papers: Part B Faculty of Science, Medicine and Health
1-1-2020
Thresholds of mangrove survival under rapid sea level rise Thresholds of mangrove survival under rapid sea level rise
N Saintilan
N Khan
E Ashe
Jeffrey Kelleway University of Wollongong, [email protected]
Kerrylee Rogers University of Wollongong, [email protected]
See next page for additional authors
Follow this and additional works at: https://ro.uow.edu.au/smhpapers1
Publication Details Citation Publication Details Citation Saintilan, N., Khan, N., Ashe, E., Kelleway, J., Rogers, K., Woodroffe, C. D., & Horton, B. (2020). Thresholds of mangrove survival under rapid sea level rise. Faculty of Science, Medicine and Health - Papers: Part B. Retrieved from https://ro.uow.edu.au/smhpapers1/1391
Research Online is the open access institutional repository for the University of Wollongong. For further information contact the UOW Library: [email protected]
Thresholds of mangrove survival under rapid sea level rise Thresholds of mangrove survival under rapid sea level rise
Abstract Abstract Copyright © 2020 The Authors, some rights reserved; exclusive licensee American Association for the Advancement of Science. No claim to original U.S. Government Works. The response of mangroves to high rates of relative sea level rise (RSLR) is poorly understood. We explore the limits of mangrove vertical accretion to sustained periods of RSLR in the final stages of deglaciation. The timing of initiation and rate of mangrove vertical accretion were compared with independently modeled rates of RSLR for 78 locations. Mangrove forests expanded between 9800 and 7500 years ago, vertically accreting thick sequences of organic sediments at a rate principally driven by the rate of RSLR, representing an important carbon sink. We found it very likely (>90% probability) that mangroves were unable to initiate sustained accretion when RSLR rates exceeded 6.1 millimeters per year. This threshold is likely to be surpassed on tropical coastlines within 30 years under high-emissions scenarios.
Publication Details Publication Details Saintilan, N., Khan, N., Ashe, E., Kelleway, J., Rogers, K., Woodroffe, C. & Horton, B. (2020). Thresholds of mangrove survival under rapid sea level rise. Science, 368 (6495), 1118-1121.
Authors Authors N Saintilan, N Khan, E Ashe, Jeffrey Kelleway, Kerrylee Rogers, Colin D. Woodroffe, and B Horton
This journal article is available at Research Online: https://ro.uow.edu.au/smhpapers1/1391
Submitted Manuscript: Confidential
1
Title: Thresholds of mangrove survival under rapid sea-level rise
Authors: N. Saintilan1*, N.S. Khan2,3, E. Ashe4, J.J. Kelleway5, K. Rogers5,6
, C.D. Woodroffe5,
B.P. Horton 7,8
Affiliations: 5
1Department of Earth and Environmental Sciences, Macquarie University, Australia.
2Department of Earth Sciences, University of Hong Kong, Hong Kong.
3Swire Marine Institute of Marine Science, University of Hong Kong, Hong Kong.
4Department of Earth and Planetary Sciences, Rutgers University, United States of America.
5School of Earth, Atmospheric and Life Sciences, University of Wollongong, Australia. 10
6Geoquest Research Centre, University of Wollongong, Australia
7Asian School of Environment, Nanyang Technological University, Singapore.
8 Earth Observatory of Singapore, Nanyang Technological University, Singapore.
*Correspondence to: [email protected]
15
Abstract:
The response of mangroves to high rates of relative sea-level rise (RSLR) is poorly understood.
We explore the limits of mangrove vertical accretion to sustained periods of RSLR in the final
stages of deglaciation. The timing of initiation and rate of mangrove vertical accretion was
compared to independently modelled rates of RSLR for 78 locations. Mangrove forests expanded 20
between 9800 and 7500 years ago, vertically accreting thick sequences of organic secdiments at
a rate principally driven by the rate of RSLR, representing an important carbon sink. We found it
very likely (>90% probability) that mangroves were unable to initiate sustained accretion when
RSLR rates exceeded 6.1 mm yr-1. This threshold is likely to be surpassed on tropical coastlines
within 30 years under high emissions scenarios. 25
One Sentence Summary: Mangrove response to sea-level rise in the final stages of deglaciation
reveal thresholds possibly exceeded in the next 30 years
Submitted Manuscript: Confidential
2
Main Text:
The rate of relative sea-level rise (RSLR) in tropical and subtropical locations is projected to
accelerate from current trends of ~3.4 mm yr-1 to a mean estimate of ~5 mm yr-1 under low-
emissions scenarios and ~10 mm yr-1 under high emissions scenarios by 2100 (1,2). Modelling of 5
feedbacks between RSLR, vertical accretion, root mass formation, and tidal marsh and mangrove
vulnerability under sustained high rates of RSLR is vital for the survival of these ecologically
and economically important coastal environments (2). Some tidal marshes have been projected to
survive RSLR of over 10 mm yr-1 where supported by high available suspended sediment
concentrations (3), based on accretion data that span annual to decadal timescales. 10
Reconstructions using paleoenvironmental proxies, however have suggested UK marshes were
vulnerable to retreat at RSLR of 7 mm yr-1 (4).
Mangroves grow in sheltered intertidal environments that are exposed to the effects of RSLR (5).
They support among the highest rates of carbon burial of all ecosystems (6), and a growing body
of evidence suggests this efficiency is enhanced by RSLR (7). However, empirical data on 15
mangrove response to high rates of RSLR are lacking, given the limited observation period (1-16
years) of real-time measurements (5).
Here we assess the mangrove response to RSLR from the paleorecord of mangrove vertical
accretion preserved in the sedimentary archives of continental shelves and coastal lowlands.
Mangrove forests have initiated and drowned in association with variability in the rate of RSLR 20
following the onset of deglaciation ~26,000 to 20,000 years ago (8). Prior to the Holocene, long-
term RSLR rates of >12mm yr-1 (8) exceeded the capacity of mangroves to maintain position in-
situ through vertical accretion, and mangroves were displaced landward (9), with few exceptions
(10,11). During the early to mid Holocene, RSLR slowed in association with the final phase of
Submitted Manuscript: Confidential
3
deglaciation of the Laurentide ice sheet (12). The rate of RSLR varied across the globe due to
glacio-isostatic adjustment, the response of the solid Earth and gravity field to ice mass
redistribution during a glacial cycle (13). Far-field sites, those distal from regions of former ice
sheet extent and incorporating most of the tropics, exhibit a decline in the rate of RSLR (14)
from from 10,000 to 7,000 years ago (Phase 1 in Fig. 1A), followed by stable or falling sea level 5
to near current position from ~6000 years ago to present (Phase 2 in Fig. 1A). In contrast, at
intermediate-field sites closer to centres of glaciation (for example, the Gulf of Mexico and the
Caribbean), sea level rose continuously throughout the Holocene due to isostatic response to
melting of the Laurentide ice sheet. These coastlines have experienced a decelerating rate of
RSLR from 10,000 years ago to the present (Fig. 1B and Figs. S5 and S6). 10
The spatially-variable deceleration of RSLR from 10,000 to 8,000 years ago across tropical and
subtropical latitudes coincided with the initiation of vertically continuous, organic-rich mangrove
sediments several metres thick, as rising seas flooded shallow continental shelves (Phase 1 in
Fig. 1A,B) (15). This deceleration provides an opportunity to explore whether: (i) the rate of
mangrove vertical accretion responds to changes in RSLR; (ii) ice-sheet proximity (intermediate 15
vs far field), geomorphic setting or tidal range constrain the capacity of mangroves to accrete in
relation to RSLR; (iii) upper thresholds of mangrove vertical accretion can be detected; and (iv)
mangrove development and vertical accretion correspond in timing to changes in the global
atmospheric carbon budget.
We present empirical data from 122 reconstructions of the timing and rate of mangrove vertical 20
accretion associated with Holocene RSLR in cores collected from 78 tropical and subtropical
locations (Fig. 2, 14). We independently estimate rates of RSLR for each of the 78 locations
Submitted Manuscript: Confidential
4
prior to and for the duration of mangrove vertical accretion from a glacio-isostatic adjustment
model using an ensemble of different Earth parameters (16) (Fig. 3 and Figs. S5 and S6).
Slowing RSLR during the early to mid Holocene coincided with the initiation of extensive
mangrove forests (Fig 1A, Phase 1; Fig. 3A,B). Our analysis suggests that sustained mangrove
vertical accretion began across far-field regions (Africa, Asia, Australasia, South America) at 5
~10,000-8,000 years ago, and intermediate-field regions (Caribbean, Gulf of Mexico) at ~8,000-
6,000 years ago (Fig. 3 and Figs. S1 and S2). Data were discriminated on the basis of ice-sheet
proximity, geomorphic setting, and differentiated by tidal regime to explore differences in the
timing of initiation and rates of vertical accretion (14). The intermediate- and far-field
classifications, defined as a function of a location’s proximity to areas of major ice sheet retreat 10
during the last deglaciation, act as a surrogate variable for the temporal pattern of RSLR rates
through the Holocene, which in turn influences the availability of accommodation space within
which mangroves can accrete vertically. In a generalised linear model of several variables, only
the proximity to former ice sheets proved to have a significant relationship with accretion rates
(14). 15
We found a strong relationship (p<0.001) between rates of mangrove vertical accretion and
RSLR rate across all sites (51% of the variation in the accretion rate can be explained by the
RSLR variation; Fig. 3). Mangrove vertical accretion first initiated at ~9,800 years ago in the
Ganges-Brahmaputra River Delta, as RSLR reduced from ~9 mm yr-1 to ~6 mm yr-1, and
continued for ~650 years at high rates until replaced by subtidal deposits as RSLR increased 20
again to >7 mm yr-1 (14). Elsewhere in far-field locations, mangrove vertical accretion initiated
as RSLR declined below ~7 mm yr-1 starting 8,800 years ago (Fig. 3). Rates of vertical accretion
of >6 mm yr-1 were sustained for over 1,000 years in mangrove forests in Australia, Africa, South
Submitted Manuscript: Confidential
5
America, Central America, and Asia (Fig. 2, Data S1), irrespective of geomorphic setting (Fig.
S1).
Mangrove vertical accretion initiated in intermediate-field regions later than in far-field
locations, first in Belize ~7,800 years ago as RSLR fell below ~5mm yr-1 and in other Caribbean
and Gulf of Mexico sites between 7,500 and 6,000 years ago (Fig. 2 and Fig. 3 and Table S1). 5
This later initiation, in comparison to far-field regions, may be related to the limited
allochthonous sediment supply available in the carbonate (reef) settings, although in Belize rates
of accretion of over 6 mm yr-1 were observed at two sites (Data S1), driven by strong
authochthonous inputs.
We use a Bayesian framework to estimate the probability of initiation of mangrove accretion 10
conditional upon rates of RSLR within the Holocene dataset (14). The empirical Holocene data
(Data S1), which span a wide range of geomorphic settings and tidal regimes (Fig. S2), suggest
that when RSLR rates exceed 6.1 mm yr-1 and 7.6 mm yr-1, respectively, mangroves are very
likely (>90% probability) and extremely likely (>95% probability) to be unable to initiate
sustained accretion. We found lower RSLR thresholds for intermediate-field sites, and higher 15
thresholds for far-field sites (Table 1).
Our database also reveals spatial variability in the duration of mangrove accretion (Figs. S1 and
S2). In only three of 50 far-field locations was there indication of drowning of mangroves during
a marine transgression (i.e., mangrove sediments overlain by tidal or subtidal deposits: Data S1).
In most far-field locations (30 of 50), accretion and progrodation of the fluvial delta led to the 20
replacement of mangrove by saltmarsh (characteristic of upper intertidal elevations), freshwater
wetland, or terrestrial forest, often by the mid-Holocene when relative sea level stabilised (Data
S1; Fig 1A Phase 2). For this reason, contemporary mangrove extent is highly contracted
Submitted Manuscript: Confidential
6
compared to the early- and mid-Holocene mangrove development in many major river deltas
such as the Ord River, Australia, the Red River, Vietnam, and the Mekong River, Vietnam and
Cambodia (15, 18-20). Mangrove accretion persisted significantly longer at intermediate-field
locations (Fig. S2) because accommodation space was enhanced by glacio-isostatic adjustment.
The extensive development of mangrove environments under RSLR has exerted a significant 5
influence on global carbon cycles over geologic timescales (21) including, we suggest, during
the early to mid Holocene (Fig. 4). Carbon balance modelling based on stable carbon isotope
signatures suggests that the 5 p.p.m.v reduction in atmospheric CO2 in the early-Holocene was
driven by increases in the uptake of carbon by the land biosphere on the order of 290 Pg C
(22,23) prior to 7,000 years ago. The timing and volume of this uptake has been attributed to the 10
northward expansion of boreal vegetation following ice-sheet retreat (~110 Pg C (24)), and
organic soil development (180 Pg C ( 23)), of which circumarctic peatlands may have
sequestered 20-60 Pg C based on the depth of peat formation at the time (24). We conservatively
estimate a somewhat larger contribution (~85 Pg C) from mangrove carbon sequestration and
burial over the period 8,600 to 6,000 years ago (14). The extensive development of mangrove 15
forests over this period largely replaced methanogenic environments (freshwater wetlands and
floodplains (Data S1; 25)) and corresponds to a declining rates of methane emission, particularly
in the Southern Hemisphere (26). The 13CH4 signals in the Southern Hemisphere for this period
show a 1.5‰ depletion consistent with a replacement of vegetation utilising the C4
photosynthetic pathway (tropical grasslands and saltmarsh adapted to low atmospheric CO2) with 20
mangroves utilising the C3 pathway (26,27).
As RSLR increases in the 21st century, an increase in the rate of mangrove vertical accretion,
coupled with landward expansion as sea level rises can be expected to drive increases in the rate
Submitted Manuscript: Confidential
7
of carbon sequestration and preservation in mangroves environments, providing a negative
feedback on radiative forcing, as suggested more broadly for coastal wetlands (7). While our
results demonstrate that accretion in mangroves increases in response to RSLR, we found it was
very likely (>90% probability) that mangroves were unable to initiate sustained accretion when
RSLR rates exceeded 6.1 mm yr-1 in any but the most sediment-laden settings. RSLR is 5
projected to remain below 5 mm yr-1 under low emissions scenarios (RCP 2.6) throughout the
21st century (1). However, RSLR is expected to exceed 5 mm yr-1 by 2030 and 7 mm yr-1 by
2050 under high emissions scenario RCP8.5 in low-latitude mangrove settings where rates of
RSLR are expected to be higher than the global average (1,2).
Where a deficit commences between vertical accretion and RSLR, time to submergence will be a 10
function of the position of the mangrove within the tidal frame. In settings of low tidal range
mangroves are more likely to be situated at elevations close to the threshold of submergence
from the outset. In settings of high tidal range, mangroves are more likely to be situated at
elevations well above this threshold, and tolerate a deficit between the rates of accretion and
RSLR for decades to centuries (5). Geomorphic setting will also influence vulnerability to 15
submergence, as allochthonous sediment contributions in tide- and river-dominated estuaries
may provide an elevation subsidy not available in environments receiving low sediment supply,
such as coral reefs. In this context, sediment retention in catchments impacted by water resource
development (i.e., trapped behind dams) and local sediment controls may decrease mangrove
resilience to RSLR in river estuaries (5). The natural response of mangrove encroachment across 20
flooded coastal lowlands is therefore the main determinant of future extent (28), although this is
already significantly impeded by coastal developments along many coastlines (29). Our findings
therefore emphasise the importance of (i) mitigating the magnitude of rapid RSLR, and (ii)
Submitted Manuscript: Confidential
8
ensuring coastal adaptation measures allow for the expansion of mangrove across coastal
lowlands.
References and Notes:
5 1. J.A. Church, et al. Sea Level Change. In: Climate Change 2013: The Physical Science Basis.
Contribution of Working Group I to the Fifth Assessment Report of the Intergovernmental Panel
on Climate Change [T.F. Stocker, D. Qin, G.-K. Plattner, M. Tignor, S.K. Allen, J. Boschung, et
al. (eds.)]. Cambridge University Press, Cambridge, United Kingdom and New York, NY, USA.
(2013). 10
2. R. E., Kopp, et al. Probabilistic 21st and 22nd century sea‐level projections at a global
network of tide‐gauge sites. Earth's future 2(8), 383-406(2014).
3. M. L Kirwan, S. Temmerman, E.E. Skeehan, G.R. Guntenspergen, S. Fagherazzi, S. 15
Overestimation of marsh vulnerability to sea level rise. Nature Climate Change 6, 253 (2016).
4. B. P. Horton, et al. Predicting marsh vulnerability to sea-level rise using Holocene relative
sea-level data. Nature communications, 9, 2687 (2018).
20
5. C. E. Lovelock, et al. The vulnerability of Indo-Pacific mangrove forests to sea-level
rise. Nature, 526, 559 (2015).
6. D. C Donato, J.B. Kauffman, D. Murdiyarso, S. Kurnianto, M. Stidham, M. Kanninen.
Mangroves among the most carbon-rich forests in the tropics. Nature geoscience, 4, 293 (2011). 25
Submitted Manuscript: Confidential
9
7. K. Rogers, et al. Wetland carbon storage controlled by millennial-scale variation in relative
sea-level rise. Nature, 567, 91 (2019)
8. K. Lambeck, H. Rouby, A. Purcell, Y. Sun, M. Sambridge. Sea level and global ice volumes 5
from the Last Glacial Maximum to the Holocene. Proceedings of the National Academy of
Sciences. U.S.A. 111, 15296-15303 (2014).
9. C. D. Woodroffe. Mangrove response to sea level rise: palaeoecological insights from
macrotidal systems in northern Australia. Marine and Freshwater Research, 69, 917-932 (2018). 10
10. T. J. Hanebuth, H. K. Voris, Y. Yokoyama, Y. Saito, J. I. Okuno. Formation and fate of
sedimentary depocentres on Southeast Asia's Sunda Shelf over the past sea-level cycle and
biogeographic implications. Earth-Science Reviews, 104, 92-110 (2011).
15
11. W. A. Nicholas, et al. Pockmark development in the Petrel Sub-basin, Timor Sea, Northern
Australia: Seabed habitat mapping in support of CO2 storage assessments. Continental Shelf
Research, 83, 129-142 (2014).
12. N. S. Khan, et al. Holocene relative sea-level changes from near-, intermediate-, and far-field 20
locations. Current Climate Change Reports, 1, 247-262 (2015).
Submitted Manuscript: Confidential
10
13. W.E. Farrell, J.A. Clark, J.A., On postglacial sea level. Geophysical Journal
International, 46, 647-667 (1976).
14. Materials and methods are available as supplementary materials.
5
15. C. D Woodroffe, B. G. Thom, J. Chappell. Development of widespread mangrove swamps in
mid-Holocene times in northern Australia. Nature 317, 711. (1985).
16. S. Dendy, J. Austermann, J.R. Creveling, J.X. Mitrovica. Sensitivity of Last Interglacial sea-10
level high stands to ice sheet configuration during Marine Isotope Stage 6. Quaternary Science
Reviews 171, 234-244 (2017).
17. T. E. Törnqvist, N.P. Hijma. Links between early Holocene ice-sheet decay, sea-level rise
and abrupt climate change. Nature Geoscience 5, 601 (2012). 15
18. B. G. Thom, L. D. Wright, J. M. Coleman. Mangrove ecology and deltaic-estuarine
geomorphology: Cambridge Gulf-Ord River, Western Australia. The Journal of Ecology, 203-
232. (1975).
20
19. S. A. Woodroffe, B. P. Horton. Holocene sea-level changes in the Indo-Pacific. Journal of
Asian Earth Sciences, 25, 29-43 (2005).
Submitted Manuscript: Confidential
11
20. S. Tanabe, K. Hori, Y. Saito, S. Haruyama, A. Kitamura. Song Hong (Red River) delta
evolution related to millennium-scale Holocene sea-level changes. Quaternary Science
Reviews, 22, 2345-2361. (2003).
21. D.S. Collins, et al. Tidal dynamics and mangrove carbon sequestration during the Oligo– 5
Miocene in the South China Sea. Nature Communications, 8, 15698. (2017).
22. A. Indermühle, et al. Holocene carbon-cycle dynamics based on CO2 trapped in ice at Taylor
Dome, Antarctica. Nature, 398,121 (1999).
10
23. J. Elsig, et al.. Stable isotope constraints on Holocene carbon cycle changes from an
Antarctic ice core. Nature, 461, 507 (2009).
24. G. M. MacDonald, D. W. Beilman, K. V. Kremenetski, Y. Sheng, L. C. Smith, A. A.
Velichko. Rapid early development of circumarctic peatlands and atmospheric CH4 and CO2 15
variations. Science, 314, 285-288 (2006).
25. H. J. Poffenbarger, B.A. Needelman, J.P. Megonigal. Salinity influence on methane
emissions from tidal marshes. Wetlands, 31,831-842 (2011).
20
26. J. Beck, M. Bock, J. Schmitt, B. Seth, T. Blunier, H. Fischer (2018). Bipolar carbon and
hydrogen isotope constraints on the Holocene methane budget. Biogeosciences, 15, 7155-7175.
Submitted Manuscript: Confidential
12
27. T. Sowers. Atmospheric methane isotope records covering the Holocene period. Quaternary
Science Reviews 29, 213-221 (2010).
28. M., Schuerch et al. Future response of global coastal wetlands to sea-level rise. Nature, 561,
231 (2018). 5
29. L. K., Phan, J. S. van Thiel de Vries, M. J. Stive. Coastal mangrove squeeze in the Mekong
Delta. Journal of Coastal Research, 31, 233-243. (2014).
30. S. E., Hamilton, D. Casey. Creation of a high spatio‐temporal resolution global database of 10
continuous mangrove forest cover for the 21st century (CGMFC‐21). Global Ecology and
Biogeography, 25, 729-738. (2016).
31. K. L McKee, D.R. Cahoon, E.C. Feller. Caribbean mangroves adjust to rising sea level
through biotic controls on change in soil elevation. Global Ecology and Biogeography 16, 545-15
556 (2007).
32. C.D. Woodroffe. Mangrove sediments and Geomorphology. Chapter 2 in D. Alongi, A.
Robertson, (eds.) Tropical Mangrove Ecosystems. American Geophysical Union, Coastal and
Estuarine Studies, 7-41. (1992) 20
33. P.J. Reimer, et al. IntCal13 and Marine13 radiocarbon age calibration curves 0–50,000 years
cal BP. Radiocarbon, 55, 1869-1887. (2013).

Submitted Manuscript: Confidential
13
34. M. A. Toscano, J.L. Gonzalez, K.R. Whelan. Calibrated density profiles of Caribbean
mangrove peat sequences from computed tomography for assessment of peat preservation,
compaction, and impacts on sea-level reconstructions. Quaternary Research, 89, 201-222
(2018). 5
35. D. F Argus, W.R. Peltier, R. Drummond, A.W. Moore. The Antarctica component of
postglacial rebound model ICE-6G_C (VM5a) based on GPS positioning, exposure age dating of
ice thicknesses, and relative sea level histories, Geophysical Journal International, 198, 537–
563 (2014). 10
36. W. R. Peltier, D.F. Argus, R. Drummond. Space geodesy constrains ice age terminal
deglaciation: The global ICE‐6G_C (VM5a) model, Journal of Geophysical Research: Solid
Earth, 120, 450– 487, (2015).
15
37. R. A Kendall, J.X. Mitrovica, G.A. Milne. On post-glacial sea level – II. Numerical
formulation and comparative results on spherically symmetric models, Geophysical Journal
International, 161, 679–706, (2005)
38. Dziewonski, A. M., Anderson, D. L. Preliminary reference Earth model, Physics of the Earth 20
and Planetary Interiors, 25, 297-356, (1981)
Submitted Manuscript: Confidential
14
39. E. Jones, et al. SciPy: Open Source Scientific Tools for Python,
2001 http://www.scipy.org/ [Online; accessed 2019-10-02].
40. F. Pedregosa et al.. Scikit-learn: Machine Learning in Python, Journal of Machine Learning
Research, 12, 2825-2830 (2011) (publisher link) 5
41. J. Goldberger, G. Hinton, S. Roweis, R. Salakhutdinov, “Neighbourhood Components
Analysis”. Advances in Neural Information”, Advances in Neural Information Processing
Systems, 17, 513-520 (2005).
10
42. T. B Atwood, et al. Global patterns in mangrove soil carbon stocks and losses. Nature
Climate Change, 7, 523. (2017).
43. C. M. Duarte, I.J. Losada, I.E. Hendriks, I. Mazarrasa, Marbà, N. The role of coastal plant
communities for climate change mitigation and adaptation. Nature Climate Change, 3, 961. 15
(2013).
44. K. Lamont, N. Saintilan, J.J. Kelleway, D. Mazumder, A. Zawadzki, A. Thirty-Year Repeat
Measures of Mangrove Above-and Below-Ground Biomass Reveals Unexpectedly High Carbon
Sequestration. Ecosystems 1-13 (2019) 20
45. M. Bock, J. Schmitt, J. Beck, B. Seth, J. Chappellaz, H. Fischer, H. Glacial/interglacial
wetland, biomass burning, and geologic methane emissions constrained by dual stable isotopic
Submitted Manuscript: Confidential
15
CH4 ice core records. Proceedings of the National Academy of Sciences, 114, E5778-E5786.
(2017).
46. R. Dommain, J. Couwenberg, P.H. Glaser, H. Joosten, I.N.N. Suryadiputra. Carbon storage
and release in Indonesian peatlands since the last deglaciation. Quaternary Science Reviews, 97, 5
1-32 (2014).
47. N. Thomas, P. Bunting, R. Lucas, A. Rosenqvist, T. Fatoyinbo. Mapping mangrove extent
and change: a globally applicable approach. Remote Sensing 10, 1466 (2018)
10
48. A.P. Belperio. Negative evidence for a mid-Holocene high sea level along the coastal plain
of the Great Barrier Reef province. Marine Geology, 32 (1979), pp. M1-M9
49. A.L. Bloom, 1975. In: D. Hopley (Editor), Research Report for Queensland. Australian
Quaternary Newsletter, 5: 22. (1979) 15
50. R.M. Carter, D. P. Johnson, K. G. Hooper Episodic post‐glacial sea‐level rise and the
sedimentary evolution of a tropical continental embayment (Cleveland Bay, Great Barrier Reef
shelf, Australia), Australian Journal of Earth Sciences, 40, 229-255 (1993).
20
51. R. L. Clark, J.C. Guppy. A transition from mangrove forest to freshwater wetland in the
monsoon tropics of Australia. Journal of Biogeography 15, 665-684. (1988).
Submitted Manuscript: Confidential
16
52. G. M Crowley, P. Anderson, A. P. Kershaw, J. Grindrod. Palynology of a Holocene marine
transgressive sequence, lower Mulgrave River valley, north‐east Queensland. Australian Journal
of Ecology, 15, 231-240 (1990).
53. G. M. Crowley, M. K. Gagan. Holocene evolution of coastal wetlands in wet-tropical 5
northeastern Australia. The Holocene, 5, 385-399. (1995).
54. T. R. Hashimoto, N. Saintilan, S.G. Haberle. Mid‐Holocene development of mangrove
communities featuring Rhizophoraceae and geomorphic change in the Richmond River Estuary,
New South Wales, Australia. Geographical Research, 44, 63-76. (2006). 10
55. J. N. Jennings. Desert dunes and estuarine fill in the Fitzroy estuary (north-western
Australia). Catena, 2, 215-262 (1975).
56. A.P. Spenceley. The Geomorphological and Zonational Development of Mangrove Swamps 15
in the Townsville Area, North Queensland. PhD Thesis, James Cook University, Townsville
(1980).
57. B. G. Thom, L. D. Wright, J. M. Coleman. Mangrove ecology and deltaic-estuarine
geomorphology: Cambridge Gulf-Ord River, Western Australia. The Journal of Ecology, 63, 20
203-232 (1975).
Submitted Manuscript: Confidential
17
58. C. D. Woodroffe. Relative sea level in the South Alligator River region, north Australia,
during the Holocene. Search, 18, 198-200 (1987).
59. C. D. Woodroffe, J. Chappell, B. G. Thom, E. Wallensky (1989). Depositional model of a
macrotidal estuary and floodplain, South Alligator River, Northern Australia. Sedimentology, 36, 5
737-756.
60. J.C. Ellison. Pollen analysis of mangrove sediments as a sea-level indicator: assessment from
Tongatapu, Tonga. Palaeogeography, Palaeoclimatology, Palaeoecology, 74, 327-341 (1989).
10
61. K. Fujimoto, T. Miyagi, T. Kikuchi, T. Kawana. Mangrove habitat formation and response to
Holocene sea-level changes on Kosrae Island, Micronesia. Mangroves and salt marshes, 1, 47-57
(1996).
62. K. Fujimoto, A. Imaya, R. Tabuchi, S. Kuramoto, H. Utsugi, T. Murofushi, Belowground 15
carbon storage of Micronesian mangrove forests. Ecological Research, 14, 409-413. (1999).
63. J.V. Ward. Palynology of Kosrae, Eastern Caroline Islands: Recoveries from pollen rain and
Holocene deposits. Review of Paleobotany and Palynology, 55, 247-271 (1988).
20
64. M. I., Bird, L. K. Fifield, T. S Teh, C. H. Chang, N. Shirlaw, K. Lambeck. An inflection in
the rate of early mid-Holocene eustatic sea-level rise: A new sea-level curve from
Singapore. Estuarine, Coastal and Shelf Science, 71, 523-536 (2007).
Submitted Manuscript: Confidential
18
65. S. Das. Palaeo-palynology of late Quaternary peat deposit from Lower Bengal Basin, India:
A palaoecological approach. Quaternary international, 325, 197-204 (2014).
66. J. Ellison. Holocene palynology and sea-level change in two estuaries in Southern Irian
Jaya. Palaeogeography, Palaeoclimatology, Palaeoecology, 220, 291-309 (2005). 5
67. M. A. Geyh, H. Streif, H. R. Kudrass. Sea-level changes during the late Pleistocene and
Holocene in the Strait of Malacca. Nature, 278, 441. (1979).
68. A.K. Hait, H. Behling. Holocene mangrove and coastal environmental changes in the western 10
Ganga–Brahmaputra Delta, India. Vegetation History and Archaeobotany, 18, 159-169 (2009).
69. B. P. Horton, P. L. Gibbard, G. M. Mine, R. J. Morley, C. Purintavaragul, J.M. Stargardt.
Holocene sea levels and palaeoenvironments, Malay-Thai Peninsula, southeast Asia. The
Holocene, 15, 1199-1213 (2005). 15
70. M.S. Islam, M.J. Tooley. Coastal and sea-level changes during the Holocene in
Bangladesh. Quaternary International, 55, 61-75 (1999).
71. K. P. N. Kumaran, K. M., Nair, M. Shindikar, R. B. Limaye, D. Padmalal. Stratigraphical 20
and palynological appraisal of the Late Quaternary mangrove deposits of the west coast of
India. Quaternary Research, 64, 418-431 (2005).
Submitted Manuscript: Confidential
19
72. Z. Li, et al. Mid-Holocene mangrove succession and its response to sea-level change in the
upper Mekong River delta, Cambodia. Quaternary Research, 78, 386-399. (2012).
73. T. Rashid, S. Suzuki, H. Sato, M.H. Monsur, S.K., Saha. Relative sea-level changes during
the Holocene in Bangladesh. Journal of Asian Earth Sciences, 64, 136-150. (2013). 5
74. C.A Setyaningsih, S. Biagioni, A. Saad, K. Kashima, S. Sabiham, H. Behling. Response of
Mangroves to Late Holocene Sea-Level Change: Palaeoecological Evidence from Sumatra,
Indonesia. Wetlands, 1-16. (2019).
10
75. J. R. P. Somboon. Paleontological study of the recent marine sediments in the lower central
plain, Thailand. Journal of Southeast Asian Earth Sciences, 2, 201–210. (1988).
76. T. Tamura, Y. Saito, S. Sieng, B. Ben, M. Kong, I. Sim, S. Choup, F. Akiba. Initiation of the
Mekong River delta at 8 ka: evidence from the sedimentary succession in the Cambodian 15
lowland. Quaternary Science Reviews, 28, 327–344. (2009).
77. S. Tanabe, K. Hori, Y. Saito, S. Haruyama, A. Kitamura. Song Hong (Red River) delta
evolution related to millennium-scale Holocene sea-level changes. Quaternary Science
Reviews, 22, 2345-2361 (2003). 20
Submitted Manuscript: Confidential
20
78. N. Tran N., Q.T. Ngo. Development history of deposits in the Quaternary of Vietnam. In:
T.V. Nguyen (ed) The Watehring Crust and Quaternary Sediments in Vietnam. Department of
Geology and Minerals, Vietnam, Hanoi 177-198. (2000).
79. E. Yulianto, et al. Mangrove shoreline responses to Holocene environmental change, 5
Makassar Strait, Indonesia. Review of Palaeobotany and Palynology, 131, 251-268. (2004).
80. J. F. Berger, V. Charpentier, R. Crassard, C. Martin, G. Davtian, J.A. López-Sáez. The
dynamics of mangrove ecosystems, changes in sea level and the strategies of Neolithic
settlements along the coast of Oman (6000–3000 cal. BC). Journal of Archaeological 10
Science, 40, 3087-3104 (2013).
81. P. Punwong, K. Selby, R. Marchant. Holocene mangrove dynamics and relative sea-level
changes along the Tanzanian coast, East Africa. Estuarine, Coastal and Shelf Science, 212, 105-
117 (2018). 15
82. M. G. Tossou, A. Akoègninou, A. Ballouche, M.A. Sowunmi, K. Akpagana, K. The history
of the mangrove vegetation in Bénin during the Holocene: a palynological study. Journal of
African Earth Sciences, 52, 167-174 (2008).
20
83. S. A. Woodroffe, A. J. Long, P. Punwong, K. Selby, C.L. Bryant, R. Marchant. Radiocarbon
dating of mangrove sediments to constrain Holocene relative sea-level change on Zanzibar in the
southwest Indian Ocean. The Holocene, 25, 820-831 (2015).
Submitted Manuscript: Confidential
21
84. H. Behling, M.C. Cohen, R.J. Lara. Studies on Holocene mangrove ecosystem dynamics of
the Bragança Peninsula in north-eastern Pará, Brazil. Palaeogeography, Palaeoclimatology,
Palaeoecology, 167, 225-242 (2001).
85. T. Boski, F.H. Bezerra, L. de Fátima Pereira, A.M. Souza, R.P. Maia, F.P. Lima-Filho, F. P. 5
Sea-level rise since 8.2 ka recorded in the sediments of the Potengi–Jundiai Estuary, NE
Brasil. Marine Geology, 365, 1-13 (2015).
86. M.C.L Cohen, et al. Holocene palaeoenvironmental history of the Amazonian mangrove
belt. Quaternary Science Reviews, 55, 50-58 (2012). 10
87. M. C. L. Cohen, H. Behling, R.J. Lara, C.B. Smith, H.R.S. Matos, V. Vedel. Impact of sea-
level and climatic changes on the Amazon coastal wetlands during the late Holocene. Vegetation
History and Archaeobotany, 18, 425. (2009).
15
88. M.C. Cohen, P.W. Souza Filho, R.J. Lara, H. Behling, R.J. Angulo. A model of Holocene
mangrove development and relative sea-level changes on the Bragança Peninsula (northern
Brazil). Wetlands Ecology and Management, 13, 433-443 (2005).
89. N. A. Fontes, et al. The impacts of the middle Holocene high sea-level stand and climatic 20
changes on mangroves of the Jucuruçu River, southern Bahia–northeastern
Brazil. Radiocarbon, 59, 215-230 (2017).
Submitted Manuscript: Confidential
22
90. M. C. França, et al. The last mangroves of Marajó Island—Eastern Amazon: impact of
climate and/or relative sea-level changes. Review of Palaeobotany and Palynology, 187, 50-65
(2012).
91. M. C. França, et al. Mangrove vegetation changes on Holocene terraces of the Doce River, 5
southeastern Brazil. Catena, 110, 59-69 (2013).
92. J. T. F. Guimarães, M. C. L Cohen, L. C. R. Pessenda, M. C. França, C. B. Smith, A. C. R
Nogueira. Mid-and late-Holocene sedimentary process and palaeovegetation changes near the
mouth of the Amazon River. The Holocene, 22, 359-370 (2012). 10
93. W. Roeleveld, A.J. van Loon. The Holocene development of the Young Coastal Plain of
Suriname. Geol. En Mijnb. 58, 21–28 (1979).
94. V. Rull, T. Vegas-Vilarrubia, N.E. de Pernia. Palynological record of an early-mid Holocene 15
mangrove in eastern Venezuela. Implications for sea-level rise and disturbance history. Journal
of Coastal Research, 496-504 (1999).
95. L. E Urrego, A.Correa-Metrio, C. González, A.R. Castaño, Y. Yokoyama. Contrasting
responses of two Caribbean mangroves to sea-level rise in the Guajira Peninsula (Colombian 20
Caribbean). Palaeogeography, Palaeoclimatology, Palaeoecology, 370, 92-102 (2013).
Submitted Manuscript: Confidential
23
96. V. Vedel, H. Behling, M. Cohen, R. Lara. Holocene mangrove dynamics and sea-level
changes in northern Brazil, inferences from the Taperebal core in northeastern Pará
State. Vegetation History and Archaeobotany, 15, 115-123. (2006).
97. T. A. Bianchette, T. A McCloskey, K.B. Liu. A 7000-year history of coastal environmental 5
changes from Mexico’s Pacific Coast: A multi-proxy record from Laguna Mitla, Guerrero. The
Holocene, 27, 1214-1226. (2017).
98. C. Cordero-Oviedo, et al. Holocene establishment of mangrove forests in the western coast of
the Gulf of Mexico. Catena, 180, 212-223 (2019). 10
99. G. Digerfeldt, M.D. Hendry. An 8000 year Holocene sea-level record from Jamaica:
implications for interpretation of Caribbean reef and coastal history. Coral Reefs, 5, 165-169
(1987).
15
100. J. C. Ellison. Mangrove retreat with rising sea-level, Bermuda. Estuarine, Coastal and Shelf
Science, 37, 75-87 (1993).
101. P. Ezcurra, E. Ezcurra, P.P. Garcillán, M.T. Costa, M. T., O. Aburto-Oropeza. Coastal
landforms and accumulation of mangrove peat increase carbon sequestration and 20
storage. Proceedings of the National Academy of Sciences, 113, 4404-4409. (2016).
Submitted Manuscript: Confidential
24
102. C. Feller, M. Fournier, D. Imbert, C. Caratini, L. Martin. Datations 14C et palynologie d’un
sédiment tourbeux continu (0-7 m) dans la Mangrove de Guadeloupe (FWI). Résultats
préliminaires. In M.P. Prost: Evolution des littoraux de Guyane et de la zone Caraïbe
méridionale pendant le Quaternaire, Symposium PICG (Vol. 274, pp. 193-202). (1992).
5
103. J. C. Joo-Chang, G.A. Islebe, N. Torrescano-Valle. Mangrove history during middle-and
late-Holocene in Pacific south-eastern Mexico. The Holocene, 25(4), 651-662. (2015).
104. N.S. Khan. Environmental and sea-level reconstruction in temperate, subtropical, and
tropical coastal wetlands using bulk stable carbon isotope geochemistry and microfossils (Ph.D. 10
Dissertation). University of Pennsylvania, Philadelphia. (2014).
105. I.G. Macintyre, M.M. Littler, D.S. Littler. Holocene history of Tobacco Range, Belize,
Central America. Atoll Research Bulletin 430, 1-18 (1995).
15
106. I.G. Macintyre, M.A. Toscano, R.G. Lighty, G.B. Bond. Holocene history of the mangrove
islands of Twin Cays, Belize, Central America. Atoll Research Bulletin 510, 1-16 (2004).
107. S.J. Mazzullo, C.S. Teal, W.D. Bischoff, K. Dimmick-Wells, B.W. Wilhite. Sedimentary
architecture and genesis of Holocene shallow-water mud-mounds, northern Belize. 20
Sedimentology 50, 743–770 (2003).
Submitted Manuscript: Confidential
25
108. N. M. Monacci, U. Meier-Grünhagen, B.P. Finney, H. Behling, M.J. Wooller. Mangrove
ecosystem changes during the Holocene at Spanish lookout Cay, Belize. Palaeogeography,
Palaeoclimatology, Palaeoecology, 280, 37-46. (2009).
109. N. M. Monacci, U. Meier-Grünhagen, B.P. Finney, H. Behling, M.J. Wooller. Paleoecology 5
of mangroves along the Sibun River, Belize. Quaternary Research, 76, 220-228. (2011).
110. D. W. Scholl. Recent sedimentary record in mangrove swamps and rise in sea level over the
southwestern coast of Florida: Part 2. Marine Geology, 2, 343-364. (1964).
10
111. R.J. Shlemon, J.L. Capacete. Application of holocene geological data for siting coastal
nuclear power plants: An example from Puerto Rico. Bulletin of the International Association of
Engineering Geology 13, 107–111 (1976).
112. E.K. Ramcharan, J.H. McAndrews. Holocene development of coastal wetland at Maracas 15
bay, Trinidad, West Indies. Journal of Coastal Research, 581-586 (2006).
113. E. K. Ramcharan. Mid-to-late Holocene sea level influence on coastal wetland development
in Trinidad. Quaternary International, 120, 145-151 (2004).
20
114. E.K. Ramcharan. Late Holocene ecological development of the Graeme Hall swamp,
Barbados, West Indies. Caribbean Journal of Science, 41, 14 (2005).
Submitted Manuscript: Confidential
26
115. D.M. Robbin. A new Holocene sea-level curve for the upper Florida Keys and Florida reef
tract. In: P.J. Gleason (ed) Environments of south Florida, present and past. Miami Geological
Society, 437–458 (1984).
116. D.P. Schmidt. A palynological and stratigraphic analysis of mangrove sediments at Punta 5
Galeta, Panamá. University of California, Berkeley (2008).
117. N. Torrescano, G.A. Islebe. Tropical forest and mangrove history from southeastern
Mexico: a 5000 yr pollen record and implications for sea level rise. Veg. Hist. Archaeobotany 15,
191–195 (2006). 10
118. C. D. Woodroffe. Mangrove swamp stratigraphy and Holocene transgression, Grand
Cayman Island, West Indies. Marine Geology, 41, 271-294 (1981).
119. M. J. Wooller, H. Behling, B.J. Smallwood, M. Fogel. Mangrove ecosystem dynamics and 15
elemental cycling at Twin Cays, Belize, during the Holocene. Journal of Quaternary Science, 19,
703-711(2004).
120. M.J. Wooller, R. Morgan, S. Fowell, H. Behling, M. Fogel. A multiproxy peat record of
Holocene mangrove palaeoecology from Twin Cays, Belize. The Holocene, 17, (2007). 20
Submitted Manuscript: Confidential
27
121. Q. Yao, K.B. Liu, W.J. Platt, V.H. Rivera-Monroy. Palynological reconstruction of
environmental changes in coastal wetlands of the Florida Everglades since the mid-
Holocene. Quaternary Research, 83, 449-458 (2015).
122. Q. Yao, K.B. Liu. Dynamics of marsh-mangrove ecotone since the mid-Holocene: A 5
palynological study of mangrove encroachment and sea level rise in the Shark River Estuary,
Florida. PloS one, 12, p.e0173670 (2017).
123. P.S. Filho, M.C.L. Cohen, R.J. Lara, G.C. Lessa, B. Koch, H. Behling. Holocene coastal
evolution and facies model of the Bragança macrotidal flat on the Amazon Mangrove Coast, 10
Northern Brazil. Journal of Coastal Research, 306-310. (2006).
124. M. J.Wooller, H. Behling, J. L. Guerrero, N. Jantz, M. E Zweigert. Late Holocene
hydrologic and vegetation changes at Turneffe Atoll, Belize, compared with records from
mainland Central America and Mexico. Palaios, 24, 650-656. (2009). 15
125. J.J. Kelleway, et al. Geochemical analyses reveal the importance of environmental history
for blue carbon sequestration. Journal of Geophysical Research: Biogeosciences, 122, 1789-
1805. (2017).
20
126. G.D. Egbert, S.Y, Erofeeva. Efficient inverse modeling of barotropic ocean tides. Journal of
Atmospheric and Oceanic Technology. 19, 183-204. (2002).
Submitted Manuscript: Confidential
28
5
10
15
20
25
30
Submitted Manuscript: Confidential
29
Acknowledgments: We thank Jerry Mitrovica of Harvard University for providing the GIA
model. Timothy A. Shaw of Nanyang Technology University assisted with the preparation of
figures. Figure 1 utilised the image library of the Integration and Application Network,
University of Maryland Centre for Environmental Science (ian.umces.edu/imagelibrary/). 5
Funding: NS was supported by an Outside Studies Program grant from Macquarie University
and AINSE. BPH are supported by the Singapore Ministry of Education Academic Research
Fund MOE2018-T2-1-030, the National Research Foundation Singapore, and the Singapore
Ministry of Education, under the Research Centers of Excellence initiative. This article is a
contribution to PALSEA2 (Palaeo-Constraints on Sea-Level Rise) and International Geoscience 10
Program (IGCP) Project 639, “Sea-Level Changes from Minutes to Millennia”. This work is
Earth Observatory of Singapore contribution 294. KR received funding from the Australian
Research Council (FT130100532). Author contributions: NS conceived the study. NS, NSK
and BPH assembled the contributing mangrove sediment data. EA extracted RSLR estimates
from GIA models. NS, EA and JK conducted data analyses. NS, NSK, EA, and KR prepared 15
figures. All authors contributed to the writing of the manuscript. Competing interests: Authors
declare no competing interests. Data and materials availability: All data is available in the
main text or the supplementary materials.
Supplementary Materials:
Materials and Methods 20
Figures S1-S6
Tables S1-S2
External Database S1
References (30-126)
25
30
35
Submitted Manuscript: Confidential
30
FIGURES
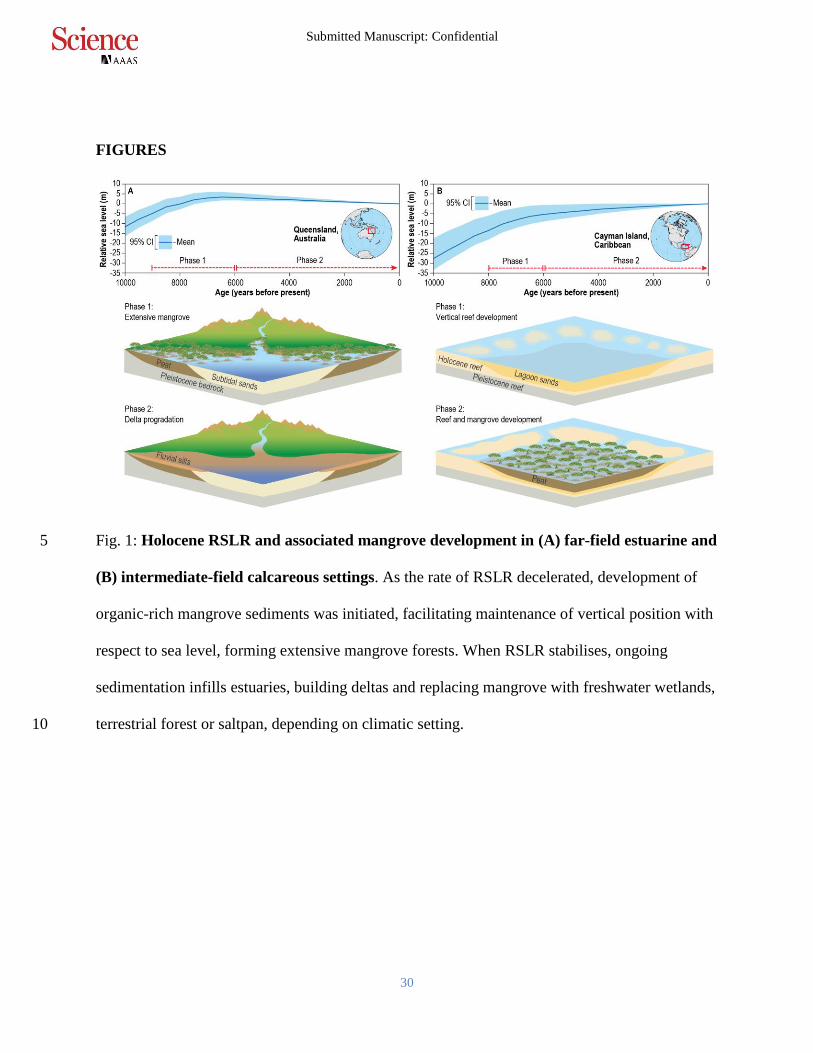
Fig. 1: Holocene RSLR and associated mangrove development in (A) far-field estuarine and 5
(B) intermediate-field calcareous settings. As the rate of RSLR decelerated, development of
organic-rich mangrove sediments was initiated, facilitating maintenance of vertical position with
respect to sea level, forming extensive mangrove forests. When RSLR stabilises, ongoing
sedimentation infills estuaries, building deltas and replacing mangrove with freshwater wetlands,
terrestrial forest or saltpan, depending on climatic setting. 10
Submitted Manuscript: Confidential
31
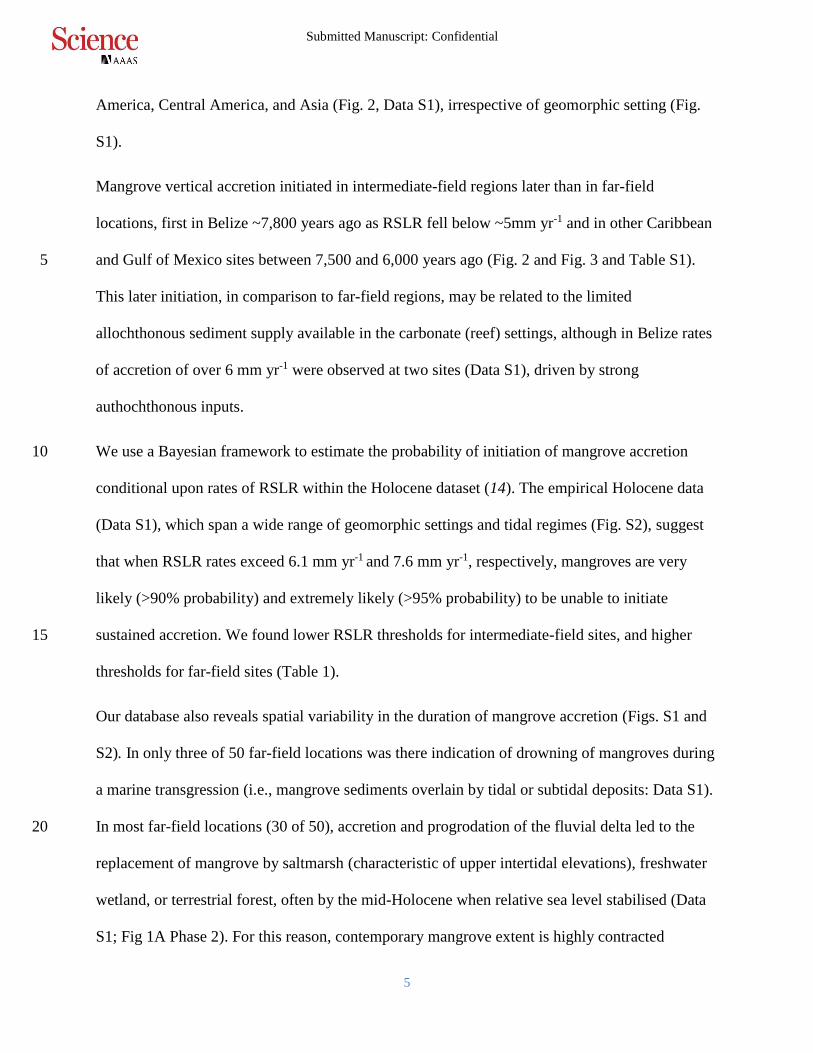
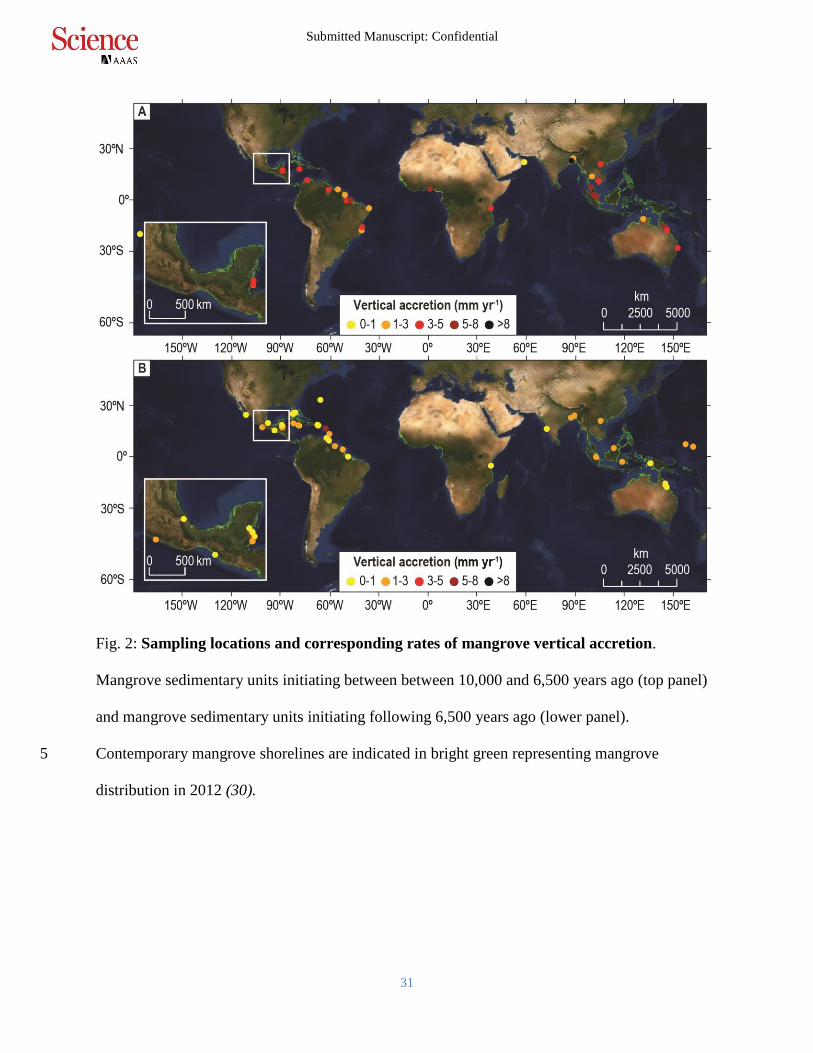
Fig. 2: Sampling locations and corresponding rates of mangrove vertical accretion.
Mangrove sedimentary units initiating between between 10,000 and 6,500 years ago (top panel)
and mangrove sedimentary units initiating following 6,500 years ago (lower panel).
Contemporary mangrove shorelines are indicated in bright green representing mangrove 5
distribution in 2012 (30).
Submitted Manuscript: Confidential
32
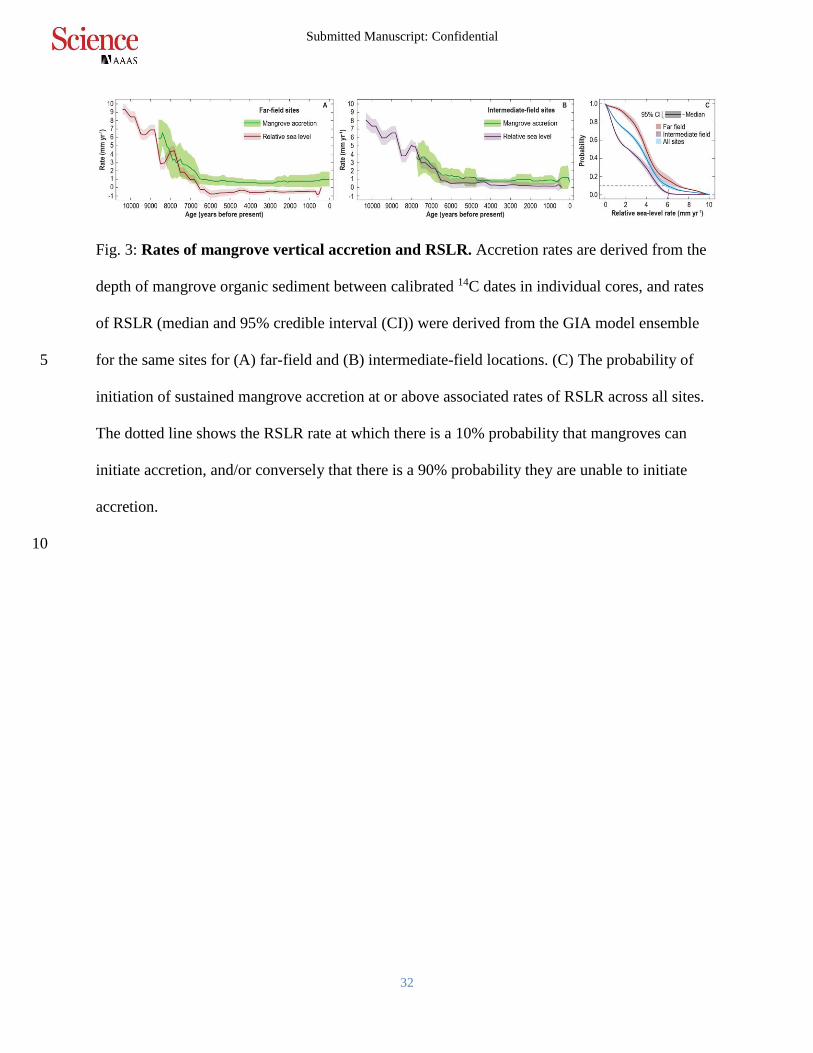
Fig. 3: Rates of mangrove vertical accretion and RSLR. Accretion rates are derived from the
depth of mangrove organic sediment between calibrated 14C dates in individual cores, and rates
of RSLR (median and 95% credible interval (CI)) were derived from the GIA model ensemble
for the same sites for (A) far-field and (B) intermediate-field locations. (C) The probability of 5
initiation of sustained mangrove accretion at or above associated rates of RSLR across all sites.
The dotted line shows the RSLR rate at which there is a 10% probability that mangroves can
initiate accretion, and/or conversely that there is a 90% probability they are unable to initiate
accretion.
10
Submitted Manuscript: Confidential
33
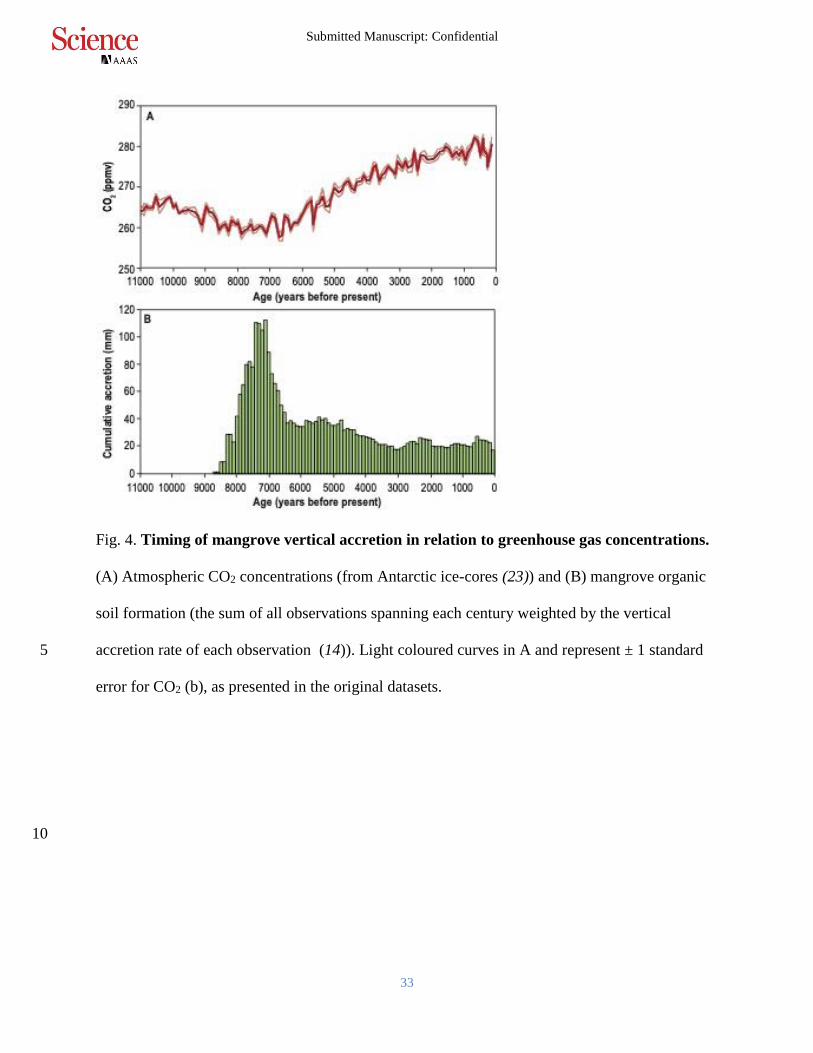
Fig. 4. Timing of mangrove vertical accretion in relation to greenhouse gas concentrations.
(A) Atmospheric CO2 concentrations (from Antarctic ice-cores (23)) and (B) mangrove organic
soil formation (the sum of all observations spanning each century weighted by the vertical
accretion rate of each observation (14)). Light coloured curves in A and represent ± 1 standard 5
error for CO2 (b), as presented in the original datasets.
10
Submitted Manuscript: Confidential
34
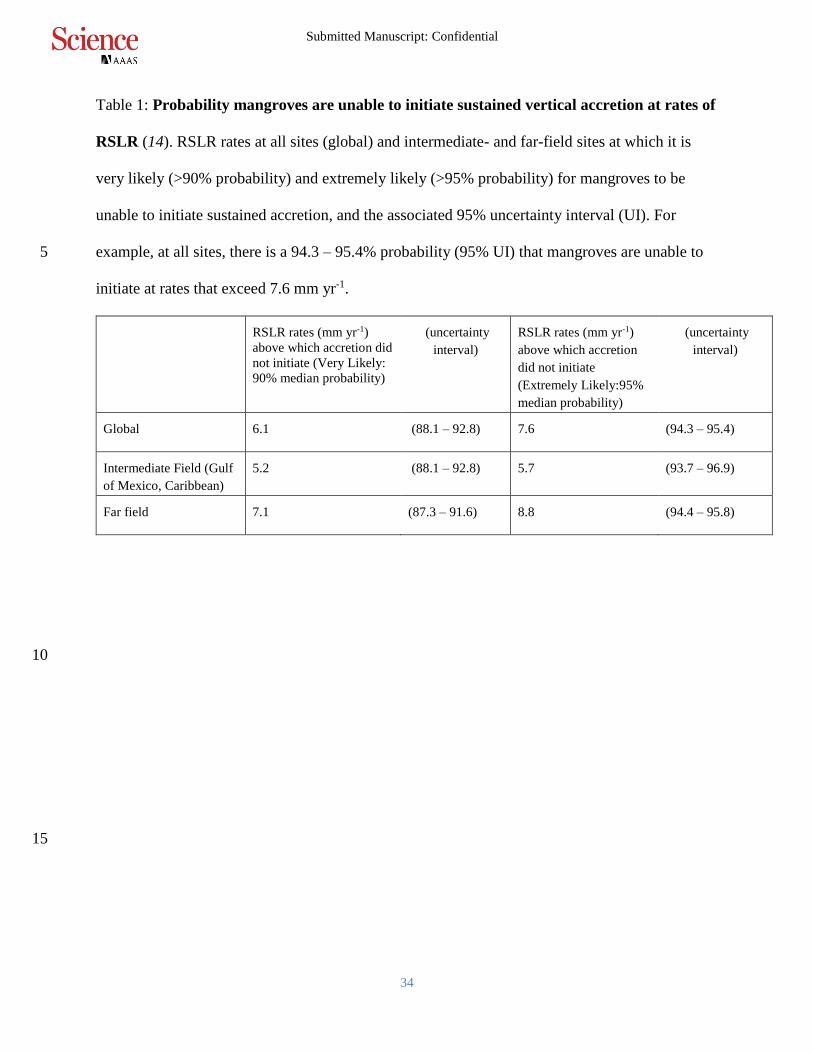
Table 1: Probability mangroves are unable to initiate sustained vertical accretion at rates of
RSLR (14). RSLR rates at all sites (global) and intermediate- and far-field sites at which it is
very likely (>90% probability) and extremely likely (>95% probability) for mangroves to be
unable to initiate sustained accretion, and the associated 95% uncertainty interval (UI). For
example, at all sites, there is a 94.3 – 95.4% probability (95% UI) that mangroves are unable to 5
initiate at rates that exceed 7.6 mm yr-1.
RSLR rates (mm yr-1)
above which accretion did
not initiate (Very Likely:
90% median probability)
(uncertainty
interval)
RSLR rates (mm yr-1)
above which accretion
did not initiate
(Extremely Likely:95%
median probability)
(uncertainty
interval)
Global 6.1 (88.1 – 92.8) 7.6 (94.3 – 95.4)
Intermediate Field (Gulf
of Mexico, Caribbean)
5.2 (88.1 – 92.8) 5.7 (93.7 – 96.9)
Far field 7.1 (87.3 – 91.6) 8.8 (94.4 – 95.8)
10
15
Submitted Manuscript: Confidential
35
Supplementary Materials for 5
Thresholds of mangrove survival under sea-level rise
N. Saintilan*, N.S. Khan, E. Ashe, J.J. Kelleway, K. Rogers,
C.D. Woodroffe, B.P. Horton
Correspondence to: [email protected]
10
Materials and Methods
Figs. S1 to S6 15
Tables S1 to S2
Caption for Data S1
References 30-126 cited in supplementary materials
Other Supplementary Materials for this manuscript include the following: 20
Data S1
25
Submitted Manuscript: Confidential
36
Materials and Methods
Accretion Rates
We searched for all published studies reporting on Holocene transgressive organic-rich
mangrove sediments using online search engines (Google Scholar, Web of Science) and our own
databases. From 190 studies we selected cores conforming to the following criteria: (a) material 5
consisted of mangrove organic muds or peats of at least two metres in depth (i.e. greater than the
rooting depth of mangrove and therefore implying in-situ vertical accretion) (b) mangrove
presence was confirmed by either pollen analysis or the identification of mangrove root
morphology and (c) radiocarbon dates were available for at least two positions in individual
cores separated by a depth of at least 1 metre (the maximum rooting depth) and at least ~300 10
years. Of the 73 studies conforming to these requirements, we extracted information from 122
core sections (from 90 cores) spanning 78 locations, with an average vertical interval between
14C dates of 2.5 m ( 1.2 m), and average time interval between 14C dates of 1931 cal years (
1849) (Data S1; 31; 46-121).
15
We noted the location, and recorded latitude and longitude of each core. We interpreted its
geomorphic setting using the categories (after 32) of tide-dominated estuarine (macro to meso-
tidal with the funnel mouth characteristic of tide dominance), barrier estuarine (in which
mangrove development occurs behind protective sand barriers on wave dominated coastlines),
large river delta (in which fluvial discharge and sedimentation are the dominant processes), 20
carbonate (i.e. coral reef including both oceanic island and barrier reef settings), and coastal
embayment (i.e. sheltered open coast or open embayment with minimal fluvial input). We also
estimated local tidal range for each site using the OSU TPXO9 global tidal model (126) and
classified sites as micro- (great diurnal range [GT] < 2 m), meso- (GT between 2 to 4 m) and
Submitted Manuscript: Confidential
37
macrotidal (GT > 4 m). We interpreted the environment pre-dating and post-dating mangrove
formation on the basis of pollen and stratigraphic descriptions to infer the nature (i.e.,
transgressive, regressive) of contacts below and above mangrove sequence where possible. The
dominant mangrove species were noted.
5
We extracted radiocarbon dates and uncertainties representing (i) the earliest date for mangrove
initiation at the site; (ii) the latest date for mangrove survival at the site; (iii) the date
corresponding to the beginning of the single core sequence from which an accretion rate was
estimated; and (iv) the end date of the single core sequence from which an accretion rate was
estimated. We calibrated all radiometric dates to sidereal years using IntCal13 (33) and SHCal13 10
within Calib 7.10 (http://calib.org/calib/calib.html). We reported 2 age ranges (Data S1).
We calculated rates of accretion as the depth of mangrove organic sediment between the 2
midpoints of calibrated radiocarbon dates divided by the time interval between dates, a technique
previously applied to estimate mangrove vertical accretion in Belize (31). Accretion rates are 15
averaged over the time period between dates, and do not reflect variability in accretion rate over
shorter time periods. Given the rapid deceleration of eustatics sea level rise over the early
Holocene, these rates are likely to be conservative. Mangrove root material is largely refractory
(31) under conditions of rising sea level and the high water content and hydraulic conductivity of
mangrove peats limit dewatering and compaction (34). 20
The sample distribution is biased to land-based samples and, in general, the upper 10-15 metres
of Holocene sediment. The deepest core (ID27: Ganges-Brahmaputra River) in our sample
Submitted Manuscript: Confidential
38
extended to 50 metres and included a transgressive mangrove soil in the lowest 9 metres, the
oldest mangrove sample in our dataset and that with the highest estimated accretion rate. Fifteen
cores did not extend to the lower depth of the mangrove unit. Similarly, the lack of off-shore
sampling, may exclude locations that maintained high rates of vertical accretion over appreciable
periods of time, and bias our sampling towards habitats that survived RSLR. Our sampling of 5
mangrove accretion in the very early Holocene (pre-9000BP) is thereby limited. Mangrove
cumulative accretion (Fig. 4) is the sum of all observations of mangrove vertical accretion
occurring in each century, multiplied by the accretion rate for each observation. Mangrove root
material is largely refractory (31) under conditions of rising sea level and the high water content
and hydraulic conductivity of mangrove peats limit dewatering and compaction (34). 10
Glacial Isostatic Adjustment Modelling
Rates of local and regional RSL change during the Holocene are primarily the result of glacio-
isostatic adjustment (GIA), the loss of ice burden and subsequent deformational, rotational and
gravitational effects on the solid Earth that influences both both eustatic and relative sea level. 15
We use a revised model of glacio-isostatic adjustment (16), which adopts the ICE-6G global ice
reconstruction from the Last Glacial Maximum (LGM) to the present day (35,36). The sea-
level calculations are based on a gravitationally self-consistent eustatic and relative sea level. We
use a revised model of glacio-isostatic adjustment (16), which adopts the ICE-6G global ice
reconstruction from the Last Glacial theory that incorporates time-varying shorelines and the 20
feedback of load-induced perturbations to Earth’s rotation into sea level (37). The model
assumes a spherically symmetric, self-gravitating, Maxwell viscoelastic Earth model. The elastic
and density components of the model are given by the seismic model PREM (38) and the
Submitted Manuscript: Confidential
39
viscosity structure is characterized by three parameters: an infinite viscosity (elastic) lithosphere
of prescribed thickness, LT, and upper and lower mantle viscosities denoted by VUM and VLM,
respectively.
We used 300 combinations of these Earth rheological parameters in the glacio-isostatic 5
adjustment model to predict RSL heights at a 512 x 260 global grid at 500-year periods. The
ensemble of 300 combinations of parameters included LT from 24 – 140 km, VUM from 0.3 – 2 x
1021Pas, and VLM from 3 – 100 x 1021Pas, where each combination is assumed to be equally
likely. These ensemble predictions provided uncertainty in RSLR rates of change for each site in
this study. 10
Statistical analysis
We previously demonstrated that spatial and temporal variations in RSLR over the mid- to late-
Holocene act as a global control on persistence of organic matter in coastal wetlands substrates
(7). We hypothesise therefore that the duration of mangrove growth (as evidenced by continuous 15
mangrove substrate within a given core) will vary between intermediate-field and far-field
locations, with longer persistence in intermediate-field zones relative to far-field locations where
RSLR stabilised several millennia earlier (NB Mangroves do not grow in near-field locations).
Generalised linear models were used to test the correlations between several variables. We tested 20
whether the non-normal variable mangrove duration (count of years mangrove persisted in situ)
varied between intermediate and far-field locations assuming a Poisson distribution and using a
log link function. Mangrove initiation date was included as a covariate in pairwise comparisons
Submitted Manuscript: Confidential
40
and was based on estimated marginal means subject to Bonferroni adjustment. Additionally, we
tested whether the mangrove accretion rates varied between intermediate and far-field locations,
geomorphic settings, and tidal ranges (Table S1) assuming a Gaussian distribution and using an
identity link function. We also tested the relationship between mangrove accretion rate and
RSLR rate from the mean time during accretion assuming a Gaussian distribution and using an 5
identity link function (Fig S5; Table S1). A significance level of P<0.05 was employed for all
models.
The statistical analysis of RSLR is based on the glacio-isostatic adjustment modelling described
above. We linearly interpolate relative sea level heights between the spatial and temporal 10
predictions at sites and dates from the mangrove data using scipy’s interpolate package (39). We
calculate RSLR rates using a linear transformation and approximate the rate distribution using
kernel density estimation with sklearn.neighbors.kde (40,41) enabling the estimation of a
cumulative distribution function (cdf) for each set of rates. We split all sites of mangrove
accretion into two categories (intermediate- and far-field sites), based on their proximity to the 15
former Laurentide Ice Sheet. Using 300-year average rates estimated every 100 years, we
estimate RSLR during accretion times for far-field and intermediate-field sites by averaging
RSLR at all sites where mangrove is within an accretion period (between the 95th percentile of
the beginning of accretion through the 5th percentile of termination) (Fig. 3).
20
To estimate the probability of initiation of mangrove accretion conditional upon rates of RSLR
within this dataset, we use a Bayesian framework to invert the probability of RSLR, given
initiation of mangrove accretion 𝑝(𝑦|𝑥), where:
Submitted Manuscript: Confidential
41
𝑝(𝑥|𝑦) ∝ 𝑝(𝑦|𝑥)𝑝(𝑥)
The posterior probability of initiation given RSLR, 𝑝(𝑥|𝑦), is therefore proportional to 𝑝(𝑦|𝑥).
We model 𝑝(𝑥|𝑦) using kernel density estimation (KDE):
𝑝(𝑦|𝑥) = {
1
𝑛ℎ∑ 𝐾 (
𝑦 − 𝑦𝑖
ℎ) , when 𝑥 = 1
𝑛
𝑖=1
0, when 𝑥 = 0
where K is a non-negative normal kernel, h is a smoothing parameter (or bandwidth), n is the 5
number of RSLR estimates used in the KDE during which mangrove is initiating. The parameter
h is optimized through unsupervised nearest neighbors learning (40,41). We use an
uninformative prior distribution of initiation, 𝑝(𝑥), where p(1) = p(0) = 0.5. We use Monte
Carlo methods to generate 1000 independent samples of RSLR at initiation, assuming a uniform
distribution within the 95% CI of radiocarbon dates. The distribution of RSLR at initiation with 10
uncertainties is the combination of all KDEs of the probability density functions for each sample.
We invert the cumulative distribution functions of initiation rates to find the probability of
mangrove initiation given RSLR with uncertainty. For example, the probability that mangroves
initiated at RSLR rates of exceeding 6.1 mm yr-1 and 7.6 mm yr-1, respectively, at the time of
initiation is ~ 10% (95% Uncertainty Interval (UI): 7.9 – 12.2 %) and ~ 5% (UI: 4.6% – 5.7%). 15
Assuming an uninformative prior distribution on initiation translates RSLR rates exceeding 6.1
mm yr-1 and 7.6 mm yr-1, respectively, suggesting that mangroves are very likely (>90%
probability; 95 % Uncertainty Interval (UI): 87.8 – 92.1%) and extremely likely (>95%
probability; 95% UI: 94.3 – 95.4%) to be unable to initiate sustained accretion. The probabilities
of initiation of sustained mangrove accretion at a given RSLR rate are summarized in Fig. 3c and 20
Table S1. All RSLR analyses based on glacia-isostatic modelling were implemented in the
software package Python.
Submitted Manuscript: Confidential
42
Carbon sequestration and GHG Emissions Factors
Most of the papers dealing with early to mid Holocene mangrove development in far field
locations comment on a substantially greater mangrove aerial extent at this time compared to
current distribution. These include major river deltas of Southeast Asia: the Song (20); the 5
Mekong (72,76); the Malay-Thai Peninsula (69); west coast India (71); the macrotidal estuaries
of northern Australia, reviewed in (15), and including the Ord (57), the Fitzroy (55), the South
Alligator (59); mesotidal estuaries on the Australian east coast (52-54); the Ivory coast, Africa
(82), Bragança Peninsula, Brazil (84), and the coastal plain of Suriname (93) and Venezuela
(94). Mangrove extent contracted with infilling, to a degree difficult to constrain with the limited 10
spread of point measures from the early Holocene. For this reason, and our limited understanding
of Holocene distribution outside of these major deltaic systems, we have refrained from
estimating early Holocene global mangrove extent. For our estimates of carbon sequestration
from this time, we use the conservative value of current mangrove extent.
15
Current estimates of the global carbon store in the upper metre of the world’s mangroves vary
due primarily to differences in the calculation of mangrove area, from 2.6 Pg C (42) to 9.4-10.4
Pg C (43), with an additional 1.8 Pg C in above-ground biomass (43). These estimates are based
on soil organic carbon stores of 283 ± 193 Mg C ha−1 (±s.d.) (42) and 255 Mg C ha−1 (43), the
differing stores being primarily due to different area estimates (42). 20
Following the initiation of the phase of extensive mangrove development as RSLR fell below
7mm yr-1 ~8800 years ago and extending to 6000 years ago, we estimated vertical accretion
Submitted Manuscript: Confidential
43
using the average across all sites (Data S1). On these estimates, mangroves in the early-Holocene
would have accreted ~8 m and sequestered ~85 Pg C between 8200 and 6000, on the
conservative assumptions that (i) mangrove area in this period was not greater than the
contemporary estimate of (47) and (ii) that the efficiency of carbon capture under rapidly rising
sea-level was not less than at present. We also assume that mangrove soil organic carbon is 5
predominantly autochthonous, as suggested by studies using direct measurement and/or stable
isotope approaches (44).
We do not anticipate appreciable loss of carbon with depth in most of these settings during the
transgressive phase. Carbon is efficiently retained in soils subject to rapid sea-level rise (7). This 10
is because the depth of oxygen penetration in saturated soils is 1-10mm (21). A portion of
surficial organic carbon is therefore buried within a year, but most new organic carbon is
introduced by roots at greater depths (44). Studies in the Caribbean (31) and Australia (125)
shows excellent preservation of old root material.
15
There are several lines of evidence to suggest that tropical mangroves may have played a role in
forcing changes to atmospheric methane concentrations during the Holocene. The deuterium
stable isotope ratio (D-Es) of ice-core CH4 during the period suggests shifts in CH4 emissions to
be dominated by tropical wetlands rather than geological emissions (45), consistent with local
sea-level stabilisation forcing increases in the extent of freshwater wetland in Indonesia (46) and 20
other large tropical systems (45). This corresponds to a period in which tropical mangroves were
replaced by methanogenic wetlands (freshwater sedges) and rainforest following the stabilisation
of sea levels in the Southern Hemisphere and the Indo-Pacific (Data S1).
Submitted Manuscript: Confidential
44
SUPPLIMENTARY FIGURES
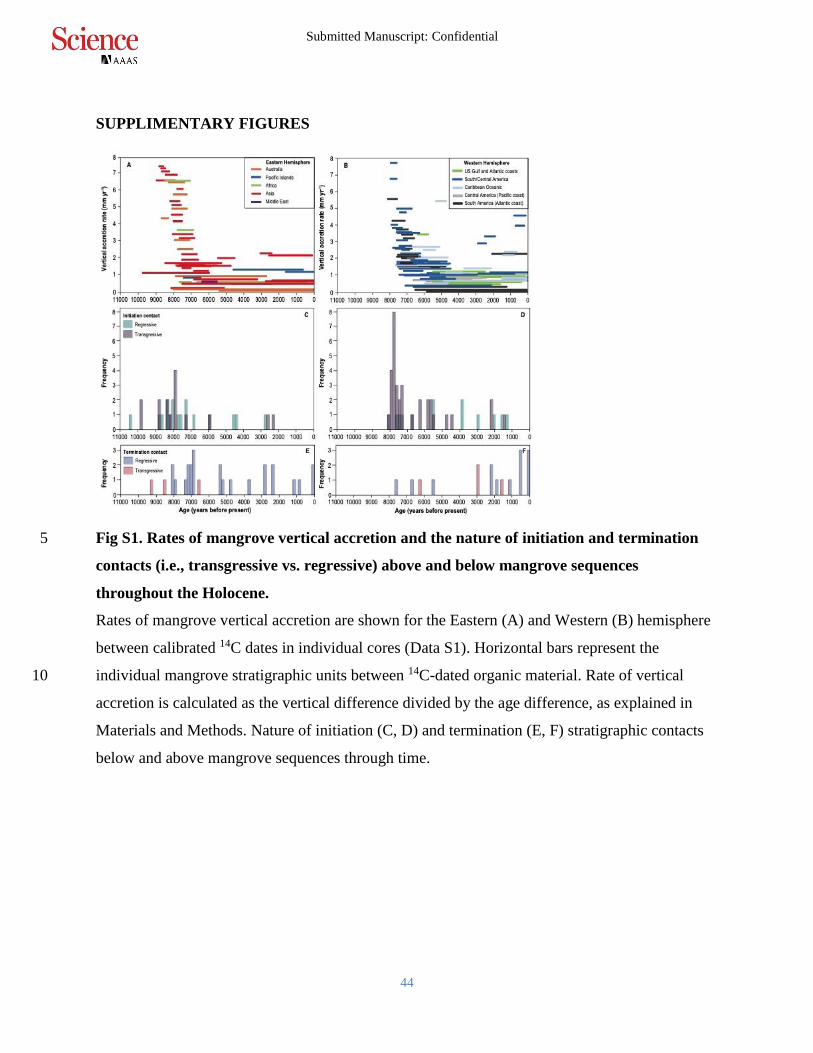
Fig S1. Rates of mangrove vertical accretion and the nature of initiation and termination 5
contacts (i.e., transgressive vs. regressive) above and below mangrove sequences
throughout the Holocene.
Rates of mangrove vertical accretion are shown for the Eastern (A) and Western (B) hemisphere
between calibrated 14C dates in individual cores (Data S1). Horizontal bars represent the
individual mangrove stratigraphic units between 14C-dated organic material. Rate of vertical 10
accretion is calculated as the vertical difference divided by the age difference, as explained in
Materials and Methods. Nature of initiation (C, D) and termination (E, F) stratigraphic contacts
below and above mangrove sequences through time.
Submitted Manuscript: Confidential
45
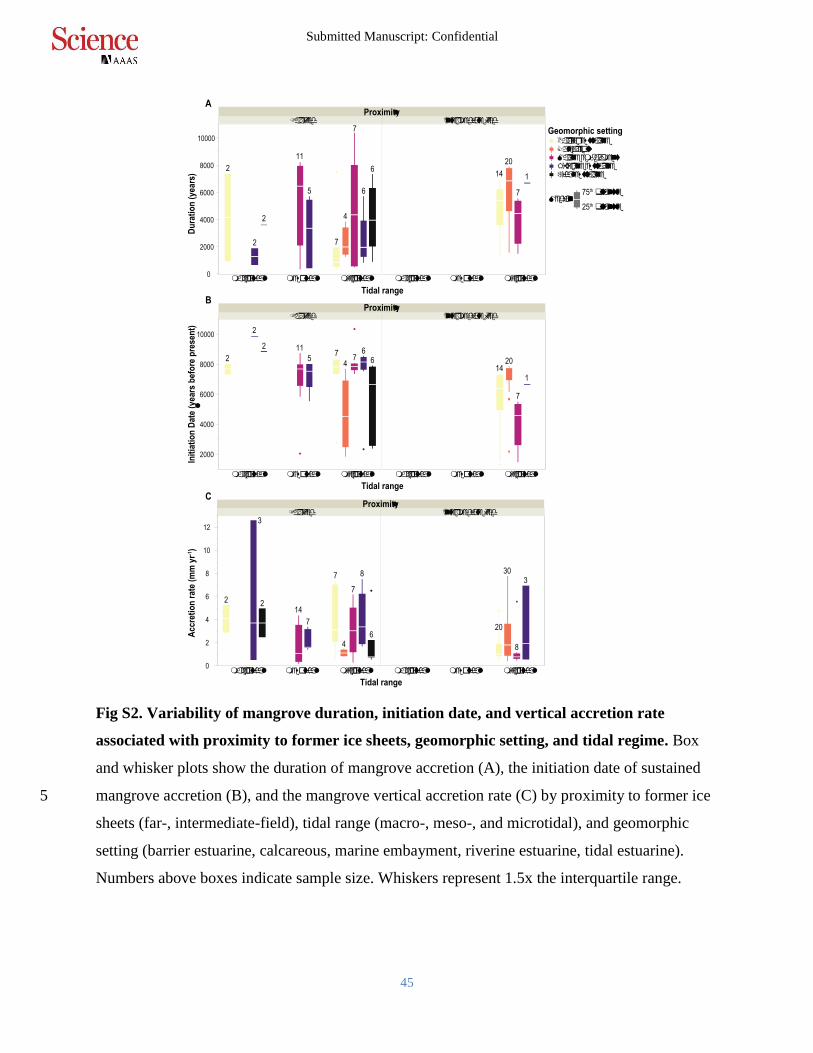
Fig S2. Variability of mangrove duration, initiation date, and vertical accretion rate
associated with proximity to former ice sheets, geomorphic setting, and tidal regime. Box
and whisker plots show the duration of mangrove accretion (A), the initiation date of sustained
mangrove accretion (B), and the mangrove vertical accretion rate (C) by proximity to former ice 5
sheets (far-, intermediate-field), tidal range (macro-, meso-, and microtidal), and geomorphic
setting (barrier estuarine, calcareous, marine embayment, riverine estuarine, tidal estuarine).
Numbers above boxes indicate sample size. Whiskers represent 1.5x the interquartile range.
ProximityFar fie
l
d Intermediate fie
l
d
Du
rati
on
(y
ea
rs)
0
2000
4000
6000
8000
10000
macrotidal mesotidal microtidal macrotidal mesotidal microtidal
Tidal range
Geomorphic settingBarrier estuarine
Calcareous
Marine embayment
Riverine estuarine
Tidal estuarine
ProximityFar fie
l
d Intermediate fie
l
d
Init
iati
on
Date
(y
ears
be
fore
pre
se
nt)
2000
4000
6000
8000
10000
macrotidal mesotidal microtidal macrotidal mesotidal microtidal
Tidal range
ProximityFar fie
l
d Intermediate fie
l
d
0
2
4
6
8
10
12
macrotidal mesotidal microtidal macrotidal mesotidal microtidal
Tidal range
Acc
reti
on
ra
te (
mm
yr-1
)
A
B
C
2
2
2
11
5
7
4
7
6
614
20
7
1
2
2
2 11
57
47
66
1420
7
1
3
14
7
8
20
30
8
3
2 2
7
4
7
6
Median
75th quantile
25th quantile
Submitted Manuscript: Confidential
46
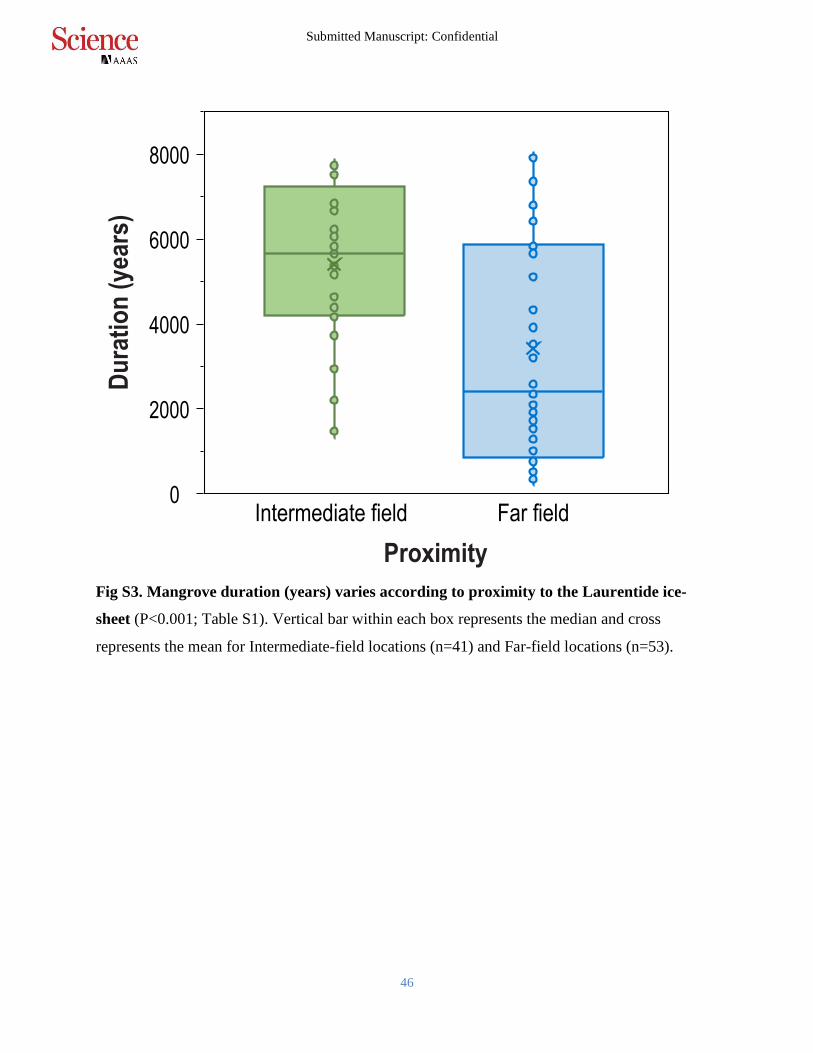
Fig S3. Mangrove duration (years) varies according to proximity to the Laurentide ice-
sheet (P<0.001; Table S1). Vertical bar within each box represents the median and cross
represents the mean for Intermediate-field locations (n=41) and Far-field locations (n=53).
0
2000
4000
6000
8000
Du
rati
on
(y
ears
)
Proximity
Intermediate field Far field
Submitted Manuscript: Confidential
47
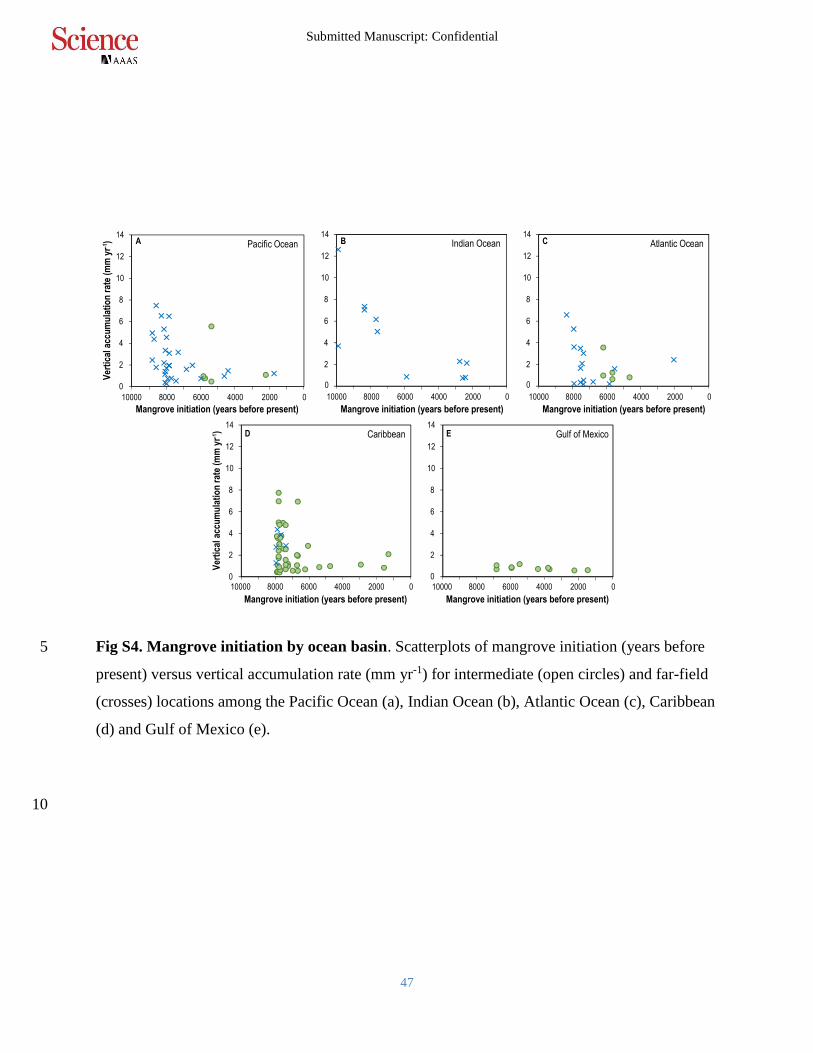
Fig S4. Mangrove initiation by ocean basin. Scatterplots of mangrove initiation (years before 5
present) versus vertical accumulation rate (mm yr-1) for intermediate (open circles) and far-field
(crosses) locations among the Pacific Ocean (a), Indian Ocean (b), Atlantic Ocean (c), Caribbean
(d) and Gulf of Mexico (e).
10
0
2
4
6
8
10
12
14
Ver
tica
l acc
um
ula
tio
n r
ate
(mm
yr-1
) Pacific OceanA
2
4
6
8
10
12
14Indian OceanB
2
4
6
8
10
12
14Atlantic OceanC
0
2
4
6
8
10
12
14
Ver
tica
l acc
um
ula
tio
n r
ate
(mm
yr-1
) CaribbeanD
2
4
6
8
10
12
14Gulf of MexicoE
Mangrove initiation (years before present)
10000 8000 6000 4000 2000 010000 8000 6000 4000 2000 0
10000 8000 6000 4000 2000 010000 8000 6000 4000 2000 010000 8000 6000 4000 2000 0
0
Mangrove initiation (years before present)
Mangrove initiation (years before present)Mangrove initiation (years before present)Mangrove initiation (years before present)
0 0
Submitted Manuscript: Confidential
48
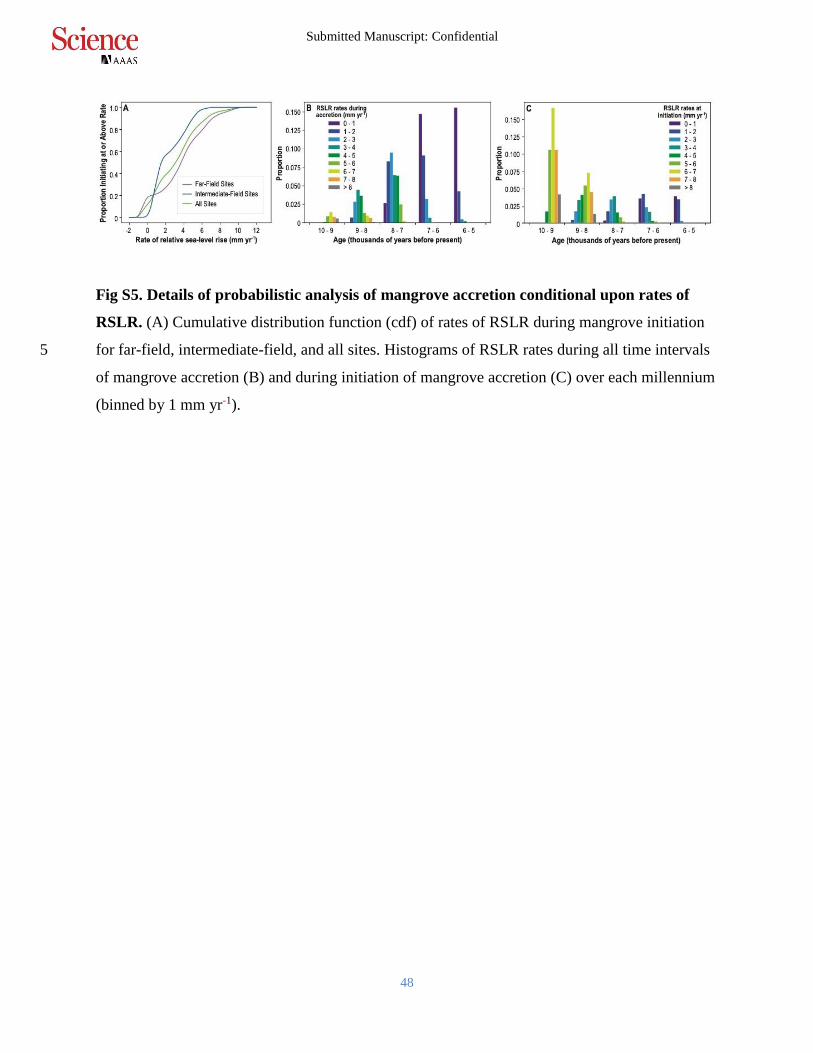
Fig S5. Details of probabilistic analysis of mangrove accretion conditional upon rates of
RSLR. (A) Cumulative distribution function (cdf) of rates of RSLR during mangrove initiation
for far-field, intermediate-field, and all sites. Histograms of RSLR rates during all time intervals 5
of mangrove accretion (B) and during initiation of mangrove accretion (C) over each millennium
(binned by 1 mm yr-1).
Submitted Manuscript: Confidential
49
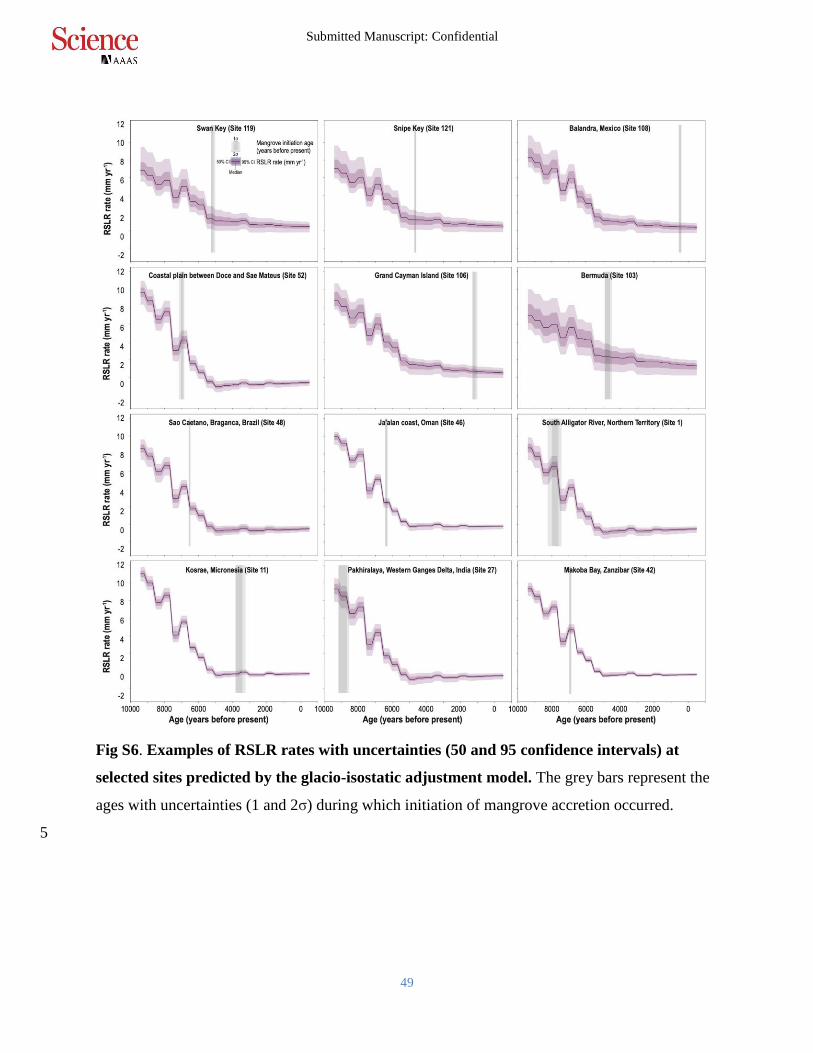
Fig S6. Examples of RSLR rates with uncertainties (50 and 95 confidence intervals) at
selected sites predicted by the glacio-isostatic adjustment model. The grey bars represent the
ages with uncertainties (1 and 2σ) during which initiation of mangrove accretion occurred.
5
Submitted Manuscript: Confidential
50
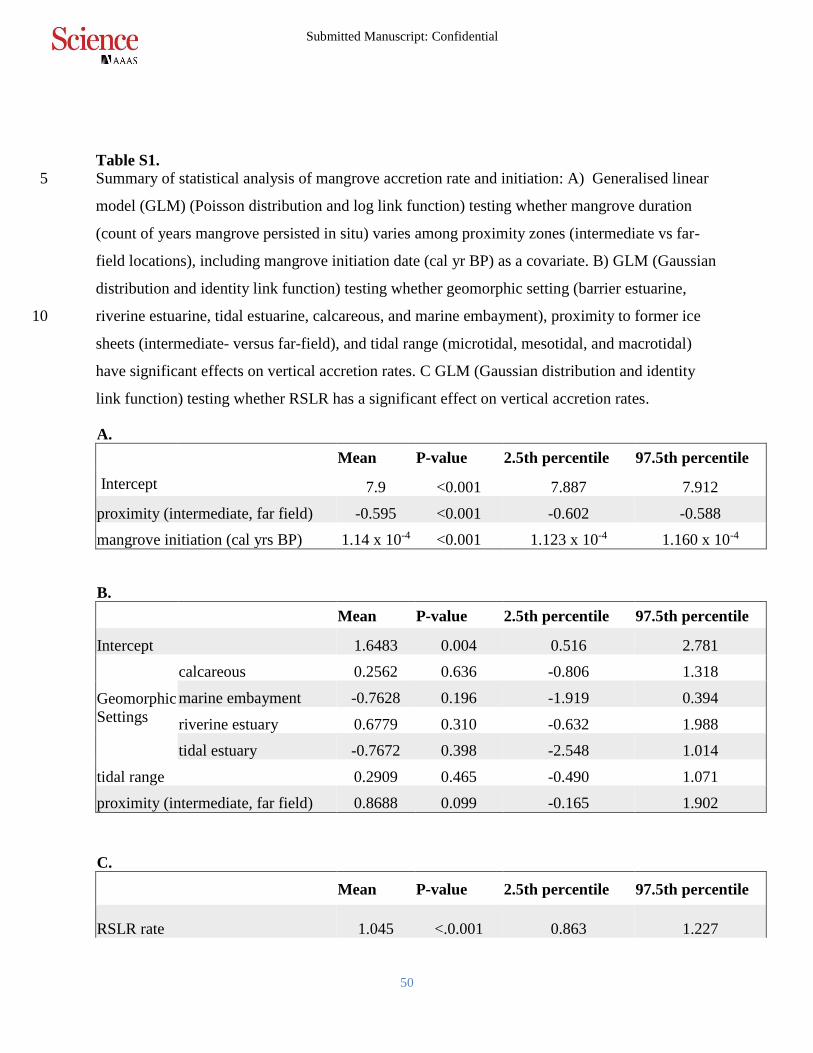
Table S1.
Summary of statistical analysis of mangrove accretion rate and initiation: A) Generalised linear 5
model (GLM) (Poisson distribution and log link function) testing whether mangrove duration
(count of years mangrove persisted in situ) varies among proximity zones (intermediate vs far-
field locations), including mangrove initiation date (cal yr BP) as a covariate. B) GLM (Gaussian
distribution and identity link function) testing whether geomorphic setting (barrier estuarine,
riverine estuarine, tidal estuarine, calcareous, and marine embayment), proximity to former ice 10
sheets (intermediate- versus far-field), and tidal range (microtidal, mesotidal, and macrotidal)
have significant effects on vertical accretion rates. C GLM (Gaussian distribution and identity
link function) testing whether RSLR has a significant effect on vertical accretion rates.
A.
Mean P-value 2.5th percentile 97.5th percentile
Intercept 7.9 <0.001 7.887 7.912
proximity (intermediate, far field) -0.595 <0.001 -0.602 -0.588
mangrove initiation (cal yrs BP) 1.14 x 10⁻⁴ <0.001 1.123 x 10⁻⁴ 1.160 x 10⁻⁴
B.
Mean P-value 2.5th percentile 97.5th percentile
Intercept 1.6483 0.004 0.516 2.781
Geomorphic
Settings
calcareous 0.2562 0.636 -0.806 1.318
marine embayment -0.7628 0.196 -1.919 0.394
riverine estuary 0.6779 0.310 -0.632 1.988
tidal estuary -0.7672 0.398 -2.548 1.014
tidal range 0.2909 0.465 -0.490 1.071
proximity (intermediate, far field) 0.8688 0.099 -0.165 1.902
C.
Mean P-value 2.5th percentile 97.5th percentile
RSLR rate 1.045 <.0.001 0.863 1.227
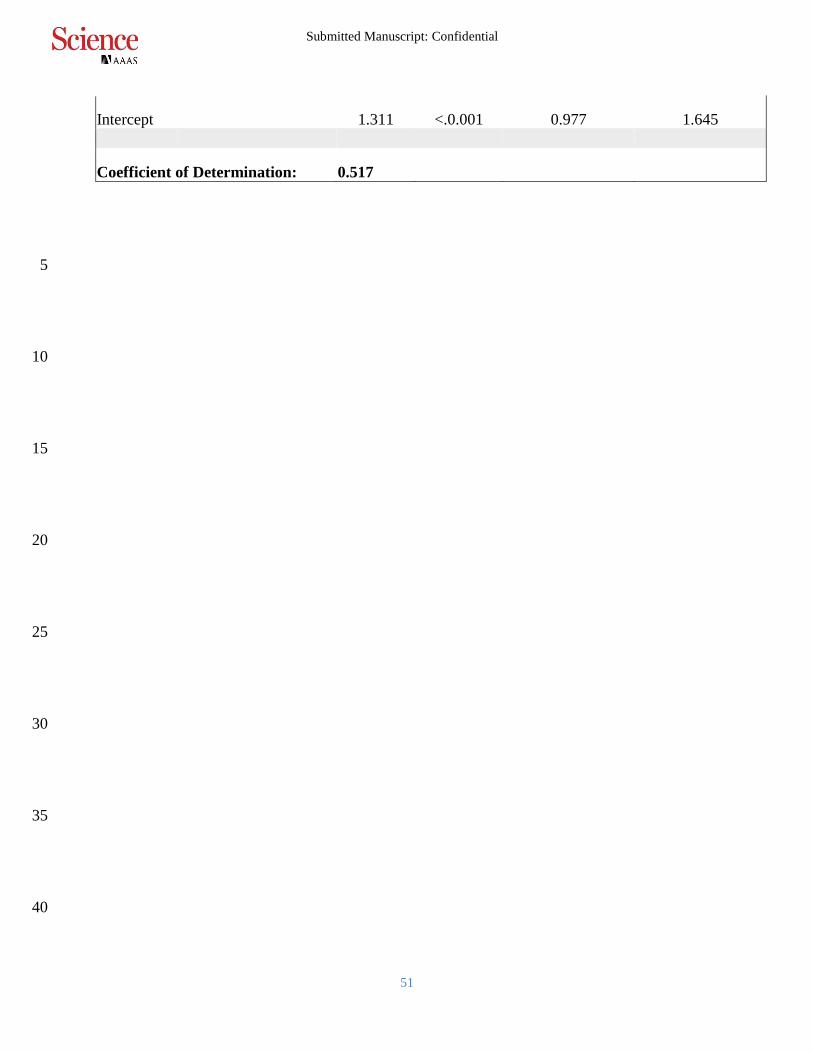
Submitted Manuscript: Confidential
51
Intercept 1.311 <.0.001 0.977 1.645
Coefficient of Determination: 0.517
5
10
15
20
25
30
35
40
Submitted Manuscript: Confidential
52
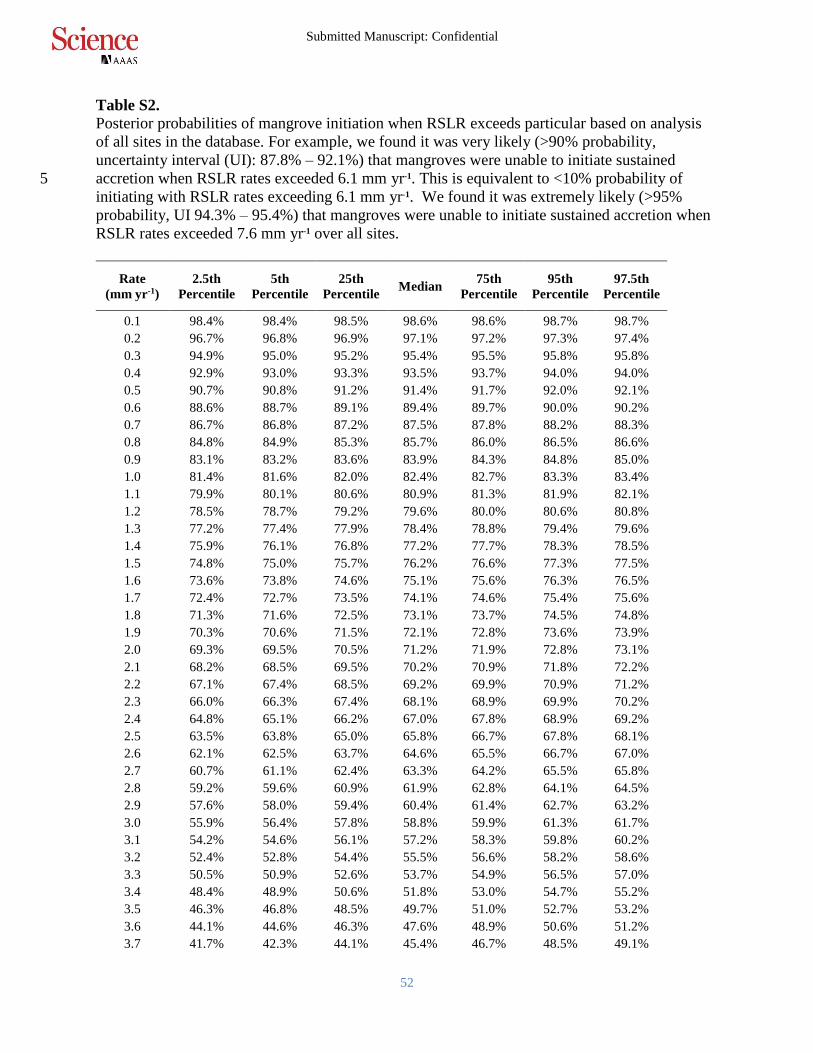
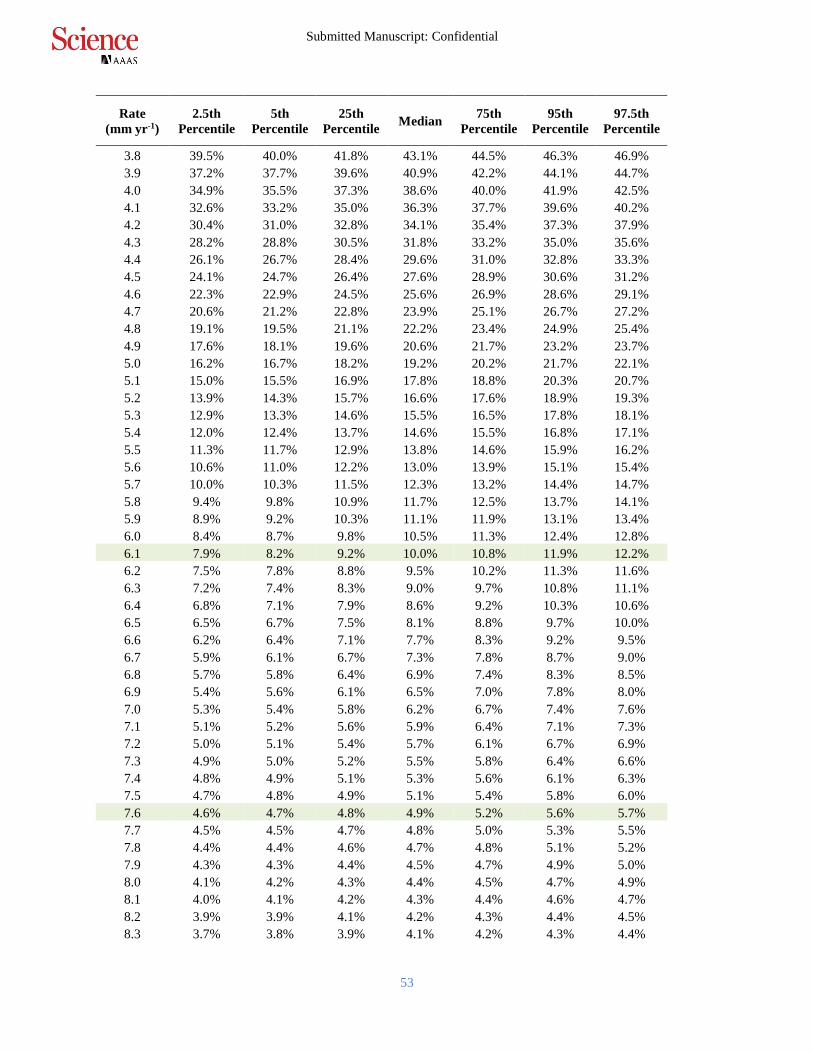
Table S2.
Posterior probabilities of mangrove initiation when RSLR exceeds particular based on analysis
of all sites in the database. For example, we found it was very likely (>90% probability,
uncertainty interval (UI): 87.8% – 92.1%) that mangroves were unable to initiate sustained
accretion when RSLR rates exceeded 6.1 mm yr-1. This is equivalent to <10% probability of 5
initiating with RSLR rates exceeding 6.1 mm yr-1. We found it was extremely likely (>95%
probability, UI 94.3% – 95.4%) that mangroves were unable to initiate sustained accretion when
RSLR rates exceeded 7.6 mm yr-1 over all sites.
Rate
(mm yr-1)
2.5th
Percentile
5th
Percentile
25th
Percentile Median
75th
Percentile
95th
Percentile
97.5th
Percentile
0.1 98.4% 98.4% 98.5% 98.6% 98.6% 98.7% 98.7%
0.2 96.7% 96.8% 96.9% 97.1% 97.2% 97.3% 97.4%
0.3 94.9% 95.0% 95.2% 95.4% 95.5% 95.8% 95.8%
0.4 92.9% 93.0% 93.3% 93.5% 93.7% 94.0% 94.0%
0.5 90.7% 90.8% 91.2% 91.4% 91.7% 92.0% 92.1%
0.6 88.6% 88.7% 89.1% 89.4% 89.7% 90.0% 90.2%
0.7 86.7% 86.8% 87.2% 87.5% 87.8% 88.2% 88.3%
0.8 84.8% 84.9% 85.3% 85.7% 86.0% 86.5% 86.6%
0.9 83.1% 83.2% 83.6% 83.9% 84.3% 84.8% 85.0%
1.0 81.4% 81.6% 82.0% 82.4% 82.7% 83.3% 83.4%
1.1 79.9% 80.1% 80.6% 80.9% 81.3% 81.9% 82.1%
1.2 78.5% 78.7% 79.2% 79.6% 80.0% 80.6% 80.8%
1.3 77.2% 77.4% 77.9% 78.4% 78.8% 79.4% 79.6%
1.4 75.9% 76.1% 76.8% 77.2% 77.7% 78.3% 78.5%
1.5 74.8% 75.0% 75.7% 76.2% 76.6% 77.3% 77.5%
1.6 73.6% 73.8% 74.6% 75.1% 75.6% 76.3% 76.5%
1.7 72.4% 72.7% 73.5% 74.1% 74.6% 75.4% 75.6%
1.8 71.3% 71.6% 72.5% 73.1% 73.7% 74.5% 74.8%
1.9 70.3% 70.6% 71.5% 72.1% 72.8% 73.6% 73.9%
2.0 69.3% 69.5% 70.5% 71.2% 71.9% 72.8% 73.1%
2.1 68.2% 68.5% 69.5% 70.2% 70.9% 71.8% 72.2%
2.2 67.1% 67.4% 68.5% 69.2% 69.9% 70.9% 71.2%
2.3 66.0% 66.3% 67.4% 68.1% 68.9% 69.9% 70.2%
2.4 64.8% 65.1% 66.2% 67.0% 67.8% 68.9% 69.2%
2.5 63.5% 63.8% 65.0% 65.8% 66.7% 67.8% 68.1%
2.6 62.1% 62.5% 63.7% 64.6% 65.5% 66.7% 67.0%
2.7 60.7% 61.1% 62.4% 63.3% 64.2% 65.5% 65.8%
2.8 59.2% 59.6% 60.9% 61.9% 62.8% 64.1% 64.5%
2.9 57.6% 58.0% 59.4% 60.4% 61.4% 62.7% 63.2%
3.0 55.9% 56.4% 57.8% 58.8% 59.9% 61.3% 61.7%
3.1 54.2% 54.6% 56.1% 57.2% 58.3% 59.8% 60.2%
3.2 52.4% 52.8% 54.4% 55.5% 56.6% 58.2% 58.6%
3.3 50.5% 50.9% 52.6% 53.7% 54.9% 56.5% 57.0%
3.4 48.4% 48.9% 50.6% 51.8% 53.0% 54.7% 55.2%
3.5 46.3% 46.8% 48.5% 49.7% 51.0% 52.7% 53.2%
3.6 44.1% 44.6% 46.3% 47.6% 48.9% 50.6% 51.2%
3.7 41.7% 42.3% 44.1% 45.4% 46.7% 48.5% 49.1%
Submitted Manuscript: Confidential
53
Rate
(mm yr-1)
2.5th
Percentile
5th
Percentile
25th
Percentile Median
75th
Percentile
95th
Percentile
97.5th
Percentile
3.8 39.5% 40.0% 41.8% 43.1% 44.5% 46.3% 46.9%
3.9 37.2% 37.7% 39.6% 40.9% 42.2% 44.1% 44.7%
4.0 34.9% 35.5% 37.3% 38.6% 40.0% 41.9% 42.5%
4.1 32.6% 33.2% 35.0% 36.3% 37.7% 39.6% 40.2%
4.2 30.4% 31.0% 32.8% 34.1% 35.4% 37.3% 37.9%
4.3 28.2% 28.8% 30.5% 31.8% 33.2% 35.0% 35.6%
4.4 26.1% 26.7% 28.4% 29.6% 31.0% 32.8% 33.3%
4.5 24.1% 24.7% 26.4% 27.6% 28.9% 30.6% 31.2%
4.6 22.3% 22.9% 24.5% 25.6% 26.9% 28.6% 29.1%
4.7 20.6% 21.2% 22.8% 23.9% 25.1% 26.7% 27.2%
4.8 19.1% 19.5% 21.1% 22.2% 23.4% 24.9% 25.4%
4.9 17.6% 18.1% 19.6% 20.6% 21.7% 23.2% 23.7%
5.0 16.2% 16.7% 18.2% 19.2% 20.2% 21.7% 22.1%
5.1 15.0% 15.5% 16.9% 17.8% 18.8% 20.3% 20.7%
5.2 13.9% 14.3% 15.7% 16.6% 17.6% 18.9% 19.3%
5.3 12.9% 13.3% 14.6% 15.5% 16.5% 17.8% 18.1%
5.4 12.0% 12.4% 13.7% 14.6% 15.5% 16.8% 17.1%
5.5 11.3% 11.7% 12.9% 13.8% 14.6% 15.9% 16.2%
5.6 10.6% 11.0% 12.2% 13.0% 13.9% 15.1% 15.4%
5.7 10.0% 10.3% 11.5% 12.3% 13.2% 14.4% 14.7%
5.8 9.4% 9.8% 10.9% 11.7% 12.5% 13.7% 14.1%
5.9 8.9% 9.2% 10.3% 11.1% 11.9% 13.1% 13.4%
6.0 8.4% 8.7% 9.8% 10.5% 11.3% 12.4% 12.8%
6.1 7.9% 8.2% 9.2% 10.0% 10.8% 11.9% 12.2%
6.2 7.5% 7.8% 8.8% 9.5% 10.2% 11.3% 11.6%
6.3 7.2% 7.4% 8.3% 9.0% 9.7% 10.8% 11.1%
6.4 6.8% 7.1% 7.9% 8.6% 9.2% 10.3% 10.6%
6.5 6.5% 6.7% 7.5% 8.1% 8.8% 9.7% 10.0%
6.6 6.2% 6.4% 7.1% 7.7% 8.3% 9.2% 9.5%
6.7 5.9% 6.1% 6.7% 7.3% 7.8% 8.7% 9.0%
6.8 5.7% 5.8% 6.4% 6.9% 7.4% 8.3% 8.5%
6.9 5.4% 5.6% 6.1% 6.5% 7.0% 7.8% 8.0%
7.0 5.3% 5.4% 5.8% 6.2% 6.7% 7.4% 7.6%
7.1 5.1% 5.2% 5.6% 5.9% 6.4% 7.1% 7.3%
7.2 5.0% 5.1% 5.4% 5.7% 6.1% 6.7% 6.9%
7.3 4.9% 5.0% 5.2% 5.5% 5.8% 6.4% 6.6%
7.4 4.8% 4.9% 5.1% 5.3% 5.6% 6.1% 6.3%
7.5 4.7% 4.8% 4.9% 5.1% 5.4% 5.8% 6.0%
7.6 4.6% 4.7% 4.8% 4.9% 5.2% 5.6% 5.7%
7.7 4.5% 4.5% 4.7% 4.8% 5.0% 5.3% 5.5%
7.8 4.4% 4.4% 4.6% 4.7% 4.8% 5.1% 5.2%
7.9 4.3% 4.3% 4.4% 4.5% 4.7% 4.9% 5.0%
8.0 4.1% 4.2% 4.3% 4.4% 4.5% 4.7% 4.9%
8.1 4.0% 4.1% 4.2% 4.3% 4.4% 4.6% 4.7%
8.2 3.9% 3.9% 4.1% 4.2% 4.3% 4.4% 4.5%
8.3 3.7% 3.8% 3.9% 4.1% 4.2% 4.3% 4.4%
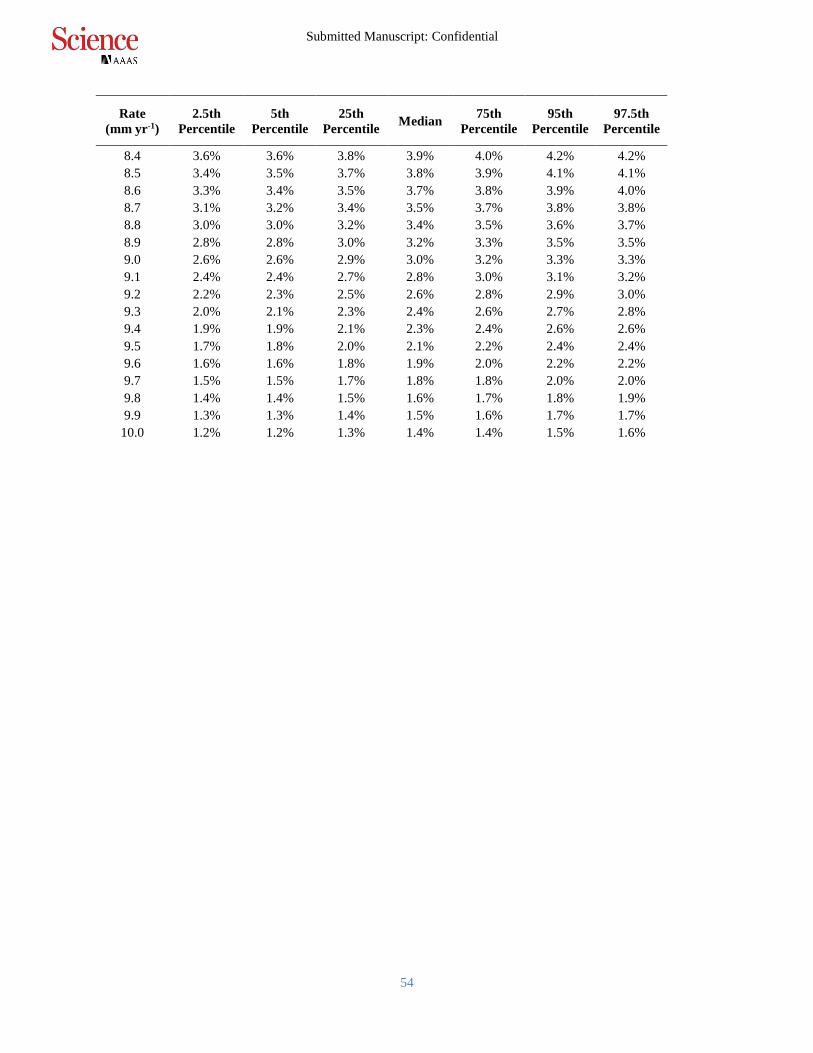
Submitted Manuscript: Confidential
54
Rate
(mm yr-1)
2.5th
Percentile
5th
Percentile
25th
Percentile Median
75th
Percentile
95th
Percentile
97.5th
Percentile
8.4 3.6% 3.6% 3.8% 3.9% 4.0% 4.2% 4.2%
8.5 3.4% 3.5% 3.7% 3.8% 3.9% 4.1% 4.1%
8.6 3.3% 3.4% 3.5% 3.7% 3.8% 3.9% 4.0%
8.7 3.1% 3.2% 3.4% 3.5% 3.7% 3.8% 3.8%
8.8 3.0% 3.0% 3.2% 3.4% 3.5% 3.6% 3.7%
8.9 2.8% 2.8% 3.0% 3.2% 3.3% 3.5% 3.5%
9.0 2.6% 2.6% 2.9% 3.0% 3.2% 3.3% 3.3%
9.1 2.4% 2.4% 2.7% 2.8% 3.0% 3.1% 3.2%
9.2 2.2% 2.3% 2.5% 2.6% 2.8% 2.9% 3.0%
9.3 2.0% 2.1% 2.3% 2.4% 2.6% 2.7% 2.8%
9.4 1.9% 1.9% 2.1% 2.3% 2.4% 2.6% 2.6%
9.5 1.7% 1.8% 2.0% 2.1% 2.2% 2.4% 2.4%
9.6 1.6% 1.6% 1.8% 1.9% 2.0% 2.2% 2.2%
9.7 1.5% 1.5% 1.7% 1.8% 1.8% 2.0% 2.0%
9.8 1.4% 1.4% 1.5% 1.6% 1.7% 1.8% 1.9%
9.9 1.3% 1.3% 1.4% 1.5% 1.6% 1.7% 1.7%
10.0 1.2% 1.2% 1.3% 1.4% 1.4% 1.5% 1.6%
Submitted Manuscript: Confidential
55
Data S1. (separate file)
Core location, initiation and completion of mangrove soil development, and rates of vertical
accretion.
5
10
15
20
25