Embed Size (px)
DESCRIPTION
Binarization Techniques
Citation preview
Thresholding(Binarization)
Idea
• Gray level Bi-tonal
• Simplest form of segmentation
• Like any segmentation, the key is how you choose the predicate P(Ri) to threshold the intensities
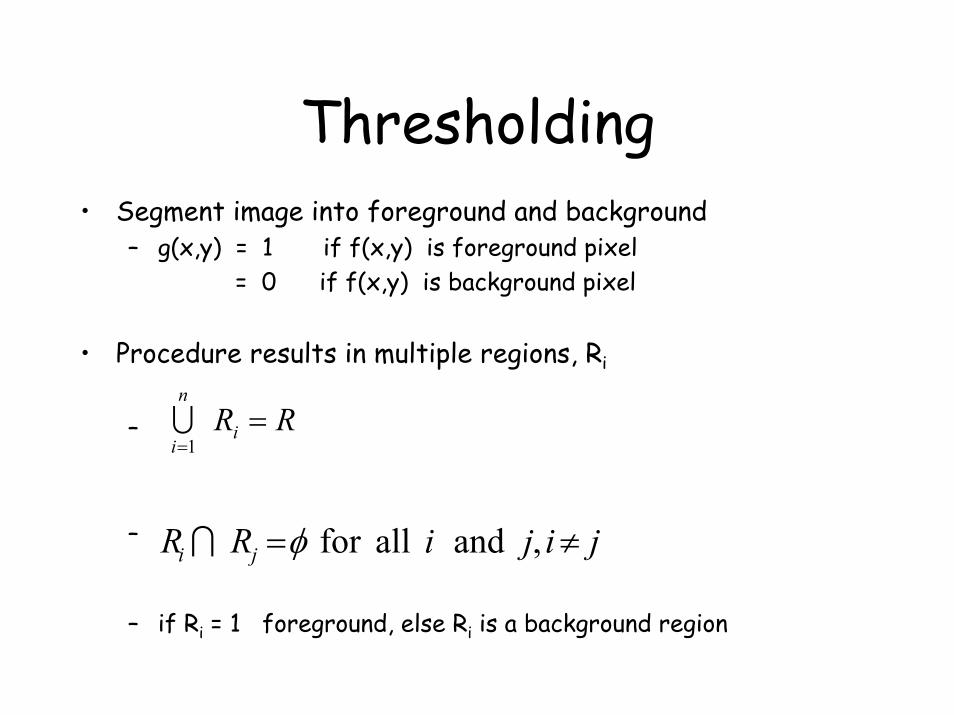
Thresholding• Segment image into foreground and background
– g(x,y) = 1 if f(x,y) is foreground pixel= 0 if f(x,y) is background pixel
• Procedure results in multiple regions, Ri
–
–
– if Ri = 1 foreground, else Ri is a background region
RRin
i=
=1U
jijiRR ji ≠= , and allfor φI
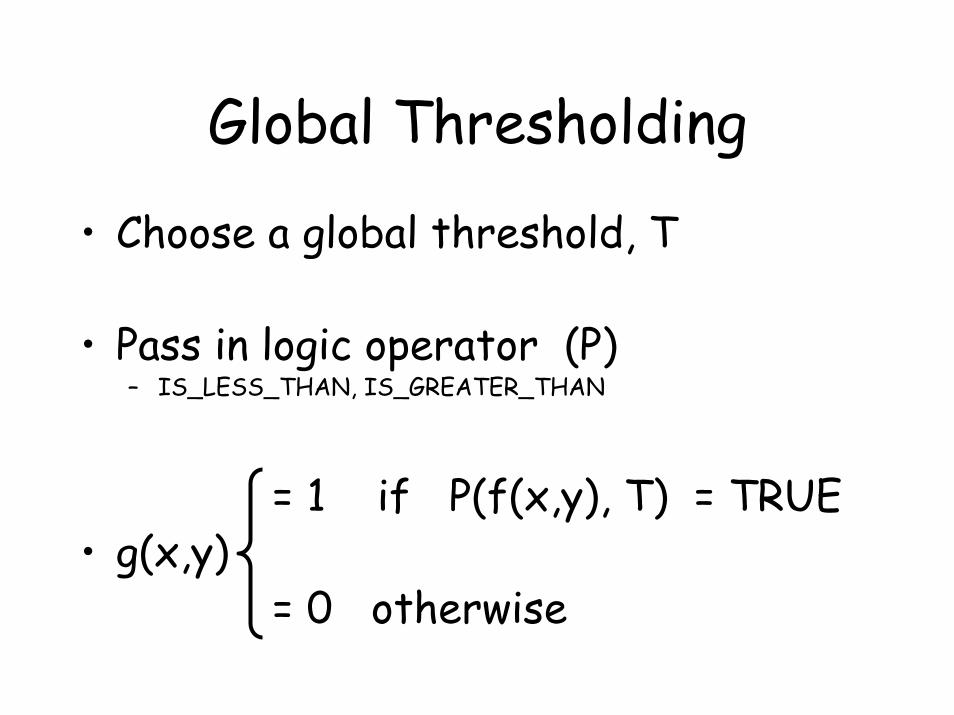
Global Thresholding
• Choose a global threshold, T
• Pass in logic operator (P)– IS_LESS_THAN, IS_GREATER_THAN
= 1 if P(f(x,y), T) = TRUE• g(x,y)
= 0 otherwise
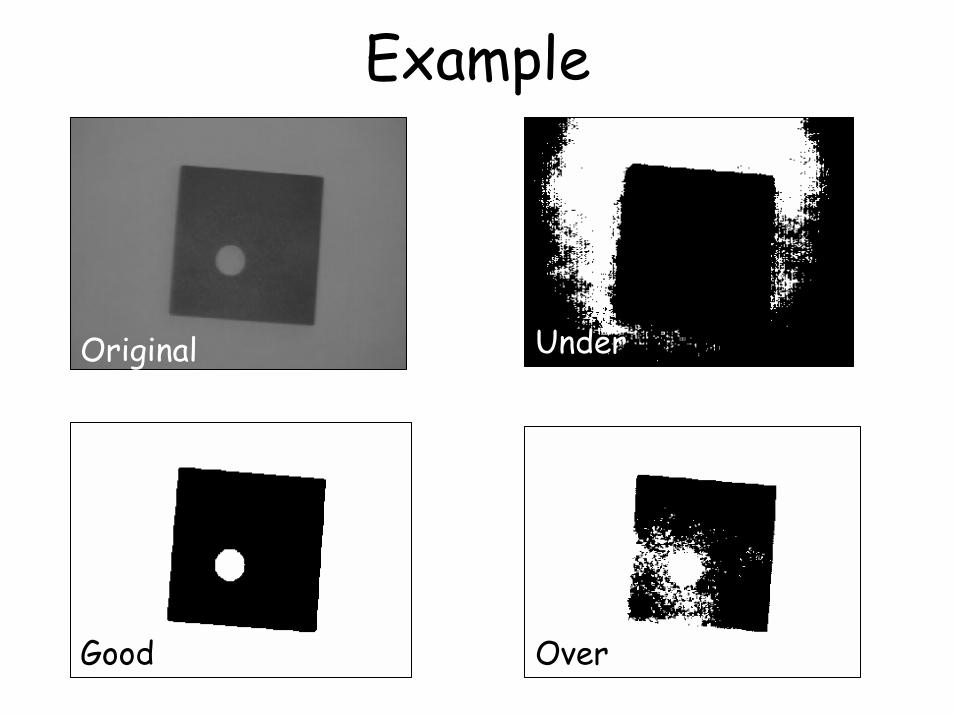
Example
Original Under
Over Good
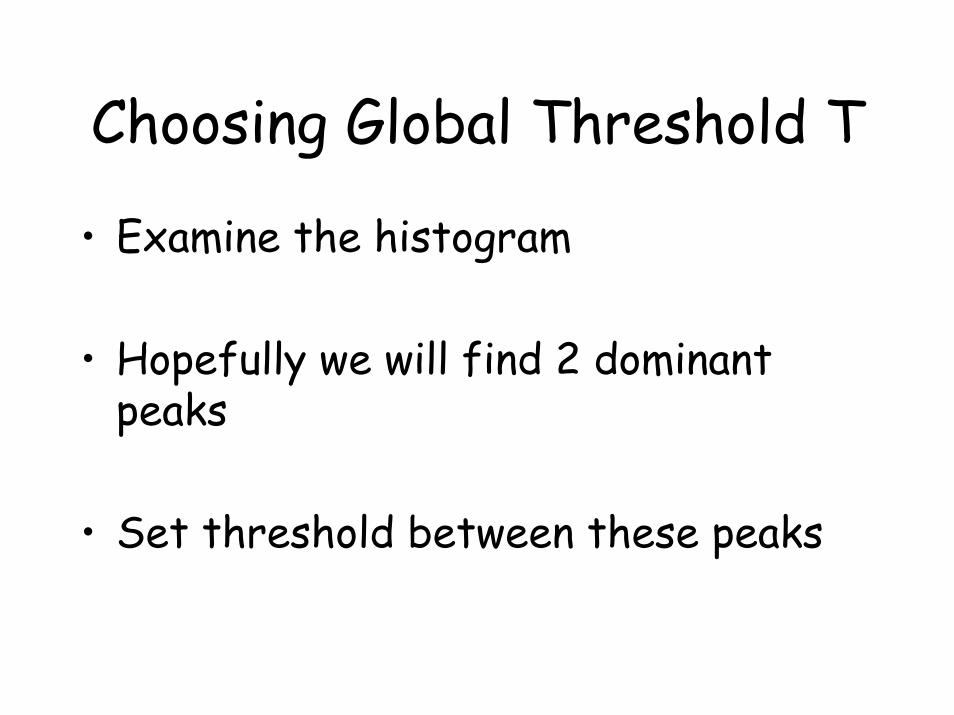
Choosing Global Threshold T
• Examine the histogram
• Hopefully we will find 2 dominant peaks
• Set threshold between these peaks
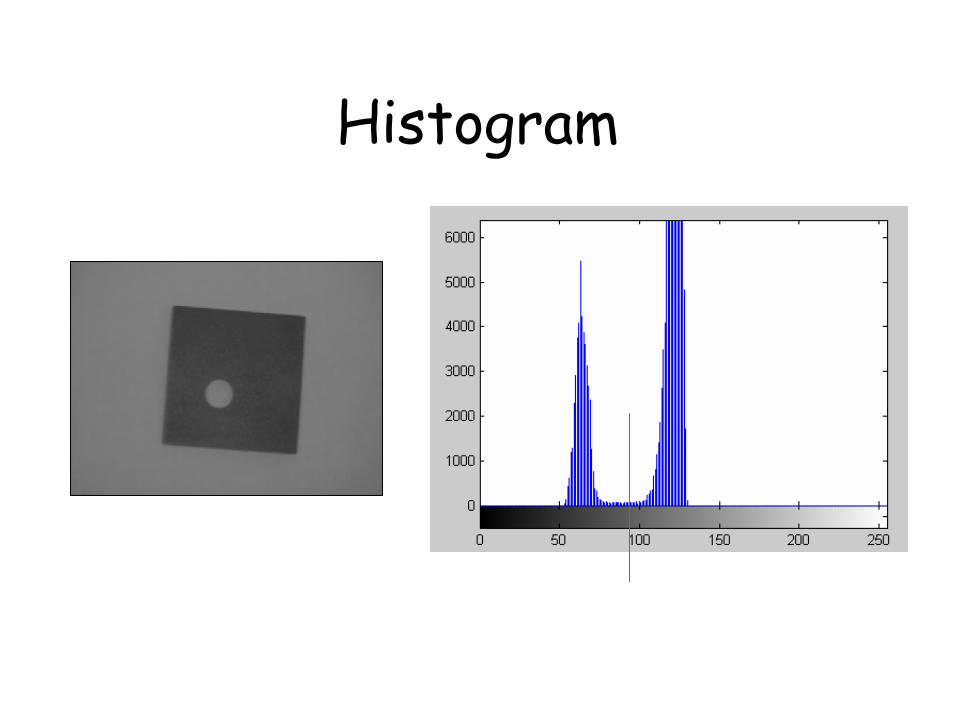
Histogram
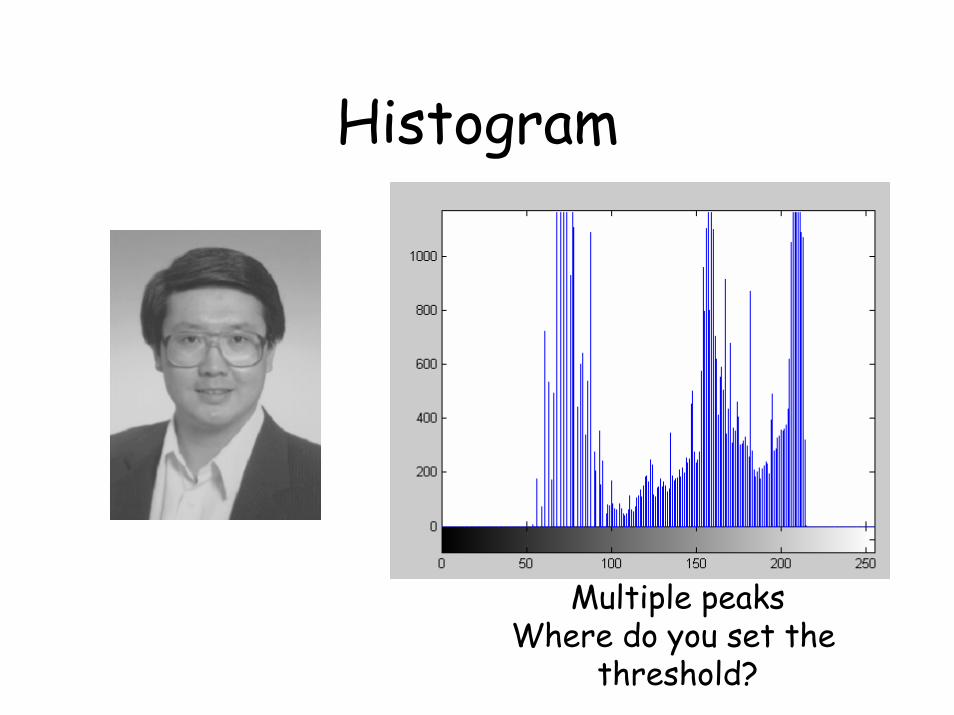
Histogram
Multiple peaksWhere do you set the
threshold?
Automatic Threshold Selection
• Why?– Automation
• Human is not always available– Repeatability
• Provides a standard approach to choosing thresholds
– For automation• Others can reproduce your results
– In research, this is important– Often overlooked!
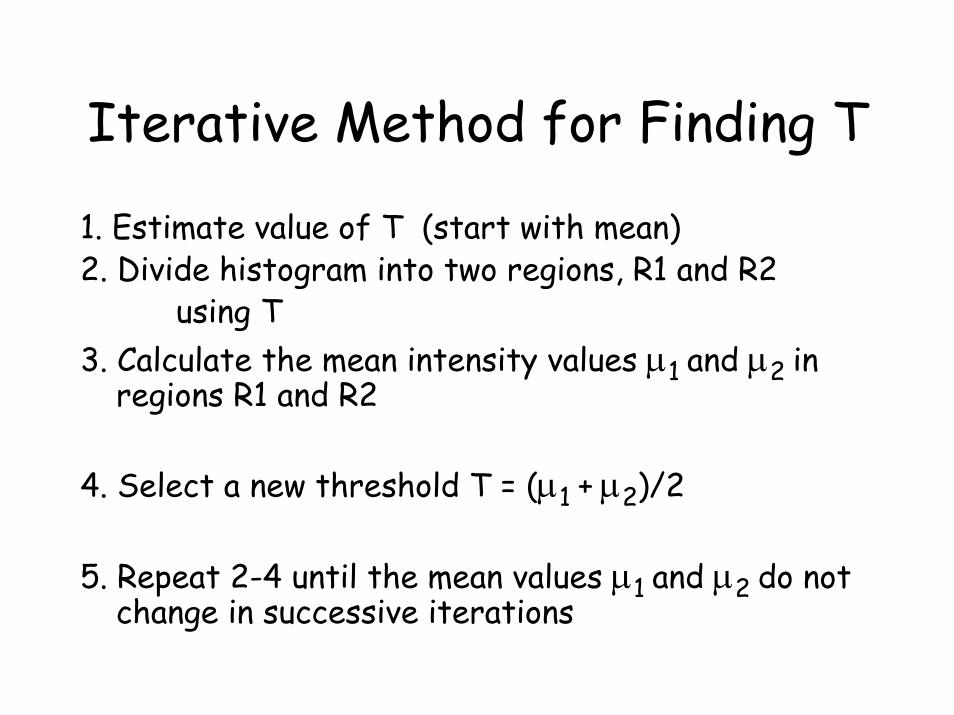
Iterative Method for Finding T
1. Estimate value of T (start with mean)2. Divide histogram into two regions, R1 and R2
using T3. Calculate the mean intensity values μ1 and μ2 in
regions R1 and R2
4. Select a new threshold T = (μ1 + μ2)/2
5. Repeat 2-4 until the mean values μ1 and μ2 do not change in successive iterations
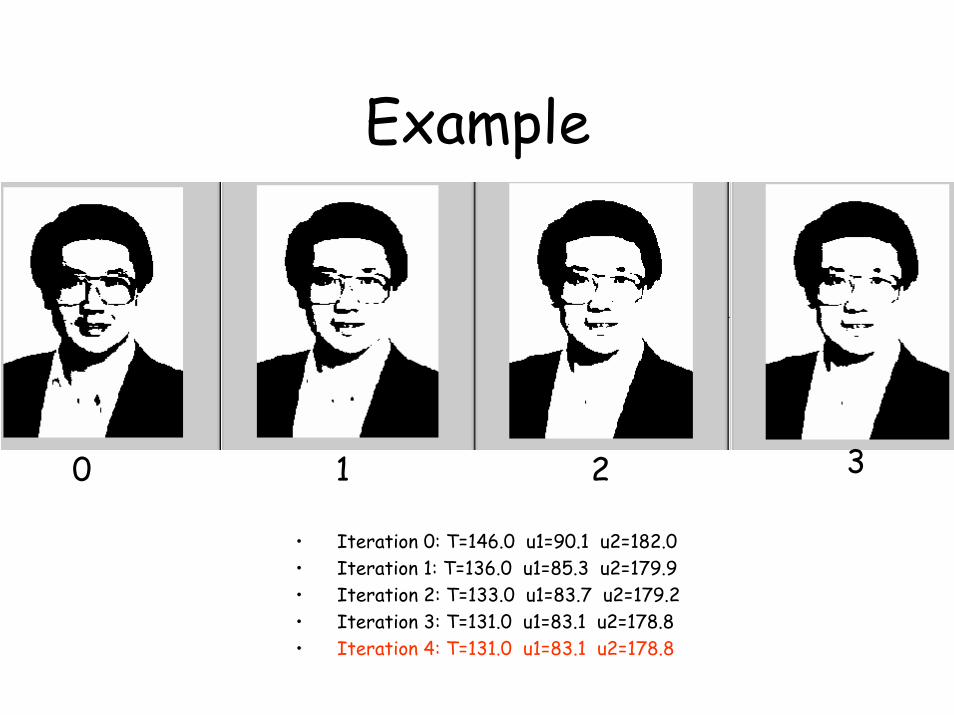
Example
• Iteration 0: T=146.0 u1=90.1 u2=182.0 • Iteration 1: T=136.0 u1=85.3 u2=179.9 • Iteration 2: T=133.0 u1=83.7 u2=179.2 • Iteration 3: T=131.0 u1=83.1 u2=178.8 • Iteration 4: T=131.0 u1=83.1 u2=178.8
0 1 2 3
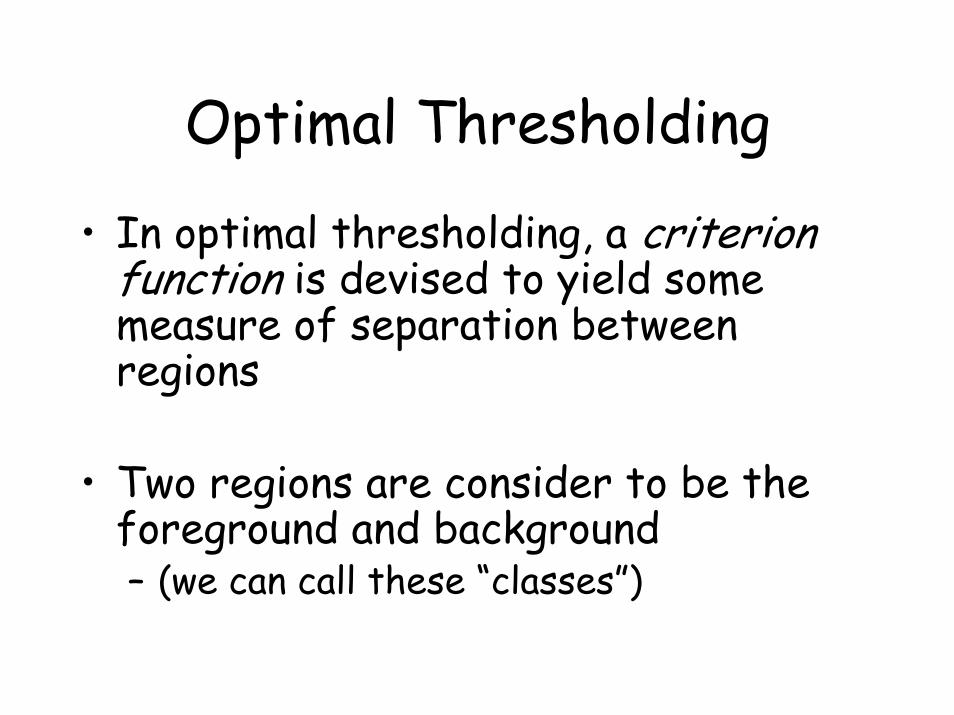
Optimal Thresholding
• In optimal thresholding, a criterion function is devised to yield some measure of separation between regions
• Two regions are consider to be the foreground and background– (we can call these “classes”)
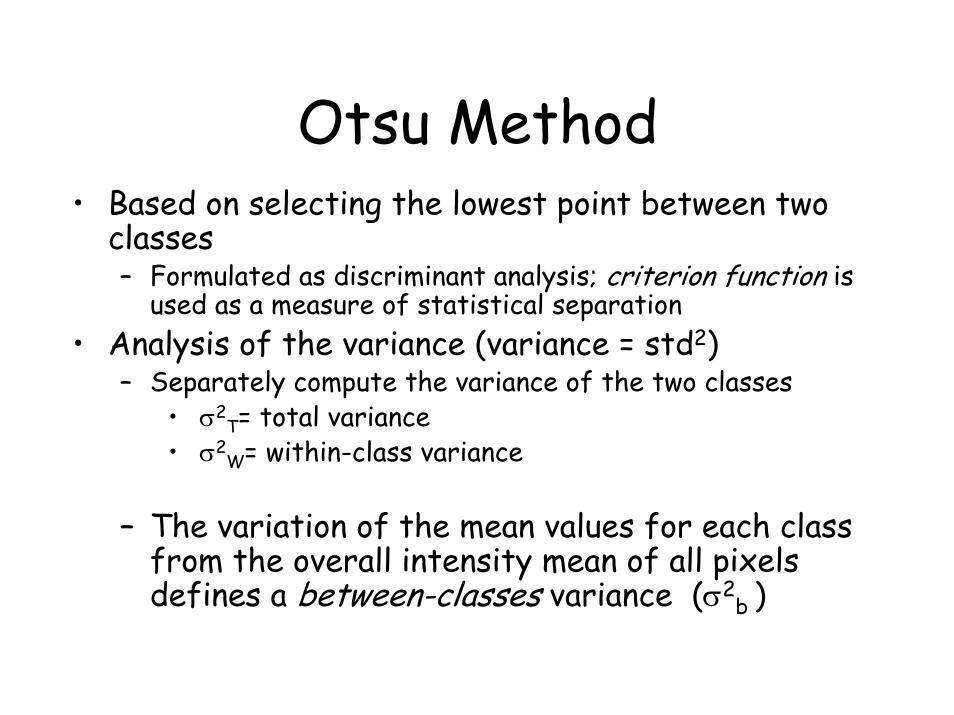
Otsu Method• Based on selecting the lowest point between two
classes– Formulated as discriminant analysis; criterion function is
used as a measure of statistical separation• Analysis of the variance (variance = std2)
– Separately compute the variance of the two classes• σ2
T= total variance• σ2
W= within-class variance
– The variation of the mean values for each class from the overall intensity mean of all pixels defines a between-classes variance (σ2
b )
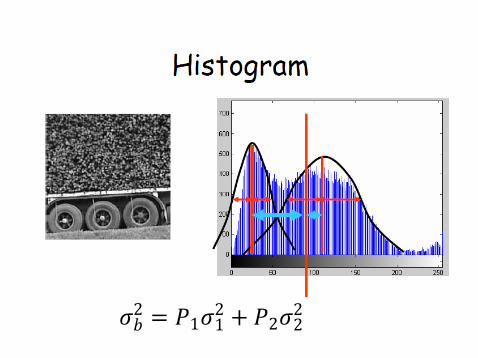
𝜎𝑏2 = 𝑃1𝜎12 + 𝑃2𝜎2
2
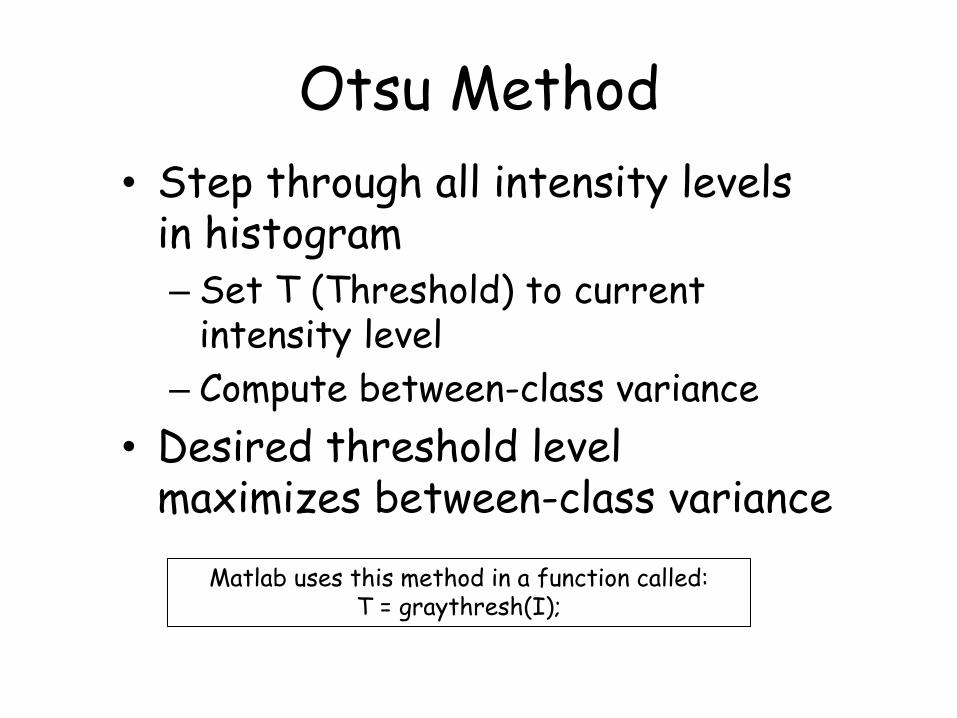
Otsu Method
• Step through all intensity levels in histogram – Set T (Threshold) to current
intensity level
– Compute between-class variance
• Desired threshold level maximizes between-class variance
Matlab uses this method in a function called: T = graythresh(I);
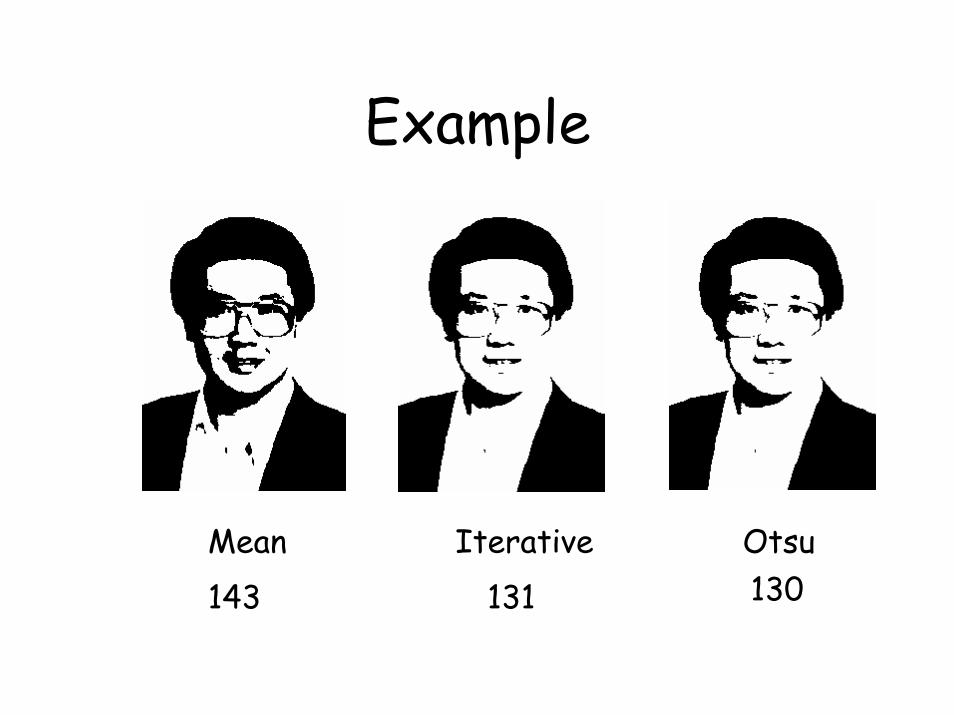
Example
Mean Otsu131
Iterative143 130
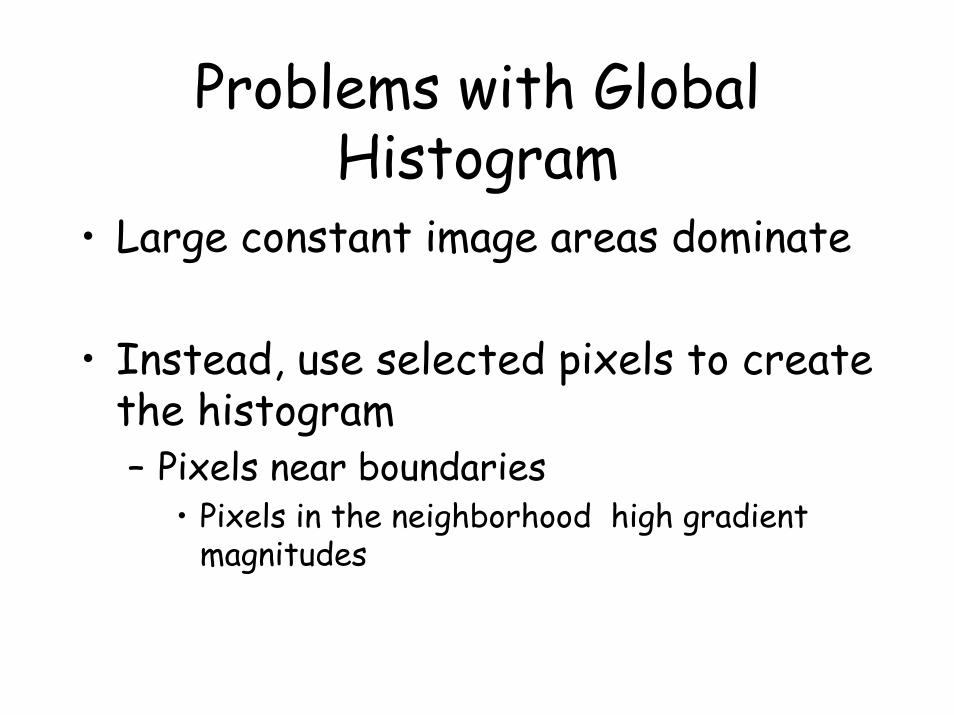
Problems with Global Histogram
• Large constant image areas dominate
• Instead, use selected pixels to create the histogram– Pixels near boundaries
• Pixels in the neighborhood high gradient magnitudes
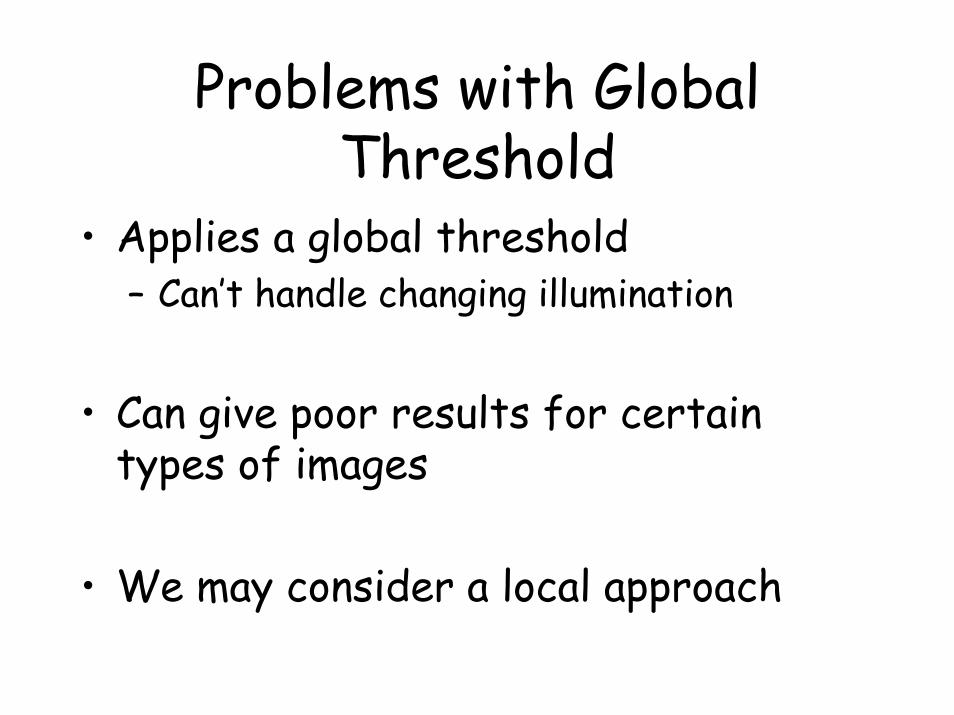
Problems with Global Threshold
• Applies a global threshold– Can’t handle changing illumination
• Can give poor results for certain types of images
• We may consider a local approach
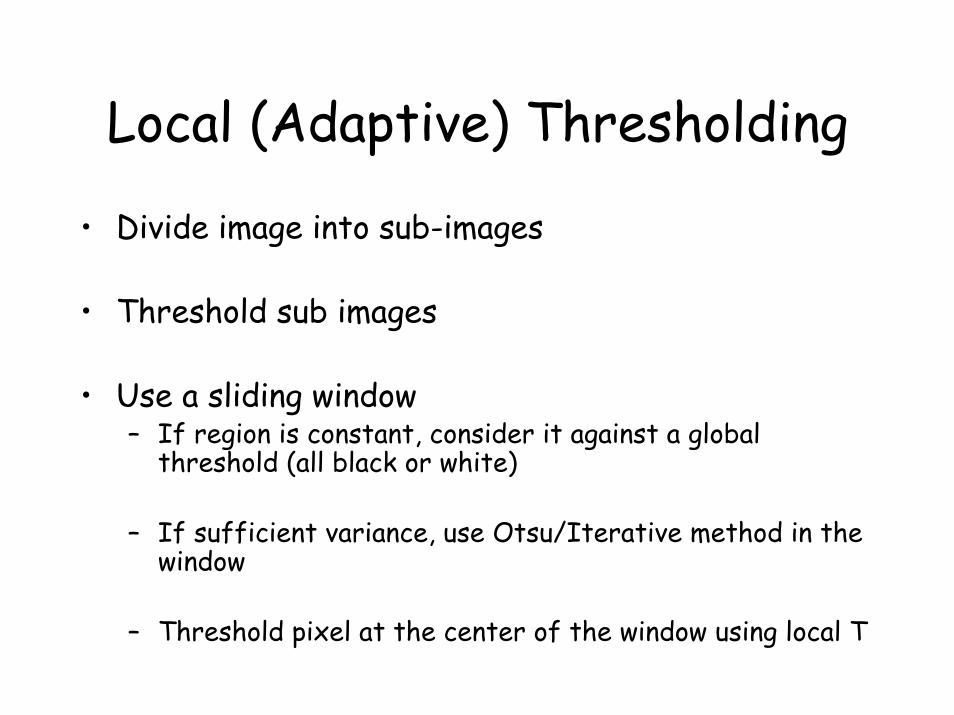
Local (Adaptive) Thresholding
• Divide image into sub-images
• Threshold sub images
• Use a sliding window – If region is constant, consider it against a global
threshold (all black or white)
– If sufficient variance, use Otsu/Iterative method in the window
– Threshold pixel at the center of the window using local T
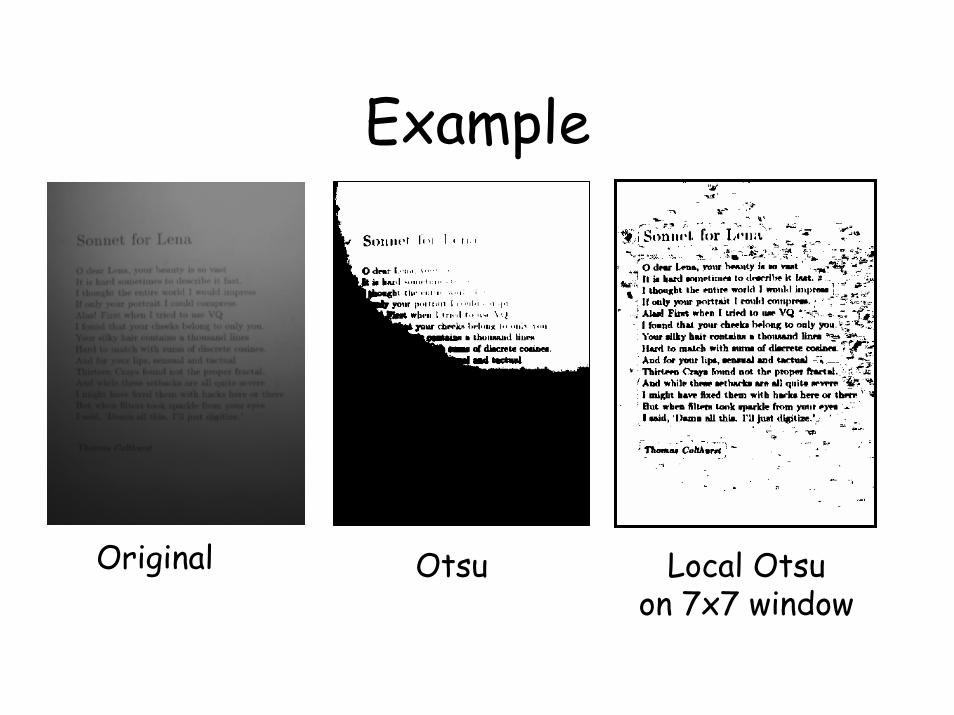
Example
Original Otsu Local Otsuon 7x7 window
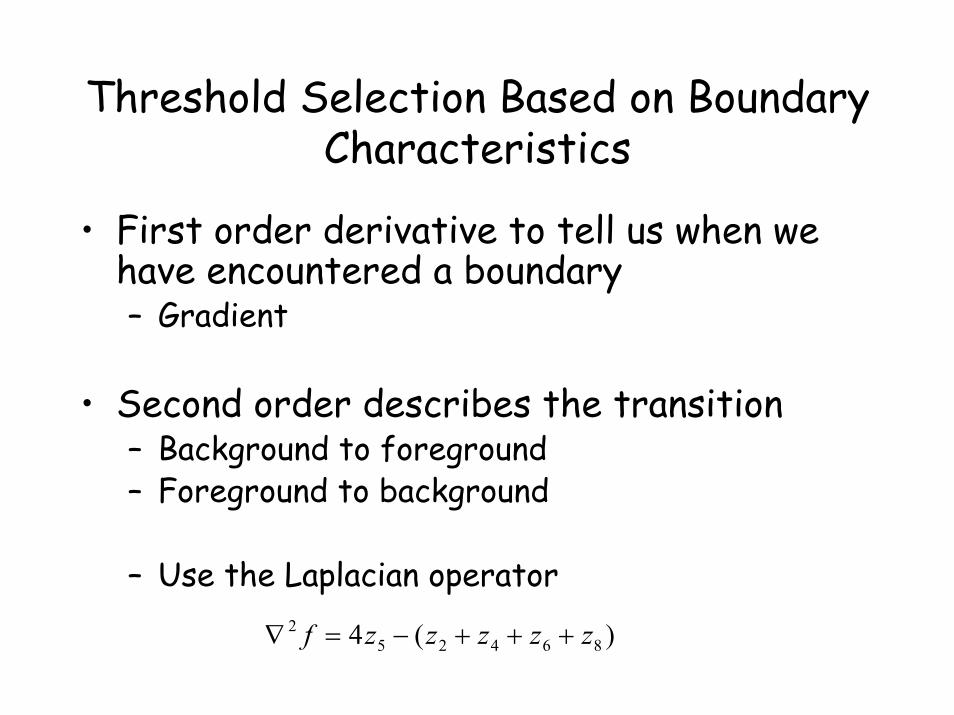
Threshold Selection Based on Boundary Characteristics
• First order derivative to tell us when we have encountered a boundary– Gradient
• Second order describes the transition– Background to foreground– Foreground to background
– Use the Laplacian operator
)(4 864252 zzzzzf +++−=∇
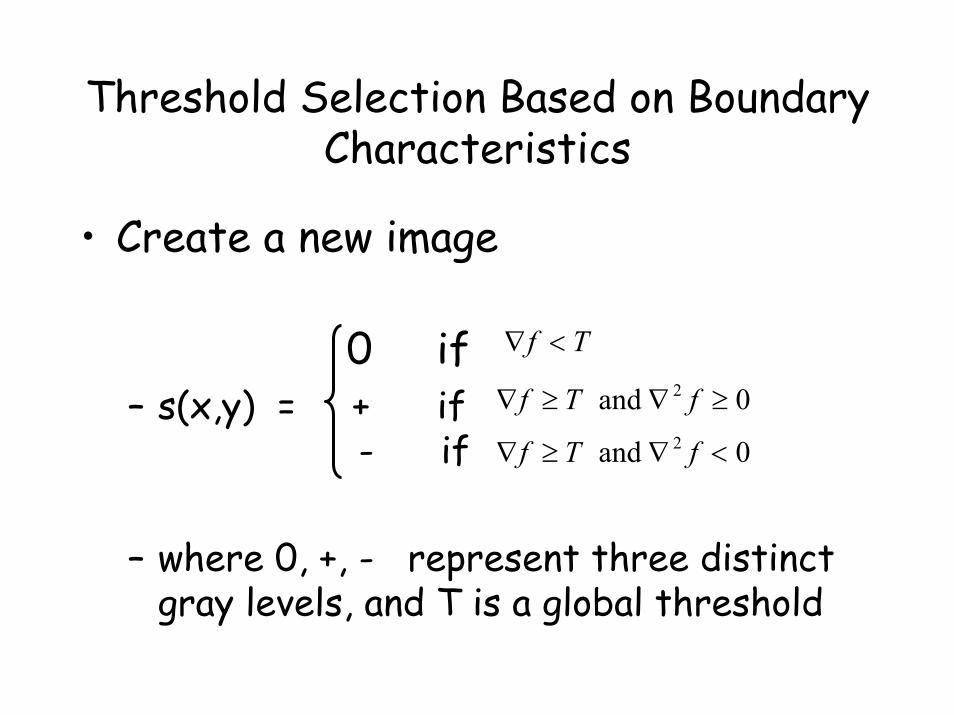
• Create a new image
0 if – s(x,y) = + if
- if
– where 0, +, - represent three distinct gray levels, and T is a global threshold
Tf
Threshold Selection Based on Boundary Characteristics
<∇
0 and 2 ≥∇≥∇ fTf
0 and 2 <∇≥∇ fTf
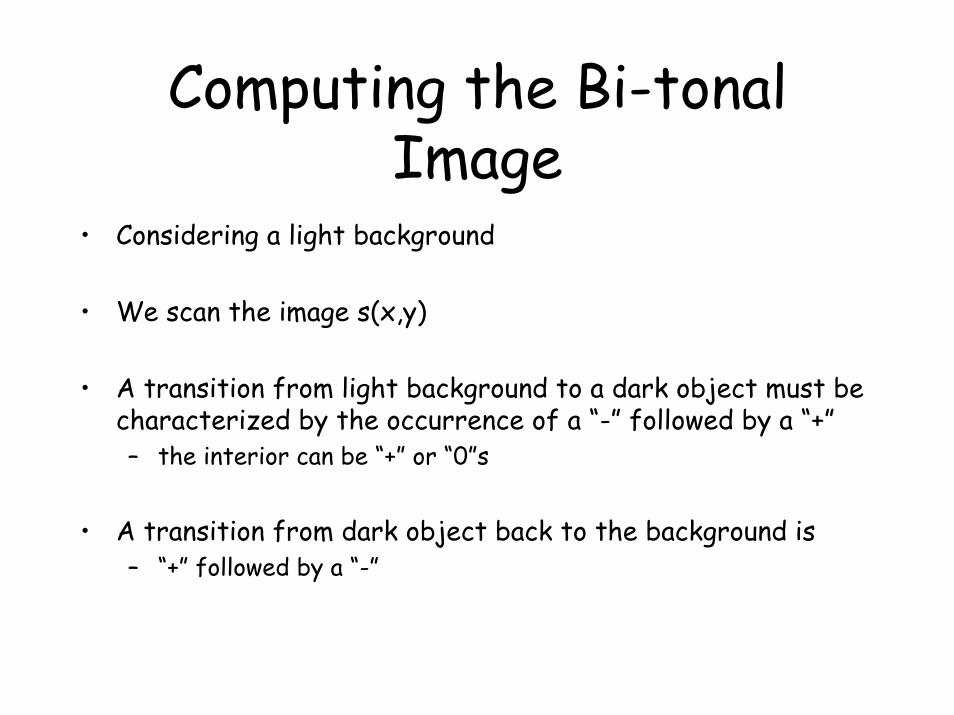
Computing the Bi-tonal Image
• Considering a light background
• We scan the image s(x,y)
• A transition from light background to a dark object must be characterized by the occurrence of a “-” followed by a “+”– the interior can be “+” or “0”s
• A transition from dark object back to the background is– “+” followed by a “-”
Computing the Bi-tonal Image
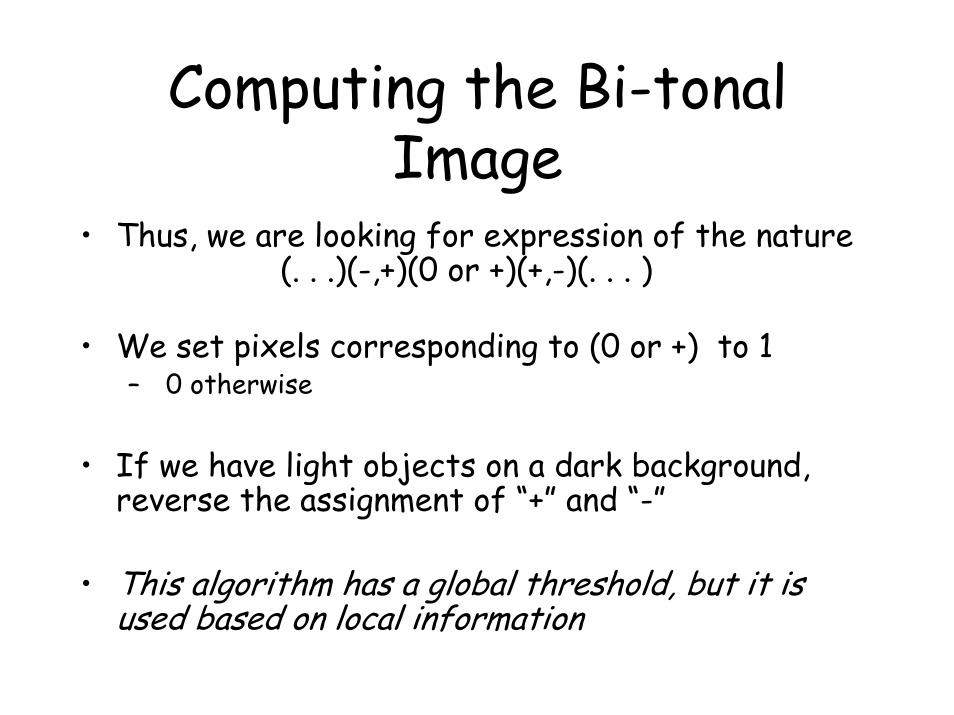
• Thus, we are looking for expression of the nature(. . .)(-,+)(0 or +)(+,-)(. . . )
• We set pixels corresponding to (0 or +) to 1– 0 otherwise
• If we have light objects on a dark background, reverse the assignment of “+” and “-”
• This algorithm has a global threshold, but it is used based on local information
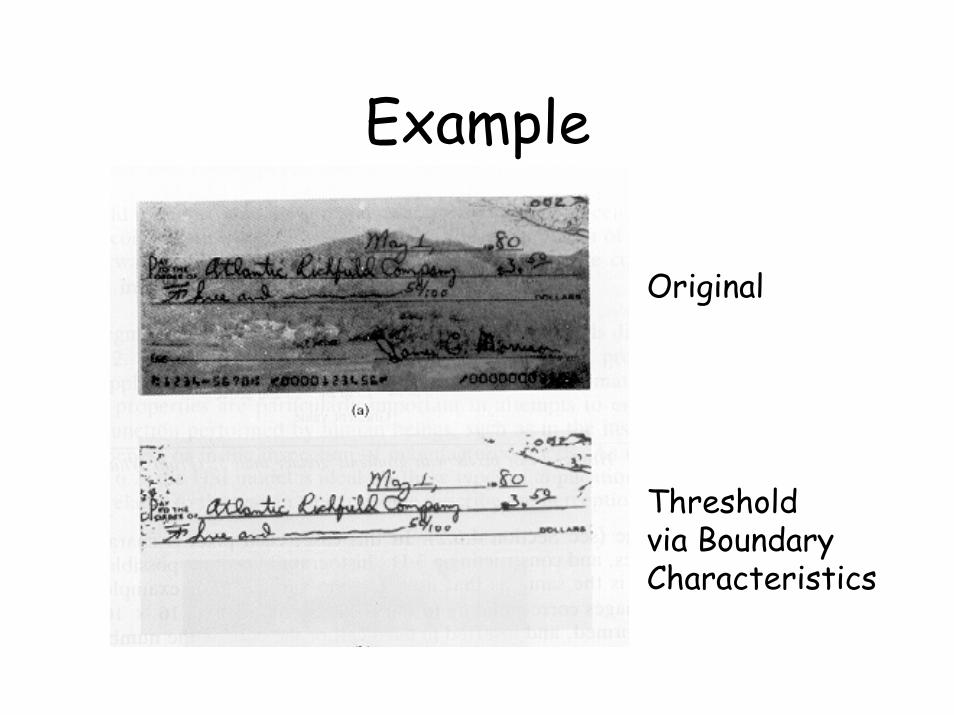
Example
Original
Thresholdvia BoundaryCharacteristics
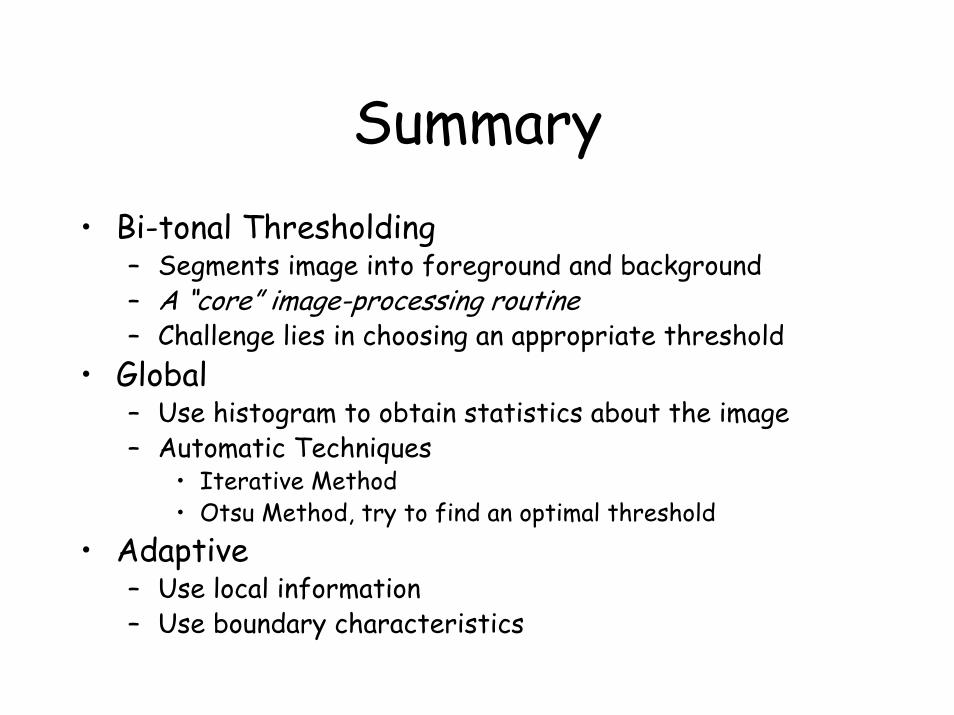
Summary• Bi-tonal Thresholding
– Segments image into foreground and background– A “core” image-processing routine– Challenge lies in choosing an appropriate threshold
• Global– Use histogram to obtain statistics about the image– Automatic Techniques
• Iterative Method• Otsu Method, try to find an optimal threshold
• Adaptive – Use local information – Use boundary characteristics