Embed Size (px)
Citation preview

Three Reasons Why Petrologists Should Study Compaction
J. Connolly, ETH Zurich

What is compaction driven fluid flow?
expe lled flu id andm elt
D ep thro ckflow
flu idflow
reac tion -gene ra ted flu idand po rosity

Objectives
• Provide a conceptual understanding of porosity waves in a viscous rock matrix
• Insights from compaction on melt extraction at mid-ocean ridges

A simple model for regional metamorphism
e x p e l l e d f l u i d a n dm e l tD e p t h r o c kf l o wf l u i df l o wr e a c t i o n - g e n e r a t e d f l u i da n d p o r o s i t y
P o ro s ity
Dep
th
F lu id P re s su re
rea c tio n f ro n tp o re d ila tio n
p o re c o m p ac tio n
rea c tio n f ro n t
d ee p -se a te dh ea t so u rc e

What happens with time?
F lu id d ru c kP o ro s itä t
Tie
fe
R ea k tio n sfro n t
t= 1
t= 2
t= 3so litä re W elle n

Numerically computed porosity and pressure profiles above a metamorphic dehydration front
T im e (M y )
5 0 M P a
o v e rp re s su reu n d e rp re ssu re
P re s su re a n o m aly
2 0
1 6
2 4 6 8 1 0
1 2
1 6
1 2
8
4
0
4
0
8
2 0
5 %
P o ro s ity
p o ro s ityso lita ry w a v e
Dep
th (
km)
Dep
th (
km)
R ea c tio n f ro n t
Birth of the Blob Modelor
Fluid Flow through a 2D Rock Matrix with Constant Viscosity
Dep
th
P o rosity, = 010t
/ m a x 0
t= 3 .3 50
/m a x 0
t=10 0
3 .3 / m a x 0
2 km
10
2 km
10
In itia l cond itio n 1D M ode l 2D M ode l, B irth o f th e “B lob”
B lo b s a re b ig g e r, fa s te r a n d b e tte r lo o k in g .
· Length scale for fluid flow ~

Tod des Blobsoder
Fluidfluss durch eine sich aufwärts verstärkende Matrix
initial Störungen/ 0 = 10
Spherische StörungPorosität um = 22.5 0 (18 M j)/ 10 t t m a x 0 S inusform ige StörungPorosität um = 0 .5 0 (0 .4 M j)/ 50 t t m a x 0starke D eckschicht
in itia l S tö ru ngen/ 0 = 10
S ph erische S tö ru ngP orositä t um = 2 2 .5 0 (1 8 M j)
/ 10t t
m a x 0
S inusfo rm ig e S tö run gP orositä t um = 0 .5 0 (0 .4 M j)
/ 50t t
m a x 0
sta rk e D eck sch ich t

Has anyone ever seen a porosity wave?Porosity (%)250
3
Depth (km)
fluid compartment(oil und gas)
sedimentvelocity
$-drivenfluid flow
stationarycompaction-front
50
P orosity (% )25
0
3
Dep
th (
km)
f lu id co m partm en t(o il u nd gas)
sed im en tve locity
$ -d riv e nf lu id f lo w
sta tio narycom paction -fron t
50
Sedimentary Basin Compaction

Pannonian basin
P o ro s itä ts-P ro fil de s P ann o n isch en B eck ens
T
iefe
(km
)
P o ro sitä t (% )
4
2
0
5 1 5 2 5
A thy
G au ss (ko n s tan te G este in sv isk o sitä t)
P ann o n isch es B eck en
M o d e ll
D ieses R esu lta t häng t in e rs ter L in ie nu r v on de r
R h eo lo g ie un d d ie ab , d .h ., da s
E ndp ro fil is t un ab häng ig vo n S ed im en t-
P e rm eab ilitä t.
S ed im en ta tion rate

Inverse analysis of sedimentary compaction profiles for pressure solution creep parameters
S h a le sS an d s to n e s
1 5 0 0 2 0 0 0 2 5 0 0 (m ) z
1 0
2 0
3 0
4 0
2 0 .5
2 1 .5
2 2 .5
^^
Q̂ (
kJ/m
ol)
log(
[Pa-
s])
m
-2
0
2

Lateral flow during regional metamorphism?
A World Where Fluids Flow Upward => Mid-Ocean Ridges
How does melt produced during mantle upwelling get focused at mid-ocean ridges?
How can highly incompatible short-lived isotopes be fractionated and preserved in MORB?

A World Where Fluids Flow Upward => Mid-Ocean Ridges
How does melt produced during mantle upwelling get focused at mid-ocean ridges?
How can highly incompatible short-lived isotopes be fractionated and preserved in MORB?
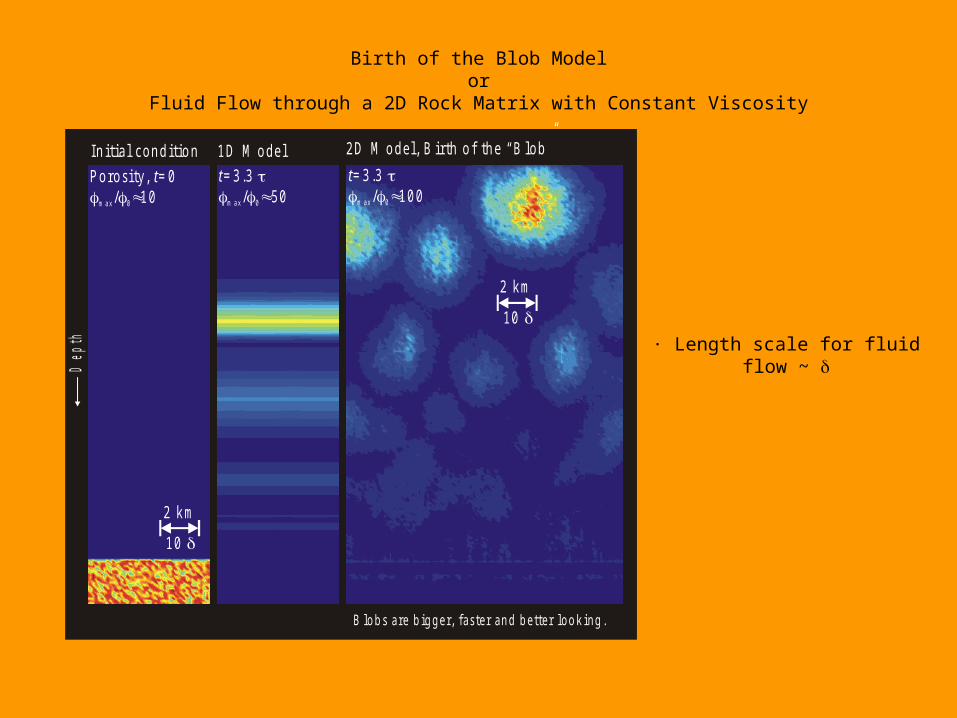
How does melt get to the ridge?
C o rn e r F lo w S u c tio n E ffe c t
G o o d N e w s
F i ts m o s t g eo c h e m ic a l a n d g e o p h y s ic a l c o n s t ra in ts .
B a d N e w s
R e q u ire s h ig h m a n tle v is c o s ity ( > 1 0 P a -s ) . 21
L ith o s p h e r ic C h a n e llin g
G o o d N e w s
A s fo r c o rn e r f lo w .
B a d N e w s
E x p e c te d p a tte rn s n o t o b se rv e d in o p h io lite s .
M a n tle B u o y a n cy
G o o d N e w s
T h e o re t ic a lly ju s tif ie d .
B a d N e w s
P o o r m a tc h fo r g e o c h e m ic a l a n d g e o p h y s ic a ld a ta .
R e q u ire s lo w m a n tle v is c o s ity ( < 1 0 P a -s ) . 19

Steady State
Ridge Axis
Norm alized crustal th ickness
M O R Stead y Sta te ( = 1 8 % , = 9 % , = 1 cm /y, = 1 0 P a -s ) f f Wmax avg20

What was wrong?
P r e v i o u s m o d e l s
f t o t a lp p
d0
d t
p y S y
2
2 2
2a
US
L g
S t e a d y s t a t e p o r o s i t y e v o l u t i o n e q u a t i o n
fd0
dm p p
t
fmp y S y M
3
2 c c
sa
U LM
L g

M eltin g
100-
150
km10-10000 y
M id -O ce an R id g e S u b d u c tio n Z o n es
Fast Fluid Transport in Ductile Rocks
600-6000 y
40 0 transport0.1% 10 km y 1Myv
transport transport0.1km y 3%v

Initial State

Final State

Return of the Blob
Final State

Conclusion
The combination of models suggested here can reconcile the geochemical signature of MOR basalts, with the possible exception of near surface matrix-melt disequilibrium.
Reports of the death of the porosity wave model are premature and premised on a rheological model that is almost certainly false.

Viscoelastic porosity wave model for Pannonian Basin sediments
p seu d o e lastic tre n d
P a n n o n ia n tren d
b) P a n n o n ia n sa n d s to n es
(% )0 5 1 0 1 5 2 0 2 5
(% )1 0 1 5 2 0 2 50 5
z (k
m)
4
3
2
1 h y d ra u lic
v isc o u s in v erse m o d e l
v isc o u s in v erse m o d e lv isc o e las tic in v e rse m o d e l
v isc o e las tic in v e rse m o d e l
p seu d o e lastic tre n d
P a n n o n ia n tren d
v isc o e las tic f it
v isc o e las tic f it
a) P a n n o n ia n sh a les

Viscoplasticity
Viscous porosity waves are propagated by high fluid pressures. Under such conditions rocks even ductile rocks will deform plastically.
ov erp re ssu re
un de rp re ssu re
w eak
strong
pressu re in a v isco us b lob
schw ach e D eck sch ich t
2D P lastiz itä t
F lu id flu ssfok ussieru ng
sta rk e D eck sch ich t
2D Viskositä t
F lu id flu ssd ispe rs io n

Morb the Movie
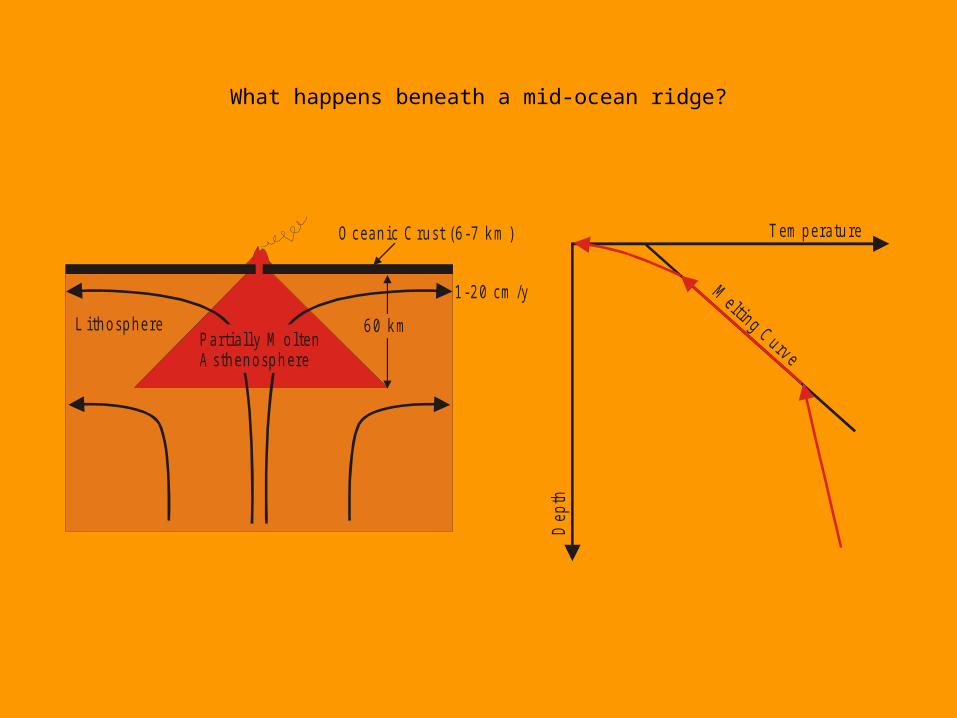
What happens beneath a mid-ocean ridge?
P a r tia lly M o l te nA s th e n o s p h e re
6 0 k mL ith o s p h e re
1 -2 0 cm /y
O c e a n ic C ru s t (6 -7 k m ) Tem p e ra tu re
Dep
th
Meltin g C u rv e

What next?
c a rb o n a te s+ h y d ra te s
M e ltin g
S u b d u c tio n Z o n e s
H O + C O2 2
H O + C O2 2
In f il tra t io n -d riv e n d ec a rb o n a tio n
Composition and depth of devolatilization => global volatile budget, deep seismicity
Amount of pore fluid => subduction zone seismic structure
C o m p u te d P h a s e R e la tio n s , S e is m ic Ve lo c itie s
P l S a Bt C rd
P l Ms G rt B
t s il
P l Chl B
t Ms
P l Ms B t C
rd
C h l P l M s K fs
Ch l P l M s Ms Chl Ep ab
P l Ms Amph C
h l
C h l E p M s P g ab
Ms E
p Pg A
mph Chl Am
ph Pg C
hl Ms l
ws
M s Pg Ch l Amph
Am ph G rt M s Pg
Amph P
g Ms
Grt
P l
P l Bt M
s G rt
Pg A
mp
h Chl G
rt Ms
Ch l
Ms
Pg
lws
6
72
8
3
9
4 5
1 0
12
1 4
0 .5
1 .0
1 .5
4 00 5 00 T (° C )
P(G
pa)
0 .5
1 .0
1 .5
4 00 5 00 T (° C )
P(G
pa)
11
1 3
1

Model Formulation
I n c o m p r e s s i b l e c o r n e r f l o w s o l u t i o n f o r v e l o c i t y 1 ,v U f x y
M e l t i n g r a t e p r o p o r t i o n a l t o v e l o c i t y
, , 2aL
m e l tm e l t c c m e l t c c a
x ya
mv m v d x d y U L m L L
L
T o t a l p r e s s u r e i s l i t h o s t a t i c + c o r n e r f l o w e f f e c t
2g ,p y U f x y
V i s c o u s c o m p a c t i o n , i n c o m p r e s s i b l e s o l i d a n d m e l t
fp pv
M e l t f l o w b y D a r c y ’ s l a w , n e g l i g i b l e a d v e c t i o n
C o n s e r v a t i o n o f t o t a l m a s s a n d s o l i d m a s s
d
d 1
mfp p
t
1 1g fn m
f ff
p pkp

What next?
Experimental and microscopic models to characterize differential compaction rheology
The mantle wedge

• The models assumed constant porosity and lithostatic melt pressure.
• Lithostatic melt pressure is fundamentally inconsistent with expulsion.
• Variations in porosity, and therefore permeability, may cause significant focusing.
• To assess these effects it is essential to account both for the process that creates porosity (melting) and destroys it (compaction).
What was wrong with previous models of the corner flow effect?

What next?
Dynamic modelling of the matrix deformation, thermal controls of melting rates, and melt advection => details of the focusing
Ergo
The corner flow pressure effect is not dependent on the mantle viscosity and is capable of explaining extraction of asthenospheric melts at mid-ocean ridges
What next?
Evaluate the influence of the mantle compressibility on the strength of the pressure effect => future work?
Consider details necessary to explain geochemical peculiarites of MORB => next slide.

What is wrong with “conventional” porosity waves?
•Require high initial porosity to nucleate, but there is no Th/U fractionation at high porosity
•Unlikely to propagate at velocities > 3 v0
•Based on an inappropriate rheological model

So what point am I trying to make?
The first order control on the time and length scales of fluid flow in many petrologic systems is mechanical. To attempt to understand such processes solely through the study of petrological and geochemical tracers is like wagging a dog by its tail.
m e tam o rp h ic f lu id f lo w
Lateral flow during regional metamorphism?

What causes the pressure difference?
S t a t i c p r e s s u r e d e n s i t y .
V i s c o u s r h e o l o g y f l u i d t o t a l
r o c k
p pdv
d t
P ressu re
m echan ical equ ilib riu m
flu id p re ssu re
ro ck p re ssu reD
epth
f lu id -o verp re ssu re d ila tio n
flu id -u nde rp ressu re com pactio n