Embed Size (px)
Citation preview

Texas A&M International University Texas A&M International University
Research Information Online Research Information Online
Theses and Dissertations
6-15-2021
Three Essays on Syndicated Loan Three Essays on Syndicated Loan
Zhenyu Hu
Follow this and additional works at: https://rio.tamiu.edu/etds
Recommended Citation Recommended Citation Hu, Zhenyu, "Three Essays on Syndicated Loan" (2021). Theses and Dissertations. 130. https://rio.tamiu.edu/etds/130
This Dissertation is brought to you for free and open access by Research Information Online. It has been accepted for inclusion in Theses and Dissertations by an authorized administrator of Research Information Online. For more information, please contact [email protected], [email protected], [email protected], [email protected].

THREE ESSAYS ON SYNDICATED LOAN
A Dissertation
by
Zhenyu Hu
Submitted to Texas A&M International University
in partial fulfillment of the requirements
for the degree of
DOCTOR OF PHILOSOPHY
December 2018
Major Subject: International Business Administration

THREE ESSAYS ON SYNDICATED LOAN
A Dissertation
by
Zhenyu Hu
Submitted to Texas A&M International University
in partial fulfillment of the requirements
for the degree of
DOCTOR OF PHILOSOPHY
Approved as to style and content by:
Chair of Committee, Ken Hung
Committee Members, Antonio J Rodriguez
George R.G. Clarke
Jui-Chin Chang
Head of Department, Steven Sears
December 2018
Major Subject: International Business Administration

iii
ABSTRACT
Three Essays On Syndicated Loan (December 2018)
Zhenyu Hu, M.S., University at Buffalo, SUNY;
Chair of Committee: Dr. Ken Hung
Syndicated loans have become common around the world and are used frequently
for various corporate purposes. The growth of syndicated loans has been phenomenal. This
dissertation explores topics on syndicated loan market.
The first chapter examines how firm’s corporate social responsibilities affect
syndicated loan structure. Using two different measures of syndicate structure (proxies by
lead bank share and Herfindahl-Hirschman index (HHI)) and corporate social
responsibility (CSR) score as our main independent variable, I find loan syndicates are less
concentrated when the borrower is more socially responsible. Specifically, a one standard
deviation increase in the CSR score is associated with a 0.06 standard deviation decrease
in the lead lender share. The results are robust to using an instrumental variable and
alternative CSR measurements.
The second chapter provides new evidence on the role of physical distance between
bank and bank regulator in syndicated loan structure. The geographical distance is used as
a proxy of the information asymmetry and the cost of soft information collection in
literature. A shorter lender-regulator distance indicates a more effective regulator
supervision on lenders because of reduced information asymmetries between lenders and

iv
regulators. My results provide evidence on how the lender-regulator distance affect
syndicated loan structure. Specifically, a one standard deviation increase in the lender-
regulator distance is associated with a 0.08 standard deviation increase in the lead lender
share. That is, syndicated loan structure is less concentrated as lead banks get closer to the
regulator.
The third chapter examines whether borrowers manipulate 10-K report readability
before receiving syndicated loans to gain bargaining power. I find that firms’ 10-K report
file size is 5.9% larger one year before receiving syndicated loan. But only poorly
performing firms do so, better performing firms make their reports easier to read. One
example for this manipulation is that poorly performing firms want to hide their poor
performance, while superior performing firms seek to highlight their performance.

v
ACKNOWLEDGMENTS
I am deeply indebted to my dissertation advisor Dr. Ken Hung, who generously guide
and support me to finish my dissertation. I am grateful to my dissertation committee
members, Dr. Antonio J Rodriguez, Dr. George R.G. Clarke, and Dr. Jui-Chin Chang for
their instructive comments. I also would like to thank Dr. Jorge Brusa, and Ms. Pamela
Short for helping me with all the paperwork. In addition, I owe a special debt of gratitude
to my passing previous advisor Dr. Siddharth Shankar, who supported me firmly. Finally,
I am indebted to my parents for their love.

vi
TABLE OF CONTENTS
Page
ABSTRACT ....................................................................................................................... iii
ACKNOWLEDGMENTS ...................................................................................................v
TABLE OF CONTENTS ................................................................................................... vi
LIST OF FIGURES ......................................................................................................... viii
LIST OF TABLES ............................................................................................................. ix
INTRODUCTION ...............................................................................................................1
What is a syndicated loan ..............................................................................................1
Syndicate process ...........................................................................................................1
A brief history of the syndicated loan market ................................................................2
Benefits of syndicated loans ..........................................................................................2
Issues in syndicate lending .............................................................................................2
CHAPTER
I CORPORATE SOCIAL RESPONSIBILITY AND SYNDICATED LOAN
STRUCTURE ................................................................................................................5
1.1 Introduction ..............................................................................................................5
1.2 Literature review ......................................................................................................8
1.3 Data and methodology ...........................................................................................17
1.4 Results ....................................................................................................................22
1.5 Conclusion .............................................................................................................43
CHAPTER
II DOES GEOGRAPHICAL DISTANCE AFFECT SYNDICATED LOAN

vii
STRUCTURE: LENDER AND REGULATOR .........................................................44
2.1 Introduction ............................................................................................................44
2.2 Literature review ....................................................................................................46
2.3 Data and methodology ...........................................................................................51
2.4 Results ....................................................................................................................55
2.5 Conclusion .............................................................................................................67
CHAPTER
III MECHANISM TO OBTAIN OPTIMAL LOAN TERM: EVIDENCE FROM
BORROWER ANNUAL REPORT READABILITY .................................................68
3.1 Introduction ............................................................................................................68
3.2 Literature review and hypotheses development .....................................................70
3.3 Data and methodology ...........................................................................................75
3.4 Results ....................................................................................................................77
3.5 Conclusion .............................................................................................................90
REFERENCES ..................................................................................................................92
APPENDICES ...................................................................................................................98
A. VARIABLES DEFINITION ...................................................................................98
B. SYNDICATION PROCESS .................................................................................101
C. MEAN PLOTS ......................................................................................................102
VITA ................................................................................................................................106

viii
LIST OF FIGURES
Page
Figure 1.1: Corporate social Responsibility Related action by US investors ......................9
Figure 1.2: Growth of syndicated loan market in recent years ..........................................13
Figure 3.1: Plot of average 10-K size (log) of firms around syndicated loan issuance ...102

ix
LIST OF TABLES
Page
Table 1.1: Descriptive statistics for corporate social responsibility data ...........................22
Table 1.2: Descriptive statistics for dependent and control variables ...............................23
Table 1.3: Correlation matrix .............................................................................................25
Table 1.4: Regression of syndicated loan structure against overall CSR score .................27
Table 1.5: Regression of syndicated loan structure against seven CSR
components score ..............................................................................................29
Table 1.6: High CSR vs. low CSR, high quality vs. low quality .......................................32
Table 1.7: High financial transparency firms vs. low financial transparency firms ..........34
Table 1.8: Regression of syndicated loan spread against overall CSR score ....................36
Table 1.9: Instrumental variable regression .......................................................................38
Table 1.10: Regression of syndicated loan structure against Domini 400 Social Index
firms ................................................................................................................40
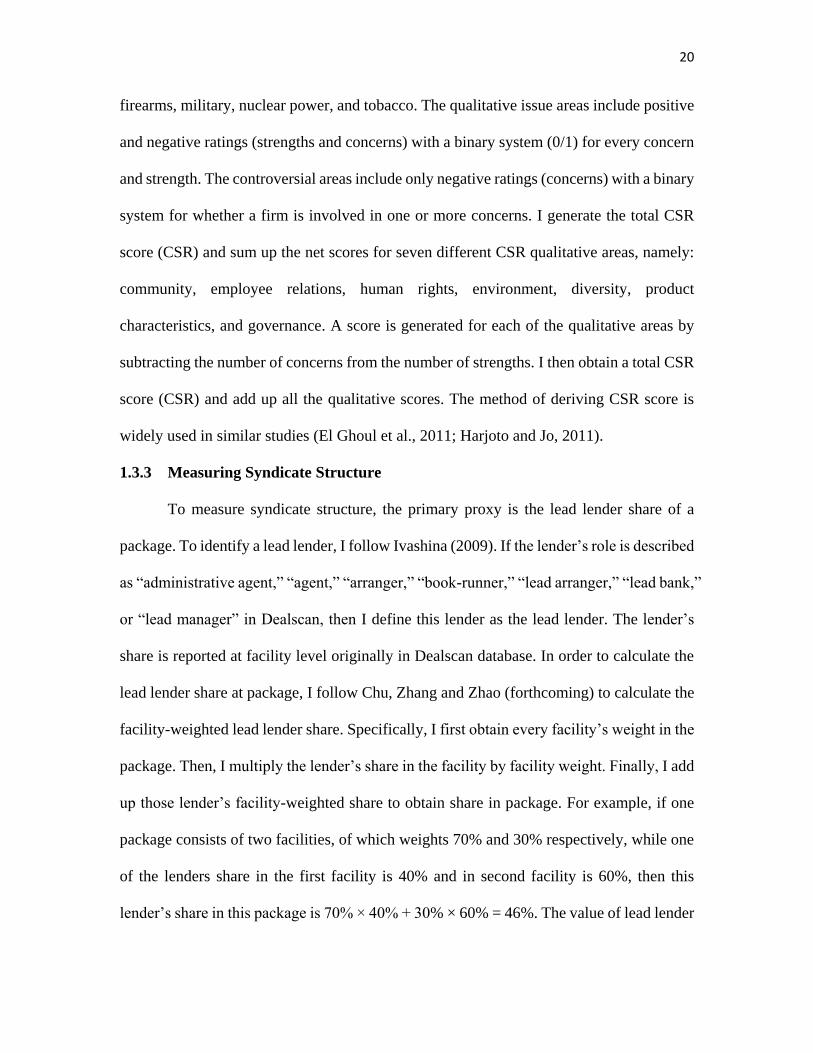
Table 1.11: Regression of syndicated loan structure against overall CSR
score before and after addition of Russell 1000 firms ....................................41
Table 2.1: Summary statistics ............................................................................................56
Table 2.2: Regression of syndicated loan structure against bank-Fed distance (closest) ..58
Table 2.3: Regression of syndicated loan spreads against bank-Fed distance (closest) ....59
Table 2.4: Lead lender reputation and lender-regulator distance ......................................62
Table 2.5: Syndicated loan structure and bank-Fed distance (Federal Reserve Banks) ....64
Table 2.6: Robustness check: CSR initiatives ...................................................................66
Table 3.1: 10-X readability before syndicated loan issuance; Do firms manipulate

x
readability to improve bargaining position .......................................................78
Table 3.2: 10-X readability before syndicated loan issuance (alternative measures) ........83
Table 3.3: Do firms manipulate readability at different levels in terms of corporate
governance ........................................................................................................85
Table 3.4: Does high-quality auditor reduce readability manipulation .............................87
Table 3.5: Do firms with bond alternatives have less incentive to manipulate readability
before syndicated loan issuance ........................................................................89

1
INTRODUCTION
What is a syndicated loan
Unlike regular loan between one lender and one borrower, syndicated loans
involve two or more lenders, who jointly provide credit to one borrower. Normally,
among those lenders, there is one lead lender, named “administrative agent,” “agent,”
“arranger,” “book-runner,” “lead arranger,” “lead bank,” or “lead manager”. In the case
of large transaction, more than one lead lender may be assigned. The rest of the group of
lenders are called participant lenders who are brought together by the lead lender to join
in the loan syndicate. The lead lenders and participant lenders play different roles in
syndicated loans. As lead lender, the lender is responsible for processing documents,
screening loans, recruiting participants, issuing loans, monitoring loans, coordinating
participant lenders, closing loans, etc. In contrast, participant lenders do not assume the
above responsibilities.
Syndicate process
Syndicated loans start from either the borrower soliciting offers from lenders who
will arrange syndicated loans or lenders taking the initiative to bid for a potential
borrower’s mandate. Once the lead lender is selected, the borrower begins negotiating
with the lead lender about the loan agreement. After a preliminary agreement is reached,
the lead lender and borrower start preparing information memorandum and inviting
participant lenders who will gain access to information memorandum and are allowed to
discuss loan terms, which include such items as loan maturity, loan interest and fees. The
participant lenders will give feedback to lead lenders. When the formal decision is made,
_____________
This dissertation follows the model of The Journal of Finance.

2
the lead lender allocates loans to participant lenders.
A brief history of the syndicated loan market
According to the loan syndications and trading association, in 2017, syndicated
loans in United States were worth over $2.5 trillion. Syndicated loans can be traced back
to the 1960s when groups of lenders initially participated in international markets
(Rhodes and Campbell (2004 )). In the U.S. domestic market, the development of the
syndicated loan market was accelerated in the late 1980s when leveraged buyouts were
the primary target. In the early 1990s, lenders began switching from the leveraged loan
market to investment-grade loans. By the mid-1990s, not only traditional lenders, such as
commercial banks, but also institutional investors, such as investment banks, insurance
companies, and pension funds, began to participate in the syndicated loan market.
Benefits of syndicated loans
Both the lender and the borrower can benefit from syndicated loans. Eichengreen
and Mody (2000) indicate that compared to bonds, syndicated loans are easier to
liquidate, renegotiate, and cancel. They also charge lower fees, require few disclosures,
and take less time to arrange. Moreover, syndicated loans allow borrowers to build
relationships with more than one creditor. For lenders, syndicated loans provide a way of
diversifying credit risk, decreasing the costs of screening and monitoring, avoiding
capital constrains, and allowing them to participate in restricted regions and industries
(Dennis and Mullineaux (2000); Madan, Sobhani and Horowitz (1999); Simons (1993 )).
Issues in syndicate lending
A syndicated loan normally involves three parties: the borrower; the lead lender;
and the participant lender. Information asymmetries among those three parties result in

3
agency problems, adverse selection, and moral hazard. Agency problems exist between
the borrower and the lead lender because the borrower knows its credit risk while the lead
lender does not. Adverse selection takes place between the lead lender and the participant
lender before syndicated loan issuance. Since the lead lender is better informed than the
participant lender about the borrower’s quality, the lead lender may have an incentive to
hold a large proportion of the loan when the borrower’s quality is high or keep a small
portion of loan when the borrower’s quality is low. Moral hazard happens between the
lead lender and the participant lender after a syndicated loan issue. In syndicate lending,
the lead lender is responsible for monitoring the borrower while the lead lender retains
only part of the loan, which reduces the lead lender’s incentive to monitor the borrower.
Studying the issues indicated above, the literature finds that information
asymmetries affect syndicated loan structure, pricing, terms, etc. For example, Dennis
and Mullineaux (2000) find that less transparent borrowers exacerbate information
asymmetries between the lender and the borrower. As a consequence, the lead lender
holds a large proportion of loans, i.e. there is a more concentrated syndicated loan
structure. Lee and Mullineaux (2004) support this finding and propose that borrowers
with high default risks will lead to a large proportion of the syndicated loan being
retained by lead lenders. Lin, Ma, Malatesta and Xuan (2012) find that syndicates tend to
be concentrated when information asymmetries are worsened by large corporate
ownership divergence. Kim and Song (2011) report that auditor quality alleviates
information asymmetries between the lead lender and participant lenders and therefore
plays an important role in syndicated loan structure formation. In this dissertation, I want
to further study the information asymmetry problem in syndicated loan setting. To be

4
specific, from the perspective of borrower, chapter 1 examines how the borrower’s
corporate social responsibility activities affect syndicated loan structure. In chapter 2, I
investigate whether the borrower takes advantage of the information asymmetries in the
process of syndicated loans, that is whether borrower manipulates 10-K report readability
to gain bargaining power. In chapter 3, I look into the effect of information asymmetries
from the perspective of the lender and the lender’s regulator. In particular, I study
whether geographic distance between the lender and the lender’s regulator affects
syndicated loan structure and spread.

5
CHAPTER I
CORPORATE SOCIAL RESPONSIBILITY AND SYNDICATED LOAN
STRUCTURE
1.1 Introduction
When several lenders partner with each other to issue a loan to a single borrower
under the same contract, they form a loan syndicate. Due to the expanding corporate
activities and better access to global funding, the U.S. syndicated loan market has grown
tremendously. As of 2014, the syndicated loan outstanding balance stands at $1.57
trillion (46.3 percent of total commitment of $3.39 trillion) which is 6.4 times larger (and
4.9 times larger in total commitments) than in 1989 (Board of Governors of the Federal
Reserve System, 2014; Board of Governors of the Federal Reserve System, 2014)1. The
rapid growth of syndicated loan market has drawn researchers’ attention. For example,
Kim and Song (2011) show that the borrower’s auditor quality reduces the proportion of
loans retained by lead lender. Lin, Ma, Malatesta and Xuan (2012) find that the
borrower’s corporate ownership has a significant effect on syndicated loan structure. I
complement this strand of literature by finding that CSR initiatives of borrowing firms
affect syndicated loan structure.
A syndicated loan involves three parties: lead lenders; participant lenders; and
borrowers. Information asymmetries exist between three parties. The borrower knows its
credit quality better than syndicate lenders, leading to information asymmetries between
borrowers and lenders. Compared to participant lenders, lead lenders know the borrowers
better than other syndicate members. Therefore, lead lenders have incentives to take
1 http://www.federalreserve.gov/newsevents/press/bcreg/bcreg20141107a1.pdf

6
advantage of its better-informed position and is subject to adverse selection and moral
hazard problems. Participant lenders are aware of those problems and therefore force lead
lenders to holder a large percentage of the syndicated loan when they believe that adverse
selection and moral hazard problems are severe.
While the information asymmetry problem affects the syndicated loan structure,
previous studies find CSR initiatives mitigate information asymmetry problems.
Dhaliwal, Li, Tsang and Yang (2011) point out that the information from CSR activities
improves the transparency of the firm’s long-term performance and risk management,
which alleviates asymmetric information between borrowers and lenders. In addition,
proactive CSR firms provide more transparent and reliable financial reports (Kim, Park
and Wier (2012 )) and increase the firm’s information availability and quality to the
lenders(Cheng, Ioannou and Serafeim (2014 )). Participant lenders gain more from this
than lead lenders, who already has better quality information to evaluate borrower’s
performance. This reduces information asymmetries between the lead lender and
participant lenders. I would, therefore, expect the participant lenders to require the lead
lender to hold less at the syndicate loan for firms with strong CSR performance.
The empirical analysis supports the hypothetical link: lead lenders hold less of the
loan when borrowers are socially responsible. With further examination of the specific
CSR components, the results indicate that among the seven components, community
engagement, employee relations, human rights, and governance all affect syndicated loan
structure while diversity, environment performance, and product safety show
insignificant impact on syndicated loan structure. I also divide the sample into a high-
CSR group, a low-CSR group, a high-quality group, and a low-quality group. My results

7
suggest CSR activities in low-CSR firms and low-quality firms are valued by lenders,
indicating that lenders are able to differentiate essential CSR investments from CSR
overinvestment. Third, I group the sample into high financial transparency firms and low
financial transparency firms. The results show that lenders value CSR more when the
firm is less financial transparent.
The main results are highly robust. First, to address the issue of endogeneity, I use
an instrumental variable approach. Following Goss and Roberts (2011), I take Republican
strength in each state as an instrument. My results continue to hold when 2SLS is
conducted. Second, the results are robust by using an alternative CSR measurement, the
Domini 400 Social Index. The test generates similar results to those in main regression.
Third, I address the concern that the results are driven by the addition of Russell 1000
firms. The estimation results remain similar and significant before and after the addition
of Russell 1000 firms. In sum, those additional robustness tests suggest that the main
results still hold: lead lenders are likely to hold smaller proportion of syndicated loans
when firms have better CSR performance.
This paper contributes to two strands of the literature. First, the paper extends
prior research that studies how borrowing firms alleviate information asymmetries and
therefore affect syndicated loan structure. I complement this strand of literature and find
that better CSR performance of borrowing firms is associated with less concentrated
syndicated loan structure through influencing information asymmetries between relevant
parties of a syndicated loan. Second, this paper contributes to the debate whether firms
should engage in CSR activities. I find lenders in syndicated loan market value CSR

8
initiatives and they can differentiate appropriate investments from overinvestment in
CSR.
The remainder of this paper is organized as follows. Section 2 discusses the past
literature and hypothesis development. Section 3 describes the data and methodology.
Section 4 discusses the empirical results, and section 5 concludes and summarizes.
1.2 Literature review
Corporate social responsibilities and syndicated loan have been studied well in
literature.
1.2.1 Corporate social responsibility
Activities on corporate social responsibilities of a corporation has significantly
increased. As shown in figure 1.1, many American firms have taken CSR related actions
in recent years. CSR is defined as the actions that a firm chooses to take that substantially
enhance the well-being of its stakeholders (Frooman (1997 )). This encompasses the
economic, legal, ethical and discretionary expectations of society (Carroll (1979 )). Jo and
Harjoto (2011) define CSR as how a firm conducts its business operations to generate an
overall positive impact on the society in regard to serving people, community, and the
environment in a manner that exceeds legal requirements. Thereof, CSR lowers firm
specific risk (Boutin-Dufresne and Savaria (2004 )), improves corporate financial
performance (Griffin and Mahon (1997); Roman, Hayibor and Agle (1999); Waddock and
Graves (1997 )), reduces external financing cost (El Ghoul, Guedhami, Kwok and Mishra
(2011); Ge and Liu (2015); Goss and Roberts (2011 )), and more importantly mitigates
information asymmetry problems (Cui, Jo and Na (2018); Jo and Kim (2007 )).

9
Figure 1.1 Corporate social Responsibility Related action by US investors
Source: Marketingcharts.com
However, whether firms should adopt CSR activities remains controversial.
Proponents of CSR investment hold the view that CSR activities are beneficial not only
to shareholders, but more importantly to stakeholders, who, in turn, would support those
high CSR firms (Freeman (2010); Jones (1995 )). The purpose of CSR policies is to
increase value in the long term by accepting and promoting socially responsible projects.
By doing so managers create a win-win situation in which the shareholder wealth
maximization gets aligned with stakeholder value maximization. Firms engage in CSR
activities to signal their images and reputations (Carter (2005); Fombrun and Shanley
(1990); Grow, Hamm and Lee (2005 )). Empirically, Hong and Kacperczyk (2009) find
that the most direct influence of CSR activities is that those social norm-constrained
firms are associated with low litigation risk, high product quality and better employee
benefits, which can be attributed to the managers of CSR-engaged firms who are honest,
ethical and trustworthy (Jones (1995 )). Not only influencing the non-financial

10
performance, but also many studies in this area have reinforced the fact that there is
positive association between CSR initiatives and firm performance. For instance, Griffin
and Mahon (1997) use multiple data sources and five accounting measures to test
whether CSR activities improve firm’s financial performance and find evidence, which is
supported by Preston and O'bannon (1997) who examine 67 large U.S. firms and Roman,
Hayibor and Agle (1999). Sun and Cui (2014) link CSR activities to firm risk, and argue
that because CSR activities increase customer satisfaction, which generates stable and
continuously growing income cash flow, the firm’s ability to pay debt is promoted.
Therefore, high CSR firms are associated with low default risk. Orlitzky, Schmidt and
Rynes (2003) conduct a meta-analysis on 52 papers that study CSR and firm financial
performance and find a positive relationship between these two.
Furthermore, empirical studies show that creditors and shareholders all value CSR
activities when firms look for external financing. El Ghoul, Guedhami, Kwok and Mishra
(2011) examine whether borrower CSR practices in the US affect the cost of equity. They
find when the borrower improves employee relations, adopts environmental policies, and
underscores product safety, investors require a low equity premium. Sharfman and
Fernando (2008) study one CSR factor, the environment, and find that environmental risk
management is rewarded by equity markets. The volatility and risk premium are low for
better environmental risk management firms. Their findings are supported by Plumlee,
Brown, Hayes and Marshall (2015) who find that environmental disclosure quality is
positively related to firm value through firm cash flow and cost of equity. Dhaliwal, Li,
Tsang and Yang (2014) extend the association between CSR and the cost of equity to
international settings. They study the benefits of CSR activities in equity markets over 31

11
countries and contend that CSR activities reduce the cost of equity and CSR reports are
used when financial reports are not available. For debt markets, CSR activities also help
to reduce cost of debt. Dhaliwal, Li, Tsang and Yang (2014) contend that CSR
performance is related to firm’s risk and value, therefore disclosing CSR performance
reduces information asymmetries between relevant parties by providing more information
to assess firm’s value and risk. Goss and Roberts (2011) examine the relationship
between CSR and loan rates and demonstrate that high CSR firms enjoy discounts on
loan rates, however, such loan rate discounts only exist when CSR is not over invested
because overinvestment in CSR is believed to be for the manager’s personal benefit.
Rather than private loans, Ge and Liu (2015) investigate how CSR performance affect the
cost of new bond issues. They report that superior CSR performers receive high credit
ratings and the cost of bond issue is low. Chen, Kacperczyk and Ortiz-Molina (2011)
examine how employee relations affect the cost of debt and show that firms with strong
unions are associated with low corporate debt costs because those firms implement less
risky investment policies and protect debtholder’s right.
However, the literature finds mixed results on CSR influence. Opponents of CSR
activities argue that CSR activities maximize stakeholder’s value at the cost of
shareholders (Friedman (2009 )). Management are selfish, and they engage in CSR
activities for their own benefits. For example, McWilliams, Siegel and Wright (2006)
find a negative influence of CSR activities and argue that the cost to improve CSR
performance exceeds the benefits. Barnea and Rubin (2005) indicate that managers
overinvest in CSR to build their own reputations. Their findings are enhanced by Prior,
Surroca and Tribó (2008) who find evidence that management pursue discretionary CSR

12
investment for personal interests. In addition, CSR activities are tools that management
uses to cover other inappropriate behavior (Hemingway and Maclagan (2004 )). Taken
together, those inappropriate adoption of CSR activities result in poor financial
performance. For instance, Ge and Liu (2015) argue that CSR activities would decrease
profit and lead to interest payment default, which increases renegotiation probability.
1.2.2 Syndicated loan
Syndicated loans have become common around the world and are used frequently
for various corporate purposes. The growth of syndicated loans has been phenomenal. As
figure 1.2 shows, the global syndicate loan market is growing both in terms of size and
the number of deals. In 2010, global syndicated loan volume was around $3 trillion. This
had grown to approximate $4.6 trillion in 2014. In terms of number of deals, it increased
from 6,000 to more than 9,000 deals in a 5-year period.
The syndicated loan process starts when a borrower requests a loan from its
preferred bank which generally becomes a lead bank of the syndicate. The lead bank
conducts due diligence, evaluates borrower risks, arranges additional fund needs by
inviting other participants, mediates loan agreements, channels loan repayments,
monitors borrowers and solves any disputes throughout the loan life. Lenders form
syndicates for a variety of reasons, such as to diversify risk, to expand their lending area,
and to avoid capital constraints (Simons (1993 )).
A syndicated loan involves three parties, lead lenders, participant lenders, and the
borrower. Information asymmetries exist among the three parties.

13
Figure 1.2 Growth of syndicated loan market in recent years
Source: (Syndicated lending by www.bis.org)
Chaudhry and Kleimeier (2015) divide syndication into three phases and identify
information asymmetries in all three phases, which are more severe when borrowers are
opaque. They argue that in the first phase, when mandates have not been awarded to lead
lenders, information asymmetries exist between borrowers and lead lenders because
borrowers are more aware of their own credit risks than lead lenders. In the second phase,
i.e. after borrowers award mandates to lead lenders, lead lenders have information
advantages over participant lenders since the major information about borrowers that
participant lenders gain is from the information memorandum which is prepared by lead
lenders, leading to an adverse selection problem. In the third phase, after the syndicate
group disburses the loan to the borrowers, the lead lenders bear all the monitoring costs,

14
but the lead lenders retain only part of the loan, leading to a moral hazard problem. Due
to the lack of monitoring, the borrowers, again, are more informed than the lenders. To
mitigate the information asymmetries, the adverse selection problems, and the moral
hazard problems, Dennis and Mullineaux (2000) test 1,526 syndicated loans and find that
the lead lender holds more shares when information asymmetries between borrowers and
lenders are severe. Lee and Mullineaux (2004) and Sufi (2007) support Dennis and
Mullineaux (2000)’s finding and further examine the reasons behind such syndicated
structure. Lee and Mullineaux (2004) examine 1,491 syndicated facilities and conclude
that syndicated loan structure is more concentrated when information about the borrower
is little, i.e. no senior debt rating or ticker symbol. Based on the results, they argue that to
minimize adverse selection problems, enhance incentives of monitoring and facilitate
renegotiation, the syndicates are structured more concentrated. By using availability of
public SEC filings and S&P senior unsecured debt ratings, Sufi (2007) examine 12,672
loan deals and find that the lead lender holds 10% more of the loan when the borrower’s
SEC filing is available. Consistent with Lee and Mullineaux (2004), they contend that to
alleviate adverse selection and moral hazard problems, participant lenders demand the
lead lender to retain a greater portion of the loan when the borrower is opaque and require
more intense due diligence and monitoring.
1.2.3 Hypothesis development
In a syndicated loan, only the lead lender/s is responsible for screening the loan
before the syndication and monitoring the loan after the syndication. Therefore, there are
adverse selection and moral hazard problems during this process. Because the lead lender
has better information than participant lenders about the borrower and therefore has

15
incentives to syndicate risky loans to participant lenders, adverse selection problems arise
before the syndication. After the syndication, since the loan is distributed to the lead
lender and participant lenders, but the monitoring costs are borne by the lead lender only,
the lead lender may shirk the monitoring responsibility, leading to moral hazard
problems. To alleviate the adverse selection and moral hazard problems, participant
lenders demand the lead lender retain a large part of the loan.
However, a countervailing factor also affects the lead lenders’ shares. As one of
the reasons of syndication is to diversify the credit risk, the lead lender may want to hold
a smaller share of the loan when the loan is risky. Ivashina (2009) studies the two
opposite factors in a syndicated loan setting. She draws two curves similar to supply and
demand curves to represent the risk diversification effect and information asymmetry
effect. She contends that the interaction of the two opposing effects creates a set of
equilibrium points. In order to identify the effect from participant lenders, she uses the
default probability standard deviation before and after one loan is added to the lender’s
loan portfolio as an instrument variable, which affects the risk diversification factor
directly but not information asymmetry factor directly. In this sense, the risk
diversification curve is allowed to move while information asymmetry curve is fixed. She
conducts two-stage least square then and shows that the asymmetry information between
lead lender and participant lender explains 4% of the borrowing cost. The results
demonstrate that asymmetric information factor and risk diversification factor are
offsetting each other and that increasing the proportion of the loan the lead lender holds
can effectively reduce information asymmetry problem. In addition, to study whether the
lead lender exploits participant lenders to diversify the loan risk, Panyagometh and

16
Roberts (2010) empirically show that in order to build the reputation, lead banks
syndicate a large fraction of loans even if the loans are less risky.
Since the views on CSR in literature are also mixed, which may result to
confusing reasonings, I rule out the negative view on CSR in the loan setting by testing
the relationship between CSR and syndicated loan spread. On the debt market, CSR
benefits the firms by lowering the cost of loans (Goss and Roberts (2011 )) and the cost
of bonds (Ge and Liu (2015 )).
Extant literature has demonstrated that the CSR activity is helpful in reducing the
adverse selection and moral hazard problems. For instance, Dhaliwal, Li, Tsang and
Yang (2011) show that better CSR performers are willing to disclose more transparent
and reliable information about the firms to the public, mitigating information asymmetry
issues between insiders and outsiders (Jo and Kim (2007); Jo and Kim (2008 )). Because
participant lenders heavily rely on the lead lender to evaluate the borrower, CSR
disclosures provide participant lenders another channel to assess the borrower’s
performance. In this sense, CSR activities alleviate adverse selection problems by
mitigating the information asymmetry between the lead lender and participant lenders.
Furthermore, Luo and Bhattacharya (2009) point out that high CSR firms are associated
with low idiosyncratic risk. When a borrower is less risky, the lead lender has fewer
incentives to take advantage of the well-informed position, which also mitigates the
adverse selection problem. Moreover, Cui, Jo and Na (2018) contend that high CSR firms
build and maintain good reputation, which mitigates information asymmetry and ease the
monitoring burden. In this case, the moral hazard problem is relieved because of less
monitoring from the lead lender on the borrower. Following this line of reasoning, I

17
conjecture that the fraction of the syndicated loan that participant lenders demand the
lead lender to hold should be fewer when the borrower is high CSR firm.
In addition, Lee and Mullineaux (2004) argue that a syndicated loan structure is
negatively related to the probability of renegotiation in the future. In order to save
renegotiation cost and gain renegotiation power, a lead lender would retain larger
proportion of the loan. Sun and Cui (2014) find that high CSR firms have stable growing
income cash flow, better financial performance and lower default risk, all of which
reduce the probability of renegotiation. In this sense, a lead lender would hold larger
loans when a borrower is low CSR firm and retain smaller loans when a borrower is high
CSR firm.
Taken together, I propose the following hypotheses:
H1: Lead lenders retain few shares of syndicated loan (syndicated loan structure is less
concentrated) when firms actively engage in CSR activities.
1.3 Data and methodology
I construct the sample extracting data from Bank Regulatory, Dealscan,
Compustat, and KLD STATS.
1.3.1 Sample selection
Dealscan, which comes from Loan Pricing Corporation, provides a
comprehensive historical information on global commercial loans. The majority of
information concerning loan price and contract details is extracted from the SEC filings
while the rest is obtained from other internal and public sources (e.g. 10-Ks). There are
two kinds of units used in Dealscan. One is “Package,” which refers to the “contract.”
The other unit is “Facility,” which refers to the “loan.” One package can consist of one or

18
several facilities. In this paper, I concentrate on the package level data. To control for
bank characteristics, I use data from Bank Regulatory which provides accounting
information for bank holding companies and commercial banks. In the paper, I focus on
bank holding companies. The accounting data of bank holding companies are collected
from FRY-9 reports. To control for borrower company’s characteristics, I obtain data
from Compustat. The CSR data come from KLD STATS, which is widely used by
academic researchers (Chatterji, Levine and Toffel (2007 )). The KLD data provide
sustainability performance of U.S. companies. The data before in 1991 and are updated
annually. The sustainability performance consists of three major categories: environment,
social, and governance. The CSR data are obtained from social category, which has seven
subcategories, i.e. community, diversity, employee relations, human rights, environment,
product, and governance.
As Chu (2016) mention that DealScan data are more detailed after 1996, I start
our data from January 1996. I end the data at the year of 2012 because the date of the link
of Dealscan and Compustat provided by ends at 2012 (Chava and Roberts (2008 )).
The sample starts with 223,307 unique facilities that belong to 154,979 packages.
I focus on packages that have one lead lender only to address the concern of ambiguity in
measuring lending shares of multiple lead lenders (Panyagometh and Roberts (2010 )).
Since I use bank shares as one of syndicated loan structure measures, I exclude packages
with missing bank allocation information. Following Chu (2016), I also assign 100%
bank shares to missing bank allocation observation if the bank is the only lender in the
package. Due to large number of missing bank allocation observations, the number of
facilities drops to 79,914, corresponding to 64,998 packages. Next, I use Dealscan-

19
Compustat link file (Chava et al, 2008) to identify borrowing firms’ accounting
information, and I also exclude facilities whose borrower companies belong to financial
and regulated industries (i.e. companies with two-digit SIC code between 60 and 69 or
equals to 49). I delete packages if any information is missing. As a result, I obtain 11,224
packages comprising of 14,385 facilities.
To identify bank holding company accounting information, I next match
syndicated loan information with data from Bank Regulatory. Due to the lack of identifier
linking Dealscan with Bank Regulatory, I merge the two datasets by matching bank name
and location. To double check accuracy, I also manually check the matching. As a result,
I have 7,210 facilities which belong to 5,686 packages.
To include CSR information for borrower firms, I use ticker as identifier. Finally,
the number of facilities that has full set of data is 2,724 facilities associated with 2,049
packages. I provide the comprehensive list of variables used in this study along with their
computations in appendix I.
1.3.2 Measuring CSR
For Corporate social responsibility measures, I use the data from KLD stats. Founded
in 1988, for over two decades, Kinder, Lydenberg, Domini Research & Analytics Inc (KLD)
has been providing benchmarks, analysis, research, compliance and consulting services
related to social, governance, and environmental practices. KLD provides ratings based on
13 CSR dimensions, grouped into two major categories: seven qualitative issue areas and
seven controversial business issues. The seven qualitative issue areas include: community,
diversity, employee relations, environment, product characteristics, human rights and
corporate governance. The six controversial business areas include: alcohol, gambling,
20
firearms, military, nuclear power, and tobacco. The qualitative issue areas include positive
and negative ratings (strengths and concerns) with a binary system (0/1) for every concern
and strength. The controversial areas include only negative ratings (concerns) with a binary
system for whether a firm is involved in one or more concerns. I generate the total CSR
score (CSR) and sum up the net scores for seven different CSR qualitative areas, namely:
community, employee relations, human rights, environment, diversity, product
characteristics, and governance. A score is generated for each of the qualitative areas by
subtracting the number of concerns from the number of strengths. I then obtain a total CSR
score (CSR) and add up all the qualitative scores. The method of deriving CSR score is
widely used in similar studies (El Ghoul et al., 2011; Harjoto and Jo, 2011).
1.3.3 Measuring Syndicate Structure
To measure syndicate structure, the primary proxy is the lead lender share of a
package. To identify a lead lender, I follow Ivashina (2009). If the lender’s role is described
as “administrative agent,” “agent,” “arranger,” “book-runner,” “lead arranger,” “lead bank,”
or “lead manager” in Dealscan, then I define this lender as the lead lender. The lender’s
share is reported at facility level originally in Dealscan database. In order to calculate the
lead lender share at package, I follow Chu, Zhang and Zhao (forthcoming) to calculate the
facility-weighted lead lender share. Specifically, I first obtain every facility’s weight in the
package. Then, I multiply the lender’s share in the facility by facility weight. Finally, I add
up those lender’s facility-weighted share to obtain share in package. For example, if one
package consists of two facilities, of which weights 70% and 30% respectively, while one
of the lenders share in the first facility is 40% and in second facility is 60%, then this
lender’s share in this package is 70% × 40% + 30% × 60% = 46%. The value of lead lender

21
share ranges from 0 to 100% and the greater the amount means the more concentrated the
syndicated structure is. To incorporate the effect of participant lender, I create Herfindahl-
Hirschman index (HHI) for all lenders’ share at the package level. HHI is calculated by
aggregating the squares of each lender’s share in the package. This value ranges from 0 to
10,000%. Like lead lender share, greater value of HHI represents more concentrated
syndicated structure.
1.3.4 Control variables
Following literature, I include a rich set of control variables to control for factors
that might affect syndicated loan structure. First, I control for borrower’s characteristics.
As in Sufi (2007) and Ivashina (2009), I include firm size, asset tangibility, Tobin’s Q,
profitability, cash holding, leverage, R&D and S&P credit rating. Following Chu, Zhang
and Zhao (forthcoming), I control for the lender characteristics such as lender size, liquidity,
ROA, leverage, tier 1 capital ratio, loan charge-offs, loan loss allowance, risk weighted
asset, subordinated debt, and deposit. Following Lin, Ma, Malatesta and Xuan (2012), I
also control for loan size and maturity. Also, I control for the borrower industry by using
Fama French 30 industry classification. The detailed definitions of the variables used in
this study is reported in the appendix section.
1.3.5 Empirical Model
In order to investigate the association between the CSR and syndicated loan
structure, I use the regression analysis.
Syndicated loan structure = f (CSR, lender characteristics, borrower characteristics, loan
characteristics, and industry effects)

22
The dependent variable is a measure of syndicated loan structure proxied by lead
lender share and HHI in line with existing literature. (Anil, 2011; Mariassunta, 2012; Sufi,
2007). The key independent variable is CSR calculated as the difference between number
of strengths and concerns. I expect CSR score is positively related to lead lender share and
HHI. Also, I control for borrower characteristics, loan characteristics, and borrower
industry.
1.4 Results
This section shows the results from the empirical analysis.
1.4.1 Descriptive statistics
Table 1 reports descriptive statistics for overall CSR score over sample period, i.e.
1996-2012. The scores are similar to those reported in El Ghoul, Guedhami, Kwok and
Mishra (2011).The score varies over time, with positive CSR score before 2003 and
negative CSR score from 2003 to 2011.
Table 1.1
Descriptive statistics for corporate social responsibility data
Mean Min Median Max St. dev.
1996 0.82 -5.00 0.00 10.00 2.17
1997 0.95 -4.00 1.00 8.00 2.14
1998 0.97 -6.00 1.00 9.00 2.54
1999 0.96 -7.00 1.00 10.00 2.34
2000 0.95 -5.00 1.00 10.00 2.23
2001 0.51 -6.00 0.00 9.00 1.90
2002 0.40 -6.00 0.00 9.00 1.98
2003 -0.14 -6.00 0.00 10.00 1.52
2004 -0.27 -6.00 0.00 11.00 1.68
2005 -0.28 -7.00 0.00 10.00 1.72
2006 -0.29 -7.00 -1.00 13.00 1.78
2007 -0.30 -8.00 -1.00 12.00 1.85
2008 -0.31 -9.00 0.00 11.00 1.86
2009 -0.32 -9.00 0.00 11.00 1.83
2010 -0.91 -7.00 -2.00 13.00 1.96
2011 -0.67 -7.00 -1.00 14.00 2.16
2012 0.51 -4.00 0.00 12.00 1.89

23
Table 2 provides descriptive statistics for dependent and control variables used in
empirical analysis. On average, the lead bank holds 32.18% in one package. The average
HHI at package level reaches to 3417.61. The key independent variable CSR score ranges
from -9 to 14 with median of 0, from which I find that most of firms are less likely to
consider their social responsibility.
Table 1.2
Descriptive statistics for dependent and control variables.
No. of package: 2049
Mean Min Median Max St. dev.
Lead bank share 32.18 0.31 16.17 100 33.6
HHI 3417.61 219.67 1528.93 10000 3691.41
Bank characteristics
Tier1 capital ratio 0.09 0.06 0.09 0.17 0.02
Leverage ratio 0.06 0.04 0.06 0.14 0.01
Bank asset (in million) 1176.49 3.97 1203.03 2370.59 710.72
Bank liquidity 0.18 0.06 0.18 0.64 0.06
Bank ROA 0.01 -0.05 0.004 0.02 0.004
Loan charge off 0.004 0.00006 0.003 0.021 0.003
Loan loss allowance 0.01 0.00004 0.01 0.03 0.004
Risk weighted asset 0.7 0.41 0.69 1.22 0.13
Subordinated debt 0.02 0.0001 0.02 0.07 0.01
Deposit -0.05 -0.77 -0.03 0.56 0.17
Firm characteristics
Asset (logarithm) 7.91 4.02 7.81 13.57 1.65
Tangibility 0.32 0.004 0.25 0.93 0.24
Tobins’Q 1.52 0.17 1.18 14.28 1.09
Profitability 0.14 -1.58 0.13 0.94 0.11
Cash Holdings 0.1 0.003 0.05 0.9 0.12
Leverage 0.25 0.01 0.25 1.62 0.17
R&D 0.02 0 0 0.68 0.05
Rating 0.66 0 1 1 0.47
Loan characteristics
loan size (logarithm) 19.74 12.47 19.81 23.98 1.4
Loan maturity (logarithm) 10.41 0.69 10.82 12.25 0.78
Table 3 reports Pearson Correlations between the dependent variables and other
regression variables. Pearson’s correlations suggest that high overall CSR score is
associated with less lead lender share and low HHI. I also notice several of firm

24
characteristics, bank characteristics, and loan characteristics are correlated with
syndicated loan structure. For example, the table reports that Tobin’s Q and firm cash
holdings are positively related to lead bank share and HHI at package level.
1.4.2 Main results
The main results are shown in this section. In section 1.4.2.1, I show the results
from base regression. In In section 1.4.2.1, I provide results by comparing high CSR
firms and low CSR firms.
1.4.2.1 Multivariate regression analysis
To examine how lenders value borrower’s CSR activities in the process of
syndicated loan formation, I regress the two syndicated loan structure proxies on overall
CSR score and various control variables. Table 1.4 reports our results. In Model 1, the
dependent variable is lead lender share, Lead bank share. The coefficient on CSR is
negative and statistically significant at 1% level. Based on the model, one standard
deviation increase in the CSR is associated with a 0.06 standard deviation decrease in the
lead lender share. The results indicate that information asymmetries are mitigated when
firms are socially responsible and therefore participant lenders do not force lead lenders
to holder more shares of the syndicated loan. Meanwhile, the results suggest that socially
responsible firms associate with low renegotiation possibility such that lead lenders do
not need to retain larger share in the syndicated loan. This highly significant relation
remains in Model 2 when I take into account participant lender’s share in syndicated
loan, suggesting the lenders value CSR activities.
Next, in table 1.5, I examine the relationship between syndicated loan structure
and seven individual CSR component scores. I first check the correlation and

25
Tab
le 1
.3
Corr
elati
on
matr
ix
1
2
3
4
5
6
7
8
9
10
11
1
Lea
d b
ank s
har
e 1.0
0
2
HH
I 0.9
1
1.0
0
3
CS
R
-0.1
1
-0.1
3
1.0
0
4
Tie
r1 c
apit
al r
atio
-0
.07
-0.0
2
0.0
0
1.0
0
5
Lev
erag
e ra
tio
0.1
8
0.1
7
-0.0
6
0.5
1
1.0
0
6
Ban
k a
sset
(in
mil
lion)
-0.1
7
-0.1
3
0.0
1
0.4
9
-0.2
4
1.0
0
7
Ban
k l
iquid
ity
0.0
2
0.0
4
0.0
2
0.4
6
0.3
4
0.0
2
1.0
0
8
Ban
k R
OA
0.0
6
0.0
6
-0.0
1
-0.1
9
-0.0
8
-0.1
9
0.0
0
1.0
0
9
Loan
char
ge
off
0.0
5
0.0
8
-0.0
4
0.5
3
0.4
1
0.2
7
0.2
5
0.0
3
1.0
0
10
Loan
lo
ss a
llow
ance
0.0
1
0.0
3
-0.0
3
0.6
5
0.6
3
0.2
9
0.3
9
-0.2
6
0.6
9
1.0
0
11
Ris
k w
eighte
d a
sset
0.2
5
0.2
1
-0.0
5
-0.4
3
0.5
3
-0.7
3
-0.0
9
0.1
3
-0.1
0
0.0
3
1.0
0
12
Subord
inat
ed d
ebt
0.1
6
0.1
3
-0.0
6
-0.3
6
0.4
1
-0.6
1
-0.1
0
0.0
1
-0.1
0
0.0
2
0.8
0
13
Dep
osi
t -0
.25
-0.2
2
0.1
0
0.1
7
-0.5
2
0.4
2
-0.0
5
0.0
3
-0.0
1
-0.1
8
-0.7
1
14
Ass
et (
logar
ithm
) -0
.52
-0.4
7
0.1
9
0.1
4
-0.2
3
0.2
4
0.0
0
-0.0
7
0.0
3
0.0
2
-0.3
8
15
Tan
gib
ilit
y
-0.1
4
-0.1
6
-0.0
6
-0.0
5
-0.0
7
-0.0
2
-0.0
3
0.0
0
-0.0
4
-0.0
3
-0.0
4
16
Tobin
s’Q
0.1
5
0.1
3
0.1
6
-0.1
5
-0.0
2
-0.1
2
-0.0
5
0.0
7
-0.0
9
-0.1
1
0.1
2
17
Pro
fita
bil
ity
-0.1
2
-0.1
2
0.1
3
-0.0
5
-0.0
7
0.0
4
-0.0
4
-0.0
2
-0.0
2
-0.0
4
-0.0
3
18
Cas
h H
old
ings
0.3
6
0.3
5
0.0
6
0.0
4
0.1
1
0.0
0
0.0
6
-0.0
1
0.0
4
0.0
5
0.0
8
19
Lev
erag
e -0
.21
-0.1
6
0.0
0
0.0
0
-0.1
1
0.0
1
-0.0
1
0.0
0
0.0
1
-0.0
4
-0.1
2
20
R&
D
0.2
4
0.2
5
0.0
7
0.0
1
0.0
8
-0.0
8
0.1
0
0.0
6
0.0
1
-0.0
2
0.0
8
21
Rat
ing
-0.4
3
-0.3
7
0.1
1
0.0
2
-0.2
5
0.1
3
-0.0
2
-0.0
4
-0.0
3
-0.0
8
-0.2
9
22
loan
siz
e
(logar
ithm
) -0
.66
-0.5
4
0.1
5
0.1
5
-0.2
3
0.2
9
-0.0
5
-0.0
6
0.0
2
0.0
0
-0.3
7
23
Loan
mat
uri
ty
(logar
ithm
) -0
.23
-0.1
5
-0.0
7
0.0
9
0.0
2
0.1
4
-0.0
7
-0.0
4
-0.0
4
-0.0
2
-0.0
5

26
Tab
le 1
.3
Corr
elati
on
matr
ix-(
con
tin
ued
)
12
13
14
15
16
17
18
19
20
21
22
23
12
Subord
inat
ed
deb
t 1.0
0
13
Dep
osi
t -0
.63
1.0
0
14
Ass
et
(logar
ithm
) -0
.31
0.4
0
1.0
0
15
Tan
gib
ilit
y
0.0
0
0.0
3
0.1
7
1.0
0
16
Tobin
s’Q
0.1
0
-0.0
5
-0.2
7
-0.1
7
1.0
0
17
Pro
fita
bil
ity
-0.0
2
0.0
4
-0.0
3
0.0
5
0.4
9
1.0
0
18
Cas
h
Hold
ings
0.0
7
-0.1
0
-0.2
9
-0.3
7
0.3
6
0.0
1
1.0
0
19
Lev
erag
e -0
.07
0.1
7
0.2
9
0.2
1
-0.1
8
-0.0
8
-0.3
7
1.0
0
20
R&
D
0.0
5
0.0
2
-0.2
0
-0.2
8
0.3
3
-0.1
1
0.4
6
-0.1
5
1.0
0
21
Rat
ing
-0.2
4
0.3
3
0.6
6
0.1
5
-0.2
2
0.0
1
-0.3
0
0.3
9
-0.1
9
1.0
0
22
loan
siz
e
(logar
ithm
) -0
.29
0.3
5
0.7
8
0.1
1
-0.1
7
0.0
8
-0.3
0
0.2
7
-0.2
1
0.5
5
1.0
0
23
Loan
mat
uri
ty
(logar
ithm
) -0
.01
-0
.06
-0.0
5
-0.0
1
-0.0
6
0.0
0
-0.0
3
-0.0
1
-0.0
3
-0.0
3
0.2
0
1.0
0

27
Table 1.4
Regression of syndicated loan structure against overall CSR score
This table shows the coefficients from a regression of the syndicated loan structure on
overall CSR score and controls for borrower, lender, and loan characteristics. The
dependent variable is lead lender share in Model 1. In Model 2, the dependent variable
is HHI. Descriptions of the explanatory variables are provided in Appendix. OLS is
conducted and p-value is included in parenthesis. Fama French 30 industry
classification is included. *, **, *** indicate p-value less than 0.1, 0.05 and 0.01
respectively.
(1) (2)
Lead lender shares HHI
CSR -0.7417*** -122.32***
(0.004) (0.0002)
Bank asset (in million) 0.0034 0.3243
(0.0114) (0.0539)
Bank liquidity -6.6160 -192.62
(0.5286) (0.8837)
Bank ROA -101.8765 -10007
(0.4086) (0.5175)
Loan charge off 993.0556 131235
(<.0001) (<.0001)
Loan loss allowance -1135.4551 -134733
(<.0001) (<.0001)
Risk weighted asset 50.0475 11209.2
(0.0321) (0.0001)
Subordinated debt -326.2650 -35981
(0.0119) (0.027)
Deposit -15.6244 -1730.8
(0.002) (0.0064)
Tier1 capital ratio 276.2047* 73557.5***
(0.0771) (0.0002)
Leverage ratio -245.8287 -87159
(0.2942) (0.0031)
Asset (logarithm) 0.8860 -225.06
(0.1737) (0.0059)
Tangibility 0.0540 -609.05
(0.9876) (0.1633)
Tobins’Q -0.0994 -63.981
(0.882) (0.4463)
Profitability -22.3682 -2368.8
(0.0002) (0.0018)
Cash Holdings 42.7826 5713.9
(<.0001) (<.0001)
Leverage 3.1225 1224.73
Continued

28
Table 1.5 Regression of syndicated loan structure against overall CSR score-
Continued
(1) (2)
Lead lender shares HHI
(0.3896) (0.0072)
R&D 28.0858 4699.59
(0.0452) (0.0076)
Rating -3.8771 -241.89
(0.0124) (0.2133)
loan size (logarithm) -13.0976 -879.8
(<.0001) (<.0001)
Loan maturity (logarithm) -5.3904 -497.57
(<.0001) (<.0001)
Industry YES YES
R-Square 0.537703 0.417049
No. of observations 2049 2049
multicollinearity among those seven components2. Without the multicollinearity issue, I
regress the lead lender share on the seven components: community engagement,
diversity, employee relations, environment performance, human rights, product features,
and governance. For each component, I apply the same manner in computing overall
CSR score to calculate individual component score. I subtract the number of concerns
from the number of strengths for each component. I am interested whether lenders value
certain components more than other components. The results show that not all CSR
components are valued by lenders. The coefficient of community engagement is negative
and significant different from zero. Similarly, I obtain negative and significant coefficient
on employee relation, suggesting well-treated employees are beneficial to lower firm’s
risk. Human rights also matter in terms of firm risk. The negative and significant
2 I test the multicollinearity by checking the variance inflation factor (VIF). The VIFs of
seven components are all between 1-2. VIF greater than 5 indicates multicollinearity.
Therefore, regressing on all seven CSR components does not create multicollinearity
issues. Montgomery, Douglas C, Elizabeth A Peck, and G Geoffrey Vining, 2012.
Introduction to linear regression analysis (John Wiley & Sons).

29
coefficient demonstrates that lenders value firms which undertake exceptional human
rights initiatives. I also find negative and significant coefficient on product features and
safety, suggesting better product safety and quality lower firm’s risk. Lastly, the
governance is negative and significant, indicating that when CSR consideration is
integrated in corporate governance, lends view such practice as positive signal. In
summary, firms with superior performance on community engagement, employee
relations, environment performance, human rights, and governance are associated with
low risk. Consistent with previous literature ( e.g. El Ghoul, Guedhami, Kwok and
Mishra (2011)), I find insignificant coefficient on diversity, indicating that workforce
diversity does not affect firm risk. Surprisingly, although the coefficients of environment
and product safety are negative, they are not significant. To interpret the insignificant
coefficient, perhaps it is because the effects of environment and product safety are more
abstract and do not affect people as directly as other components do. Therefore, the
lenders do not value the environment component as much as other components.
Table 1.6
Regression of syndicated loan structure against seven CSR components score
This table reports results from regressing syndicated loan structure on seven CSR
components score. The dependent variable is lead lender share. In unreported table, I
also regress HHI on seven CSR individual component score, the coefficient sign and
significance level are similar to those in this table. The seven individual CSR
components are community engagement, diversity, employee relations, environment
performance, human rights, product features and safety, and governance. Descriptions
of the explanatory variables are provided in Appendix. OLS is conducted and p-value
is included in parenthesis. Fama French 30 industry classification is included. *, **,
*** indicate p-value less than 0.1, 0.05 and 0.01 respectively.
Lead lender shares
Community -2.233651**
(0.0105)
Diversity 0.662724
(0.1468)
Continued

30
Table 1.7 Regression of syndicated loan structure against seven CSR components
score - Continued
Lead lender shares
Employee -1.166628**
(0.0416)
Environment -0.048813
(0.2309)
Human right -4.317386**
(0.0133)
Product -1.287071
(0.1071)
Governance -0.204852*
(0.0799)
Bank asset (in million) -318.67
(0.0141)
Bank liquidity -16.1
(0.0015)
Bank ROA 0.00348
(0.0095)
Loan charge off -7.3783
(0.4823)
Loan loss allowance -106.83
(0.3865)
Risk weighted asset 1024.63
(<.0001)
Subordinated debt -1151.5
(<.0001)
Deposit 52.8642
(0.024)
Tier1 capital ratio 305.084
(0.052)
Leverage ratio -281.03
(0.2319)
Asset (logarithm) 0.65622
(0.3076)
Tangibility -0.0109
(0.9975)
Tobins’Q -0.2232
(0.7384)
Profitability -22.709
(0.0002)
Cash Holdings 41.9405
(<.0001)
Leverage 3.44624
(0.3422)
Continued

31
Table 1.8 Regression of syndicated loan structure against seven CSR components
score - Continued
Lead lender shares
R&D 28.1693
(0.0447)
Rating -3.8361
(0.0134)
loan size (logarithm) -13.026
(<.0001)
Loan maturity (logarithm) -5.3948
(<.0001)
Industry YES
R-Square 0.537527
No. of packages 2049
1.4.2.2 High CSR firms vs. low CSR firms; high quality firms vs. low quality firms
The literature holds opposing views in terms of CSR investment. Advocates for
CSR believe that CSR activities mitigate firm risks. However, opponents argue that
overinvestment in CSR leads to agency cost. To test these two views, I divide sample into
four subsamples. Based on S&P ratings, I divide the sample into high-quality firms (S&P
ratings above BBB-, Model 1) and low-quality firms (S&P ratings below BBB-, Model
2). Based on the median of CSR score, I also divide the sample into high CSR group
(above median score, Model 3) and low CSR group (below median score, Model 4). In
table 1.6, the results show, the coefficient is negative but not significant from zero in
Model 1. This shows lenders do not value CSR activities for highly rated firms. In
contrast, the coefficient is negative and significant in Model 2. This means CSR
investment is useful in low-rated firms.
The results for high and low CSR firms are below. The coefficient is also negative
but not significant different from zero for high CSR firms in Model 3. But, the coefficient
is negative and significant for low CSR firms in Model 4. In summary, the results above

32
demonstrate that lenders are able to differentiate valuable CSR investment from CSR
overinvestment. For firms that are high-quality and invest in CSR activities above median
level, additional investment in CSR is perceived as overinvestment, which results in
agency cost. For firms that are low-quality and invest in CSR activities below median
level, more investment in CSR activities is helpful in lowing the firm’s risk and is valued
by lenders.
Table 1.9
High CSR vs. low CSR, high quality vs. low quality
This table reports coefficients from four subsamples. The Model 1 is high-quality
borrowers. The Model 2 is low-quality borrowers. In Model 3, I include high CSR
borrowers. In Model 4, I contain low CSR borrowers. The dependent variable is lead
lender share Descriptions of the explanatory variables are provided in Appendix. Fama
French 30 industry classification is included. *, **, *** indicate p-value less than 0.1,
0.05 and 0.01 respectively.
Model 1 Model 2 Model 3 Model 4
High quality Low quality High CSR Low CSR
CSR -0.0824 -0.3900** -0.3142 -1.1336**
(0.6461) (0.0491) (0.5418) (0.0448)
Bank asset (in million) 0.00563 0.00236 0.00408 0.00351
(0.0004) (0.3687) (0.0699) (0.0374)
Bank liquidity -9.6822 22.4101 -38.997 7.01413
(0.4994) (0.2366) (0.0355) (0.5873)
Bank ROA 148.455 -134.67 298.244 -275.51
(0.3598) (0.4932) (0.1822) (0.0632)
Loan charge off 487.44 1538.64 498.676 1081.87
(0.0379) (0.0002) (0.1664) (<.0001)
Loan loss allowance -1082.6 -1096.3 -894.09 -1142.1
(<.0001) (0.009) (0.0111) (<.0001)
Risk weighted asset 78.1409 -17.654 76.3144 46.8022
(0.0059) (0.6921) (0.07) (0.1058)
Subordinated debt -534.55 168.301 -661.89 -162.52
(0.0025) (0.5153) (0.0055) (0.2997)
Deposit -27.262 -7.8114 1.70412 -20.895
(0.0001) (0.3962) (0.847) (0.0009)
Tier1 capital ratio 398.44 -234 395.265 268.042
(0.0243) (0.4616) (0.1445) (0.1689)
Leverage ratio -441.83 406.51 -298.55 -304.75
(0.1056) (0.3691) (0.4912) (0.2883)
Asset (logarithm) 3.13499 0.84593 -0.0157 0.29217
Continued

33
Table 1.10 High CSR vs. low CSR, high quality vs. low quality - Continued
Model 1 Model 2 Model 3 Model 4
High quality Low quality High CSR Low CSR
(0.0003) (0.5903) (0.9894) (0.7179)
Tangibility -0.8396 -3.728 -4.5349 -0.416
(0.8273) (0.6061) (0.5087) (0.9217)
Tobins’Q 1.90255 -0.431 -0.9129 0.61025
(0.0461) (0.749) (0.4022) (0.5099)
Profitability -33.162 -10.866 -17.307 -25.559
(0.0048) (0.1885) (0.1844) (0.0003)
Cash Holdings 41.8026 35.7246 35.1988 45.1839
(<.0001) (0.0002) (0.0001) (<.0001)
Leverage -10.235 11.2851 7.68636 -0.2372
(0.0227) (0.0932) (0.2006) (0.9593)
R&D -17.469 19.7853 14.547 38.9788
(0.3615) (0.3691) (0.5101) (0.0308)
Rating -3.8871 -6.7049 -9.7933 -0.9049
(0.0348) (0.0204) (0.0004) (0.6387)
loan size (logarithm) -12.395 -15.632 -10.682 -13.324
(<.0001) (<.0001) (<.0001) (<.0001)
Loan maturity (logarithm) -8.4604 -1.1228 -6.5364 -5.1138
(<.0001) (0.5326) (<.0001) (<.0001)
Industry YES YES YES YES
R-Square 0.586236 0.562911 0.583170 0.540486
No. of observations 945 681 612 1437
1.4.2.3 High financial transparency firms vs. low financial transparency firms
Dhaliwal et al (2014) show that the information from firm’s CSR activities is an
alternative source for outsiders when information from the financial statement is not
abundant. Therefore, I conject that CSR activities are more valued in firms whose
financial transparency is low. In contrast, for high financial transparent firms, CSR is less
valued by lenders. To test my hypothesis, I follow Dhaliwal et al (2014) and use average
accruals over past three years to proxy the degree of financial transparency. I divide the
sample into two groups based on the median of average accruals. My results are shown in
Table 1.7. The coefficients are negative in both two groups of firms. However, the

34
influence is significant when firms are less financially transparent. However, the
influence is significant when firms are less financially transparent.
Table 1.7
High financial transparency firms vs. low financial transparency firms
This table reports coefficients from two subsamples. The Model 1 is high financial
transparency borrowers. The Model 2 is low financial transparency borrowers. The
dependent variable is lead lender share Descriptions of the explanatory variables are
provided in Appendix. Fama French 30 industry classification is included. *, **, ***
indicate p-value less than 0.1, 0.05 and 0.01 respectively.
(1) (2)
High financial
transparency
Low financial
transparency
CSR -0.1611 -0.6460**
(0.5907) (0.0609)
Bank asset (in million) 0.00417 0.00341
(0.0446) (0.1067)
Bank liquidity -37.188 8.47462
(0.0269) (0.5896)
Bank ROA 245.515 -141.88
(0.2418) (0.474)
Loan charge off 454.758 1062.87
(0.1371) (0.0043)
Loan loss allowance -663.84 -1299.9
(0.0466) (0.0002)
Risk weighted asset 26.9778 69.8236
(0.4277) (0.0739)
Subordinated debt -545.95 -342.08
(0.0121) (0.0847)
Deposit -16.618 -19.101
(0.0481) (0.0113)
Tier1 capital ratio 145.78 342.421
(0.5184) (0.1948)
Leverage ratio 30.3958 -381.03
(0.9297) (0.345)
Asset (logarithm) -1.7565 2.6194
(0.0879) (0.015)
Tangibility 9.20324 0.25782
(0.1032) (0.9634)
Tobins’Q -0.9394 0.2627
(0.4115) (0.7792)
Profitability -5.5362 -34.242
(0.6145) (0.0001)
Continued

35
Table 1.7 High financial transparency firms vs. low financial transparency firms -
Continued
(1) (2)
High financial
transparency
Low financial
transparency
Cash Holdings 48.478 44.5444
(<.0001) (<.0001)
Leverage -0.0417 5.23952
(0.9944) (0.3483)
R&D 34.1474 16.8044
(0.2277) (0.3556)
Rating 0.95903 -8.3442
(0.6841) (0.001)
loan size (logarithm) -10.916 -14.907
(<.0001) (<.0001)
Loan maturity (logarithm) -8.0676 -5.081
(<.0001) (<.0001)
Industry YES YES
R-Square 0.471635 0.636166
No. of observations 976 819
1.4.2.1 CSR and syndicated loan rates
Although views on CSR initiatives are mixed in literature, CSR activities are
favorable on debt market (Ge and Liu (2015); Goss and Roberts (2011 )). To support this
argument, I test whether borrowers receive discounts on syndicated loan rates when they
are socially responsible firms. In table 1.8, I regress the syndicated loan spread on CSR
overall score and control variables for borrower, lender, and loan. The dependent variable
is All-in-drawn spread, which is the basis points over LIBOR plus any annual fee and/or
up-front fee. Since the All-in-drawn spread is reported at facility level, I match the
corresponding facilities for each package in my sample and then conduct the test at
facility level. The key independent variable is CSR overall score. Consistent with Goss
and Roberts (2011), I find negative and significant coefficient, indicating that high CSR

36
firms enjoy discounts on loan rates. The results provide supports to the advocated
argument on
Table 1.8
Regression of syndicated loan spread against overall CSR score
This table shows the coefficients from a regression of the syndicated loan spread on
overall CSR score and controls for borrower, lender, and loan characteristics. The
dependent variable is All-in-drawn spread, which is the basis points over LIBOR plus
any annual fee and/or up-front fee. Descriptions of the explanatory variables are
provided in Appendix. OLS is conducted and p-value is included in parenthesis. Fama
French 30 industry classification is included. *, **, *** indicate p-value less than 0.1,
0.05 and 0.01 respectively.
Syndicated loan spreads
CSR -4.1798***
(<.0001)
Bank asset (in million) 0.00734
(0.1644)
Bank liquidity 19.5936
(0.6343)
Bank ROA -1310.9
(0.009)
Loan charge off 3402.71
(<.0001)
Loan loss allowance 2320.2
(0.0076)
Risk weighted asset 188.822
(0.038)
Subordinated debt -559.95
(0.2675)
Deposit -48.668
(0.0158)
Tier1 capital ratio 2480.83
(<.0001)
Leverage ratio -2475.9
(0.0068)
Asset (logarithm) -14.373
(<.0001)
Tangibility 3.59431
(0.7911)
Tobins’Q -18.072
(<.0001)
Profitability -140.25
(<.0001)
Cash Holdings 84.3432
Continued

37
Table 1.8 Regression of syndicated loan spread against overall CSR score -
Continued
Syndicated loan spreads
(<.0001)
Leverage 159.261
(<.0001)
R&D 132.708
(0.015)
Rating -7.8654
(0.1912)
loan size (logarithm) -16.172
(<.0001)
Loan maturity (logarithm) 2.9562
(0.3829)
Number of lenders (facility level) -0.0277
(0.9337)
Industry YES
R-Square 0.446522
No. of facilities 1955
CSR. That is, CSR activities lower the firm’s idiosyncratic risk, which is relevant to the
firm’s ability to repay the creditors. Therefore, in syndicated loan setting, in terms of the
lender’s response, CSR activities are beneficial to the firms.
1.4.3 Robustness check
This section shows results from robustness check.
1.4.3.1 Instrumental variable regressions
Although it is unlikely that syndicated loan structure affects CSR activities (i.e.
reverse causality), it is possible that unobservable factors jointly affect CSR activities and
syndicated loan structure (i.e. omitted variables bias). To alleviate this potential problem,
following Goss and Roberts (2011), I use the strength of Republican Party in each state as
an instrumental variable and run two-stage least squares analysis. The rationale behind
using Republican strength is that high CSR firms tend to be located in Democratic states

38
while low CSR firms are mostly found in Republican states. Following Rubin (2008), I
obtain the strength of Republican Party from state voting trends3. Table 1.9 shows the
results from the two-stage least squares analysis. The coefficients in both Model 1 and
Model 2 remain negative and significant at the 1% level, confirming the results from our
baseline regression.
1.4.3.1 Alternative CSR measurement
Thus far, I have tested our hypothesis with the use of overall CSR score and seven
Table 1.9
Instrumental variable regression
This table reports estimations by conducting two-stage least squares. The instrumental
variable is Republican strength in every state. The dependent variable is lead lender
share in Model 1. In Model 2, the dependent variable is HHI. Descriptions of the
explanatory variables are provided in Appendix. Fama French 30 industry
classification is included. *, **, *** indicate p-value less than 0.1, 0.05 and 0.01
respectively.
(1) (2)
Lead lender shares HHI
CSR -3.9968*** -665.16***
(0.0009) (<.0001)
Bank asset (in million) 0.00351 0.34319
(0.013) (0.0617)
Bank liquidity -6.5964 -188.77
(0.5506) (0.8955)
Bank ROA -93.397 -8607.4
(0.4717) (0.61)
Loan charge off 970.928 127535
(<.0001) (<.0001)
Loan loss allowance -1115.3 -131392
(<.0001) (<.0001)
Risk weighted asset 46.9197 10692.4
(0.0561) (0.0008)
Subordinated debt -314.15 -33973
(0.0215) (0.0558)
Deposit -14.361 -1520.3
(0.0072) (0.0286)
Tier1 capital ratio 252.771 69678.6
Continued
3 See www.thegreenpapers.com

39
Table 1.9 Instrumental variable regression - Continued
(1) (2)
Lead lender shares HHI
(0.1243) (0.0011)
Leverage ratio -210.41 -81289
(0.3937) (0.0113)
Asset (logarithm) 0.74719 -247.71
(0.2707) (0.005)
Tangibility -1.1216 -804.89
(0.761) (0.0934)
Tobins’Q -0.1053 -64.75
(0.8812) (0.4797)
Profitability -23.595 -2571.7
(0.0002) (0.0019)
Cash Holdings 40.8044 5386.08
(<.0001) (<.0001)
Leverage 3.56176 1297.24
(0.351) (0.009)
R&D 28.6695 4800
(0.0522) (0.0124)
Rating -4.0238 -266.18
(0.0137) (0.2096)
loan size (logarithm) -13.117 -883.02
(<.0001) (<.0001)
Loan maturity (logarithm) -5.3983 -498.99
(<.0001) (<.0001)
Industry YES YES
Adj R-Sq 0.49948 0.35978
No. of observations 2049 2049
individual CSR components. Another proxy of CSR widely used in literature is Domini
400 Social Index (DSI400) (e.g. Kim, Park and Wier (2012); McWilliams and Siegel
(2000 )). Firms included in DSI400 are defined as CSR firms. Therefore, I create dummy
variable DSI that takes value of 1 if the firm is listed in DSI 400 Index, and 0 otherwise.
The results are shown in Table 1.10. Consistent with results from baseline regression, I
find smaller lead lender share and low HHI for firms listed in DSI400 Index, suggesting
DSI 400 firms are considered less risky by lenders.

40
Table 1.10
Regression of syndicated loan structure against Domini 400 Social Index firms
This table reports results from regressing syndicated loan structure on Domini 400
Social Index firms. Firms included in DSI 400 Index are high CSR firms. I create
dummy variable DSI that takes value of 1 if the firm is listed in DSI 400 Index, and 0
otherwise. The dependent variable is lead lender share in Model 1. In Model 2, the
dependent variable is HHI. Descriptions of the explanatory variables are provided in
Appendix. Fama French 30 industry classification is included. *, **, *** indicate p-
value less than 0.1, 0.05 and 0.01 respectively.
(1) (2)
Lead lender shares HHI
DSI -0.894** -143.692**
(0.049) (0.038)
Bank asset (in million) 0.00341 0.3256
(0.0113) (0.0537)
Bank liquidity -7.1341 -239.28
(0.4977) (0.8563)
Bank ROA -92.623 -9066.2
(0.4535) (0.5591)
Loan charge off 997.574 134364
(<.0001) (<.0001)
Loan loss allowance -1120.6 -134263
(<.0001) (<.0001)
Risk weighted asset 47.1288 10861.5
(0.0439) (0.0002)
Subordinated debt -318.69 -35625
(0.0143) (0.0292)
Deposit -15.542 -1787
(0.0022) (0.0051)
Tier1 capital ratio 259.453 71711.5
(0.0975) (0.0003)
Leverage ratio -223.63 -85243
(0.3411) (0.0039)
Asset (logarithm) 0.63328 -284.37
(0.3289) (0.0005)
Tangibility 0.04482 -566.99
(0.9898) (0.1967)
Tobins’Q -0.1801 -97.285
(0.7898) (0.2516)
Profitability -23.042 -2515.3
(0.0001) (0.001)
Cash Holdings 41.8526 5562.13
(<.0001) (<.0001)
Leverage 3.43994 1300.18
(0.3442) (0.0045)
Continued
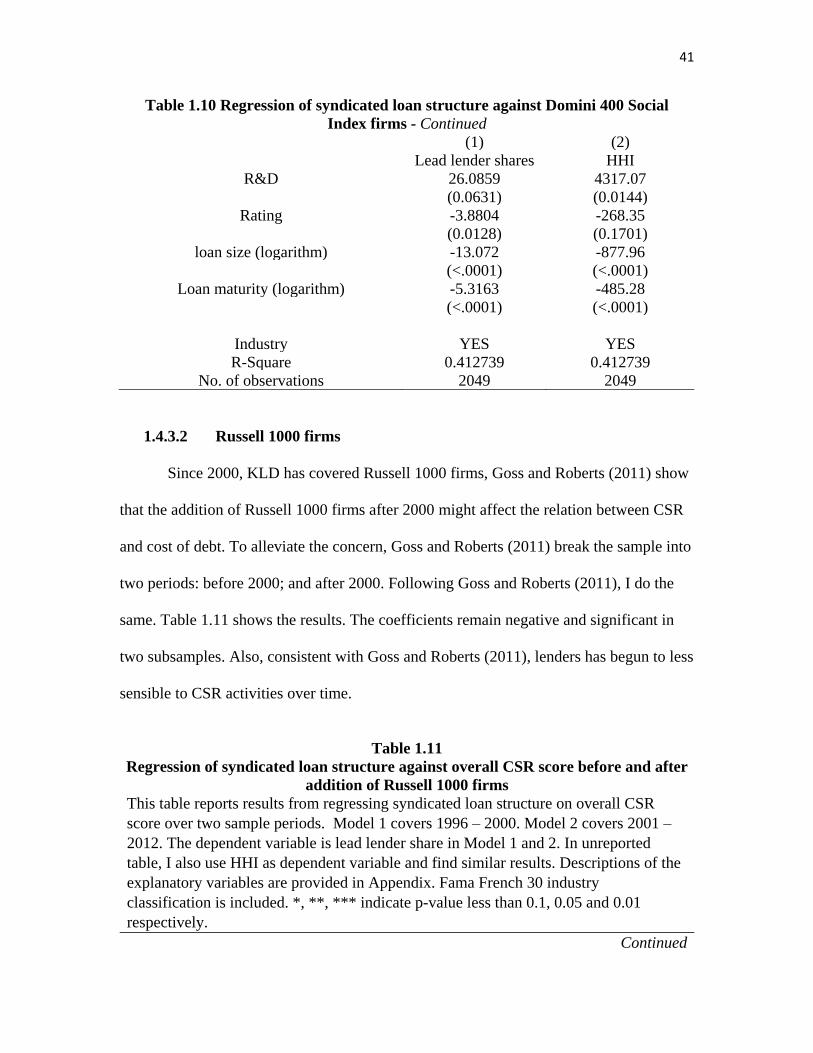
41
Table 1.10 Regression of syndicated loan structure against Domini 400 Social
Index firms - Continued
(1) (2)
Lead lender shares HHI
R&D 26.0859 4317.07
(0.0631) (0.0144)
Rating -3.8804 -268.35
(0.0128) (0.1701)
loan size (logarithm) -13.072 -877.96
(<.0001) (<.0001)
Loan maturity (logarithm) -5.3163 -485.28
(<.0001) (<.0001)
Industry YES YES
R-Square 0.412739 0.412739
No. of observations 2049 2049
1.4.3.2 Russell 1000 firms
Since 2000, KLD has covered Russell 1000 firms, Goss and Roberts (2011) show
that the addition of Russell 1000 firms after 2000 might affect the relation between CSR
and cost of debt. To alleviate the concern, Goss and Roberts (2011) break the sample into
two periods: before 2000; and after 2000. Following Goss and Roberts (2011), I do the
same. Table 1.11 shows the results. The coefficients remain negative and significant in
two subsamples. Also, consistent with Goss and Roberts (2011), lenders has begun to less
sensible to CSR activities over time.
Table 1.11
Regression of syndicated loan structure against overall CSR score before and after
addition of Russell 1000 firms
This table reports results from regressing syndicated loan structure on overall CSR
score over two sample periods. Model 1 covers 1996 – 2000. Model 2 covers 2001 –
2012. The dependent variable is lead lender share in Model 1 and 2. In unreported
table, I also use HHI as dependent variable and find similar results. Descriptions of the
explanatory variables are provided in Appendix. Fama French 30 industry
classification is included. *, **, *** indicate p-value less than 0.1, 0.05 and 0.01
respectively.
Continued

42
Table 1.11 Regression of syndicated loan structure against overall CSR score
before and after addition of Russell 1000 firms - Continued
(1) (2)
1996-2000 2001-2012
CSR -1.2968* -0.7053**
(0.0836) (0.0117)
Bank asset (in million) -0.0128 0.00287
(0.4441) (0.0492)
Bank liquidity -79.713 0.86632
(0.0863) (0.9401)
Bank ROA 1647.26 -133.47
(0.072) (0.3)
Loan charge off -914.46 1001.2
(0.4802) (<.0001)
Loan loss allowance -116.2 -1073.6
(0.9188) (<.0001)
Risk weighted asset -124.08 61.9172
(0.5545) (0.0134)
Subordinated debt -166.44 -370.79
(0.5815) (0.0172)
Deposit -2.3508 -12.966
(0.9063) (0.0196)
Tier1 capital ratio -902.06 296.539
(0.6486) (0.0707)
Leverage ratio 1360.07 -304.5
(0.5624) (0.2235)
Asset (logarithm) 1.4664 0.96115
(0.4994) (0.1727)
Tangibility -5.1642 0.42292
(0.6846) (0.9087)
Tobins’Q -0.096 0.13583
(0.9593) (0.8628)
Profitability 2.87577 -24.938
(0.9169) (<.0001)
Cash Holdings -5.4544 45.5642
(0.8025) (<.0001)
Leverage 4.43694 3.23082
(0.7062) (0.4052)
R&D 134.065 19.6638
(0.0079) (0.1887)
Rating -3.7798 -3.5781
(0.3829) (0.0325)
loan size (logarithm) -11.949 -13.027
(<.0001) (<.0001)
Loan maturity (logarithm) -4.0607 -5.8883
Continued

43
Table 1.11 Regression of syndicated loan structure against overall CSR score
before and after addition of Russell 1000 firms - Continued
(1) (2)
1996-2000 2001-2012
(0.0175) (<.0001)
Industry YES YES
R-Square 0.595478 0.543076
No. of observations 320 1729
1.5 Conclusion
In this paper, I empirically examine the association between corporate social
responsibilities and syndicated loan structure. I propose that lenders view CSR
performance as risk-mitigating factor in the process of forming syndicate structure. Using
a sample of syndicated loans in the U.S. market and controlling for borrower characteristics,
lender characteristics, loan characteristics, as well as industry, our results show that
syndicated loan structure is less concentrated when the borrower has better CSR
performance, which is consistent with our hypothesis. Furthermore, I document that not all
seven components of CSR score are valued by lenders. In particular, community
engagement, employee relations, human rights, and governance are significantly related to
syndicated loan structure while diversity, environment performance, product safety do not.
I also resolve endogeneity problem, apply alternative measurements, and conduct
robustness check. Our findings remain significant and hold.
Our results contribute to extant syndicated loan structure literature by finding that
CSR investment affect lender’s decision on syndicated loan structure and contribute to the
debate of whether firms should engage in CSR activities by showing that lender values
borrowing firm’s appropriate CSR investment.

44
CHAPTER II
DOES GEOGRAPHICAL DISTANCE AFFECT SYNDICATED LOAN
STRUCTURE: LENDER AND REGULATOR
2.1 Introduction
Recent empirical research has focused on the determinants of syndicated loan
structure from the borrower’s perspective (e.g. Dennis and Mullineaux (2000 )), lender’s
perspective (e.g. Jones, Lang and Nigro (2005 )), the borrower-lender relationship (e.g.
Ferreira and Matos (2012 )), and lead lender-participant lender relationship (e.g. François
and Missonier‐Piera (2007 )). However, factors about the lender’s regulator have not been
studied. In this paper, we investigate whether and how the physical distance between lender
and the lender’s regulator affects syndicated loan structure.
Over the past several decades, information and communication technologies have
advanced significantly. These developments have led to a change from face-to-face
communication to impersonal communication in the banking market. However, on-site
examinations of bank regulators against banks are still the best and most frequently used
way (Rezende and Wu (2014 )).
A large number of literature focus on the influence of geographical distance
between lenders and borrowers (e.g. Agarwal and Hauswald (2006); Degryse and Ongena
(2005); Knyazeva and Knyazeva (2012); Petersen and Rajan (2002 )), while fewer shows
interests in the influence of geographical distance between lenders and lenders’ regulator.
Among those literature, Lim, Hagendorff and Armitage (2016) show that distance between
lenders and lenders’ regulator is a proxy for information asymmetry and cost of collecting
soft information. A shorter distance between lenders and lenders’ regulator gives the

45
regulator a superior knowledge on local economic conditions and the bank’s loan portfolio
performance, which improve the efficacy of supervision. Kedia and Rajgopal (2011)
document that regulators are more likely to examine nearby firms due to the limited time
and money, and regulators are more knowledgeable about proximate firms because
potential casual communication between regulators and firms.
In a syndicated loan, the lead lender’s behavior determines the loan structure and
rates to a large degree. If the lead lender is aggressive and prone to make risky loans, on
the one hand, the lead lender itself may either want to hold less syndicated loan in order to
diversify the loan risk or seek to hold more syndicated loan shares to increase its power in
the following possible renegotiation; on the other hand, participant lenders would demand
lead lenders to hold larger portion of loans and require higher rates to protect themselves
from potential adverse selection and moral hazard problems. A closer distance between a
bank and the bank’s regulator, which is a proxy of information advantage and efficient
supervision, constrains the bank’s aggressive behavior, and therefore plays a role in the
syndicated loan structure formation and pricing.
In consistent with those literature, I use the geographical distance between banks
and bank regulators as a proxy for information asymmetry and efficacy of supervision. The
empirical results show that lead lenders proximate to regulatory offices hold less of the
syndicated loan because of the low possibility of renegotiation and less pressure from
participant lenders. Furthermore, I examine whether the distance between lead lender and
regulator also affects the syndicated loan spreads. The results document that because more
effective and intensive supervisions lower lead lenders’ loan portfolio risks and increase
trustiness from participant lenders, the syndicated loan spreads are lower when lead lenders

46
are close to regulators. In addition, I also find the influence of lender-regulator distance is
more obvious when lenders do not have superior reputation, indicating that lenders’
internal controls and external supervisions play the similar role. Moreover, my main results
are robust to an alternative measurement and the inclusion of CSR factor.
This paper contributes to the literature in several ways. First, to the best of my
knowledge, this paper is the first one linking syndicated loan structure and rates to the
lender’s regulator. I find another factor, i.e. lender-regulator distance, also affects
syndicated loan structure and rates. Second, the results also have practical meanings. To
limit bank’s aggressive activities, regulator office and branches play an important role. For
this view, the bank regulator should keep current or open more branches rather than close
branches.
The remainder of the paper is structured as follows: Section 2 presents data and
methodology. Section 3 shows results or main analysis and additional analyses. Section 4
draws conclusion.
2.2 Literature review
This section provides literature on bank supervision and geographical distance. In
section 2.2.3, I develop the hypothesis.
2.2.1 Bank supervision and geographical distance
The banking regulation system is complicated in the United States. There are three
regulators: the Federal Reserve system (Fed), the Federal Deposit Insurance
Corporation (FDIC), and the Office of the Comptroller of the Currency (OCC) which
merged with the Office of Thrift Supervision (OTS) in 2011. Although the primary goal of
these three regulators is to maintain the stability and soundness of the United States

47
financial system, they supervise different types of banks. For example, the Federal Reserve
is the regulator of bank holding companies and state-chartered banks that are members of
the Federal Reserve System, while nonmembers of state-chartered banks are supervised by
FDIC. As to national banks, OCC is the supervisor.
The supervisory process of the Federal Reserve Bank consists of on-site
examinations and off-site surveillance, in which on-site examination is the major method
(Rezende and Wu (2014 )). After the passage of the Federal Deposit Insurance Corporation
Improvement Act of 1991 (FDICIA), bank regulators are required to send teams to banks
to conduct on-site examinations at least once every 12 months or 18 months depending on
a six criteria assessment of the bank. In order to identify banks’ weaknesses and improve
their safety and soundness, the main goal that supervision teams seek to reach is to abstain
banks from engaging in high risk loans (Kupiec, Lee and Rosenfeld (2017 )).
One supervisory team includes one senior supervisory officer who interacts with
the board of directors and executive management, and a number of team specialists who
communicate with members of management. In the process of on-site examination,
supervision teams review documents and evaluate banks’ capital adequacy, asset quality,
management, earnings, liquidity, and sensitivity to market risk, known as CAMELS. After
supervision teams finish the assessment and the reports, they communicate their findings
with staffs from banks. The discussion topics include but not limited to the banks’ overall
conditions, the problems the banks have, suggestions to solve the problems, and plans on
future supervisions.
Therefore, an effective communication between bank regulators and banks
improves the collection of soft information and the quality of supervision, which ameliorate

48
the banks’ overall conditions, including loan portfolio performance and risk management.
However, barriers influencing the communication between bank regulators and banks exist,
such as geographical distance between bank regulators and banks.
Physical distances are positively related to information asymmetry problems and
therefore are considered as a proxy for information asymmetry problems in literature (e.g.
Kedia and Rajgopal (2011); Kubick and Lockhart (2016); Lim, Hagendorff and Armitage
(2016 )). For instance, Hauswald and Marquez (2006) construct a model showing that
information quality decays with distance between lender and borrower. Lim et al (2016)
document that banks are more transparent to their regulators when banks are closer to
regulators geographically because shorter distances between banks and bank regulators
make it easier for regulators to obtain soft information about banks and mitigate the
information asymmetries between banks and bank regulators. In addition, the information
on a banks’ loan performance is more reliable when banks are geographically close to
regulators, which know the local economic situation. In contrast, the information on a
banks’ loan performance is less reliable when banks are geographically away from
regulators, which know the local economic situation.
Furthermore, geographical distance is also linked to the effectiveness of
supervision and the proportion of resources allocating to the supervision. For example,
Kedia and Rajgopal (2011) document that regulators allocate more monitoring resources
to closer firms because it is cheaper in terms of time and money, and regulators are more
knowledgeable about proximate firms because potential casual communication between
regulators and firms. In the meantime, firms located closer to regulators are less likely to
commit a violation since firms are well informed about the regulator’s policy and the cost

49
of violation. Firms located farther to regulators are more likely to commit a violation since
firms are less informed about the regulator’s policy and the cost of violation.
2.2.2 Syndicated loan
In a syndicate setting, two major forces affect the syndicated loan structure. On the
one hand, the lead lender is willing to retain larger portion of the loan either because the
participant lenders demand the lead lender to hold more proportion of the loan for the
concern of asymmetric information between participant lenders and lead lenders (Sufi
(2007 )) or because the lead lender is willing to do so to save costs of renegotiation when
the loan is risky and therefore has higher chance to default (Lee and Mullineaux (2004 )).
On the other hand, the lead lender has less incentive to hold more shares of the loan because
the lead lender wants to diversify its credit risk (Simons (1993 )).
2.2.3 Hypothesis development
The major goal of bank supervision is to refrain bank from making high risk or low
quality loans. Therefore, a more effective bank supervision will have significant influence
on the lending behavior of low quality borrower (Kupiec, Lee and Rosenfeld (2017 )).
Shorter geographical distance between bank regulators and banks improves the bank
supervision effectiveness by reducing the information asymmetries between bank
regulators and banks (Lim, Hagendorff and Armitage (2016 )), by allocating more
monitoring resources to nearby banks (Kedia and Rajgopal (2011 )), and by making it
easier to detect bank sensitive information (Berger, Bouwman, Kick and Schaeck (2016 )).
Exposed under the more effective supervision, banks close by bank regulators
would be prudent on screening loans and be more responsible for monitoring loans, the
behaviors that reduce the probability of loan renegotiation. Therefore, the lead lender has

50
less incentive to hold larger proportion of the loan to gain renegotiation power. Meanwhile,
participant lenders trust lead lenders to a greater extent because of more effective
supervision from regulators to nearby banks. The trust reduces participant lenders’ demand
on lead lenders’ holdings. Taken together, the lead lender’s holding should be fewer when
the lead lender is proximate to the regulator.
One thing deserves to be mentioned is the lead lender’s risk diversification purpose.
As the loan portfolio performance improves under more effective supervision, the lead
lender also has incentive to retain more of the loan share. However, empirical studies show
that lead lenders do not do so because they value their own reputation in syndicated loan
market (e.g. Panyagometh and Roberts (2010 )).
Consequently, as a whole, I hypothesis that
H1: Lead lenders hold few shares of syndicated loan when lead lenders are
proximate to bank regulators.
Further, I study whether bank-regulator distance affects syndicated loan spreads.
Similar to the rationale behind syndicated loan structure, factors from lead lenders and
participant lenders all affect the rates. Because bank supervision includes the examination
on the processes of loan issuance and risk management, an effective and intensive bank
supervision reduces the possibility that lead lenders syndicate risky loans and shirk
monitoring responsibilities (Kupiec, Lee and Rosenfeld (2017 )).
As one of the factors facilitating an effective and intensive bank supervision,
geographical distance between banks and regulators receives a special attention in an
annual report of the Federal Reserve Bank of St. Louis, which states that regulator staffs

51
are able to effectively collect deeper information when they involve in local economies4.
In academia, Lim, Hagendorff and Armitage (2016) and Berger, Bouwman, Kick and
Schaeck (2016) study the importance of geographical distance between banks and
regulators and argue proximate regulators possess more information on banks’ true loan
performance and allocate more resources to monitor the banks.
Therefore, it is reasonable to conjecture banks nearby regulators charge lower loan
rates due to the reduced loan risk and less pressure from participant lenders who demand
higher loan rates to compensate for possible adverse selection and moral hazard problems.
Accordingly, I hypothesize that
H2: Syndicated loan spreads are lower when lead lenders geographically
proximate to regulators.
2.3 Data and methodology
This section provides data and methodology.
2.3.1 Dataset
We draw U.S. syndicated loan sample from the Loan Pricing Corporation (LPC)
DealScan database, which collects information from SEC filings, public documents (e.g.
10K) and internal sources. The borrower-specific characteristics are collected from
Compustat. To merge borrower accounting information with borrower names in DealScan,
we use the DealScan-Compustat link provided by Chava and Roberts (2008).
To find lender’s location, we use lender’s zip code from DealScan first. If this
information is missing in DealScan, we look up lender’s zip code from the Bank Regulatory
database, which contain data of all commercial banks and bank holding companies. The
4 https://www.stlouisfed.org/annual-report/2013

52
accounting variables of banks are compiled from FR Y-9C. To obtain bank regulatory
location data, we manually collect the data from the Fed website.
2.3.2 Sample
Our sample period is 1996—2012. We apply following selection criteria to
construct our sample. First, since we focus on the lead lender which plays the major role
before, during and after loan initiated, we follow Hauswald and Marquez (2006) to analyze
our sample at the facility level, not the package level. Second, consistent with Kleimeier
and Chaudhry (2015) and Coleman, Esho and Sharpe (2006), we analyze facilities with
one lead lender only. Third, to ensure syndicated loan structure is not affect by factors at
the country level, we exclude borrowers and lenders that are outside the U.S. Fourth, we
exclude facilities whose borrowers belong to financial industry (SIC code 6000--6999).
2.3.3 Dependent variable
We focus on two proxies to measure syndicated loan concentration. The first
dependent variable related to syndicated loan concentration is lead bank share. High lead
bank share indicates high syndicated loan concentration. On average, lead bank holds 24.43%
share in each facility.
Second, we use Herfindahl-Hirschman index (HHI) to capture the influence of each
lender on syndicated loan structure. HHI is calculated as a sum of squared percentage share
of each lender in the facility. Thus, the value ranges from 0 to 10,000 and the smaller value
represents more diversified syndicate structure. In our sample, the average HHI reaches to
1773.04 at facility level.
2.3.4 Key independent variable (Distance variable)
In general, to measure the distance, we use Haversine distance function.

53
, 2 arcsin( )a bDis r h=,
2 2sin ( ) cos( )cos( )sin ( )2 2
b a b aa bh C C C C
− −= + ,
r3,959 mi, C=π/180
Where Disa,b refers to the physical distance between borrower and lender or
between regulator and lender in miles. h refers to Haversine formula. θa, φa refer to the
latitude of location a and b; θb, φb refer to the longitude of location a and b. C is constant,
which equals to the ratio of π and 180.
Specifically, we measure physical distance between lender and regulator. We
obtain zip code of lender from Dealscan and Bank Regulatory. To find corresponding
coordinates, we resort to US Census files. By using Haversine distance function, we derive
distance and then we take natural log of the distance.
Our key independent variable is Bank-Fed distance (closest) which is natural
logarithm of physical distance between the closest federal reserve bank or branch and
lenders within this federal reserve bank’s district. For instance, if the lender is at Austin,
Texas, this bank is in the 11th district. Then, the Bank-Fed distance (closest) is the
geographical distance between lender and federal reserve bank branch at San Antonio
which is closer to Austin than Dallas.
Alternatively, as a robustness check, we use Bank-Fed distance (Federal Reserve
Bank) which is the natural logarithm of physical proximity between the Federal Reserve
Bank and lenders within this Federal Reserve Bank’s district. For instance, if the lender is
at Austin, Texas, this bank is in the 11th district. Then, the Bank-Fed distance (Federal

54
Reserve Bank) is the geographical distance between lender and federal reserve bank at
Dallas.
2.3.5 Control variables
First, we control for bank characteristics that can affect the bank’s risk-taking
activity, including total capital ratio, leverage ratio, lender size, lender liquidity, bank ROA,
loan loss allowance, risk weighted asset, and deposit. Second, Lee and Mullineaux (2004)
find that factors that lead to information asymmetries, credit risk, agency problem and
factors that are related to loan characteristics, lead bank reputation can influence syndicated
loan structure. Therefore, we control for variables under those categories. Specifically, we
control for borrower’s S&P rating and asset to mitigate information asymmetry concern.
Borrower’s leverage is controlled due to credit risk issue. Furthermore, we control for
borrower’s R&D expenditures to alleviate the influence of agency problem. In line with
literature, we also control for borrower’s Tobin’s q, tangibility, profitability, cash holding,
and cashflow volatility. Loan characteristics, such as facility size, maturity, loan purpose,
loan security, are also controlled. To control for lead lender’s reputation, we use lead
lender’s market share as proxy, which is calculated based on number of packages each
lender has (Ivashina (2009 )). Finally, consistent with the literature, we control for firm and
industry fixed effects.
2.3.6 Empirical models
The first part of our analysis is to study whether physical proximity between lender
and regulator affect syndicated loan structure. To examine this hypothesis, we perform
analysis on following model. We follow Lee and Mullineaux (2004) to perform Ordinary
Least Square (OLS).

55
Syndicated structure variable = β0 + β1Bank-Fed distance + β2X + ε (1)
Where syndicate structure is proxied by lead bank share and HHI. Bank-Fed
distance (Federal Reserve Bank) is natural logarithm of physical proximity between the
federal reserve bank and lenders within this federal reserve bank’s district. X’s are sets of
control variables, including borrower characteristics (firm size, asset tangibility, Tobin’s q,
profitability, leverage, cash holdings, credit rating, R&D, cash flow volatility), loan
characteristic (loan size, loan maturity, loan purpose, loan security), lender characteristic
(total capital ratio, leverage ratio, lender size, lender liquidity, bank ROA, loan loss
allowance, risk weighted asset, and deposit), lender reputation, and industry effects (Fama-
French 30 Industrial Classifications). β1 should be positive when dependent variable is lead
lender share or HHI.
Furthermore, we look into the influence of regulator-lender distance on syndicate
loan spread by performing the following multiple regression analysis.
Syndicated loan spreads = β0 + β1Bank-Fed distance + β2X + ε (2)
Where the dependent variable is measured by all-in-drawn basis point. The key
independent variable and control variables remain the same as those in regression (1).
2.4 Results
This section provides summary statistics and empirical results.
2.4.1 Summary statistics
Table 2.1 provides summary statistics for the sample. The average lead lender share
is about 25%, and the median is about 18%. Syndicated loan structure is called
concentrated if lead bank share is high, while low lead bank share indicates dispersed
syndicated loan structure. Banks are about 201 miles away from federal reserve bank and

56
45 miles away from the closest federal reserve bank or branch on average in the sample,
with median 188 miles and 6 miles respectively.
Table 2.1
Summary statistics
Variable Mean Median Std. Dev
Lead bank share 24.43 17.50 21.41
Herfindahl-Hirschman index (HHI) 1773.04 1056.25 1957.58
Bank-Fed distance
Bank-Fed distance (closest) (miles) 44.91 6.45 101.58
Bank-Fed distance (closest) 1.77 1.86 1.85
Bank-Fed distance (Federal Reserve Bank) (miles) 201.90 188.11 189.30
Bank-Fed distance (Federal Reserve Bank) 3.96 5.24 2.34
Bank characteristics
Tier1 capital ratio 0.09 0.08 0.01
Leverage ratio 0.07 0.06 0.01
Bank asset (million) 587.74 452.34 536.62
Bank liquidity 0.20 0.20 0.09
Bank ROA 0.01 0.01 0.01
Loan charge off 0.01 0.01 0.01
Loan loss allowance 0.01 0.01 0.01
Risk weighted asset 0.75 0.73 0.11
Deposit 0.52 0.60 0.24
Lead bank market share 9.87 9.87 0.01
Firm characteristics
Firm size 8.10 7.96 1.62
Tangibility 0.30 0.23 0.24
Tobin’s q 1.57 1.26 1.28
Profitability 0.15 0.14 0.13
Cash holding 0.10 0.05 0.12
Leverage 0.23 0.22 0.17
R&D 0.02 0.00 0.04
S&P rate 0.59 1.00 0.49
Cash flow volatility 0.54 0.03 10.24
Loan characteristics
Continued

57
Table 2.2 Summary statistics - Continued
Variable Mean Median Std. Dev
Maturity (month) 43.30 56.00 20.81
Loan size 19.60 19.51 1.20
Loan security 0.35 0 0.48
2.4.2 Multivariate results
This section shows multivariate results.
2.4.2.1 Syndicated loan structure and lender-regulator distance
Table 2.2 presents multivariate analysis of the relation between lender-regulator
distance and syndicated loan structure. We perform ordinary least squares regression in
model one and two. The dependent variable in first model is lead bank share while in the
second model is HHI. As we expected, the coefficients of Bank-Fed distance (closest) and
HHI are positive and significant. In another word, the lead lender holds fewer shares when
it is proximate to regulator. Specifically, an one standard deviation increase in the key
independent variable, Bank-Fed distance (closest), is associated with a 0.08 standard
deviation increase in the lead lender share. The results indicate the adverse selection and
moral hazard problems are mitigated as the lead lender gets closer to regulator because
regulator allocates more monitoring resources to proximate banks and the supervision is
more efficient. This can be partially attributed to regulator’s superior ability to collect soft
information from lender. With few concerns about adverse selection and moral hazard
problems, participant lenders are less likely to force lead lenders to hold a large proportion
of loans.
2.4.2.2 Syndicated loan rates and lender-regulator distance
Table 2.3 shows the relationship between lender-regulator distance and syndicated

58
Table 2.3
Regression of syndicated loan structure against bank-Fed distance (closest)
This table shows the coefficients from a regression of the syndicated loan structure on
bank-Fed distance (closest) and controls for borrower, lender, and loan characteristics.
The dependent variable is lead lender share in Model 1. In Model 2, the dependent
variable is HHI. Descriptions of the explanatory variables are provided in Appendix.
OLS is conducted and p-value is included in parenthesis. Fama French 30 industry
classification is included. *, **, *** indicate p-value less than 0.1, 0.05 and 0.01
respectively.
(1)
Lead lender shares
(2)
HHI
Bank-Fed distance (closest) 0.88*** 64.72***
(<.01) (<.01)
Firm size -0.05 29.88
(0.89) (0.34)
Tangibility 2.86 294.02
(0.16) (0.14)
Tobin’s q 1.64*** 165.01***
(<.01) (<.01)
Profitability -37.99*** -3508.47***
(<.01) (<.01)
Cash holding -3.13 -394.26
(0.36) (0.24)
Leverage -0.89 -7.14
(0.66) (0.97)
R&D -4.39 -829.97
(0.71) (0.48)
S&P rate -0.6 -4.59
(0.48) (0.95)
Tier1 capital ratio 60.89 19170.3751*
(0.58) (0.07)
Leverage ratio 23.05 -14466.15
(0.88) (0.93)
Bank asset (million) 0.01 0.09
(0.81) (0.34)
Bank liquidity 0.38 -374.04
(0.94) (0.48)
Bank ROA -192.65*** -19785.19***
(0.01) (0.01)
Loan charge off -342.04** -35116.97**
(0.02) (0.02)
Continued

59
Table 2.4 Regression of syndicated loan structure against bank-Fed distance
(closest) - Continued
(1)
Lead lender shares
(2)
HHI
Loan loss allowance -155.34 -18338.44
(0.31) (0.22)
Risk weighted asset 16.71 2815.22**
(0.21) (0.03)
Deposit 7.19 941.99*
(0.19) (0.08)
Loan size -6.67*** -672.25***
(<.01) (<.01)
Maturity (month) -0.14*** -15.93***
(<.01) (<.01)
No. of facilities 4356 4356
R2 0.40 0.38
Pr > F <.0001 <.0001
FF 30 industry Yes Yes
loan rates. As we expected, the coefficient is positive and significant, indicating syndicated
loan rates are lower as banks get closer to the regulator because bank regulators supervise
the bank’s loan portfolio performance and adequacy of bank’s risk monitoring activity,
which alleviates adverse selection and moral hazard problems.
Table 2.3
Regression of syndicated loan spreads against bank-Fed distance (closest)
This table shows the coefficients from a regression of the syndicated loan spreads on
bank-Fed distance (closest) and controls for borrower, lender, and loan characteristics.
The dependent variable is All-in-drawn spread. Descriptions of the explanatory
variables are provided in Appendix. OLS is conducted and p-value is included in
parenthesis. Fama French 30 industry classification is included. *, **, *** indicate p-
value less than 0.1, 0.05 and 0.01 respectively.
All in drawn spreads
Bank-Fed distance (Closest) 4.86***
(<.01)
Firm size -4.20***
(<.01)
Continued

60
Table 2.3 Regression of syndicated loan spreads against bank-Fed distance
(closest) - Continued
All in drawn spreads
Tangibility 22.55***
(<.01)
Tobin’s q -12.50***
(<.01)
Profitability -33.78
(0.13)
Cash holding -17.83
(0.49)
Leverage 73.43***
(<.01)
R&D -106.40*
(0.10)
S&P rate -7.36**
(0.03)
Cash flow volatility 70.48***
(<.01)
Tier1 capital ratio -1638.38
(0.92)
Leverage ratio 1890.34
(0.75)
Bank asset (million) 0.01***
(<.01)
Bank liquidity 187.74***
(<.01)
Bank ROA 7.56
(0.11)
Loan charge off 11.57
(0.20)
Loan loss allowance -1.78
(0.85)
Risk weighted asset 0.24
(0.75)
Deposit -1.29***
(<.01)
Loan size -14.59***
(<.01)
Maturity (month) 0.01**
Continued

61
Table 2.3 Regression of syndicated loan spreads against bank-Fed distance
(closest) - Continued
All in drawn spreads
(0.02)
Loan security 60.67**
(0.03)
Lead bank market share 0.51
(0.39)
Loan purpose Yes
R2 0.59
No. of facilities 3044
FF 30 industry Yes
2.4.2.3 Lead lender reputation and lender-regulator distance
Lead lender’s reputation can mitigate the potential adverse selection and moral
hazard problems between lead lenders and participant lenders (Gopalan, Nanda and
Yerramilli (2011 )). Therefore, an effective and intensive bank supervision should be more
valued by participant lenders when lead lenders lack good reputations. To measure lenders’
reputations, I follow Lee and Mullineaux (2004) to use lenders’ market share as proxy.
Then, I divide the sample into high reputation lead lenders and low reputation lead lenders
based on the median score. In table 2.4, I test the low reputation group and show the results
in model 1. Not surprisingly, the coefficient is positive and significant, suggesting that an
effective and intensive bank supervision mitigate participant lenders’ concern on lead
lenders’ potential adverse selection and moral hazard problems when lead lenders
reputations are low. In contrast, the coefficient in model 2 is not significant, where lead
lenders own high reputation. To substantiate the difference is statistically significant, I also
run Chow test for those two subsamples. The P-value of Chow test is significant at 1%

62
level. The results indicate lead lenders’ good reputations earn trustiness from participant
lenders.
Table 2.4
Lead lender reputation and lender-regulator distance
This table shows the coefficients from a regression of the syndicated loan structure on
bank-Fed distance (closest) and controls for borrower, lender, and loan characteristics
in two subsamples. In group 1, the lead lenders’ reputations are below median level. In
group 2, the lead lenders’ reputations are above median level. The dependent variable
is lead lender share in Model 1 and Model 2. Descriptions of the explanatory variables
are provided in Appendix. OLS is conducted and p-value is included in parenthesis.
Fama French 30 industry classification is included. *, **, *** indicate p-value less than
0.1, 0.05 and 0.01 respectively.
(1)
Low reputation lenders
(2)
High reputation lenders
Bank-Fed distance (closest) 1.91*** 1.59
(<.01) (0.14)
Firm size 0.44 1.12
(0.89) (0.10)
Tangibility 9.09 -1.86
(0.16) (0.65)
Tobin’s q 1.39*** 1.15
(<.01) (0.14)
Profitability -45.63*** -15.65***
(<.01) (<.01)
Cash holding -3.13 3.91
(0.36) (0.24)
Leverage -0.89 -7.14
(0.66) (0.97)
R&D -4.39 61.34
(0.71) (0.48)
S&P rate -0.6 -4.59
(0.48) (0.95)
Tier1 capital ratio 60.89 377.69*
(0.58) (0.07)
Leverage ratio 23.05 -2.52
(0.88) (0.93)
Bank asset (million) 0.01 0.09
(0.81) (0.34)
Bank liquidity 0.38 -374.04
Continued

63
Table 2.4 Lead lender reputation and lender-regulator distance - Continued
(1)
Low reputation lenders
(2)
High reputation lenders
(0.94) (0.48)
Bank ROA -178.32*** -303.37***
(0.01) (0.01)
Loan charge off -342.04** -290.09**
(0.02) (0.02)
Loan loss allowance -155.34 -433.97
(0.31) (0.22)
Risk weighted asset 16.71 38.27**
(0.21) (0.03)
Deposit 7.19 941.99*
(0.19) (0.08)
Loan size -6.67*** -3.63***
(<.01) (<.01)
Maturity (month) -0.14*** -15.93***
(<.01) (<.01)
No. of facilities 2634 1722
R2 0.26 0.21
Pr > F <.0001 <.0001
FF 30 industry Yes Yes
F-value of Chow test 4.62
2.4.3 Robustness tests
In this part, we conduct a battery of robustness tests to examine whether our main
results that syndicated loan structure is less concentrated when lenders are close to
regulators. Overall, the results from the robustness tests are not different from the primary
results.
2.4.3.1 Syndicated loan structure and distance between bank and the closest federal
reserve bank or branch
To further test the effect of lender-regulator distance on syndicated loan structure,
we employ another measure of lender-regulator distance, i.e. the distance between the bank

64
and the main federal reserve bank office in the district. In Table 2.5, we find significant
evidence that distance between the bank and the main federal reserve bank office affects
syndicated loan structure. Like distance between bank and closest federal reserve bank
office, distance between bank and the main federal reserve bank is positively related to the
lead bank share and the HHI.
Table 2.5
Robustness check: Syndicated loan structure and bank-Fed distance (Federal
Reserve Banks)
This table shows the coefficients from a regression of the syndicated loan structure on
bank-Fed distance (main office) and controls for borrower, lender, and loan
characteristics. The dependent variable is lead lender share in Model 1. In Model 2, the
dependent variable is HHI. Descriptions of the explanatory variables are provided in
Appendix. OLS is conducted and p-value is included in parenthesis. Fama French 30
industry classification is included. *, **, *** indicate p-value less than 0.1, 0.05 and
0.01 respectively.
Model
(1) (2)
Bank-Fed distance (Federal Reserve
Banks) 0.49*** 44.34**
(0.01) (0.02)
Firm size -0.06 29.55
(0.87) (0.40)
Tangibility 3.01 303.80
(0.14) (0.12)
Tobin’s q 1.57*** 161.31***
(<.01) (<.01)
Profitability -37.28*** -3459.47***
(<.01) (<.01)
Cash holding -3.19 -401.14
(0.34) (0.22)
Leverage -0.62 11.09
(0.76) (0.95)
R&D -0.78 -1075.22
(0.54) (0.35)
S&P rate -0.66 -8.70
(0.43) (0.91)
Cash flow volatility 1.71 23.65
Continued

65
Table 2.5 Robustness check: Syndicated loan structure and bank-Fed distance
(Federal Reserve Banks) - Continued
(1) (2)
(0.52) (0.93)
Tier1 capital ratio -29.14 12115.58
(0.79) (0.26)
Leverage ratio 147.26 -4457.19
(0.36) (0.77)
Bank asset (million) 0.01* 0.22**
(0.08) (0.01)
Bank liquidity -5.05 -804.31
(0.36) (0.13)
Bank ROA -158.94** -17500.89**
(0.03) (0.01)
Loan charge off -419.48*** -40712.10***
(<.01) (<.01)
Loan loss allowance 46.39 -2278.83
(0.76) (0.88)
Risk weighted asset 4.15 1794.37
(0.76) (0.17)
Deposit 5.10 807.49
(0.35) (0.14)
Loan size (ln) -6.66*** -670.21***
(<.01) (<.01)
Maturity (month) -0.14*** -15.76***
(<.01) (<.01)
No. of facilities 4356 4356
R2 0.41 0.38
Pr > F <.0001 <.0001
FF 30 industry Yes Yes
2.4.3.2 Robustness check: CSR initiatives
In Chapter 1, I find borrowers’ CSR activities affect syndicated loan structures. In
this chapter, I rerun the baseline regression with CSR factor. The results show that both the
significant level and magnitude of the coefficient drop slightly. The reason may be due to

66
the reduction in sample size after we include CSR score. However, in total, the results
remain robust after control for the CSR factor.
Table 2.6
Robustness check: CSR initiatives
This table shows the coefficients from a regression of the syndicated loan structure on
bank-Fed distance (closest) and controls for CSR, borrower, lender, and loan
characteristics. The dependent variable is lead lender share in Model 1. In Model 2, the
dependent variable is HHI. Descriptions of the explanatory variables are provided in
Appendix. OLS is conducted and p-value is included in parenthesis. Fama French 30
industry classification is included. *, **, *** indicate p-value less than 0.1, 0.05 and
0.01 respectively.
Lead lender shares
Bank-Fed distance (Closest) 0.87**
(0.03)
CSR -0.37**
(0.02)
Firm size -0.72***
(<.01)
Tangibility 7.85***
(<.01)
Tobin’s q 1.50***
(<.01)
Profitability -32.68
(0.13)
Cash holding -2.41
(0.49)
Leverage 3.56***
(<.01)
R&D -106.40*
(0.10)
S&P rate -7.36**
(0.03)
Tier1 capital ratio 700.20
(0.92)
Leverage ratio 887.80
(0.75)
Bank asset (million) 0.01***
(<.01)
Bank liquidity 23.26***
Continued
67
Table 2.6 Robustness check: CSR initiatives - Continued
Lead lender shares
(<.01)
Bank ROA 7.56
(0.11)
Loan charge off 11.57
(0.20)
Loan loss allowance -1.78
(0.85)
Risk weighted asset 0.24
(0.75)
Deposit -1.29***
(<.01)
Loan size -14.59***
(<.01)
Maturity (month) -4.88**
(0.02)
No. of facilities 3573
FF 30 industry Yes
2.5 Conclusion
I analyze the effects of physical distance between lead lenders and the lender
regulators on syndicated loan structure and rates. My findings are as follows. First,
syndicated loan structures are less concentrated as lead lenders get closer to the regulator.
Second, syndicated loan rates are lower when lead lenders are close to bank regulators.
Third, when lead lenders do not possess superior reputation, a closer physical distance
between lead lenders and the lender regulators reduces lead lender shares, implying more
effective supervisions from bank regulators. Fourth, the results are robust to an alternative
measurement and the inclusion of CSR factor. Overall, this paper finds compelling
evidence on the new factor, lender-regulator distance, which can affect syndicated loan
structure and rates.

68
CHAPTER III
MECHANISM TO OBTAIN OPTIMAL LOAN TERM: EVIDENCE FROM
BORROWER ANNUAL REPORT READABILITY
3.1 Introduction
Readability has been studied well in the finance literature. Research interest on
financial report readability includes the determinants of readability (e.g. Ajina, Laouiti and
Msolli (2016); Li (2008); Lo, Ramos and Rogo (2017); Nelson and Pritchard (2007 )) and
consequences of readability (e.g. Biddle, Hilary and Verdi (2009); Bonsall IV, Leone,
Miller and Rennekamp (2017); Hwang and Kim (2017); Kim, Wang and Zhang (2016);
Lee (2012); Miller (2010); Rennekamp (2012); You and Zhang (2009 )). Viewed
collectively, these studies imply poor-performing firms hide negative information while
well-performing firms highlight positive information by manipulating how financial report
readabilities are. In this essay, I investigate whether firms manipulate financial report
readability before syndicated loan issuance.
Using a sample over 1986 to 2012, I find that borrowers manipulate 10-X report
readability before syndicated loan issuance. Furthermore, I also explore whether borrowers
manipulate readability to improve bargaining power in the process of loan syndication. I
find evidence consistent with the literature that better-performing firms file easy-to-read
10-X before syndicated loan issuance in order to highlight favorable information while
poor-performed firms file hard-to-read 10-X before syndicated loan issuance in order to
hide negative information. Next, I examine the difference in borrower readability
manipulation behavior when firms are different in free cash flow. I find that firms with
more free cash flow file more transparent 10-X reports while firms with less free cash flow

69
file more obfuscated 10-X report before syndicated loan issuance because they are thirsty
for cash.
Further, I conduct additional tests to check what types of firms are likely to
manipulate financial report readabilities. For example, I study whether firms’ corporate
governance affects financial report readability manipulation. I use a G-index to proxy
corporate governance performance and find that good corporate governance limits firms’
readability manipulation before syndicated loan issuance. Only firms with poor corporate
governance obfuscate reports before syndicated loan issuance. I also look at whether better
auditors monitor the reports readability. The results show that big 4 auditors constrain firms’
readability manipulation. Also, I consider the possible bond effect on borrower’s
readability manipulation behavior. I conjecture that firms issued bond one year prior to
syndicated loan issuance have less incentive to file complicated 10-X reports because they
have access to an alternative external financing source. The results confirm the
expectations. Moreover, I use file size (Loughran and McDonald (2014 )) as the main
readability proxy in the baseline regression. The results are still significant when I apply
alternative measurements, fog index (Li (2008 )) and bog index (Bonsall IV, Leone, Miller
and Rennekamp (2017 )), to proxy readability.
The paper contributes to the growing literature in the area of syndicated loans and
the field of the textual properties of financial disclosure. First, I find a new channel through
which firms aggravate information asymmetries between borrowers and lenders in a
syndicated loan setting. To alleviate the agency problem between the borrower and lender,
the lender may require the borrower file more readable financial report.

70
Second, I complement the scant literature linking financial disclosure readability to
creditors. Since creditors are considered quasi-insiders, they have superior ability to collect
firm-specific information. Whether, and to what extent, the public financial report affects
creditor’s evaluation are less explored. I study the link between creditor and borrower’s
financial report readability ex ante, i.e. whether the borrower intentionally manipulates
readability before syndicated loan issuance.
Third, I find another mechanism which firms take advantage to gain bargaining
power in the process of loan syndication. The previous literature shows that to gain
bargaining power and obtain favorable loan terms, firms manage earnings (Ahn and Choi
(2009 )). Instead of managing earnings, I find that firms manipulate how readable the
financial reports are to get better loan terms.
The remainder of the paper proceeds as follows. In section 2, the literature is
reviewed, and the hypothesis is developed. Section 3 describes data selection and the
methodology used in the analysis. Section 4 provides main results and additional tests. In
section 5, I draw the conclusion.
3.2 Literature review and hypotheses development
This section provides literature review and hypothesis development.
3.2.1 Literature review
Firms are required to issue financial reports (e.g. 10-K, 10-Q) every period by the
SEC. These financial reports convey firm’s information and are evaluated by investors,
analysts, and creditors. As such, the quality of the financial report determines how
accurately investors, analysts, creditors, and even regulators are able to evaluate firm
performance. Although financial reports play important role in delivering firm’s

71
information to its users, it is not easy to read and comprehend those financial reports not
only for individual investors but also for sophisticated investors (Lawrence (2013); Lehavy,
Li and Merkley (2011); Miller (2010); Plumlee (2003); Rennekamp (2012 )). Firms seek
to hide negative information by making long and verbose financial reports containing
complex words because investors may overlook the important information if critical
information and unimportant information are mixed (Radin (2007 )). The SEC, therefore,
raised this concern and has been putting consistent efforts to make financial reports more
readable such that users are able to comprehend those financial reports easily and to assess
firm performance based on information contained in those financial reports. For example,
in 1998, SEC required companies to strictly comply with plain English principles (e.g.
short sentences, concrete everyday language, no multiple negatives) in financial reports,
and issued a Plain English Handbook to guide companies on plain English in order to
achieve their ultimate goal that is to have all disclosure documents written in plain English
(Securities, Education and Assistance (1998 )). In 2006, SEC extended the plain English
requirement to other types of disclosures, such as financial disclosures relating to corporate
governance and management compensation. In 2009, SEC further require mutual funds to
use plain English in their prospectus (Rennekamp (2012 )). However, the early literature
studies annual report readability are based on small samples and finds that annual reports
are not easy to read (Barnett and Leoffler (1979); Healy (1977); Jones and Shoemaker
(1994); Lebar (1982); Smith and Smith (1971); Soper and Dolphin (1964 )). Jones and
Shoemaker (1994) go over accounting narratives literature and summarize that majority of
those studies mention that financial reports are very difficult to read, and the difficulty level
is still increasing. Their findings are supported by Li (2008) who documents that financial

72
report’s readability continuously worsens. Consequently, the reasons and consequences of
such phenomena draw researchers’ attention.
In general, poor financial report readability results in negative consequences. On
debt markets, Bonsall and Miller (2017) examine the association between filling readability
and cost of debt and argue that less readable disclosure results in low bond rating and high
cost of debt. In stock markets, Rennekamp (2012) claims that investors rely on more
readable disclosure when they make decisions. When management provides less readable
disclosures, investors lose credibility on the management. Although the influence of
financial disclosure readability on cost of equity is not clear yet, the stock crash risk is
substantiated to be the consequence of less readable filing because management write
complicated report to hide adverse information (Kim, Wang and Zhang (2016 )). Similarly,
You and Zhang (2009) indicate that investors severely underreact in stock market when
10-K report is difficult to read. Moreover, Miller (2010) document that stock trading
volume is reduced when financial reports are longer and harder to read due to small
investor’s trading reduction. Lee (2012) studies quarterly report readability and finds that
longer and complicated quarterly reports impede the market to react timely to earnings
related information, leading to stock market inefficiency. Firm value is also influenced by
financial report readability. Hwang and Kim (2017) find that firms are traded at significant
discount of fundamental value if annual report readability is low because investors are
suspicious of the firm and the firm’s management. In addition, Biddle, Hilary and Verdi
(2009) examine the association between financial reporting readability and investment
efficiency and document that negative relationship between financial reporting readability

73
and overinvestment and positive relationship between financial reporting readability and
underinvestment.
Given the negative impact of less readable financial report, why do firms still file
less readable reports? The reasons intrigue another strand of literature which examines the
determinants of disclosure readability. Using large sample, Li (2008) report that firms with
lower earnings and less persistent positive earnings issue less readable annual report, the
evidence implying that firms manipulate financial report readability to hide unfavorable
financial performance. Ajina, Laouiti and Msolli (2016) support Li (2008) and extend to
the French stock market. They find that in order to hide earnings management, managers
file less readable annual reports. Lo, Ramos and Rogo (2017) show similar results while
they investigate the management discussion and analysis section of the annual report. Other
studies also examine what factors affect firm’s financial report readability. For instance,
Nelson and Pritchard (2007) find that litigation risk is associated with cautionary language
and readability of firm’s voluntary disclosure. Interestingly, firms subject to greater
litigation risk issue more readable disclosure to reduce the cost of litigation.
The literature studying readability determinants finds that manipulating financial
reports readability is the mechanism firms use to hide adverse information. The
transparency and quality of financial reports are negatively associated with the length and
complexity of the reports (Lawrence (2013 )). You and Zhang (2009) indicate although
annual financial report provides useful information to evaluate firm’s prospective
performance, complex annual report slows down investor’s speed of information ingestion.
Bloomfield (2002) proposes that the reason that managers file complex public financial
reports is to make it costly for investors extract useful information. Paredes (2003) points

74
out that large volume of information in disclosure prohibits investors from making optimal
decisions which is called information-overload risk. As one of the financial report users,
debt lender analyze borrower’s financial report to set debt covenant (Dichev and Skinner
(2002 )) and loan rate (Mazumdar and Sengupta (2005 )). Li (2008) examines how annual
report readability affect cost of borrowing and finds that low readable annual report results
in unfavorable loan terms. The conclusion is supported by Ertugrul, Lei, Qiu and Wan
(2017) who provide evidence that when annual report readability is low, loan spread is
higher; loan maturity is shorter; loan collateral is likely to be required. However, these
papers study readability and loans ex post. No study examines readability and loans ex ante,
i.e. whether borrower intentionally manipulates annual report readability before loan
issuance to gain bargaining power in loan contract negotiation. In this study, I fill this gap.
3.2.2 Hypothesis development
The hypothesis examined in this study is whether borrower firms manipulate
financial report readability before syndicated loan issuance. Since lenders evaluate
borrower’s financial condition to grant loans (Fraser, Gup and Kolari (2000 )), financial
statements turn out to be one of the primary media to convey information on the borrower’s
financial condition. In the meantime, managers are able to decide the degree of detail in
financial reports (Davis and Tama ‐ Sweet (2012 )). Consequently, borrowers have
incentives to manipulate financial statements in order to obtain favorable loan terms.
Because financial statement users may neglect important information in long financial
statement, I hypothesize that poor-performing borrowers are prone to generate long and
less readable financial statements before syndicated loan issuance. In contrast, firms with

75
good performance are likely to file shorter and more readable financial statement before
syndicated loan issuance. Taken together, I hypothesize that
H1: Before issue syndicated loans, borrowers with favorable financial performance
(unfavorable financial performance) tend to file less complicated annual report (more
complicated annual report).
3.3 Data and methodology
The initial sample consists of syndicated loan data drawn from Dealscan. I keep
facilities whose distribution method is “Syndication”, which accounts 73.4% of the overall
facilities. To control for country effect, I remove all facilities that occurred outside United
States. Due to the concern of ambiguity in measuring lending shares of multiple lead
lenders, I are consistent with Panyagometh and Roberts (2010) and rule out facilities
involving more than one lead lender. Since 78% of facilities report only one lead lender,
dropping facilities with multiple lead lenders will not lead to significant loss in sample size
(Kleimeier and Chaudhry (2015 )). To define lead lender, I refer to lender role as “Lead
bank”, “Agent”, “Admin agent”, “Arranger”, “Bookrunner”, “Lead arranger”, and “Lead
manager”. I use the link provided by Chava and Roberts (2008) to match financial and
accounting data of loan borrowers from Compustat to Dealscan, which also leads to the
reason that the sample period is between 1986 and 2012. As to other accounting variables
of company from CRSP, I match Compustat with CRSP by PERMNO. I exclude facilities
whose borrower companies belong to financial and utility firms (i.e. companies with two-
digit SIC code between 60 and 69 or equals to 49).
There are many measurements of readability in the prior literatures, e.g. the length
of disclosure (Miller (2010); You and Zhang (2009 )), Fog Index (Lehavy, Li and Merkley

76
(2011); Li (2008 )), disclosure file size (Loughran and McDonald (2014 )). Among these
measurements of disclosure readability, I use two proxies (10-K document file size and
Fog Index). 10-K document file size is proposed by Loughran and McDonald (2014) who
argue that 10-K document file size is a better proxy than the Fog Index since it overcomes
two drawbacks of the Fog Index in a business context. Specifically, the Fog Index is
comprised of two components. One is “average word per sentence” while the other is
“words complexity”. Loughran and McDonald (2014) point out that it is not easy to
precisely measure average words in every sentence in a financial report and that using
complex words to form the Fog Index is misspecified, because complex words (e.g.
corporation, management) in financial report are not difficult to understand. In the sample,
I keep financial report labelled “10-K”, “10-K405”, “10-KSB”, “10-KSB405”.
Although the Fog Index has weaknesses in measuring readability in financial
reports, I still use the Fog Index to conduct a robustness test, as it is widely used in
readability studies (Dougal, Engelberg, Garcia and Parsons (2012); Lehavy, Li and
Merkley (2011); Li (2008 )). The Fog index was created by Gunning (1952). The index
takes into account the number of word per sentence and the percentage of complex words.
Complex words are defined as words with more than three syllables. If the index is greater
and equal to 18, then the report is unreadable. If the index is between 14 and 18, then the
report is considered as readable but difficult to understand. A reasonable and acceptable
report drops into the range between 10 and 14, while the index below 10 refers to an easy-
to-read report. The function to generate the Fog Index is as follows:
Fog Index = 0.4 × (average words per sentence + percentage of complex words)

77
To examine whether borrowers manipulate annual report readability before
syndicated loan issuance, I perform an OLS regression.
Financial report readability = f (Before, firm characteristics, industry and year effects)
Where financial report readability is proxied by the natural logarithm of 10-K net
file size and Fog Index. Before is an indicator variable which equals to 1 if the filling date
of annual report is one year prior to syndicated loan issuance when the lender-borrower
relation is complete new (i.e. no previous lender-borrower relationship within five years),
and equals to 0 if the filling date of annual report is two-years prior to syndicated loan
issuance. Following Li (2008), I control for borrow firm’s size, age, market-to-book ratio,
financial complexity, stock return volatility, operating earnings volatility, state, and special
item. I also include industry and firm fixed effect in regression.
3.4 Results
This section provides empirical results.
3.4.1 Main regression results: 10-X readability before syndicated loan issuance
The results of the main regression are consistent with the findings in correlations.
The results are reported in Table 3.1. The p-values are presented in parentheses. Column 1
reports the regression results with the key independent variable, logsize, controlled for
borrower characteristics, industry and firm fixed effect. The coefficient of the file size is
found to be positive and significant at 1% level, suggesting that the10-X is less readable
one year before syndicated loan issuance than two years before. Statistically, the coefficient
indicates that firms’ 10-X report file size is 5.9% (e0.057-1)5 larger one year before receiving
syndicated loan. Economically, these results are also meaningful. For instance, the
5 Halvorsen, Robert, and Raymond Palmquist, 1980, The interpretation of dummy variables in semilogarithmic equations, American economic review 70, 474-475.

78
incremental of readability complexity in the year prior syndicated loan issuance is
equivalent to 34.6% of change that happens when the firm size increase by one standard
deviation (0.057/(0.077×2.142)).
Table 3.1
10-X readability before syndicated loan issuance;
Do firms manipulate readability to improve bargaining position
Model 1 in this table shows the coefficients from a regression of the 10-X readability
on the dummy variable before and controls for industry, firm fixed effects, and
borrower characteristics.
Model 2 and 3 in this table present the results for the regression analysis to study the
interaction effect of good performance and poor performance with the key independent
variable and the interaction effect of more free cash flow and less free cash flow with
the key independent variable. I estimate the hypothesis with model as:
10 − 𝑋 𝑟𝑒𝑎𝑑𝑎𝑏𝑖𝑙𝑖𝑡𝑦= 𝛽0 + 𝛽1𝐵𝑒𝑓𝑜𝑟𝑒 + 𝛽2𝑝𝑒𝑟𝑓𝑜𝑟𝑚𝑑𝑢𝑚𝑚𝑦+ 𝛽3𝐵𝑒𝑔𝑖𝑛𝑝𝑒𝑟𝑓𝑜𝑟𝑚𝑑𝑢𝑚𝑚𝑦 + 𝛽4𝑓𝑖𝑟𝑚 𝑐ℎ𝑎𝑟𝑎𝑐𝑡𝑒𝑟𝑖𝑠𝑡𝑖𝑐𝑠+ 𝛽5𝑖𝑛𝑑𝑢𝑠𝑡𝑟𝑦 𝑎𝑛𝑑 𝑓𝑖𝑟𝑚 𝑓𝑖𝑥𝑒𝑑 𝑒𝑓𝑓𝑒𝑐𝑡 + 𝜀
10 − 𝑋 𝑟𝑒𝑎𝑑𝑎𝑏𝑖𝑙𝑖𝑡𝑦= 𝛽0 + 𝛽1𝐵𝑒𝑓𝑜𝑟𝑒 + 𝛽2𝐹𝐶𝐹𝑑𝑢𝑚𝑚𝑦 + 𝛽3𝐵𝑒𝑔𝑖𝑛𝐹𝐶𝐹𝑑𝑢𝑚𝑚𝑦+ 𝛽4𝑓𝑖𝑟𝑚 𝑐ℎ𝑎𝑟𝑎𝑐𝑡𝑒𝑟𝑖𝑠𝑡𝑖𝑐𝑠 + 𝛽5𝑖𝑛𝑑𝑢𝑠𝑡𝑟𝑦 𝑎𝑛𝑑 𝑓𝑖𝑟𝑚 𝑓𝑖𝑥𝑒𝑑 𝑒𝑓𝑓𝑒𝑐𝑡+ 𝜀
Performance is measured by EBIT/AT, where EBIT is earnings before interest and
taxes and AT is total asset. Free cash flow is measured by OANCF-CAPX, where
OANCF is net cash flow from operations and CAPX is capital expenditure. Fama
French 30 industry classification and firm fixed effect are included. *, **, *** indicate
p-value less than 0.1, 0.05 and 0.01 respectively. Descriptions of the explanatory
variables are provided in Appendix I. OLS is conducted and p-value is included in
parenthesis. Fama French 30 industry classification is included. *, **, *** indicate p-
value less than 0.1, 0.05 and 0.01 respectively.
(1)
10-X file size
(2)
Performance
based
(3)
Free cash flow
based
Before 0.057*** 0.061*** 0.066*** (<.0001) (<.0001) (<.0001)
Performdummy -0.166***
(<.0001)
Beforeperformdummy -0.066***
(<.0001)
Fcfdummy -0.009
(0.8627)
Continued

79
Table 3.1 10-X readability before syndicated loan issuance
Do firms manipulate readability to improve bargaining position - Continued
(1)
10-X file size
(2)
Performance
based
(3)
Free cash flow
based
Beforefcfdummy -0.168**
(0.040)
Log (firm size) 0.077 0.081 0.073 (<.0001) (<.0001) (<.0001)
MTB 0.465 0.048 -0.100 (<.0001) (<.0001) (<.0001)
SI -0.343 -0.339 -0.136 (<.0001) (<.0001) (0.3225)
Statedummy 0.049 0.038 -0.213 (0.4111) (0.5279) (0.0992)
Log(non-missing) 1.140 1.135 1.112 (<.0001) (<.0001) (<.0001)
Earnings Std. 0.001 0.000 0.000 (<.0001) (<.0001) (<.0001)
Sdret 0.375 0.385 0.362 (<.0001) (<.0001) (<.0001)
Numsegbusin 0.031 0.029 0.026 (<.0001) (<.0001) (<.0001)
Numindgeo -0.015 0.015 0.035 (<.0001) (<.0001) (<.0001)
Firm age -0.004 -0.004 -0.004 (<.0001) (<.0001) (<.0001)
T test 2.58 5.91
FF industry Yes Yes Yes
Firm fixed effect Yes Yes Yes
Observations 30883 30883 6392
R2 0.21 0.21 0.19
Pr > F <.0001 <.0001 <.0001
3.4.2 Do firms manipulate readability to improve bargaining position
The literature shows that the10-X is one type of important financial report creditors
use to set loan rates and determine debt covenant. Due to the importance of financial reports,
firms may want to hide unfavorable or highlight favorable information by manipulating the
readability of financial reports as it is difficult for investors to make optimal decisions when

80
the financial report is long and verbose. Specifically, I propose that if a firm is performing
well, it is willing to make the financial report easy to read in order to underscore its good
performance and therefore achieve favorable loan rates and terms. In contrast, poorly
performed firms tend to complicate financial report to cover their poor performance in
order to be in a better position when they negotiate with lenders. In general, the results
support the idea.
To test whether firms manipulate readability to gain bargaining power, I create
indicator variable, performdummy, which is equal to 1 if firm’s performance is above
median level and 0 otherwise. I interact performdummy with Before, generating a new
variable Beforeperformdummy, which equals to 1 when the 10-X report is one year before
syndicated loan issuance and is filed by good-performance firm, and 0 when the firm does
not perform well. The results are report in column 2 of Table 3.1. The coefficient of Before
is positive and significant at 1% level. Specifically, the coefficient indicates that firms’ 10-
X report file size is 6.3% (e0.057-1) larger one year before receiving syndicated loan when
the firms are poor-performing firms, indicating that poor performed firms file more
complicated 10-X reports at the year before syndicated loan issuance than that at two years
before syndicated loan issuance. performdummy and Beforeperformdummy are both
negative and significant at 1% level. The sum of coefficient of Before and
Beforeperformdummy is -0.005, resulting in a 0.5% smaller 10-X file size one year before
receiving syndicated loan when the firms are good-performing firms. I also test the
significance of the sum of performdummy and Beforeperformdummy. The sum is
significant at 1% level (t-stat 2.58). Therefore, firms with better performance slightly make
the 10-X reports more readable the year prior syndicated loan issuance than the report filed

81
two years prior syndicated loan issuance. Consequently, I can argue that firms manipulate
10-X readability to improve bargaining position before syndicated loan issuance, i.e.
poorly performed firms file less readable report in order to hide unfavorable information
while good performing firms file more readable report to highlight its favorable
information or do not manipulate the reports readability.
Jensen (1986) shows that firms with more free cash flow have exacerbated agency
problems due to insufficient investment. In another word, firms with a relatively larger
stockpile of cash care less about the loan, which is external finance, because they are able
to finance operating and projects with internal savings. The theory of free cash flow results
in the next hypothesis i.e. firms with low cash flow are likely to file complicated 10-X
reports because they thirst for cash. In contrast, the incentive to manipulate 10-X report
readability of firms with high cash flow is less strong because they do not lack cash and
therefore are not as sensitive to external loan as low cash flow firms are.
To test whether firms manipulate 10-X report readability in order to improve bargaining
position due to cash needs, similar to what I did in firm performance test, I create another
dummy variable, FCFdummy equal to 1 if the firm’s free cash flow is higher than median
level in the sample and 0 otherwise. To examine the magnitude and direction of readability
manipulation before syndicated loan issuance, I interact FCFdummy with Before, leading
to the interaction term BeforeFCFdummy, which is equal to 1 when the 10-X report is filed
one year before syndicated loan issuance and where firm has above median free cash flow,
and 0 otherwise. Free cash flow is measured by OANCF-CAPX, where OANCF is net cash
flow from operations and CAPX is capital expenditure. The regression I run is as follows:

82
10 − 𝑋 𝑟𝑒𝑎𝑑𝑎𝑏𝑖𝑙𝑖𝑡𝑦
= 𝛽0 + 𝛽1𝐵𝑒𝑓𝑜𝑟𝑒 + 𝛽2𝐹𝐶𝐹𝑑𝑢𝑚𝑚𝑦 + 𝛽3𝐵𝑒𝑔𝑖𝑛𝐹𝐶𝐹𝑑𝑢𝑚𝑚𝑦
+ 𝛽4𝑓𝑖𝑟𝑚 𝑐ℎ𝑎𝑟𝑎𝑐𝑡𝑒𝑟𝑖𝑠𝑡𝑖𝑐𝑠 + 𝛽5𝑖𝑛𝑑𝑢𝑠𝑡𝑟𝑦 𝑎𝑛𝑑 𝑓𝑖𝑟𝑚 𝑓𝑖𝑥𝑒𝑑 𝑒𝑓𝑓𝑒𝑐𝑡 + 𝜀
Column 3 in Table 3.1 reports the findings. Due to the missing value of free cash flow, the
sample is reduced to 6392 observations. Similar to the results in column 1, Before is
positively and significantly related to 10-X report readability, with a 6.8% (e0.066-1) larger
firms’ 10-X report file size one year before receiving syndicated loan when the firms have
less free cash flow, demonstrating that firms having less free cash flow obscure 10-X
readability to increase bargaining power during syndicated loan negotiation because they
are in need of cash from external source. The coefficient of the FCFdummy is negative
although it is not significant. However, the sum of coefficient of FCFdummy with
BeforeFCFdummy is -0.102, resulting in a 9.7% (e-0.102 -1) smaller 10-X file size one year
before receiving syndicated loan when the firms are abundant free cash flow. I also test the
significance of the sum of FCFdummy with BeforeFCFdummy. The sum is significant at
1% level (t-stat 5.91). As such, I can conclude that firms with abundant free cash flow not
only does not manipulate 10-X report readability to hide unfavorable information, but they
even improve 10-X report readability. To summarize, firms lacking of free cash flow file
more opaque 10-X report one year before syndicated loan issuance while firms with
abundant free cash flow file more transparent 10-X report.
3.4.3 Additional analysis and findings
This section provides additional analysis and findings.
3.4.3.1 Main regression is robust to using alternative measures of readability
In the main regression, I rely on net file size as the primary measure of financial
report readability. Li (2008) and Bonsall IV, Leone, Miller and Rennekamp (2017) propose

83
two alternative readability measurements, i.e. the Fog index and the Bog index. Given a
large number of studies have employed the Fog and Bog, I test the baseline regression
using them as readability proxies. In Table 3.2, I provide evidence that these two alternative
readability measurements remain significant. The results suggest that the main results are
robust to alternative readability measurement.
Table 3.2
10-X readability before syndicated loan issuance (alternative measures)
This table shows the coefficients from a regression of the 10-X readability measured by
Fog index in Model 1 and Bog index in Model 2 on the dummy variable before and
controls for industry, firm fixed effect and borrower characteristics. Descriptions of the
explanatory variables are provided in Appendix. OLS is conducted and p-value is
included in parenthesis. Fama French 30 industry classification is included. *, **, ***
indicate p-value less than 0.1, 0.05 and 0.01 respectively.
(1)
DV=Fog index
(2)
DV=Bog index
Before 0.103*** 0.263*** (0.0003) (0.0009)
Log (firm size) 0.032 0.238
(<.0001) (<.0001)
MTB 0.050 0.215 (0.0245) (0.0005)
SI -0.241 -1.529 (0.0890) (<.0001)
Statedummy 0.927 -0.378 (0.0007) (0.5580)
Log(non-missing) 0.292 11.813 (0.0031) (<.0001)
Earnings Std. 0.000 0.000 (<.0001) (0.0001)
Sdret 0.142 3.438 (0.2485) (<.0001)
Numsegbusin 0.008 0.414 (0.2915) (<.0001)
Numindgeo -0.011 0.143 (0.1208) (0.0017)
Firm age -0.007 -0.066 (<.0001) (<.0001)
Continued

84
Table 3.2 10-X readability before syndicated loan issuance (alternative measures)
- Continued
(1)
DV=Fog index
(2)
DV=Bog index
FF industry Yes Yes
Firm fixed effect Yes Yes
Observations 25009 29048
R2 0.30 0.31
Pr > F <.0001 <.0001
3.4.3.2 Do firms manipulate readability at different levels in terms of corporate
governance?
The prior literature shows that corporate governance is related to financial report
quality, earnings management, financial statement fraud, etc. Weak corporate governance
may imply that corporate management endorse the behavior of financial report readability
obfuscation. I test whether corporate governance affect financial report readability
manipulation. I use G-index, provided by Gompers, Ishii and Metrick (2003), to proxy
corporate governance. The G-index provided by Gompers, Ishii and Metrick (2003) covers
the sample period from 1990 to 2006, leading to a significant drop in sample size. I create
indicator variable, gdummy, which is equal to 1 if firm’s G-index is below median level
and 0 otherwise. I interact gdummy with Before, generating a new variable Beforegdummy,
which equals to 1 when the 10-X report is one year before syndicated loan issuance and is
filed by good-governance firm, and 0 when the firms do not have good governance.
Table 3.3 presents the results. The dependent variable is log size of 10-X file. The
coefficient of Before is positive and significant at 5% level, indicating that poor governing
firms file more complicated 10-X reports at the year before syndicated loan issuance than
that at two years before syndicated loan issuance. The sum of coefficient of Beforegdummy
with before is 0.007. However, the sum is insignificant (t-stat 0.01), indicating that better
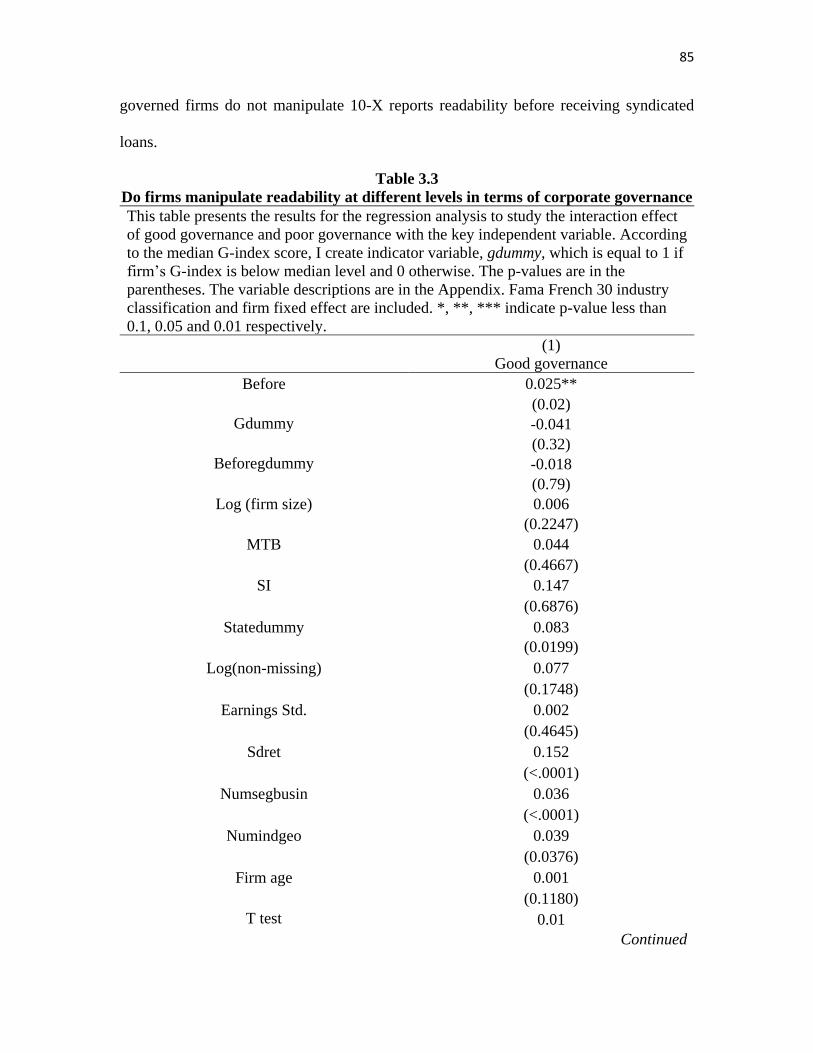
85
governed firms do not manipulate 10-X reports readability before receiving syndicated
loans.
Table 3.3
Do firms manipulate readability at different levels in terms of corporate governance
This table presents the results for the regression analysis to study the interaction effect
of good governance and poor governance with the key independent variable. According
to the median G-index score, I create indicator variable, gdummy, which is equal to 1 if
firm’s G-index is below median level and 0 otherwise. The p-values are in the
parentheses. The variable descriptions are in the Appendix. Fama French 30 industry
classification and firm fixed effect are included. *, **, *** indicate p-value less than
0.1, 0.05 and 0.01 respectively.
(1)
Good governance
Before 0.025** (0.02)
Gdummy -0.041
(0.32)
Beforegdummy -0.018
(0.79)
Log (firm size) 0.006
(0.2247)
MTB 0.044 (0.4667)
SI 0.147 (0.6876)
Statedummy 0.083 (0.0199)
Log(non-missing) 0.077 (0.1748)
Earnings Std. 0.002 (0.4645)
Sdret 0.152 (<.0001)
Numsegbusin 0.036 (<.0001)
Numindgeo 0.039 (0.0376)
Firm age 0.001 (0.1180)
T test 0.01
Continued

86
Table 3.3 Do firms manipulate readability at different levels in terms of corporate
governance - Continued
FF industry Yes
Firm fixed effect Yes
Observations 10072
R2 0.37
Pr > F <.0001
3.4.3.3 Does high-quality auditor reduce readability manipulation?
The auditor is expected to detect, correct, or reveal important error and
misstatement in financial reports (DeAngelo (1981 )). Auditor quality is linked to financial
reporting credibility in the prior literature, i.e. higher auditor quality leads higher credibility
of the auditee’s financial report. Four international audit firms are considered as highest
quality auditors, known as Big 4 (Deloitte Touche Tohmatsu Limited,
PricewaterhouseCoopers, Ernst & Young, KPMG). Because less readable financial reports
worsen financial report quality, I want to examine whether the auditor plays a role in
deterring the firm from manipulating financial report readability. I develop a dummy
variable, Big4, which is equal to one if the firm is audited by Big 4 company and otherwise
is equal to 0. Then, I create interact big4 with Before, generating a new variable Beforebig4,
which equals to 1 when the 10-X report is one year before syndicated loan issuance and is
filed by big 4 audited firms, and 0 when the firms are not audited by big 4.
I find the coefficient of Before is positive and significant at 1% level, corresponding
to a 14.1% (e0.132-1) larger 10-X file size, indicating that non-big4 audited firms file more
complicated 10-X reports at the year before syndicated loan issuance than that at two years
before syndicated loan issuance.

87
The sum of coefficient of beforebig4 with before is 0.011, implying a 1.1% greater
10-X file size one year before syndicated loan issuance. However, the sum of beforebig4
with before is insignificant (t-stat 0.81), indicating that big4-audited firms do not
manipulate 10-X reports readability before receiving syndicated loans.
Table 3.4
Does high-quality auditor reduce readability manipulation
This table presents the results for the regression analysis to study the firm’s readability
manipulation behavior in two different groups in terms of the quality of auditor. Based
on the fact that whether the firm is monitored by Big 4 auditor, I develop a dummy
variable, Big4, which is equal to 1 if the firm is audited by Big 4 company and
otherwise is equal to 0. The p-values are in the parentheses. The variable descriptions
are in the Appendix. Fama French 30 industry classification and firm fixed effect are
included. *, **, *** indicate p-value less than 0.1, 0.05 and 0.01 respectively.
10-X file size
Before 0.132*** (<.0001)
Big4 0.103***
(<.0001)
Beforebig4 -0.121***
(<.0001)
Log (firm size) 0.007
(<.0001)
MTB 0.081 (<.0001)
SI -0.276 (<.0001)
Statedummy 0.265 (<.0001)
Log(non-missing) 1.134 (<.0001)
Earnings Std. 0.000 (<.0001)
Sdret 0.449 (<.0001)
Numsegbusin 0.036 (<.0001)
Numindgeo 0.011 (<.0001)
Continued

88
Table 3.4 Does high-quality auditor reduce readability manipulation - Continued
10-X file size
Firm age -0.003 (<.0001)
T test 0.81
FF industry Yes
Firm fixed effect Yes
Observations 26466
R2 0.22
Pr > F <.0001
3.4.3.4 Do firms with bond alternatives have less incentive to manipulate readability
before syndicated loan issuance?
Firms can raise money by using different types of debt, among which syndicated
loan and bond work in a similar fashion and both aim to long-term lending. As an
alternative of syndicated loan, bond provides a large sum of money to the firms. I am
interested in examining whether firms have less incentive to manipulate readability before
syndicated loan issuance if they also issue bond before issuing syndicated loans.
To test the hypothesis, I develop a dummy variable, Bond, which is equal to 1 if the
firm issued bonds one year before issuing the syndicated loan and otherwise is equal to 0.
Then, I create interact bond with Before, generating a new variable Beforebond, which
equals to 1 when the 10-X report is one year before syndicated loan issuance and is filed
by firms which issued bonds one year before issuing the syndicated loan, and 0 for the
firms that did not issue bonds one year before issuing the syndicated loan.
Table 3.5 shows the results. The coefficient of Before is positive and significant at
1% level, corresponding to a 7.3% (e0.07-1) larger 10-X file size, indicating that firms
without issuing bonds one year before syndicated loan file more complicated 10-X reports

89
at the year before syndicated loan issuance than that at two years before syndicated loan
issuance. The sum of coefficient of Beforegbond with before is 0.06, implying a 6.2%
greater 10-X file size one year before syndicated loan issuance. The sum of beforebig4
with before is significant at 5% (t-stat 3.86). The results indicate that firms receiving extra
funds from bonds also manipulate 10-X reports readability. However, the incentive is
decreasing.
Table 3.5
Do firms with bond alternatives have less incentive to manipulate readability before
syndicated loan issuance
This table presents the results for the regression analysis to study the firm’s readability
manipulation behavior in two different groups in terms of previous bond issuance.
Based on the fact that whether the firm issued bond prior syndicated loan, I develop a
dummy variable, Bond, which is equal to 1 if the firm issued bonds one year before
issuing the syndicated loan and otherwise is equal to 0. The p-values are in the
parentheses. The variable descriptions are in the Appendix. Fama French 30 industry
classification and firm fixed effect are included. *, **, *** indicate p-value less than
0.1, 0.05 and 0.01 respectively.
10-X file size
Before 0.070*** (<.0001)
Bond 0.116
(0.11)
Beforebond -0.01
(0.23)
Log (firm size) 0.002
(<.0001)
MTB 0.167 (0.0478)
SI -0.306 (0.0290)
Statedummy 0.2647 (0.2246)
Log(non-missing) 0.795 (<.0001)
Earnings Std. 0.000 (0.9892)
Sdret -0.676
Continued

90
Table 3.5 Do firms with bond alternatives have less incentive to manipulate
readability before syndicated loan issuance - Continued
10-X file size (0.0031)
Numsegbusin 0.039 (0.0005)
Numindgeo 0.011 (0.2206)
Firm age -0.005 (<.0001)
T test 3.86
FF industry Yes
Firm fixed effect Yes
Observations 29308
R2 0.24
Pr > F <.0001
3.5 Conclusion
Financial reports convey firm’s information and are evaluated by investors, analyst,
creditors, regulators, etc. However, financial reports are not easy to read. To address this
issue, the SEC required companies to strictly comply with plain English principles (e.g.
short sentence, concrete everyday language, no multiple negatives) in financial reports, and
issued a Plain English Handbook to guide companies on plain English in order to achieve
their ultimate goal that is to have all disclosure documents written in plain English. In spite
of the requirement, financial report readability continuous to worsen, which leaves us one
question: why do firms file less readable financial reports? In this paper, I explore this
research question in a syndicated loan setting. I find that the borrower manipulates 10-K
report readability before syndicated loan issuance to gain bargaining power. In particular,
well-performing firms file more readable 10-K reports before syndicated loan issuance in
order to highlight favorable information while poor-performed firms file less readable 10-

91
X reports before syndicated loan issuance in order to hide negative information. In this
respect, this essay provides an explanation of why firms file less readable financial report.
To consolidate the main result, I conduct a series of tests. The results show that firms with
more free cash flow file more transparent 10-X report while firms with less free cash flow
file more obfuscated 10-X report before syndicated loan issuance because they are thirst
for cash. Furthermore, I find evidence that only firms with poor corporate governance
obfuscate reports before syndicated loan issuance. Moreover, the results indicate that a
high-quality auditor also constrains firm’s readability manipulation. Finally, I find that
firms issued bond one year prior to syndicated loan issuance have less incentive to
manipulate 10-K report because they have access to alternative external financing source.
92
REFERENCES
Agarwal, Sumit, and Robert Hauswald, 2006, Distance and information asymmetries in
lending decisions, American University, document interne.
Ahn, Sungyoon, and Wooseok Choi, 2009, The role of bank monitoring in corporate
governance: Evidence from borrowers’ earnings management behavior, Journal
of banking & finance 33, 425-434.
Ajina, Aymen, Mhamed Laouiti, and Badreddine Msolli, 2016, Guiding through the fog:
Does annual report readability reveal earnings management?, Research in
International Business and Finance 38, 509-516.
Barnea, A, and A Rubin, 2005, Corporate social responsibility as a conflict between
owners. Social performance metrics conference, Haas Center for Responsible
Business.
Barnett, Andrew, and Keith Leoffler, 1979, Readability of accounting and auditing
messages, The Journal of Business Communication (1973) 16, 49-59.
Berger, Allen N, Christa HS Bouwman, Thomas Kick, and Klaus Schaeck, 2016, Bank
liquidity creation following regulatory interventions and capital support, Journal
of Financial Intermediation 26, 115-141.
Biddle, Gary C, Gilles Hilary, and Rodrigo S Verdi, 2009, How does financial reporting
quality relate to investment efficiency?, Journal of accounting and economics 48,
112-131.
Bloomfield, Robert J, 2002, The “incomplete revelation hypothesis” and financial
reporting, Accounting Horizons 16, 233-243.
Bonsall IV, Samuel B, Andrew J Leone, Brian P Miller, and Kristina Rennekamp, 2017,
A plain english measure of financial reporting readability, Journal of Accounting
and Economics 63, 329-357.
Bonsall, Samuel B, and Brian P Miller, 2017, The impact of narrative disclosure
readability on bond ratings and the cost of debt, Review of Accounting Studies 22,
608-643.
Boutin-Dufresne, Francois, and Patrick Savaria, 2004, Corporate social responsibility and
financial risk, The Journal of investing 13, 57-66.
Carroll, Archie B, 1979, A three-dimensional conceptual model of corporate
performance, Academy of management review 4, 497-505.
Carter, Craig R, 2005, Purchasing social responsibility and firm performance: The key
mediating roles of organizational learning and supplier performance,
International Journal of Physical Distribution & Logistics Management 35, 177-
194.
Chatterji, Aaron K, David I Levine, and Michael W Toffel, 2007. Do corporate social
responsibility ratings predict corporate social performance? (Division of
Research, Harvard Business School).
Chaudhry, Sajid M, and Stefanie Kleimeier, 2015, Lead arranger reputation and the
structure of loan syndicates, Journal of International Financial Markets,
Institutions and Money 38, 116-126.
Chava, Sudheer, and Michael R Roberts, 2008, How does financing impact investment?
The role of debt covenants, The Journal of Finance 63, 2085-2121.

93
Chen, Huafeng, Marcin Kacperczyk, and Hernan Ortiz-Molina, 2011, Do nonfinancial
stakeholders affect the pricing of risky debt? Evidence from unionized workers,
Review of Finance 16, 347-383.
Cheng, Beiting, Ioannis Ioannou, and George Serafeim, 2014, Corporate social
responsibility and access to finance, Strategic management journal 35, 1-23.
Chu, Y, D Zhang, and Y Zhao, Forthcoming, bank capital and lending: Evidence from
syndicated loans, Journal of Financial and Quantitative Analysis.
Chu, Yongqiang, Donghang Zhang, and Yijia Zhao, 2016, Bank capital and lending:
Evidence from syndicated loans, Available at SSRN 2462377.
Coleman, Anthony DF, Neil Esho, and Ian G Sharpe, 2006, Does bank monitoring
influence loan contract terms?, Journal of Financial Services Research 30, 177-
198.
Cui, Jinhua, Hoje Jo, and Haejung Na, 2018, Does corporate social responsibility affect
information asymmetry?, Journal of Business Ethics 148, 549-572.
Davis, Angela K, and Isho Tama‐Sweet, 2012, Managers’ use of language across
alternative disclosure outlets: Earnings press releases versus md&a,
Contemporary Accounting Research 29, 804-837.
DeAngelo, Linda Elizabeth, 1981, Auditor size and audit quality, Journal of accounting
and economics 3, 183-199.
Degryse, Hans, and Steven Ongena, 2005, Distance, lending relationships, and
competition, The Journal of Finance 60, 231-266.
Dennis, Steven A, and Donald J Mullineaux, 2000, Syndicated loans, Journal of financial
intermediation 9, 404-426.
Dhaliwal, Dan, Oliver Zhen Li, Albert Tsang, and Yong George Yang, 2014, Corporate
social responsibility disclosure and the cost of equity capital: The roles of
stakeholder orientation and financial transparency, Journal of Accounting and
Public Policy 33, 328-355.
Dhaliwal, Dan S, Oliver Zhen Li, Albert Tsang, and Yong George Yang, 2011, Voluntary
nonfinancial disclosure and the cost of equity capital: The initiation of corporate
social responsibility reporting, The accounting review 86, 59-100.
Dichev, Ilia D, and Douglas J Skinner, 2002, Large–sample evidence on the debt
covenant hypothesis, Journal of accounting research 40, 1091-1123.
Dougal, Casey, Joseph Engelberg, Diego Garcia, and Christopher A Parsons, 2012,
Journalists and the stock market, Review of Financial Studies 25, 639-679.
Eichengreen, Barry, and Ashoka Mody, 2000, Lending booms, reserves and the
sustainability of short-term debt: Inferences from the pricing of syndicated bank
loans, Journal of Development Economics 63, 5-44.
El Ghoul, Sadok, Omrane Guedhami, Chuck CY Kwok, and Dev R Mishra, 2011, Does
corporate social responsibility affect the cost of capital?, Journal of Banking &
Finance 35, 2388-2406.
Ertugrul, Mine, Jin Lei, Jiaping Qiu, and Chi Wan, 2017, Annual report readability, tone
ambiguity, and the cost of borrowing, Journal of Financial and Quantitative
Analysis 52, 811-836.
Ferreira, Miguel A, and Pedro Matos, 2012, Universal banks and corporate control:
Evidence from the global syndicated loan market, Review of Financial Studies 25,
2703-2744.

94
Fombrun, Charles, and Mark Shanley, 1990, What's in a name? Reputation building and
corporate strategy, Academy of management Journal 33, 233-258.
François, Pascal, and Franck Missonier‐Piera, 2007, The agency structure of loan
syndicates, Financial Review 42, 227-245.
Fraser, Donald R, Benton E Gup, and James W Kolari, 2000. Commercial banking
(South-Western).
Freeman, R Edward, 2010. Strategic management: A stakeholder approach (Cambridge
university press).
Friedman, Milton, 2009. Capitalism and freedom (University of Chicago press).
Frooman, Jeff, 1997, Socially irresponsible and illegal behavior and shareholder wealth a
meta-analysis of event studies, Business & society 36, 221-249.
Ge, Wenxia, and Mingzhi Liu, 2015, Corporate social responsibility and the cost of
corporate bonds, Journal of Accounting and Public Policy 34, 597-624.
Gompers, Paul, Joy Ishii, and Andrew Metrick, 2003, Corporate governance and equity
prices, The quarterly journal of economics 118, 107-156.
Gopalan, Radhakrishnan, Vikram Nanda, and Vijay Yerramilli, 2011, Does poor
performance damage the reputation of financial intermediaries? Evidence from
the loan syndication market, The Journal of Finance 66, 2083-2120.
Goss, Allen, and Gordon S Roberts, 2011, The impact of corporate social responsibility
on the cost of bank loans, Journal of Banking & Finance 35, 1794-1810.
Griffin, Jennifer J, and John F Mahon, 1997, The corporate social performance and
corporate financial performance debate: Twenty-five years of incomparable
research, Business & society 36, 5-31.
Grow, Brian, Steve Hamm, and Louise Lee, 2005, The debate over doing good, Business
Week 3947, 76.
Gunning, Robert, 1952, The technique of clear writing. McGraw-Hill, New York.
Halvorsen, Robert, and Raymond Palmquist, 1980, The interpretation of dummy
variables in semilogarithmic equations, American economic review 70, 474-475.
Hauswald, Robert, and Robert Marquez, 2006, Competition and strategic information
acquisition in credit markets, Review of Financial Studies 19, 967-1000.
Healy, Paul, 1977, Can you understand the footnotes to financial statements, Accountants
Journal 56, 219-222.
Hemingway, Christine A, and Patrick W Maclagan, 2004, Managers' personal values as
drivers of corporate social responsibility, Journal of Business Ethics 50, 33-44.
Hong, Harrison, and Marcin Kacperczyk, 2009, The price of sin: The effects of social
norms on markets, Journal of Financial Economics 93, 15-36.
Hwang, Byoung-Hyoun, and Hugh Hoikwang Kim, 2017, It pays to write well, Journal
of Financial Economics 124, 373-394.
Ivashina, Victoria, 2009, Asymmetric information effects on loan spreads, Journal of
financial Economics 92, 300-319.
Jensen, Michael C, 1986, Agency costs of free cash flow, corporate finance, and
takeovers, The American economic review 76, 323-329.
Jo, Hoje, and Maretno A Harjoto, 2011, Corporate governance and firm value: The
impact of corporate social responsibility, Journal of business ethics 103, 351-383.
Jo, Hoje, and Yongtae Kim, 2007, Disclosure frequency and earnings management,
Journal of Financial Economics 84, 561-590.

95
Jo, Hoje, and Yongtae Kim, 2008, Ethics and disclosure: A study of the financial
performance of firms in the seasoned equity offerings market, Journal of Business
Ethics 80, 855-878.
Jones, Jonathan D, William W Lang, and Peter J Nigro, 2005, Agent bank behavior in
bank loan syndications, Journal of Financial Research 28, 385-402.
Jones, Michael John, and Paul A Shoemaker, 1994, Accounting narratives: A review of
empirical studies of content and readability, Journal of accounting literature 13,
142.
Jones, Thomas M, 1995, Instrumental stakeholder theory: A synthesis of ethics and
economics, Academy of management review 20, 404-437.
Kedia, Simi, and Shiva Rajgopal, 2011, Do the sec's enforcement preferences affect
corporate misconduct?, Journal of Accounting and Economics 51, 259-278.
Kim, Chansog Francis, Ke Wang, and Liandong Zhang, 2016, Readability of 10-k reports
and stock price crash risk.
Kim, Jeong-Bon, and Byron Y Song, 2011, Auditor quality and loan syndicate structure,
Auditing: A Journal of Practice & Theory 30, 71-99.
Kim, Yongtae, Myung Seok Park, and Benson Wier, 2012, Is earnings quality associated
with corporate social responsibility?, The Accounting Review 87, 761-796.
Kleimeier, Stefanie, and Sajid M Chaudhry, 2015, Cultural differences and the structure
of loan syndicates, Finance Research Letters 15, 115-124.
Knyazeva, Anzhela, and Diana Knyazeva, 2012, Does being your bank’s neighbor
matter?, Journal of Banking & Finance 36, 1194-1209.
Kubick, Thomas R, and G Brandon Lockhart, 2016, Proximity to the sec and stock price
crash risk, Financial Management 45, 341-367.
Kupiec, Paul, Yan Lee, and Claire Rosenfeld, 2017, Does bank supervision impact bank
loan growth?, Journal of Financial Stability 28, 29-48.
Lawrence, Alastair, 2013, Individual investors and financial disclosure, Journal of
Accounting and Economics 56, 130-147.
Lebar, Mary Ann, 1982, A general semantics analysis of selected sections of the 10-k, the
annual report to shareholders, and the financial press release, Accounting Review
57, 176-189.
Lee, Sang Whi, and Donald J Mullineaux, 2004, Monitoring, financial distress, and the
structure of commercial lending syndicates, Financial management 107-130.
Lee, Yen‐Jung, 2012, The effect of quarterly report readability on information efficiency
of stock prices, Contemporary Accounting Research 29, 1137-1170.
Lehavy, Reuven, Feng Li, and Kenneth Merkley, 2011, The effect of annual report
readability on analyst following and the properties of their earnings forecasts, The
Accounting Review 86, 1087-1115.
Li, Feng, 2008, Annual report readability, current earnings, and earnings persistence,
Journal of Accounting and economics 45, 221-247.
Lim, Ivan, Jens Hagendorff, and Seth Armitage, 2016, Regulatory monitoring,
information asymmetry, and accounting quality: Evidence from the banking
industry, (Working Paper).
Lin, Chen, Yue Ma, Paul Malatesta, and Yuhai Xuan, 2012, Corporate ownership
structure and bank loan syndicate structure, Journal of Financial Economics 104,
1-22.

96
Lo, Kin, Felipe Ramos, and Rafael Rogo, 2017, Earnings management and annual report
readability, Journal of Accounting and Economics 63, 1-25.
Loughran, Tim, and Bill McDonald, 2014, Measuring readability in financial disclosures,
The Journal of Finance 69, 1643-1671.
Luo, Xueming, and Chitra Bhanu Bhattacharya, 2009, The debate over doing good:
Corporate social performance, strategic marketing levers, and firm-idiosyncratic
risk, Journal of Marketing 73, 198-213.
Madan, R, R Sobhani, and K Horowitz, 1999, The biggest secret of wall street, Paine
Webber Equity Research.
Mazumdar, Sumon C, and Partha Sengupta, 2005, Disclosure and the loan spread on
private debt, Financial analysts journal 61, 83-95.
McWilliams, Abagail, and Donald Siegel, 2000, Corporate social responsibility and
financial performance: Correlation or misspecification?, Strategic management
journal 21, 603-609.
McWilliams, Abagail, Donald S Siegel, and Patrick M Wright, 2006, Corporate social
responsibility: Strategic implications, Journal of management studies 43, 1-18.
Miller, Brian P, 2010, The effects of reporting complexity on small and large investor
trading, The Accounting Review 85, 2107-2143.
Montgomery, Douglas C, Elizabeth A Peck, and G Geoffrey Vining, 2012. Introduction
to linear regression analysis (John Wiley & Sons).
Nelson, Karen K, and Adam C Pritchard, 2007, Litigation risk and voluntary disclosure:
The use of meaningful cautionary language.
Orlitzky, Marc, Frank L Schmidt, and Sara L Rynes, 2003, Corporate social and financial
performance: A meta-analysis, Organization studies 24, 403-441.
Panyagometh, Kamphol, and Gordon S Roberts, 2010, Do lead banks exploit syndicate
participants? Evidence from ex post risk, Financial Management 39, 273-299.
Paredes, Troy A, 2003, Blinded by the light: Information overload and its consequences
for securities regulation, Wash. ULQ 81, 417.
Petersen, Mitchell A, and Raghuram G Rajan, 2002, Does distance still matter? The
information revolution in small business lending, The journal of Finance 57,
2533-2570.
Plumlee, Marlene A, 2003, The effect of information complexity on analysts' use of that
information, The Accounting Review 78, 275-296.
Plumlee, Marlene, Darrell Brown, Rachel M Hayes, and R Scott Marshall, 2015,
Voluntary environmental disclosure quality and firm value: Further evidence,
Journal of Accounting and Public Policy 34, 336-361.
Preston, Lee E, and Douglas P O'bannon, 1997, The corporate social-financial
performance relationship: A typology and analysis, Business & Society 36, 419-
429.
Prior, Diego, Jordi Surroca, and Josep A Tribó, 2008, Are socially responsible managers
really ethical? Exploring the relationship between earnings management and
corporate social responsibility, Corporate Governance: An International Review
16, 160-177.
Radin, Arthur J, 2007, Have we created financial statement disclosure overload, The CPA
Journal 6-9.

97
Rennekamp, Kristina, 2012, Processing fluency and investors’ reactions to disclosure
readability, Journal of Accounting Research 50, 1319-1354.
Rezende, Marcelo, and Jason Wu, 2014, The effects of supervision on bank performance:
Evidence from discontinuous examination frequencies.
Rhodes, Tony, and Mark Campbell, 2004. Syndicated lending: Practice and
documentation (Linnius).
Roman, Ronald M, Sefa Hayibor, and Bradley R Agle, 1999, The relationship between
social and financial performance: Repainting a portrait, Business & Society 38,
109-125.
Rubin, Amir, 2008, Political views and corporate decision making: The case of corporate
social responsibility, Financial Review 43, 337-360.
Securities, United States., Exchange Commission. Office of Investor Education, and
Assistance, 1998. A plain english handbook: How to create clear sec disclosure
documents (The Office).
Sharfman, Mark P, and Chitru S Fernando, 2008, Environmental risk management and
the cost of capital, Strategic management journal 29, 569-592.
Simons, Katerina, 1993, Why do banks syndicate loans?, New England Economic Review
45-52.
Smith, James E, and Nora P Smith, 1971, Readability: A measure of the performance of
the communication function of financial reporting, The Accounting Review 46,
552-561.
Soper, Fred J, and Robert Dolphin, 1964, Readability and corporate annual reports, The
Accounting Review 39, 358.
Sufi, Amir, 2007, Information asymmetry and financing arrangements: Evidence from
syndicated loans, The Journal of Finance 62, 629-668.
Sun, Wenbin, and Kexiu Cui, 2014, Linking corporate social responsibility to firm
default risk, European Management Journal 32, 275-287.
Waddock, Sandra A, and Samuel B Graves, 1997, The corporate social performance–
financial performance link, Strategic management journal 18, 303-319.
You, Haifeng, and Xiao-jun Zhang, 2009, Financial reporting complexity and investor
underreaction to 10-k information, Review of Accounting Studies 14, 559-586.

98
APPENDIX I
VARIABLE DEFINITION
Panel A. Chapters I specific variables
Variable name Variable definition
CSR The CSR score that is the summation of total strengths and concerns.
CSR=(com_str_num+div_str_num+emp_str_num+env_str_num+hum_
str_num+pro_str_num)-
(com_con_num+div_con_num+emp_con_num+env_con_num+hum_c
on_num+pro_con_num).
Lead bank share
(package level)
The lead bank share in syndicated loan contract. If a bank participates
in multiple facilities in one package, we weighted the bank share by
facility weight. If the bank share is missing and there is only one bank
in the package, we assign 100% to the bank share. Following Chu,
Zhang and Zhao (2016).
Herfindahl-
Hirschman index
(HHI) (package
level)
HHI is calculated by aggregating the squares of each lender’s share in
the package.
Panel B. Chapters II specific variables
LOGSIZE Natural logarithm of net file size of “10-K”, “10-K405”, “10-KSB”, or
“10-KSB405”.
Net file size is “the total number of characters in the filing after the
Stage One Parse” (Loughran and McDonald (2014 )).
BEFORE Dummy variable =1 for t-1 year annual report, and = 0 for t-2 annual
report. T is the year syndicated loan occurred.
Panel C. Chapters III specific variables
Bank-Fed distance
(Federal Reserve
Bank)
Natural logarithm of physical proximity between the federal reserve
bank and lenders within this federal reserve bank’s district.
Bank-Fed distance
(closest)
Natural logarithm of physical the distance between bank and the
closest federal reserve bank or branch
Lead bank share
(facility level)
The lead bank share in syndicated loan contract at facility level.
Herfindahl-
Hirschman index
(HHI) (facility level)
HHI is calculated by aggregating the squares of each lender’s share in
the facility.

99
Panel D. Variables common to Chapters I-III
Borrower
characteristics
Tobins’Q The fraction of Market Value of Total Assets and Book Value of Total
Assets. TobinsQ=(PRCC_F*CSHO+(DLC+DLTT)+PSTKL-
TXDITC)/at. Assigning 0 to TXDITC is missing. Following Chu,
Zhang and Zhao (2016).
Profitability
Dividing operating income before depreciation by book value total
assets. Profitability=OIBDP/AT
Tangibility
Dividing net property, plant and equipment by book value total assets.
Tangibility=PPENT/AT;
Cash Holdings Dividing cash by book value total assets. CashHoldings=CHE/AT;
Leverage
Dividing total liability by book value total assets.
Leverage=(DLC+DLTT)/AT
R&D Dividing R&D expense by book value total assets. RD=XRD/AT
SIZE
Natural logarithm of market value of borrow firm equity at fiscal year
end.
MTB
Market to book, calculated as (market value of equity + book value of
liability)/total asset book value.
SI
Special items, calculated as special item value/book value of total
asset.
STATEDUMMY Dummy variable =1 for Delaware firms, and = 0 otherwise.
LOGNONMISS
Proxy for financial complexity, defined as natural logarithm of number
of non-missing variables in Compustat.
EARNINGSSTD
Proxy for operations volatility, defined as standard deviation of Income
Before Extraordinary Items over prior five years
STDRET
Proxy for business volatility, measured as standard deviation of stock
returns over prior five years.
NUMSEGBUSIN
Proxy for operation complexity, measured by number of business
segment from Compustat.
NUMINDGEO
Proxy for operation complexity, measured by number of geographic
segment from Compustat.

100
FIRMAGE Number of years since the first time borrower firm reports in CRSP.
Lender
characteristics
Tier1 capital ratio Dividing Total Capital by Risk-Weighted Assets.
totalcapialratio=(bhck8274+bhck8275)/bhcka223
Leverage ratio Dividing Tier 1 Capital by Bank Total Assets.
leverageratio=bhck8274/bhck2170
Bank asset (in
million) Bank total asset scaled by 1,000,000. bankasset=bhck2170/1000000
Bank liquidity The liquidity of the lender. Dividing the sum of cash and Available-
for-sale Securities by total asset.
bankliquidity=(bhck0010+bhck1773)/bhck2170
Bank ROA Dividing bank net income by total asset. bankroa=bhck4340/bhck2170
Loan charge off Loan Loss Allowance/Bank Total Assets: RCFD3123/RCFD2170
Loan loss allowance Dividing Loan Loss Allowance by total asset.
loanlossallowance=bhck3123/bhck2170
Risk weighted asset Scaled the risk-weighted asset by total asset.
riskweightedasset=bhcka223/bhck2170
Subordinated debt Subordinated Debt/Bank Total Assets: RCFD3200/RCFD2170
Deposit Scaled the amount of deposits by total asset. deposit=(bhdm6631-
bhdm6636+bhfn6631+bhfn6636)/bhck2170
Loan characteristics
loan size (logarithm)
(package level) The log of loan size in syndicated loan package
loan size (logarithm)
(facility level)
The log of loan size in syndicated loan facility
Loan maturity
(logarithm)
The log of loan maturity

101
APPENDIX II
Syndication process
Borrower
soliciting bids
from lenders
Lenders bid
borrower’s offer
Mandate is awarded.
Syndication process starts
Lead lender prepares an
information memo for
potential participant lenders
Potential participant lenders
give informal feedback
Lead lender formally market
the deal to potential
participant lenders

102
APPENDIX III
A. Mean Plots
Figure 3.1 shows the mean of firm’s annual report readability for five years before and
five years after facility occurred. In figure 1, yearcode=0 shows annual reports filed the
year preceding facility starting date. Yearcode=-1 shows annual reports filed two years
prior facility starting date. Yearcode=1 shows annual reports filed one year followed
facility starting date. The most striking change was made in the year right before facility
issuance. The mean of log annual report size increased significantly, i.e. annual report
readability dropped heavily. What is interesting is that firms tend to improve annual
report readability after facility issuance, and the improvement keeps in the following
three years. This may be due to bank monitoring. In general, the figure supports the view
that firms manipulate annual report readability before syndicated loan issuance.
Figure 3.1
Plot of average 10-K size (log) of firms around syndicated loan issuance

103
B. Descriptive statistics and correlations
Table 3.6 shows the descriptive statistics of dependent variable, key independent variable
and control variables in the sample. On average, there are approximate 346736 characters
in 10-X file, which equals to about 0.33 megabyte 6. The corresponding number in
natural log form is 12.55.
Table 3.7 presents Pearson correlation between variables that are used in main regression.
The Before is negatively correlated with logsize and is highly significant, indicating that
firms obscure 10-X readability one year before syndicated loan issuance compared to 10-
X readability filed two years ago.
Table 3.6
Descriptive statistics for dependent and control variables
This table reports the summary statistics of variables used in the main regression.
NetFileSize is the total number of characters in the 10 – K filing after the Stage One
Parse, which is provided by Loughran and McDonald (2014). Logsize is the natural log
of netfilesize. Before is a dummy variable which is equal to 1 for 10-X filed one year
prior facility starting date and 0 for 10-X filed two years prior facility starting date.
Log (firm size) is natural logarithm of market value of borrow firm equity at fiscal year
end. MTB is market to book, calculated as (market value of equity + book value of
liability)/total asset book value. SI refers to special items, calculated as special item
value/book value of total asset. Satedummy is dummy variable =1 for Delaware firms,
and = 0 otherwise. Log(non-missing) is proxy for financial complexity, defined as
natural logarithm of number of non-missing variables in Compustat. Earnings Std. is
proxy for operations volatility, defined as standard deviation of Income Before
Extraordinary Items over prior five years. Sdret is proxy for business volatility,
measured as standard deviation of stock returns over prior five years. Numsegbusin is
proxy for operation complexity, measured by number of business segment from
Compustat. Numindgeo is proxy for operation complexity, measured by number of
geographic segment from Compustat. Firmage is number of years since the first time
borrower firm reports in CRSP.
Variable N Mean Median Std
NetFileSize 30883 346736.60 283546.50 263264.25
Logsize 30883 12.55 12.56 0.65
Before 30883 0.07 0.00 0.26
Log (firm size) 30883 6.19 6.20 2.12
6 1 megabyte=1048576 characters

104
MTB 30883 0.75 0.68 0.61
SI 30883 -0.02 0.00 0.10
Satedummy 30883 0.00 0.00 0.05
Log(non-missing) 30883 5.60 5.59 0.15
Earnings Std. 30883 123.97 18.89 544.03
Sdret 30883 0.15 0.12 0.11
Numsegbusin 30883 2.64 2.00 2.04
Numindgeo 30883 2.87 2.00 2.25
Firmage 30883 30.05 24.50 19.58

105
Ta
ble
3.7
Corr
elati
on
of
Vari
ab
les
Use
d i
n t
he
Main
Mod
el
No
te. T
his
tab
le r
eport
s th
e P
ears
on c
orr
elat
ion o
f var
iable
s use
d i
n a
nal
ysi
s. T
he
bold
ed c
orr
elat
ion c
oef
fici
ent
is
sig
nif
ican
t at
1%
lev
el. L
og (
firm
siz
e) i
s th
e nat
ura
l lo
g o
f net
file
size
. B
efore
is
a dum
my v
aria
ble
whic
h i
s eq
ual
to 1
for
10
-X f
iled
one
yea
r pri
or
faci
lity
sta
rtin
g d
ate
and 0
for
10
-X f
iled
tw
o y
ears
pri
or
faci
lity
sta
rtin
g d
ate.
Siz
e is
nat
ura
l
logar
ithm
of
mar
ket
val
ue
of
borr
ow
fir
m e
quit
y a
t fi
scal
yea
r en
d. M
TB
is
mar
ket
to b
ook, ca
lcula
ted a
s (m
ark
et v
alue
of
equit
y +
book v
alue
of
liab
ilit
y)/
tota
l as
set
book v
alue.
SI
refe
rs t
o s
pec
ial
item
s, c
alcu
late
d a
s sp
ecia
l it
em v
alue/
book
val
ue
of
tota
l as
set.
Sat
edum
my i
s du
mm
y v
aria
ble
=1 f
or
Del
awar
e fi
rms,
and =
0 o
ther
wis
e. L
og
(non
-mis
sing)
is p
roxy
for
finan
cial
com
ple
xit
y, def
ined
as
nat
ura
l lo
gar
ithm
of
num
ber
of
non
-mis
sing v
aria
ble
s in
Com
pust
at.
Ear
nin
gs
Std
. is
pro
xy f
or
oper
atio
ns
vola
tili
ty, def
ined
as
stan
dar
d d
evia
tion o
f in
com
e b
efore
extr
aord
inar
y i
tem
s over
pri
or
five
yea
rs.
Sd
ret
is p
roxy f
or
busi
nes
s vola
tili
ty, m
easu
red a
s st
andar
d d
evia
tion o
f st
ock
ret
urn
s over
pri
or
five
yea
rs.
Num
segbusi
n
is p
roxy f
or
oper
atio
n c
om
ple
xit
y, m
easu
red b
y n
um
ber
of
busi
nes
s se
gm
ent
from
Co
mpust
at.
Num
indgeo
is
pro
xy f
or
op
erat
ion c
om
ple
xit
y, m
easu
red b
y n
um
ber
of
geo
gra
phic
seg
men
t fr
om
Co
mpust
at.
Fir
mag
e is
num
ber
of
yea
rs s
ince
the
firs
t ti
me
bo
rrow
er f
irm
rep
ort
s in
CR
SP
.
1
2
3
4
5
6
7
8
9
10
11
12
1
Logsi
ze
1.0
0
0.0
1
0.2
7
0.0
1
-0.0
2
0.0
1
0.1
0
0.1
4
-0.0
3
0.1
2
0.1
0
0.0
3
2
Bef
ore
1.0
0
-0.0
4
0.0
1
-0.0
1
0.0
0
-0.0
4
-0.0
1
0.0
2
-0.0
3
-0.0
2
-0.0
7
3
Log (
firm
siz
e)
1.0
0
-0.1
9
0.1
1
0.0
5
0.3
0
0.3
0
-0.3
8
0.2
9
0.2
3
0.4
2
4
MT
B
1.0
0
-0.1
0
0.0
1
-0.0
7
0.0
0
0.1
9
-0.0
6
-0.0
5
-0.0
8
5
SI
1.0
0
0.0
0
-0.0
3
-0.0
7
-0.1
8
-0.0
1
-0.0
4
0.0
5
6
Sat
edum
my
1.0
0
0.0
1
0.0
3
-0.0
2
0.0
8
0.1
0
0.0
9
7
Log(n
on
-mis
sing)
1.0
0
0.1
3
-0.0
5
0.2
5
0.2
3
0.0
9
8
Ear
nin
gs
Std
.
1.0
0
-0.0
2
0.1
4
0.0
9
0.1
7
9
Sdre
t
1.0
0
-0.0
8
-0.0
1
-0.2
4
10
Nu
mse
gbusi
n
1.0
0
0.2
7
0.3
1
11
Nu
min
dgeo
1.0
0
0.1
9
12
Fir
mag
e
1.0
0

106
VITA
Zhenyu Hu
5201 University Blvd, WHTC 219
Laredo, TX 78041 [email protected]
FIELD OF SPECIALIZATION: FINANCE
EDUCATION
University at Buffalo, State University of New York
Buffalo, NY
M.S in Economics August 2011 – June 2013
Zhuhai College of Jilin University
Zhuhai, China
B.S in International Economics and Trade Economics September 2007- June 2011
B.S in Business English (Minor)