Embed Size (px)
Citation preview

M. Braunstein and R. Y. Levine Vol. 17, No. 1 /January 2000 /J. Opt. Soc. Am. A 11
Three-dimensional tomographic reconstruction ofan absorptive perturbation
with diffuse photon density waves
Matthew Braunstein and Robert Y. Levine
Spectral Sciences, Inc., 99 South Bedford Street, Suite 7, Burlington, Massachusetts 01803-5169
Received February 25, 1999; revised manuscript received August 20, 1999; accepted September 2, 1999
A three-dimensional tomographic reconstruction algorithm for an absorptive perturbation in tissue is derived.The input consists of multiple two-dimensional projected views of tissue that is backilluminated with diffusephoton density waves. The algorithm is based on a generalization of the projection-slice theorem and consistsof depth estimation, image deconvolution, filtering, and backprojection. The formalism provides estimates ofthe number of views necessary to achieve a given spatial resolution in the reconstruction. The algorithm isdemonstrated with data simulated to mimic the absorption of a contrast agent in human tissue. The effectsof noise and uncertainties in the depth estimate are explored. © 2000 Optical Society of America[S0740-3232(00)01501-5]
OCIS codes: 170.3660, 170.6960, 170.3010, 170.6510, 170.3880, 170.5270.
1. INTRODUCTIONThe theory of tomographic reconstruction, taking as inputmultiple projections of an object, is at the foundation ofdiverse medical applications such as computer-aidedtomography,1 magnetic resonance imaging, emission com-puted tomography, and intensity-modulated radiationtherapy.2 In this paper tomographic reconstruction oftissue anomalies from diffuse photon density wave(DPDW) images is considered.3,4 Tomographic recon-struction of absorption and scattering parameters fromDPDW images is defined as a three-dimensional (3D) re-construction from multiple two-dimensional (2D) projec-tions of backilluminated tissue. This is distinct from themore common inversion of the diffusion equation to matchpoint-source/detector boundary conditions.5–9 In the lat-ter case, the term tomography often refers to the recon-struction of objects in 2D slices through the tissue.DPDW tissue imaging, utilizing nonionizing near-IR pho-tons, may provide unique information about the presenceof cancerous tissue and in vivo tissue functioning. It hasbeen an area of intensive research in recent years.10
Near-IR photons in the range 0.7–1.2 mm penetratedeep into tissue but are highly scattered, so that a pro-jected image appears highly blurred.11–13 The incorpora-tion of scattering effects in the model for photon propaga-tion, with the goal of defining an inversion algorithm fromprojected images or detector array responses, has ap-peared in a number of papers.5–9,14–19 The tomographictechniques generally involve the definition of image filtersor scattering kernels to compensate for the photon migra-tion through homogeneous tissues.14–17 The procedurederived in this paper is in this category of DPDW imagereconstruction. It is shown that for a small absorptiveperturbation in tissue, such as caused by the accumula-tion of a contrast agent in a tumor, the photon diffusionequation and the boundary conditions lead to a general-ized 3D tomographic reconstruction algorithm for the per-
0740-3232/2000/010011-10$15.00 ©
turbation involving depth estimation, image deconvolu-tion, and backprojection. The procedure is based on ageneralization of the projection-slice theorem20 that re-lates the Fourier transform of the projection to a slice ofthe 3D tissue Fourier transform times an extra depth-dependent term. This extends an analysis in Ref. 19 tothe case of multiple projections. The reconstruction isnecessarily three dimensional because of the migration ofphotons out of the plane of entry before and after interac-tion with the absorptive perturbation. Alternative recon-struction schemes include the fitting of detector responsesto parameterized solutions of the diffusion equation.21–23
However, without the imposition of the projection geom-etry in the data, the conditioning of the inversion is lesscertain. The algorithm presented here could provide acomputationally inexpensive initial solution to improvethe conditioning of these techniques.
Scattering and absorption artifacts, such as bone orblood vessels, may be poorly modeled by using the homo-geneous tissue DPDW diffusion equation. For the imag-ing of tumors, the problem of artifacts is partially over-come by the use of contrast agents. There is evidencethat, possibly because of immature, leaky vasculature,24
an intravenous contrast agent persists at the tumorsite.25,26 The imaging of early-stage tumor vasculaturemay be important in determining the likelihood ofmetastases.24,27 Internal bleeding detection is anotherapplication in which the persistent accumulation of a con-trast agent could be imaged.28 In recent years it hasbeen shown that multispectral imaging could be used toisolate accumulations in tissue of a contrast agent with astrong near-IR absorption edge.29–31 For example, aclinically feasible compound with negligible medical com-plications, indocyanine green, has been studied for theseapplications.32 Alternatively, near-IR imaging beforeand after the introduction of the agent could isolate thedrug in a tumor.
2000 Optical Society of America
12 J. Opt. Soc. Am. A/Vol. 17, No. 1 /January 2000 M. Braunstein and R. Y. Levine
In this paper a unified 3D tomographic reconstructionalgorithm for absorptive perturbations, such as arisingfrom an accumulated contrast agent, is derived. The 3Dgeometry is suggested by photon migration and the feasi-bility of measuring 2D transilluminated images on thetissue surface with a CCD camera.29,30 The tomographicgeometry and the boundary conditions assume a flat im-age plane that can be implemented through the use of abolus matched to the diffusion equation parameters of thetissue.33 We show that the difference in camera imagesbetween absorption and transmission wavelengths ap-proximates the x-ray transform of the 3D function defin-ing the agent attenuation constant in tissue. This is thebasis of the reconstruction algorithm.
The paper will proceed as follows. Section 2 containsthe derivation of the projection image from bispectralmeasurements of a DPDW. The treatment, which issimilar to that of Ref. 19, leads to a generalized 3Dprojection-slice theorem20 as the basis for image recon-struction from multiple views. Inversion to the 3D per-turbative attenuation function requires depth estimationand image deconvolution, both of which are discussed inSection 3. This is combined with a known 3D x-raytransform inversion algorithm20 in Section 4. Section 5presents a demonstration calculation of the algorithmwith the use of simulated data designed to mimic the ab-sorption of a contrast agent in tissue. Section 6 givesconclusions. Appendixes A and B contain derivations ofa sufficient number and the optimum orientation of pro-jected images for the 3D reconstruction, respectively.
2. TOMOGRAPHIC DIFFUSE PHOTONDENSITY WAVE MODELIn this section the formalism in Ref. 19 is reviewed andextended to multiple views for 3D tomographic recon-struction of a perturbative absorbing agent. As appear-ing in the diffusion equation,3,4 photon propagation in tis-sue is characterized by absorption and (reduced)scattering constants ma and ms8 , diffusion constant D05 v/(3ms8) for photon velocity v, and DPDW complexwave number k0 5 @(2mav 1 iv)/D0#1/2 for DPDWmodulation frequency v. For simplicity consider the dclimit v → 0, and substitute for D0 to define a DPDW at-tenuation constant k0 5 A3mams8. Typical values of ma5 0.02 cm21 and ms8 5 8.0 cm21 in tissue correspond toan attenuation of k0 5 0.69 cm21.
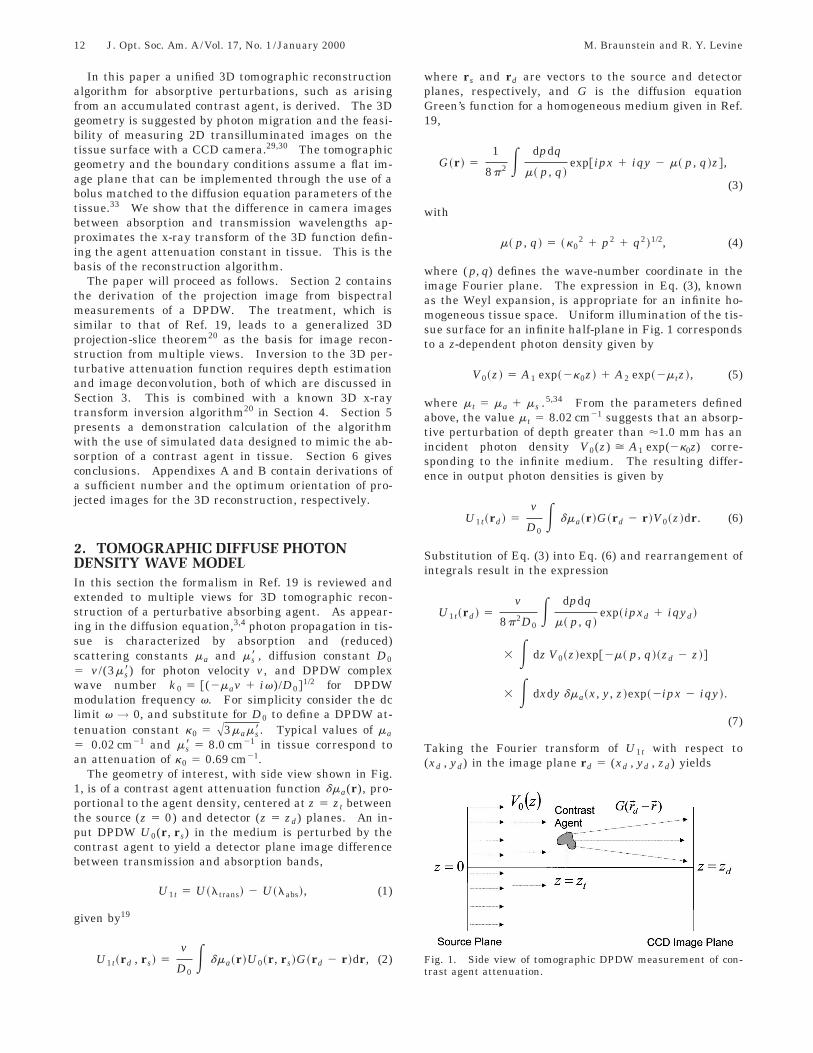
The geometry of interest, with side view shown in Fig.1, is of a contrast agent attenuation function dma(r), pro-portional to the agent density, centered at z 5 zt betweenthe source (z 5 0) and detector (z 5 zd) planes. An in-put DPDW U0(r, rs) in the medium is perturbed by thecontrast agent to yield a detector plane image differencebetween transmission and absorption bands,
U1t 5 U~ltrans! 2 U~labs!, (1)
given by19
U1t~rd , rs! 5v
D0E dma~r!U0~r, rs!G~rd 2 r!dr, (2)
where rs and rd are vectors to the source and detectorplanes, respectively, and G is the diffusion equationGreen’s function for a homogeneous medium given in Ref.19,
G~r! 51
8p2 E dpdq
m~ p, q !exp@ipx 1 iqy 2 m~ p, q !z#,
(3)
with
m~ p, q ! 5 ~k02 1 p2 1 q2!1/2, (4)
where ( p, q) defines the wave-number coordinate in theimage Fourier plane. The expression in Eq. (3), knownas the Weyl expansion, is appropriate for an infinite ho-mogeneous tissue space. Uniform illumination of the tis-sue surface for an infinite half-plane in Fig. 1 correspondsto a z-dependent photon density given by
V0~z ! 5 A1 exp~2k0z ! 1 A2 exp~2m tz !, (5)
where m t 5 ma 1 ms .5,34 From the parameters definedabove, the value m t 5 8.02 cm21 suggests that an absorp-tive perturbation of depth greater than '1.0 mm has anincident photon density V0(z) > A1 exp(2k0z) corre-sponding to the infinite medium. The resulting differ-ence in output photon densities is given by
U1t~rd! 5v
D0E dma~r!G~rd 2 r!V0~z !dr. (6)
Substitution of Eq. (3) into Eq. (6) and rearrangement ofintegrals result in the expression
U1t~rd! 5v
8p2D0E dpdq
m~ p, q !exp~ipxd 1 iqyd!
3 E dz V0~z !exp@2m~ p, q !~zd 2 z !#
3 E dxdy dma~x, y, z !exp~2ipx 2 iqy !.
(7)
Taking the Fourier transform of U1t with respect to(xd , yd) in the image plane rd 5 (xd , yd , zd) yields
Fig. 1. Side view of tomographic DPDW measurement of con-trast agent attenuation.
M. Braunstein and R. Y. Levine Vol. 17, No. 1 /January 2000 /J. Opt. Soc. Am. A 13
U1t~ p, q, zd! 5v
8p2D0
1
m~ p, q !E dz V0~z !
3 exp@2m~ p, q !~zd 2 z !#dma~ p, q, z !,
(8)
where dma( p, q, z) is the 2D Fourier transform ofma(x, y, z). To isolate the function dma( p, q, z) in a pro-jection integral, it is necessary to remove the multiplyingfactors from the integrand in Eq. (8). For example, it isassumed that the quantity exp@2m( p, q)(zd 2 z)# is rela-tively slowly varying over a perturbation centered at z0and extending over a range 2l (z0 6 l):
uexp@2m~ p, q !~zd 2 z0 2 l !# 2 exp@2m~ p, q !~zd 2 z0 1 l !#u
exp@2m~ p, q !~zd 2 z0!#5 uexp@m~ p, q !l# 2 exp@2m~ p, q !l#u ! 1. (9)
This condition requires m( p, q)l ! 1, which from Eq. (4)yields
l !1
~k02 1 p2 1 q2!1/2 ,
1
k0. (10)
Therefore the object must be small compared with the in-verse attenuation k0
21 > 1.4 cm. Expression (10) alsoconstrains the reconstructed spatial frequencies indma( p, q, z) to satisfy
p2 1 q2 !1
l2 2 k02, (11)
indicating that the reconstructed transverse spatial fre-quencies are somewhat less (by k0
2) than the inverse ofthe z extent of the object. Relations (10) and (11) suggestthat it is difficult to reconstruct features of the perturba-tion much more resolved than the object size. For uni-form illumination of absorptive perturbations at depthsgreater than 1 mm, the attenuation length of V0(z) in Eq.(5) is expected to be on the order of k0
21, so that the con-dition on l is less constrained than in relation (10).These assumptions allow the localization of the integrandfactors of dma in Eq. (8) to z 5 zt , with the result that
U1t~ p, q, zd! 5vV0~zt!
8p2D0
exp@2m~ p, q !~zd 2 zt!#
m~ p, q !
3 dm5 a~ p, q, 0 !, (12)
where dm5 a( p, q, 0) is the kz 5 0 slice of the 3D Fourier
transform of dma(x, y, z). Note that U1t is the Fouriertransform of the projection along the z axis, which is gen-eralized for multiple views to a look direction u.
The expression in Eq. (12), which is a key result in thispaper, is a generalization of the well-known projection-slice theorem20 relating the Fourier transforms of projec-tions and reconstructed objects. In this case the 2DFourier-transformed projection U1t is proportional to thecorresponding slice through the 3D Fourier transform of
dma . In addition to dm5 a , there is a depth- and spatial-frequency-dependent factor
D u 5v
8p2D0
V0~zt!exp@2m~ p, q !Dz#
m~ p, q !, (13)
where Dz 5 zd 2 zt . Aside from this factor, which re-quires special processing discussed in Section 3, the in-version of Eq. (12) for multiple views is a known generali-zation of the backprojection-of-filtered-projectionsalgorithm used in computed tomography (CT)reconstruction.1,20 This algorithm will be summarized inSection 4.
3. POINT-SOURCE SOLUTION AND DEPTHESTIMATETo invert Eq. (6) for dma from multiple views, it is neces-sary to remove the depth-dependent factor D u [in Eq.(13)], which implies knowledge of the depth of the pertur-bation. We now show that the depth can be estimated byrelating the difference image at each angle to the first-order solution to a point perturbation @dma(x) 5 sd (x)#.Assuming that the perturbation is a point to first order,the output photon density is obtained from the inverseFourier transform of Eq. (12) as
U1t~rd! 5 V10E exp$2k0Dz@1 1 ~ p2 1 q2!/k02#1/2%
@1 1 ~ p2 1 q2!/k02#1/2
3 exp@i~xdp 1 ydq !#dpdq, (14)
where V10 5 vsV0(zt)/(8p2D0). Evaluation of Eq. (14)yields the point-source solution for the difference in out-put photon densities given by
U1t~xd , yd! 52pV10k0 exp~2k0ADz2 1 r2!
ADz2 1 r2, (15)
where r 5 Axd2 1 yd
2 on the detector plane. Note that,although there is depth (zt) dependence in the factor V10 ,the normalized width of the blurred spot described in Eq.(15) determines Dz.
The initial step in a robust depth estimation algorithmto determine Dz is to identify the detector plane locationof maximum fluence at the origin. Then the image planedensity is integrated over a disk of radius R centered onthis point to obtain the function
A~R ! 5 E0
R
2prU1t~r !dr, (16)
which upon substitution of Eq. (15) yields
A~R ! 5 ~2p!2V10@exp~2k0Dz ! 2 exp~2k0ADz2 1 R2!#.(17)
Subtraction and normalization by the total image inten-sity result in an expression independent of V10 :
14 J. Opt. Soc. Am. A/Vol. 17, No. 1 /January 2000 M. Braunstein and R. Y. Levine
c ~R ! 5 lnFA~`! 2 A~R !
A~`!G 5 k0~Dz 2 ADz2 1 R2!.
(18)
The solution of Eq. (18) for Dz yields a depth estimate D zas a function of R:
D z~R ! 5~ c/k0!2 2 R2
2~ c/k0!, (19)
which, in the perturbative limit for a point density,should be constant as a function of R. Therefore the av-erage of depth estimates from multiple disk radii definesan overall depth. This method of depth estimation wasapplied recently by using in vitro indocyanine green injec-tions in backilluminated tissue from bispectral CCD cam-era images on the surface.29,30
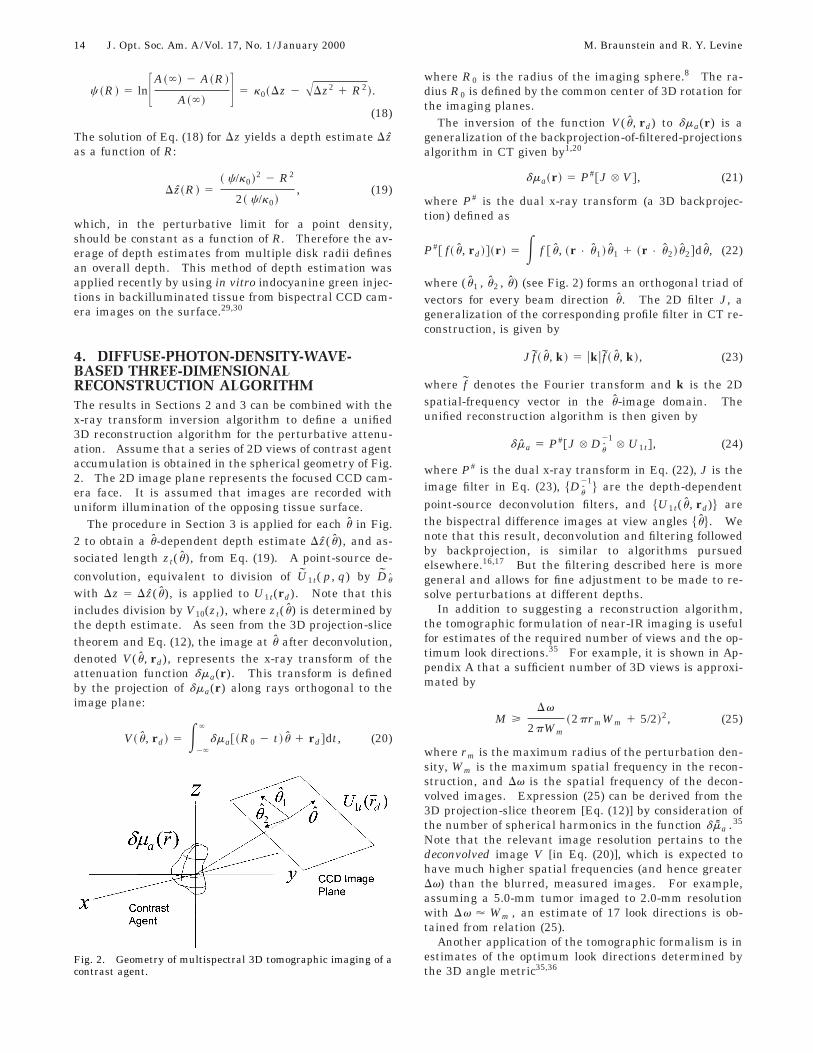
4. DIFFUSE-PHOTON-DENSITY-WAVE-BASED THREE-DIMENSIONALRECONSTRUCTION ALGORITHMThe results in Sections 2 and 3 can be combined with thex-ray transform inversion algorithm to define a unified3D reconstruction algorithm for the perturbative attenu-ation. Assume that a series of 2D views of contrast agentaccumulation is obtained in the spherical geometry of Fig.2. The 2D image plane represents the focused CCD cam-era face. It is assumed that images are recorded withuniform illumination of the opposing tissue surface.
The procedure in Section 3 is applied for each u in Fig.2 to obtain a u-dependent depth estimate D z( u), and as-sociated length zt( u), from Eq. (19). A point-source de-
convolution, equivalent to division of U1t( p, q) by D u
with Dz 5 D z( u), is applied to U1t(rd). Note that thisincludes division by V10(zt), where zt( u) is determined bythe depth estimate. As seen from the 3D projection-slicetheorem and Eq. (12), the image at u after deconvolution,denoted V( u, rd), represents the x-ray transform of theattenuation function dma(r). This transform is definedby the projection of dma(r) along rays orthogonal to theimage plane:
V~ u, rd! 5 E2`
`
dma@~R0 2 t !u 1 rd#dt, (20)
Fig. 2. Geometry of multispectral 3D tomographic imaging of acontrast agent.
where R0 is the radius of the imaging sphere.8 The ra-dius R0 is defined by the common center of 3D rotation forthe imaging planes.
The inversion of the function V( u, rd) to dma(r) is ageneralization of the backprojection-of-filtered-projectionsalgorithm in CT given by1,20
dma~r! 5 P#@J ^ V#, (21)
where P# is the dual x-ray transform (a 3D backprojec-tion) defined as
P#@ f~ u, rd!#~r! 5 E f @ u, ~r • u1!u1 1 ~r • u2!u2#du, (22)
where ( u1 , u2 , u) (see Fig. 2) forms an orthogonal triad ofvectors for every beam direction u. The 2D filter J, ageneralization of the corresponding profile filter in CT re-construction, is given by
Jf~ u, k! 5 uku f~ u, k!, (23)
where f denotes the Fourier transform and k is the 2Dspatial-frequency vector in the u-image domain. Theunified reconstruction algorithm is then given by
dma 5 P#@J ^ Du
21^ U1t#, (24)
where P# is the dual x-ray transform in Eq. (22), J is theimage filter in Eq. (23), $D u
21% are the depth-dependent
point-source deconvolution filters, and $U1t( u, rd)% arethe bispectral difference images at view angles $u%. Wenote that this result, deconvolution and filtering followedby backprojection, is similar to algorithms pursuedelsewhere.16,17 But the filtering described here is moregeneral and allows for fine adjustment to be made to re-solve perturbations at different depths.
In addition to suggesting a reconstruction algorithm,the tomographic formulation of near-IR imaging is usefulfor estimates of the required number of views and the op-timum look directions.35 For example, it is shown in Ap-pendix A that a sufficient number of 3D views is approxi-mated by
M >Dv
2pWm~2prmWm 1 5/2!2, (25)
where rm is the maximum radius of the perturbation den-sity, Wm is the maximum spatial frequency in the recon-struction, and Dv is the spatial frequency of the decon-volved images. Expression (25) can be derived from the3D projection-slice theorem [Eq. (12)] by consideration ofthe number of spherical harmonics in the function dm5 a .35
Note that the relevant image resolution pertains to thedeconvolved image V [in Eq. (20)], which is expected tohave much higher spatial frequencies (and hence greaterDv) than the blurred, measured images. For example,assuming a 5.0-mm tumor imaged to 2.0-mm resolutionwith Dv ' Wm , an estimate of 17 look directions is ob-tained from relation (25).
Another application of the tomographic formalism is inestimates of the optimum look directions determined bythe 3D angle metric35,36

M. Braunstein and R. Y. Levine Vol. 17, No. 1 /January 2000 /J. Opt. Soc. Am. A 15
Q~u! 5 E drd P u Pu
#@J ^ D
u
21^ U1t#~ u, rd!
3 @J ^ Du
21^ U1t#~ u, rd!, (26)
which is a measure of the contribution of the u image tothe overall reconstruction. Equation (26) is the overlapof the attenuation function and the backprojection of theimage at u. By consideration of simple shapes, it hasbeen shown that the optimum look directions are towardthe sharper ends of an elongated object.37 Equation (26),derived in Appendix B, assumes prior knowledge of thedensity function shape, so it may be useful for reimagingand processing to enhance an earlier reconstruction.
5. SIMULATIONSIn this section we apply the 3D tomographic reconstruc-tion algorithm to a simulated data set for demonstrationpurposes and explore in a preliminary way some of thelimits of its applicability. The simulations are suggestedby the tissue parameters and the geometry of the mea-surements of Ref. 19, where a single view was used to re-construct a slice of tissue, and are reflective of in vitromeasurements of human tissue. Here we use 12 view di-rections to image a cube of tissue 5.3 cm on a side, with areduced scattering coefficient ms8 5 0.8 cm21 and an ab-sorption coefficient ma 5 0.02 cm21 to give an attenuationconstant k0 5 0.69 cm21. In this cube two absorptiveperturbations are centered at (x, y, z) coordinates (20.2cm, 20.2 cm, 0.0 cm) and (0.2 cm, 0.2 cm, 0.0 cm), respec-tively. The perturbations are 3D Gaussian spheres thathave an intensity distribution of the form exp@2a (r2 rc)
2#, where the coefficient a is set to 2 cm21 and rc isthe coordinate of the perturbation center given above.This functional form was chosen to mimic a spreading dis-tribution of contrast agent localized around an absorptivesite. Sampling was done on a millimeter scale, so thateach voxel was 1 mm3. Figure 3 shows the distributionof the tissue perturbations on a slice through the z 5 0plane of the tissue. Figure 4 shows the 12 imaging direc-tions used for the reconstruction. These vertices repre-sent both illumination and detection plane directions.These directions were chosen based on previous studies todetermine optimal integration for functions on a sphere.38
The first step in the simulation is to create the mea-sured image for each view direction. For demonstrationpurposes this was done by projecting the tissue inhomo-geneities into the 12 imaging plane directions and con-volving these images with the convolution filter D u , fromEq. (13), to blur the projection. This low-pass filteringprocess approximately reproduces the blurring thatwould occur from tissue propagation, and we observe thatwe do in fact obtain images that correspond roughly tooverlapping point sources at the appropriate depth. Fig-ure 5 shows the relative intensity on the detector planefor one of the projection angles, which we take as an ap-proximation to the measured transillumination differenceimage U1t of Eq. (1). The other direction angles looksimilar and show a single wide maximum that does notseparate the perturbations. This illustrates the inherentdifficulty of imaging in highly scattering media. These
projections were performed with an algorithm first de-scribed to process CT data.39
Figure 6 shows the reconstruction of tissue inhomoge-neities with use of the projected difference images fromall 12 directions. Here we used a conventional back-projection reconstruction algorithm, meaning that weused Eq. (24) but with no deconvolution filter, so thatDu
21 5 1. The two perturbations are not resolved, as wewould expect from the image plane result, and we obtaina blurred version of the original inhomogeneities. Wenote that in addition to the conventional filter J of Eq.(23), we used a Gaussian taper filter with a full width athalf-maximum of 1.0 mm21 to mitigate ringing caused bythe sharp cutoff of the filter.40 We also note that some ofthe reconstruction has negative intensity. This resultsfrom application of the filter and is a known artifact ofthese kinds of CT reconstructions. Figure 7 shows asimilar reconstruction, in which depth estimates havebeen done at each beam direction to construct the decon-volution filter D u
21 of Eq. (24). These filters were thenused in Eq. (24) to implement the full reconstruction al-
Fig. 3. Distribution of tissue perturbation. A slice through thez 5 0 plane is shown. Axes are in units of millimeters, and theintensity has been normalized to 1.0 at the maximum.
Fig. 4. Imaging directions for 3D transillumination reconstruc-tion. Units are relative.

16 J. Opt. Soc. Am. A/Vol. 17, No. 1 /January 2000 M. Braunstein and R. Y. Levine
gorithm including deconvolution. For these calculationsthe width of the taper filter was decreased, dampeningthe highest frequencies of the deconvolution filter, andcomputations were done in double precision to better con-dition the numerical filtering process. In contrast to thereconstruction without the filter, this reconstructionclearly distinguishes the two perturbations, with intensi-ties close to those of the original tissue of Fig. 3.
Actual measurements will of course have an amount ofnoise, which will be manifest in the projection plane dif-ference images. This noise may come from the measure-ment process, or it may result from a delocalization of thecontrast agent through the tissue. The noise is particu-larly troublesome for the reconstruction algorithm de-scribed here, since the deconvolution filter will accentuatehigh frequencies to a great degree, and therefore the ef-fective signal-to-noise ratio of the reconstruction may be-come very low. To address these concerns in a prelimi-
Fig. 5. Relative intensity on the detector plane for one of theprojection angles. The (x, y) points are in units of millimeters,and the z direction shows the relative intensity.
Fig. 6. Reconstruction of tissue perturbations with the use of all12 views. A slice through the z 5 0 plane is shown. Axes arein units of millimeters, and the intensity has been normalized to1.0 at the maximum. No deconvolution was performed.
nary way, we have performed the same reconstructiondescribed above and have added noise to the tissue spacebefore projecting to the image plane to create the mea-sured images at each view. We added to each voxel inthe tissue space random noise centered at 1023 and with asimilar spread relative to the maximum of the two targetGaussian spheres. The resulting reconstruction is shownin Fig. 8. The two perturbations are still distinguishable,but the surrounding background tissue intensities showoscillations almost to the same level as that of thespheres, making the effective signal-to-noise ratio quitelow. The deconvolution algorithm is clearly sensitive tonoise. On the other hand, use of more beams in the re-construction, or more effective tapers that retain the highfrequencies while keeping the noise low, may mitigatethese problems. We are encouraged that recent experi-mental work using ad hoc deconvolution filtering andbackprojection appears to create useful reconstructions.14
We have also explored the sensitivity of the method to er-rors in the depth estimate. This has not been a large
Fig. 7. Same as Fig. 6, except that deconvolution of the pro-jected images was performed before backprojection.
Fig. 8. Same as Fig. 7, but noise has been added to the tissuevolume to create the simulated images used for the reconstruc-tion.

M. Braunstein and R. Y. Levine Vol. 17, No. 1 /January 2000 /J. Opt. Soc. Am. A 17
source of error in the previous examples, but in practicesuch errors will occur. Figure 9 shows the reconstructionwith noise and the deconvolution filter as in Fig. 8 butwith the addition of a random error in the depth for thefilter in each beam direction of 20% standard deviation ofthe known depth centered on the estimated depth. Theresults are similar to those of Fig. 8, except that there isless contrast in the tissue perturbations over the back-ground. This is because the backprojections have an er-ror that is due to imprecise deconvolution, in addition tothe noise. For other situations, where the inhomogene-ities are distributed throughout the tissue, a single depthestimate will not suffice, and a series of reconstructionsmust be performed, one for each absorption center.
6. CONCLUSIONSIn this paper a unified algorithm for 3D DPDW imagingof absorptive perturbations in tissue with multiple trans-illuminated 2D views was derived. This algorithm is ageneralization of previous work19 that uses a single view,and it extends tomographic reconstruction algorithmsbased on the projection-slice theorem in a formal way toinclude scattering media. An important aspect of this al-gorithm is the use of a deconvolution filter that compen-sates for the blurring from photon scattering. To con-struct the filter, we require for each look direction a depthestimate based on the width of the image plane response.The point-source solution corresponding to the estimateddepth is deconvolved from the image to obtain the x-raytransform of the perturbing attenuation function. Theinversion of the processed images then requires filteringand backprojection.
The algorithm was demonstrated with data simulatingthe absorption of a contrast agent in human tissue. Theuse of a contrast agent is expected to suppress tissue in-homogeneities. It was found that the deconvolution filterwas important in achieving good resolution. However,the deconvolution filter, which accentuates high frequen-cies, was shown to be sensitive to noise and the estimateddepths of the tumor absorption. This type of processing
Fig. 9. Same as Fig. 8, but with uncertainty in the depth esti-mation.
will require careful treatment in practice, but we notethat even for a measurement using a single view an effec-tive tomographic reconstruction can be achieved.19 Asnoted by Schotland (Ref. 7, p. 278), perturbative ap-proaches to the reconstruction problem are ‘‘subject tocertain limitations,’’ including the assumption that thereference medium is uniformly absorbing and scattering,which appears not to be the case for biological tissues.Nevertheless, because backprojection of the transillumi-nated images is likely to give a reasonable and computa-tionally inexpensive first-order result, the present algo-rithm could be used as a starting point for an iterativeapproach to the inverse problem.
APPENDIX A: IMAGE NUMBERCONDITIONSThe projection-slice theorem for the 3D x-ray transformrelates the 2D Fourier transform of a projected image atangle u to a slice through the 3D Fourier transform of thereconstructed object.20 For the case of near-IR imagingof an absorbing perturbation, the relationship in Eq. (12)relates the projected image to the absorption functionconvolved with the photon point-spread function. Thesampling geometry implied by the projection-slice theo-rem is shown in Fig. 10, in which Fourier space sampleson a slice through the origin are obtained from the Fou-rier transform of the projected image.
Generalizing the derivation of the bow tie condition inRef. 41 for electron microscopy, we expand the absorptionfunction dma(r) and its Fourier transform in sphericalharmonics. (It is assumed that the point-spread functionhas been deconvolved in the following analysis.) The re-sult is given by
dma~r, u, f! 5 (l50
`
(m521
l
glm~r !Ylm~u, f!, (A1)
dma~W, Q, F! 5 (l50
`
(m52l
l
Glm~W !Ylm~Q, F!, (A2)
Fig. 10. Geometry for determination of the number of viewsnecessary for reconstruction to achieve a given resolution. It isassumed that the images have already been deconvolved, as dis-cussed in the text.

18 J. Opt. Soc. Am. A/Vol. 17, No. 1 /January 2000 M. Braunstein and R. Y. Levine
where W is the magnitude of the 3D frequency vectorWQ. From the Funk–Henke theorem for spherical har-monics $Ylm%,20
ES2
exp~isu • v !Ylm~v !d v 5 ~2p!3/2ilJl11/2~ s!
AsYlm~ u !,
(A3)
where u denotes the unit vector u 5 (u, f) in S2 (the unitsphere). The expression for the Fourier transform inspherical coordinates is
dma~WQ! 5 E exp~i2pW u • Q!dma~r u !r2drdu. (A4)
We have, by substitution of Eqs. (A1) and (A2),
Glm~W ! 5~2p!il
AWE r3/2Jl11/2~2prW !glm~r !dr. (A5)
In Eqs. (A3) and (A5), Jn is the nth-order Bessel function.From Eq. (12) and the geometry in Fig. 10, the decon-
volved image V( u, y) at angle u P S2 is related to theFourier transform of the perturbation dma by
dm5 a~h! 5 V~ u, h!, h P u'. (A6)
We are interested in the determination of the functiondm5 a(h), h P Q', from the finite sampling of views
V( u, y). From Eq. (A6) the image at angle Q j , j5 1,..., M, determines frequency space samples ofdm5 a(h) evaluated at h P Q j
' . More specifically, substi-
tution of h 5 WQ jk , Q jk P Q j' , k 5 1,..., Nj , into Eq.
(A6) yields
dm5 a~WQ jk! 5 V~Q j , WQ jk!. (A7)
The geometry suggested by Eq. (A7) is shown in Fig. 10,in which samples on an annulus of radius W, from thebeam oriented at angle Q j , are proportional to the corre-sponding frequency space samples of dm5 a(h).
The set $Glm(W)% completely determines the recon-structed function dm5 a(h) at a radial spatial frequency ofW. Hence the condition for reconstruction of dm5 a is theinversion of the matrix equation ( j 5 1,..., M; k5 1,..., Nj) for $Glm(W)% given by
dm5 a~WQ jk! 5 (lm
Glm~W !Ylm~Q jk!. (A8)
Defining the matrix Y ( jk)(lm) [ Ylm(Q jk), we obtain
~Y • ~WG !!~ jk ! 5 W(lm
Y ~ jk !~lm !Glm 5 V~Q j , WQ jk!.
(A9)
Equation (A9) represents Nj equations (the number ofsamples in the plane Q j
') among the unknowns $Glm(W)%.Assuming a maximum value l of L in the expansion of Eq.(A2), the corresponding number of unknowns is ( l50
L (2l1 1) 5 (L 1 1)2, which results in a consistency bound(number of equations > number of unknowns) given by
(j51
M
Nj > ~L 1 1 !2. (A10)
The number of samples obtained from each image for thereconstruction of dm5 a at frequency W is determined by the2D Fourier transform of the image on the annulus of ra-dius W. A resolution length of Dv in frequency on the im-age suggests a number of samples Nj(W) 5 2pW/Dv.Substitution into Eq. (A10) results in an image numberthreshold given by
M >Dv
2pW~L 1 1 !2. (A11)
A sufficient (maximum) value for L can be estimated byassuming a maximum extent for the perturbation rmaxwith the property glm(r) 5 0 for r > rmax in Eq. (A1).Therefore, at a spatial frequency of W, a bound 2prmaxWexists for the Bessel-function argument in Eq. (A5).From the Debye approximation,41 Jn(x) > 0 for n > x1 2; when this is substituted into Eq. (A5), we haveGlm(W) > 0 for l > L [ 2prmaxW 1 3/2. Therefore,from relation (A11), a sufficient number of beams for re-construction at frequency W is given by
M >Dv
2pW~2prmaxW 1 5/2!2. (A12)
In the limit 2prmaxW @ 1, relation (A12) is written as
M > ~rmaxDv!2prmaxWmax , (A13)
where Wmax is the maximum spatial frequency in the re-constructed function.
It is interesting to contrast the image number criterionfor 2D and 3D cases. 2D reconstruction results in abound
M > 2prmaxWmax 1 5/2, (A14)
which is known as the bow tie condition in CT (Ref. 20)and electron microscopy.41 The 2D inversion bound dif-fers from the 3D bound because only one sample is ob-tained in frequency space for each annulus. Thereforethe factor rmaxDv, dependent on the image frequencyspace resolution, does not appear in the 2D bound. Notethat the matrix inversion, although never actually com-puted, is more complex in the cylindrical case because of arequired evaluation at each (W, Z) coordinate rather thaneach radial spatial frequency W alone.
APPENDIX B: IMAGE ORIENTATIONCONDITIONSThe reconstruction of the perturbation function dma(r)from a discrete set of views, embodied as the matrix in-version in Eq. (A9), suggests that the generalized inverseof Y ( jk)(lm) must be well defined. This corresponds to thecondition that the matrix
~Y* TY !~lm !8~lm ! 5 (j51
M
(k51
Nj
Y ~lm !8* ~Q jk!Y ~lm !~Q jk! (B1)
is nonsingular. Therefore the eigenvalues of Y* TY in Eq.(B1) define a selection criterion at each frequency W for

M. Braunstein and R. Y. Levine Vol. 17, No. 1 /January 2000 /J. Opt. Soc. Am. A 19
the set of view angles $Q j , j 5 1,..., M%. For example, ifthe samples on the frequency space annulus in Fig. 10 arenot independent, the inversion could require more viewsthan suggested in relation (A11).
An additional selection criterion, which ranks indi-vidual views, is based on the metrics in the tissue andprojection Hilbert spaces. The direct inner products intissue and projection spaces between two perturbationfunctions f,g and images fI, gI are defined by
@ f, g# 5 ER2
f~x!g~x!dx, (B2)
^ f, g& 5 ER2
f~ u, y!g~ u, y!dy, (B3)
respectively.20 The dual x-ray transform is the metricspace dual of the x-ray transform relative to the directmetrics. The duality relationship is expressed in theequation
@ f, P#g# 5 ^Pf, g&, (B4)
where f and g are functions in tissue and image spaces,respectively. Assuming a continuous profile function
f( u, y), y P u', define the sampled profile function fIs by
fs~ u, y! 5 (j51
M
d ~u 2 u j!f~ u j , y!. (B5)
We are interested in maximizing the direct inner productbetween the perturbation functions corresponding to con-tinuous and sampled views. Substitution of Eq. (21) intothe direct inner product and application of Eq. (B4) yield
@dma , dmas# 5 ^PP#@J ^ V#, ~J ^ V !s&. (B6)
Equation (B6) corresponds to an image space metric indi-cating that the contributions of views to the reconstruc-tion of dma are ranked in angle by the function
Q~u! 5 E (P u Pu
#@J ^ V#~ u, y!)(J ^ V~ u, y!)dy,
(B7)
which is derivable from the deconvolved images $V( u, y)%.
Address correspondence to Matthew Braunstein at thelocation on the title page or by e-mail, [email protected].
REFERENCES1. S. R. Deans, The Radon Transform and Some of Its Appli-
cations (Wiley, New York, 1983).2. S. Webb, The Physics of Three-Dimensional Radiation
Therapy, Conformal Radiotherapy, Radiosurgery, andTreatment Planning (Institute of Physics, Bristol, UK,1993).
3. M. A. O’Leary, D. Boas, B. Chance, and A. Yodh, ‘‘Experi-mental images of heterogeneous turbid media,’’ Opt. Lett.20, 426–428 (1985).
4. A. Yodh and B. Chance, ‘‘Spectroscopy and imaging withdiffusing light,’’ Phys. Today 48 (March), 34–40 (1995) andreferences therein.
5. S. R. Arridge and J. C. Hebden, ‘‘Optical imaging in medi-cine: II. Modelling and reconstruction,’’ Phys. Med. Biol.42, 841–853 (1997).
6. I. W. Kwee, Y. Tanikawa, S. Proskurin, S. R. Arridge, D. T.Delphy, and Y. Yamada, ‘‘Performance of a null-space im-
age reconstruction algorithm,’’ in Optical Tomography andSpectroscopy of Tissue: Theory, Instrumentation, Model,and Human Studies II, B. Chance and R. R. Alfano, eds.,Proc. SPIE 2979, 185–196 (1997).
7. J. C. Schotland, ‘‘Continuous-wave diffusion imaging,’’ J.Opt. Soc. Am. A 14, 275–279 (1997).
8. Y. Yao, Y. Pei, Y. Wang, and R. L. Barbour, ‘‘A Born typeiterative method for imaging of heterogeneous scatteringmedia and its application to simulated breast tissue,’’ inOptical Tomography and Spectroscopy of Tissue: Theory,Instrumentation, Model, and Human Studies II, B. Chanceand R. R. Alfano, eds., Proc. SPIE 2979, 232–240 (1997).
9. M. V. Klibanov, T. R. Lucas, and R. M. Frank, ‘‘New imag-ing algorithm in diffusion tomography,’’ in Optical Tomog-raphy and Spectroscopy of Tissue: Theory, Instrumenta-tion, Model, and Human Studies II, B. Chance and R. R.Alfano, eds., Proc. SPIE 2979, 272–283 (1997).
10. See, for example, B. Chance and R. Alfano, eds., Optical To-mography and Spectroscopy of Tissue: Theory, Instrumen-tation, Model, and Human Studies II, Proc. SPIE 2979,1–864 (1997).
11. J. T. Bruulsema, J. E. Hayward, T. J. Farrell, M. Essen-preis, and M. S. Patterson, ‘‘Optical properties of phantomsand tissue measured in vivo from 0.9–1.3 mm using spa-tially resolved diffuse reflectance,’’ in Optical Tomographyand Spectroscopy of Tissue: Theory, Instrumentation,Model, and Human Studies II, B. Chance and R. R. Alfano,eds., Proc. SPIE 2979, 325–334 (1997).
12. V. G. Peters, D. R. Wyman, M. S. Patterson, and G. L.Frank, ‘‘Optical properties of normal and diseased humanbreast tissues in the visible and near infrared,’’ Phys. Med.Biol. 35, 1317–1334 (1990).
13. W.-F. Cheong, S. A. Prahl, and A. J. Welch, ‘‘A review of op-tical properties of biological tissues,’’ IEEE J. QuantumElectron. 26, 2166–2185 (1990).
14. R. J. Grable, D. P. Rohler, and S. Kla, ‘‘Optical tomographybreast imaging,’’ in Optical Tomography and Spectroscopyof Tissue: Theory, Instrumentation, Model, and HumanStudies II, B. Chance and R. R. Alfano, eds., Proc. SPIE2979, 197–210 (1997).
15. S. A. Walker, A. E. Cerussi, and E. Gratton, ‘‘Back-projection image reconstruction using photon density wavesin tissues,’’ in Optical Tomography: Photon Migration andSpectroscopy of Tissue and Model Media: Theory, HumanStudies, and Instrumentation, B. Chance and R. R. Alfano,eds., Proc. SPIE 2389, 350–357 (1995).
16. S. B. Colak, H. Schomberg, G. W. ’t Hooft, and M. B. vander Mark, ‘‘Optical backprojection tomography in heteroge-neous diffusive media,’’ in Advances in Optical Imaging andPhoton Migration, R. R. Alfano and J. G. Fujimoto, eds.,Vol. 2 of OSA Trends in Optics and Photonics Series (Opti-cal Society of America, Washington, D.C., 1996), pp. 282–289.
17. S. B. Colak, D. G. Papaioannou, G. W. ’t Hooft, and M. B.van der Mark, ‘‘Optical image reconstruction with deconvo-lution in light diffusing media,’’ in Photon Migration in Tis-sues, B. Chance, D. T. Delpy, and G. J. Mueller, eds., Proc.SPIE 2626, 306–315 (1995).
18. A. J. Devaney, ‘‘Reconstructive tomography with diffractingwavefields,’’ Inverse Probl. 2, 161–183 (1986).
19. X. D. Li, T. Durduran, A. G. Yodh, B. Chance, and D. N.Pattanayak, ‘‘Diffraction tomography for biochemical imag-ing with diffuse-photon density waves,’’ Opt. Lett. 22, 573–575 (1997).
20. F. Natterer, The Mathematics of Computerized Tomography(Wiley, New York, 1986).
21. S. C. Feng, F.-A. Zeng, and B. Chance, ‘‘Analytical pertur-bation theory of photon migration in the presence of asingle absorbing or scattering defect sphere,’’ in Optical To-mography: Photon Migration and Spectroscopy of Tissueand Model Media: Theory, Human Studies, and Instru-mentation, B. Chance and R. R. Alfano, eds., Proc. SPIE2389, 54–63 (1995).
22. D. A. Boas, M. A. O’Leary, B. Chance, and A. G. Yodh,‘‘Scattering of diffuse photon density waves by spherical in-
20 J. Opt. Soc. Am. A/Vol. 17, No. 1 /January 2000 M. Braunstein and R. Y. Levine
homogeneities within turbid media: analytic solution andapplications,’’ Proc. Natl. Acad. Sci. USA 91, 4887–4891(1994).
23. S. Fantini, S. A. Walker, M. A. Franceschini, M. Kaschke,P. M. Schlag, and K. T. Moesta, ‘‘Assessment of the size, po-sition, and optical properties of breast tumors in vivo bynoninvasive optical methods,’’ Appl. Opt. 37, 1982–1989(1998).
24. L. S. Heuser and F. N. Miller, ‘‘Differential macromolecularleakage from the vasculature of tumors,’’ Cancer 57, 461–464 (1986).
25. X. Li, B. Beauvoit, R. White, S. Nioka, B. Chance, and A.Yodh, ‘‘Tumor localization using fluorescence of indocya-nine green (ICG) in rat models,’’ in Optical Tomography:Photon Migration and Spectroscopy of Tissue and ModelMedia: Theory, Human Studies and Instrumentation, B.Chance and R. R. Alfano, eds., Proc. SPIE 2389, 789–797(1995).
26. M. M. Haglund, D. W. Hochman, A. M. Spence, and M. S.Berger, ‘‘Enhanced optical imaging of rat gliomas and tu-mor margins,’’ Neurosurgery 35, 930–940 (1994).
27. N. Weidner, J. P. Semple, W. R. Welch, and J. Folkman,‘‘Tumor angiogenesis and metastasis-correlation in invasivebreast carcinoma,’’ N. Eng. J. Med. 324, 1–7 (1991).
28. S. P. Gopinath, C. S. Robertson, R. G. Grossman, and B.Chance, ‘‘Near-infrared spectroscopic localization of intra-cranial hematomas,’’ J. Neurosurg. 79, 43–47 (1993).
29. M. Braunstein, R. W. Chan, and R. Y. Levine, ‘‘Simulationof dye-enhanced near-IR transillumination imaging of tu-mors,’’ in Proceedings of the IEEE Engineering in Medicineand Biology 19th Annual International Conference (IEEE,New York, 1997), p. 93.
30. M. Braunstein, R. W. Chan, and R. Y. Levine, ‘‘Dye-enhanced multispectral transillumination for breast cancerdetection: feasibility measurements,’’ in Proceedings of theIEEE Engineering in Medicine and Biology 19th Annual In-ternational Conference (IEEE, New York, 1997), p. 91.
31. S. Zhou, M. A. O’Leary, S. Nioka, and B. Chance, ‘‘Breasttumor detection using continuous wave light source,’’ in Op-tical Tomography: Photon Migration and Spectroscopy ofTissue and Model Media: Theory, Human Studies, and In-
strumentation, B. Chance and R. R. Alfano, eds., Proc. SPIE2389, 809–817 (1995).
32. T. Carski, Indocyanine Green: History, Chemistry, Phar-macology, Indications, Adverse Reactions, Investigation andPrognosis: An Investigative Brochure (Becton Dickinson,Cockeysville, Md., 1995).
33. X. Wu, L. Stinger, and G. W. Faris, ‘‘Determination of tis-sue properties by immersion in a matched scattering fluid,’’in Optical Tomography and Spectroscopy of Tissues:Theory, Instrumentation, Model, and Human Studies II, B.Chance and R. R. Alfano, eds., Proc. SPIE 2979, 300–306(1997).
34. A. Ishimaru, Wave Propagation and Scattering in RandomMedia, Volume 1, Single Scattering and Transport Theory(Academic, New York, 1978), pp. 175–185.
35. R. Y. Levine, E. A. Gregerson, and M. M. Urie, ‘‘The appli-cation of the x-ray transform to 3D conformal radio-therapy,’’ in Computational Radiology and Imaging:Therapy and Diagnostics, C. Borgers and F. Natterer, eds.(Springer-Verlag, New York, 1999).
36. B. P. Medoff, ‘‘Image reconstruction from limited data:theory and applications in computerized tomography,’’ inImage Recovery: Theory and Application, H. Stark, ed.(Academic, New York, 1987).
37. M. Braunstein and R. Y. Levine, ‘‘Optimum beam configu-rations in tomographic intensity modulated radiationtherapy,’’ Phys. Med. Biol. (to be published).
38. W. Neutsch, ‘‘Optimal spherical design and numerical inte-gration on the sphere,’’ J. Comput. Phys. 51, 313–325(1983).
39. R. L. Siddon, ‘‘Fast calculation of the exact radiological pathfor a three-dimensional CT array,’’ Med. Phys. 12, 252–255(1985).
40. G. T. Gullberg and T. F. Budinger, ‘‘The use of filteringmethods to compensate for constant attenuation in single-photon emission computed tomography,’’ IEEE Trans.Biomed. Eng. BME-28, 142–157 (1981).
41. R. A. Crowther, D. J. DeRosier, and A. Klug, ‘‘The recon-struction of a three-dimensional structure from projectionsand its application to electron microscopy,’’ Proc. R. Soc.London, Ser. A 317, 319–340 (1970).