Embed Size (px)
Citation preview
Three-Dimensional Structure of the Siskin Green River Oil Shale Kerogen Model:
A Comparison between Calculated and Observed Properties
Anita M. Orendt,1 Ian S.O. Pimienta,
1,2 Shyam R. Badu,
1 Mark S. Solum,
3 Ronald J.
Pugmire,3,4
and Julio C. Facelli1,5
1Center for High Performance Computing and
3Departments of Chemistry,
4Chemical
Engineering, and 5Biomedical Informatics University of Utah, Salt Lake City, Utah
84112
2Department of Chemistry and Physics, Troy University, Troy, Alabama 36082
Darren R. Locke,6 Karena W. Chapman,
6 Peter J. Chupas,
6 and Randall E. Winans
6
6X-ray Science Division, Advanced Photon Source, Argonne National Laboratory, 9700
S. Cass Avenue, Lemont, Illinois 60439
Abstract
Three-dimensional (3D) structural models of the Green River kerogen based on
the two-dimensional (2D) structure proposed by Siskin were generated using a
combination of ab initio and molecular mechanics calculations. Several initial monomer
conformations were generated using the simulated annealing procedure, followed by
minimization via quantum mechanical calculations. 13
C solid state nuclear magnetic
resonance (SSNMR) spectra and atomic pair distribution functions (PDFs) were
calculated based on these 3D models and compared to experimental results obtained on a
Green River kerogen sample. The results show reasonably good agreement between
calculated and experimental results, showing that this type of 3D modeling can be of

value in the evaluation of 2D models. Moreover this paper establishes a general
methodology to develop 3D models for any existing or future 2D model of kerogens.
Introduction
Kerogen is defined as the insoluble organic component of the organic matter in
sedimentary rocks. This organic matter is usually mixed with minerals during its
deposition which contributes to the difficulty in its physical isolation. Kerogen is not
soluble in normal organic solvents because of the large molecular weight up to several
thousand Daltons.14
Kerogen is found in rocks such as shale, as oil shale deposits, and
when heated in the Earth’s crust some types release hydrocarbons in the form of crude oil
or natural gas.
As kerogen is a mixture of organic material, its chemical composition varies from
one sample to another. According to the van Krevelen diagram, kerogens can be
classified based on the ratios of H/C and O/C.5 Type I kerogens have H/C ratio greater
than 1.25 and O/C ratio less than 0.15. This class is derived primarily from cyanobacteria
or various Chlorophyta and dinoflagellates. Type II kerogens, derived from marine
planktonic organisms, have H/C ratio less than 1.25 and O/C ratio of 0.03 to 0.18. Type
II kerogens can be enriched in organic sulfur; in this case they are further classified as
belonging to Type IIS kerogens. Type III kerogens are derived primarily from higher
plant remains in coals and coaly shales; they possess a low hydrogen count (H/C < 1, O/C
0.030.3) because of the extensive ring and aromatic character in these systems.
Finally, type IV kerogens are comprised of mostly polycyclic aromatic hydrocarbons
with H/C ratio less than 0.5.
Source rocks in the Green River formation, one of the most extensive oil shale
reserves in the world, contains hydrogen-rich algal kerogen (type I) with up to 20 wt%
organic matter in the form of amorphous kerogen solid integrated in a silicate- and
carbonate-based mineral matrix.6,7
In the past few years, investigators have employed
different methods to separate organic kerogen from inorganic minerals in oil shales and
to recover the unaltered kerogen for characterization studies.812
Although considerable
progress has been achieved from these studies, the complete isolation of kerogen from oil
shales remain difficult.
In the case of these petroleum precursors, e.g., source rocks and the kerogens,
little information is presently available to describe their physical behavior.13
Only a few
relevant studies utilizing both chemical and instrumental analysis to reconstruct a
stochastic two-dimensional (2D) model of kerogens have been published.14-19
The work
of Durand and co-workers dealt with type I and type II kerogens.14
More recently, 2D
models of kerogen have been proposed by Siskin15,16
for type I Green River Oil Shale
(GROS) and Lille14
for kukersite (a type II/I kerogen). The Siskin model was originally
generated using nondestructive chemical derivatization and characterization via NMR
and mass spectroscopy of materials isolated under mild conditions.15
The model was
revisited in 2004 and compared to results of NMR, XPS and sulfur XANES results.16
A
much larger (more than 104 core structures with approximately 10
6 atoms), more general
2D kerogen model20
has also been developed using the data from various solid state
analyses to construct the cores. This model has been used to predict oil and gas
compositional yields; however, it is too large for the computational work being done in
this paper. It should also be noted that there have been more recent studies of kerogen
structure21
that have presented evidence of structural features that are not accounted for
within the Siskin model. As no newer models have been presented in the literature, for
the purpose of this work the Siskin model will be used. However, the methodology
presented is quite general and can be used for any existing or future model of kerogens.
A potential solution to aid in the isolation of kerogen is the analysis of its three
dimensional (3D) molecular structure using molecular modeling and simulation.
Atomistic modeling is routinely used in many industries (pharmaceutical, polymers,
coatings, explosives, membrane proteins, etc.) to gain insight to material properties and
behavior. Faulon18-19
reported some preliminary data on 3D structures of kerogen but
there has been a lack of modeling work that utilizes the molecular modeling tools that are
available today. Hence, little is known about the 3D characteristics of any of the kerogen
models. The 3D characteristics of kerogen will not only define the manner in which the
kerogen folds and interacts with both the extractable bitumen and the mineral matter, but
the structural information will provide a new view of the structure including information
on which portions of the structure are exposed on the surface, which portions are
accessible through channels, and/or which portions may be isolated in the interior of the
structure. An understanding of where the various functional groups are located may
serve as useful guides for developing novel processing schemes for resource recovery. In
addition, the surface exposure of polar functional groups will provide new information on
the interaction of the kerogen structure with the inorganic matrix that appears to bind
tightly to the mineral matter.6, 22-25
In this work, the 3D structure of the Green River Siskin model15
was obtained
using a combination of ab initio and molecular mechanics calculations. The 3D structure
was then used to calculate the 13
C chemical shifts, from which a simulated 13
C spectrum
can be generated, as well as to simulate the expected atomic pairwise distribution
function (PDF). The PDF gives the probability of finding an atom at a given radial
distance from another atom; the peaks observed correspond directly to interatomic
distances within the sample and is suitable for this study as it provides local structural
information independent of long-range order.26,27
In addition, 13
C solid state NMR
(SSNMR) is a powerful tool to obtain structural information on insoluble samples such as
kerogens. Using the methodology developed by Grant and Pugmire28,29
and used
extensively on fossil fuel samples, SSNMR 13
C spectra can be analyzed to provide
detailed structural data such as the average aromatic cluster size and the average number
of substituents on the clusters.
The 13
C SSNMR spectrum and PDF simulated using our model are compared
with their experimental counterparts on the kerogen extracted from a segment of a Green
River basin shale core.30
The comparison of the simulated and experimental properties
allows for an evaluation of the quality of the 3D model as well as the underlying 2D one.
It should be noted that the experimental data being used was obtained on kerogen isolated
from shale taken from a single one-foot section of a four inch diameter core from the
Green River basin and as such differences between this sample and the sample used to
obtain the experimental data from which the Siskin Model was based are to be expected.
The existence of a 3D model that has been validated against experimental data
will allow for further computational study on the interaction between the kerogen and the
mineral matrix as well as on the further processing of the kerogen for oil production.
Computational and Experimental Details
Generation of 3D Model: A 3D structure corresponding to the 2D Siskin’s
kerogen model15
(chemical formula of C645H1017N19O17S4; molecular weight of 9438.35
g/mol) was built using HyperChem.31
A preliminary chemical structure was obtained via
the molecular mechanics energy minimization routine in HyperChem using the MM+32
force field. This minimized structure was further optimized using the ab initio software
package GAMESS33
at the restricted Hartree-Fock (RHF) level of theory using the
minimal STO-3G34
basis set.
After a minimum energy structure was identified by the above procedure, this
structure was used to initiate a series of molecular mechanics calculations, using
simulated annealing35
to generate several monomer conformations. This procedure
involves three steps: heat, run, and cool. The first step was completed using simulation
period of heat time (0.1 ps) and a starting temperature of 10 K to set initial velocities with
rescaling of velocities at temperature increments of 119 K per 0.01 ps to reach the
simulation temperature of 1200 K. In the second step, the velocities are rescaled at a
constant temperature of 1200 K for a run time of 0.5 ps. The final step was the
simulation period of cool time (1 ps), with rescaling of velocities at temperature
increments of 9 K per 0.01 ps to reach the final temperature of 300 K. The process was
repeated until four monomer conformations were obtained from the parent.
Each of these generated conformers was then locally optimized using GAMESS
at the RHF/STO-3G level of theory in the same manner as the original 3D structure. The
energies of these structures were compared and the structure with the overall minimum
energy was then chosen as the “parent” for the next simulated annealing cycle. The
lowest energy conformation obtained in the second annealing cycle was used in the
simulation of the PDF and NMR spectra. Molecular images were generated using
Mercury.36
Calculation of 13
C Chemical Shielding: The NMR calculations were done using
the density functional theory approach with the PBE1PBE37
exchange correlation
functional and using the 4-31G basis set38
as implemented in Gaussian09 suite of
programs.39
The calculated chemical shielding values were converted to chemical shifts
on the tetramethylsilane (TMS) scale using the shielding calculation of methane at the
same level of theory, 200.5 ppm, adjusted by -7 ppm which is the chemical shift of dilute
methane on TMS scale.40
Gaussian broadening of 2 ppm along with Lorentzian
broadening of 1 ppm was applied on the aliphatic region, with 5 ppm Gaussian
broadening used in the aromatic region to obtain the simulated SSNMR spectrum.
Calculation of Atomic PDF: The PDFs were calculated using DISCUS and
plotted using KUPLOT, both part of the DIFFUSE41
suite of packages. Atomic
coordinates of the model were used to calculate a PDF using the following equation
v
ov
vrrr
f
ff
rrG
4)(
)0(
)0()0(1)(
2
(1)
where r is the radius, δ is the Dirac delta function, ρo is the average number density of the
kerogen, ƒ(0) ν and ƒ(0) μ are the x-ray atomic form factors for atoms ν and μ while <ƒ(0)
>2
is the square of the average x-ray atomic form factors. The sum goes over all pairs of
atoms ν and μ within the model separated by rνμ. The subtraction of 4rρo from the G(r)
in the above equation leads to the function being equal to zero at large radial distances.
While this equation applies for infinite materials with homogenous density confined
within well-defined boundaries, kerogen models are finite with irregular shapes and
cannot be bound in any way to avoid void space within the boundaries. This leads to a
lower average density for the bound model which presents a problem when calculating
the pair distribution function using the above equation. To correct for this effect, a
modified term is used to describe the shape and size of the kerogen model. The modified
equation that allows adjustments for model shape and size, which can be derived from
Eq. 4 in the paper of Neder and Korsunskiy,42
is as follows:
))(tanh(4)()0(
)0()0(1)(
2rRSrrr
f
ff
rrG
v
ov
v
(2)
where S is related to the model shape and R the model diameter.
Sample Details: As mentioned in the introduction, experimental data was obtained on a
kerogen extracted from a segment of a Green River basin shale core.30
An elemental
analysis of the kerogen sample used gave an approximately 5% mineral matter content
and an atomic composition of C100H150N3O8S1 for the organic content. This can be
compared to the atomic composition of the Siskin model (C645H1017N19O17S4 or
C100H157.7N2.9O2.6S0.6); the only large difference is that the kerogen sample used has a
higher oxygen content than that of the model.
Measurement of Atomic PDF: Measurement of the atomic pair distribution function for
a powdered (100 mesh) demineralized Green River kerogen sample30
was made on
instrument 11-ID-B at the Advanced Photon Source (APS), Argonne National
Laboratory. High-energy X-rays (60 KeV, =0.2128Å) were used with a Perkin Elmer
amorphous silicon based detector43
to collect diffraction data to high values of
momentum transfer, Q (Qmax18Å-1
; Q=4Sin/). The 2D diffraction images were
processed in Fit2D44
software to perform x-ray polarization correction and radial
integration for peak intensity. Extraction of the experimental pair distribution function
from these data was made with PDFgetX2.45
This software applies corrections to the
scattering data for oblique incidence of the x-rays on the image plate, background
subtraction, and Compton scattering to produce a structure function, S(Q). The reduced
pair distribution function, F(Q) [F(Q)=Q(S(Q)-1)] is Sine-Fourier transformed to yield
the atomic pair distribution function, G(r):
0
)(]1)([2
1)( drQrSinQSQrG
(3)
where the transform is truncated at Qmax=18 Å-1
due to experimental limitations. The
resulting experimental G(r) function yields information on the average bond distances in
the kerogen material and can be compared to calculated PDFs of kerogen models.
Previously, this approach was shown to provide a reasonable comparison and validation
on a coal model.46,47
Measurement of 13
C solid state NMR: The 13
C spectrum of the same Green
River kerogen sample used in the PDF measurement was obtained on a Varian Direct
Drive (Oversampled) NMR spectrometer operating at a carbon frequency of 25.152 MHz
and a proton frequency of 100.02 MHz. The probe was a Chemagnetics 7.5 mm with a
ceramic housing for reduced carbon background. The spinning speed was set at 4100 Hz.
The pulse delay was 1 s, which is significantly longer than five times the longest T1 for
the protons. The data was collected using the cross-polarization (CP) method and
TPPM48
decoupling. The contact time was 3 ms which was also more than five times the
longest TCH of the aromatic region, as determined from a variable contact time fit49
of the
data. Within the signal to noise ratio differences, the CP spectrum was identical to a
single pulse (SP) spectrum. No line broadening was used in this CP spectrum and a total
of 146,200 scans were taken.
Results and Discussion
3D Modeling: Our work began with the assumption that the Siskin 2D model of
the Green River oil shale kerogen, shown in Figure 1, was the most complete and reliable
structural model that was available. This structure was incorporated into the molecular
modeling scheme using the general procedure described above. The initial starting point
was the 3D structure designated as S1 in Figure 2; this represents the starting point for the
folded structure used to begin the search for lower local energy minima structures. The
RHF single point energy of this local structure, designated as S1, is 28569.2846
Hartree (1 Hartree = 627.509 kcal/mol).
Following the annealing/optimization process described above using the S1
structure, four additional low energy structures, shown in Figure 3, were identified: S2
(ERHF = 28569.7319 Hartree), S3 (ERHF = 28569.6691 Hartree), S4 (ERHF =
28570.3721 Hartree), and S5 (ERHF = 28569.9504 Hartree). The lowest energy of
these initial five structures, S4, was then used as the parent for another
annealing/optimization cycle, generating structures S4-1 through S4-5. These structures
are shown in Figure 4. These ten structures were all optimized at the RHF level to relax
the geometries obtained from the MM+ calculations. It should be noted that due to the
size of these systems, it is not feasible to obtain a completely optimized structure. The
initial and final RHF energies are listed in Table 1. This shows that the structures
obtained from MM+ are, on the average, 1 Hartree higher than those calculated from
RHF. The lowest energy structure after the optimization is S4-5 (ERHF = -28571.4952
Hartree). This S4-5 structure was the one used to obtain the simulations of 13
C NMR and
PDF measurements, used to validate the model.
NMR: In order to explore the sensitivity of the simulated 13
C NMR spectrum to
the structure of the model, calculations of the chemical shielding were completed on
structures S4-1 through S4-5 and these calculations were used to simulate the spectra
shown in Figure 5. As can be seen in this figure, the spectra obtained from any of these
models are very similar, with only slight differences in the aliphatic chemical shift
region. This is not unexpected, as nearly all the structural changes in the models are
occurring in the flexible aliphatic chains while the aromatic structures are very rigid and
fixed.
A comparison can also be made between the spectrum simulated for model S4-5
and an experimental 13
C SSNMR spectrum of a Green River kerogen, as shown in Figure
6. The agreement between the simulation and the experimental spectrum is quite good in
terms of the agreement of the line shape for both the aliphatic and aromatic regions as
well as in the relative intensities of the two regions. The agreement of the relative
intensities is a reflection that the model and the experiment have the same ratios between
aromatic and aliphatic (28% aromatic/olefinic/carbonyl for the model and 24% from the
experimental NMR). Both the experimental and theory show the same tail to higher
chemical shifts, due to the presence of the carbonyl carbons; this tail is more pronounced
in the experimental spectrum, possibly an indication of the higher oxygen content of the
sample used in this work versus that used in the construction of the 2D Siskin model.
PDF: A similar analysis was completed with the atomic pairwise distribution
functions in order to obtain a second independent validation of the model. The PDF
simulated based on the S4-5 monomer model is shown in Figure 7, along with the
decomposition to the pairings between different atom types. The plot shows that the
atom-atom correlations are consistent with the separations expected based on typical
carbon bond lengths and angles: CH (1.12 Å), CC (1.52 Å), CCH (2.18 Å),
CCC (2.56 Å), and dihedral CCCC (3.90 Å). The features above 3 Å are a
function of the 3D structure and should show sensitivity to changes in the model. A
comparison of the PDFs of the structures S4-1 to S4-5 is shown in Figure 8. The plots do
not show any significant deviation from each other which indicates that in general the
average of various geometrical parameters such as bond lengths, bond angles, and
torsional angles are the same for all structures.
To gauge the sensitivity of the PDF analysis to the structural model a
stoichiometric equivalent 2D model of the kerogen Siskin model using only aliphatic
groups was built and its PDF was generated. As shown in Figure 8, the PDF of the
aliphatic model is clearly different from the PDF obtained from the other models in the
region above 3 Å. Hence, the PDF approach provides unique plots for different chemical
structures and can be used for our analysis.
The ultimate test, of course, is how well the PDF of the models correlate with the
experimental PDF. A preliminary comparison of the model and experimental PDFs
suggested that both have the same features in the short range region (r < 3 Å) but deviates
heavily at longer distances. There are two possible reasons for this discrepancy: (1) the
model is considerably smaller than the experimental structure and (2) a correction term as
discussed in the experimental section which accounts for the shape and size of the model
is necessary for comparison with experiment.
To explore the effect of the size of the model, a much larger model was built by
confining twelve of the un-optimized Siskin model structures (S1) in a bounding box just
large enough to accommodate the model. This last point is crucial as the correction term
mentioned in point two above, assumes a totally filled rectangular box with no void
spaces. The PDF of the 12-unit kerogen model and the experimental PDF for the Green
River kerogen are shown in Figure 10. The PDF of the model is corrected accordingly
for size and shape. The first peak in the PDFs corresponds to C-H distances whereas the
second corresponds to the C-C distance between directly bonded carbons. This distance is
approximately 1.5 Å for aliphatic carbons and 1.4 Å for aromatic ones. The second peak
at approximately at 2.5 Å corresponds to the geminal distance between carbons two
bonds apart. This distance is approximately 2.4 Å and 2.6 Å for aromatic and aliphatic
carbons, respectively. The peak at approximately 3 Å corresponds to the distance
between carbons separated by four bonds in a cis configuration and the one at
approximately 3.8 Å to carbons in a trans configuration. For these peaks there is good
agreement in terms of peak position. The comparison of the peak intensities does show
differences, especially in the intensity of the C-H peak. This does suggest that there may
be a greater proportion of aromatic carbons or heteroatoms in the sample compared to the
model, consistent with the results of the elemental analysis discussed earlier.
Conclusion
Several 3D models based on Siskin’s 2D model for a Green River kerogen were
constructed by geometry optimization of different conformations provided by simulated
annealing techniques. These models were used to obtain simulated PDF plots and 13
C
NMR spectra which were compared with experimental data obtained on a Green River
kerogen sample. This process allowed for the exploration of both the sensitivity of these
experimental methods to the 3D structure as well as for the validation of the use of the
models for subsequent modeling work. The results presented demonstrate the feasibility
of extending 2D models to 3D to help validate and provide information on possible
deficiencies with the 2D models.
Using different single unit models, simulations of the expected 13
C NMR
spectrum were completed. These simulated spectra are all similar, but do show
differences in the line shape in the aliphatic region. The comparison between the
experimental and simulated spectra is quite good, in terms of the line shapes of both the
aromatic and aliphatic region as well as in the relative signal intensity between the two
peaks.
The initial models consisting of a single kerogen unit were not sufficient to mimic
the bulk kerogen as can be seen in their respective PDF plots. A larger 12-unit model
was therefore constructed in a manner which minimized the amount of “dead” spaces
around the corners of our confining box, as the calculation of the PDF is based on a
rectangular box with no void spaces around the molecule. Overall there is good
agreement between the model and experimental PDFs especially at shorter distances,
however less accurate for distances between 4 Å and 6 Å. For distances above 6 Å the
PDF provides very poor resolution and while there is overall agreement between the
model and experimental one, this does not provide any apparent structural information.
Acknowledgments: This work was supported by award DE-FE0001243 from the U.S.
Department of Energy, National Energy Technology Laboratory. Use of the Advanced
Photon Source was supported by the U. S. Department of Energy, Office of Science,
Office of Basic Energy Sciences, under Contract No. DE-AC02-06CH11357. An
allocation of computer time from the Center for High Performance Computing at the
University of Utah is acknowledged. A.M.O. acknowledges a beam time award on beam
11-ID-B at the Advanced Photon Source at Argonne National Laboratory. D.R.L.
acknowledges support by the Chevron Energy Technology Company through a contract
with University of Utah.
References
(1) Vandenbroucke, M.; Largeau, C. Kerogen origin, evolution and structure. Org.
Geochem. 2007, 38, 719.
(2) Rullkötter, J.; Michaelis, W. The structure of kerogen and related materials. A review
of recent progress and future trends. Org. Geochem. 1990, 16, 829.
(3) Siskin, M.; Katritksy, A. R. Aqueous Organic Chemistry: Geochemical Aspects. In
Composition, Geochemistry and Conversion of Oil Shales; Snape, C., Ed., Kluwer
Academic Publishers: Boston 1995, p. 313.
(4) Nomura, M.; Artok, L.; Murata, S.; Yamamoto, A.; Hama, A.; Gao, H.; Kidena, K.
Structural Evaluation of Zao Zhuang Coal. Energy Fuels 1998, 12, 512.
(5) van Krevelen, D. W. Coal: Typology – Chemistry – Physics – Constitution.
Netherlands: Elsevier; 1961.
(6) Brons, G.; Siskin, M.; Botto, R. I.; Guven, N. Quantitative mineral distribution in
Green River and Rundle oil shales. Energy Fuels 1989, 3, 85.
(7) Siskin, M.; Katritzky, A. R. Reactivity of Organic Compounds in Hot Water:
Geochemical and Technological Implications. Science 1991, 254, 231.
(8) Smith, J. W.; Higby, L. W. Preparation of organic concentrate from Green River oil
shale. Anal. Chem. 1960, 32, 1718.
(9) Reisberg, J. The Beneficiation of Green River Oil Shale by Pelletization. In Oil
Shale, Tar Sands, and Related Materials; Stauffer, H. C., Ed.; American Chemical
Society:Washington, DC, 1981; p. 155.
(10) Ibrahimov, R. A. Bissada, K. K. (Adry) Comparative analysis and geological
significance of kerogen isolated using open-system (palynological) versus chemically and
volumetrically conservative closed-system methods. Org. Geochem. 2010, 41, 800.
(11) Gupta, R.; Gidaspow, D.; Wasan, D. T. Electrostatic Beneficiation of Eastern Oil
Shales. Chem. Eng. Comm. 1991, 108, 49.
(12) Siskin, M.; Brons, G.; Payack, J.F., Jr. Disruption of Kerogen-Mineral Interactions
in Oil Shales. Energy Fuels 1987, 1, 248 and references citin therein.
(13) Vandenbroucke, M. Kerogen: from Types to Models of Chemical Structure. Oil &
Gas Science and Technology-Rev. IFP 2003, 58, 243.
(14) Durand, B; Vandenbroucke, M. As cited in Kerogen, Insoluble Organic Matter
From Rocks; B. Durand, Ed.; Technip: Paris, 1980; p. 218 and 319.
(15) Siskin, M.; Scouten, C. G.; Rose, K. D.; Aczel, D.; Colgrove, S. G.; Pabst, R. E.
Detailed Structural Characterization of the Organic Material in Rundle Ramsay Crossing
and Green River Oil Shales. In Composition, geochemistry and conversion of oil shales;
Snape, C., Ed.; Kluwer Academic: Boston, 1995; p. 143.
(16) Kelemen, S.R.; Siskin, M. Organic Mater Models of Oil Shale Revisited. Prepr.
Pap.-Am. Chem. Soc., Div. Pet. Chem. 2004, 49, 73.
(17) Lille, U.; Heinmaa, I.; Pehk, T. Molecular model of Estonian kukersite kerogen
evaluated by 13
C MAS NMR spectra. Fuel 2003, 82, 799.
(18) Faulon, J. L.; Vandenbroucke, M.; Drappier, J. M.; Behar, F.; Romero, M. 3D
Chemical Model for Geological Macromolecules. Org. Geochem. 1990, 6, 981
(19) Faulon, J.L. Prediction, Elucidation, and Molecular Modeling. Algorithms and
Applications in Geochemistry. 1991, Ph. D. Thesis.
(20) Freund, H.; Walters, C. C.; Kelemen, S. R.; Siskin, M.; Gorbaty, M. L.; Curry, D. J.;
Bence, A. E. Predicting oil and gas compositional yields via chemical structure-chemical
yield modeling (CS-CYM): Part 1- Concepts and implementation. Org. Geochem. 2007,
38, 288.
(21) Salmon, E.; Behar, F.; Hatcher, P.G. Molecular Characterization of Type I kerogen
for the Green River Formation using advanced NMR techniques in combination with
electrospray ionization/ultrahigh resolution mass spectrometry. Org. Geochem. 2011, 42,
301.
(22) Vandergrift, G. F.; Winans, R. E.; Horwitz, E. P. Quantitative study of the
carboxylic acids in Green River oil shale bitumen. Fuel 1980, 59, 627.
(23) Jeong, K. M.; Patzer II, J. F. Indigenous Mineral Matter Effects in Pyrolysis of
Green River Oil Shale. In Geochemistry and Chemistry of Oil Shales; Minkis, F. P.,
McKay, J. F., Ed.; American Chemical Society: Washington DC, 1983; pp. 529 - 542.
(24) Jeong K. M.; Kobylinski, T. P. Organic-Mineral Matter Interactions in Green River
Oil Shale. Prepr. Pap.-Am. Chem. Soc., Div. Fuel Chem. 1983, p. 493.
(25) Sheu, E.Y. Self-Association of Asphaltenes; Structure and Molecular Packing. In
Structure and Dynamics of Asphaltenes; Mullins, O. C.; Sheu, E.Y., Ed.; Plenum Press:
New York, 1998; pp.115-144.
(26) Egami, T.; Billinge, S.J. L. Underneath the Bragg Peaks: Structure Analysis of
Complex Materials; Oxford/Pergamon Press: New York, 2003.
(27) Nield, V.; Keen, D. A. Diffuse Neutron Scattering from Crystalline Materials;
Oxford/Clarendon Press: Oxford, 2001.
(28) Solum, M. S.; Pugmire, R. J.; Grant, D. M. 13
C Solid-State NMR of Argonne
Premium Coals. Energy Fuels 1989, 3, 187-193.
(29) Solum, M. S., Sarofim, A. F., Pugmire, R. J., Fletcher, T. F., Zhang, H. 13
C NMR
Analysis of Soot Produced from Model Compounds and a Coal. Energy Fuels 2001, 15,
961.
(30) Solid state 13
C NMR and PDF measurements were completed on a sample of
kerogen isolated following the process outlined by Vandergrift, G. F.; Winans, R. E.;
Scott, R. G.; Horwitz, E. P., in Fuel 1980, 59(9), 627, on a one foot section from the peak
organic content of the Mahogany zone of a core drilled in the Green River Formation of
the Uinta Basin in Utah in spring 2010. The experimental results will be discussed
further in a separate publication.
(31) HyperChem(TM) Professional 7, Hypercube, Inc., 1115 NW 4th Street, Gainesville,
Florida 32601, USA.
(32) Allinger, N. L. Conformational Analysis 130. MM2. A Hydrocarbon Force Field
Utilizing V1 and V2 Torsional Terms. J. Am. Chem. Soc., 1977, 99, 8127.
(33) Schmidt, M. W.; Baldridge, K.K.; Boatz, J. A.; Elbert, S. T.; Gordon, M. S.; Jensen,
J. J.; Koseki, S.; Matsunaga, N.; Nguyen, K. A.; Su, S.; Windus, T. L.; Dupuis, M.;
Montgomery, J. A. General Atomic and Molecular Electronic Structure System. J.
Comput. Chem. 1993, 14, 1347.
(34) Hehre, W.J.; Stewart, R. F.; Pople, J. A. Self-Consistent Molecular Orbital
Methods I. Use of Gaussian Expansions of Slater Type Atomic Orbitals. J. Chem. Phys.
1969, 51, 2657.
(35) Kirkpatrick, S.; Gelatt, C. D.; Vecchi, M. P. Optimization by Simulated Annealing.
Science 1983, 220, 671.
(36) Macrae, C. F.; Bruno, I.J.; Chisholm, J. A.; Edgington, P. R.; McCabe, P.; Pidcock,
E.; Rodriguez-Monge, L.; Taylor, R.; van de Streek, J.; Wood, P. A. Mercury CSD 2.0 –
new features for the visualization and investigation of crystal structures. J. Appl. Cryst.
2008, 41, 466.
(37) Adamo, C; Barone, V. Toward reliable density functional methods without
adjustable parameters: The PBE0 model. J. Chem. Phys., 1999, 110, 6158-69.
(38) Ditchfield, R.; Hehre, W. J.; Pople, J. A. Self-Consistent Molecular Orbital Methods.
9. Extended Gaussian-type basis for molecular-orbital studies of organic molecules. J.
Chem. Phys., 1971, 54, 724; Hehre, W. J.; Ditchfield, R.; Pople, J. A. Self-Consistent
Molecular Orbital Methods. 12. Further extensions of Gaussian-type basis sets for use in
molecular-orbital studies of organic molecules. J. Chem. Phys., 1972, 56, 2257.
(39) Gaussian 09, Revision B.01, Frisch, M. J.; Trucks, G. W.; Schlegel, H. B.; Scuseria,
G. E.; Robb, M. A.; Cheeseman, J. R.; Scalmani, G.; Barone, V.; Mennucci, B.;
Petersson, G. A.; Nakatsuji, H.; Caricato, M.; Li, X.; Hratchian, H. P.; Izmaylov, A. F.;
Bloino, J.; Zheng, G.; Sonnenberg, J. L.; Hada, M.; Ehara, M.; Toyota, K.; Fukuda, R.;
Hasegawa, J.; Ishida, M.; Nakajima, T.; Honda, Y.; Kitao, O.; Nakai, H.; Vreven, T.;
Montgomery, Jr., J. A.; Peralta, J. E.; Ogliaro, F.; Bearpark, M.; Heyd, J. J.; Brothers, E.;
Kudin, K. N.; Staroverov, V. N.; Kobayashi, R.; Normand, J.; Raghavachari, K.; Rendell,
A.; Burant, J. C.; Iyengar, S. S.; Tomasi, J.; Cossi, M.; Rega, N.; Millam, N. J.; Klene,
M.; Knox, J. E.; Cross, J. B.; Bakken, V.; Adamo, C.; Jaramillo, J.; Gomperts, R.;
Stratmann, R. E.; Yazyev, O.; Austin, A. J.; Cammi, R.; Pomelli, C.; Ochterski, J. W.;
Martin, R. L.; Morokuma, K.; Zakrzewski, V. G.; Voth, G. A.; Salvador, P.; Dannenberg,
J. J.; Dapprich, S.; Daniels, A. D.; Farkas, Ö.; Foresman, J. B.; Ortiz, J. V.; Cioslowski,
J.; Fox, D. J. Gaussian, Inc., Wallingford CT, 2009.
(40) Jameson, A. K.; Jameson, C. J. Gas-phase 13
C chemical shifts in the zero-pressure
limit: refinements to the absolute shielding scale for 13
C. Chem. Phys. Lett. 1987, 134,
461.
(41) Proffen, T.; Neder, R. B. DISCUS: a program for diffuse scattering and defect-
structure simulation. J. Appl. Crystallogr. 1997, 30, 171.
(42) Neder, R. B.; Korsunskiy, V. I. Structure of nanoparticles from powder diffraction
data using the pair distribution function. J. Phys.: Condens. Matter, 2005, 17, S125.
(43) Chupas, P. J.; Chapman, K. W.; Lee, P. L. Applications of an amorphous silicon-
based area detector for high-resolution, high-sensitivity and fast time-resolved pair
distribution function measurements. J. Appl. Cryst., 2007, 40, 463.
(44) Hammersley, A. P.; Svensson, S. O.; Hanfland, M.; Fitch, A. N.; Hausermann, D.
Two-dimensional Detector Software: From Real Detector to Idealized Image or Two-
theta Scan. High Pressure Research, 1996, 14, 235.
(45) Qiu, X.; Thompson, J. W.; Billinge, S. J. L. PDFgetX2: a GUI-driven program to
obtain the pair distribution function from X-ray powder diffraction data. J. Appl. Cryst.,
2004, 37, 678.
(46) Winans, R. E.; Chapman, K.W.; Chupas, P. J.; Seifert, S.; Clemens, A. H.; Calo, J.;
Bain, E.; Mathews, J. P.;
Narkiewicz, M.R. In situ studies of coal pressurized with CO2
by small angle and high energy, wide angle X-ray scattering. Prep. Pap. - Am. Chem.
Soc., Div Fuel Chem., 2008, 53(1), 283.
(47) Castro-Marcano, F.; Winans, R. E.; Chupas, P.; Chapman, K.; Calo, J. M.; Watson,
J. K.; Mathews, J. P. Fine Structure Evaluation of the Pair Distribution Function with
Molecular Models of the Argonne Premium Coals. Energy Fuels 2012, 26, 4336.
(48) Bennett, A. E., Rienstra, C. M., Auger, M., Lakshmi, K. V., Griffin, R. G.
Heteronuclear decoupling in rotating solids. J. Chem. Phys. 1995, 103, 6951.
(49) Kolodziejski, W., Klinowski, J. Kinetics of Cross-Polarization in Solid-State NMR:
A Guide for Chemists. Chem. Rev. 2002, 102, 613.
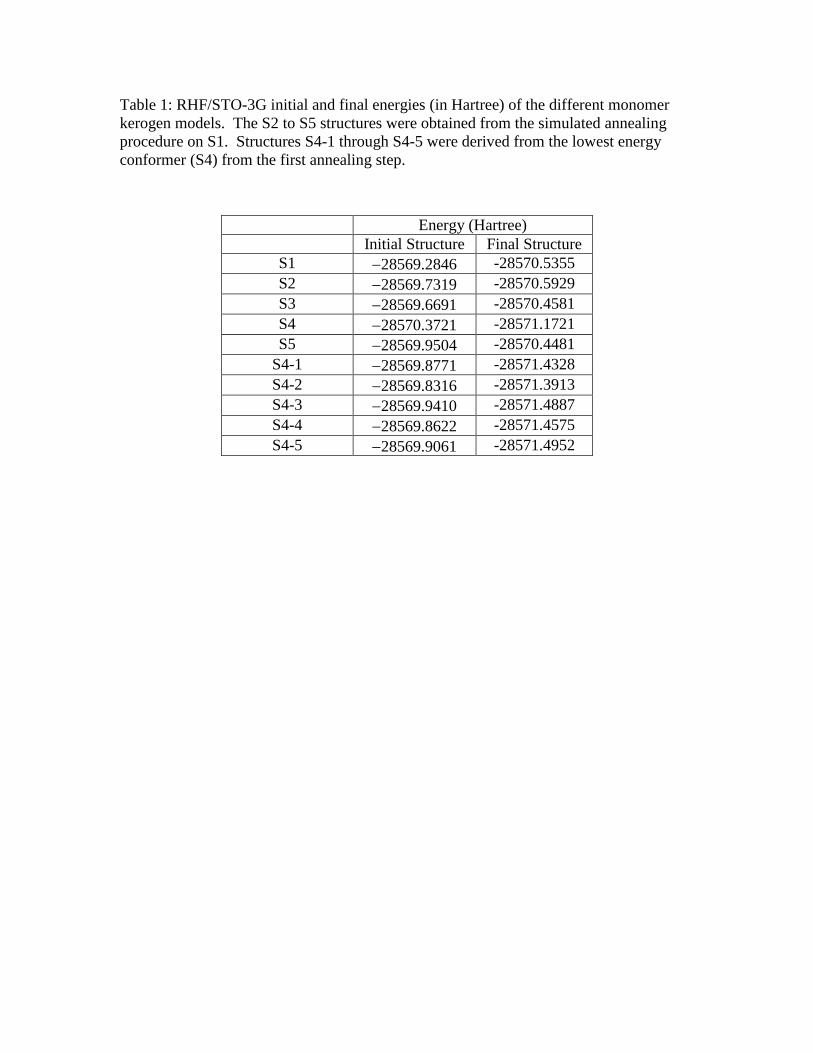
Table 1: RHF/STO-3G initial and final energies (in Hartree) of the different monomer
kerogen models. The S2 to S5 structures were obtained from the simulated annealing
procedure on S1. Structures S4-1 through S4-5 were derived from the lowest energy
conformer (S4) from the first annealing step.
Energy (Hartree)
Initial Structure Final Structure
S1 28569.2846 -28570.5355
S2 28569.7319 -28570.5929
S3 28569.6691 -28570.4581
S4 28570.3721 -28571.1721
S5 28569.9504 -28570.4481
S4-1 28569.8771 -28571.4328
S4-2 28569.8316 -28571.3913
S4-3 28569.9410 -28571.4887
S4-4 28569.8622 -28571.4575
S4-5 28569.9061 -28571.4952
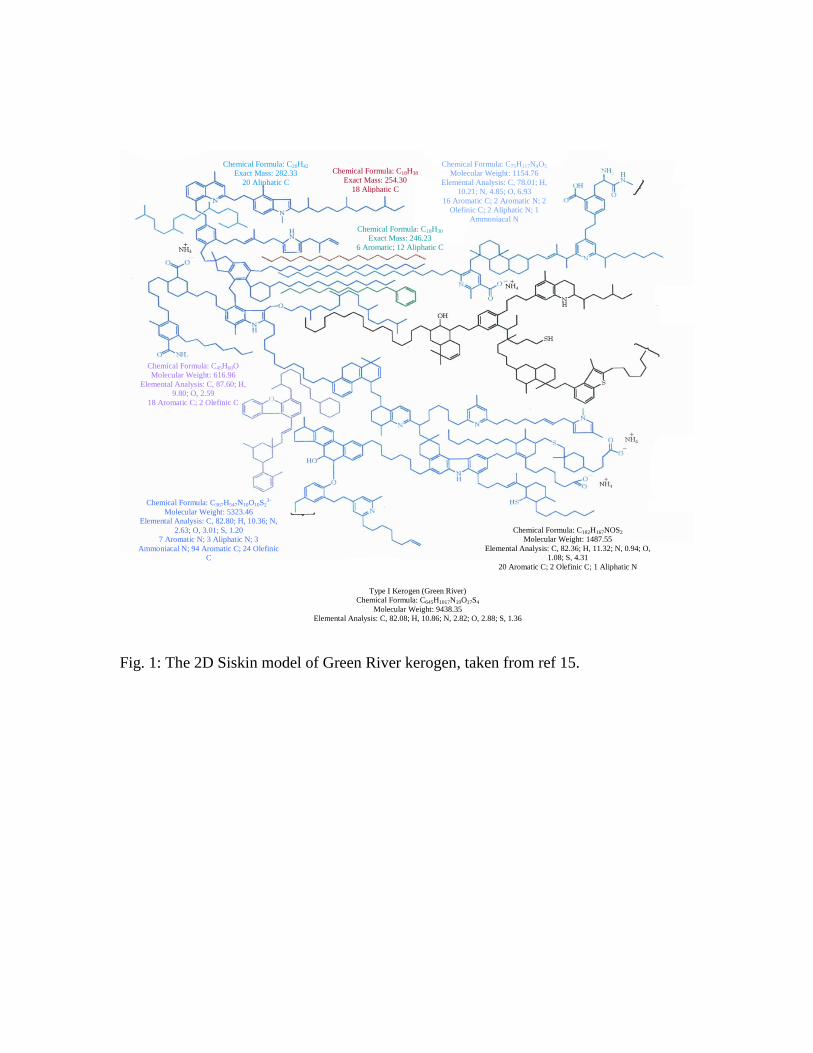
Fig. 1: The 2D Siskin model of Green River kerogen, taken from ref 15.
Chemical Formula: C20H42
Exact Mass: 282.33
20 Aliphatic C
Chemical Formula: C18H38
Exact Mass: 254.30
18 Aliphatic C
Chemical Formula: C75H117N4O5
Molecular Weight: 1154.76
Elemental Analysis: C, 78.01; H,
10.21; N, 4.85; O, 6.93
16 Aromatic C; 2 Aromatic N; 2
Olefinic C; 2 Aliphatic N; 1
Ammoniacal N
Chemical Formula: C18H30
Exact Mass: 246.23
6 Aromatic; 12 Aliphatic C
Chemical Formula: C45H60O
Molecular Weight: 616.96
Elemental Analysis: C, 87.60; H,
9.80; O, 2.59
18 Aromatic C; 2 Olefinic C
Chemical Formula: C367H547N10O10S23-
Molecular Weight: 5323.46
Elemental Analysis: C, 82.80; H, 10.36; N,
2.63; O, 3.01; S, 1.20
7 Aromatic N; 3 Aliphatic N; 3
Ammoniacal N; 94 Aromatic C; 24 Olefinic
C
Chemical Formula: C102H167NOS2
Molecular Weight: 1487.55
Elemental Analysis: C, 82.36; H, 11.32; N, 0.94; O,
1.08; S, 4.31
20 Aromatic C; 2 Olefinic C; 1 Aliphatic N
Type I Kerogen (Green River)
Chemical Formula: C645H1017N19O17S4
Molecular Weight: 9438.35
Elemental Analysis: C, 82.08; H, 10.86; N, 2.82; O, 2.88; S, 1.36
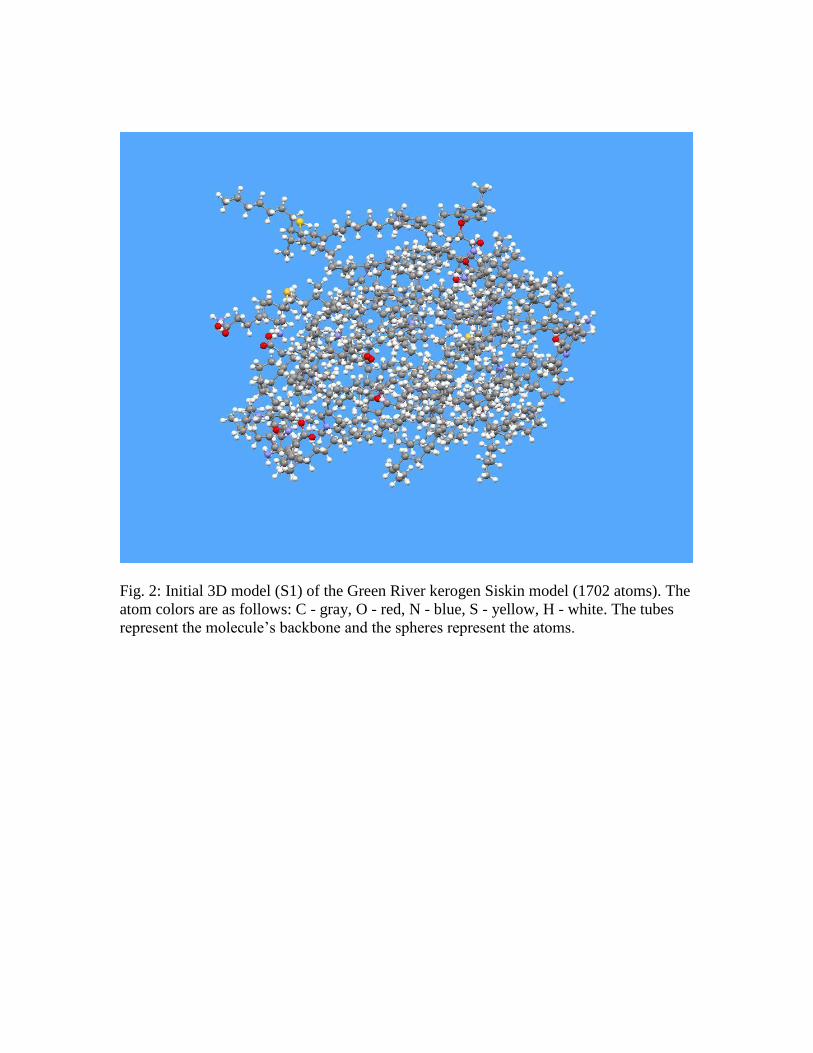
Fig. 2: Initial 3D model (S1) of the Green River kerogen Siskin model (1702 atoms). The
atom colors are as follows: C - gray, O - red, N - blue, S - yellow, H - white. The tubes
represent the molecule’s backbone and the spheres represent the atoms.
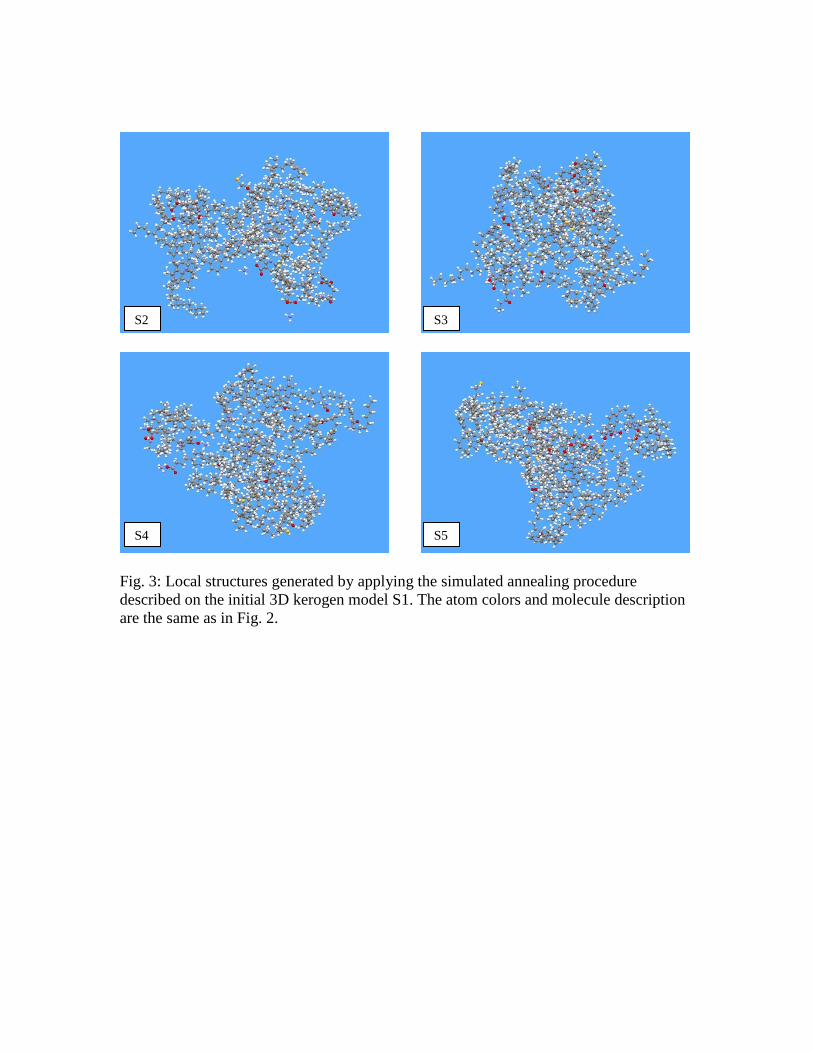
Fig. 3: Local structures generated by applying the simulated annealing procedure
described on the initial 3D kerogen model S1. The atom colors and molecule description
are the same as in Fig. 2.
S4
S2 S3
S5
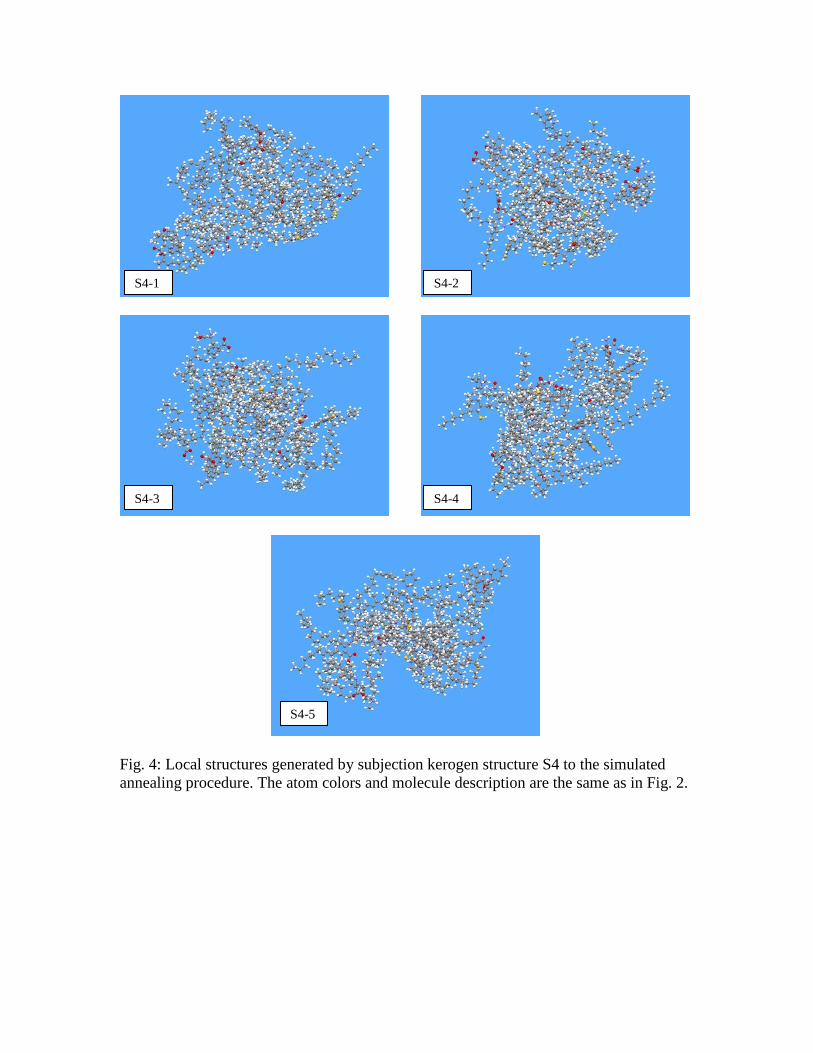
Fig. 4: Local structures generated by subjection kerogen structure S4 to the simulated
annealing procedure. The atom colors and molecule description are the same as in Fig. 2.
S4-1 S4-2
S4-3 S4-4
S4-5
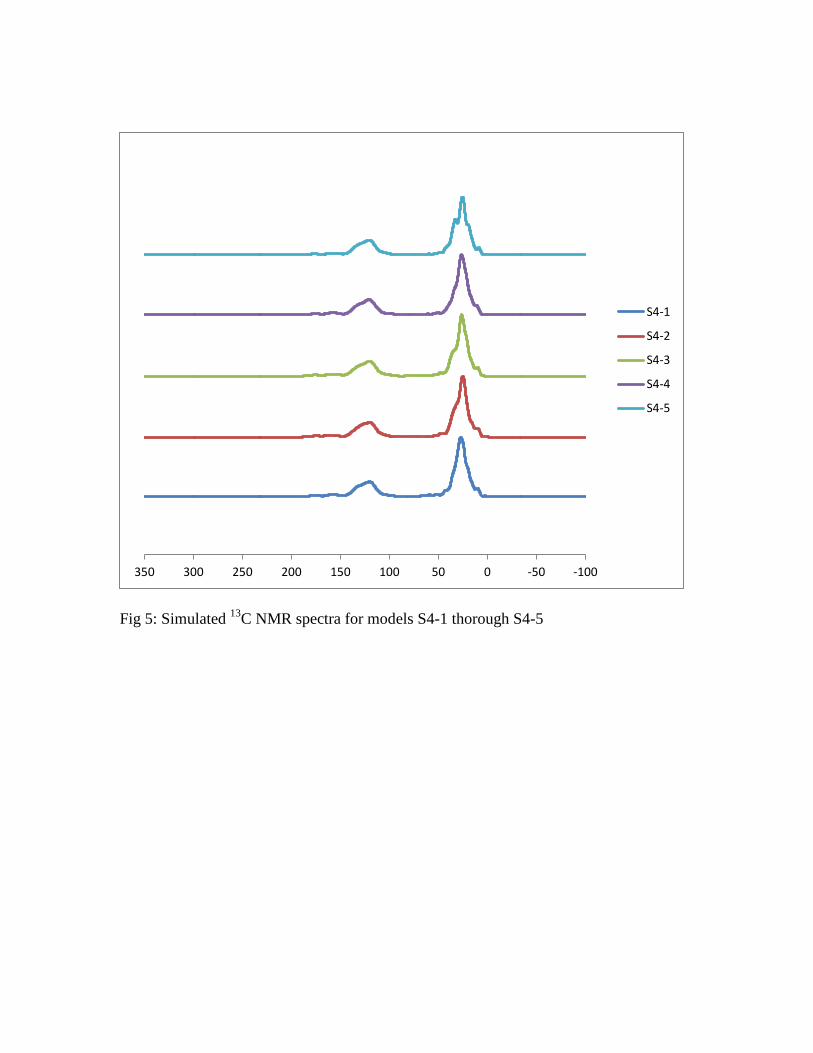
Fig 5: Simulated 13
C NMR spectra for models S4-1 thorough S4-5
-100-50050100150200250300350
S4-1
S4-2
S4-3
S4-4
S4-5
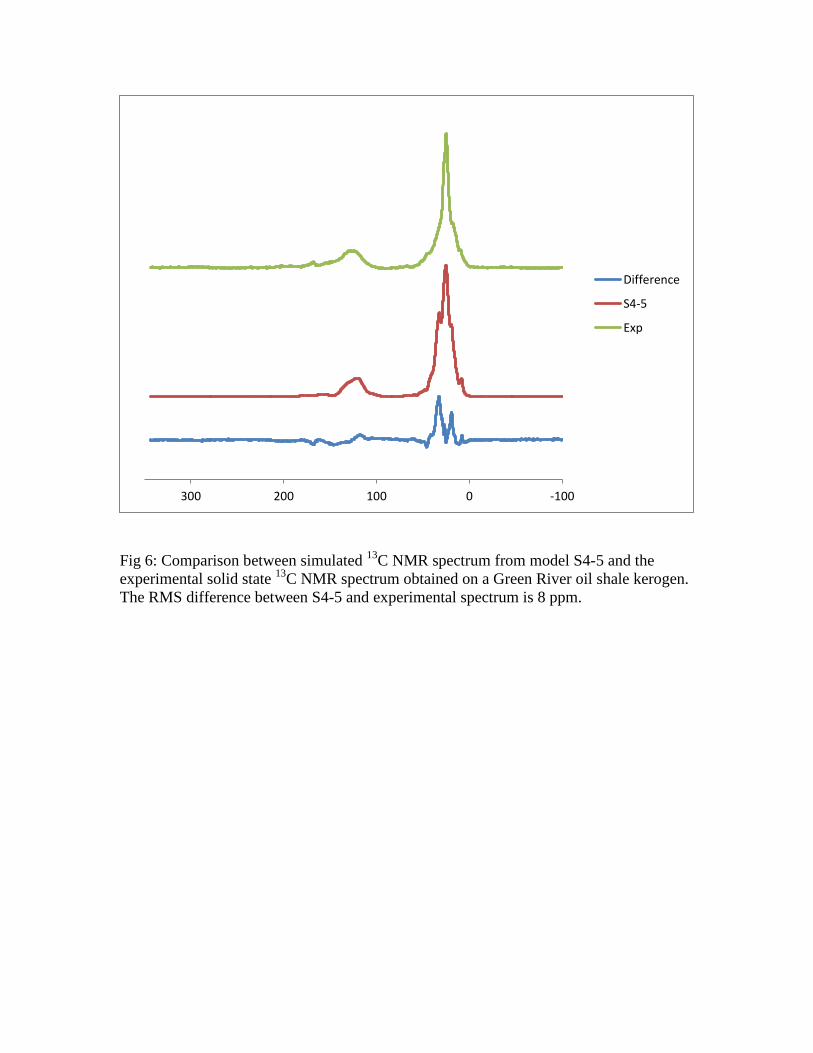
Fig 6: Comparison between simulated 13
C NMR spectrum from model S4-5 and the
experimental solid state 13
C NMR spectrum obtained on a Green River oil shale kerogen.
The RMS difference between S4-5 and experimental spectrum is 8 ppm.
-1000100200300
Difference
S4-5
Exp
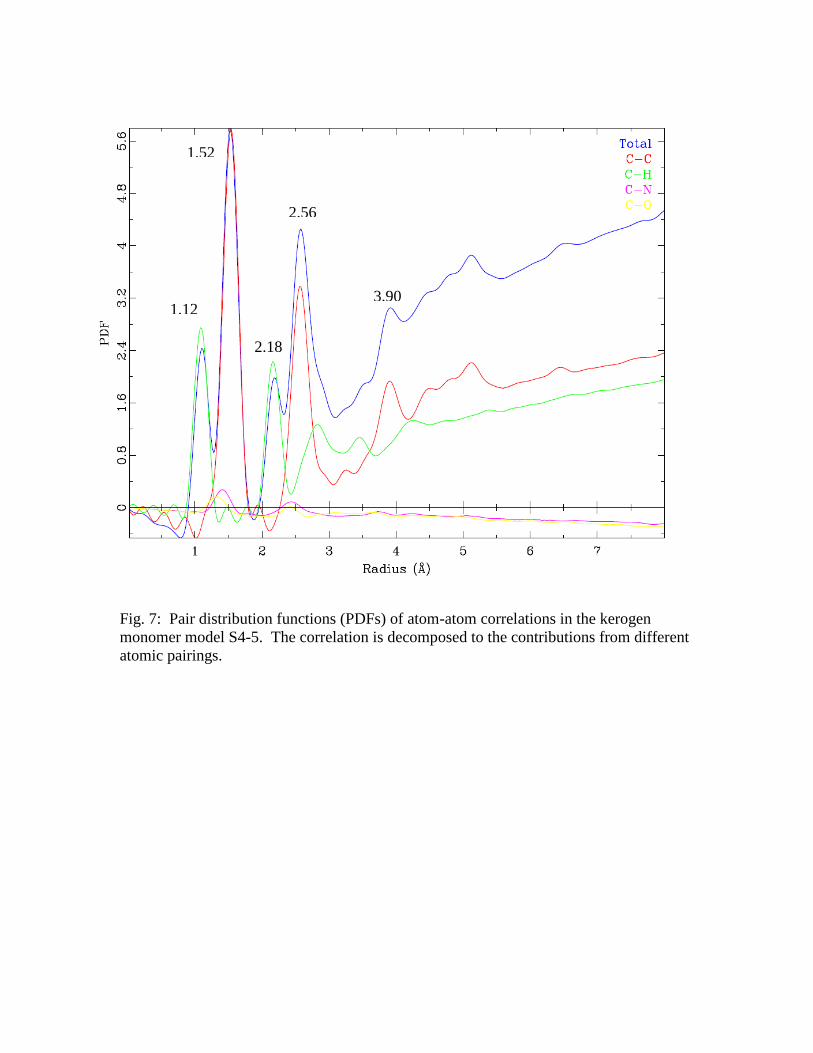
Fig. 7: Pair distribution functions (PDFs) of atom-atom correlations in the kerogen
monomer model S4-5. The correlation is decomposed to the contributions from different
atomic pairings.
1.12
1.52
2.18
2.56
3.90
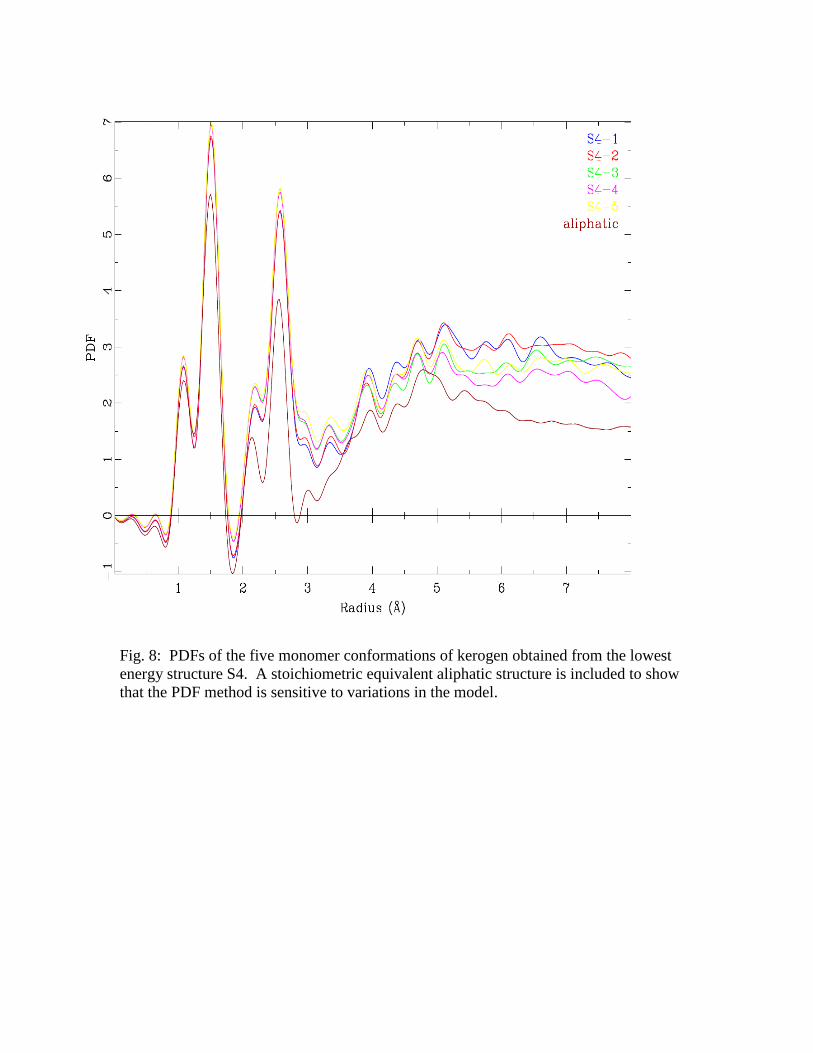
Fig. 8: PDFs of the five monomer conformations of kerogen obtained from the lowest
energy structure S4. A stoichiometric equivalent aliphatic structure is included to show
that the PDF method is sensitive to variations in the model.
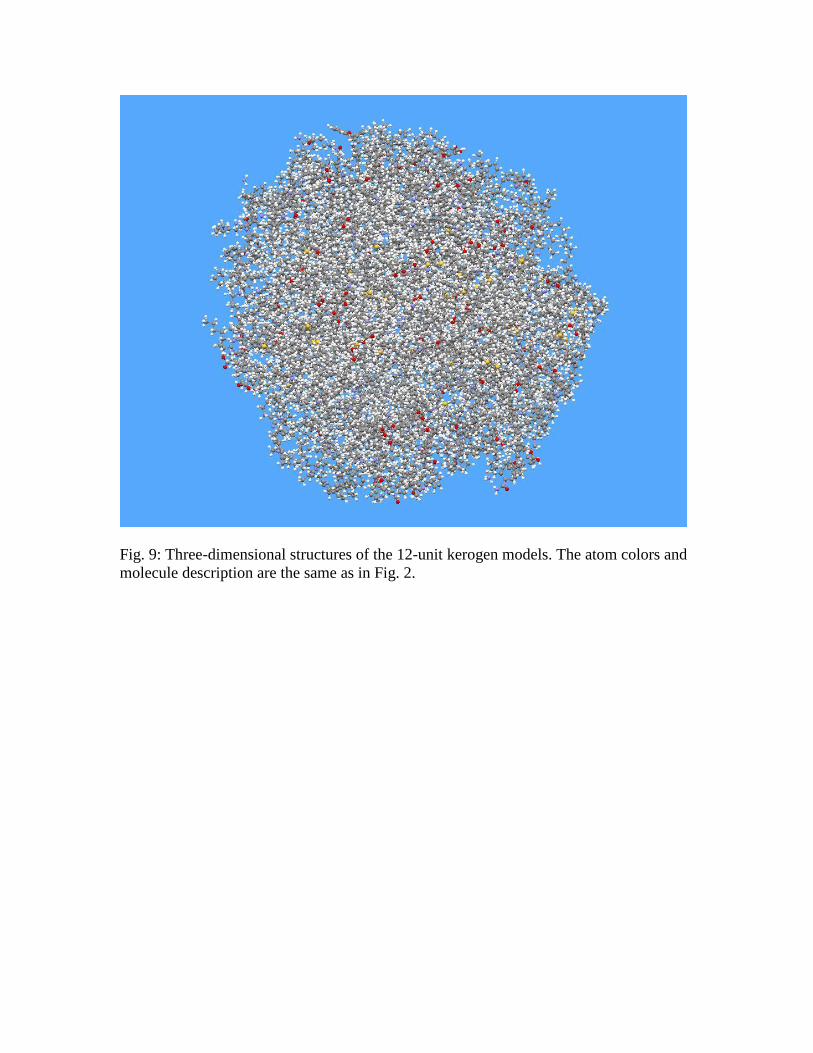
Fig. 9: Three-dimensional structures of the 12-unit kerogen models. The atom colors and
molecule description are the same as in Fig. 2.
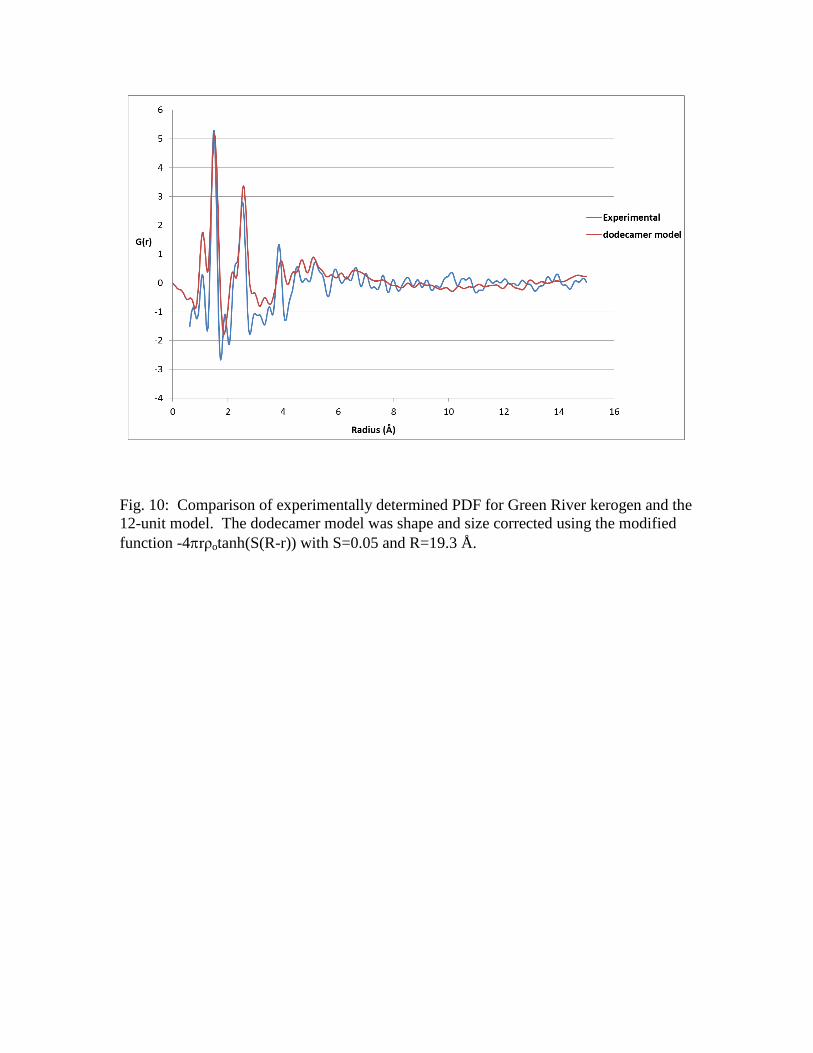
Fig. 10: Comparison of experimentally determined PDF for Green River kerogen and the
12-unit model. The dodecamer model was shape and size corrected using the modified
function -4rρotanh(S(R-r)) with S=0.05 and R=19.3 Å.


![t ^l|tlTppxnes 11252.pdf · [ republic act no. 11252 ] an act extending for another twenty-five (25) years the franchise granted to rmc broadcasting corporation under republic act](https://img.pdfslide.us/doc/110x75/5e9df6c746ccfd4b367beed1/t-ltltppxnes-11252pdf-republic-act-no-11252-an-act-extending-for-another.jpg)