Embed Size (px)
Citation preview
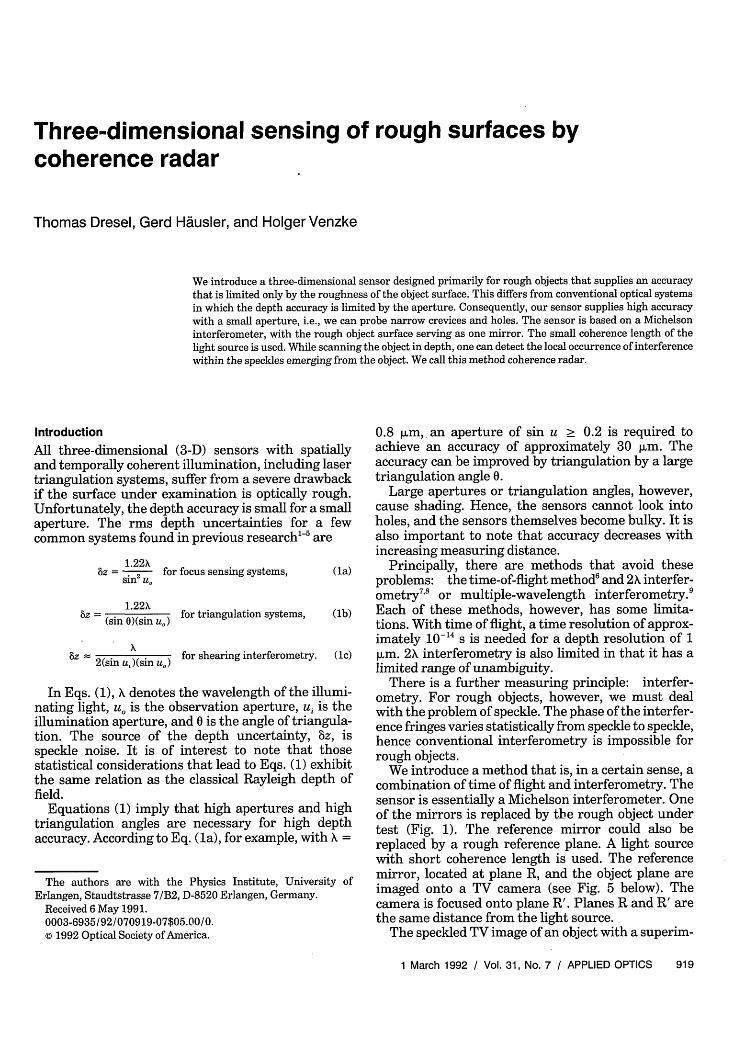
Three-dimensional sensing of rough surfaces bycoherence radar
Thomas Dresel, Gerd Hdusler, and Holger Venzke
We introduce a three-dimensional sensor designed primarily for rough objects that supplies an accuracythat is limited only by the roughness of the object surface. This differs from conventional optical systemsin which the depth accuracy is limited by the aperture. Consequently, our sensor supplies high accuracywith a small aperture, i.e., we can probe narrow crevices and holes. The sensor is based on a Michelsoninterferometer, with the rough object surface serving as one mirror. The small coherence length of thelight source is used. While scanning the object in depth, one can detect the local occurrence of interferencewithin the speckles emerging from the object. We call this method coherence radar.
Introduction
All three-dimensional (3-D) sensors with spatiallyand temporally coherent illumination, including lasertriangulation systems, suffer from a severe drawbackif the surface under examination is optically rough.Unfortunately, the depth accuracy is small for a smallaperture. The rms depth uncertainties for a fewcommon systems found in previous research`5 are
1.22X6z= z for focus sensing systems, (la)
1.22X(sin 0)(sin uo) for triangulation systems, (lb)
A2(sin ui)(sin u,) for shearing interferometry. (1c)
In Eqs. (1), X denotes the wavelength of the illumi-nating light, u. is the observation aperture, ui is theillumination aperture, and 0 is the angle of triangula-tion. The source of the depth uncertainty, z, isspeckle noise. It is of interest to note that thosestatistical considerations that lead to Eqs. (1) exhibitthe same relation as the classical Rayleigh depth offield.
Equations (1) imply that high apertures and hightriangulation angles are necessary for high depthaccuracy. According to Eq. (la), for example, with X =
The authors are with the Physics Institute, University ofErlangen, Staudtstrasse 7/B2, D-8520 Erlangen, Germany.
Received 6 May 1991.0003-6935/92/070919-07$05.00/0.c 1992 Optical Society of America.
0.8 m,. an aperture of sin u 0.2 is required toachieve an accuracy of approximately 30 plm. Theaccuracy can be improved by triangulation by a largetriangulation angle 0.
Large apertures or triangulation angles, however,cause shading. Hence, the sensors cannot look intoholes, and the sensors themselves become bulky. It isalso important to note that accuracy decreases withincreasing measuring distance.
Principally, there are methods that avoid theseproblems: the time-of-flight method6 and 2A interfer-ometry7'8 or multiple-wavelength interferometry?Each of these methods, however, has some limita-tions. With time of flight, a time resolution of approx-imately 10-l' s is needed for a depth resolution of 1p1m. 2X interferometry is also limited in that it has alimited range of unambiguity.
There is a further measuring principle: interfer-ometry. For rough objects, however, we must dealwith the problem of speckle. The phase of the interfer-ence fringes varies statistically from speckle to speckle,hence conventional interferometry is impossible forrough objects.
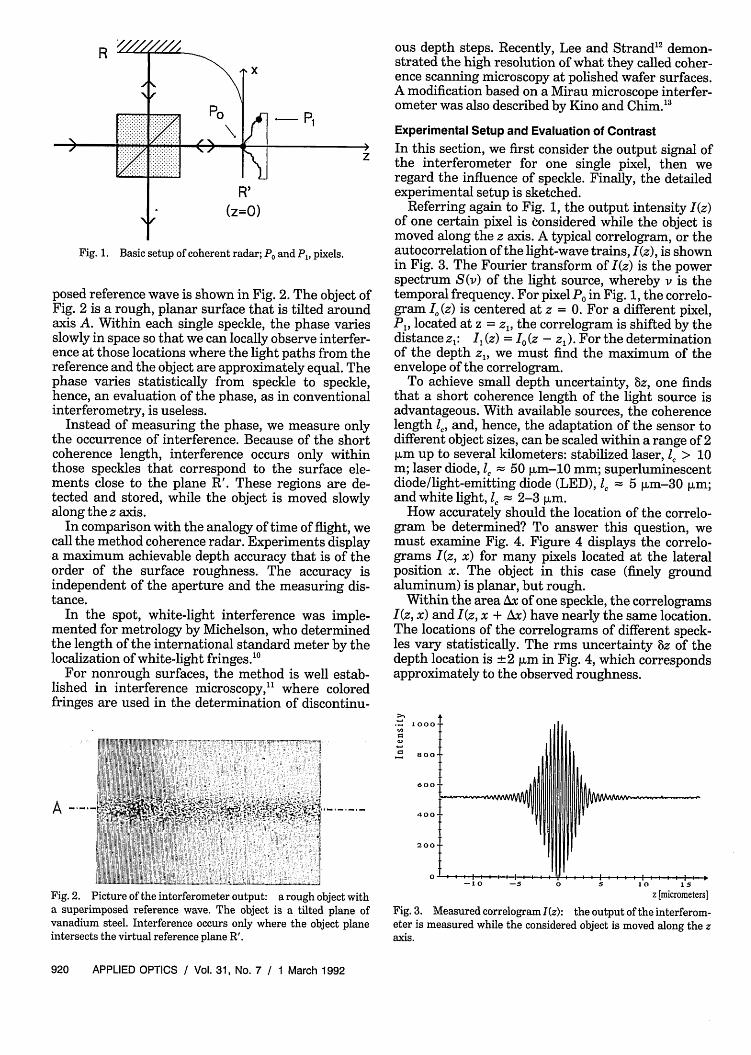
We introduce a method that is, in a certain sense, acombination of time of flight and interferometry. Thesensor is essentially a Michelson interferometer. Oneof the mirrors is replaced by the rough object undertest (Fig. 1). The reference mirror could also bereplaced by a rough reference plane. A light sourcewith short coherence length is used. The referencemirror, located at plane R, and the object plane areimaged onto a TV camera (see Fig. 5 below). Thecamera is focused onto plane R'. Planes R and R' arethe same distance from the light source.
The speckled TV image of an object with a superim-
1 March 1992 / Vol. 31, No. 7 / APPLIED OPTICS 919
'/
-7. P0
..X ..:...... .........
N t1C Pi
~~~~~z
(z=O)'4.
Fig. 1. Basic setup of coherent radar; P0 and P1, pixels.
posed reference wave is shown in Fig. 2. The object ofFig. 2 is a rough, planar surface that is tilted aroundaxis A. Within each single speckle, the phase variesslowly in space so that we can locally observe interfer-ence at those locations where the light paths from thereference and the object are approximately equal. Thephase varies statistically from speckle to speckle,hence, an evaluation of the phase, as in conventionalinterferometry, is useless.
Instead of measuring the phase, we measure onlythe occurrence of interference. Because of the shortcoherence length, interference occurs only withinthose speckles that correspond to the surface ele-ments close to the plane R'. These regions are de-tected and stored, while the object is moved slowlyalong the z axis.
In comparison with the analogy of time of flight, wecall the method coherence radar. Experiments displaya maximum achievable depth accuracy that is of theorder of the surface roughness. The accuracy isindependent of the aperture and the measuring dis-tance.
In the spot, white-light interference was imple-mented for metrology by Michelson, who determinedthe length of the international standard meter by thelocalization of white-light fringes.'"
For nonrough surfaces, the method is well estab-lished in interference microscopy," where coloredfringes are used in the determination of discontinu-
ous depth steps. Recently, Lee and Strand12 demon-strated the high resolution of what they called coher-ence scanning microscopy at polished wafer surfaces.A modification based on a Mirau microscope interfer-ometer was also described by Kino and Chim."
Experimental Setup and Evaluation of Contrast
In this section, we first consider the output signal ofthe interferometer for one single pixel, then weregard the influence of speckle. Finally, the detailedexperimental setup is sketched.
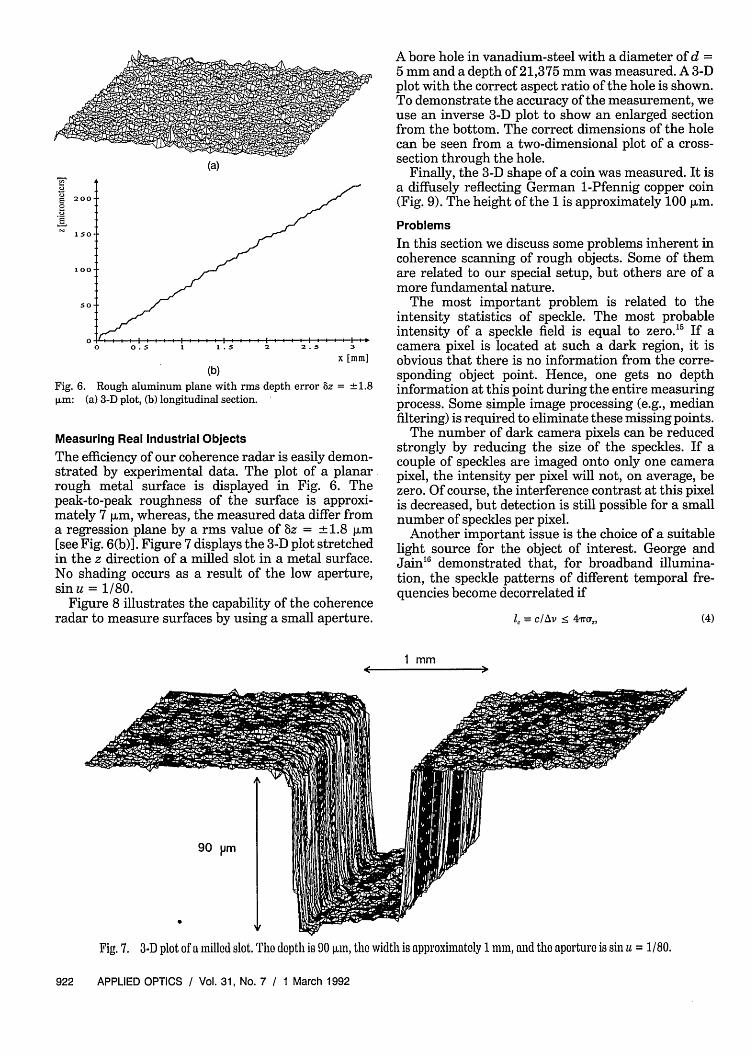
Referring again to Fig. 1, the output intensity I(z)of one certain pixel is considered while the object ismoved along the z axis. A typical correlogram, or theautocorrelation of the light-wave trains, I(z), is shownin Fig. 3. The Fourier transform of I(z) is the powerspectrum S(v) of the light source, whereby v is thetemporal frequency. For pixel P0 in Fig. 1, the correlo-gram I, (z) is centered at z = 0. For a different pixel,P1, located at z = z, the correlogram is shifted by thedistance z,: I, (z) = Io (z - z). For the determinationof the depth z, we must find the maximum of theenvelope of the correlogram.
To achieve small depth uncertainty, z, one findsthat a short coherence length of the light source isadvantageous. With available sources, the coherencelength 1,, and, hence, the adaptation of the sensor todifferent object sizes, can be scaled within a range of 2,um up to several kilometers: stabilized laser, > 10m; laser diode, 50 ,um-10 mm; superluminescentdiode/light-emitting diode (LED), l, 5 m-30 ,um;and white light, l, 2-3 ,um.
How accurately should the location of the correlo-gram be determined? To answer this question, wemust examine Fig. 4. Figure 4 displays the correlo-grams I(z, x) for many pixels located at the lateralposition x. The object in this case (finely groundaluminum) is planar, but rough.
Within the area Ax of one speckle, the correlogramsI(z, x) and I(z, x + Ax) have nearly the same location.The locations of the correlograms of different speck-les vary statistically. The rms uncertainty z of thedepth location is 2 ,um in Fig. 4, which correspondsapproximately to the observed roughness.
1000.
A
Fig. 2. Picture of the interferometer output: a rough object witha superimposed reference wave. The object is a tilted plane ofvanadium steel. Interference occurs only where the object planeintersects the virtual reference plane R'.
800
600-
400
200
0
iii''.
-10 -S 0 5 10 15
-i o -s. o s 10-- 1
z [micrometers]
Fig. 3. Measured correlograml(z): the output of the interferom-eter is measured while the considered object is moved along the zaxis.
920 APPLIED OPTICS / Vol. 31, No. 7 / 1 March 1992
N
........
.... ....
.. .. . . ......ill ll l
II
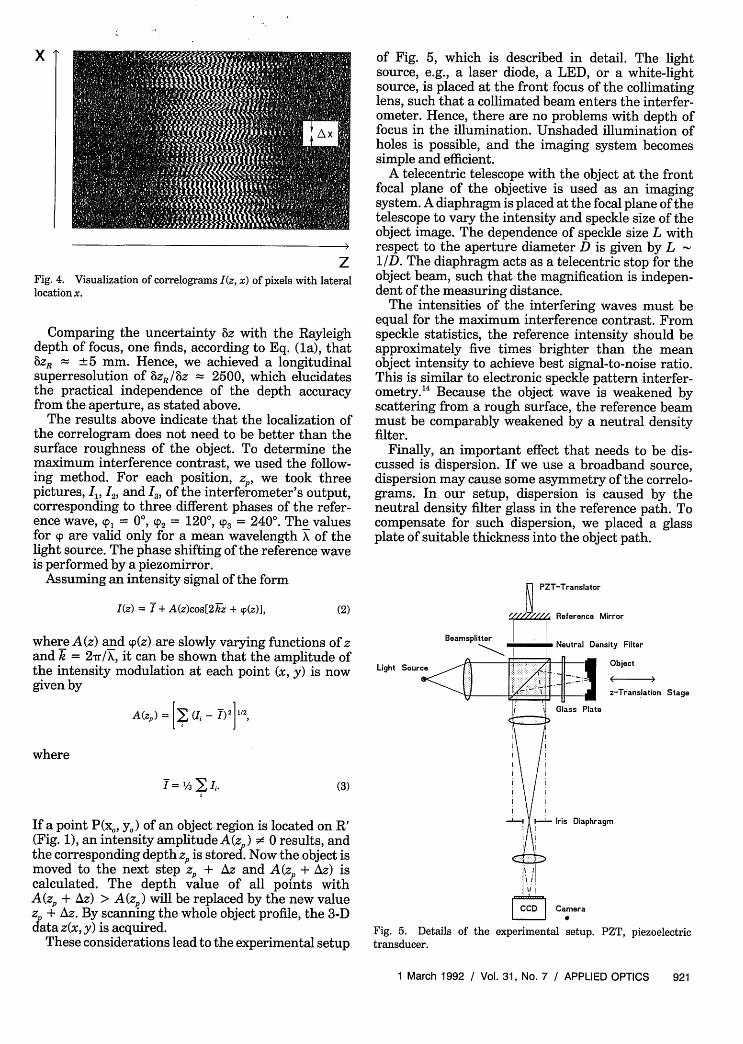
Fig. 4. Visualization of correlograms I(z, x) of pixels with laterallocation x.
Comparing the uncertainty z with the Rayleighdepth of focus, one finds, according to Eq. (la), that8ZR 5 mm. Hence, we achieved a longitudinalsuperresolution of ZR/8z 2500, which elucidatesthe practical independence of the depth accuracyfrom the aperture, as stated above.
The results above indicate that the localization ofthe correlogram does not need to be better than thesurface roughness of the object. To determine themaximum interference contrast, we used the follow-ing method. For each position, z, we took threepictures, I I2, and I3, of the interferometer's output,corresponding to three different phases of the refer-ence wave, p, = 00, (p = 1200, 9 = 2400. The valuesfor (p are valid only for a mean wavelength A of thelight source. The phase shifting of the reference waveis performed by a piezomirror.
Assuming an intensity signal of the form
I(z) = I + A(z)cos[2kz + p(z)], (2)
where A(z) and (p(z) are slowly varying functions of zand k = 2r/X, it can be shown that the amplitude ofthe intensity modulation at each point (x, y) is nowgiven by
A(z5) = (Ii-I)2]1/2
of Fig. 5, which is described in detail. The lightsource, e.g., a laser diode, a LED, or a white-lightsource, is placed at the front focus of the collimatinglens, such that a collimated beam enters the interfer-ometer. Hence, there are no problems with depth offocus in the illumination. Unshaded illumination ofholes is possible, and the imaging system becomessimple and efficient.
A telecentric telescope with the object at the frontfocal plane of the objective is used as an imagingsystem. A diaphragm is placed at the focal plane of thetelescope to vary the intensity and speckle size of theobject image. The dependence of speckle size L withrespect to the aperture diameter D is given by L 1ID. The diaphragm acts as a telecentric stop for theobject beam, such that the magnification is indepen-dent of the measuring distance.
The intensities of the interfering waves must beequal for the maximum interference contrast. Fromspeckle statistics, the reference intensity should beapproximately five times brighter than the meanobject intensity to achieve best signal-to-noise ratio.This is similar to electronic speckle pattern interfer-ometry. 4 Because the object wave is weakened byscattering from a rough surface, the reference beammust be comparably weakened by a neutral densityfilter.
Finally, an important effect that needs to be dis-cussed is dispersion. If we use a broadband source,dispersion may cause some asymmetry of the correlo-grams. In our setup, dispersion is caused by theneutral density filter glass in the reference path. Tocompensate for such dispersion, we placed a glassplate of suitable thickness into the object path.
PZT-Translator
Z( Reference Mirror
Beamsplitter
Light Source
where
7 = /3 E Ii-
Neutral Density Filter
p I Object
z-Transation Stage
Glass Plate
(3)
If a point P(x,, y) of an object region is located on R'(Fig. 1), an intensity amplitude A(z ) 0 results, andthe corresponding depth z is stored. Now the object ismoved to the next step z + Az and A(zp + Az) iscalculated. The depth value of all points withA(zp + Az) > A(zp) will be replaced by the new valuez + Az. By scanning the whole object profile, the 3-Ddata z(x, y) is acquired.
These considerations lead to the experimental setup
Iris Diaphragm
|2~J CD|Camera
Fig. 5. Details of the experimental setup. PZT, piezoelectrictransducer.
1 March 1992 / Vol. 31, No. 7 / APPLIED OPTICS 921
(a)
7
5 2000To
.E
150-
100-
50
0 0.5 I I 5S 2 2.5 3
x [mm](b)
Fig. 6. Rough aluminum plane with rms depth error z = +1.8pAm: (a) 3-D plot, (b) longitudinal section.
Measuring Real Industrial Objects
The efficiency of our coherence radar is easily demon-strated by experimental data. The plot of a planarrough metal surface is displayed in Fig. 6. Thepeak-to-peak roughness of the surface is approxi-mately 7 plm, whereas, the measured data differ froma regression plane by a rms value of 8z = 1.8 [um[see Fig. 6(b)]. Figure 7 displays the 3-D plot stretchedin the z direction of a milled slot in a metal surface.No shading occurs as a result of the low aperture,sinu = 1/80.
Figure 8 illustrates the capability of the coherenceradar to measure surfaces by using a small aperture.
A bore hole in vanadium-steel with a diameter of d =5 mm and a depth of 21,375 mm was measured. A 3-Dplot with the correct aspect ratio of the hole is shown.To demonstrate the accuracy of the measurement, weuse an inverse 3-D plot to show an enlarged sectionfrom the bottom. The correct dimensions of the holecan be seen from a two-dimensional plot of a cross-section through the hole.
Finally, the 3-D shape of a coin was measured. It isa diffusely reflecting German 1-Pfennig copper coin(Fig. 9). The height of the 1 is approximately 100 Vtm.
Problems
In this section we discuss some problems inherent incoherence scanning of rough objects. Some of themare related to our special setup, but others are of amore fundamental nature.
The most important problem is related to theintensity statistics of speckle. The most probableintensity of a speckle field is equal to zero. 5 If acamera pixel is located at such a dark region, it isobvious that there is no information from the corre-sponding object point. Hence, one gets no depthinformation at this point during the entire measuringprocess. Some simple image processing (e.g., medianfiltering) is required to eliminate these missing points.
The number of dark camera pixels can be reducedstrongly by reducing the size of the speckles. If acouple of speckles are imaged onto only one camerapixel, the intensity per pixel will not, on average, bezero. Of course, the interference contrast at this pixelis decreased, but detection is still possible for a smallnumber of speckles per pixel.
Another important issue is the choice of a suitablelight source for the object of interest. George andJain demonstrated that, for broadband illumina-tion, the speckle patterns of different temporal fre-quencies become decorrelated if
4 ac/v 4rrg2, (4)
mm
90 pm
Fig. 7. 3D plot of a milled slot. The depth is 90 .Lm, the width is approximately 1 mm, and the aperture is sin u = 1/80.
922 APPLIED OPTICS / Vol. 31, No. 7 / 1 March 1992
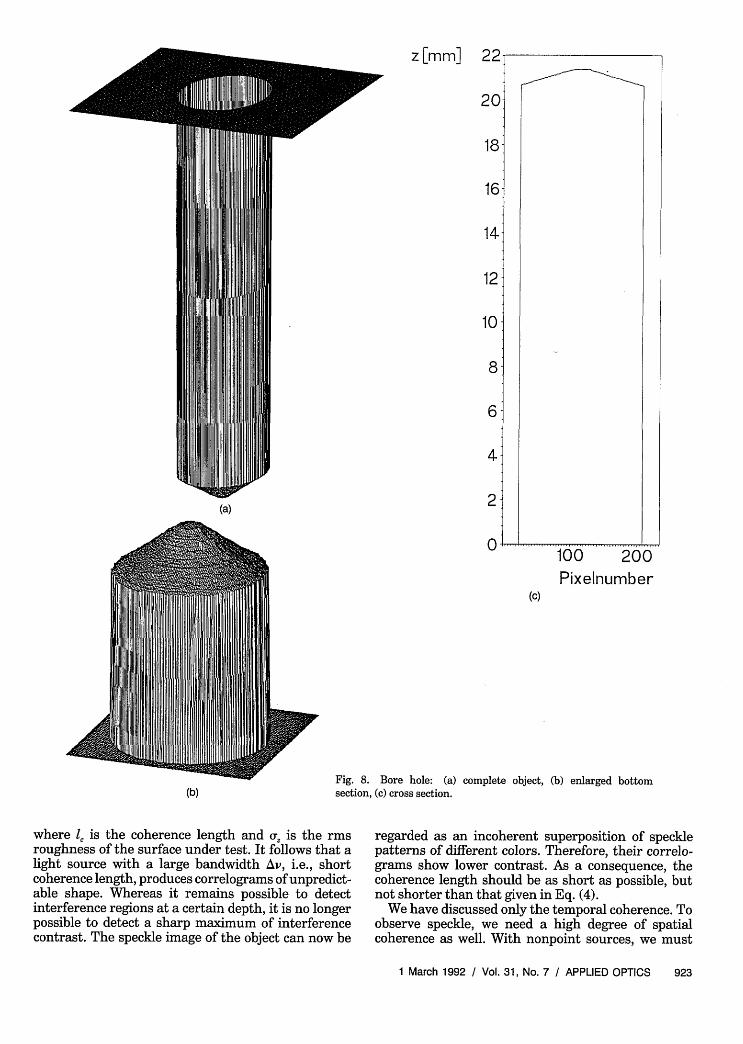
z [mm] 22
.... .... .... ......................100 200Pixelnumber
(c)
(b)Fig. 8. Bore hole: (a)section, (c) cross section.
where l is the coherence length and q,2 is the rmsroughness of the surface under test. It follows that alight source with a large bandwidth Av, i.e., shortcoherence length, produces correlograms of unpredict-able shape. Whereas it remains possible to detectinterference regions at a certain depth, it is no longerpossible to detect a sharp maximum of interferencecontrast. The speckle image of the object can now be
complete object, (b) enlarged bottom
regarded as an incoherent superposition of specklepatterns of different colors. Therefore, their correlo-grams show lower contrast. As a consequence, thecoherence length should be as short as possible, butnot shorter than that given in Eq. (4).
We have discussed only the temporal coherence. Toobserve speckle, we need a high degree of spatialcoherence as well. With nonpoint sources, we must
1 March 1992 / Vol. 31, No. 7 / APPLIED OPTICS 923
20
18
16
14
12
10
8
6
4
2
0
(a)
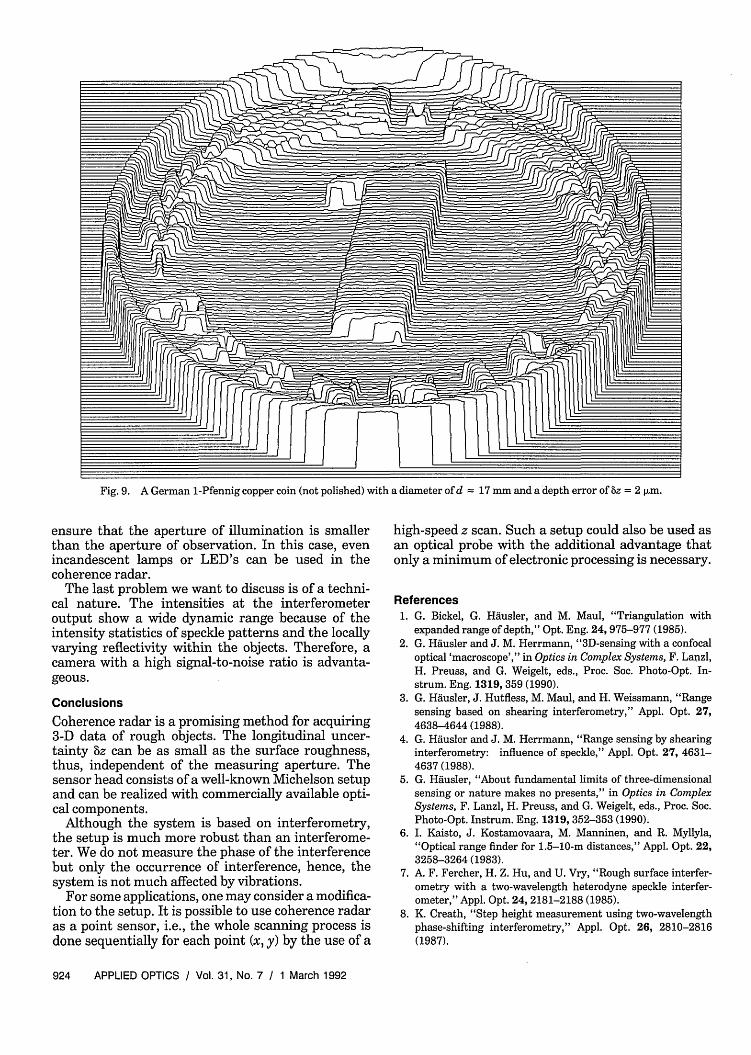
Fig. 9. A German 1-Pfennig copper coin (not polished) with a diameter of d 17 mm and a depth error of 8z = 2 pum.
ensure that the aperture of illumination is smallerthan the aperture of observation. In this case, evenincandescent lamps or LED's can be used in thecoherence radar.
The last problem we want to discuss is of a techni-cal nature. The intensities at the interferometeroutput show a wide dynamic range because of theintensity statistics of speckle patterns and the locallyvarying reflectivity within the objects. Therefore, acamera with a high signal-to-noise ratio is advanta-geous.
Conclusions
Coherence radar is a promising method for acquiring3-D data of rough objects. The longitudinal uncer-tainty z can be as small as the surface roughness,thus, independent of the measuring aperture. Thesensor head consists of a well-known Michelson setupand can be realized with commercially available opti-cal components.
Although the system is based on interferometry,the setup is much more robust than an interferome-ter. We do not measure the phase of the interferencebut only the occurrence of interference, hence, thesystem is not much affected by vibrations.
For some applications, one may consider a modifica-tion to the setup. It is possible to use coherence radaras a point sensor, i.e., the whole scanning process isdone sequentially for each point (x, y) by the use of a
high-speed z scan. Such a setup could also be used asan optical probe with the additional advantage thatonly a minimum of electronic processing is necessary.
References1. G. Bickel, G. Hausler, and M. Maul, "Triangulation with
expanded range of depth," Opt. Eng. 24, 975-977 (1985).2. G. Hiusler and J. M. Herrmann, "3D-sensing with a confocal
optical 'macroscope'," in Optics in Complex Systems, F. Lanzl,H. Preuss, and G. Weigelt, eds., Proc. Soc. Photo-Opt. In-strum. Eng. 1319, 359 (1990).
3. G. Hausler, J. Hutfless, M. Maul, and H. Weissmann, "Rangesensing based on shearing interferometry," Appl. Opt. 27,4638-4644 (1988).
4. G. Hdusler and J. M. Herrmann, "Range sensing by shearinginterferometry: influence of speckle," Appl. Opt. 27, 4631-4637 (1988).
5. G. Hdusler, "About fundamental limits of three-dimensionalsensing or nature makes no presents," in Optics in ComplexSystems, F. Lanzl, H. Preuss, and G. Weigelt, eds., Proc. Soc.Photo-Opt. Instrum. Eng. 1319, 352-353 (1990).
6. I. Kaisto, J. Kostamovaara, M. Manninen, and R. Myllyla,"Optical range finder for 1.5-10-m distances," Appl. Opt. 22,3258-3264 (1983).
7. A. F. Fercher, H. Z. Hu, and U. Vry, "Rough surface interfer-ometry with a two-wavelength heterodyne speckle interfer-ometer," Appl. Opt. 24, 2181-2188 (1985).
8. K. Creath, "Step height measurement using two-wavelengthphase-shifting interferometry," Appl. Opt. 26, 2810-2816(1987).
924 APPLIED OPTICS / Vol. 31, No. 7 / 1 March 1992
9. Y. Y. Cheng and J. C. Wyant, "Multiple-wavelength phase-shifting interferometry," Appl. Opt. 24, 804-807 (1985).A. A. Michelson, "Determination experimentale de la valeurdu metre en longueurs d'ondes lumineuses," Trav. Mem. Bur.Int. Poids Mes. 11, 1-42 (1895).
11. M. Davidson, K. Kaufman, I. Mazor, and F. Cohen, "Anapplication of interference microscopy to integrated circuitinspection and metrology," in Integrated Circuit Microscopy;Inspection, and Process Control, K. M. Monahan, ed., Proc.Soc. Photo-Opt. Instrum. Eng. 775,233-247 (1987).
12. B. S. Lee and T. C. Strand, "Profilometry with a coherencescanning microscope," Appl. Opt. 29,3784-3788 (1990).
13. G. S. Kino and S. S. C. Chim, "Mirau correlation microscope,"Appl. Opt. 29, 3775-3783 (1990).
14. R. E. Jones and C. Wykes, Holographic and Speckle Interferom-etry (Cambridge U. Press, London, 1983).
15. J. W. Goodman, "Statistical properties of laser specklepatterns," in Laser Speckle and Related Phenomena, J. C.Dainty, ed. (Springer-Verlag, Berlin, 1984), pp. 9-75.
16. N. George and A. Jain, "Speckle reduction using multipletones of illumination," Appl. Opt. 12, 1202-1212 (1973).
1 March 1992 / Vol. 31, No. 7 / APPLIED OPTICS 925
10.


![deis oracle cloud 2010 [Read-Only]...•Consolidate to WebLogic Server (or Tuxedo for C/C++/COBOL) •Use scripting to automate scaling Coherence Coherence Coherence Coherence JRockit](https://img.pdfslide.us/doc/110x75/60424d9ef7a72d35481332d7/deis-oracle-cloud-2010-read-only-aconsolidate-to-weblogic-server-or-tuxedo.jpg)