Embed Size (px)
Citation preview

1
Supporting Information for:
Three-Dimensional Growth of Li2S in Lithium–Sulfur Batteries Promoted by a Redox Mediator
Laura C. H. Gerber,† Peter D. Frischmann,† Frank Y. Fan,‡ Sean E. Doris,†,|| Xiaohui Qu,§
Angelique M. Scheuermann,†,|| Kristin A. Persson,§,¶ Yet-Ming Chiang,‡ and Brett A. Helms*,†
† The Molecular Foundry, Lawrence Berkeley National Laboratory, One Cyclotron Road,
Berkeley, CA 94720, USA
‡ Department of Materials Science and Engineering, Massachusetts Institute of Technology, Cambridge, MA 02139, USA
§ Computational Research Division, Lawrence Berkeley National Laboratory, One Cyclotron
Road, Berkeley, CA 94720, USA
|| Department of Chemistry and ¶Department of Materials Science and Engineering, University of
California, Berkeley, California, 94720, USA
Correspondence addressed to: [email protected]
Table of Contents
1 General Information 2
2 Computational Details 3
3 Synthetic Procedures and Characterization 5
4 Electrochemistry 7
5 Li–S Cell Testing 8
6 Scanning Electron Microscopy of Li2S at Various States of Charge 11
7 Potentiostatic Electrodeposition Experiments 17
8 NMR Spectra 19
9 References 21
2
General Information
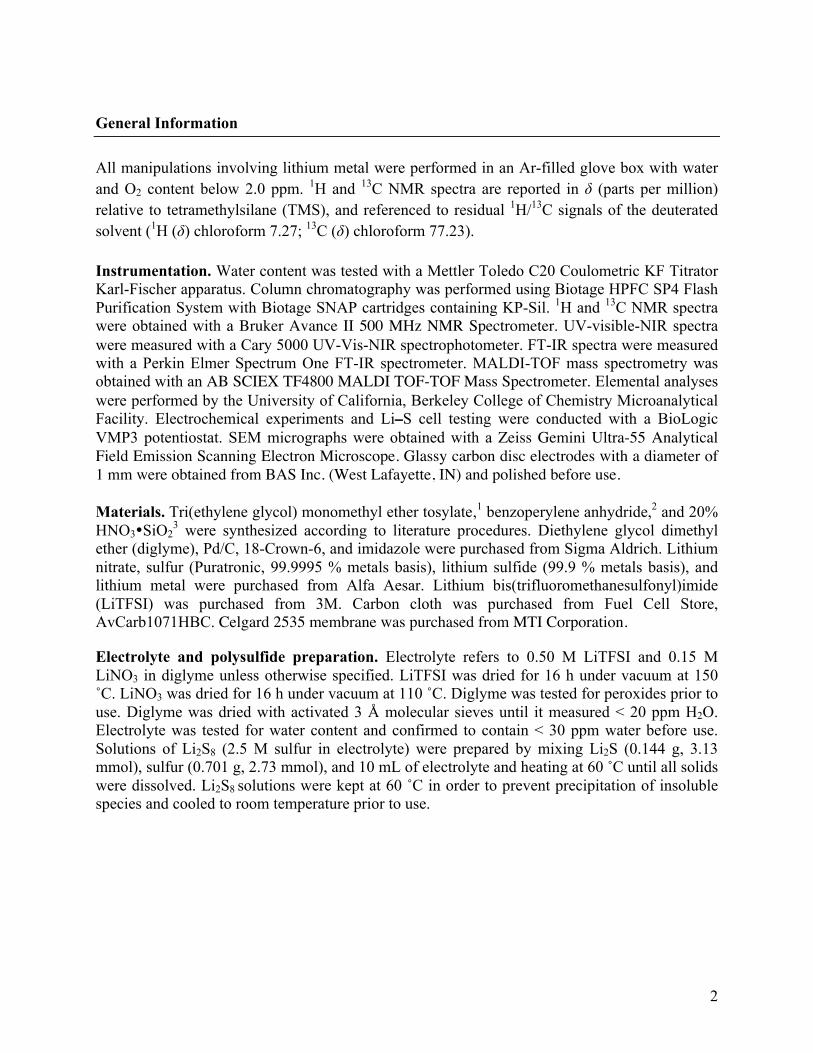
All manipulations involving lithium metal were performed in an Ar-filled glove box with water and O2 content below 2.0 ppm. 1H and 13C NMR spectra are reported in δ (parts per million) relative to tetramethylsilane (TMS), and referenced to residual 1H/13C signals of the deuterated solvent (1H (δ) chloroform 7.27; 13C (δ) chloroform 77.23).
Instrumentation. Water content was tested with a Mettler Toledo C20 Coulometric KF Titrator Karl-Fischer apparatus. Column chromatography was performed using Biotage HPFC SP4 Flash Purification System with Biotage SNAP cartridges containing KP-Sil. 1H and 13C NMR spectra were obtained with a Bruker Avance II 500 MHz NMR Spectrometer. UV-visible-NIR spectra were measured with a Cary 5000 UV-Vis-NIR spectrophotometer. FT-IR spectra were measured with a Perkin Elmer Spectrum One FT-IR spectrometer. MALDI-TOF mass spectrometry was obtained with an AB SCIEX TF4800 MALDI TOF-TOF Mass Spectrometer. Elemental analyses were performed by the University of California, Berkeley College of Chemistry Microanalytical Facility. Electrochemical experiments and Li–S cell testing were conducted with a BioLogic VMP3 potentiostat. SEM micrographs were obtained with a Zeiss Gemini Ultra-55 Analytical Field Emission Scanning Electron Microscope. Glassy carbon disc electrodes with a diameter of 1 mm were obtained from BAS Inc. (West Lafayette, IN) and polished before use.
Materials. Tri(ethylene glycol) monomethyl ether tosylate,1 benzoperylene anhydride,2 and 20% HNO3�SiO2
3 were synthesized according to literature procedures. Diethylene glycol dimethyl ether (diglyme), Pd/C, 18-Crown-6, and imidazole were purchased from Sigma Aldrich. Lithium nitrate, sulfur (Puratronic, 99.9995 % metals basis), lithium sulfide (99.9 % metals basis), and lithium metal were purchased from Alfa Aesar. Lithium bis(trifluoromethanesulfonyl)imide (LiTFSI) was purchased from 3M. Carbon cloth was purchased from Fuel Cell Store, AvCarb1071HBC. Celgard 2535 membrane was purchased from MTI Corporation.
Electrolyte and polysulfide preparation. Electrolyte refers to 0.50 M LiTFSI and 0.15 M LiNO3 in diglyme unless otherwise specified. LiTFSI was dried for 16 h under vacuum at 150 C. LiNO3 was . Diglyme was tested for peroxides prior to
use. Diglyme was dried with activated 3 Å molecular sieves until it measured < 20 ppm H2O. Electrolyte was tested for water content and confirmed to contain < 30 ppm water before use. Solutions of Li2S8 (2.5 M sulfur in electrolyte) were prepared by mixing Li2S (0.144 g, 3.13 mmol), sulfur (0.701 g, 2.73 mmol), and 10 were dissolved. Li2S8 species and cooled to room temperature prior to use.

3
Computational Details Density Functional Theory (DFT) calculations were employed to predict the electron affinities (Eea) to screen candidates for experimental validation. Eea is correlated to reduction limit of the electrochemical stability window. Eea is calculated by the energy difference between the neutral and anion state of the molecule. The choice of computational method is a balance between accuracy and computational cost. The relatively low cost PBE functional4 is used to optimize the structure, while the more accurate M11 hybrid functional5 is used for accurate energy calculations. Grimme’s dispersion correction is included for PBE to capture the missing dispersion interaction, which can be partially accounted for by the HF exchange in M11. All the structures at different charge states are fully relaxed at the PBE/6-31+G* level, while all the single point energies are evaluated at the M11/6-31+G* level. The IEF-PCM dielectric continuum model is employed to capture the solvent effect in a qualitative way, and a dielectric constant of 9 was applied. All the DFT calculations have been carried out using quantum chemistry package QChem 4.6 The job monitoring, error fixing and data parsing are automated by a workflow infrastructure developed by the Electrolyte Genome project.7,8

4
Figure S1. Structures for which the Eea was calculated. The calculated Eea values are shown for both the bare anion and where the anion is stabilized by a Li+ counter ion.
NO O NO O
NO O
N
O
O
NO O
NO O
NO O
N
O
O
NO O
NO O
N
O
O
NO O
NO O
N
O
O
N
O
O
NO O
N
O
O
N
O
O
N
O
O
N
O
O
NO O
N
O
O
NO O
NO O
NO O
per1.07 (No Li)
NO O
N
O
O
PMI1.97 (No Li)
2.12 (Li)
NO O
NN
O
O
O
O
NO O
N
O
O
N
O
O
N
N
O
O
O
O
N
O
O
N
N
O
O
O
O
PBI2.49 (No Li)
2.54 (Li)
BP0.78 (No Li)
BPI11.75 (No Li)
1.99 (Li)
BPI21.74 (No Li)
2.22 (Li)BPDI1
1.96 (No Li) 2.08 (Li)
BPDI22.23 (No Li)
2.63 (Li)
BPTI22.11 (No Li)
2.64 (Li)
BPTI12.40 (No Li)
2.86 (Li)
Cor0.50 (No Li)
CI11.58 (No Li)
1.84 (Li)
CDI21.97 (No Li)
1.93 (Li)
CDI31.77 (No Li)
2.28 (Li)
CDI11.82 (No Li)
2.18 (Li)
CTI42.03 (No Li)
2.30 (Li)
CTI31.94 (No Li)
1.96 (Li)CTI5
1.93 (No Li) 2.33 (Li)
CTI12.19 (No Li)
2.64 (Li)
CTI22.29 (No Li)
2.48 (Li)

5
Synthetic Procedures and Characterization
Scheme S1. Chemical synthesis of BPI Synthesis of 1 Catechol (7.96 g, 72 mmol), tri(ethylene glycol) monomethyl ether tosylate (46 g, 144 mmol), K2CO3 (33 g, 239 mmol), 18-Crown-6 (3.75 g, 14 mmol), and acetone (200 mL) were added to an oven-dried 500 mL 3-necked flask. The reaction mixture was sparged with N2 for 30 m, fitted with a reflux condenser, and refluxed (75 °C) for 16 h. The solvent was removed under reduced pressure. Dichloromethane was added, and the solution was washed with 50 mL saturated NaHCO3, 2 x 50 mL H2O, dried over MgSO4, and filtered. The volatiles were removed in vacuo to isolate 1 as a colorless oil (26.71 g, 92%). Spectra are consistent with those previously published.9
Synthesis of 2 Compound 1 (8.4 g, 20.87 mmol) and dichloromethane (50 mL) were added to a 150 mL round bottom flask. After 1 dissolved, 20% HNO3�SiO2 (16.95 g of HNO3�SiO2, 53.8 mmol HNO3) was added, and the suspension was stirred for 5 min. The suspension was filtered through a pad of Celite on a fritted filter, and solvent was then removed from the filtrate under reduced pressure. The mixture was purified by column chromatography with DCM/MeOH as the eluent (SiO2, 0–8% MeOH). Column fractions containing pure and impure product were combined and solvent was removed under reduced pressure. The resulting mixture was purified again by
N
O
O
O
O O
O
O OO
O
OH
OH+ 2 O
OO
OS
O O 18-Crown-6K2CO3 O
O O
O
O OO
O
SiO2 HNO3O
O O
O
O OO
O
O2N
Pd/CH2
O
O O
O
O OO
O
H2N
O
O
O
imidazole155 C, 16 h
1
2 3
BPI
DCMRT, 5 min
acetone75 C, 16 h
EtOHRT, 24 h

6
column chromatography with 50:50 DCM:EtOAc as eluent to yield 2 as a dark orange oil (5.06 g, 54%). Characterization of 2 1H NMR (CDCl3) δ 7.84 (dd, 1H, JHH = 9, 3 Hz, ArH), 7.76 (d, 1H, JHH = 3 Hz, ArH), 6.92 (d, 1H, JHH = 9 Hz, ArH), 4.22 (m, 4 H, OCH2), 3.87 (m, 4H, OCH2), 3.71 (m, 4H, OCH2), 3.65 – 3.61 (overlapping m, 8H, OCH2), 3.51 (m, 4H, OCH2), 3.34 (s, 6H, OCH3); 13C{1H} δ 154.5, 148.6, 141.5, 118.1, 112.0, 109.1, 71.99 (2C), 71.02 (2C), 70.76, 70.75, 70.64, 70.62, 69.6, 69.5, 69.2, 69.1, 59.1 (2C); FT-IR (neat) ν (cm–1) 2926, 2875, 1586, 1515, 1455, 1336, 1273, 1233, 1200, 1094, 1047, 1031, 970, 948, 864, 806, 745, 723; UV/vis (CHCl3): λmax/nm (ε/M–1 cm–1): 305 (5954), 338 (7291); Anal Calc’d for C20H33NO10: C, 53.68; H, 7.43; N, 3.13; Found: C, 53.46, H, 7.30; N, 3.19; ESI-MS (MeOH) m/z = 470.20 [M + Na]+ Synthesis of 3 Compound 2 (2.67 g, 5.97 mmol) and ethanol (120 mL) were added to a 250 mL flask. The flask was evacuated and refilled with N2 three times before adding 10% by weight Pd/C (313 mg, 0.294 mmol Pd) as a dispersion in EtOH. The flask was fitted with a 3-way valve connected to a H2-filled balloon. The suspension was evacuated and refilled with H2 three times and then allowed to stir under an H2 atmosphere for 24 h. The reaction mixture was filtered through a glass frit containing a pad of Celite and the filtrate was concentrated under reduced pressure to yield 3 as a brown oil (1.98 g, 80%). Characterization of 3 1H NMR (CDCl3) δ 6.77 (d, 1H, JHH = 9 Hz, ArH), 6.33 (d, 1H, JHH = 3 Hz, ArH), 6.22 (dd, 1H, JHH = 9 Hz, 3 Hz, ArH), 4.12 (t, 2H, JHH = 5 Hz, OCH2), 4.08 (t, 2H, JHH = 5 Hz, OCH2), 3.84 (t, 2H, JHH = 5 Hz, OCH2), 3.79 (t, 2H, JHH = 5 Hz, OCH2), 3.74 – 3.71 (overlapping m, 4H, OCH2), 3.68 – 3.64 (overlapping m, 8 H, OCH2), 3.56 – 3.54 (overlapping m, 4 H, OCH2), 3.38 (s, 6H, OCH3), 2.00 (br s, NH2); 13C{1H} δ 150.4, 142.0, 141.6, 118.4, 107.6, 103.4, 72.0 (2C), 70.9, 70.78 (2C), 70.77, 70.6 (2C), 70.4, 70.1, 69.8, 68.7, 59.14, 59.12; FT-IR (neat) ν (cm–1) 2981, 2923, 2914, 2886, 2871, 2825, 1634, 1614, 1594, 1512, 1470, 1463, 1456, 1447, 1351, 1327, 1295, 1224, 1199, 1185, 1090, 1060,1052, 1043,1027, 986, 940, 890, 848, 844, 800, 759, 751, 710; UV/vis (CHCl3): λmax/nm (ε/L mol–1 cm–1): 298 (7704); Anal Calc’d for C20H35NO8: C, 57.54; H, 8.45, N, 3.35; Found: C, 57.03; H, 8.36; N, 3.33; ESI-MS (MeOH) m/z = 440.20 [M + Na]+ Synthesis of BPI Compound 3 (0.993 g 2.379 mmol), benzoperylene anhydride (0.641 g, 1.840 mmol), imidazole (6.3 g, 92.1 mmol), and a stir bar were added to a 40 mL septum-capped vial. The vial was evacuated and refilled with N2 three times, and stirred at 155 °C for 16 h over which time the orange suspension becomes a brown solution. The vial was removed from heat and 30 mL CHCl3 was added before the imidazole solidified. The solution was washed with 1.0 M HCl (3 x 30 mL), dried over MgSO4, filtered, and concentrated under reduced pressure. The crude product was purified with a SiO2 plug. Perylene (yellow with blue fluorescence) was eluted first with DCM. The orange product, BPI, was eluted with 5% MeOH in DCM. The solvent was removed under reduced pressure to isolate BPI as a dark orange solid (1.159 g, 84%).

7
Characterization of BPI 1H NMR (CDCl3) δ 8.12 (d, 2H, JHH = 8 Hz, ArH), 7.99 (d, 2H, JHH = 8 Hz, ArH), 7.57 (t, 2H, JHH = 8 Hz, ArH), 7.52 (d, 2H, JHH = 8 Hz, ArH), 7.22 – 7.17 (overlapping m, 5H, ArH), 4.35 (t, 4H, JHH = 5 Hz, OCH2), 3.99 (q, 4H, JHH = 5 Hz, OCH2), 3.86 (m, 4H, OCH2), 3.79 (m, 4H, OCH2), 3.74 (m, 4H, OCH2), 3.70 (m, 4H, OCH2), 3.64 (m, 4H, OCH2), 3.58 (m, 4H, OCH2), 3.45 (s, 3H, OCH3), 3.38 (s, 3H, OCH3); 13C{1H} NMR (CDCl3) δ 186.1, 149.4, 148.5, 131.0, 129.2, 128.7, 127.0, 126.9, 125.7, 125.1, 122.7, 122.7, 121.6, 121.5, 121.0, 119.7, 114.9, 113.4, 72.21, 72.16, 71.15, 71.11, 70.98, 70.96, 70.84, 70.78, 70.01, 69.95, 69.4, 69.3, 59.3, 59.2; FT-IR (neat) ν (cm–1) 2980, 2923, 2876,2866, 2833, 2821, 2811, 1760, 1597, 1516, 1485, 1456, 1436, 1403, 1394, 1348, 1326, 1290, 1256, 1227, 1208, 1198, 1143, 1116, 1105, 1099, 1091, 1051, 1040, 1026, 963, 950, 943, 932, 927, 901, 892, 865, 854, 837, 795, 785, 771, 752, 725; UV/vis (CHCl3): λmax/nm (ε/L mol–1 cm–1): 330 (32257), 342 (56880), 368 (18725), 391 (17815), 459 (4881), 485 (6760); Anal Calc’d for C44H43NO10: C, 70.86; H, 5.81, N, 1.88; Found: C, 70.62; H, 6.09; N, 2.09; MS (MALDI-TOF, DCTB) m/z = 784.0837 [M+K]+, 768.1177 [M+Na]+ Electrochemistry The electrochemical cell was configured with a glassy carbon working electrode and lithium metal reference and counter electrodes. Working solutions for cyclic voltammetry (CV) were separated from lithium counter and reference electrodes with a glass frit with an average pore size of ~7 nm and thickness of 5 mm obtained from Advanced Glass and Ceramics (St. James, NC, USA). In order to account for the potential drop across a highly resistive frit, all CV measurements were corrected for iR drop by measuring the impedance between the working and reference electrodes with an applied AC voltage with frequency of 100 kHz and correcting for 85% of the expected iR drop. CVs of polysulfide alone, BPI alone, and BPI with polysulfide were conducted in electrolyte with 2.5 mM BPI and 12 mM sulfur of nominal composition Li2S8 at 1 mV/s.
Figure S2. Cyclic voltammograms of BPI (orange trace, 2.5 mM BPI) and Li2S8 (black trace, 12 mM sulfur) and BPI and Li2S8 (green trace, 12 mM sulfur, 2.5 mM BPI) at 1 mV s–1. The electrolyte is 0.50 M LiTFSI and 0.15 M LiNO3 in diglyme, with a glassy C working electrode and lithium reference and counter electrodes.

8
Li–S Cell Testing Dropcast BPI on C cloth 0.600 mL tetraglyme was added to BPI (19 mg) and the mixture was heated until the
The BPI solution was dropcast evenly across the C cloth. The C cloth was then cooled to ambient temperature and dried under reduced pressure for 3 days. Li–S Cell Assembly with BPI dropcast on C cloth Lithium disks (3/8 inch diameter) were punched from 1.5 mm thick Li foil and soaked in electrolyte for > 1 h. One side of the Li disk was scraped with a spatula to expose a shiny Li surface. The scraped side was pressed onto a nickel or stainless steel electrode, 6 µL electrolyte and a piece of Celgard (1/2 inch diameter) were placed on top. Two pieces of C cloth (with or without BPI) were placed in the well (0.5 mm deep, ¼ inch diameter) of a gold-coated nickel electrode. About 18 µL catholyte (1.0 M sulfur as Li2S8 in electrolyte, d = 1.05 g mL–1) was added to the well with the C cloth (16–22 mg weight of catholyte), the weight was recorded, and the cell assembled. Solubility of BPI Solutions of BPI in electrolyte were prepared with 1, 2, 3, 4, and 5 wt% BPI by heating the
perature. The samples containing 1 and 2 wt% BPI remained free-flowing liquids, while samples with 3–5% BPI became gels (as indicated when the electrolyte no longer flows on short time-scales and is stable to inversion), see Figure S3. When catholyte solutions of 3 wt% BPI with 1.0 M Sulfur (as Li2S8 in electrolyte) are prepared as specified below, the mixture becomes more viscous, but is not a gel as indicated by it not being stable to inversion.
Figure S3. BPI at 1–5 wt% in electrolyte. At 1 and 2 wt% BPI, the mixtures remain free-flowing liquids, while at 3 wt% and above gels form, as shown by being stable to inversion. Li–S Cell Assembly with BPI in solution 8.1 mg BPI and 219 µL electrolyte were added to a vial
2S8 (8.0 M sulfur in
until it was added to the cell. Lithium disks (3/8 inch diameter) were punched from 1.5 mm thick Li foil and soaked in electrolyte for > 1 h. One side of the Li disk was scraped with a spatula to expose a shiny Li surface. The scraped side was pressed onto a nickel or stainless steel electrode,

9
6 µL electrolyte and a piece of Celgard (1/2 inch diameter) were placed on top. Two pieces of C cloth were placed in the well (0.5 mm deep, ¼ inch diameter) of a gold-coated nickel electrode. About 18 µL catholyte was added to the well with the C cloth (16–22 mg weight of catholyte), the weight was recorded, and the cell assembled. Control Li–S Cells without Carbon Cloth Electrochemical cells were assembled as above, but without C cloth.
Figure S4. Li–S cells without C cloth, with and without BPI. Control Li–S Cells without Sulfur In order to test if BPI is contributing to the observed capacities, Li–S cells were prepared with BPI, but no sulfur species. Cells were assembled as above, using C cloth containing BPI, but rather than polysulfide solution, 18 µL of electrolyte was used to fill the well in the electrode. The cells were cycled at similar current densities to cells with polysulfide (the electrolyte was weighed, and a C/8 current density was calculated as if 1.0 M sulfur as Li2S8 in electrolyte had been added). Of three Li–S cells run, the greatest charge observed due to BPI was 3.72 x 10⁻³ mAh. The electrochemical cells with BPI and 1.0 M sulfur average 0.42 mAh. The charging of BPI contributes at maximum 0.9% of the total capacity of the cell.

10
Figure S5. Charge (open) and discharge (filled) capacities for Li–S cells cycling at various rates.
Figure S6. Discharge capacity (solid squares) and Coulombic efficiency (open circles) at C/8 rate over 100 cycles for Li–S cells with and without BPI.
11
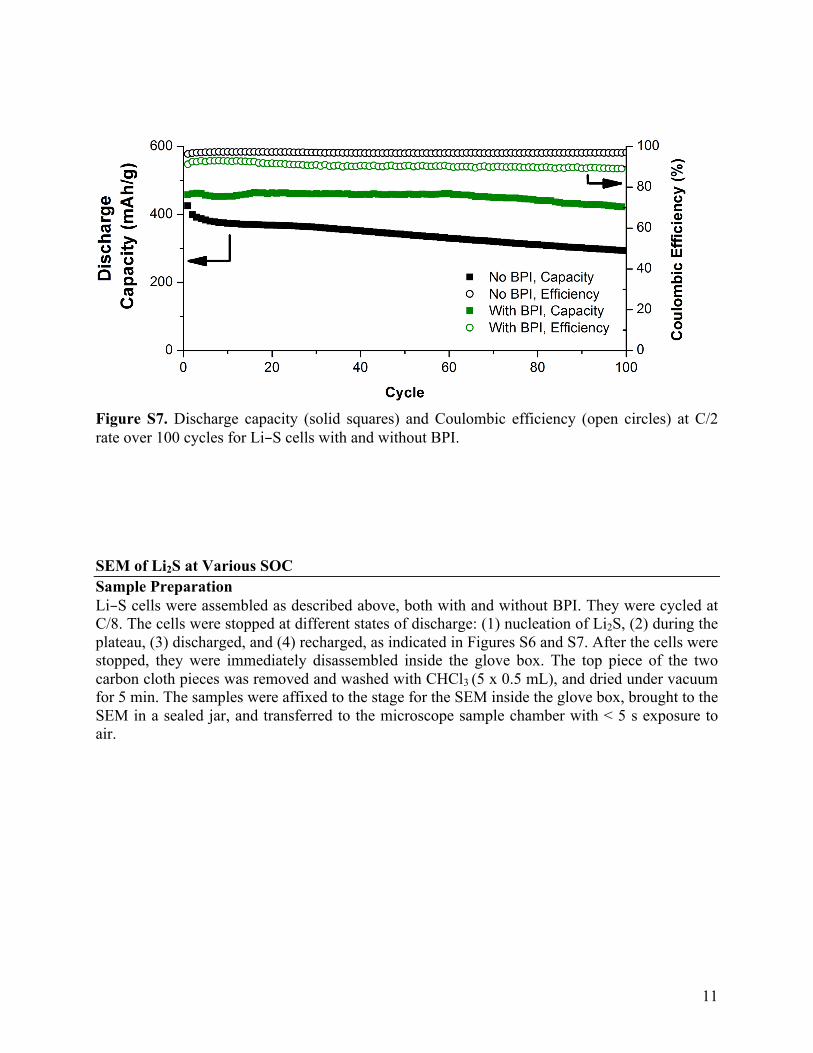
Figure S7. Discharge capacity (solid squares) and Coulombic efficiency (open circles) at C/2 rate over 100 cycles for Li–S cells with and without BPI. SEM of Li2S at Various SOC Sample Preparation Li–S cells were assembled as described above, both with and without BPI. They were cycled at C/8. The cells were stopped at different states of discharge: (1) nucleation of Li2S, (2) during the plateau, (3) discharged, and (4) recharged, as indicated in Figures S6 and S7. After the cells were stopped, they were immediately disassembled inside the glove box. The top piece of the two carbon cloth pieces was removed and washed with CHCl3 (5 x 0.5 mL), and dried under vacuum for 5 min. The samples were affixed to the stage for the SEM inside the glove box, brought to the SEM in a sealed jar, and transferred to the microscope sample chamber with < 5 s exposure to air.

12
Figure S8. Progressive electrodeposition of Li2S on C cloth, imaged at different states-of-charge in Li–S cells with BPI absent (left) and BPI present (right) and presented here at lower magnification than in Figure 3. A) The first discharge/charge cycle at C/8 rate. States-of-charge are indicated as Points 1–4 where separate cells were stopped to image the Li2S deposits on the C cloth. SEM images of Li2S electrodeposition on C cloth from a cell without BPI are shown: B) at nucleation (Point 1); C) during the Li2S voltage plateau (Point 2); D) at the end of discharge (Point 3); and E) after recharge (Point 4). SEM images of Li2S electrodeposition on C cloth from a cell with BPI: F) at nucleation (Point 1); G) during the Li2S voltage plateau (Point 2); H) at the end of discharge (Point 3); and I) after recharge (Point 4). Scale bars = 2 μm.

13
Figure S9. Points at which Li–S cells loaded with BPI were stopped to image the Li2S electrodeposition on C cloth.
Figure S10. Points at which Li–S cells that do not contain BPI were stopped to image the Li2S electrodeposition on C cloth.

14
Morphology of Li2S from dissolved BPI cell Similar porous, 3D morphologies of Li2S are observed on C cloth after discharge when BPI is introduced as dissolved in electrolyte rather than dropcast on C cloth.
Figure S11. Li2S on C cloth after discharge of a cell containing BPI, but introduced as part of the electrolyte. C cloth was removed and washed by the standard procedure. Scale bar = 2 µm.

15
Table S1. EDX spectra Li2S deposited on C cloth at various states of charge. Oxygen is present due to the formation of LiOH upon brief (< 5 s) exposure of the samples to ambient moisture when transferring the samples to the instrument. The number corresponds to the points labeled in Figure 3 and S5.
State of Charge With BPI No BPI Li–S Cell with No Polysulfide – Discharged
Before Cycling
Nucleation (1)
Plateau (2)

16
Discharged (3)
Charged (4)
Images of C Cloth Before Li–S Cell Cycling Two C cloth disks (with or without BPI) were placed in an electrode well. The sulfur catholyte (18 µL, 1.0 M sulfur as Li2S8 in electrolyte) was added and the mixture was allowed to sit for 10 min. The C cloth disks were then removed and washed with the same procedure as described above. Figures S12 and S13 indicate that the washing procedure removes polysulfides, electrolyte, and BPI.
Figure S12. SEM images of C cloth containing BPI after exposure to polysulfides and washed by the standard procedure. Scale bar (left) = 10 µm. Scale bar (right) = 2 µm.

17
Figure S13. SEM images of C cloth with no BPI after exposure to polysulfides and washed by the standard procedure. Scale bar (left) = 10 µm. Scale bar (right) = 2 µm.
Figure S14. SEM images of C cloth from a Li–S cell with BPI, but with no polysulfide, washed with the same procedure used to image Li2S at different states of charge. This indicates that the deposits observed in the presence of Li2S8 are due to sulfur-based species, not electrolyte or BPI. Scale bar (left) = 10 µm. Scale bar (right) = 2 µm. Potentiostatic Electrodeposition Experiments Procedure Cells were initially held at 2.09 V for up to 9h, or until current fell below 6 µA, to minimize the amount of higher-order polysulfides in the solution. The cells were then held at 1.95V or 2.0V to initiate nucleation and growth of Li2S. Model of Electrodeposition In this work, electrodeposition is modeled as being on a planar surface, which we believe is a reasonable assumption considering that deposited layers are thin compared to the diameter of the carbon fibers. Furthermore, in a previous work we have shown that electrodeposition kinetics are limited by surface reaction rate rather than diffusion, and that the deposited insulating sulfide forms a passivating film that progressively reduces the carbon surface area available for deposition, resulting in two-dimensional growth and a thin film-like morphology.10

18
For potentiostatic electrodeposition under these conditions, the current density vs. time relation is of the form:
𝐽𝐽𝐽𝐽 =
𝑡𝑡𝑡𝑡 𝑒𝑒𝑒𝑒𝑒𝑒 −
12
𝑡𝑡𝑡𝑡 − 1
where Jm and tm are respectively the maximum current and the time at which the maximum current occurs.11,12 This equation follows from the Avrami equation, which accounts for the impingement of islands after growth. In particular, the exponential factor represents the probability (from the Poisson distribution) that a given area element of the electrode is untransformed and therefore available for further reaction. The width of the peak can be used to determine the growth rate constant k.
𝑡𝑡 = 2𝜋𝜋𝑁𝑁 𝑘𝑘 / where N0 is the number of nuclei. In the case of electrodeposition of Li2S involving the redox mediator BPI, we model the additional current due to the mediator (which was assumed to be limited by the available surface area of the C cloth) with the term c. We assume that the rate-limiting step is due to BPI. If this were not the case, a horizontal asymptote would be present in the current-time plot. The resulting current due to BPI is c times the available surface area of the electrode. Our modified current-time relation is:
𝐽𝐽𝐽𝐽 =
𝑡𝑡𝑡𝑡 + 𝑐𝑐 𝑒𝑒𝑒𝑒𝑒𝑒 −
12
𝑡𝑡𝑡𝑡 − 1

19
Figure S15. Overlayed experimental data (black) and model fits (red).

20
NMR Spectra
Figure S16. 1H NMR spectrum of 2.

21
Figure S17. 1H NMR spectrum of 3.

22
Figure S18. 1H NMR spectrum of BPI. References (1) Chen, H.; Yang, Y.; Wang, Y.; Wu, L. Chem. Eur. J. 2013, 19, 11051–11061. (2) Clar, E.; Zander, M. J. Chem. Soc. 1957, 4616–4619. (3) Tapia, R.; Torres, G.; Valderrama, J. A. Synth. Commun. 1986, 16, 681–687. (4) Perdew, J. P.; Burke, K.; Ernzerhof, M. Phys. Rev. Lett. 1996, 77, 3865 – 3858. (5) Peverati, R.; Truhlar, D. G. J. Phys. Chem. Lett. 2011, 2, 2810–2817. (6) Shao, Y.; Gan, Z.; Epifanovsky, E.; Gilbert, A. T. B.; Wormit, M.; Kussmann, J.; Lange, A.
W.; Behn, A.; Deng, J.; Feng, X.; et al. Mol. Phys. 2015, 113, 1184–1215. (7) Qu, X.; Jain, A.; Rajput, N. N.; Cheng, L.; Zhang, Y.; Ong, S. P.; Brafman, M.; Maginn, E.;
Curtiss, L. A.; Persson, K. A. Comput. Mater. Sci. 2015, 103, 56–67. (8) Cheng, L.; Assary, R. S.; Qu, X.; Jain, A.; Ong, S. P.; Rajput, N. N.; Persson, K.; Curtiss, L.
A. J. Phys. Chem. Lett. 2015, 6, 283–291.

23
(9) Bhosale, S. V.; Jani, C. H.; Lalander, C. H.; Langford, S. J.; Nerush, I.; Shapter, J.; Villamaina, D.; Vauthey, E. Chem. Commun. 2011, 47, 8226–8228.
(10) Fan, F. Y.; Carter, W. C.; Chiang, Y.-M. Adv. Mater. 2015, 27, 5203–5209. (11) Jafarian, M.; Mahjani, M. G.; Gobal, F.; Danaee, I. J. Electroanal. Chem. 2006, 588, 190–
196. (12) Fleischmann, M.; Thirsk, H. R. In Advances in Electrochemistry and Electrochemical
Engineering, Vol. 3; Delahay, P., Ed.; John Wiley & Sons, 1963; pp 123–210.