Embed Size (px)
Citation preview
THREE-DIMENSIONAL
FLUVIAL-DELTAIC SEQUENCE STRATIGRAPHY
PLIOCENE-RECENT MUDA FORMATION,
BELIDA FIELD, WEST NATUNA BASIN, INDONESIA
A Thesis
by
YAN DARMADI
Submitted to the Office of Graduate Studies of Texas A&M University
in partial fulfillment of the requirements for the degree of
MASTER OF SCIENCE
December 2005
Major Subject: Geophysics
THREE-DIMENSIONAL
FLUVIAL-DELTAIC SEQUENCE STRATIGRAPHY
PLIOCENE-RECENT MUDA FORMATION,
BELIDA FIELD, WEST NATUNA BASIN, INDONESIA
A Thesis
by
YAN DARMADI
Submitted to the Office of Graduate Studies of Texas A&M University
in partial fulfillment of the requirements for the degree of
MASTER OF SCIENCE
Approved by: Chair of Committee, Steven L. Dorobek Committee Members, Brian J. Willis
Daulat D. Mamora Head of Department, Richard L.Carlson
December 2005
Major Subject: Geophysics

iii
ABSTRACT
Three-Dimensional Fluvial-Deltaic Sequence Stratigraphy
Pliocene-Recent Muda Formation, Belida Field, West Natuna Basin, Indonesia.
(December 2005)
Yan Darmadi, B.S, The University of Indonesia
Chair of Advisory Committee: Dr. Steven L. Dorobek
The Pliocene-Recent Muda formation is essentially undeformed in the West
Natuna Basin, and excellent resolution of this interval on three-dimensional seismic data
in Belida Field allows detailed interpretation of component fluvial-deltaic systems.
Detailed interpretation of seismic time slice and seismic sections along with seismic
facies analysis, horizon mapping, and extraction of seismic attributes provide the basis to
construct a sequence stratigraphic framework and determine patterns for sediment
dispersal and accumulation.
The Muda interval contains five third-order sequences, with depositional
environments confined to the shelf and consisting mainly of fluvial elements. Sequence
boundaries (SB) apparently result from major sea level falls, since there was no tectonic
uplift and the field underwent only regional slow subsidence during sedimentation of the
study interval.
Sea level fluctuation also caused changes in fluvial patterns. Analysis of
changing channel patterns indicates that major systems tracts relate to specific channel
patterns. The Lowstand Systems Tract (LST) is generally dominated by larger channel

iv
dimensions and low sinuosity channel patterns. The Transgressive Systems Tract (TST)
typically contains relatively smaller channels with high sinuosity. Channels in the
Highstand Systems Tract (HST) generally show moderate sinuosity channels and are
intermediate in size, larger than TST channels but smaller than LST channels. Crossplots
of stratigraphic position and channel morphology indicate that within the transition from
LST-TST, channel dimensions (width and thickness) generally decrease and channel
sinuosity generally increases.
High sinuosity, meandering and anastomosing channels are generally found near
the maximum flooding surface. Low sinuosity channels occur within the HST-SB-LST
succession, with the exception of higher sinuosity meandering channels evolving inside
valleys. Larger, lower sinuosity channels result from high gradient and high discharge
associated with stream piracy. Smaller, high-sinuosity channels result from low gradient
and small discharge.
Extraction of seismic attributes such as RMS Amplitude and Average Reflection
Strength show these depositional features in greater detail. In the Belida Field area,
lowstand channels were found to comprise the greatest volume of sandstone bodies.
Seismic delineation of the distribution and morphology of these channel systems provides
critical input for reservoir modeling and volumetric analysis.

v
DEDICATION
To Mom and Dad, without whom I would not reach this far
To Lidia, without whom I would not have the faith
To my brothers and sisters, without whom I would not be able to advance
vi
ACKNOWLEDGMENTS
I thank God the Almighty who has given me the ability to finish this thesis, and
also I thank Him for every gift He has endowed me with.
Many thanks go to my advisory committee. I thank Dr. Dorobek for all the clues,
suggestions, and discussions he gave. I thank Dr. Willis for all discussions and
suggestions. I thank Dr. Mamora for being my committee member.
I would not have been able to pursue this degree without the scholarship from the
Educational Consortium of Coordinating Board of Oil and Gas of Indonesia. A special
thank you goes to Chuck Caughey. Chuck has been a friend, a teacher, and a guide before
I came to and while I attended Texas A&M University.
I give my gratitude to the Belida Group of ConocoPhillips Indonesia in Jakarta
who had been very helpful in collecting information I needed. Appreciation goes to Redo
Waworuntu, Sugiharto Danudjaja, Rahadian Adhyaksawan, and Paulus and Fadia Hamid;
also to Dwi for preparing well log data, Pak Nady for preparing seismic tape, and Roald
Brotherton and Vaughn Ball for permission to use the data.
I would not have had the strength to go through this study without the prayers of
my beloved Mom and Dad. Special gratitude goes to my beloved Lidia for her patience
and devotion.
Thanks to my colleagues who have been very helpful to me in discussions. They
are Hesham-el Sobky, Sergio Olave-Hoces, Tayo Magbegbeola and Gabriel Grimaldi.
Thanks also to Steve Tran, the network and Landmark administrator.
Special gratitude goes to all the Indonesian fellows in Bryan and College Station,
during the period of Spring 2004 to Fall 2005. Thanks to Rifky, Ismail, Iwan, Suandy,

vii
Job Roy, Darmawan, Zuher, Asti, Anto, Jaffee, and Triandi. Thanks also to other
Indonesian fellows that are too many to mention here.
I have received support, encouragement, and help from many people that I have
not mentioned. Thanks to all of you, and I hope you will gain success.

viii
TABLE OF CONTENTS
Page
ABSTRACT………………………............................................................................ iii DEDICATION……………………………………………………………………… v ACKNOWLEDGMENTS…………………………………………………………... vi TABLE OF CONTENTS…………………………………………………………… viii LIST OF FIGURES…………………………………………………………………. x CHAPTER I INTRODUCTION…………………………………………………… 1 II GEOLOGIC SETTING AND GENERAL STRATIGRAPHY OF THE STUDY AREA…………………………………………………. 4 West Natuna Basin………………………………………………... 4 Muda Formation: Lithofacies and Stratigraphy…………………... 6 III AVAILABLE DATA AND METHODOLOGIES USED…………... 9 IV OVERVIEW OF FLUVIAL SEQUENCE STRATIGRAPHIC MODELS……...................................................................................... 11 V MUDA SEQUENCE STRATIGRAPHIC FRAMEWORK…………. 18 Allocyclic and Autocyclic Controls on Sequence Stratigraphic Development……………………………………………………... 18 General Description of Muda Stratigraphic Patterns…………….. 20 Description and Interpretation of Muda Depositional Sequences... 20 Pre-Sequence 1………………………………………………. 20

ix
CHAPTER Page Sequence 1…………………………………………………… 24 Sequence 2…………………………………………………… 30 Sequence 3………………………………………………… 35 Sequence 4…………………………………………………... 42 VI DISCUSSION..………………………………………………………. 48 Channel Stacking Patterns…………………………………………. 48 Channel-Thickness Stacking Patterns ………………………. 50 Channel-Width Stacking Patterns…………………………… 53 Channel-Sinuosity Stacking Patterns………………………... 55 Significance of Channel Stacking Patterns………………………... 57 Implications for Reservoir Modeling……………………………… 57 VII CONCLUSIONS…………………………………………………….. 59 REFERENCES CITED…………………………………………………………… 61 APPENDIX A………………………………………………………………………. 70 APPENDIX B………………………………………………………………………. 71 APPENDIX C………………………………………………………………………. 72 VITA………………………………………………………………………………... 73

x
LIST OF FIGURES FIGURE Page
1 Basemap of the study area. White lines indicate the locations of seismic sections shown in the next figures…………………..………………………. 2
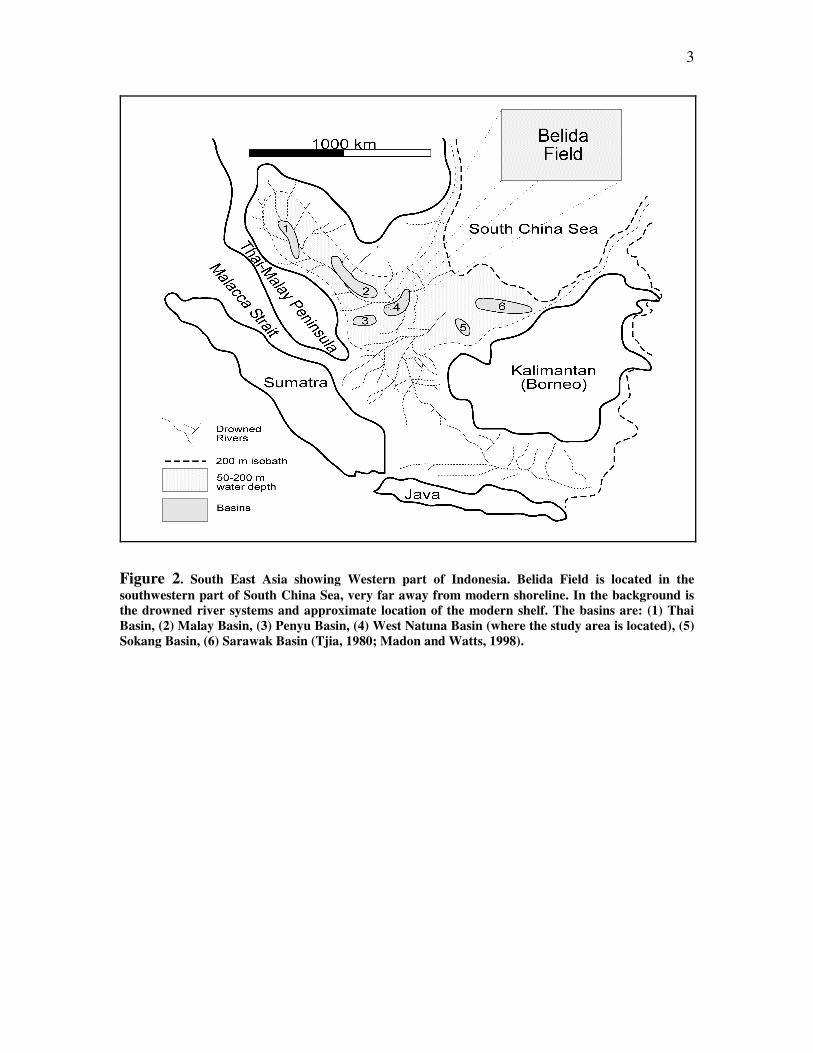
2 South East Asia showing Western part of Indonesia. Belida Field is located
in the southwestern part of South China Sea, very far away from modern shoreline. In the background is the drowned river systems and approximate location of the modern shelf. The basins are: (1) Thai Basin, (2) Malay Basin, (3) Penyu Basin, (4) West Natuna Basin (where the study area is located), (5) Sokang Basin, (6) Sarawak Basin (Tjia, 1980; Madon and Watts, 1998)…………………………………………….…………………... 3
3 West Natuna Basin Standard Chronostratigraphy showing complete
stratigraphic setting in West Natuna Basin. Belida Field does not have all the formation described in the chart. (ConocoPhillips Indonesia internal company report, 2002)……………………………..……………………….. 5
4 Two backstripped subsidence curves from Malay basin. The Malay basin is
located on the left of West Natuna Basin (see location on figure 1). Rifting was starting at approximately 35 Ma. Inset is the beta value (modified from Madon and Watts, 1998)……………………………………………………. 6
5 Belida structure is resulted from inversion of a half-graben. The fault is
inverted, being normal at the bottom and reverse upward. The Muda formation is located above the structure, in the tectonically quiet interval, which is the result of regional slow subsidence…………..………………… 7
6 Chronostratigraphic chart in Muda showing relationship between age,
sequences, sequence boundaries, and nannofossils in the study interval (modified from Morley et al., 2003)………………………..………………. 8
7 A Regional seismic line (the TGS-Nopec SEAS 95 survey) crossing West
Natuna Basin and Kambing-1 well, which is showing very similar structure and stratigraphic style with Belida Field. The maximum flooding surface Base of the study is shown by the green line. Consistency in structure and stratigraphy of regional line make it possible to adapt information from this well to Belida Field. By correlating with the well formation, it is inferred that the MFS Base of the study is approximately formed within the DS sequence of Morley et al., 2003, which is approximately 2.5 – 2.75 Ma……………………………………............................................................ 10

xi
FIGURE Page
8 Two scenarios of Incised and Unincised Lowstand Alluvial Bypass Systems. The upper diagram is the formation of incised valley system on the entire shelf. The lower diagram is the formation of unincised lowstand alluvial bypass system (modified from Posamentier, 2001)……………..…. 13
9 A summary diagram showing changes in fluvial architecture as a function
of base level changes of nonmarine strata (modified from Shanley and McCabe, 1993)…………………………..………………………………….. 15
10 An alternative to alluvial sequence stratigraphic model offered by Wright
and Marriott, showing that alluviation mainly takes place during transgression, not at highstand (modified from Wright and Marriott, 1993) 16
11 A sequence stratigraphic model that was generated from time slices
analysis. The position of the lower sequence boundary is based primarily on the existence of incised valley (modified from Miall, 2002)…..………... 17
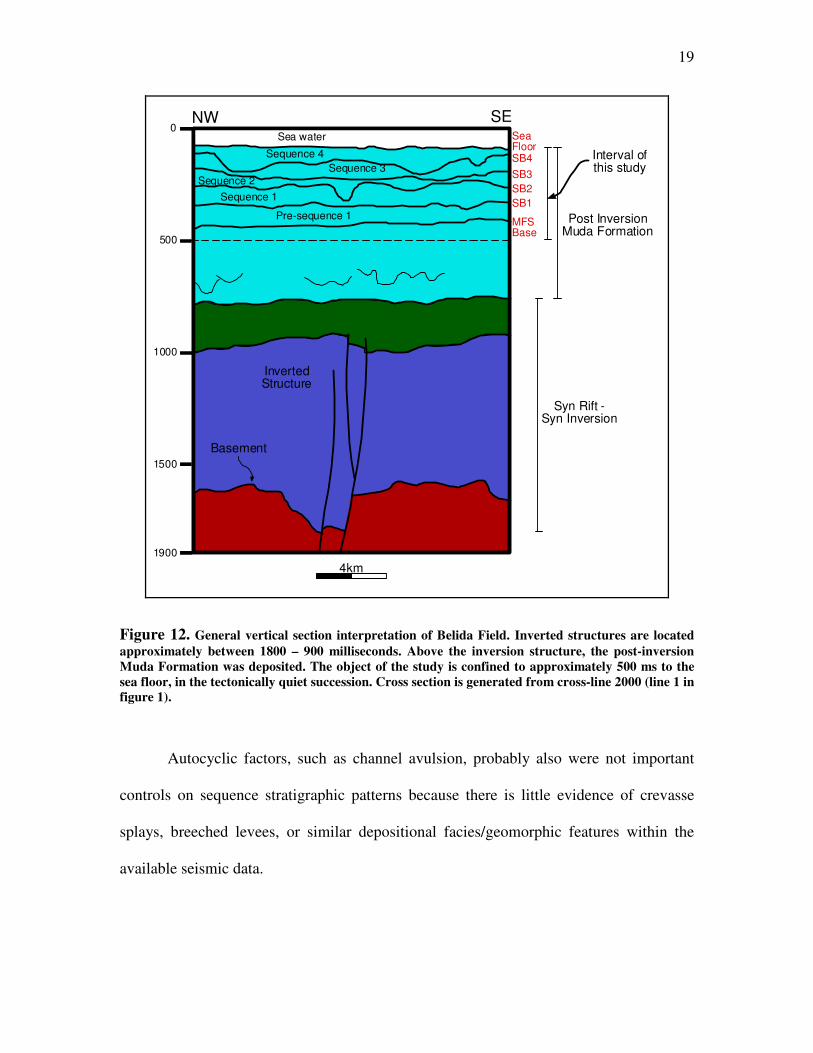
12 General vertical section interpretation of Belida Field. Inverted structures
are located approximately between 1800 – 900 milliseconds. Above the inversion structure, the post-inversion Muda Formation was deposited. The object of the study is confined to approximately 500 ms to the sea floor, in the tectonically quiet succession. Cross section is generated from cross-line 2000 (line 1 in figure 1)………………………………………………..…… 19
13 Seismic facies description of Pre-Sequence 1, mapped from cross-line 1450
(Line 2 in figure 1). Seismic facies 1 represents meandering channel in dip view and its fill, seismic facies 2 represents adjacent floodplain, and seismic facies 3 represents low sinuosity channel and its fill. See text for more discussion………………………………………..……………………. 21
14 A combined interpretation from several time slices to represent Highstand
System Tract of Pre-Sequence 1. After the deposition of marine rich facies maximum flooding surface, meandering channels are deposited, since the slope is still very low. One meandering channel develops very good meander scrolls, while the other does not. Following this, the sea-level rises, rate of accommodation generation is decreasing and late highstand facies formed with appearances of low sinuosity channels, as slope is increasing. Meandering channels respond by decreasing sinuosity and reducing meander scrolls. Channel dimensions are bigger in the late highstand systems tracts. Channels are oriented north to south during TST to early HST, and oriented northeast to southwest during late HST…………………………………………………………………………. 23

xii
FIGURE Page
15 A meandering channel is oriented north to south at 396 ms below the sea floor. Another less meandering channel is flowing on top of it from northwest to southeast, reflecting the response of fluvial systems to decreasing accommodation space in late highstand. The time slice is interpreted to be located in transgressive to late highstand systems tracts of Pre-Sequence 1. Inset picture is location within the time slice……………..
24
16 Seismic facies description in Sequence 1 (Line 3 in figure 1). U / V shaped is indicating fluvial channels in fluvial setting. Meandering channel is imaged in dip direction, suggesting lateral accretion of channel bodies. Facies inside channel is varied from low amplitude, high amplitude, to very high amplitude, depending on the surrounding lithology. Seismic facies 2 represents floodplain with marine influence. Seismic facies 4 represents floodplain……………………………………................................................ 26
17 Three dimensional visualization of sequence boundary 1, which is showing
relief that was formed by major channel erosion. The main erosion is oriented northeast-to-southwest, with smaller erosional features located in the northern part of study area. Note that small tributary channels are not present………………………………………………………………………. 27
18 The lowstand systems tract of sequence 1 is characterized by low sinuosity
channels. The channels are mostly wide. Channels are oriented north to south at the beginning, and then change into northeast to southwest……………………….…………………………………………… 28
19 Channels are increasing their sinuosity as the slope is getting lower, as a
result of base level rise. High sinuosities to meandering channels dominate the depositional channel patterns in transgressive to early highstand of Sequence 1. Channel dimensions vary with time, probably reflecting discharge or sediment supply changes. Channels orientation is changing from northeast to southwest and then northwest to southeast……………… 29
20 Following the sea level rise, slope is decreasing again, low sinuosity
channels dominate. Channels are oriented north to south. A very wide and low-sinuous to straight channel appears at the center of the study area, indicating the base of next sequence boundary……….……………………. 30

xiii
FIGURE Page
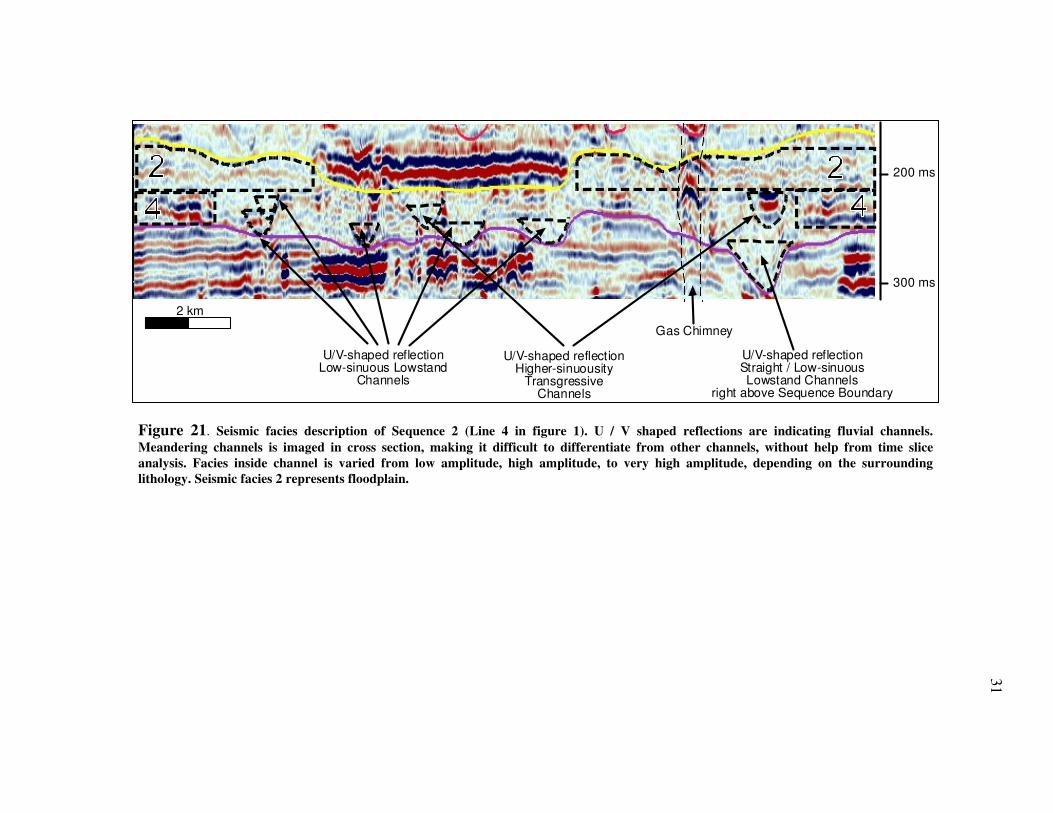
21 Seismic facies description of Sequence 2 (Line 4 in figure 1). U/V shaped reflections are indicating fluvial channels. Meandering channels is imaged in cross section, making it difficult to differentiate from other channels, without help from time slice analysis. Facies inside channel is varied from low amplitude, high amplitude, to very high amplitude, depending on the surrounding lithology. Seismic facies 2 represents floodplain……………… 31
22 Three dimensional visualization of sequence boundary 2, which is showing
relief that was formed by major channel erosion. The main erosion is oriented north-to-south. The main erosional feature is accompanied by several channels erosion. Note that small tributary channels are not present………………………………………………………………………. 32
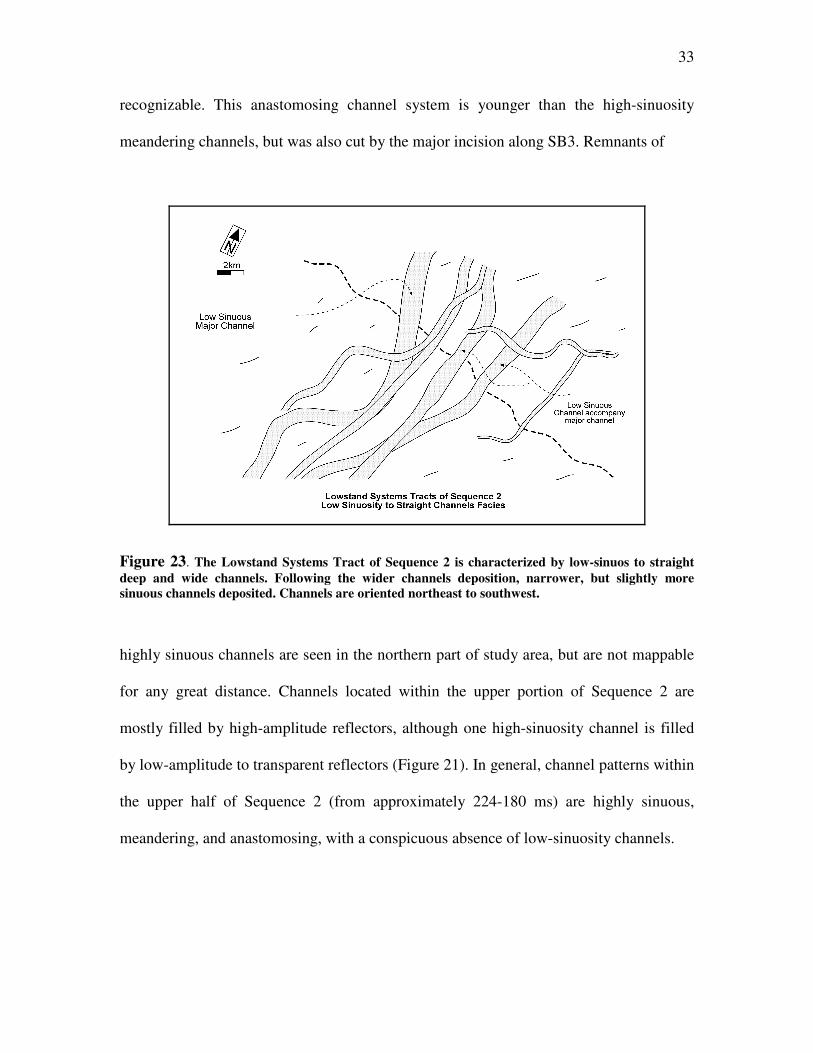
23 The Lowstand Systems Tracts of Sequence 2 is characterized by low-
sinuos to straight deep and wide channels. Following the wider channels deposition, narrower, but slightly more sinuous channels deposited. Channels are oriented northeast to southwest……………………………… 33
24 The transgressive systems tracts of Sequence 2 is characterized by high-
sinuosity and anastomosing channels. Channels are interpreted to flow from west to east. However, the base of incised valley of Sequence 3 appears, indicating that some transgressive facies, and highstand systems tracts of Sequence 2 was eroded by the valley of Sequence 3. Erosion by the valley is also indicated by incomplete complex channel networks in the background. The boundary of the valley erosion is indicated by the limit of eroded channel bodies……………………………………………………… 35
25 Three dimensional visualization of sequence boundary 3, which is showing
relief that was formed by major incised valley system. The main erosion is oriented west-to-east. The incised valley system is eroded by north-south low sinuosity channels. Note that small tributary channels are prominent in the floodplain………………………………………………………….……. 36
26 Seismic facies description of Sequence 3 (Line 5 in figure 1). At the center
of the section, prominent erosion by an incised valley is indicated by sudden facies change. The erosional surface is the upper sequence boundary of Sequence 3. Meandering channels is imaged in cross section, in u-shaped reflection. Indication of meandering is seen in time slice. High sinuosity channels are also imaged in cross-section, by u-shaped reflection. Overall seismic facies in Sequence 3 is lower in amplitude, compare to previous sequences…………………………………………………………. 39

xiv
FIGURE Page
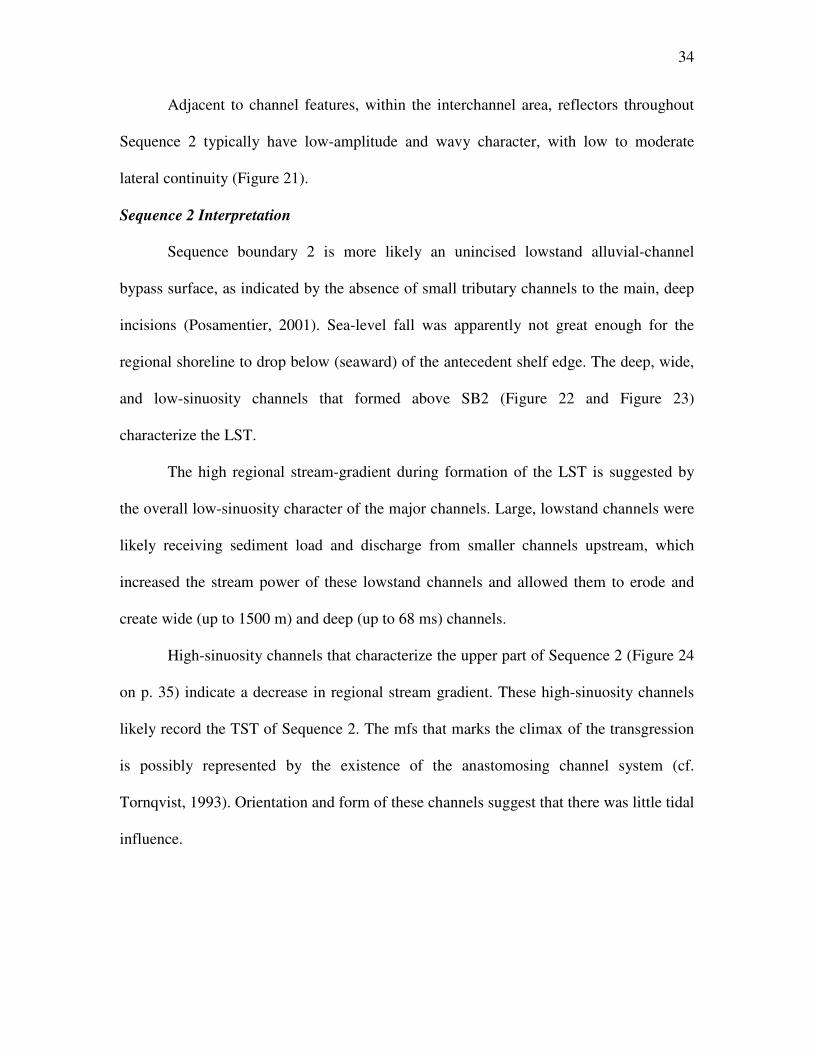
27 Time slice at 178 milliseconds TWT, showing complex stratal deposition and erosion from HST of sequence 2, erosion by SB 3, dendritic drainage pattern of Sequence 3, deposition of meandering channel in TST of Sequence 3, and erosion by SB 4…...……………………………………… 40
28 The incised valley of Sequence 3, which is filled by a meandering channel
is capped and eroded by incised valley of Sequence 4. See text for further details……………..…………………………………………………………
41
29 Three dimensional visualization of sequence boundary 4, which is showing
relief that was formed by major incised valley system. The main erosion is oriented NW-SE. The incised valley system is accompanied by low sinuosity channels. Note that small tributary channels are prominent in the floodplain……………………………………………………………………. 43
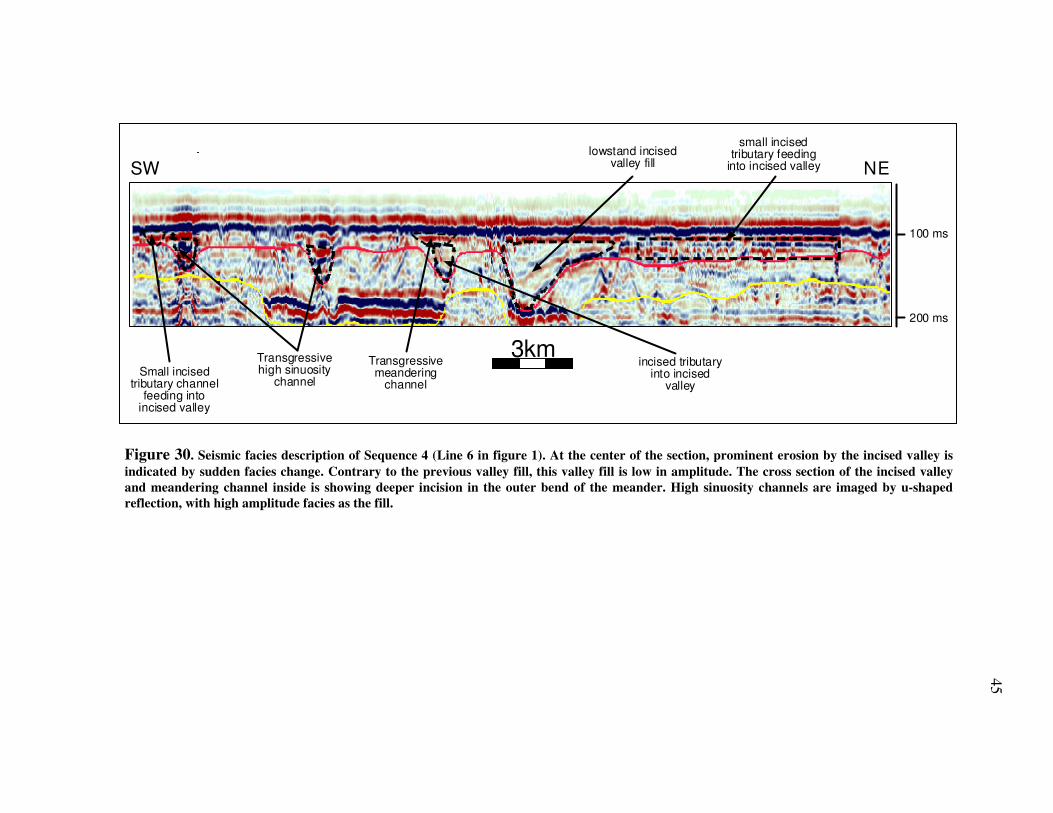
30 Seismic facies description of Sequence 4 (Line 6 in figure 1). At the center
of the section, prominent erosion by the incised valley is indicated by sudden facies change. Contrary to the previous valley fill, this valley fill is low in amplitude. The cross section of the incised valley and meandering channel inside is showing deeper incision in the outer bend of the meander. High sinuosity channels are imaged by u-shaped reflection, with high amplitude facies as the fill……………………………………..……………. 45
31 The incised valley of Sequence 4 is wider in up section, having a v-shaped
dimension. The valley has a chute channel. Complex tributaries developed in the floodplain. See text for further details of sequence description……... 46
32 Time slice at 130 milliseconds TWT, showing complex stratal deposition
and erosion from Sequence 3 to Sequence 4, erosion by SB 4, dendritic drainage pattern of Sequence 4, and also another valley system is seen to the lower-left of the field…………………………………………………… 47
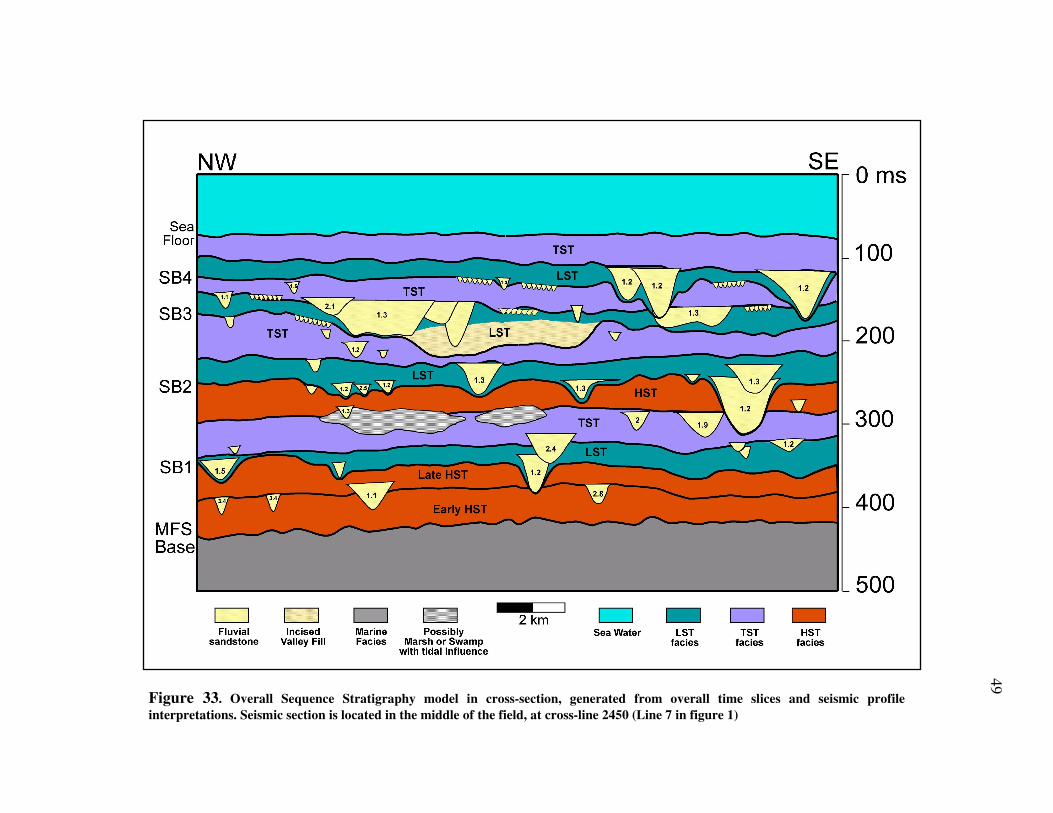
33 Overall Sequence Stratigraphy model in cross-section, generated from
overall time slices and seismic profile interpretations. Seismic section is located in the middle of the field, at cross-line 2450 (Line 7 in figure 1)….. 49
34 Stratigraphic position of channels plotted against channel thickness. On the
middle is the coastal onlap of Wornardt et al. (2001), and on the right is the sea level curve of Haq et al. (1987). See text for discussion………………..
52

xv
FIGURE Page
35 Stratigraphic positions plotted against channel width. Channels are wider following the sequence boundary. Bigger dimension of channels are interpreted as bigger trunk channel is receiving water and discharge from smaller tributaries. See text for further discussion…………………………. 54
36 Stratigraphic positions plotted against channel sinuosity. High sinuosity
channels dominate in the transgression phase. Low sinuosity channels are mostly located in the lowstand phase, immediately following sequence boundaries. Highstand phase also has lower sinuosity channels. Red arrows indicate decrease in sinuosity as systems tract approaching upper sequence boundaries. See text for further discussion. (green: 1-1.5; yellow: 1.5-2.0; blue: 2.0-2.5; light blue: 2.5-3.0; brown: 3.0-3.5)………………...………… 56
37 Frequency spectrum within the seismic interval of this study. Highest
frequency recorded is ~125 Hz. Dominant frequency is ~50-60 Hz ……….. 70
38 The velocity data used for time-depth conversion, plotted against two way time. Velocity of the study interval is in the range of 1500 m/s to 2100 m/s. Velocity model is built from four time-depth data (checkshot / VSP). The high velocity in the lower part is possibly due to accumulation of marine shale in the northeastern part of the field, as it is indicated by the well (Belida East 1) location. Marine shale is interpreted to have higher velocity than fluvial sands in other part of study area……………………..………… 71
39 The method used in this study to measure sinuosity of channels (after
Bridge, 2003)……………………………………………………………….. 72

1
CHAPTER I
INTRODUCTION
Detailed understanding of sequence stratigraphic relationships in fluvial facies is
still incomplete (cf. Posamentier et al., 1988; Posamentier and Vail, 1988; Shanley and
McCabe, 1991; Shanley and McCabe, 1994; Emery and Myers, 1996; Posamentier, 2001;
Wescott, 1993), especially with regards to the three-dimensional stratigraphic
architecture that results during multiple cycles of base-level change. Outcrop examples
typically provide only limited views of either vertical or lateral relationships. The few
Quaternary systems that have been extensively cored (e.g., Posamentier & Allen, 1993;
Somoza et al., 1998; Tornqvist, 1993) only give insight into fluvial-deltaic strata that
were deposited over the last cycle of eustatic sea-level change (i.e., since the Last Glacial
Maximum). Thus, sequence stratigraphic models for fluvial-deltaic systems are at least
partly inferential because three-dimensional control for these types of deposits is either
rarely available or is not fully utilized.
Subsurface data (including a 3D seismic survey and well information) from
Belida field in the West Natuna Basin, South China Sea (Figure 1) were used during this
study to document stratigraphic relationships within the Pliocene to Recent Muda
Formation. The Muda Formation consists of fluvial-deltaic facies that were deposited
This thesis follows the style of the American Association of Petroleum Geologists Bulletin.

2
during several cycles of base-level change. At least five third-order depositional
sequences are recognized within the upper 320 meters of the Muda Formation, each of
which is bounded by a major unconformity or sequence boundary that is characterized by
significant fluvial incision. The outstanding seismic resolution of paleogeomorphologic
features across the study area (e.g., various fluvial-channel and interchannel-bar types,
drainage patterns, and delta clinoforms) and recognition of facies stacking patterns
allowed construction of a high-resolution sequence stratigraphic model for this interval.
1 23 4
56
5km
7
Figure 1. Basemap of the study area. White lines indicate the locations of seismic sections shown in the next figures.
Data from Belida field provide a rare example where the responses of fluvial
systems during multiple, third-order cycles of base-level change are spectacularly imaged
and decipherable.
3
Figure 2. South East Asia showing Western part of Indonesia. Belida Field is located in the southwestern part of South China Sea, very far away from modern shoreline. In the background is the drowned river systems and approximate location of the modern shelf. The basins are: (1) Thai Basin, (2) Malay Basin, (3) Penyu Basin, (4) West Natuna Basin (where the study area is located), (5) Sokang Basin, (6) Sarawak Basin (Tjia, 1980; Madon and Watts, 1998).
4
CHAPTER II
GEOLOGIC SETTING AND GENERAL STRATIGRAPHY
OF THE STUDY AREA
WEST NATUNA BASIN
The West Natuna Basin consists of a series of roughly east-west oriented
depocenters with intervening basement ridges that formed when Paleogene rifting events
affected most of the southern South China Sea (SCS) or “Sunda Shelf” region (Figure 2;
Daines, 1985; Ginger et al., 1993; Murray, 2003; White JR and Wing, 1978;
Wongsosantiko and Wirojudo, 1984). Many half-graben depocenters of the West Natuna
Basin experienced significant contraction during late Oligocene to Miocene time to form
the “Sunda Folds,” which are classical examples of inverted basins (Ginger et al., 1993;
Olson and Dorobek, 2000). Regionally, the entire West Natuna Basin is bounded by a
series of fault-bounded basement highs, including the Khorat-Con Son high to the north,
the Natuna Arch to the east, shallow parts of the Sunda “Craton” to the south, and a
gradual transition into the Malay Basin to the west (Pollock et al., 1984).
Belida field is located in the western part of the South Natuna Sea (Maynard et
al., 2003). The 3D seismic survey used during this study is approximately 17 km wide by
40 km long and is located ~800 kilometers updip from the modern shelf-slope break to
the east. Present-day water depths are 50-60 m across most of the West Natuna Basin, so
that during glacio-eustatic lowstands and the Sunda Shelf becomes subaerially exposed

5
Figure 3. West Natuna Basin Standard Chronostratigraphy showing complete stratigraphic setting in West Natuna Basin. Belida Field does not have all the formation described in the chart. (ConocoPhillips Indonesia internal company report, 2002).
CI I 197, 001
SEQUENCEBOUNDARIES
0
5
10
15
20
25
30
35
40
TIME IN MaSTRUCTURALEVOLUTION
P O S T
R I F T
RIFTINITIATION
SB 50
III
II
I
SYN
RIFT
11.6
24.8
30.2
38.0
SB 90
SB 0
SB 1000
SEQUENCESTRATIGRAPHY
WEST NATUNASTRATIGRAPHY
0
5
10
15
20
25
30
35
40
TIME IN Ma SYSTEM SERIES STAGES
STANDARDCHRONOSTRATIGRAPHY
BERGGREN et al., 1995
HOLOCENE
PLEISTOCENE
Z A N C L E A N
ME SS IN IAN
T O R T O N IAN
L A N G H IAN
B UR D IG A L IAN
A Q U IT AN IA N
C H A T TIAN
R U PE LIAN
P R IA B O N IAN
B A R T O N IAN
IO N IA N
C A LA B R IA N
P IA C E N Z IA N
G E L A SI A N
S E R R A V ALL IAN
3 7 . 0
3 3 . 7
2 8 .5
2 3 .8
2 0 . 5 2
1 6 . 4 0
1 4 . 8 0
1 1 . 2 0
7 .1 2
5 .3 2
3 . 5 8
2 . 6 0
1 . 7 70 . 9 5
WEST NATUNA STANDARDCENOZOIC STRATIGRAPHY
Q
IH-619/NOV/02
B E L U TF M
G A B U S
F M
B A R A TF M
U D A N GF M
A R A N G
F M
M U D A
F M
LITHOSTRATIGRAPHY
(CONOCO)
L A M AF M
B E L U T
G R O U P
B A R A T
G R O U P
LWRARANGSANDMBR
LOWER
A R AN G
GROUP
UPPER
M UD A
GROUP
UPPER
GROUP FM
LOWER
B E N U AF M
LWRARANGSHALEMBR
M U D AF M
ARANGFM
UDANG FM
GABUS FM
BELUT FM
BAWAH FM
S B 1 0 0 0
S B 7 0 0
S B 5 0 0
S B 3 3 0
S B 9 0
S B 5 0
S B 0

6
(such as during the LGM), Belida field is located in downstream parts of regional
drainage systems (Figure 1).
MUDA FORMATION: LITHOFACIES AND STRATIGRAPHY
The Upper Miocene to Recent Muda Formation is up to ~750 m in thickness
(~0.75 second, two-way seismic travel-time; Figure 3; Phillips et al., 1997) and is a
broadly recognized lithostratigraphic unit deposited in a regional subsidence (Figure 4)
across most of the Sunda Shelf. The lower part of the Muda Formation consists largely of
outer-shelf mudstone facies and is generally considered the topseal for underlying
sandstone and carbonate reservoirs in several basins across the southern SCS (Cossey, et
al., 1982; Mattes, 1979; Matthews et al., 1997; Mayall et al., 1995; Michael and Adrian,
0
4
2
Ma Before Present
40 020 1030
M-7 well
1.35
0
4
2
Ma Before Present
40 020 1030
M-6 well
1.7
Figure 4. Two backstripped subsidence curves from Malay basin. The Malay basin is located on the left of West Natuna Basin (see location on figure 1). Rifting was starting at approximately 35 Ma. Inset is the beta value (modified from Madon and Watts, 1998)

7
1996; Sutoto, 1991). More recently, several studies have focused on the uppermost ~100
m of the Muda Formation and its lateral stratigraphic equivalents. This upper part of the
Muda Formation (Figure5; Figure 6) records deposition across the Sunda Shelf during the
last sea-level cycle, from maximum lowstand conditions during the Last Glacial
Maximum (LGM), transgression during the post-Pleistocene sea-level rise, and the
0
500
1000
1500
1900
SENW
4km
InvertedStructure
Basement
SB 2
SB 4SB 3
SB 1MFSBase
sea floorPost
Inversion
Syn-RiftPost-Rift
Syn-Inversion
Figure 5. Belida structure is resulted from inversion of a half-graben. The fault is inverted, being normal at the bottom and reverse upward. The Muda formation is located above the structure, in the tectonically quiet interval, which is the result of regional slow subsidence.

8
present-day, shallow-marine, highstand conditions across the Sunda Shelf (e.g., Hanebuth
and Statteger, 2003). To our knowledge, however, no detailed three-dimensional
stratigraphic analysis of the older Muda strata has been published nor has any proprietary
study of this type been done by the petroleum industry.
Basal strata of the Muda Formation unconformably overlie a regional late
Miocene unconformity (“Upper Miocene Unconformity”) that is recognizable across
most of the southern SCS. Basal Muda facies generally consist of gray-green mudstone
facies that were deposited in outer neritic environments during the global eustatic rise
that followed the Messinian lowstand event (i.e., Pliocene transgressive deposits). Since
the earliest exploration wells were drilled across the southern SCS in the 1960’s and
1970’s by the petroleum industry, the Muda Formation generally has been thought to
consist entirely of marine gray-green mudstone facies. This interpretation persisted until
the 1990’s because well logs were not run and drill-cuttings were rarely examined until
deeper parts of the Muda Formation were penetrated.
Figure 6. Chronostratigraphic chart in Muda showing relationship between age, sequences, sequence boundaries, and nannofossils in the study interval (modified from Morley et al., 2003; Palynova, 2003)

9
CHAPTER III
AVAILABLE DATA AND METHODOLOGIES USED
A high-resolution 3D seismic-reflection survey acquired across Belida field in
2001 by Conoco Indonesia was used during this study. In-line spacing within the survey
is 25 m and cross-line spacing is 12.5 m. Digital well-log data and biostratigraphic picks
from one well (Figure 7) were used to constrain seismic interpretations. Most wells
across Belida field only include information from deeper stratigraphic levels (i.e., Eocene
to upper Miocene strata) where petroleum reservoirs are located. Four wells, however,
have seismic-velocity information for the shallow section, which proved essential for
time-depth conversion of the Muda Formation.
Seismic mapping was done on vertical seismic sections and time slices.
Depositional features were recognized using seismic facies analysis, seismic amplitude
character, and geomorphologic pattern-recognition on time slices. Seismic facies (most
notably, various channel and interchannel bar types) were identified and key stratigraphic
surfaces (e.g., incised valleys, fluvial channels, and maximum flooding surfaces) were
mapped throughout the entire 3D seismic volume. Time-slices were examined at 4 ms
intervals throughout the entire volume of Muda strata, which allowed very detailed
mapping of depositional and geomorphologic features. Careful mapping of key
stratigraphic surfaces and analysis of geomorphologic features allowed
paleogeomorphologic reconstruction of the study area during early Pliocene to Recent
time (Cant, 1992). Recognition of facies stacking patterns and incorporation of
biostratigraphic information allowed depositional cycles within the Muda Formation to
10
be dated and compared to published eustatic sea-level charts (Haq et al., 1987) and
coastal onlap curves (Wornardt et al., 2001), which helped to further constrain sequence
stratigraphic interpretations.
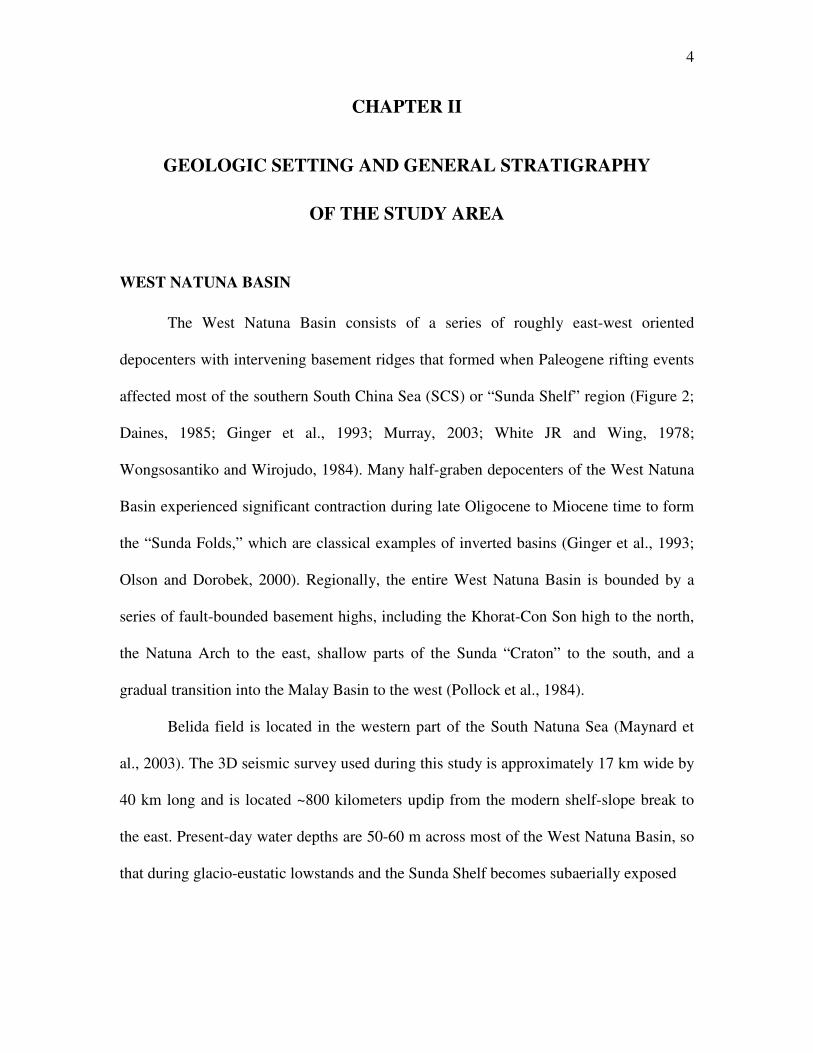
The highest frequency recorded in the 3D seismic data from Belida field is >100
Hz, with the highest dominant frequency range being 50-60 Hz within the studied
interval. Thus, given the relatively shallow depth of the Muda Formation at Belida field
there is little attenuation of the seismic data. Given the high frequency content of the data
and an average seismic velocity of ~1650 m/s for the Muda Formation, stratigraphic
features on the order of 6.9-8.3 m thickness can be resolved.
0
1s
CDP 10542
Kambing-1SW NE
MFS Base of this study
Figure 7. A Regional seismic line (the TGS-Nopec SEAS 95 survey) crossing West Natuna Basin and Kambing-1 well, which is showing very similar structure and stratigraphic style with Belida Field. The maximum flooding surface base of the study is shown by the green line. Consistency in structure and stratigraphy of regional line make it possible to adapt information from this well to Belida Field. By correlating with the well formation, it is inferred that the MFS Base of the study is approximately formed within the DS sequence of Morley et al., 2003, which is approximately 2.5 – 2.75 Ma.

11
CHAPTER IV
OVERVIEW OF FLUVIAL
SEQUENCE STRATIGRAPHIC MODELS
Fluvial systems respond rapidly to changes in base level (Reading and Levell,
1996; Reading and Collinson, 1996), which can be defined as the level at which a stream
can no longer erode its bed. For streams that discharge into ocean basins, base level
corresponds to sea level (Schumm, 1993). Base-level changes cause changes in the
sinuosity, width, and depth of fluvial channels (Blum and Tornqvist, 2000). The concept
of a graded stream profile can be defined as the equilibrium surface that determines
where erosion and deposition occur along a fluvial system (Collinson, 1996).
Disturbances to the river system, such as sea-level fluctuations, tectonic uplift or
subsidence, and changes in fluvial discharge, will affect an established stream profile.
Rivers will respond to these disturbances by creating a new equilibrium profile, so that
the river will adjust by either eroding or depositing sediment. In addition, channel
patterns will also change along the profile as the new graded profile is achieved.
Incised-valley systems are elongate, erosional, topographic lows that are typically
wider than a single channel form (Dalrymple et al., 1994). Incised valleys form in at least
three principal ways (Posamentier, 2001): (1) as a result of sea-level fall, (2) by tectonic
tilting of alluvial settings, or (3) during significant decrease in fluvial discharge, which
causes development of underfit streams. Most of the Sunda Shelf region has undergone
only slow, regional tectonic subsidence since ~10 Ma (Figure 4; Madon and Watts, 1998;
McClay & Bonora, 1998; Murray, 2003). In addition, only a few strike-slip faults cut
12
through the oldest Muda strata that were examined during this study. Given the
apparently quiescent tectonic setting of the West Natuna Basin during Pliocene to Recent
time, it is unlikely that there was significant tilting of fluvial settings during Muda
deposition. General climate information from Morley and others (2003) for the West
Natuna Basin (Figure 6) indicate that incised valley formation during Muda deposition
was not caused by significant decreases in fluvial discharge, resulting in formation of
underfit streams. Thus, incised-valley systems in the Muda Formation at Belida field
were most likely caused by sea-level falls.
Deep river incision occurs when base-level fall is especially large (Schumm,
1993). Abrupt seaward shifts of depositional facies usually occur across the regionally
mappable sequence boundary found at the base of incised-valley fills (Mulholland, 1998).
Incised valleys typically begin to back-fill with sediment during sea level rise(s),
although the amount lowstand filling versus transgressive filling may be difficult to
identify. Incised-valley systems can be hundreds of kilometers long, tens of kilometers
wide, and up to a hundred meters or so deep. The outer incised valley extends from the
mouth of the valley landward to the point where earliest highstand progradation of
fluvial/deltaic facies is recognizable. The middle part of an incised-valley system extends
from the point where fluvial systems begin to equilibrate during the early sea-level rise,
landward to the limit of marine/estuarine conditions at the time of maximum flooding.
The inner incised-valley system extends from the seaward limit of marine/estuarine
influence and landward to the point where relative sea-level has little affect on fluvial
style.
13
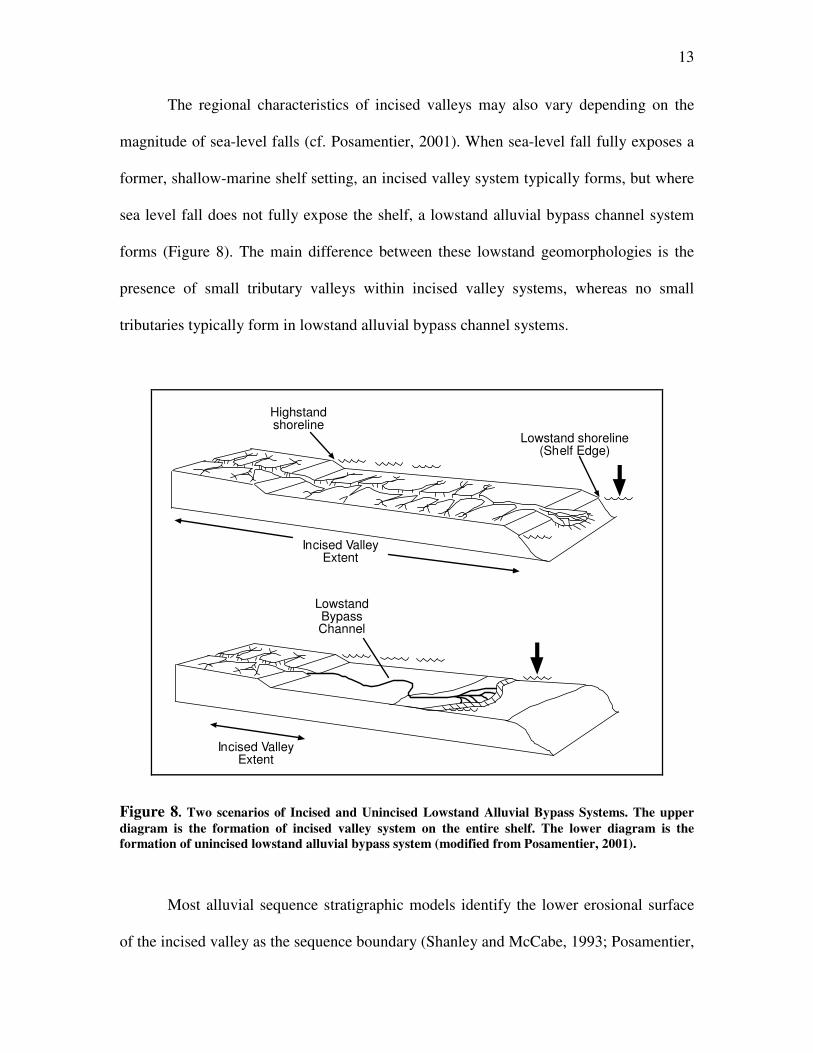
The regional characteristics of incised valleys may also vary depending on the
magnitude of sea-level falls (cf. Posamentier, 2001). When sea-level fall fully exposes a
former, shallow-marine shelf setting, an incised valley system typically forms, but where
sea level fall does not fully expose the shelf, a lowstand alluvial bypass channel system
forms (Figure 8). The main difference between these lowstand geomorphologies is the
presence of small tributary valleys within incised valley systems, whereas no small
tributaries typically form in lowstand alluvial bypass channel systems.
Highstandshoreline
Lowstand shoreline(Shelf Edge)
Incised ValleyExtent
LowstandBypassChannel
Incised ValleyExtent
Figure 8. Two scenarios of Incised and Unincised Lowstand Alluvial Bypass Systems. The upper diagram is the formation of incised valley system on the entire shelf. The lower diagram is the formation of unincised lowstand alluvial bypass system (modified from Posamentier, 2001).
Most alluvial sequence stratigraphic models identify the lower erosional surface
of the incised valley as the sequence boundary (Shanley and McCabe, 1993; Posamentier,

14
2001; Wright and Marriott, 1993; Plint, et al, 2001; Olsen, et al, 1995; Legarreta and
Uliana, 1998). Extensive, laterally amalgamated fluvial deposits that are confined within
the incised valley typically overlie this regionally significant sequence boundary. With
rapid sea-level fall and incision, all discharge events will be concentrated into a narrow,
deep channel. The late lowstand systems tract (or late LST) reflects the time when sea
level begins to rise slowly, after the previous major sea-level fall. Fluvial systems
respond by depositing more sediment in response to the gradual base-level rise. Strata
that comprise the late LST within incised-valley fills correspondingly show progressively
increasing rates of aggradation. Sandy facies generally will be concentrated in the center
of the valley, but the increase in aggradation rates results in multistory-multilateral sand
bodies in the lower part of the incised valley fill (cf. Martinsen et al., 1999; Wright and
Marriott, 1993).
Van Wagoner and others (1990) argue that the LST is characterized by point bar
deposits in distal parts of the incised valley, which result from deposition by sinuous
channels. In contrast, braided channel facies are characteristic of LST deposits in upper
reaches of the incised valley (e.g. Miall, 2002; Wright and Marriott, 1993).
During continued sea-level rise (i.e., early transgressive systems tract or TST),
amalgamated fluvial sandstones are deposited (Shanley and McCabe, 1993; Figure 9;
Olsen et al., 1995). Continued transgression is represented by a change from
amalgamated channel sandstone bodies to more fine-grained and more isolated fluvial-
channel deposits within the incised-valley fill (cf. Wright and Marriott, 1993; Figure 10;
Olsen et al., 1995), with progressively increasing proportions of fine-grained, overbank
facies. During rising base level, reduced fluvial gradients also may cause stream channel

15
patterns to change to more meandering or anastomosing channel types, and crevasse
deposits may increase as the river tries to maintain grade with base-level rise (e.g.
Tornqvist, 1993; Miall, 2002; Figure 11). Shanley et al. (1992) proposed that increased
tidal structures identify the period of maximum flooding (i.e., end of the TST). Therefore,
the maximum flooding surface is thought to correspond to development of tidally-
influenced fluvial strata within the incised valley fill, especially in more basinward parts
of incised valley systems. The distal parts of incised valleys may become estuaries when
the valley is flooded by sea water.
Figure 9. A summary diagram showing changes in fluvial architecture as a function of base level changes of nonmarine strata (modified from Shanley and McCabe, 1993)
16
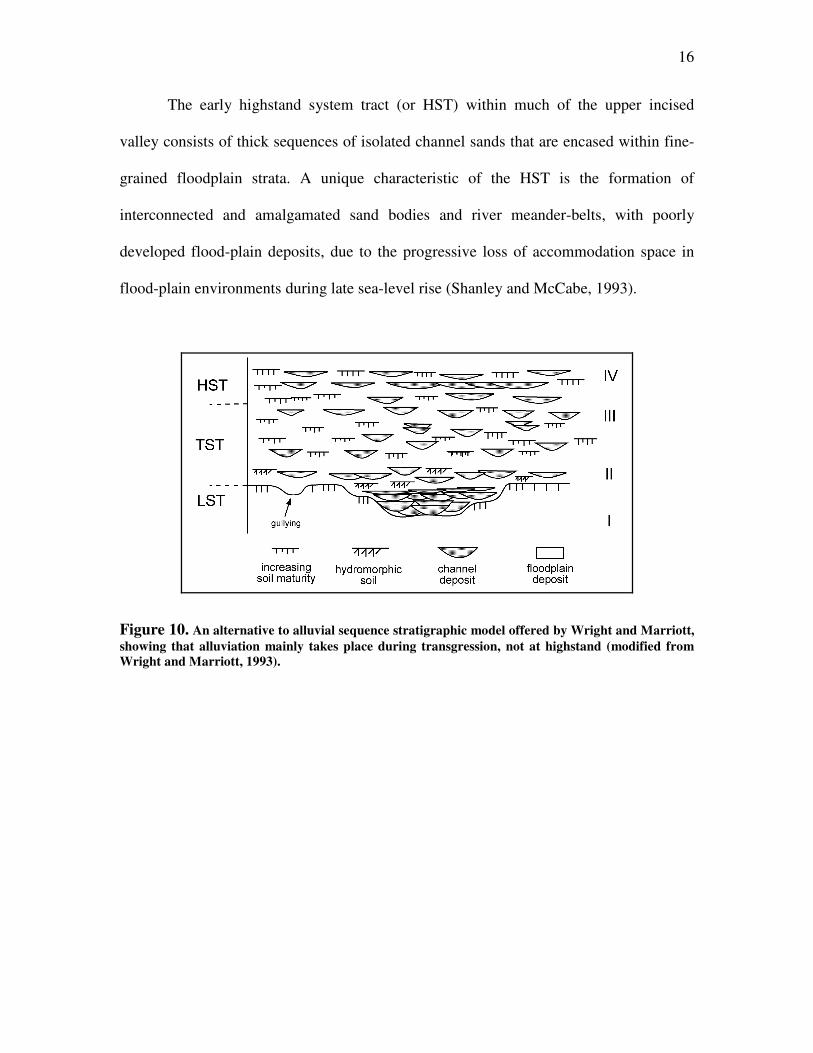
The early highstand system tract (or HST) within much of the upper incised
valley consists of thick sequences of isolated channel sands that are encased within fine-
grained floodplain strata. A unique characteristic of the HST is the formation of
interconnected and amalgamated sand bodies and river meander-belts, with poorly
developed flood-plain deposits, due to the progressive loss of accommodation space in
flood-plain environments during late sea-level rise (Shanley and McCabe, 1993).
Figure 10. An alternative to alluvial sequence stratigraphic model offered by Wright and Marriott, showing that alluviation mainly takes place during transgression, not at highstand (modified from Wright and Marriott, 1993).

17
Figure 11. A sequence stratigraphic model that was generated from time slices analysis. The position of the lower sequence boundary is based primarily on the existence of incised valley (modified from Miall, 2002)

18
CHAPTER V
MUDA SEQUENCE STRATIGRAPHIC FRAMEWORK
Sequence stratigraphic terminology used in this study follows that of Van
Wagoner and others (1987). Four sequence boundaries were defined within the Muda
Formation across the study area (Figure 12). Sequence boundaries show clear evidence of
fluvial incision, presence of tributaries with dendritic drainage patterns, and distinct
fluvial channel patterns. Each of the five depositional sequences recognized within the
Muda Formation represents deposition during a “third-order” sea-level cycle (i.e., ~0.5
Myr of deposition for each sequence).
ALLOCYCLIC VS AUTOCYCLIC CONTROL ON SEQUENCE
STRATIGRAPHIC DEVELOPMENT
Stratigraphic patterns recognized during this study are thought to be controlled
largely by eustatic sea-level changes. Other allocyclic controls, such as tectonic tilting or
varying subsidence rates and paleoclimatic changes during Pliocene to Recent time likely
had only minimal effects on Muda stratigraphic development (see discussion above).
Fluvial networks in the Muda Formation at Belida field are located in middle to
downstream parts of regional drainage systems that extended across much of the Sunda
Shelf during Pliocene to Recent sea-level lowstands (Murray, 2003). Thus, Muda channel
morphologies and drainage evolution at Belida field should have been strongly affected
by sea-level changes (Emery & Myers, 1996).
19
Interval ofthis study
Post InversionMuda Formation
Syn Rift -Syn Inversion
0
500
1000
1500
1900
SE
Pre-sequence 1
Sequence 1Sequence 2
Sequence 3Sequence 4
Sea water
Basement
NW
4km
InvertedStructure
MFSBase
SB1SB2SB3SB4
SeaFloor
Figure 12. General vertical section interpretation of Belida Field. Inverted structures are located approximately between 1800 – 900 milliseconds. Above the inversion structure, the post-inversion Muda Formation was deposited. The object of the study is confined to approximately 500 ms to the sea floor, in the tectonically quiet succession. Cross section is generated from cross-line 2000 (line 1 in figure 1).
Autocyclic factors, such as channel avulsion, probably also were not important
controls on sequence stratigraphic patterns because there is little evidence of crevasse
splays, breeched levees, or similar depositional facies/geomorphic features within the
available seismic data.

20
GENERAL DESCRIPTION OF MUDA STRATIGRAPHIC PATTERNS
The Muda Formation comprises an overall progradational fluvial-deltaic and
shallow-marine succession that formed during several cycles of sea-level change under
conditions of relatively slow subsidence. Sediment supply was sufficient to create long-
term progradational stratal patterns. Fluvial depositional and erosional features are
recognizable within the Muda Formation, starting at approximately 750 ms TWT,
although this study focused on the interval from 450 ms to the present-day sea floor. At
approximately 450 ms, a regional maximum flooding surface marks the beginning of the
long-term regressive phase that commenced at approximately 2.5-2.7 Ma. Five third-
order depositional sequences are recognizable within the Muda Formation above the
maximum flooding surface at ~450 ms.
DESCRIPTION AND INTERPRETATION OF MUDA DEPOSITIONAL
SEQUENCES
Each third-order depositional sequence recognized in the Muda Formation is
illustrated using observations from several time slices or several seismic sections. In each
time slice, white shades represent facies with high seismic amplitude and black represents
low-amplitude facies.
Pre-Sequence 1
Pre-Sequence 1 Description
Pre-Sequence 1 strata consist of the interval from ~450 to ~370 ms TWT,
between the basal maximum flooding surface described previously (or MFS Base, blue
horizon on figure 13) to the first recognizable sequence boundary (or SB1; green horizon
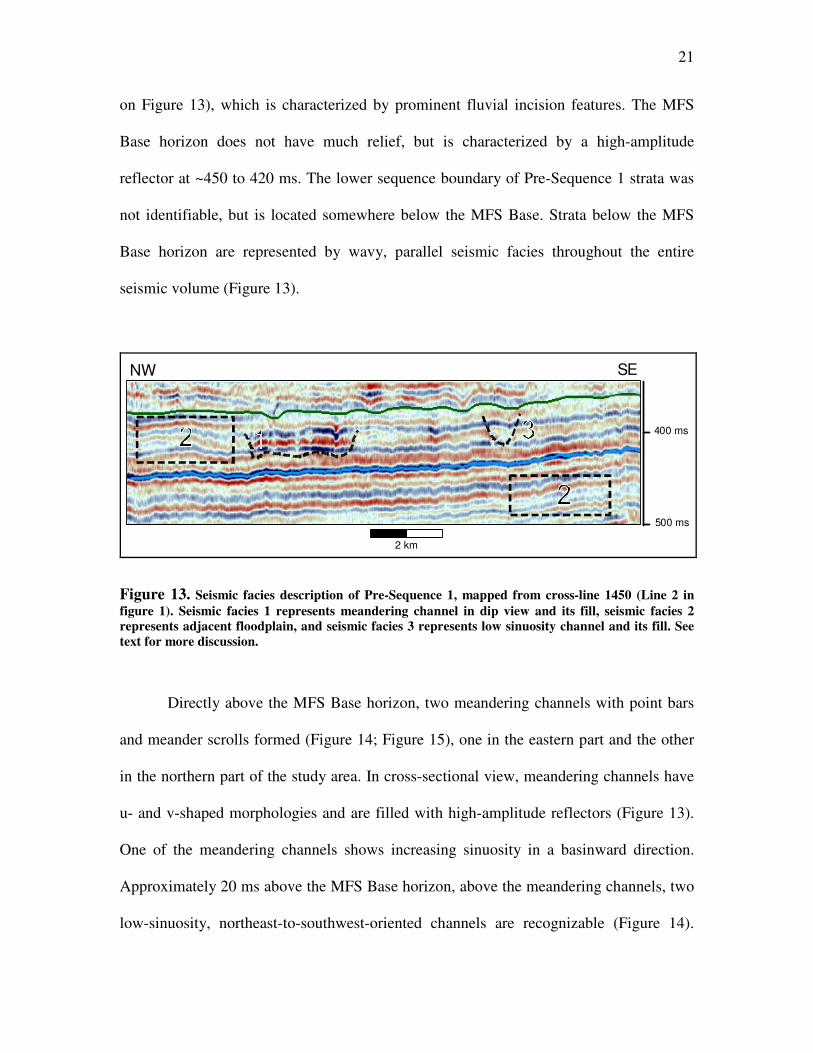
21
on Figure 13), which is characterized by prominent fluvial incision features. The MFS
Base horizon does not have much relief, but is characterized by a high-amplitude
reflector at ~450 to 420 ms. The lower sequence boundary of Pre-Sequence 1 strata was
not identifiable, but is located somewhere below the MFS Base. Strata below the MFS
Base horizon are represented by wavy, parallel seismic facies throughout the entire
seismic volume (Figure 13).
SENW
400 ms
500 ms
2 km
Figure 13. Seismic facies description of Pre-Sequence 1, mapped from cross-line 1450 (Line 2 in figure 1). Seismic facies 1 represents meandering channel in dip view and its fill, seismic facies 2 represents adjacent floodplain, and seismic facies 3 represents low sinuosity channel and its fill. See text for more discussion.
Directly above the MFS Base horizon, two meandering channels with point bars
and meander scrolls formed (Figure 14; Figure 15), one in the eastern part and the other
in the northern part of the study area. In cross-sectional view, meandering channels have
u- and v-shaped morphologies and are filled with high-amplitude reflectors (Figure 13).
One of the meandering channels shows increasing sinuosity in a basinward direction.
Approximately 20 ms above the MFS Base horizon, above the meandering channels, two
low-sinuosity, northeast-to-southwest-oriented channels are recognizable (Figure 14).
22
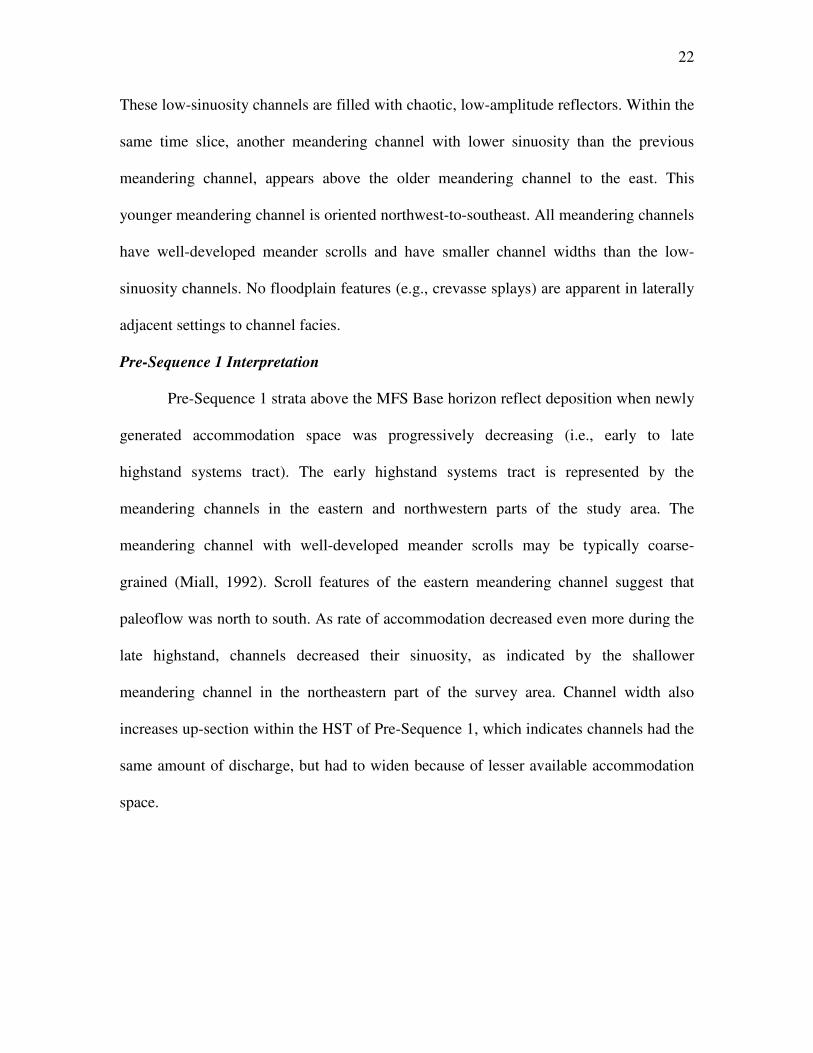
These low-sinuosity channels are filled with chaotic, low-amplitude reflectors. Within the
same time slice, another meandering channel with lower sinuosity than the previous
meandering channel, appears above the older meandering channel to the east. This
younger meandering channel is oriented northwest-to-southeast. All meandering channels
have well-developed meander scrolls and have smaller channel widths than the low-
sinuosity channels. No floodplain features (e.g., crevasse splays) are apparent in laterally
adjacent settings to channel facies.
Pre-Sequence 1 Interpretation
Pre-Sequence 1 strata above the MFS Base horizon reflect deposition when newly
generated accommodation space was progressively decreasing (i.e., early to late
highstand systems tract). The early highstand systems tract is represented by the
meandering channels in the eastern and northwestern parts of the study area. The
meandering channel with well-developed meander scrolls may be typically coarse-
grained (Miall, 1992). Scroll features of the eastern meandering channel suggest that
paleoflow was north to south. As rate of accommodation decreased even more during the
late highstand, channels decreased their sinuosity, as indicated by the shallower
meandering channel in the northeastern part of the survey area. Channel width also
increases up-section within the HST of Pre-Sequence 1, which indicates channels had the
same amount of discharge, but had to widen because of lesser available accommodation
space.

23
Figure 14. A combined interpretation from several time slices to represent Highstand System Tract of Pre-Sequence 1. After the deposition of marine rich facies maximum flooding surface, meandering channels are deposited, since the slope is still very low. One meandering channel develops very good meander scrolls, while the other does not. Following this, the sea-level rises, rate of accommodation generation is decreasing and late highstand facies formed with appearances of low sinuosity channels, as slope is increasing. Meandering channels response by decreasing sinuosity and reducing meander scrolls. Channel dimensions are bigger in the late highstand systems tract. Channels are oriented north to south during TST to early HST, and oriented northeast to southwest during late HST.
No fluvial or coastline features within the interval below MFS Base may suggest
that the interval below MFS Base consists of shallow-marine facies.

24
Figure 15. A meandering channel is oriented north to south at 396 ms below the sea floor. Another less meandering channel is flowing on top of it from northwest to southeast, reflecting the response of fluvial systems to decreasing accommodation space in late highstand. The time slice is interpreted to be located in transgressive to late highstand systems tract of Pre-Sequence 1. Inset picture is location within the time slice.
Sequence 1 Sequence 1 Description
Sequence 1 consists of the interval from ~350 to ~250 ms TWT, although the
sequence boundaries that bound this depositional sequence (and also all overlying
sequences) have significant relief so that these are only general estimates. Sequence 1 is
bounded below by sequence boundary 1 (or SB1; green horizon on Figure 16), which has
up to ~70 ms of local relief. High-amplitude seismic facies fill v-shaped incisions that
characterize SB1.
In plan view, successive time slices through SB1 and overlying strata show that
this surface is characterized by wide and deep erosional features with numerous smaller
channels in more northern parts of the survey area (Figure 17). The smaller channels have
low sinuosity values, are u-shaped in cross-sectional view, and have east-west
orientations. In the southern part of the survey area, a low sinuosity, southwest to
northeast oriented channel developed near the middle part of Sequence 1 (Figure 18).
2
5km
2km

25
In the middle part of Sequence 1, channel sinuosity increases. At ~50
milliseconds above SB1, meandering channels become apparent in time slices, although
they lack significant meander scrolls. High-amplitude, sub-parallel reflectors characterize
adjacent interchannel strata and extend across the entire survey area, wherever channel
features are not present. The older meandering channel trends from southwest to
northeast, whereas the younger meandering channels trend from west to east.
Overlying the meandering and high-sinuosity channels, another prominent fluvial
system is imaged in the upper part of Sequence 1. This fluvial system is north-south
oriented and cuts across the survey area. Low-sinuosity channels dominate and are u-
shaped in cross-section and filled with either high or low amplitude, laterally continuous
reflectors or completely chaotic facies. Other low-sinuosity channel also appears in the
eastern and northwestern parts of the survey area. Compared to the low-sinuosity
channels at the base of Sequence 1, the younger channels are less wide and not as deep.
Adjacent to channel features, reflectors throughout Sequence 1 typically have
moderate to high amplitude and high lateral continuity.
26
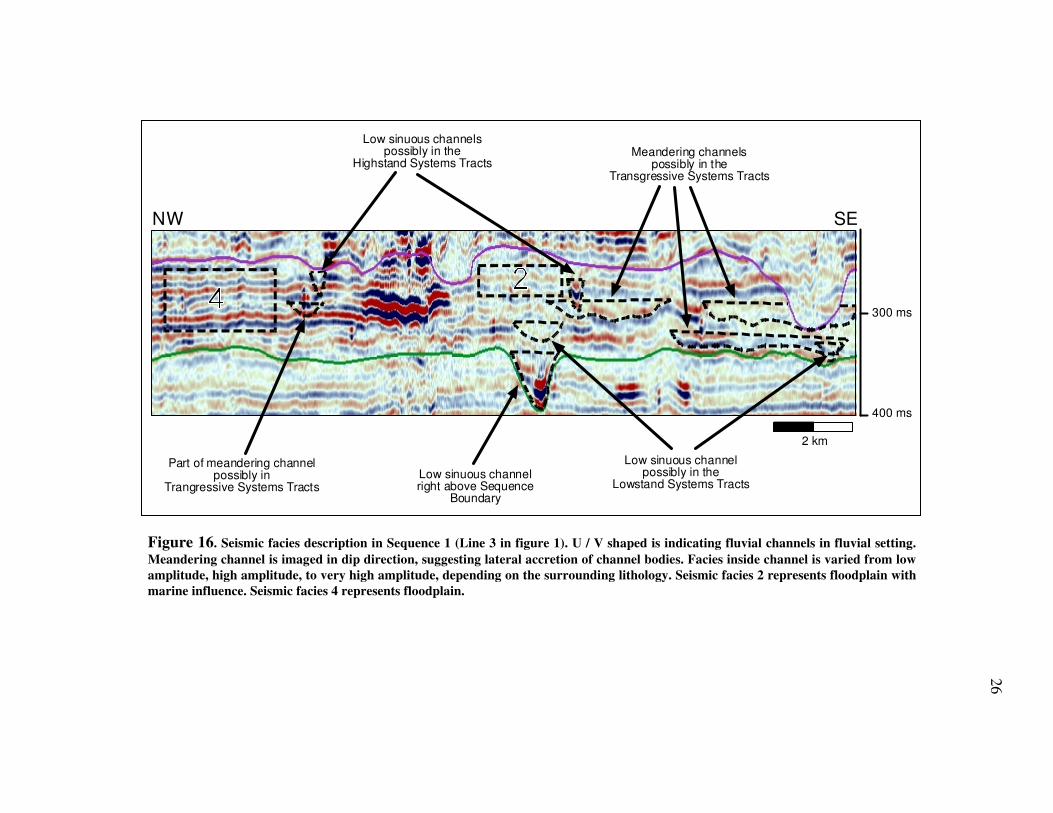
300 ms
400 ms
2 km
Low sinuous channelright above Sequence
Boundary
Low sinuous channelpossibly in the
Lowstand Systems Tracts
Meandering channelspossibly in the
Transgressive Systems Tracts
Low sinuous channelspossibly in the
Highstand Systems Tracts
Part of meandering channelpossibly in
Trangressive Systems Tracts
SENW
Figure 16. Seismic facies description in Sequence 1 (Line 3 in figure 1). U / V shaped is indicating fluvial channels in fluvial setting. Meandering channel is imaged in dip direction, suggesting lateral accretion of channel bodies. Facies inside channel is varied from low amplitude, high amplitude, to very high amplitude, depending on the surrounding lithology. Seismic facies 2 represents floodplain with marine influence. Seismic facies 4 represents floodplain.

27
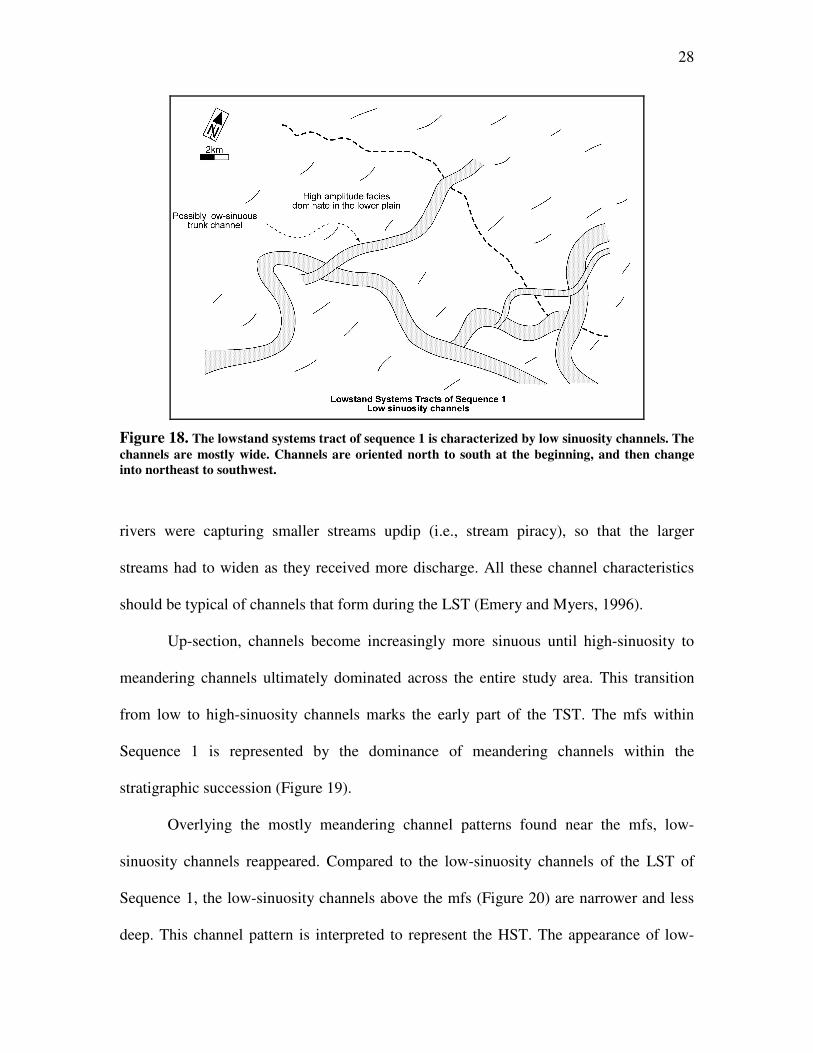
N
5 km
Figure 17. Three dimensional visualization of sequence boundary 1, which is showing relief that was formed by major channel erosion. The main erosion is oriented northeast-to-southwest, with smaller erosional features located in the northern part of study area. Note that small tributary channels are not present. Sequence 1 Interpretation
Sequence 1 marks the beginning of decreasing marine influence across Belida
field. The overall proportion of fluvial-channel facies within third-order depositional
sequences progressively increases up-section in the Muda Formation, beginning with
Sequence 1.
The lack of small tributary channels along SB1 suggests that base-level fall was
not great enough to expose the entire Sunda Shelf, so that SB1 probably represents a
lowstand alluvial-channel bypass surface (cf. Posamentier, 2001). Stream power,
however, was great enough during lowstand conditions to form channels up to 70
milliseconds deep (Figure 17; Figure 18). Channel patterns immediately above the
sequence boundary are wide, deep, and have low-sinuosity. Wide channels suggest that
larger
28
Figure 18. The lowstand systems tract of sequence 1 is characterized by low sinuosity channels. The channels are mostly wide. Channels are oriented north to south at the beginning, and then change into northeast to southwest.
rivers were capturing smaller streams updip (i.e., stream piracy), so that the larger
streams had to widen as they received more discharge. All these channel characteristics
should be typical of channels that form during the LST (Emery and Myers, 1996).
Up-section, channels become increasingly more sinuous until high-sinuosity to
meandering channels ultimately dominated across the entire study area. This transition
from low to high-sinuosity channels marks the early part of the TST. The mfs within
Sequence 1 is represented by the dominance of meandering channels within the
stratigraphic succession (Figure 19).
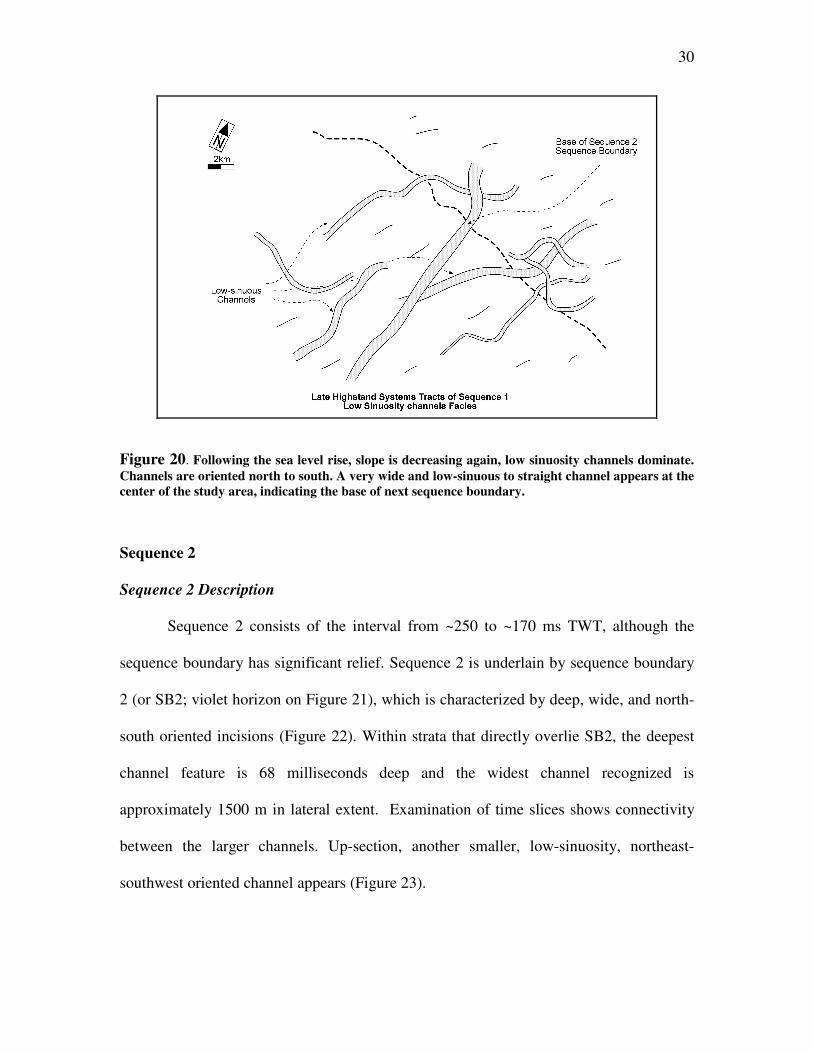
Overlying the mostly meandering channel patterns found near the mfs, low-
sinuosity channels reappeared. Compared to the low-sinuosity channels of the LST of
Sequence 1, the low-sinuosity channels above the mfs (Figure 20) are narrower and less
deep. This channel pattern is interpreted to represent the HST. The appearance of low-

29
sinuosity channels with smaller cross-sectional dimensions reflects the decreasing
accommodation conditions that should be typical of highstand systems tract in fluvial-
dominated settings. A prominent low-sinuosity to straight channel in the center of the
study area reflects the beginning of sequence boundary formation that marks the next
sequence (i.e., sequence boundary 2).
Figure 19. Channels are increasing their sinuosity as the slope is getting lower, as a result of base level rise. High sinuosities to meandering channels dominate the depositional channel patterns in transgressive to early highstand of Sequence 1. Channel dimensions vary with time, probably reflecting discharge or sediment supply changes. Channels orientation is changing from northeast to southwest and then northwest to southeast.
30
Figure 20. Following the sea level rise, slope is decreasing again, low sinuosity channels dominate. Channels are oriented north to south. A very wide and low-sinuous to straight channel appears at the center of the study area, indicating the base of next sequence boundary.
Sequence 2 Sequence 2 Description
Sequence 2 consists of the interval from ~250 to ~170 ms TWT, although the
sequence boundary has significant relief. Sequence 2 is underlain by sequence boundary
2 (or SB2; violet horizon on Figure 21), which is characterized by deep, wide, and north-
south oriented incisions (Figure 22). Within strata that directly overlie SB2, the deepest
channel feature is 68 milliseconds deep and the widest channel recognized is
approximately 1500 m in lateral extent. Examination of time slices shows connectivity
between the larger channels. Up-section, another smaller, low-sinuosity, northeast-
southwest oriented channel appears (Figure 23).
31
200 ms
300 ms
U/V-shaped reflectionLow-sinuous Lowstand
Channels
U/V-shaped reflectionStraight / Low-sinuousLowstand Channels
right above Sequence Boundary
U/V-shaped reflectionHigher-sinuousity
TransgressiveChannels
2 km
Gas Chimney
Figure 21. Seismic facies description of Sequence 2 (Line 4 in figure 1). U / V shaped reflections are indicating fluvial channels. Meandering channels is imaged in cross section, making it difficult to differentiate from other channels, without help from time slice analysis. Facies inside channel is varied from low amplitude, high amplitude, to very high amplitude, depending on the surrounding lithology. Seismic facies 2 represents floodplain.

32
5 km
N
Figure 22. Three dimensional visualization of sequence boundary 2, which is showing relief that was formed by major channel erosion. The main erosion is oriented north-to-south. The main erosional feature is accompanied by several channels erosion. Note that small tributary channels are not present.
Farther up-section, a very prominent west-to-east oriented incision extends across
the entire survey area. This prominent incision is actually the most deeply incised part of
sequence boundary 3 (or SB3), which defines the base of the overlying depositional
sequence (Sequence 3). SB3 cut deeply into Sequence 2 strata over much of the survey
area, so that Sequence 2 may be only partially preserved and much of the upper part of
Sequence 2 may have been eroded.
Outside of the deeply incised part of SB3, Sequence 2 strata contain numerous
meandering channels. These meandering channels do not have prominent meander
scrolls. In the eastern part of the study area, an anastomosing channel system is
33
recognizable. This anastomosing channel system is younger than the high-sinuosity
meandering channels, but was also cut by the major incision along SB3. Remnants of
Figure 23. The Lowstand Systems Tract of Sequence 2 is characterized by low-sinuos to straight deep and wide channels. Following the wider channels deposition, narrower, but slightly more sinuous channels deposited. Channels are oriented northeast to southwest.
highly sinuous channels are seen in the northern part of study area, but are not mappable
for any great distance. Channels located within the upper portion of Sequence 2 are
mostly filled by high-amplitude reflectors, although one high-sinuosity channel is filled
by low-amplitude to transparent reflectors (Figure 21). In general, channel patterns within
the upper half of Sequence 2 (from approximately 224-180 ms) are highly sinuous,
meandering, and anastomosing, with a conspicuous absence of low-sinuosity channels.
34
Adjacent to channel features, within the interchannel area, reflectors throughout
Sequence 2 typically have low-amplitude and wavy character, with low to moderate
lateral continuity (Figure 21).
Sequence 2 Interpretation
Sequence boundary 2 is more likely an unincised lowstand alluvial-channel
bypass surface, as indicated by the absence of small tributary channels to the main, deep
incisions (Posamentier, 2001). Sea-level fall was apparently not great enough for the
regional shoreline to drop below (seaward) of the antecedent shelf edge. The deep, wide,
and low-sinuosity channels that formed above SB2 (Figure 22 and Figure 23)
characterize the LST.
The high regional stream-gradient during formation of the LST is suggested by
the overall low-sinuosity character of the major channels. Large, lowstand channels were
likely receiving sediment load and discharge from smaller channels upstream, which
increased the stream power of these lowstand channels and allowed them to erode and
create wide (up to 1500 m) and deep (up to 68 ms) channels.
High-sinuosity channels that characterize the upper part of Sequence 2 (Figure 24
on p. 35) indicate a decrease in regional stream gradient. These high-sinuosity channels
likely record the TST of Sequence 2. The mfs that marks the climax of the transgression
is possibly represented by the existence of the anastomosing channel system (cf.
Tornqvist, 1993). Orientation and form of these channels suggest that there was little tidal
influence.

35
Figure 24. The transgressive systems tract of Sequence 2 is characterized by high-sinuosity and anastomosing channels. Channels are interpreted to flow from west to east. However, the base of incised valley of Sequence 3 appears, indicating that some transgressive facies, and highstand systems tract of Sequence 2 was eroded by the valley of Sequence 3. Erosion by the valley is also indicated by incomplete complex channel networks in the background. The boundary of the valley erosion is indicated by the limit of eroded channel bodies.
A major erosional surface that marks the beginning of the next depositional
sequence characterizes the base of the overlying incised valley system (i.e., sequence
boundary 3 at the base of Sequence 3). This surface significantly eroded HST strata of
Sequence 2, with even some erosion down to the level of TST strata within Sequence 2.
Sequence 3
Sequence 3 Description
Sequence 3 consists of the interval from ~170 to ~120 ms TWT, although the
sequence boundary itself has significant relief (Figure 25). Sequence 3 is bounded below

36
by an incised valley system that comprises sequence boundary 3 (or SB3, yellow horizon
on the figure on p. 39). The deepest part of the incised valley has up to 40 ms relief. SB3
is also characterized by numerous small tributary valleys and well-developed dendritic
drainage patterns in flood plain environments adjacent to the main trunk stream along
SB3 (Figure 25 on p.36, the figure on p. 40 and the figure on p. 41). The incised valley
system was then back-filled by meandering channels
N
5 km
Figure 25. Three dimensional visualization of sequence boundary 3, which is showing relief that was formed by major incised valley system. The main erosion is oriented west-to-east. The incised valley system is eroded by north-south low sinuosity channels. Note that small tributary channels are prominent in the floodplain.

37
that were confined to the valley. Strata that fill meandering-channels are characterized by
very high-amplitude facies that contain u-shaped features in cross-sectional view (Figure
26). Point bars are very prominent and clearly imaged on time slices from just above SB3
(the figure on p. 40).
The meandering channels confined to the incised valley system were cut in the
western and central parts of the survey area by another system of large, north-south
trending, low- to moderate-sinuosity channels. In the eastern part of the survey area, the
anastomosing channel from the HST of Sequence 2 was apparently eroded by small
tributary channels and small, low-sinuosity channels that drained into the main incised
valley of Sequence 3 (Figure 27).
The low- to moderate-sinuosity channel in the outside of the valley has a different
orientation than the meandering channel inside the incised valley. Upsection, a north-
south trending, meandering channel with well-developed meander scroll appears in the
western part of the study area with. Low-amplitude to reflection-free facies fill this
channel.
Above the interfluve of the incised valley, numerous, small, closely spaced, v-
shaped erosional features represent small tributary channels. The uppermost portion of
the incised valley system of Sequence 3 was locally eroded during development of the
next sequence boundary (sequence boundary 4).
Sequence 3 Interpretation
Sequence 3 is dominated by fluvial facies. Within the incised-valley fill, a large
meandering channel developed with well-imaged meander scrolls. The meandering
channel increased its sinuosity as base level rose and continued to deposit meander

38
scrolls that were confined within the incised valley. The meandering pattern suggests that
regional gradients were low during deposition and back-filling of the valley, which
commonly happens during the sea level rise of LST to TST time interval (Dalrymple et
al., 1994). Deposits within the valley fill are commonly channel-dominated and consist of
multistory, multilateral channel sandstone bodies. Very minor floodplain facies are
preserved within the valley filling succession. The meandering channel and meander
scroll orientation suggests that paleoflow was west to east.
Above the basal part of the incised-valley fill, laterally continuous, low-amplitude
reflectors overlie the multistory channel sandstone within the valley and may represent
the late TST of Sequence 3 (Figure 26). Up-section, channel sinuosity increases again
with a transition to meandering channels with well-developed meander scrolls. This
meandering channel has a much smaller width compared to the previous channels and
probably represents the late TST to early HST. The small dimensions and high sinuosity
of this channel suggest very low channel gradients and small discharge during
transgressive to early highstand conditions.

39
3km
SW NE
Small tributarychannels feedinginto Incised Valley
High sinuositychannels in
Transgressive -Early Highstand Point Bar
of Incised Valley 4
Meanderingchannels in
Transgressive -Early Highstand
Very high amplitudelowstand Incised
Valley Fill
Small tributarychannels feedinginto Incised Valley
100 ms
200 ms
Figure 26. Seismic facies description of Sequence 3 (Line 5 in figure 1). At the center of the section, prominent erosion by an incised valley is indicated by sudden facies change. The erosional surface is the upper sequence boundary of Sequence 3. Meandering channels is imaged in cross section, in u-shaped reflection. Indication of meandering is seen in time slice. High sinuosity channels are also imaged in cross-section, by u-shaped reflection. Overall seismic facies in Sequence 3 is lower in amplitude, compare to previous sequences.
40
2km
Figure 27. Time slice at 178 milliseconds TWT, showing complex stratal deposition and erosion from HST of sequence 2, erosion by SB 3, dendritic drainage pattern of Sequence 3, deposition of meandering channel in TST of Sequence 3, and erosion by SB 4.

41
Figure 28. The incised valley of Sequence 3, which is filled by a meandering channel is capped and eroded by incised valley of Sequence 4. See text for further details.
42
Erosional relief along sequence boundary 4 (described below) indicates that
significant parts of the Sequence 3 HST may have been eroded. Conversely, the HST of
Sequence 3 not have had enough time to aggrade and prograde, as sea-level fall may have
occurred very rapidly.
Sequence 4
Sequence 4 Description
Sequence 4 consists of the interval from ~120 to ~80 ms TWT, but the sequence
boundary itself has significant relief (Figure 29). Sequence 4 is bounded below by an
incised valley system that comprises sequence boundary 4 (or SB4, red horizon on Figure
30), which is characterized by numerous small tributaries and well-developed dendritic
drainage patterns in floodplain environments adjacent to the main trunk stream along SB4
(Figure 29, 31 and 32). The deepest incision of the valley of SB4 has up to 80 ms of
relief.
The incised valley was filled by a large, 2.3 km wide, meandering river that was
confined to the valley; prominent scroll bars developed on the eastern inside bend of this
major river (figure 31). The valley fill is represented by low-amplitude, lateral accretion
strata that dip westward into the channel (figure 30). East of the valley, small dendritic
drainages eroded the floodplain and drained into the main incised valley. A chute channel
seems to have developed along the eastern side of the incised valley (Figure 30).

43
5 km
N
Figure 29. Three dimensional visualization of sequence boundary 4, which is showing relief that was formed by major incised valley system. The main erosion is oriented NW-SE. The incised valley system is accompanied by low sinuosity channels. Note that small tributary channels are prominent in the floodplain.
In the eastern part of the study area, two low-sinuosity, approximately east-west
oriented, trunk channels appear. At the center of the study area, another, northwest-
southeast oriented, low-sinuosity channel appears. This low-sinuosity channel is in turn,
cross cut by another west-east oriented, low-sinuosity channel.
Part of major incised valley system (with smaller dendritic tributaries that flank it)
is imaged in the southwestern part of the study area, although it is not clear whether this
incised valley is part of SB4. Regardless, this incised valley system also developed good
lateral-accretion strata.
The last channel feature imaged within Sequence 4 is a narrow (<200 m wide)
west to east oriented, meandering channel; minor meander scrolls are apparent in plan

44
view (Figure 31 and Figure 32). Numerous small v-shaped erosional features are found
adjacent to this narrow meandering channel and represent small tributaries to the channel.
Several seismic reflectors (representing ~25 ms) comprise the last deposits of
Sequence 4 and include the present-day sea floor reflector.
Sequence 4 Interpretation
Sequence 4 is bounded below by an incised valley system (sensu Posamentier,
2001). In contrast to the valley fill at the base Sequence 3, basal valley filling deposits of
Sequence 4 have low to moderate amplitude, suggests that the valley fill and underlying
deposits of Sequence 3 have similar acoustic impedance (Figure 30). Small tributaries
that drained into the main incised valley suggest that sea level fell beyond the antecedent
shelf edge. Valley fills with lateral accretion surfaces are interpreted to represent the LST
of Sequence 4.
Point bars within the main valley in the central part of the study area indicate
north-to-south flow, whereas point bars in the poorly preserved valley feature in the
southwestern part of the study area suggest west-to-east flow. The chronostratigraphic
relationships of this poorly preserved valley feature, however, remain unclear.
The low- to moderate-sinuosity channels in the eastern part of study area are
interpreted to have formed at almost the same time as the main incised valley formed.
Thus, these sinuous channels are interpreted to represent the LST to perhaps early TST.
Up-section, the east-west meandering channel that crosses the middle part of
study area probably reflects low regional stream gradients that are characteristic of the
TST.
45
Small incisedtributary channel
feeding intoincised valley
Transgressivehigh sinuosity
channel
Transgressivemeandering
channel
incised tributaryinto incised
valley
small incisedtributary feeding
into incised valleylowstand incised
valley fillSW
100 ms
200 ms
3km
NE
Figure 30. Seismic facies description of Sequence 4 (Line 6 in figure 1). At the center of the section, prominent erosion by the incised valley is indicated by sudden facies change. Contrary to the previous valley fill, this valley fill is low in amplitude. The cross section of the incised valley and meandering channel inside is showing deeper incision in the outer bend of the meander. High sinuosity channels are imaged by u-shaped reflection, with high amplitude facies as the fill.

46
Figure 31. The incised valley of Sequence 4 is wider in up section, having a v-shaped dimension. The valley has a chute channel. Complex tributaries developed in the floodplain. See text for further details of sequence description.

47
2km
Figure 32. Time slice at 130 milliseconds TWT, showing complex stratal deposition and erosion from Sequence 3 to Sequence 4, erosion by SB 4, dendritic drainage pattern of Sequence 4, and also another valley system is seen to the lower-left of the field.

48
CHAPTER VI
DISCUSSION
The complex cross-cutting relationships observed within the Muda Formation at
Belida field show that recognition of sequence stratigraphic relationships within fluvial-
dominated systems requires extremely careful mapping of surfaces within 3D seismic
volumes. Although fluvial depositional and erosional features may be exquisitely imaged
within the 3D seismic volume used for this study, the stratigraphic relationships that can
be interpreted are a function of the degree of preservation of successive stratigraphic
intervals. In the Muda Formation at Belida field, each third-order depositional sequence
documented during this study was strongly influenced by the amount of post-depositional
erosion that occurred during development of the prominent erosional surfaces (i.e., the
overlying sequence boundary) that cap each sequence.
In this section, channel stacking patterns are discussed and their significance for
sequence stratigraphic models is examined.
CHANNEL STACKING PATTERNS
Channel stacking patterns (i.e., the vertical changes in channel morphologies and
dimensions, in both plan and cross-sectional views) within the Muda Formation follow
predictable trends and are apparently related to cycles of base-level change. Cross-line
1450, which extends northwest-southeast across the center of the survey area, illustrates
most of the key stratigraphic relationships that provide the basis for the overall sequence
stratigraphic model presented here (Figure 33).
49
Figure 33. Overall Sequence Stratigraphy model in cross-section, generated from overall time slices and seismic profile interpretations. Seismic section is located in the middle of the field, at cross-line 2450 (Line 7 in figure 1)
50
Numbers inside each channel body on Figure 33 represent the channel’s sinuosity
value, as measured in plan view (Bridge, 2003). Most channels within LSTs of each
depositional sequence have low sinuosity values between 1.2 to 1.5. Most channels
within TSTs have higher sinuosity values, ranging from 1.2 to 3.4. Most channels in
HSTs have low sinuosity values, ranging from 1.1 to 1.3.
General cross-sectional dimensions of channels also vary within each systems
tract. Directly above sequence boundaries, LST channels are deeper and wider. Within
the early to middle TST, channels become narrower and have varied depths. Within
sequence that have well-preserved HSTs (i.e., Pre-Sequence 1 and Sequence 1), channels
seem more poorly connected, which resulted in isolated, low-sinuosity, shoestring sand
bodies (see figure 20).
Channel morphological characteristics (e.g., width, depth, and sinuosity) were
plotted against stratigraphic position above the MFS Base horizon. Channel stacking
patterns were then compared to the sea-level/coastal-onlap curves of Haq et al. (1987)
and Wornardt et al. (2001). The sea-level/coastal-onlap curves were kept to their original
form, although the vertical time scale was adjusted to correlate with known
biostratigraphic datums within the studied interval. The correlated curves show that there
is significant coherency reveal between channel stacking patterns and previously
published sea-level curves, which indicate they are directly related.
Channel-Thickness Stacking Patterns
Channel-thickness trends are shown in Figure 34. Channels are thickest directly
51
above the sequence boundary, and become thinner up-section. Generally, channel
thickness decreases within the LST-TST and reaches some of the smallest thickness
values near the mfs. Within the HST, channel thickness generally increases, reaching
higher values beneath the next sequence boundary. Some scatter in channel-thickness
values within each systems tract could indicate a responses to a number of factors,
including higher order sea-level fluctuations (i.e., fourth and fifth order cycles), short-
term fluctuations in discharge, or channel avulsion events that cannot be resolved within
the available data. Where sequence boundaries are incised valleys (sensu Posamentier,
2001), deep fluvial channels are related to incision, which results from sea-level fall
beyond the antecedent shelf edge. Where sequence boundaries are lowstand alluvial-
channel bypass systems, deep channels are probably related to stream piracy, where large
channels receive more discharge and sediment supply from smaller tributaries in the
updip portion of regional fluvial systems.

52
SB1
SB2
SB3
SB4
420
370
70
120
170
220
270
320
0 10 20 30 40 50 60 70 80 90
Depth (ms)
Stratigraphic Position vs Channel Depth Compare to SL Curves
MFS
2.55 Ma
Depth: 152m
Depth: 172m
Depth: 262m
Depth: 332m
Depth: 374m
Sea FloorDepth: 56m
Recent
1.56 Ma
800 Ka
400 Ka
0 Ma
0.8 Ma
1.6 Ma
2.6 MaSea Level Curve Modified
from Haq et al,1987
Landward
Coastal Onlap modifiedfrom Wornardt et al, 2001
Basinward0 Ma
-50 -1000m50100
2.55
2.09
1.56
1.40
0.8
1.09
1.47
1.59
2.21
2.59
SB?
SB?
0.4
2.0 Ma
1.3 Ma
Figure 34. Stratigraphic position of channels plotted against channel thickness. On the middle is the coastal onlap of Wornardt et al. (2001), and on the right is the sea level curve of Haq et al. (1987). See text for discussion.

53
Channel-Width Stacking Patterns
Channel width versus stratigraphic position is shown in Figure 35. Channels are
widest immediately above each sequence boundary. Where the sequence boundary was
formed by an incised valley system, wide channels are probably related to major
subaerial exposure during sea-level fall. Where the sequence boundary was formed by a
lowstand alluvial bypass system, however, wide channels may be related to stream
piracy, where large channels received more discharge and sediment from smaller
tributaries updip from the study area. Near the inferred maximum flooding surfaces,
channels are narrow. Generally, channel width decreases upsection from the sequence
boundary at the base of each depositional sequence to the maximum flooding surface.
Within the HST, channel width increases (along with channel depth), which probably
reflects both the progressive loss of accommodation during highstand conditions and
maintenance of discharge.

54
Sea Floor
0
500
1000
1500
2000
2500 SB1 SB2 SB3 SB4
420 370 70120170220270320
Stratigraphic Position vs Maximum Channel Width
Stratigraphic Position (ms)MFS Base
Figure 35. Stratigraphic positions plotted against channel width. Channels are wider following the sequence boundary. Bigger dimension of channels are interpreted as bigger trunk channel is receiving water and discharge from smaller tributaries. See text for further discussion.

55
Channel-Sinuosity Stacking Patterns
Figure 36 shows general trends of channel sinuosity within the stratigraphic
framework. Most channels have sinuosity values between 1-1.5. Meandering and
anastomosing channel patterns are possibly related to the mfs (cf. Tornqvist, 1993; Emery
and Myers, 1996). Generalized trends suggest that channel sinuosity increases within the
LST, reaches a maximum near the maximum flooding surface (sinuosity values up to
3.4), and then progressively decreases within the HST until the next sequence boundary.
Low-sinuosity channels may reflect high regional stream gradients during early
lowstand and late highstand conditions. High stream gradients and high discharge cause
low-sinuosity channels to develop. High regional stream gradients were generated as the
entire fluvial system was either retrograding during deposition of the late LST or
prograding during the late HST. High sinuosity to meandering channel patterns of the
TST are probably related to low regional gradients during sea-level rise.

56
Stratigraphic Position vs Channel Sinuosity
0.0
0.5
1.0
1.5
2.0
2.5
3.0
3.5
4.0
Stratigraphic Position (ms)
SB1 SB2 SB3 SB4
420 370 70120170220270320
Figure 36. Stratigraphic positions plotted against channel sinuosity. High sinuosity channels dominate in the transgression phase. Low sinuosity channels are mostly located in the lowstand phase, immediately following sequence boundaries. Highstand phase also has lower sinuosity channels. Red arrows indicate decrease in sinuosity as systems tract approaching upper sequence boundaries. See text for further discussion. (green: 1-1.5; yellow: 1.5-2.0; blue: 2.0-2.5; light blue: 2.5-3.0; brown: 3.0-3.5).
57
SIGNIFICANCE OF CHANNEL STACKING PATTERNS
The channel stacking patterns within the Muda Formation follow trends suggested
or inferred by previous sequence stratigraphic models for fluvial-deltaic systems (cf.
Shanley and McCabe, 1993; Posamentier 2001; Emery and Myers, 1996; Tornqvist,
1993). Perhaps what is most interesting, however, is that these channel stacking patterns
are expressed in paleogeographic areas that were located far updip from the margins of
the Sunda Shelf during deposition of the Muda Formation. Regional seismic profiles in
our possession (i.e., TGS-Nopec SEAS-95 Survey) extend across all of the West Natuna
Basin and eastward to the present-day margin of the Sunda Shelf, which is located in the
East Natuna and Nam Con Son basins (~110º longitude). Examination of upper Pliocene-
Recent strata within these uninterrupted, laterally continuous, east-west oriented, seismic
profiles shows that fluvial facies dominate the Muda Formation until the present-day
shelf edge is reached. In addition, the thickness of the Muda Formation and its lateral
stratigraphic equivalents vary little across nearly all of the Sunda Shelf (cf. Murray,
2003).
In other words, the entire Sunda Shelf appears to have been fully aggraded and
was remarkably flat throughout late Pliocene to Recent time. This means that large
regions of the Sunda Shelf, perhaps extending for distances of 1000 km or more, were
responding very rapidly and essentially synchronously to base-level changes.
IMPLICATIONS FOR RESERVOIR MODELING
Three-dimensional seismic geomorphology had been proved to be a powerful tool
to understand reservoir internal architecture and predict fluid flow in reservoir modeling
58
(e.g. Carter, 2003; Maynard and Murray, 2003). Our fluvial sequence stratigraphy model
in figure 33 suggests that reservoir facies is likely the fluvial facies (yellow) and incised
valleys fill (orange). In agreement to Miall (2002), lowstand meandering and braided
rivers provide the greatest volume of potential porous reservoir, with the assumption that
whole channel belt consists of sand (cf. Reynolds, 1999). Moreover, lowstand channels
are often laterally amalgamated, possibly providing connections between sand bodies.
Transgressive meandering channels are smaller in dimension than lowstand channels.
Low sinuosity channels in highstand, which are possibly braided, are also smaller
compare to LST channels. Moreover, highstand channels are possibly not well-preserved,
if upper sequence boundary incise too deep and rework most of the Highstand Systems
Tract. From an exploration perspective, further analysis of sandstone body distributions,
sandstone body interconnections, and porosity and permeability relationship would
possibly help the process of reservoir description (Galloway, 1998).

59
CHAPTER VII
CONCLUSIONS
1. This study is among the first studies of alluvial sequence stratigraphy based on
three dimensional seismic data.
2. The Upper Pliocene-recent evolution of Belida Field is interpreted to consist of
five third-order sequences.
3. It is suggested that the changes in fluvial stacking pattern are likely to be caused
by eustatic sea-level change. Published information stated that the study area is
undergoing regional slow subsidence only, without any significant tectonic
control to the Upper Pliocene-Recent strata of Muda Formation. Interpretation is
not constrained by climate, since no detail climate information available. No
autocyclic control had been incorporated in the interpretation process, since it is
impossible to do so with seismic data only.
4. Channel-stacking patterns indicate that:
a. Immediately above sequence boundaries, channels are deepest. Near the
mfs, channels are shallow. Generally, within LST-TST channel depth is
decreasing and within HST channel depth is increasing, with fluctuations
inside each system tract, possibly reflecting higher-order sea level changes
or response to autocyclic processes.
b. Immediately above sequence boundaries, channels are widest.
Approximately near mfs, channels are less wide. In the LST-TST, channel
width generally decrease. During HST channels width generally increase,
60
with fluctuations possibly representing response to autocyclic process,
higher-order (fourth-fifth order) sea level changes or climate effects.
c. Low sinuosity channels, are mostly located within directly above the
sequence boundary, with the exception of meandering channel evolving
inside incised valley. High sinuosity channels are observed within
transgressive phase, climaxing in the mfs. Channels located within the
HST mostly have low-sinuosity values.
5. Seismic attributes that particularly used in this study, which are RMS Amplitude
and Average Reflection Strength, are proved to be able to improve the image of
depositional feature from interpreted structure.
6. The sequence stratigraphy model of fluvial setting, resulted from application of
Sequence Stratigraphy techniques to interpretation of seismic data of a fluvial
setting, could yield a better prediction of sandy and shaly facies, which eventually
may lead to a better reservoir geometry modeling, and a better prediction of
porosity and permeability distribution.

61
REFERENCES CITED
Blum, M.D., and T.E. Tornqvist, 2000, Fluvial responses to climate and sea level change:
a review and look forward: Sedimentology, v. 47, p. 2-48.
Bridge, J.S., 2003, Rivers and floodplains, forms, processes, and sedimentary records:
Oxford, Blackwell Science, 416 p.
Cant, D. J., 1992, Subsurface facies analysis in R. G. Walker, C.K. Wilgus, B.S.
Hastings, C.G.St.C. Kendall, H.W. Posamentier, C.A. Ross, J. Van Wagoner, eds.,
Sea-Level Changes-An Integrated Approach: SEPM Special Publication 42, p. 109-
124.
Carter, D.C., 2003, 3-D seismic geomorphology: insights into fluvial reservoir deposition
and performance, Widuri Field, Java Sea: APPG Bulletin, v. 87, p. 909-934.
Collinson, J.D., 1996, Alluvial sediments in H.G. Reading, eds., Sedimentary
environments: processes, facies, and stratigraphy: Oxford, Blackwell Science, p. 37-
82.
ConocoPhillips Indonesia internal company report, 2002, West Natuna Basin standard
stratigraphy.
Cossey, S.P.J., W.T. Valenta, F. Payot, and T.T. Ho, 1982, Seismic hydrocarbon
indicators in the South China Sea: geological and geophysical aspects: Proceeedings
of the Indonesian Petroleum Association 11th Annual Convention, v. 1, p. 335-355.
Daines, S.R., 1985, Structural history of the West Natuna Basin and the tectonic
evolution of the Sunda region: Proceedings of the Indonesian Petroleum Association
14th Annual Convention, p. 39-61.

62
Dalrymple, R. W., R. Boyd, and B. A. Zaitlin, 1994, History of research, types, and
internal organization of incised-valley systems: introduction to the volume in R. W.
Dalrymple, R. Boyd, and B. A. Zaitlin, eds., Incised-valley systems: origin and
sedimentary sequences: SEPM Special Publication 51, p. 3-10.
Emery, D., and K.J. Myers, 1996, Sequence stratigraphy: Oxford, Blackwell Science, 297
p.
Galloway, W.E, 1998, Clastic depositional systems and sequences: application to
reservoir prediction, delineation, and characterization: The Leading Edge, v.17, p.
173-180.
Ginger, D.C., W.O. Ardjakusumah, R.J. Hedley, and J. Pothecary, 1993, Inversion
history of the West Natuna Basin: examples from the cumi-cumi PSC: Proceedings of
the Indonesian Petroleum Association 22th Annual Convention, p. 635-658.
Hanebuth, T.J, and K. Statteger, 2003, The stratigraphic evolution of the Sunda Shelf
during the past fifty thousand years, in F.H. Sidi, D. Nummedal, P. Imbert, and H.
Darman, eds., Tropical deltas of Southeast Asia; sedimentology, stratigraphy, and
petroleum geology: SEPM Special Publications 76, p. 189-200.
Haq, B.U., J. Hardenbol, and P.R. Vail, 1987, Chronology of fluctuating sea levels since
the Triassic: Science, v. 235, p. 1156-1167.
Legarreta, L., and M.A., Uliana, 1998, Anatomy of hinterland depositional sequences:
Upper Cretaceous fluvial strata, Neuquen basin, West-Central Argentina, in K.W.,
Shanley, and P.J. McCabe, eds., Relative role of eustasy, climate, and tectonism in
continental rocks: SEPM Special Publications 59, p. 83-92.
63
Madon, M.B., and A.B. Watts, 1998, Gravity anomalies, subsidence history and the
tectonic evolution of the Malay and Penyu basins (offshore Peninsula Malaysia):
Basin Research, v. 10, p. 375-392.
Martinsen, O.J., A. Ryseth, H.W. Helland, H. Flesche, G. Torkildsen, and S. Idil, 1999,
Stratigraphic base level and fluvial architecture: Ericson Sandstone (Campanian),
Rock Springs Uplift, SW Wyoming, USA: Sedimentology, v. 46, p. 235-259.
Mattes, E.M., 1979, Udang Field: a new Indonesian development: Proceedings of the
Indonesian Petroleum Association 8th Annual Convention, p. 177-184.
Matthews, S.J., A.J. Fraser, S. Lowe, S.P. Todd, and F.J. Peel, 1997, Structure,
stratigraphy and petroleum geology of the SE Nam Con Son Basin, offshore Vietnam,
in A.J. Fraser, S.J. Matthews, and R.W. Murphy, eds., Petroleum geology of
Southeast Asia: Geological Society Special Publications, p. 89-106.
Mayall, M.J., A. Bent., and D.M. Roberts, 1995, Miocene carbonate buildups in the Nam
Con Son Basin, offshore socialist Republic of Vietnam: AAPG Bulletin, v. 8, p.
1234-1235.
Maynard, K., W. Prabowo, J. Gunawan, C. Ways, and R. Brotherton, 2003, Maximising
the value of a mature asset, The Belida Field, West Natuna – can a detailed
subsurface re-evaluation really add value late in field life?: Proceedings of the
Indonesian Petroleum Association 29th Annual Convention and Exhibition, v. 2, p.
291-305.

64
Maynard, K., and I. Murray, 2003, One million years from the upper arang formation,
West Natuna Basin, implications for reservoir distribution and facies variation in
fluvial deltaic deposits: Proceedings of the Indonesian Petroleum Association 29th
Annual Convention and Exhibition, v.1, p. 270-276.
McClay, K. and M. Bonora, 1998, Tectonic evolution of Sunda Shelf and the West Natun
Basin, Indonesia, Part A: regional overview: Final Report presented to Conoco
Indonesia Inc., 57 p.
Miall, A.D., 1992, Alluvial deposits, in R., G. Walker, and N., P. James, eds., Facies
models response to sea level change: Waterloo, Geological Association of Canada, p.
119-142.
Miall, A.D., 2002, Architecture and sequence stratigraphy of Pleistocene fluvial systems
in the Malay Basin, based on seismic time slices snalysis: AAPG Bulletin, v. 86, p.
1201-1216.
Michael E., and H. Adrian, 1996, The petroleum system of West Block B PSC, South
Natuna Sea, Indonesia: Proceedings of the Indonesian Petroleum Association 25th
Annual Convention and Exhibition, v.1, p. 465-479.
Morley, R.J., H.P. Morley, and P. Restrepo-Pace, 2003, Unravelling the tectonically
controlled stratigraphy of the West Natuna Basin by means of palaeo-derived mid
Tertiary climate changes: Proceedings of the Indonesian Petroleum Association 29th
Annual Convention, v.1, p. 561-584.
Mulholland, J.W., 1998, Sequence architecture: The Leading Edge, v.17, p. 767-771.
65
Murray, M.R., 2003, Regional tectonics, differential subsidence, and sediment dispersal
patterns: implications for sediment flux to the southern South China Sea and regional
filling of sedimentary basins during Pliocene to recent time: Master’s thesis, Texas
A&M University, 120 p.
Olsen, T., R. Steel, K. Hogseth, T. Skar, and S. Roe, 1995, Sequential architecture in a
fluvial succession: sequence stratigraphy in upper Cretaceous mesaverde group, Price
Canyon, Utah: Journal of Sedimentary Research, v. B65, p. 265-280.
Olson, C.C., and S.L. Dorobek, 2000, Styles and significance of structural inversion
across the Nam Con Son Basin, offshore SE Vietnam: American Association of
Petroleum Geologists Annual Meeting Expanded Abstract, p. 109.
Palynova, 2003, Sequence characterisation and fingerprinting: Jakarta, Indonesia,
ConocoPhillips Internal Company Report, 120 p.
Phillips, S., L. Little, E. Michael, and V. Odell, 1997, Sequence stratigraphy of Tertiary
petroleum systems in the West Natuna Basin, Indonesia: Proceedings of the
Petroleum Systems of SE Asia and Australasia Conference Indonesian Petroleum
Association, p. 381-390.
Plint, A.G., P.J. McCarthy, and U.F. Faccini, 2001, Nonmarine sequence stratigraphy:
updip expression of sequence boundaries and systems tract in a high resolution
framework, Cenomanian Dunvegan Formation, Alberta Foreland Basin, Canada:
AAPG Bulletin, v. 86, p. 1967-2001.
Pollock, R.E., J.B. Hayes, K.P. Williams, and R.A. Young, 1984, The petroleum geology
of the KH Field, Kakap, Indonesia: Proceedings of the Indonesian Petroleum
Association 13th Annual Convention, v.1, p. 407-423.
66
Posamentier, H.W., 2001, Lowstand alluvial bypass systems: incised vs. unincised:
AAPG Bulletin, v. 85, p. 1771-1793.
Posamentier, H.W., and G.P. Allen, 1993, Variability of the sequence stratigraphic
models: effects of local basin factors: Sedimentary Geology, v. 86, p. 91-109.
Posamentier, H.W., M.T. Jervey, and P.R. Vail, 1988, Eustatic controls on clastic
deposition I - conceptual framework, in C. K. Wilgus, B. J. Hastings, H.W.
Posamentier, J. C. Van Wagoner, C. A. Ross and C. G. St. C. Kendall, eds., Sea-level
change - an integrated approach: SEPM Special Publication 42, p. 109-124.
Posamentier, H. W. and P. R. Vail, 1988, Eustatic controls on clastic deposition II -
sequence and systems tract models, in C. K. Wilgus, B. J. Hastings, H.W.
Posamentier, J. C. Van Wagoner, C. A. Ross and C. G. St. C. Kendall, eds., Sea-level
change - an integrated approach: SEPM Special Publication 42, p. 125-154
Reading, H.G., and J.D. Collinson, 1996, Clastic coasts, in H.G. Reading, ed.,
Sedimentary environments: processes, facies, and stratigraphy: Oxford, Blackwell
Science, p. 154-231.
Reading, H.G., and B.K. Levell, 1996, Controls on the sedimentary rock records, in H.G.
Reading, ed., Sedimentary environments: processes, facies, and stratigraphy: Oxford,
Blackwell Science, p. 5-36.
Reynolds, A.D., 1999, Dimensions of paralic sandstone bodies: AAPG Bulletin, v. 83, p.
211-229.
Schumm, S.A., 1993, River response to baselevel change: implications for sequence
stratigraphy: The Journal of Geology, v. 101, p. 279-294.
67
Shanley, K.W., and P.J. McCabe, 1991, Predicting facies architecture through sequence
stratigraphy – an example from the Kaiparowits Plateau, Utah: Geology, v. 19, p.
742-745.
Shanley, K.W., and P.J. McCabe, 1993, Alluvial architecture in a sequence stratigraphic
framework; a case history from the Upper Cretaceous of southern Utah, USA, in S.S.
Flint, and A.D. Bryant, eds., The geological modelling of hydrocarbon reservoirs and
outcrop analogues: Special Publication of the International Association of
Sedimentologists, p. 21-55.
Shanley, K.W., and P.J. McCabe, 1994, Perspectives on the sequence stratigraphy of
continental strata: AAPG Bulletin, v. 78, p. 544-568.
Shanley, K.W., P.J. McCabe, and R.D. Hettinger, 1992, Tidal influence in Cretaceous
fluvial strata from Utah, USA: a key to sequence stratigraphic interpretation:
Sedimentology, v. 39, p. 905-930.
Somoza, L., A. Barnolas, A. Arasa, A. Maestro, J.G. Rees, and F.J. Hernandez-Molina,
1998, Architectural stacking patterns of the Ebro delta controlled by Holocene high-
frequency eustatic fluctuations, delta-lobe switching and subsidence processes:
Sedimentary Geology, v. 117, p.11-32.
Sutoto A, 1991, Reservoir geology of the Belida Field South Natuna Sea, Block B. The
petroleum system of West Block B PSC, South Natuna Sea, Indonesia: Proceedings
of the Indonesian Petroleum Association 25th Annual Convention and Exhibition, v.1,
p.453-478.
Tjia, H.D., 1980, The sunda shelf, Southeast Asia: Annals of Geomorphology, v. 4, p.
405-427.

68
Tornqvist, T.E., 1993, Holocene alternating of meandering and anastomosing fluvial
system in Rhine-Meuse delta (central Netherlands) controlled by sea level rise and
subsoil erodibility: Journal of Sedimentary Petrology, v. 63, p. 683-693.
Van Wagoner, J.C., R.M. Mitchum, H.W. Posamentier, and P.R.Vail, 1987, Seismic
stratigraphy interpretation using sequence stratigraphy, Part 2: key definitions of
sequence stratigraphy, in A.W. Bally, ed., Atlas of seismic stratigraphy: AAPG
Studies in Geology 27, p. 11-14.
Van Wagoner, J.C., R.M. Mitchum, K.M.Campion, and V.D. Rahmanian, 1990,
Siliciclastic sequence stratigraphy in well logs, cores, and outcrops: concepts for
high-resolution correlation of time and facies: APPG Methods in Exploration Series
7, 55 p.
Wescott, W.A., 1993, Geomorphic thresholds and complex response of fluvial systems –
some implications for sequence stratigraphy: AAPG Bulletin, v. 77, p. 1208-1218.
White JR., J.M., and R.S. Wing, 1978, Structural development of the South China Sea
with particular reference to Indonesia: Proceedings of the Indonesian Petroleum
Association 7th Annual Convention, p. 159-177.
Wongsosantiko, A., and G.K. Wirojudo, 1984, Tertiary tectonic evolution and related
hydrocarbon potential in the Natuna Area: Proceedings of the Indonesian Petroleum
Association 13th Annual Convention, v.1, p. 161-183.
Wornardt, W.W., B. Shaffer, and P.R. Vail, 2001, Revision of the late Miocene, Pliocene
and Pleistocene sequence cycles: Gulf Coast Association of Geological Societies
Transactions, v. L1, p. 477-482.

69
Wright, V.P., and S.B. Marriott, 1993, The sequence stratigraphy of fluvial depositional
systems: the role of floodplain sediment storage: Sedimentary Geology, v. 86, p. 203-
210.
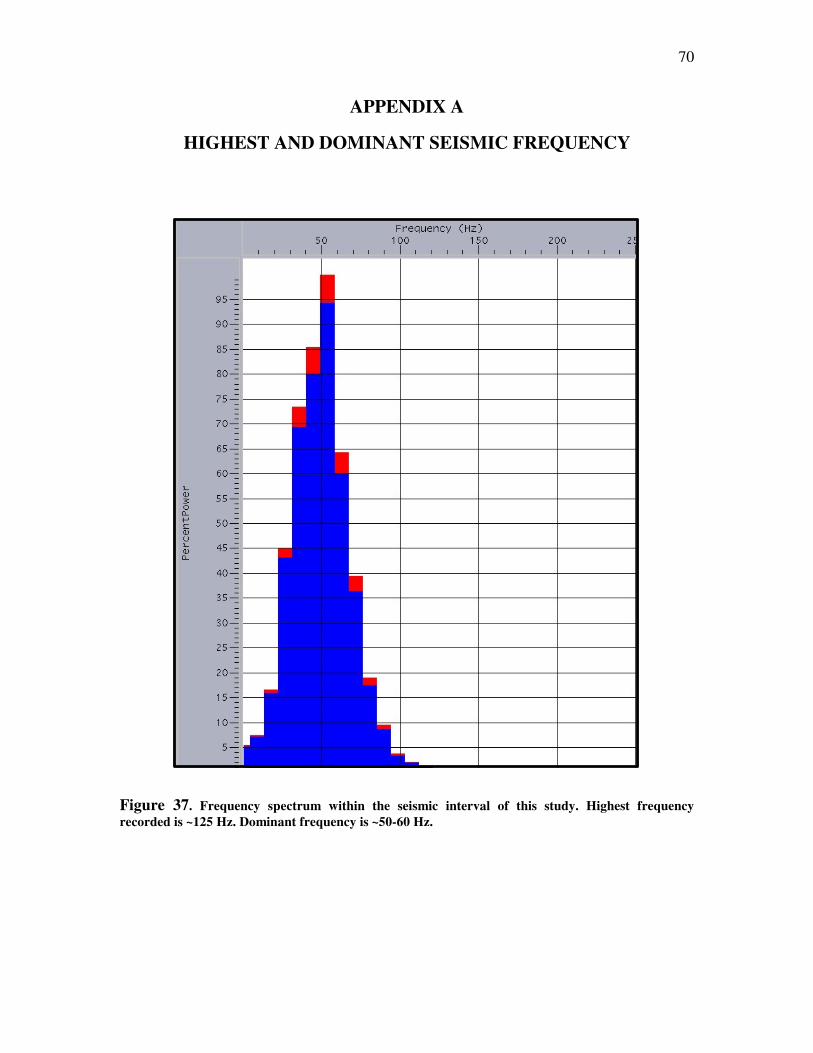
70
APPENDIX A
HIGHEST AND DOMINANT SEISMIC FREQUENCY
Figure 37. Frequency spectrum within the seismic interval of this study. Highest frequency recorded is ~125 Hz. Dominant frequency is ~50-60 Hz.

71
APPENDIX B
VELOCITY INFORMATION
BG-02/HZ
BB-19
BA-22
BELIDA EAST-1
1500 1600 1700 1800 1900 2000 21000
100
200
300
400
500
600
Vint (m/s)
Velocity Information
MFS
Figure 38. The velocity data used for time-depth conversion, plotted against two way time. Velocity of the study interval is in the range of 1500 m/s to 2100 m/s. Velocity model is built from four time-depth data (checkshot / VSP). The high velocity in the lower part is possibly due to accumulation of marine shale in the northeastern part of the field, as it is indicated by the well (Belida East 1) location. Marine shale is interpreted to have higher velocity than fluvial sands in other part of study area.

72
APPENDIX C
CHANNEL SINUOSITY
Figure 39. The method used in this study to measure sinuosity of channels (after Bridge, 2003)
73
VITA
Name: Yan Darmadi Address: JL. M. Kafi II 10 Rt 08/08 Srengseng Sawah Jagakarsa Jakarta Indonesia 12640 Email Address: [email protected] Education: B.S., Physics, The University of Indonesia, 2002 M.S., Geophysics, Texas A&M University, 2005