Embed Size (px)
Citation preview
The Future of Nigeria:Three critical levers for improving HDI
www.pwc.com/ng

The Future of Nigeria: Three critical levers for improving HDI 2
Executive summary
Content
Why HDI?
Three critical levers affecting HDI
Performance across the three levers
Potential in 2030
AppendixCountry Case Studies
Bibliography
3
5
8
11
14
16
19
With GDP in market exchange rate (MER) terms improved to enable Nigeria reach its socio-1at $490 billion in 2015 , Nigeria ranked as economic targets which we measure by a high
Africa's largest economy and could be the 9th human development status. These levers are:2largest global economy by 2050 according to
?Improving the ease of doing businessPwC estimates. Prior to the recent decline in the ?Enhancing labour productivity price of crude oil, Nigeria enjoyed strong ?Reducing the overall level of corruption economic growth at a CAGR of 5.3%, post-
3 perceptionrebasing . However, this growth did not translate into social development as high poverty and
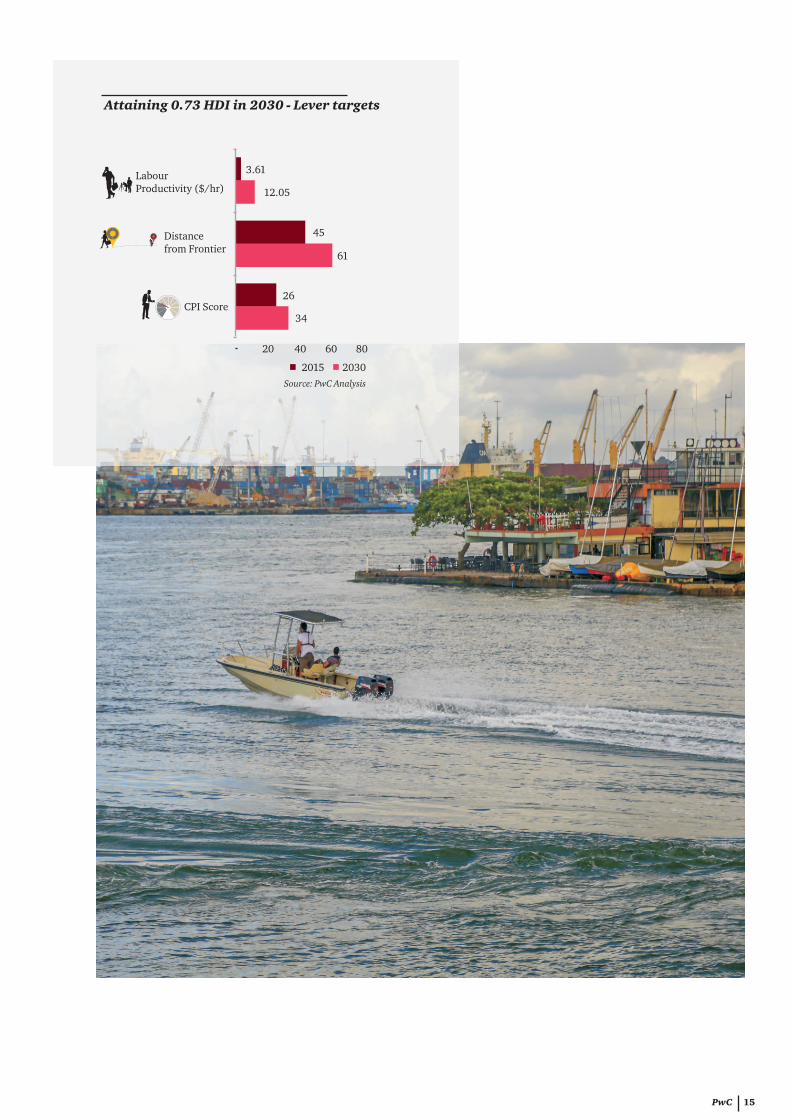
Thus, we conclude that progress across these inequality levels persist. three levers could result in a significant improvement in Nigeria's HDI score, reaching Our previous report, which estimates the impact 0.73 (2014: 0.51), thereby attaining a “high of corruption on the Nigerian economy, identifies
6 human development” status by 2030. a low standard of living and widening inequality Specifically, we target Nigeria improves:as some of the mechanisms through which
corruption impacts the economy. In addition, ?Ease of doing business ranking through a based on a GDP projection of $1.45 trillion in
74 higher Distance to Frontier (DTF) score of 61 2030 , the report estimates that Nigeria's GDP in 2030 (2015: 45)could be $530 billion higher if corruption is
5?Labour productivity to $12.05/hr in 2030 reduced to levels comparable to Malaysia . Thus, (2015: $3.61/hr)effective policies aimed at reducing corruption ?CPI score to 34 in 2030 (2015: 26)will be critical to achieving Nigeria's GDP
potential.Translating economic growth into real improvements in the lives of the average citizen However, tposes a real challenge for policy makers. Tracking policies should be guided not only by progress across these levers has the potential to improvements in GDP but also a broader boost the attention on HDI as a priority on the measure of development for which we use the public agenda. An analysis of these three levers Human Development Index (HDI). Whilst the can identify areas requiring policy attention and HDI is a composite measure of development specific strategies targeted at improving overall based on an assessment of education, life well-being can be formulated. PwC will expectancy and income per capita indicators, this commence the publication of annual research draws on a more direct and measurable monitoring reports on the performance of approach to tracking improvements in human these three identified levers with policy development. Using quantitative analysis, suggestions for each category.academic reviews and country case studies, we
identify three critical levers that need to be
his report argues that national
Executive summary
1. 2015 IMF World Economic Outlook 2. PwC Estimates 3. CAGR, 2010-2014 4. PwC analysis based on two potential annual growth rates of 5% and 7% (upper limit) to 2030. 5. PwC Estimates using PwC World in 2050 macroeconomic model. 6. Please see appendix for country classifications 7. The Ease of Doing Business ranking is derived from the overall distance to frontier (DTF), which illustrates how far a country is from the best practice observed on each doing business topic across all countries. For example, in the starting a business section, each of the component (number of procedures, time, cost and minimum capital) is measured against the global best and worst using a normalisation methodology and converted into a score out of 100. Once the component scores are calculated, the group DTF is then a simple average of the component DTFs, and the economy DTF, an average of the group DTFs.
PwC 3

Ease of Doing Business
45 61
2015 2030
Labour Productivity
DTFScore
DTFScore
CPI Score
2015 2030
3426
$3.61/hr $12.05/hr
2015 2030
Human Development Index
The Future of Nigeria: Three critical levers for improving HDI 4
Progress across the three levers below could result in a significant improvement in Nigeria's HDI score, reaching 0.73, thereby attaining a “high human development” status by 2030
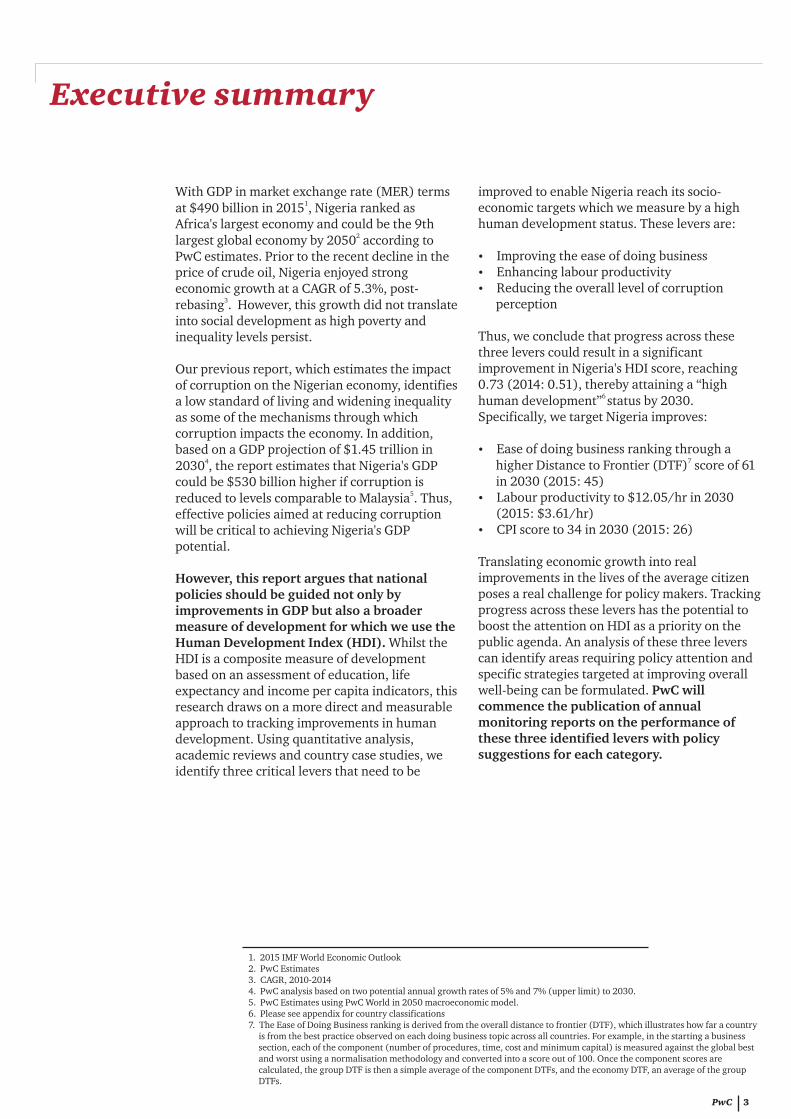
Despite strong economic growth at of the labour force. Though 8a CAGR of 5.3% post-rebasing, growth in the Nigerian economy
Nigeria has been plagued with the has been driven by more labour-jobless growth phenomenon as intensive sectors such as employment growth has only agriculture and services, income averaged 1.3%. However, growth opportunities have been limited has not been broad based with due to low productivity levels persistent incidences of high and thus has not resulted in poverty, unemployment and improved living standards for underemployment. Official Nigeria's growing population, unemployment rose from 6.0% in hence, the need for 2011 to 8.2% in 2015, with a developmental measures beyond growing number of youths GDP.massively underemployed at 18.3%
Why the Human Development Index (HDI)
Nigeria’s Jobless Growth
PwC 5
Source: NBS, CBN, PwC Analysis
8. Market Exchange Rate (MER)
5 % 4 %
5 %
6 %
3 %
(0%)
(2%)
7%
3%
(2%)
(3%)
(2%)
(1%)
0%
1%
2%
3%
4%
5%
6%
7%
8%
2011 2012 2013 2014 2015
Real GDP Growth Growth in Employment
0.00
0.10
0.20
0.30
0.40
0.50
0.60
0.70
0.80
0.90
1.00
1995 2000 2005 2010 2014
Nigeria SSA BRICS OECD World
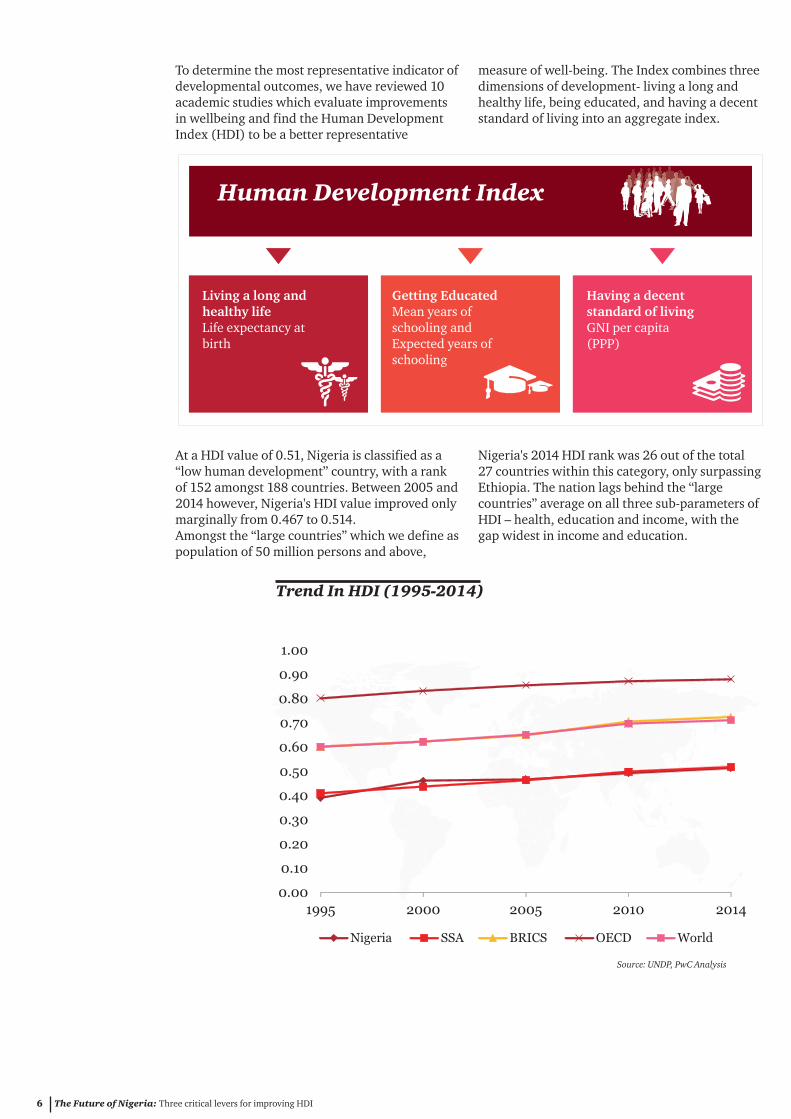
At a HDI value of 0.51, Nigeria is classified as a Nigeria's 2014 HDI rank was 26 out of the total “low human development” country, with a rank 27 countries within this category, only surpassing of 152 amongst 188 countries. Between 2005 and Ethiopia. The nation lags behind the “large 2014 however, Nigeria's HDI value improved only countries” average on all three sub-parameters of marginally from 0.467 to 0.514. HDI – health, education and income, with the Amongst the “large countries” which we define as gap widest in income and education.population of 50 million persons and above,
To determine the most representative indicator of measure of well-being. The Index combines three developmental outcomes, we have reviewed 10 dimensions of development- living a long and academic studies which evaluate improvements healthy life, being educated, and having a decent in wellbeing and find the Human Development standard of living into an aggregate index. Index (HDI) to be a better representative
Human Development Index
Living a long and healthy lifeLife expectancy at birth
The Future of Nigeria: Three critical levers for improving HDI 6
Source: UNDP, PwC Analysis
Trend In HDI (1995-2014)
Getting Educated Mean years of schooling and Expected years of schooling
Having a decent standard of living GNI per capita (PPP)
PwC 7
To determine the critical levers required to enable Nigeria reach its HDI target, we drew on two methods:
Three critical levers affecting HDI
? Economic literature ? Quantitative modelling: review: We conducted a We ran a cross-country review of the economic regression (using 43 high
9 academic on the determinants income countries ) of the HDI of inclusive growth. These on the key drivers of inclusive studies use dataset comprising growth identified in the of a large number of countries, literature review so as to including Nigeria, therefore establish significant making the results robust and relationships peculiar to high applicable. income countries.
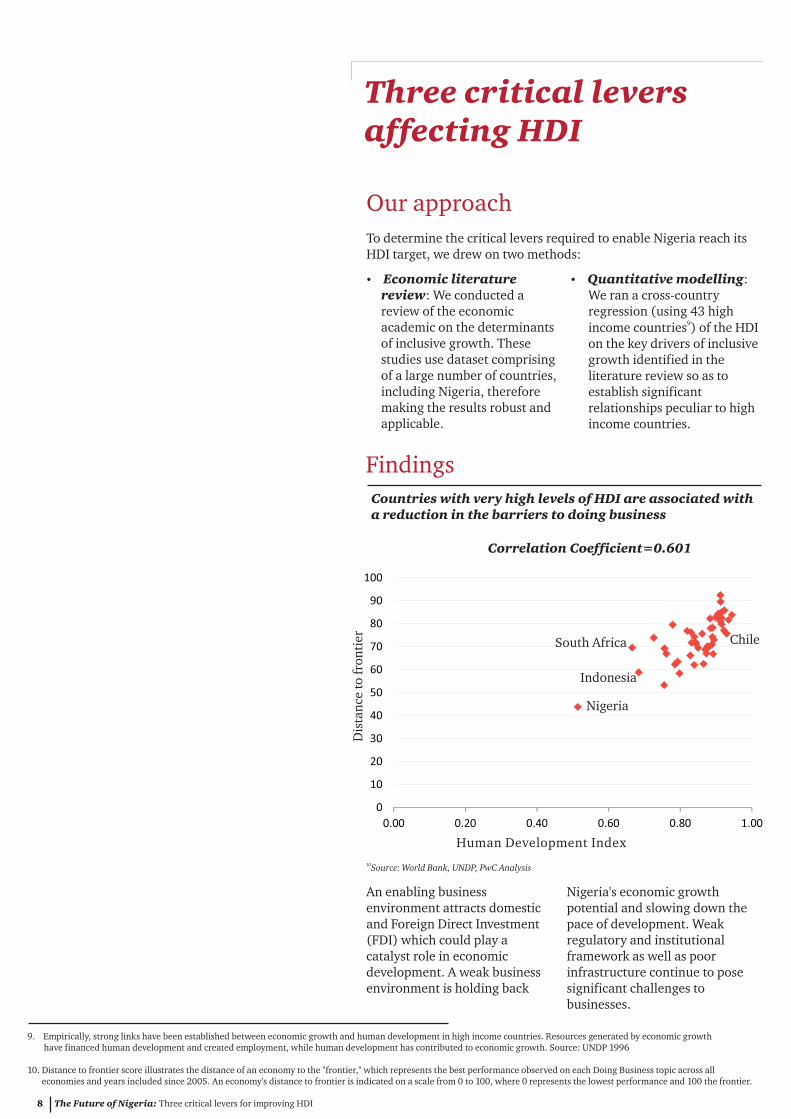
Countries with very high levels of HDI are associated with a reduction in the barriers to doing business
Our approach
Findings
Nigeria
Indonesia
South Africa Chile
Correlation Coefficient=0.601
Dis
tan
ce t
o f
ron
tier
Human Development Index
The Future of Nigeria: Three critical levers for improving HDI 8
10Source: World Bank, UNDP, PwC Analysis
9. Empirically, strong links have been established between economic growth and human development in high income countries. Resources generated by economic growth have financed human development and created employment, while human development has contributed to economic growth. Source: UNDP 1996
10. Distance to frontier score illustrates the distance of an economy to the "frontier," which represents the best performance observed on each Doing Business topic across all economies and years included since 2005. An economy's distance to frontier is indicated on a scale from 0 to 100, where 0 represents the lowest performance and 100 the frontier.
An enabling business Nigeria's economic growth environment attracts domestic potential and slowing down the and Foreign Direct Investment pace of development. Weak (FDI) which could play a regulatory and institutional catalyst role in economic framework as well as poor development. A weak business infrastructure continue to pose environment is holding back significant challenges to
businesses.
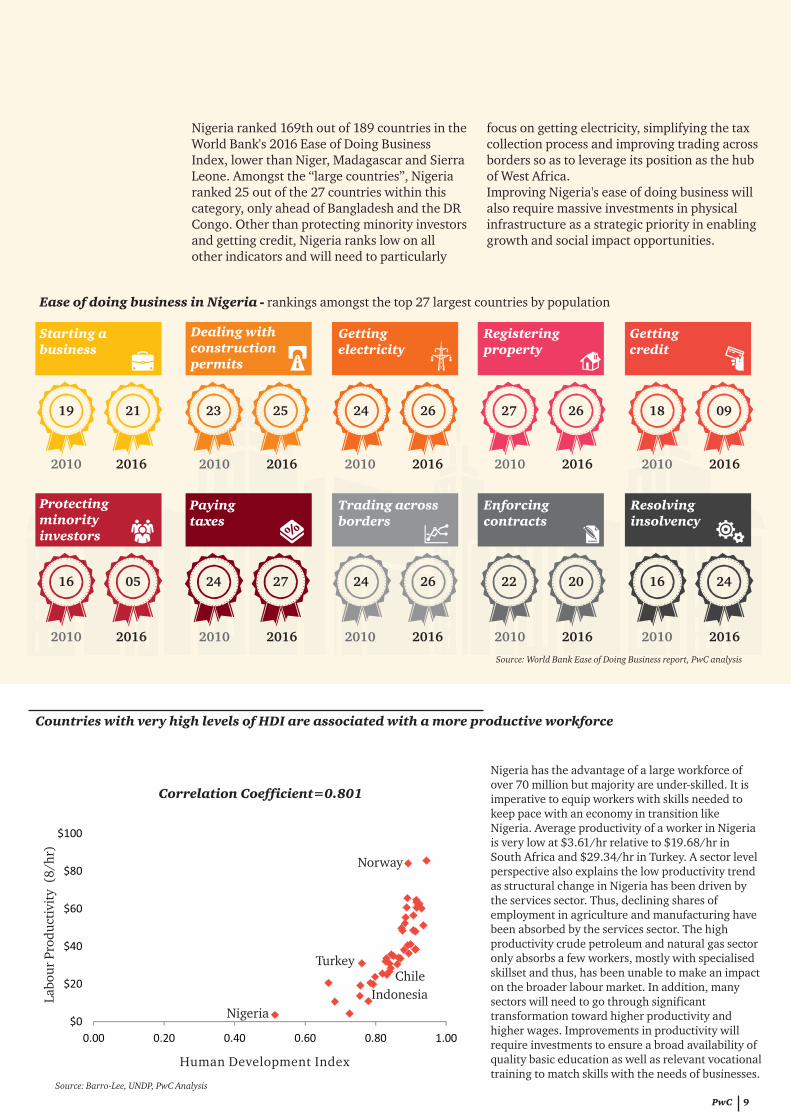
Nigeria ranked 169th out of 189 countries in the focus on getting electricity, simplifying the tax World Bank's 2016 Ease of Doing Business collection process and improving trading across Index, lower than Niger, Madagascar and Sierra borders so as to leverage its position as the hub Leone. Amongst the “large countries”, Nigeria of West Africa.ranked 25 out of the 27 countries within this Improving Nigeria's ease of doing business will category, only ahead of Bangladesh and the DR also require massive investments in physical Congo. Other than protecting minority investors infrastructure as a strategic priority in enabling and getting credit, Nigeria ranks low on all growth and social impact opportunities. other indicators and will need to particularly
Countries with very high levels of HDI are associated with a more productive workforce
2010 2016 2010 2016 2010 2016 2010 2016 2010 2016
2010 2016 2010 2016 2010 2016 2010 2016 2010 2016
Starting a business
Dealing with construction permits
Getting electricity
Registering property
Getting credit
Protecting minority investors
Paying taxes
Trading across borders
Enforcing contracts
Resolving insolvency
19 21 23 25 24 26 27 26 18 09
16 05 24 27 24 26 22 20 16 24
Norway
TurkeyChile
Nigeria
Indonesia
Correlation Coefficient=0.801
La
bo
ur
Pro
du
ctiv
ity
(8
/hr)
Human Development Index
PwC 9
Source: Barro-Lee, UNDP, PwC Analysis
Ease of doing business in Nigeria - rankings amongst the top 27 largest countries by population
Nigeria has the advantage of a large workforce of over 70 million but majority are under-skilled. It is imperative to equip workers with skills needed to keep pace with an economy in transition like Nigeria. Average productivity of a worker in Nigeria is very low at $3.61/hr relative to $19.68/hr in South Africa and $29.34/hr in Turkey. A sector level perspective also explains the low productivity trend as structural change in Nigeria has been driven by the services sector. Thus, declining shares of employment in agriculture and manufacturing have been absorbed by the services sector. The high productivity crude petroleum and natural gas sector only absorbs a few workers, mostly with specialised skillset and thus, has been unable to make an impact on the broader labour market. In addition, many sectors will need to go through significant transformation toward higher productivity and higher wages. Improvements in productivity will require investments to ensure a broad availability of quality basic education as well as relevant vocational training to match skills with the needs of businesses.
Source: World Bank Ease of Doing Business report, PwC analysis
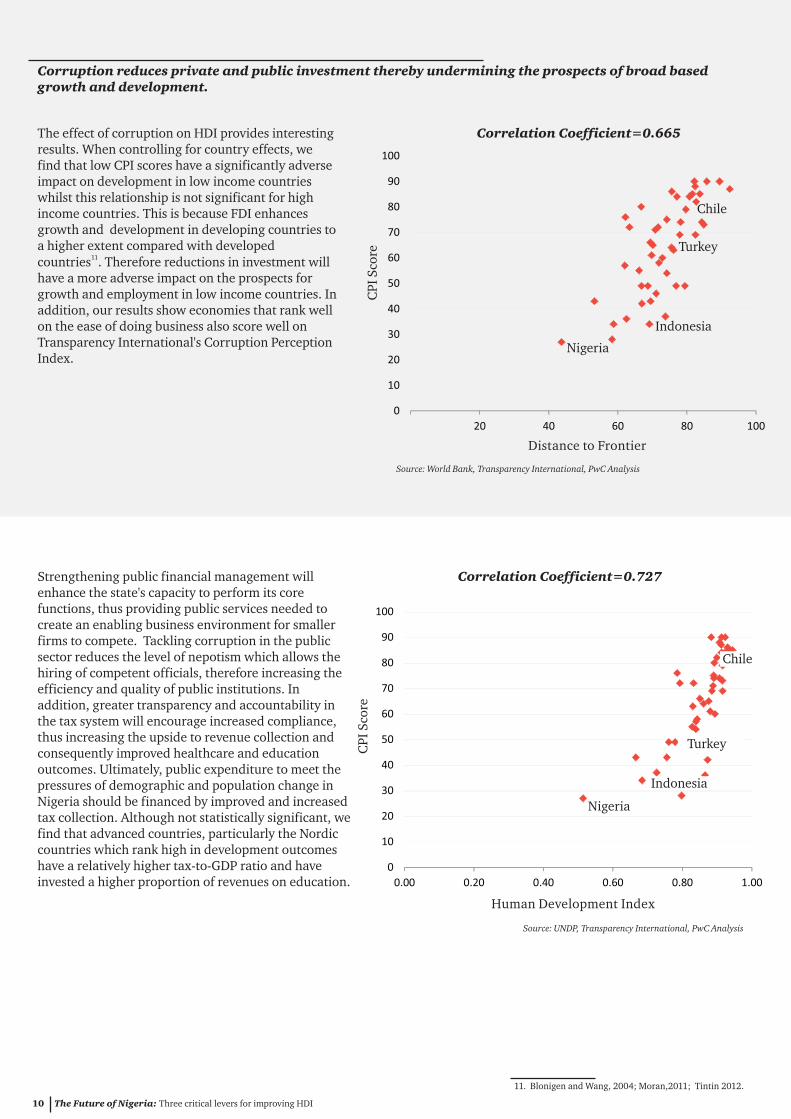
The effect of corruption on HDI provides interesting results. When controlling for country effects, we find that low CPI scores have a significantly adverse impact on development in low income countries whilst this relationship is not significant for high income countries. This is because FDI enhances growth and development in developing countries to a higher extent compared with developed
11countries . Therefore reductions in investment will have a more adverse impact on the prospects for growth and employment in low income countries. In addition, our results show economies that rank well on the ease of doing business also score well on Transparency International's Corruption Perception Index.
Strengthening public financial management will enhance the state's capacity to perform its core functions, thus providing public services needed to create an enabling business environment for smaller firms to compete. Tackling corruption in the public sector reduces the level of nepotism which allows the hiring of competent officials, therefore increasing the efficiency and quality of public institutions. In addition, greater transparency and accountability in the tax system will encourage increased compliance, thus increasing the upside to revenue collection and consequently improved healthcare and education outcomes. Ultimately, public expenditure to meet the pressures of demographic and population change in Nigeria should be financed by improved and increased tax collection. Although not statistically significant, we find that advanced countries, particularly the Nordic countries which rank high in development outcomes have a relatively higher tax-to-GDP ratio and have invested a higher proportion of revenues on education.
Chile
Turkey
Indonesia
Nigeria
Chile
Turkey
Nigeria
Indonesia
Correlation Coefficient=0.665
CP
I S
core
Distance to Frontier
Correlation Coefficient=0.727
CP
I S
core
Human Development Index
The Future of Nigeria: Three critical levers for improving HDI 10
Source: World Bank, Transparency International, PwC Analysis
Source: UNDP, Transparency International, PwC Analysis
11. Blonigen and Wang, 2004; Moran,2011; Tintin 2012.
Corruption reduces private and public investment thereby undermining the prospects of broad based growth and development.

Nigeria's performance across the three levers
Ease of Doing Business Nigeria has slightly improved on the Ease of Doing Business rankings, with its Distance to Frontier score improving from 40 in 2005 to 46 in 2015. Significant improvements have been recorded in the areas of “getting credit” and “protecting minority investors”. The multiplicity of taxes facing businesses in Nigeria with an average of 59 tax payments per year presents a major challenge to doing business.
Source: World Bank, PwC Analysis
39.59
43.74 42.87 43.97
48.3344.69
-
10
20
30
40
50
60
2005 2007 2009 2011 2013 2015
Distance to Frontier Score
PwC 11
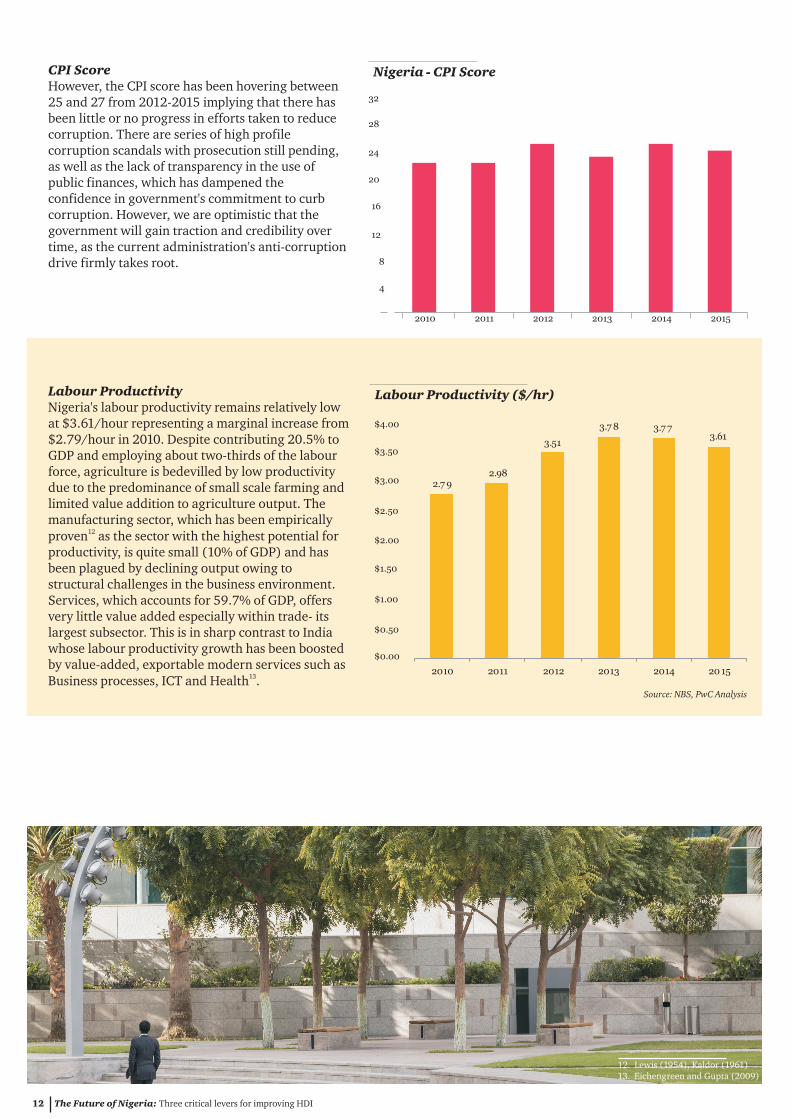
CPI ScoreHowever, the CPI score has been hovering between 25 and 27 from 2012-2015 implying that there has been little or no progress in efforts taken to reduce corruption. There are series of high profile corruption scandals with prosecution still pending, as well as the lack of transparency in the use of public finances, which has dampened the confidence in government's commitment to curb corruption. However, we are optimistic that the government will gain traction and credibility over time, as the current administration's anti-corruption drive firmly takes root.
Labour ProductivityNigeria's labour productivity remains relatively low at $3.61/hour representing a marginal increase from $2.79/hour in 2010. Despite contributing 20.5% to GDP and employing about two-thirds of the labour force, agriculture is bedevilled by low productivity due to the predominance of small scale farming and limited value addition to agriculture output. The manufacturing sector, which has been empirically
12proven as the sector with the highest potential for productivity, is quite small (10% of GDP) and has been plagued by declining output owing to structural challenges in the business environment. Services, which accounts for 59.7% of GDP, offers very little value added especially within trade- its largest subsector. This is in sharp contrast to India whose labour productivity growth has been boosted by value-added, exportable modern services such as
13Business processes, ICT and Health . Source: NBS, PwC Analysis
12. Lewis (1954), Kaldor (1961) 13. Eichengreen and Gupta (2009)
2.7 92.98
3.51
3.7 8 3.7 73.61
-
1
1
2
2
3
3
4
4
2010 2011 2012 2013 2014 20 15
$0.50
$1.00
$1.50
$2.00
$2.50
$3.00
$3.50
$4.00
4
8
12
16
20
24
28
32
2010 2011 2012 2013 2014 2015
Nigeria - CPI Score
$0.00
Labour Productivity ($/hr)
The Future of Nigeria: Three critical levers for improving HDI 12
PwC 13

HDI- Nigeria's potential in 2030
We estimate the potential achieves significant Human Development Index score improvements across the three that Nigeria could achieve in levers. To calculate these 2030 based on a scenario that improvements, we identify simulates achieving the countries with the most improvements in the CPI Score, impressive improvements in CPI
14Distance to Frontier score and score, DTF Score and Labour Labour productivity of the productivity over the past 15 country case studies. years, with recognition for
country specific factors such as The case countries are selected the stage of development or using the following criteria: population. To avoid being
skewed, we averaged the top ?Human Development Index three best percentage grew at a rate above 10% from improvements to estimate the 2000-2014; 2030 target for Nigeria across the ?Human Development Index in three levers. 2015 is above Nigeria's by at least 0.05 and/or; Results?Country has moved upwards The panel regression gives the to a higher category (e.g. equation: from low human development to medium human HDI= 0.614 + 0.0009 (CPI development). Score) + 0.0012 (DTF Score)
+0.0021 (Labour Methodology for creating productivity)scenario Our results show that HDI in Using a sample of 46 Middle and Nigeria could reach 0.73 from
15 the current 0.51 and attain the High Income Countries , we run status of a high human a panel regression of HDI on CPI development country by 2030 if Score, DTF Score and Labour it invests in policies and reforms productivity to establish the on which a sustainable growth equation below: engine can built. This will require improvements in the ease HDI= á +â (CPI Score) +ã (DTF of doing business; an Score) +ä (Labour productivity), acceleration in labour where á is a constant and â,ã and productivity and reduction in the ä are the values of the coefficient overall level of corruption for the respective explanatory perception at a rate similar to the variables. average of its comparison countries.To estimate Nigeria's 2030 HDI
score, we assume that Nigeria
14. Distance to Frontier score represents Ease of doing Business 15. High income countries using World Bank country classification
The Future of Nigeria: Three critical levers for improving HDI 14
Source: PwC Analysis
20 40 60 80
34
26
61
45
12.05
3.61Labour Productivity ($/hr)
Distance from Frontier
CPI Score
Attaining 0.73 HDI in 2030 - Lever targets
2015 2030
PwC 15
AppendixCountry Case Studies
Chile
Chile has introduced anti-corruption policies such as:
Chile significantly improved in its ease of doing business rankings by implementing reforms such as:
providing an immediate ? GDP (current US$) - $240bn
temporary operating license ? Total Population- 18mn
to new companies.? Labour Productivity - $25.80/hour
? Introducing provisions to ? Poverty Headcount ratio at
facilitate the continuity of the national poverty lines - debtor's business during 14.4% insolvency and creating
? Life expectancy at birth specialised insolvency courts. (years) - 81
? GNI per capita (current US$)- $14,910? FDI (net inflows % of GDP)-
? Passing a mandatory instructive 8.5% signature on best practices in
? Gini coefficient- 50.8 asset and interest declarations in 2015
? Promoting transparency in lobbying by publishing the list of registered lobbyists online.
? Introducing an online system for business registration in 2011 and
Latin America & Caribbean
Criteria for benchmark country selection:
Higher CPI Score relative to Nigeria73
Higher HDI rank relative to Nigeria 43
HDI increased from 2000-14
Previous history of business reforms and anti-corruption policies
16
16. Guide to data: GDP and Population (2015); Life expectancy (2014); Poverty headcount (2013)
The Future of Nigeria: Three critical levers for improving HDI 16
10.6%
Turkey
Turkey has introduced anti-corruption policies such as:
Turkey significantly improved in its ease of doing business rankings by implementing reforms such as:
infrastructure and training about ? GDP (current US$)- $718bn 2,500 customs officers and 14,000 ? Total Population- 79mn traders, which eased trading across ? Labour Productivity- $31.70/hour borders. ? Poverty Headcount ratio at national poverty lines- 1.6%? Life expectancy at birth (years)- 75 ? Adopting an “Action Plan on Increasing ? GNI per capita (current US$)- Transparency and Enhancing Good $10,830 Governance in the Public Sector”. The ? FDI ( net inflows % of GDP)- 1.6% plan includes disciplinary and criminal ? Gini coefficient - 40 sanctions against public officials
involved in corruption, and measures aimed at modernising the auditing system of the public sector, improving
transparency in campaign financing and ? Reducing the time required for strengthening the fight against money dealing with construction permits laundering. by setting strict time limits for granting a lot plan and by reducing ? Agreeing on an Emergency Action Plan the documentation requirements with the EU which helps in for an occupancy permit. strengthening anti-corruption units. ? Introducing an electronic data interchange system, improving information technology
Indonesia
Indonesia has introduced anti-corruption policies such as:
Indonesia significantly improved in its ease of doing business rankings by implementing reforms such as:
employer contributions and introducing ? GDP (current $)- $862bn an online system for paying social ? Total Population- 258mn security contributions.? Labour Productivity- $11.95/hour? Poverty Headcount ratio at ? Introducing a simplified application national poverty lines- 11.3% process allowing an applicant to ? Life expectancy at birth (years)- 69 simultaneously obtain a general trading ? GNI per capita (current $)- licence and a business registration $3,630 certificate. ? FDI ( net inflows % of GDP)- 3%? Gini Coefficient- 38
? Strengthening the capacity of the Corruption Eradication Commission (KPK) by recruiting staff through open competition, establishing ethical codes,
? Making tax payments easier and training investigators and developing less costly for companies by: comprehensive internal procedures. reducing the corporate income tax rate, reducing the ceiling for
Europe
Criteria for benchmark country selection:
Higher CPI Score relative to Nigeria42
Higher HDI rank relative to Nigeria 72
HDI increased from 2000-14
Previous history of business reforms and anti-corruption policies
Asia
Criteria for benchmark country selection:
Higher CPI Score relative to Nigeria36
Higher HDI rank relative to Nigeria 110
HDI increased from 2000-14
Previous history of business reforms and anti-corruption policies
PwC 17
12.7%
16.6%
Abbreviations
? CPI- Corruption Perceptions Index ? GDP- Gross Domestic Product? GNI- Gross National Income ? FDI- Foreign Direct Investment ? HDI- Human Development Index ? DTF- Distance To Frontier ? IMF- International Monetary Fund
The Future of Nigeria: Three critical levers for improving HDI 18
Country Classifications Human Development Index
? Very High Human Development= HDI ≥ 0.8
? High Human Development = 0.8≥HDI ≥ 0.7
? Medium Human Development=0.7≥HDI ≥ 0.55
? Low Human Development= 0.55≥HDI
Bibliography
? Ali, I. and Hyun H. Son (2007). “Defining and ? Johnson, A. (2014). “Poverty in Nigeria Measuring Inclusive Growth: Application to Increasing Despite GDP Growth”. The Borgen Philippines”. ERD Working Paper No. 98, Project. Economics and Research Department, Asian Development Bank, Manila. ? Klasen, S. (2010). “Measuring and Monitoring
Inclusive Growth: Multiple Definitions, Open ? Al-Sadig, Ali, 2009. The Effects of Corruption Questions and some Constructive Proposals”. on FDI Inflows. Cato Journal 29, No.2, Asian Development Bank Spring/Summer.
? Lee, J-W., and W. McKibbin. (2014). “Service ? Birdsall (1993). Social Development is Sector Productivity and Economic Growth in Economic Development. Policy Research Asia. ADB Working Paper 490. Tokyo: Asian Working Paper No. 1123. World Bank, Development Bank Institute. Washington DC.
? Mauro, Paolo (1995). “Corruption and ? Blonigen, A. ad M. Wang. (2004). Growth”, Quarterly Journal of Economics “Inappropriate Pooling of Wealthy and Poor 110(3): 681-712. Countries in Empirical FDI Studies. NBER Working Paper No. 10378. ? Mauro, P. (1996). “The Effects of Corruption on Growth, Investment and Government ? Brooks, N and Hwong, T. (2006). “The Social Expenditure.”IMF Working Paper No. 96/98, Benefits and Economic Costs of Taxation.” pp.1-28. Canadian Centre for Policy Alternatives. ? Schultz, T (1993). “Investment in Schooling ? Chene, M. (2012). “Overview of Corruption and Health of Women and Men”. Journal of and Anti-Corruption in Turkey. Transparency Human Resources 28:694-734 International Working Paper No. 313. ? Schutte, S.A. (2012). “Against the Odds: Anti-? Cobham, A. (2014). “Nigeria's Upward Revision Corruption Reform in Indonesia. Public of GDP should Sound Alarm on Tax-to-GDP Administration and Development 32(1): pp. Ratio. Centre for Global Development. 38-48. ? Djankov, S. and C. McLiesh (2005). “Doing ? Tintin, C. (2012). “Does Foreign Direct Business in 2005: Removing Obstacles to Investment Spur Economic Growth and Growth”. A Co-Publication of the World Bank, Development? A Comparative Study the International Finance Corporation and http://www.etsg.org/ETSG2012/Programme/ Oxford University Press. Papers/73.pdf ? Doing Business in 2016: Country Data Profiles, ? World Bank. (2014). Nigeria Economic Report. World Bank, Washington DC Nigeria Economic Report; No. 2. Washington, . DC: World Bank Group. ? Education for All 2015 National Review Report: http://documents.worldbank.org/curated/en/ Nigeria. UNESCO, Paris. 2014/07/19883231/nigeria-economic-report- no-2? Hicks, N. and Streeten, P. (1979). “Indicators of Development: The Search for a Basic Needs ? United Nations Human Development Report, Yardstick” World Development. 2015. ? Ianchovichina, Elena and Lundstrom, Gable (2012). “What is Inclusive Growth?” International Monetary Fund.
PwC 19
This publication has been prepared for general guidance on matters of interest only, and does not constitute professional advice. You should not act upon the information contained in this publication without obtaining specific professional advice. No representation or warranty (express or implied) is given as to the accuracy or completeness of the information contained in this publication, and, to the extent permitted by law, PricewaterhouseCoopers Limited, its members, employees and agents do not accept or assume any liability, responsibility or duty of care for any consequences of you or anyone else acting, or refraining to act, in reliance on the information contained in this publication or for any decision based on it.
© 2016 PricewaterhouseCoopers Limited. All rights reserved. In this document, PwC refers to PricewaterhouseCoopers Limited (a Nigerian limited liability company), which is a member firm of PricewaterhouseCoopers International Limited, each member firm of which is a separate legal entity. Please see www.pwc.com/structure for further details.
Contacts
Uyi AkpataCountry and Regional Senior Partner West Market Area+234 1 271 1700 [email protected]
Dr Andrew S. Nevin (PhD)Partner & Chief EconomistPwC Nigeria+234 1 271 1700 [email protected]
Adedayo AkinbiyiEconomistPwC Nigeria+234 1 271 1700 [email protected]


![INHALT - CONTENTS - MATIÈRE · RHZ(DW10ATED); (66kW-120kW) 1.6 HDi; 1.6 HDi 110; 1.6 HDi 110 FAP; 1.6 HDi 110 FAP [04]; 1.6 HDi 110FAP; 1.6 HDi 90; 1.6 HDi 90 [04]; 2.0 HDi; 2.0](https://img.pdfslide.us/doc/110x75/605cc6e9948bf00b8613e09d/inhalt-contents-matire-rhzdw10ated-66kw-120kw-16-hdi-16-hdi-110-16.jpg)