Embed Size (px)
Citation preview
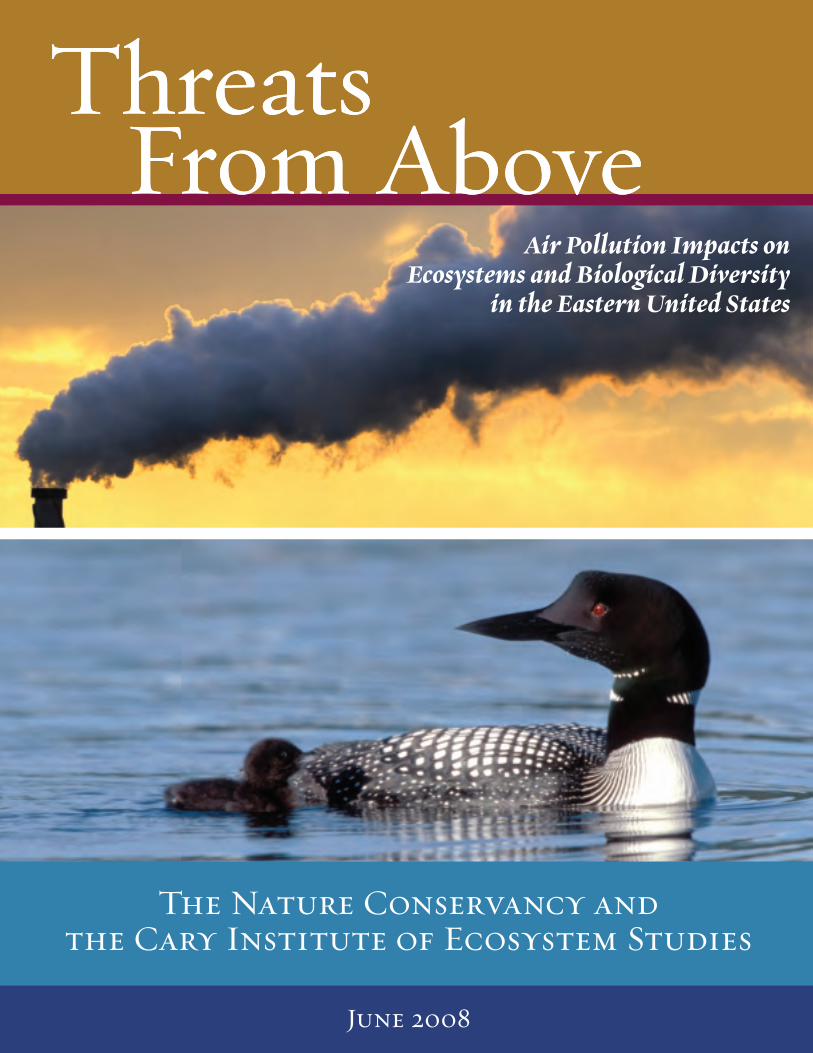
Air Pollution Impacts on Ecosystems and Biological Diversity
in the Eastern United States
Threats From Above
Threats From Above
The Nature Conservancy and
the Cary Institute of Ecosystem Studies
June 2008
17793:Layout 1 5/29/08 5:14 PM Page c1
AUTHORSGary M. Lovett, Ph.D. Cary Institute of Ecosystem StudiesTimothy H. Tear, Ph.D. The Nature Conservancy
CONTRIBUTORSB. Jack Cosby, Ph.D. University of VirginiaCharles T. Driscoll, Ph.D. Syracuse UniversityJudy K. Dunscomb The Nature ConservancyDavid C. Evers, Ph.D. BioDiversity Research InstituteStuart E.G. Findlay, Ph.D. Cary Institute of Ecosystem StudiesHelen Hooper The Nature ConservancyKathy Fallon Lambert Ecologic: Analysis & CommunicationsFrank Lowenstein The Nature ConservancyKathleen C. Weathers, Ph.D. Cary Institute of Ecosystem Studies Alan White The Nature Conservancy
SUGGESTED CITATION Lovett, G.M., and T.H. Tear. 2008. Threats from Above: Air Pollution Impacts on Ecosystems and Biological Diversity in the Eastern United States. The Nature Conservancy and the Cary Institute of Ecosystem Studies.
For additional copies, contact The Nature Conservancy at 301-897-8570 or visit www.ecostudies.org/reprints/Threats_from_Above.pdf
Threats From Above is available online at:www.nature.org/wherewework/northamerica/states/maryland/
Cover Photography:
Top: Coal-fired power plants are among the leading sources of airborne mercury, sulfur and nitrogen pollution. © Eric Middelkoop/BigStockPhoto.com
Botom: A newly hatched common loon chick is watched by its parent as it takes its first swim. © Daniel Poleschook Jr. and Ginger Gumm
17793:Layout 1 5/29/08 5:14 PM Page c2
Air Pollution Impacts on Ecosystems and Biological Diversity
in the Eastern United States
Threats From Above
The Nature Conservancy and
the Cary Institute of Ecosystem Studies
June 2008
17793:Layout 1 5/29/08 5:14 PM Page 1
2
executive summary
Air pollution harms every major ecosystem in the northeastern United States, producing economic losses,reducing scenic beauty, decreasing the value of
conservation investments and damaging forests, lakes, rivers,wetlands and coastal waters. These negative impacts demandswift action to reduce air pollution and further evaluate its effects.
A team of 32 experts, convened by the Nature Conservancy andthe Cary Institute of Ecosystems Studies, recently evaluated airpollution’s effects in the Northeast and Mid-Atlantic regions ofthe United States and identified the conservation implications.1
This report summarizes their findings about the significant airpollution impacts to several major ecosystem types, evaluatesthe use of air pollution loading limits to conserve biologicalresources and presents a Call to Action for advancing criticalloads and expanding national air pollution monitoring.
The substantial weight of evidence established throug h decades of research by hundreds of scientists shows that:
• Air pollution harms natural ecosystems and threatensbiological diversity in the eastern U.S.;
• Conventional land conservation and existing air qualityregulations are necessary but insufficient to conserve naturalecosystems and their valuable services;
• Limits on air pollution loading, such as critical loads, should be established for sensitive ecosystems to reduce ongoingenvironmental damage; and
• The monitoring of air pollution and its effects must expand to better safeguard the nation’s natural resources and assessthe effectiveness of air pollution policies.
Air pollution harms natural ecosystems and threatens biological diversity in theeastern U.S.
Air pollution has rained down and drifted into the eastern U.S.for more than a century, altering forests, lakes, rivers, coastalwaters and other ecosystems to the detriment of the plants andanimals that live there. In aquatic ecosystems, air pollutionacidifies surface waters, reducing their ability to sustain nativefish. In estuaries and coastal waters, it contributes to nutrientover-enrichment, producing algal blooms, foul smells and low oxygen levels. It also causes mercury to accumulate in aquaticfood webs, threatening the health of both people and wild animals.
In forests, air pollution acidifies soils, depleting importantnutrients and reducing the productivity of some forest trees. Itadds excess nitrogen, altering nutrient levels and decreasingdisease resistance. It also induces ozone impacts, decreasing theability of many plant species to harness the energy of the sun forgrowth and other vital functions.
Though subtle, these ecological effects can be quite serious. Forexample, mercury contamination may not kill fish outright, butit may threaten human health and reduce the reproductivesuccess of the loons that eat the tainted fish. Compounding theeffects of air pollution are other human-caused environmentalfactors including climate change, sprawl and the introduction ofnon-native species. As threats to the health of natural systemsbecome more diverse and complex, our approaches toconservation and public policy must adapt.
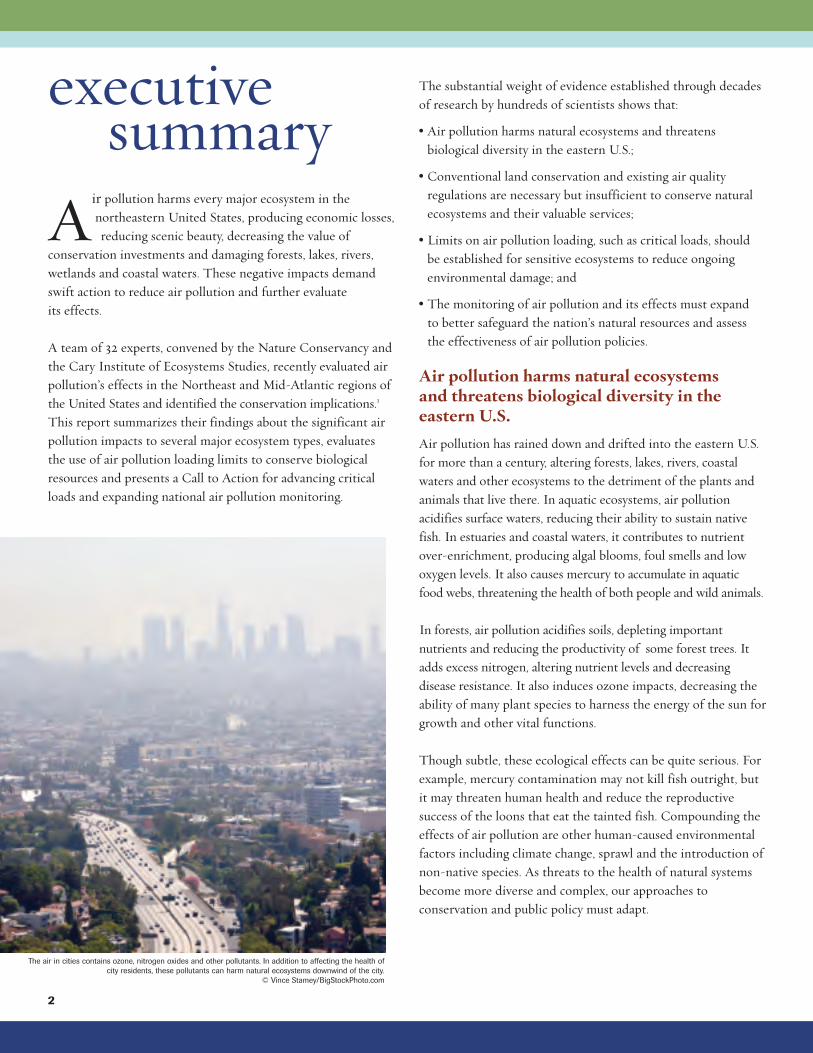
The air in cities contains ozone, nitrogen oxides and other pollutants. In addition to affecting the health of
city residents, these pollutants can harm natural ecosystems downwind of the city.
© Vince Stamey/BigStockPhoto.com
17793:Layout 1 6/2/08 2:17 PM Page 2
Conventional land conservation and existingair quality regulations are necessary butinsufficient to conserve natural ecosystemsand their valuable services.
In the past several decades, land protection has been theprimary approach to conserving biological diversity and othernatural resources. Land acquisition and easements came intofavor when the main threat to biodiversity was assumed to bethe conversion of forests and farmlands to housing andcommercial developments. The effectiveness of theseconventional tools spurred the growth of the land trustmovement, giving rise to the more than 580 land trusts thatnow exist in the Northeast alone. The Nature Conservancyitself invests tens of millions of dollars in land protection eachyear for the purpose of conserving global biological diversity.
Unfortunately, air pollution is pervasive and does not recognizeproperty boundaries. Habitats and landscapes cannot beconserved by land protection alone—action to reduce airpollution must be part of the solution. Given the extent andseverity of air pollution’s effects on ecosystems, it is time for theconservation community, government agencies and Congress to directly address this serious threat. An important approach to expanding the suite of conservation strategies is establishingpollution loading limits.
Limits on air pollution loading, such ascritical loads, should be established forsensitive ecosystems in order to reduceongoing environmental damage.
U.S. air quality regulations currently focus on impacts to humanhealth. While the federal Clean Air Act sets both primarystandards to protect human health and secondary standards toprotect general welfare and the environment, the U.S. has notfully implemented the ecologically based secondary standards.In addition, current air quality regulations focus on what isemitted into the atmosphere but do not actually limit theamount of pollution deposited to the landscape.
It is time to refocus and expand the existing approach to airpollution control in order to address ecosystem effects. Inaddition to establishing secondary standards, limits should be placed on the amount – or load – of a given pollutant thatcan be deposited. One method of setting pollution loadinglimits is by specifying “critical loads” for ecosystems. A critical
load is the amount of pollution that can be deposited into aspecified ecosystem without causing significant adverseenvironmental effects. Critical loads should be established forsensitive U.S. ecosystems to limit air pollution, assess federaland state regulations and manage public lands.
The monitoring of air pollution and its effectsmust expand to better safeguard the nation’snatural resources and assess the effectivenessof air pollution policies.
Many important monitoring programs exist in the U.S., but there is currently no comprehensive integrated network to measure atmospheric deposition, soil and surface waterconcentrations of pollutants and biological effects. Biologicalmeasurements are particularly scant. Without this information,it is impossible to determine the effectiveness of the federalClean Air Act’s air pollution mandates. Existing monitoringprograms must be supported and expanded to improveestimates of total air pollution deposition, measure changes insoil and surface water chemistry and track trends in plants,animals, habitats and the services they provide to humans. Thisexpanded monitoring is critical to evaluating the efficacy ofpublic policies aimed at decreasing air pollution impacts.
3
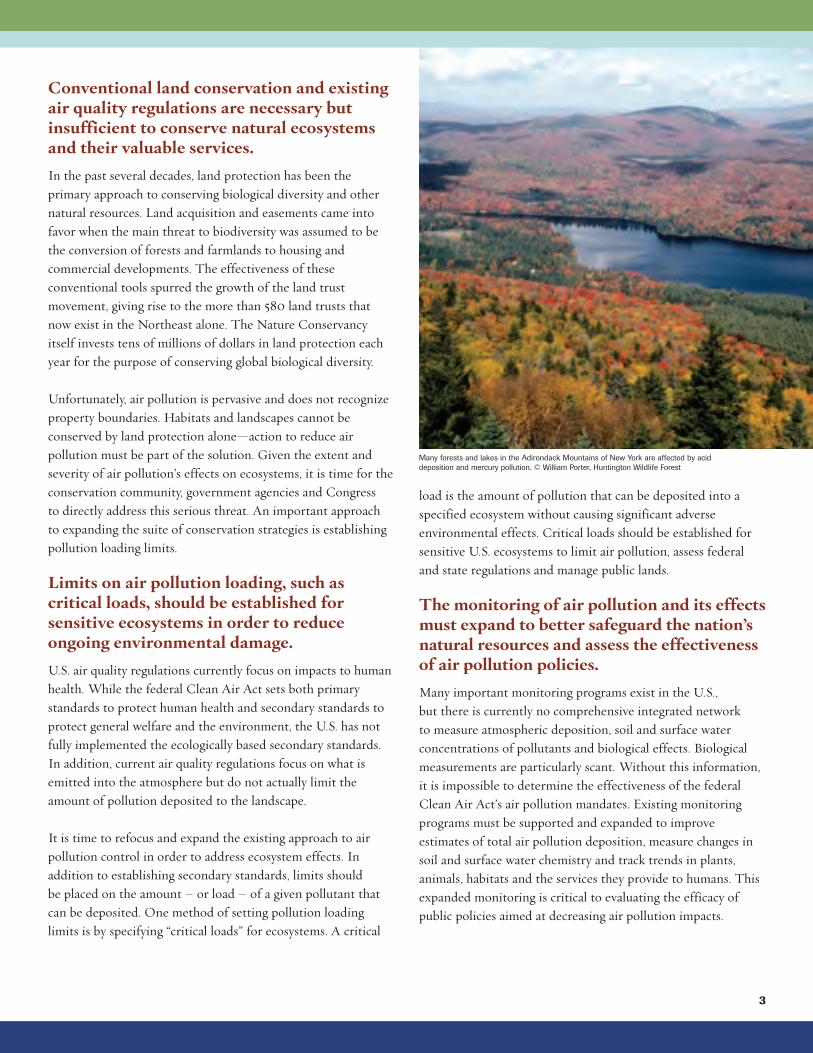
Many forests and lakes in the Adirondack Mountains of New York are affected by acid
deposition and mercury pollution. © William Porter, Huntington Wildlife Forest
17793:Layout 1 5/29/08 5:14 PM Page 3
I. threats from above
Scientists have studied the environmental effects of airpollution for decades2. To synthesize the current knowledge of air pollution effects, The Nature Conservancy and the Cary Institute of Ecosystems Studies convened a workshop of 32 experts to assess the impacts of four major air pollutants(sulfur, nitrogen, ground-level ozone and mercury) to six targetecosystems in the Northeast and Mid-Atlantic regions of theUnited States. This report draws from the workshop’s findingson the known biological effects of the four pollutants andevaluates the conservation implications. In general, the impactsof these four pollutants are significant and widespread across all ecosystem types, disrupting vital functions and threateningbiological diversity (see Table 1).
Air pollution in the United States originates from local, regionaland global sources. Pollutants are emitted into the air primarilythrough smokestacks, tailpipes and agricultural operations.After they are released, the pollutants may travel hundreds ofmiles in the air before they are deposited back to earth, either inwet deposition (rain and snow) or dry deposition (dry particlesand gases). The largest U.S. sources of sulfur dioxide andnitrogen oxide emissions that produce acid rain are powerplants, cars and trucks, and industrial facilities4. Nitrogen oxideand hydrocarbon emissions that react in the atmospheregenerate ground-level ozone. The largest sources of mercurypollution in the U.S. are coal-fired power plants, followed byindustrial sources and waste incinerators5. Many of these samesources also emit carbon dioxide, one of the most abundantgreenhouse gases that contribute to climate change.
The Northeast and Mid-Atlantic regions receive some of thehighest levels of atmospheric deposition (air pollution depositedto the landscape) in all of North America because of their loca -tion downwind from large industrial and urban pollution sources.
This report summarizes the biological effects for three types of terrestrial ecosystems:
(1) forests,
(2) bogs and other wetlands, and
(3) alpine and subalpine ecosystems;
and three types of aquatic ecosystems:
(1) streams and rivers,
(2) lakes and ponds, and
(3) coastal waters.
While the high pollution loading in the Northeast and Mid-Atlantic regions makes these areas the subject of many scientificstudies, areas throughout the U.S. suffer from the effects ofacidity, ozone and mercury, underscoring that air pollution istruly a national issue.
5
A. Air Pollution and its Ecological EffectsAir pollution has damaged many terrestrial and aquaticecosystems in the Northeast and Mid-Atlantic regions of theUnited States. Among the most affected terrestrial ecosystemsare forests and wetlands. Some of the most impaired aquaticecosystems include streams and rivers, lakes and ponds andcoastal waters. These ecosystems, which contain sensitivespecies, are common to the region and have received sufficientstudy to inform an evaluation of air pollution impacts.
What are the biological effects of excess nitrogen, aciddeposition, ozone and mercury pollution? The followingsections summarize the relevant scientific literature for themajor terrestrial and aquatic ecosystems following the pathmost pollutants take from upland forests and alpine regions to streams and rivers, flowing on to lakes and ponds andultimately to coastal waters.
4
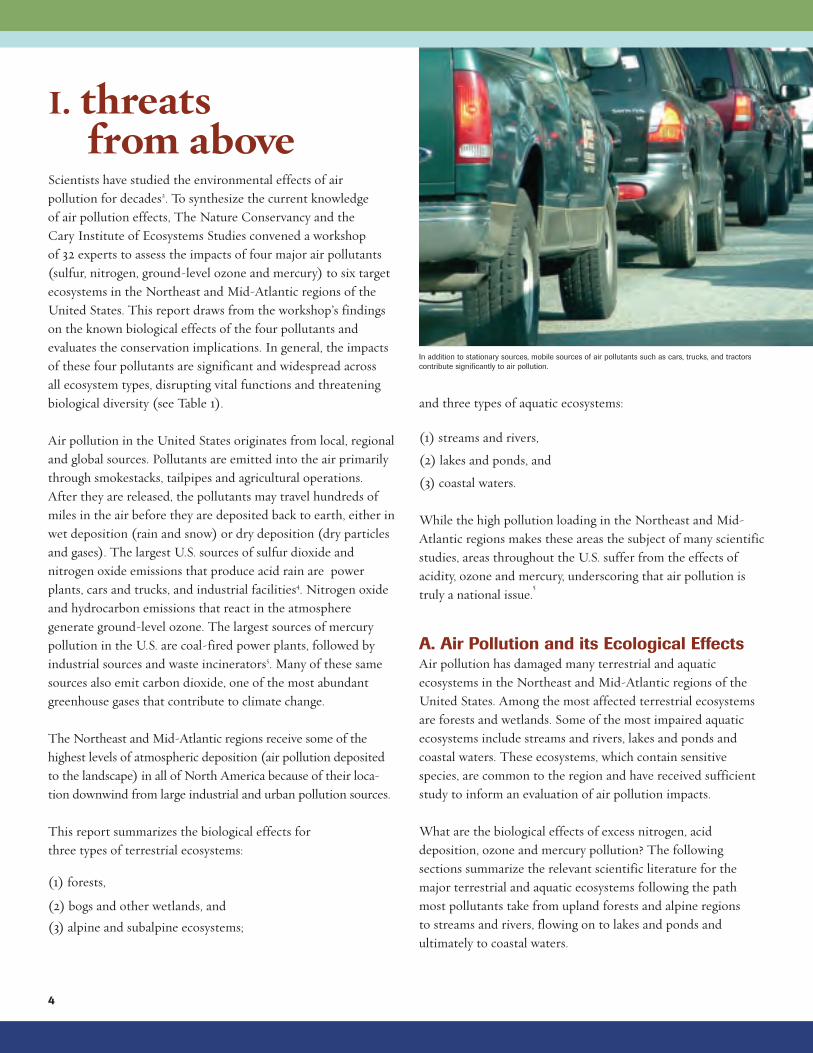
In addition to stationary sources, mobile sources of air pollutants such as cars, trucks, and tractors
contribute significantly to air pollution.
17793:Layout 1 5/29/08 5:14 PM Page 4
5
1. Nitrogen
Nitrogen is the most abundant element in the earth’satmosphere; however, its most common form, dinitrogen gas (N2), is not directly available to most plants and animals.Because of its limited availability yet critical biological role,nitrogen controls the growth and productivity of manyecosystems. To be available to living organisms, nitrogen in the
atmosphere must be converted from N2 to a reactive form (Nr). This conversion process occurs naturally via specializedorganisms, lightning and fires. However, human-drivenprocesses such as producing nitrogen fertilizer and burningfossil fuels also produce reactive nitrogen and now play a dominant role in the nitrogen cycle.
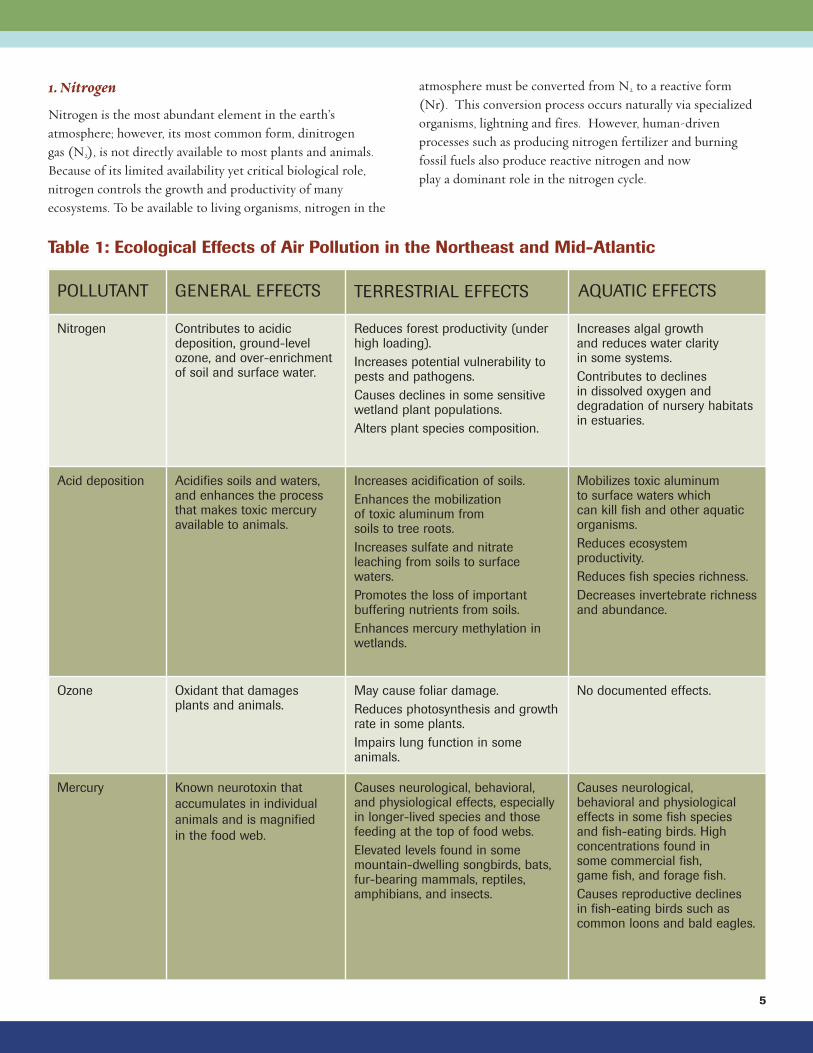
Table 1: Ecological Effects of Air Pollution in the Northeast and Mid-Atlantic
POLLUTANT GENERAL EFFECTS TERRESTRIAL EFFECTS AQUATIC EFFECTS
Nitrogen Contributes to acidicdeposition, ground-levelozone, and over-enrichmentof soil and surface water.
Reduces forest productivity (underhigh loading).
Increases potential vulnerability topests and pathogens.
Causes declines in some sensitivewetland plant populations.
Alters plant species composition.
Increases algal growth and reduces water clarity in some systems.
Contributes to declines in dissolved oxygen anddegradation of nursery habitatsin estuaries.
Acid deposition Acidifies soils and waters,and enhances the processthat makes toxic mercuryavailable to animals.
Increases acidification of soils.
Enhances the mobilization of toxic aluminum from soils to tree roots.
Increases sulfate and nitrateleaching from soils to surfacewaters.
Promotes the loss of importantbuffering nutrients from soils.
Enhances mercury methylation inwetlands.
Mobilizes toxic aluminum to surface waters which can kill fish and other aquaticorganisms.
Reduces ecosystemproductivity.
Reduces fish species richness.
Decreases invertebrate richnessand abundance.
Ozone Oxidant that damages plants and animals.
May cause foliar damage.
Reduces photosynthesis and growthrate in some plants.
Impairs lung function in someanimals.
No documented effects.
Mercury Known neurotoxin that
accumulates in individual
animals and is magnified
in the food web.
Causes neurological, behavioral,and physiological effects, especiallyin longer-lived species and thosefeeding at the top of food webs.
Elevated levels found in somemountain-dwelling songbirds, bats,fur-bearing mammals, reptiles,amphibians, and insects.
Causes neurological, behavioral and physiologicaleffects in some fish species and fish-eating birds. Highconcentrations found in some commercial fish, game fish, and forage fish.
Causes reproductive declines in fish-eating birds such ascommon loons and bald eagles.
17793:Layout 1 5/29/08 5:14 PM Page 5
6
During the past 50 years, human actions have more than doubledthe rate reactive nitrogen is added to the environment— and therate continues to rise6. This accumu lation of reactive nitrogen isaltering the nitrogen cycle at local and global scales with seriousconsequences. A single atom of reactive nitrogen can causedamage throughout the environment as it moves from air to soil, fresh waters, plants and coastal waters. The term “nitrogencascade” describes this chain of nitrogen’s environmental effects7.
In terrestrial ecosystems, excess nitrogen can lead to decreasedsoil fertility, reduced productivity and even tree death. The suiteof nitrogen pollution impacts are described as “nitrogensaturation,”8 which is the process of adding more nitrogen thanplants and microbes can absorb, resulting in increased nitrogenleaching, changes in plant growth and, in some cases, elevated tree mortality.
Alpine and subalpine regions in the eastern U.S. receive highlevels of nitrogen deposition due to the prevalence of pollutant-laden clouds and fog. However, most studies on the effects ofnitrogen deposition on alpine and subalpine ecosystems haveoccurred in the Rocky Mountains and in Europe. At NiwotRidge in the Rocky Mountains of Colorado, a nitrogen additionstudy in an alpine meadow showed that added nitrogen initiallyincreases overall plant diversity, but the authors suggest that
higher levels of nitrogen deposition or long-term accumulationmay cause the reverse to occur—a decrease in plant speciesdiversity as nitrogen “loving” (nitrophilous) species start todominate9. The plant responses in this study were evident atnitrogen deposition rates as low as 4 kilograms of nitrogen perhectare per year (4 kg N/ha-yr).
These experiments in the Rockies and the overall similarityamong plants of alpine ecosystems in the Rockies and theeastern U.S. suggest that nitrogen deposition may be damaginghigh-elevation ecosystems in the eastern U.S. Deposition loadsof 10 to 40 kg N/ha-yr10 in high-elevation areas in the East aremuch higher than in the West and have probably been at thatlevel for several decades. It is possible that productivity andspecies shifts have already occurred in eastern alpine ecosystems.
Below the alpine zone, spruce-fir forests and hardwoodforests dominate the terrestrial landscape of the eastern U.S. Inareas where pollution is minimal, nitrogen levels are often lowenough to limit forest growth. Under these conditions, addednitrogen can stimulate tree growth. However, some forests nowreceive too much nitrogen as a result of air pollution. Underconditions of high nitrogen deposition, the leaching of nitratefrom soils to surface waters has been observed in the Northeast,suggesting that supply is exceeding demand and these forests
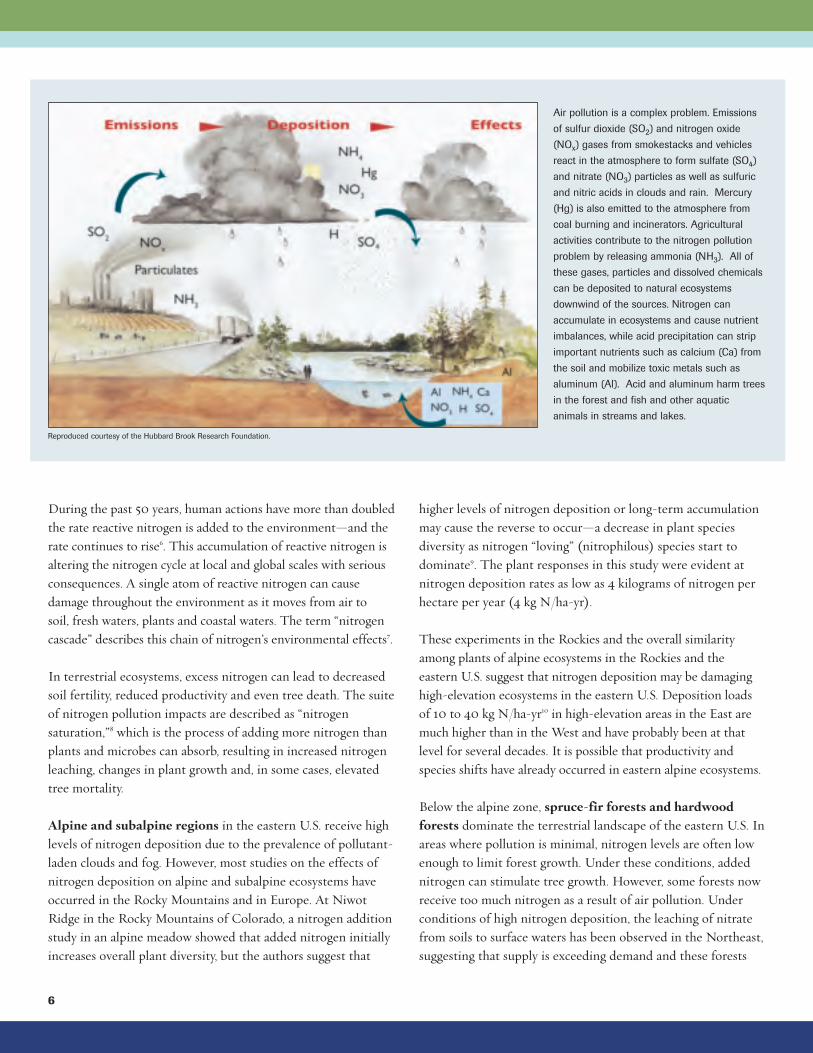
Air pollution is a complex problem. Emissions
of sulfur dioxide (SO2) and nitrogen oxide
(NOx) gases from smokestacks and vehicles
react in the atmosphere to form sulfate (SO4)
and nitrate (NO3) particles as well as sulfuric
and nitric acids in clouds and rain. Mercury
(Hg) is also emitted to the atmosphere from
coal burning and incinerators. Agricultural
activities contribute to the nitrogen pollution
problem by releasing ammonia (NH3). All of
these gases, particles and dissolved chemicals
can be deposited to natural ecosystems
downwind of the sources. Nitrogen can
accumulate in ecosystems and cause nutrient
imbalances, while acid precipitation can strip
important nutrients such as calcium (Ca) from
the soil and mobilize toxic metals such as
aluminum (Al). Acid and aluminum harm trees
in the forest and fish and other aquatic
animals in streams and lakes.
Reproduced courtesy of the Hubbard Brook Research Foundation.
17793:Layout 1 5/29/08 5:14 PM Page 6
may be in the initial stages of nitrogen saturation11. Nitrateleaching appears to be rare in forests receiving less than 5 kgN/ha-yr and increasingly common as deposition levels exceed 8 kg N/ha-yr12. Nitrate leaching can acidify soils, stripping awayimportant buffering nutrients such as calcium and magnesium,and mobilizing harmful aluminum that can impair the functionof tree roots and move into rivers and streams.
The question of whether current nitrogen pollution levels in theU.S. enhance or reduce tree growth is controversial13. However,most reports indicate that tree growth has remained stable ordeclined over the past two decades, suggesting it is unlikely thatnitrogen pollution has had a beneficial fertilizing effect overlarge areas in the long term14. The effect of nitrogen pollutionon the composition of plant species in forests is an area of activeresearch. Shifts in tree species composition under currentnitrogen deposition levels would be difficult to assess because ofthe long lifespan of trees and confounding effects of local landuse history. Changes in abundance and composition of understory shrubs and non-woody plants have occurred
in response to nitrogen deposition in Europe15, and might be expected in the eastern U.S.
Nitrogen pollution can also impose more subtle impacts on forests by altering basic processes. For example, plant-eatinginsects tend to prefer vegetation with higher nitrogen content,and there is some evidence that increased nitrogen may bepredisposing trees to insect pest attacks16. Increasedsusceptibility to pests could be a serious liability for easternforests, given the number of exotic insect pests that are beingintroduced continually through enhanced global trade17.
During the past 15 years, several experimental studies haveexamined the effects of intentionally adding nitrogen to forestsin this region. The nitrogen application rates in these studiesvary from about two to 15 times existing nitrogen depositionlevels. Most forest stands where nitrogen was added have shownincreases in plant nitrogen content, production and leaching ofnitrate and leaching of important nutrients such as magnesiumand calcium. In three cases, the nitrogen addition resulted indeclines in productivity and increases in tree mortality18. Whiletree mortality does not currently appear to be a widespreadresponse to nitrogen deposition in the eastern U.S., it is unclearwhether forests will respond the same way to future long-termaccumulation of nitrogen from atmospheric deposition as they do to these experimental nitrogen additions.
7
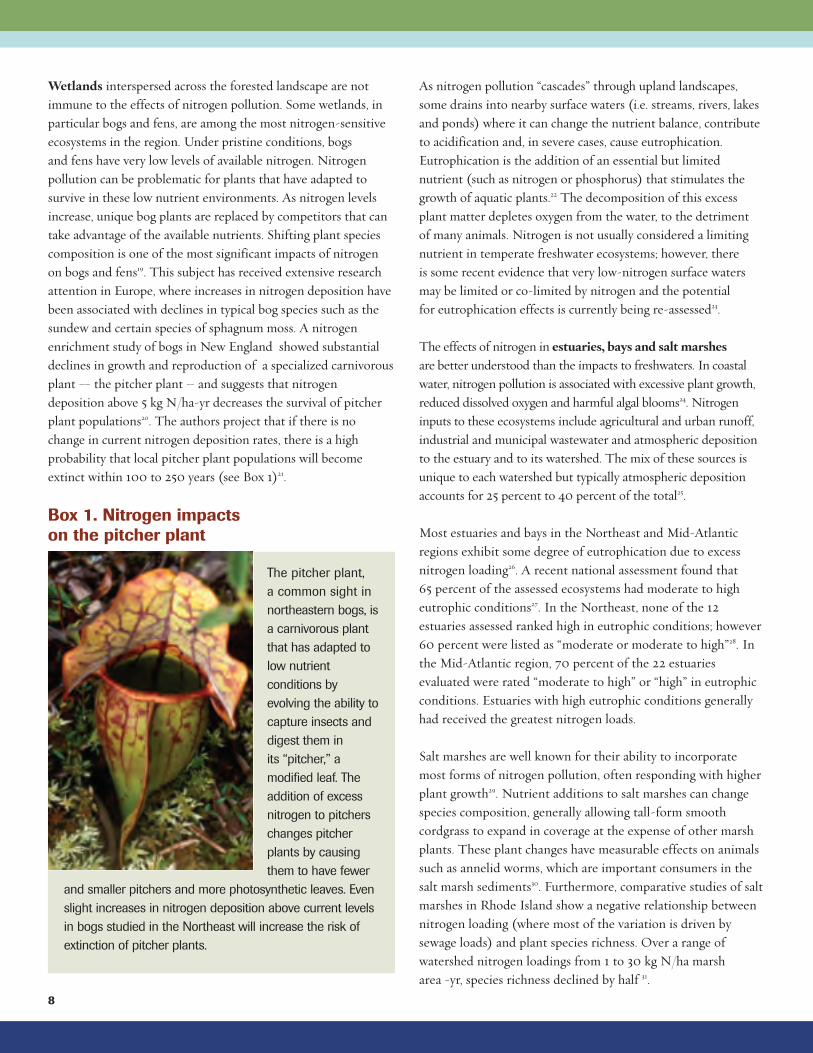
Mountaintop spruce-fir forests receive large amounts of air pollutant deposition, often in the
form of wind-blown fog and mist. © Chris Galbraith/BigStockPhoto.com
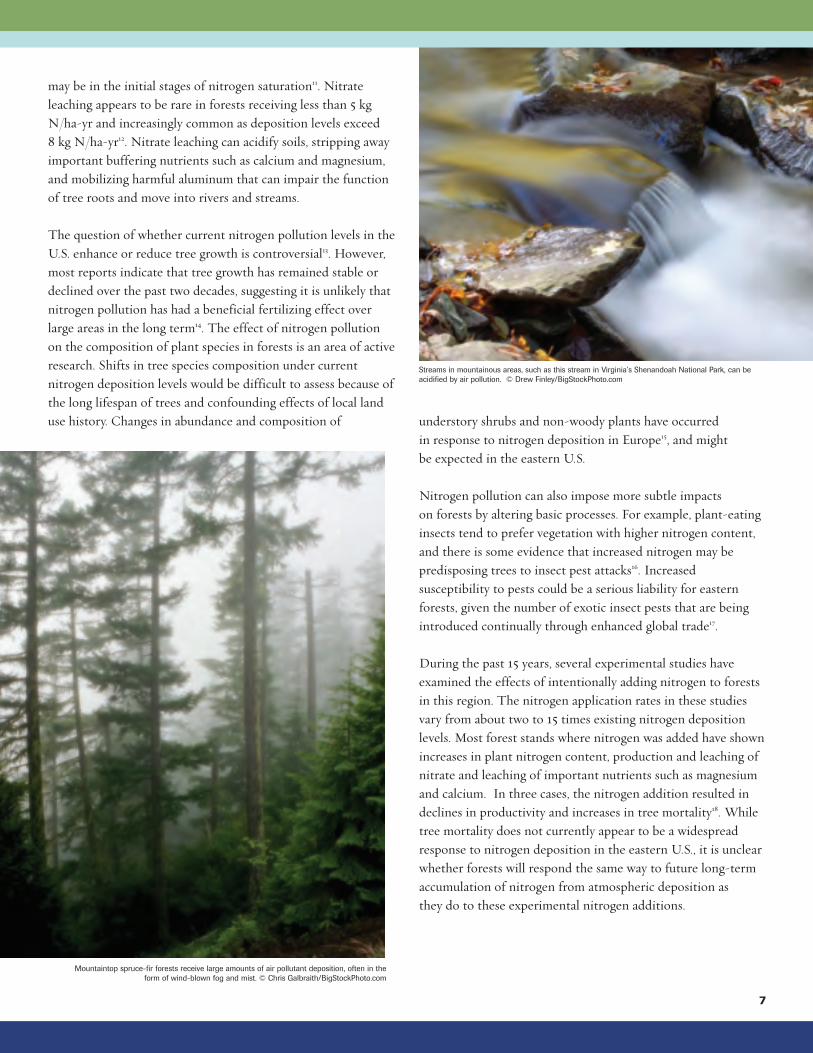
Streams in mountainous areas, such as this stream in Virginia’s Shenandoah National Park, can be
acidified by air pollution. © Drew Finley/BigStockPhoto.com
17793:Layout 1 5/29/08 5:14 PM Page 7
8
Wetlands interspersed across the forested landscape are notimmune to the effects of nitrogen pollution. Some wetlands, inparticular bogs and fens, are among the most nitrogen-sensitiveecosystems in the region. Under pristine conditions, bogs and fens have very low levels of available nitrogen. Nitrogenpollution can be problematic for plants that have adapted tosurvive in these low nutrient environments. As nitrogen levelsincrease, unique bog plants are replaced by competitors that cantake advantage of the available nutrients. Shifting plant speciescomposition is one of the most significant impacts of nitrogenon bogs and fens19. This subject has received extensive researchattention in Europe, where increases in nitrogen deposition havebeen associated with declines in typical bog species such as thesundew and certain species of sphagnum moss. A nitrogenenrichment study of bogs in New England showed substantialdeclines in growth and reproduction of a specialized carnivorousplant — the pitcher plant – and suggests that nitrogendeposition above 5 kg N/ha-yr decreases the survival of pitcherplant populations20. The authors project that if there is nochange in current nitrogen deposition rates, there is a highprobability that local pitcher plant populations will becomeextinct within 100 to 250 years (see Box 1)21.
As nitrogen pollution “cascades” through upland landscapes,some drains into nearby surface waters (i.e. streams, rivers, lakesand ponds) where it can change the nutrient balance, contributeto acidification and, in severe cases, cause eutrophication.Eutrophication is the addition of an essential but limitednutrient (such as nitrogen or phosphorus) that stimulates thegrowth of aquatic plants.22 The decomposition of this excessplant matter depletes oxygen from the water, to the detriment of many animals. Nitrogen is not usually considered a limitingnutrient in temperate freshwater ecosystems; however, there is some recent evidence that very low-nitrogen surface watersmay be limited or co-limited by nitrogen and the potential for eutrophication effects is currently being re-assessed23.
The effects of nitrogen in estuaries, bays and salt marshesare better understood than the impacts to freshwaters. In coastalwater, nitrogen pollution is associated with excessive plant growth,reduced dissolved oxygen and harmful algal blooms24. Nitrogeninputs to these ecosystems include agricultural and urban runoff,industrial and municipal wastewater and atmospheric depositionto the estuary and to its watershed. The mix of these sources isunique to each watershed but typically atmospheric depositionaccounts for 25 percent to 40 percent of the total25.
Most estuaries and bays in the Northeast and Mid-Atlanticregions exhibit some degree of eutrophication due to excessnitrogen loading26. A recent national assessment found that 65 percent of the assessed ecosystems had moderate to higheutrophic conditions27. In the Northeast, none of the 12estuaries assessed ranked high in eutrophic conditions; however60 percent were listed as “moderate or moderate to high”28. Inthe Mid-Atlantic region, 70 percent of the 22 estuariesevaluated were rated “moderate to high” or “high” in eutrophicconditions. Estuaries with high eutrophic conditions generallyhad received the greatest nitrogen loads.
Salt marshes are well known for their ability to incorporatemost forms of nitrogen pollution, often responding with higherplant growth29. Nutrient additions to salt marshes can changespecies composition, generally allowing tall-form smoothcordgrass to expand in coverage at the expense of other marshplants. These plant changes have measurable effects on animalssuch as annelid worms, which are important consumers in thesalt marsh sediments30. Furthermore, comparative studies of saltmarshes in Rhode Island show a negative relationship betweennitrogen loading (where most of the variation is driven bysewage loads) and plant species richness. Over a range ofwatershed nitrogen loadings from 1 to 30 kg N/ha marsh area -yr, species richness declined by half 31.
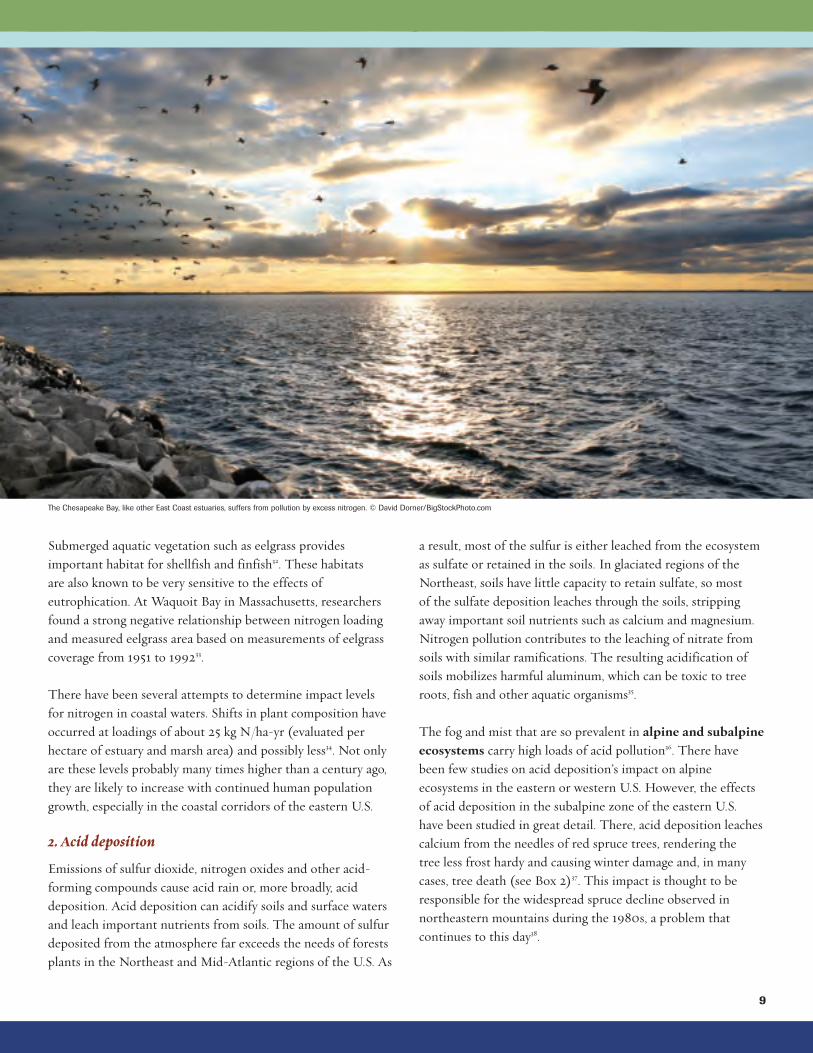
The pitcher plant,
a common sight in
north eastern bogs, is
a carnivorous plant
that has adapted to
low nutrient
conditions by
evolving the ability to
capture insects and
digest them in
its “pitcher,” a
modified leaf. The
addition of excess
nitrogen to pitchers
changes pitcher
plants by causing
them to have fewer
and smaller pitchers and more photosynthetic leaves. Even
slight increases in nitrogen deposition above current levels
in bogs studied in the Northeast will increase the risk of
extinction of pitcher plants.
Box 1. Nitrogen impacts on the pitcher plant
17793:Layout 1 5/29/08 5:14 PM Page 8
9
Submerged aquatic vegetation such as eelgrass providesimportant habitat for shellfish and finfish32. These habitats are also known to be very sensitive to the effects ofeutrophication. At Waquoit Bay in Massachusetts, researchersfound a strong negative relationship between nitrogen loadingand measured eelgrass area based on measurements of eelgrasscoverage from 1951 to 199233.
There have been several attempts to determine impact levels for nitrogen in coastal waters. Shifts in plant composition haveoccurred at loadings of about 25 kg N/ha-yr (evaluated perhectare of estuary and marsh area) and possibly less34. Not onlyare these levels probably many times higher than a century ago,they are likely to increase with continued human populationgrowth, especially in the coastal corridors of the eastern U.S.
2. Acid deposition
Emissions of sulfur dioxide, nitrogen oxides and other acid-forming compounds cause acid rain or, more broadly, aciddeposition. Acid deposition can acidify soils and surface watersand leach important nutrients from soils. The amount of sulfurdeposited from the atmosphere far exceeds the needs of forestsplants in the Northeast and Mid-Atlantic regions of the U.S. As
a result, most of the sulfur is either leached from the ecosystemas sulfate or retained in the soils. In glaciated regions of theNortheast, soils have little capacity to retain sulfate, so most of the sulfate deposition leaches through the soils, strippingaway important soil nutrients such as calcium and magnesium.Nitrogen pollution contributes to the leaching of nitrate fromsoils with similar ramifications. The resulting acidification ofsoils mobilizes harmful aluminum, which can be toxic to treeroots, fish and other aquatic organisms35.
The fog and mist that are so prevalent in alpine and subalpineecosystems carry high loads of acid pollution36. There havebeen few studies on acid deposition’s impact on alpineecosystems in the eastern or western U.S. However, the effectsof acid deposition in the subalpine zone of the eastern U.S. have been studied in great detail. There, acid deposition leachescalcium from the needles of red spruce trees, rendering the tree less frost hardy and causing winter damage and, in manycases, tree death (see Box 2)37. This impact is thought to beresponsible for the widespread spruce decline observed innortheastern mountains during the 1980s, a problem thatcontinues to this day38.
The Chesapeake Bay, like other East Coast estuaries, suffers from pollution by excess nitrogen. © David Dorner/BigStockPhoto.com
17793:Layout 1 5/29/08 5:14 PM Page 9
10
In lower-elevation hardwood forests, the loss of soil nutrientscan stress plants that require a high calcium or magnesiumsupply such as sugar maple, white ash, basswood and floweringdogwood. Declines in sugar maple, an economically importanttree species, have been observed in calcium-poor areas in centraland western Pennsylvania and are attributed to a combinationof acid deposition and insect outbreaks39. Poor regeneration ofsugar maple has also been linked to the loss of available soilcalcium associated with acid rain40. Fertilization of plots withcalcium and magnesium appears to reverse the decline41.
Animals that inhabit forest ecosystems also may be affected bysoil acidification. Earthworms, slugs, centipedes and otherarthropods with high-calcium needs are among the soil animalsknown to be sensitive to acidity, although most of the studiesare from high-deposition areas in Europe45. Few studies havebeen conducted on higher-order animals. One study reportsthat the productivity of wood thrush populations is negatively
correlated with acid deposition levels across the northeasternU.S.46 This is a correlative result, but the proposed mechanismfor the response is plausible—that acid rain reduces the quantityor quality of the soil invertebrates that are the main source ofcalcium for wood thrushes. The reduction in acid-sensitiveinvertebrates is also reported to have caused declines inEuropean birds47. In an acidified forest in Pennsylvania, addinglime to increase calcium levels improved the bird habitat48.
Wetlands are generally less impaired by acid deposition thanother types of ecosystems. However, recent research hasdocumented an important synergistic effect between sulfurdeposition and the increased production of methylmercury, aform of mercury that readily biomagnifies through food webs in the environment. Added sulfur can stimulate the activity of specialized bacteria in wetland sediments, which convertinorganic mercury to methylmercury. Given the decades-longdeposition of sulfur to the wetland-rich landscape of the
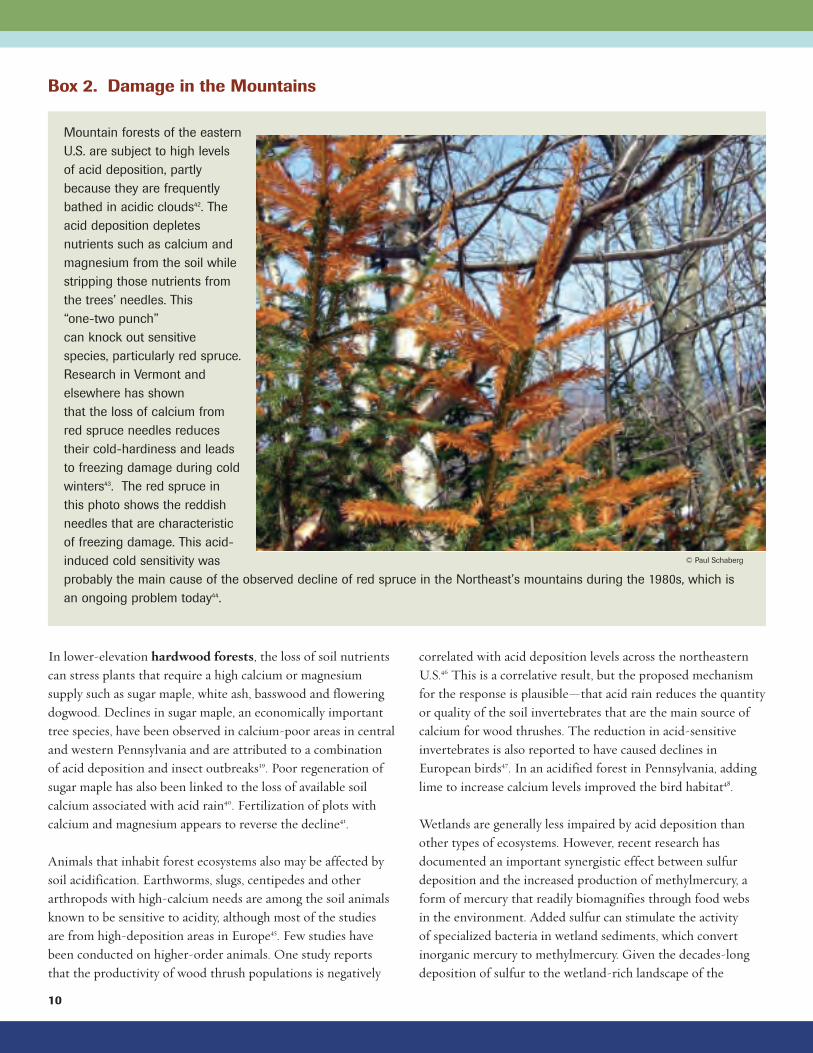
Mountain forests of the eastern
U.S. are subject to high levels
of acid deposition, partly
because they are frequently
bathed in acidic clouds42. The
acid deposition depletes
nutrients such as calcium and
magnesium from the soil while
stripping those nutrients from
the trees’ needles. This
“one-two punch”
can knock out sensitive
species, particularly red spruce.
Research in Vermont and
elsewhere has shown
that the loss of calcium from
red spruce needles reduces
their cold-hardiness and leads
to freezing damage during cold
winters43. The red spruce in
this photo shows the reddish
needles that are characteristic
of freezing damage. This acid-
induced cold sensitivity was
probably the main cause of the observed decline of red spruce in the Northeast’s mountains during the 1980s, which is
an ongoing problem today44.
Box 2. Damage in the Mountains
© Paul Schaberg
17793:Layout 1 5/29/08 5:14 PM Page 10
Northeast and Mid-Atlantic regions, the impact is widespreadand severe. (See page 12 for more on mercury pollution.)
The impacts of acid deposition on upland forests and wetlandshave adverse consequences for downstream surface waters.Much of the sulfate, nitrate and aluminum that is leached fromthe soil eventually flows into lakes and streams. As a result, acid deposition lowers the pH (increases the acidity) of surfacewaters, decreases acid neutralizing capacity and increases theconcentrations of toxic forms of aluminum49. Acid-neutralizingcapacity (ANC), the ability of water to neutralize strong acids,is a primary indicator of sensitivity to acidification. Theseeffects of acid deposition have been well known since the 1970s,and there is little doubt about the serious impact acidificationhas on a wide range of aquatic organisms.
Aquatic organisms vary widely in their sensitivity to acidification.The most sensitive organisms tend to be adversely affected whenpH drops below about 6, while some tolerant organisms cansurvive in waters as acid as pH 4. (The pH scale is logarithmic,so that pH 4 is 100 times more acidic than pH 6.) Thesensitivity of various organisms to acidification has been welldocumented and the general patterns are summarized in Box 3.As stream acidity increases, sensitive species either die out orseek refuge in less-acidified sections of the stream. Animals thatcan move downstream such as fish and invertebrates will often“drift” in search of better habitat conditions.
Stream and lake acidification can be chronic (persistentthroughout most of the year) or episodic (occurring primarilyafter rainstorms or snowmelt events). When surface watersbecome chronically acidic, both fish populations and fish speciesdiversity can decline. For example, research at ShenandoahNational Park in Virginia demonstrated that one fish species is lost for approximately every 21 micro-equivalents per literdecrease in minimum ANC levels from 160 to -10 micro-equivalents per liter50. In the Adirondack Mountains of NewYork, one fish species is lost for every 0.8 unit decline in lakepH from pH 6.5 to 4.051. In lakes of the Adirondacks and theWhite Mountains in New Hampshire, an average of 2.4zooplankton species (small animals that are consumed by fish)are lost with each pH unit decrease52. The effects of acidicdeposition are most severe in high-elevation, headwater streamsand lakes. Larger, low-gradient, lower-elevation streams andrivers in the Northeast and Mid-Atlantic show fewer impacts.In these larger watersheds, the neutralizing capacity of thewatershed soils often buffer the effects of atmosphericdeposition.
Episodic—or short term—acidification occurs during high-flowevents such as large rainstorms or snowmelt periods. These acidpulses can release high concentrations of dissolved aluminum,which can be toxic to fish in a short period of time. In gill-breathing animals such as fish, aluminum can interruptrespiration and other vital functions53, causing the animal to dieif it cannot find refuge.
In addition to the direct impacts of acid rain on species and ecosystems, indirect effects in lake and stream ecosystemsare also important. For instance, increased acidity can reducethe concentration of dissolved organic carbon (DOC) in lakes,decreasing the brown coloration of the water and allowing light to penetrate further into the lake. The increased sunlightwarms the lake, alters the ability of prey species to avoid theirpredators, and may increase the growth of algae and otherplants on the lake bottom. DOC is important for anotherreason: it can make aluminum less toxic, so a decrease in DOCincreases the toxicity of aluminum to fish and other organisms.Waterfowl are also impacted by acid deposition through twomechanisms. First, acidity mobilizes toxic metals (such asmercury) in the food chain and these metals may accumulate in the birds. Second, acidity, aluminum or other acid-mobilizedmetals may kill organisms that are part of the birds’ diet. InOntario, fish-eating birds have been found to be less abundantand breed less successfully on acidified lakes54.
3. Ozone
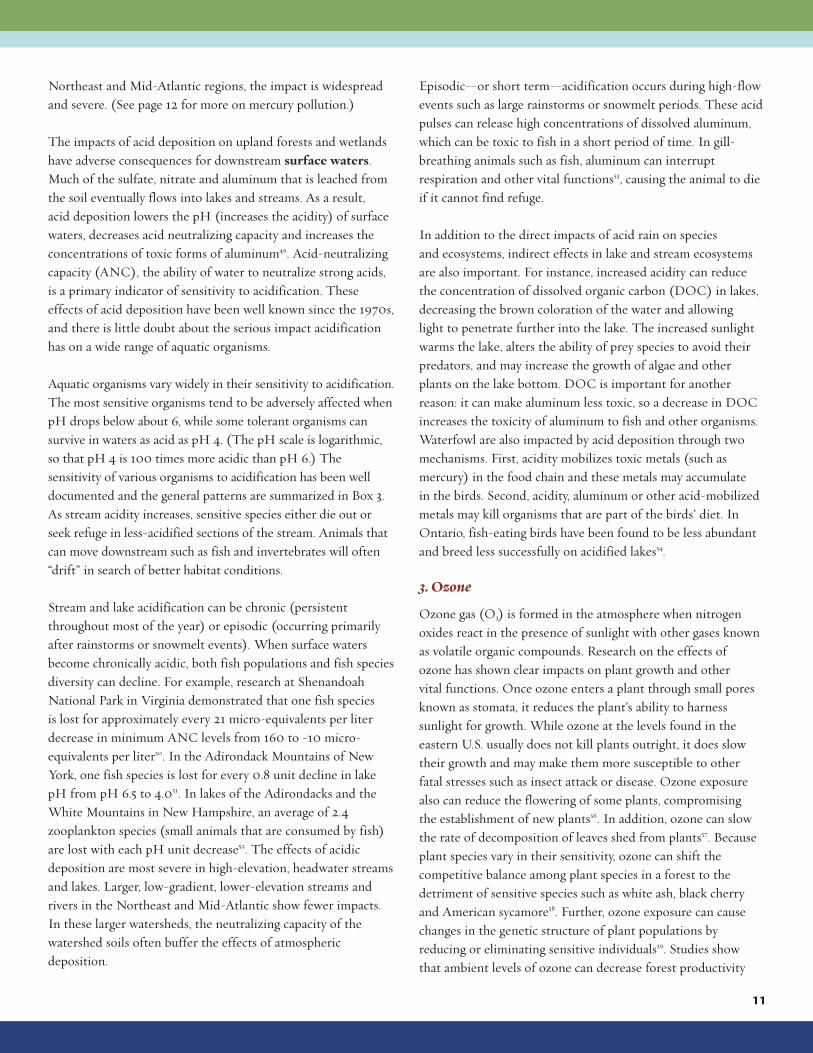
Ozone gas (O3) is formed in the atmosphere when nitrogenoxides react in the presence of sunlight with other gases knownas volatile organic compounds. Research on the effects of ozone has shown clear impacts on plant growth and other vital functions. Once ozone enters a plant through small poresknown as stomata, it reduces the plant’s ability to harnesssunlight for growth. While ozone at the levels found in theeastern U.S. usually does not kill plants outright, it does slowtheir growth and may make them more susceptible to otherfatal stresses such as insect attack or disease. Ozone exposurealso can reduce the flowering of some plants, compromising the establishment of new plants56. In addition, ozone can slowthe rate of decomposition of leaves shed from plants57. Becauseplant species vary in their sensitivity, ozone can shift thecompetitive balance among plant species in a forest to thedetriment of sensitive species such as white ash, black cherryand American sycamore58. Further, ozone exposure can causechanges in the genetic structure of plant populations byreducing or eliminating sensitive individuals59. Studies show that ambient levels of ozone can decrease forest productivity
11
17793:Layout 1 5/29/08 5:14 PM Page 11
12
in the Northeast from 2 percent to 16 percent60, with potentialeconomic consequences.
Several different indices of ozone exposure are used to assessecological effects. Sum06, an index commonly used in plantresearch, represents the cumulative exposure to ozoneconcentrations over 0.06 parts per million (ppm). Research has shown that Sum06 levels of 8-12 ppm-hr or greater arelikely to produce leaf and needle injury to some plants innatural ecosystems61.
The effects of ozone on the plants, shrubs and mosses of alpineand wetland ecosystems have not been extensively studied.However, several of the tree species that are commonly found inor around wetlands in this region, such as green ash andspeckled alder, are considered sensitive to ozone, suggesting thatmeasurable ozone impacts are plausible.
While there is considerable research on ozone damage to plants, less information is available on the effects of ozone onwildlife. Given the well-known effects of ozone on the humanrespiratory system, there may be significant impacts of ozoneexposure on any animals with similar respiration mechanisms62.
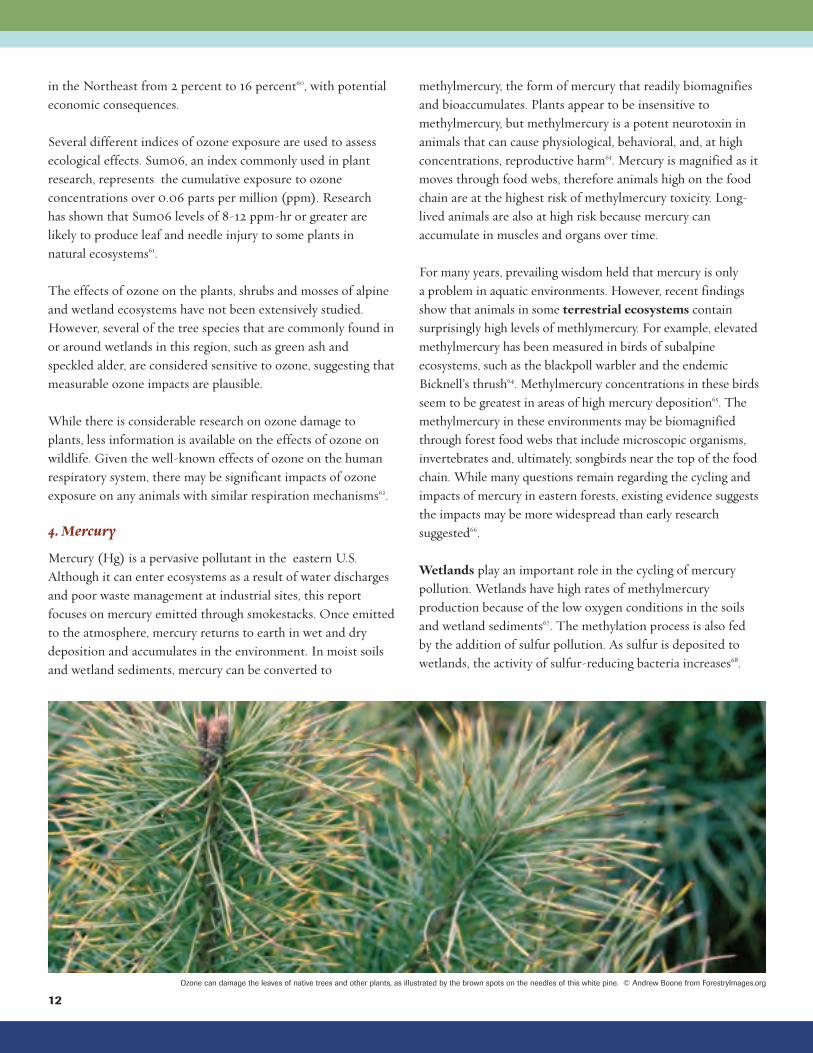
4. Mercury
Mercury (Hg) is a pervasive pollutant in the eastern U.S.Although it can enter ecosystems as a result of water dischargesand poor waste management at industrial sites, this reportfocuses on mercury emitted through smokestacks. Once emittedto the atmosphere, mercury returns to earth in wet and drydeposition and accumulates in the environment. In moist soilsand wetland sediments, mercury can be converted to
methylmercury, the form of mercury that readily biomagnifiesand bioaccumulates. Plants appear to be insensitive tomethylmercury, but methylmercury is a potent neurotoxin inanimals that can cause physiological, behavioral, and, at highconcentrations, reproductive harm63. Mercury is magnified as itmoves through food webs, therefore animals high on the foodchain are at the highest risk of methylmercury toxicity. Long-lived animals are also at high risk because mercury canaccumulate in muscles and organs over time.
For many years, prevailing wisdom held that mercury is only a problem in aquatic environments. However, recent findingsshow that animals in some terrestrial ecosystems containsurprisingly high levels of methlymercury. For example, elevatedmethylmercury has been measured in birds of subalpine ecosystems, such as the blackpoll warbler and the endemicBicknell’s thrush64. Methylmercury concentrations in these birdsseem to be greatest in areas of high mercury deposition65. Themethylmercury in these environments may be biomagnifiedthrough forest food webs that include microscopic organisms,invertebrates and, ultimately, songbirds near the top of the foodchain. While many questions remain regarding the cycling andimpacts of mercury in eastern forests, existing evidence suggeststhe impacts may be more widespread than early researchsuggested66.
Wetlands play an important role in the cycling of mercurypollution. Wetlands have high rates of methylmercuryproduction because of the low oxygen conditions in the soilsand wetland sediments67. The methylation process is also fed by the addition of sulfur pollution. As sulfur is deposited towetlands, the activity of sulfur-reducing bacteria increases68.
Ozone can damage the leaves of native trees and other plants, as illustrated by the brown spots on the needles of this white pine. © Andrew Boone from ForestryImages.org
17793:Layout 1 5/29/08 5:14 PM Page 12
13
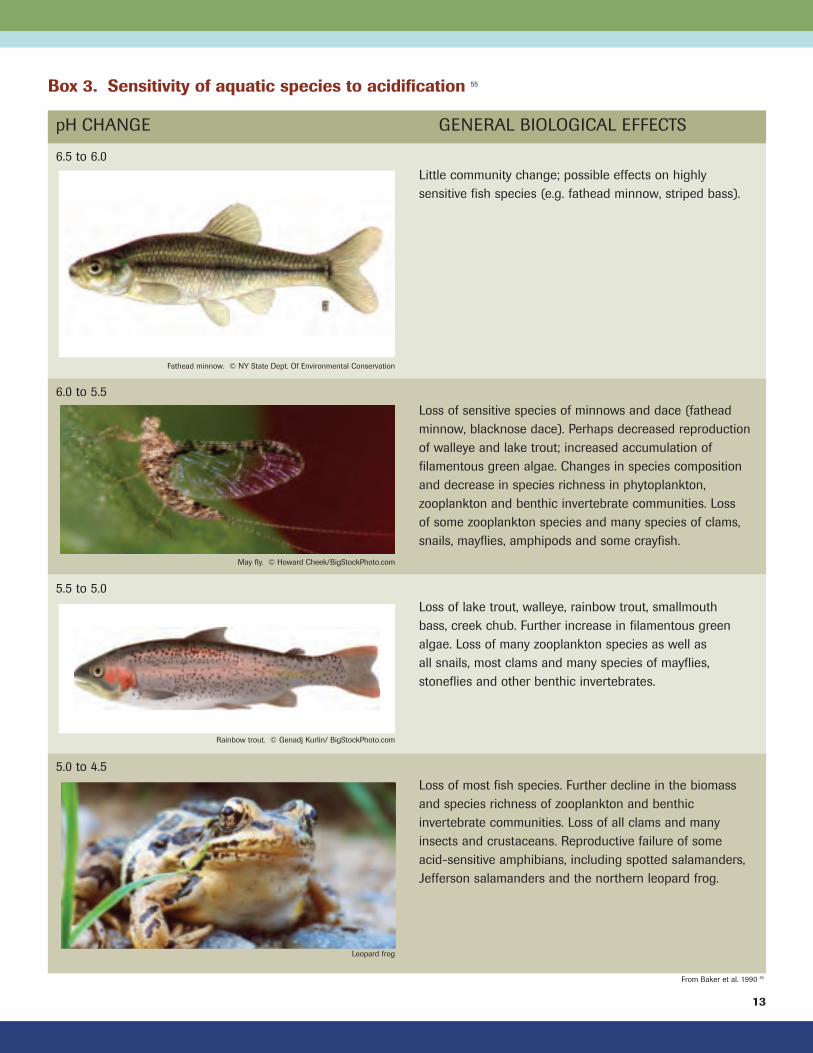
Box 3. Sensitivity of aquatic species to acidification 55
pH CHANGE GENERAL BIOLOGICAL EFFECTS
6.5 to 6.0
Little community change; possible effects on highly
sensitive fish species (e.g. fathead minnow, striped bass).
6.0 to 5.5
Loss of sensitive species of minnows and dace (fathead
minnow, blacknose dace). Perhaps decreased reproduction
of walleye and lake trout; increased accumulation of
filamentous green algae. Changes in species composition
and decrease in species richness in phytoplankton,
zooplankton and benthic invertebrate communities. Loss
of some zooplankton species and many species of clams,
snails, mayflies, amphipods and some crayfish.
5.5 to 5.0
Loss of lake trout, walleye, rainbow trout, smallmouth
bass, creek chub. Further increase in filamentous green
algae. Loss of many zooplankton species as well as
all snails, most clams and many species of mayflies,
stoneflies and other benthic invertebrates.
5.0 to 4.5
Loss of most fish species. Further decline in the biomass
and species richness of zooplankton and benthic
invertebrate communities. Loss of all clams and many
insects and crustaceans. Reproductive failure of some
acid-sensitive amphibians, including spotted salamanders,
Jefferson salamanders and the northern leopard frog.
From Baker et al. 1990 55
Rainbow trout. © Genadj Kurlin/ BigStockPhoto.com
Leopard frog
May fly. © Howard Cheek/BigStockPhoto.com
Fathead minnow. © NY State Dept. Of Environmental Conservation
17793:Layout 1 6/2/08 2:17 PM Page 13
14
These bacteria convert inorganic mercury to methylmercury,which can transfer to rivers and lakes where it biomagnifiesthrough the food web. This interaction between sulfur andmercury increases the adverse impact of mercury in wetlandsreceiving inputs of sulfate69. Animals near the top of the foodchain in fens, bogs and other wetlands, such as birds thatconsume invertebrates, are at a high risk for mercuryaccumulation in these ecosystems.
Mercury moves through wetlands and upland environments to streams and lakes. According to extensive research, theimpacts of mercury levels on freshwater fish as well as fish-eating birds and mammals include declines in reproductivesuccess, lower disease resistance and impairment of key survival behaviors (such as grooming and feeding).
Fish species with high mercury levels include large, long-livedspecies such as walleye, northern pike and largemouth andsmallmouth bass. Other species with elevated mercury includeyellow and white perch and lake trout. A recent synthesis ofmercury research from the Northeast shows that mercuryconcentrations in fish tend to decrease with increasing pH,sulfate and acid neutralizing capacity in lakes70. The directeffects of methylmercury on fish include the inhibition ofnormal growth and male sex organ development71, reducedpredator avoidance72 and decreased reproduction73.
There are few studies of mercury’s effects on amphibians, withthe important exception of salamanders. Salamanders oftenexhibit elevated mercury levels, and the absence of salamanderspecies in some habitats has been linked to chemical changessuch as greater acidification and increased methylmercuryavailability74. There is compelling evidence that the high inputof mercury and sulfur in the Appalachian Mountains could havenegative impacts on populations of the many salamander speciesthat reside in upper watershed streams and ponds75.
The impact of mercury contamination on birds is a seriousconservation concern. Bird species in which the effects ofmercury are well known from laboratory and field studiesinclude the mallard76, common loon and bald eagle. Mercurypoisoning in these birds can lead to reduced reproductivesuccess, behavioral changes such as reduced time spent hunting,and neurological problems such as brain lesions, spinal corddegeneration and tremors77. Recent research on common loonsdemonstrates that reproduction is lower in birds with bloodmercury levels equal to or greater than 3.0 ppm78. Mercury has been shown to harm the reproductive success of wildpopulations including the bald eagle in Maine79, the great egret in Florida80, the clapper rail in San Francisco Bay,California81and the snowy egret in Nevada82.
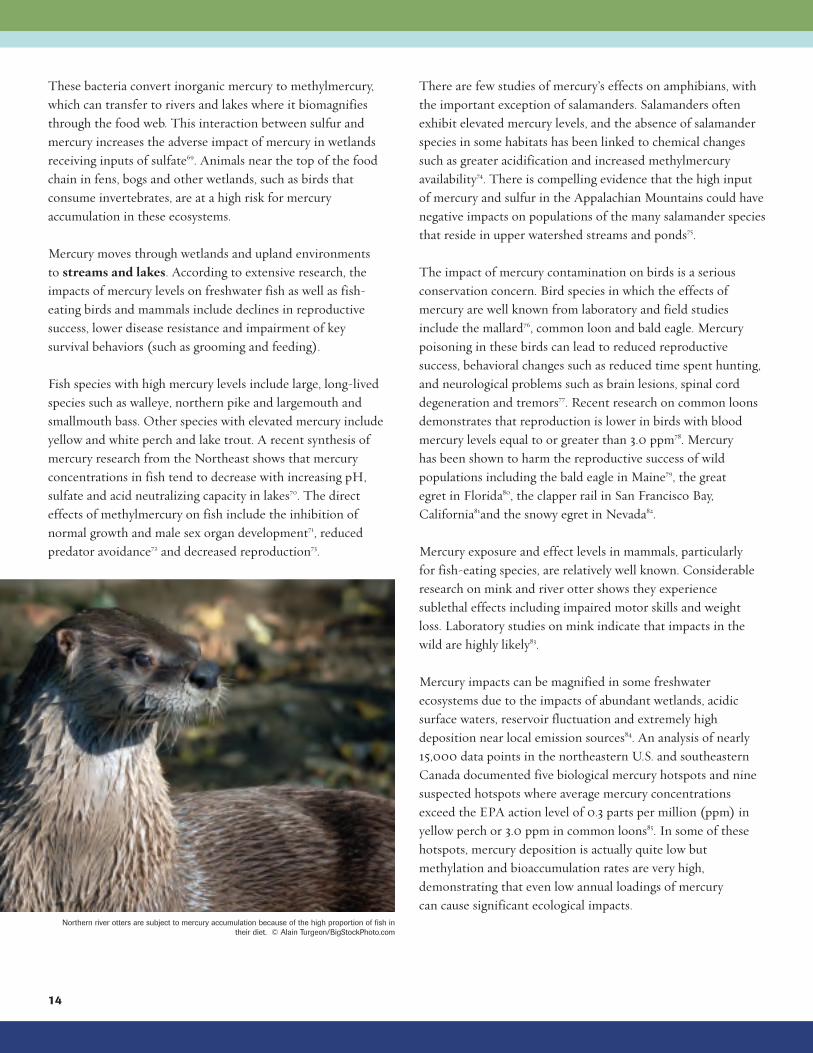
Mercury exposure and effect levels in mammals, particularly for fish-eating species, are relatively well known. Considerableresearch on mink and river otter shows they experiencesublethal effects including impaired motor skills and weightloss. Laboratory studies on mink indicate that impacts in thewild are highly likely83.
Mercury impacts can be magnified in some freshwaterecosystems due to the impacts of abundant wetlands, acidicsurface waters, reservoir fluctuation and extremely highdeposition near local emission sources84. An analysis of nearly15,000 data points in the northeastern U.S. and southeasternCanada documented five biological mercury hotspots and ninesuspected hotspots where average mercury concentrationsexceed the EPA action level of 0.3 parts per million (ppm) inyellow perch or 3.0 ppm in common loons85. In some of thesehotspots, mercury deposition is actually quite low butmethylation and bioaccumulation rates are very high,demonstrating that even low annual loadings of mercury can cause significant ecological impacts.
Northern river otters are subject to mercury accumulation because of the high proportion of fish in
their diet. © Alain Turgeon/BigStockPhoto.com
17793:Layout 1 5/29/08 5:14 PM Page 14
15
It is well known that freshwater wetlands are hotspots formercury methylation, but the role of coastal habitats such as salt marshes is less well understood and of increasing concern86.Recent research indicates that blood mercury concentrations inthe saltmarsh sharp-tailed sparrow tend to be higher than othersongbirds87 and high mercury levels may be correlated withlower reproductive success. It is likely that saltmarsh sharp-tailed sparrows have significantly higher blood mercury levelsthan another sparrow species sharing a similar range becausethey consume prey higher on the food chain88.
B. Air Pollution and Environmental ChangeUnderstanding the complex interactions among air pollutantsand other environmental disturbances such as climate changepresents a monumental challenge for scientists andconservationists alike. Not only do multiple pollutants interact,but the changing climate affects every biological and chemicalprocess in ecosystems. For example, increases in temperaturehave reduced the duration of ice cover on lakes89, and changes in
temperature also affect the frost-hardinessof spruce trees subject to acid deposition90.Gradients of temperature and moisturestrongly affect the distribution oforganisms91, so the whole assemblage ofecosystems can change as the climateshifts. While it is extremely difficult topredict the precise effects of pollutants onecosystems in a changing climate, it is clearthat pollution reduction will have positiveeffects under any climatic conditions.
Invasions of non-native species alsointeract with air pollution. Deposition ofnitrogen may make some habitats moresuitable for weedy invasive plants92 andmay make trees more susceptible to exoticpests93. Invasive aquatic species canradically change the communitycomposition of surface waters, thus alteringthe effects of acid deposition on the biota.
Land use changes influence the effects ofair pollution by changing the distributionof emission sources and by changing the
physical characteristics of the landscape that receives thepollution94. For example, forest edges capture more pollution thaninterior forests95 and urban lands and row crop agriculture exporttwo to three times more nitrogen runoff per acre than forestedlandscapes96. Therefore, as watersheds fragment and urbanize,nitrogen pollution to downstream waters is likely to increase.
In general, while controlled studies have enhanced scientificunderstanding of the effects of air pollution, the added impactsof other environmental changes—climate change, land usechange and non-native species invasions—makes it difficult topredict ecosystems’ responses to changing pollutant loading.However, these complications should not be an excuse forinaction. Lowering atmospheric deposition will reduce the likelihood of damage to natural ecosystems, no matter what other stresses are present.
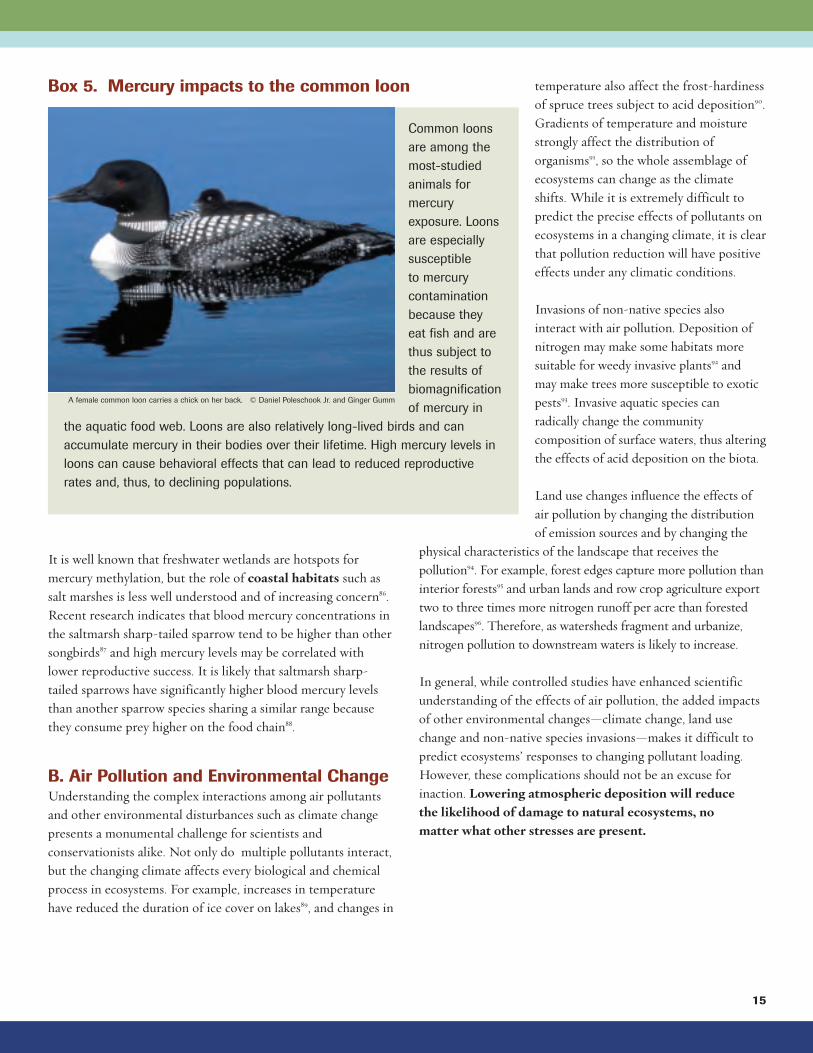
Common loons
are among the
most-studied
animals for
mercury
exposure. Loons
are especially
susceptible
to mercury
contamination
because they
eat fish and are
thus subject to
the results of
biomagnification
of mercury in
the aquatic food web. Loons are also relatively long-lived birds and can
accumulate mercury in their bodies over their lifetime. High mercury levels in
loons can cause behavioral effects that can lead to reduced reproductive
rates and, thus, to declining populations.
Box 5. Mercury impacts to the common loon
A female common loon carries a chick on her back. © Daniel Poleschook Jr. and Ginger Gumm
17793:Layout 1 5/29/08 5:14 PM Page 15
II. air pollution, biological
diversity and critical loads
While important questions remain, the scientific evidence isclear: Air pollution adversely impacts most types of ecosystemsin the Northeast and Mid-Atlantic regions and must be furtherreduced. The conservation of biological diversity and othernatural resources during the past several decades has relied onconventional land protection methods such as land acquisitionand the purchase or donation of conservation easements. Thisapproach came into favor when the principal threat tobiodiversity was assumed to be land conversion for residentialand commercial development. The effectiveness of conservationeasements and land acquisition spurred the land trustmovement, giving rise to the more than 580 land trusts thatnow exist in the Northeast alone. The Nature Conservancyitself invests millions of dollars in land protection each year forthe purpose of conserving global biological diversity.
While these investments have been important to protectingbiodiversity, it is clear that the impacts of atmospheric pollutionthreaten to undermine these efforts. An expanded approach toconservation that accounts for atmospheric pollutants will helpsafeguard the centuries of personal and financial investmentsmade to preserve these ecosystems for people and wildlife. Thiscould be accomplished by establishing more ecologically basedair pollution standards (known as secondary standards) and by developing limits on air pollution loading.
Despite the well-documented environmental harm caused by atmospheric nitrogen, sulfur, ozone and mercury pollution,the U.S. has never implemented a separate secondary standardspecifically aimed at reducing the environmental effects of thesepollutants. Current U.S. air quality regulations focus on what is emitted into the atmosphere, but do not actually limit theamount of pollution deposited to the landscape.
Air pollution loading limits are based on the amount of a givenpollutant that is deposited to ecosystems. Several approaches areused to determine whether pollution deposition levels areacceptable. Two of the most commonly used methods are: (1) redline/green line designations and (2) critical loads. The red line/green line approach was first used to help
16
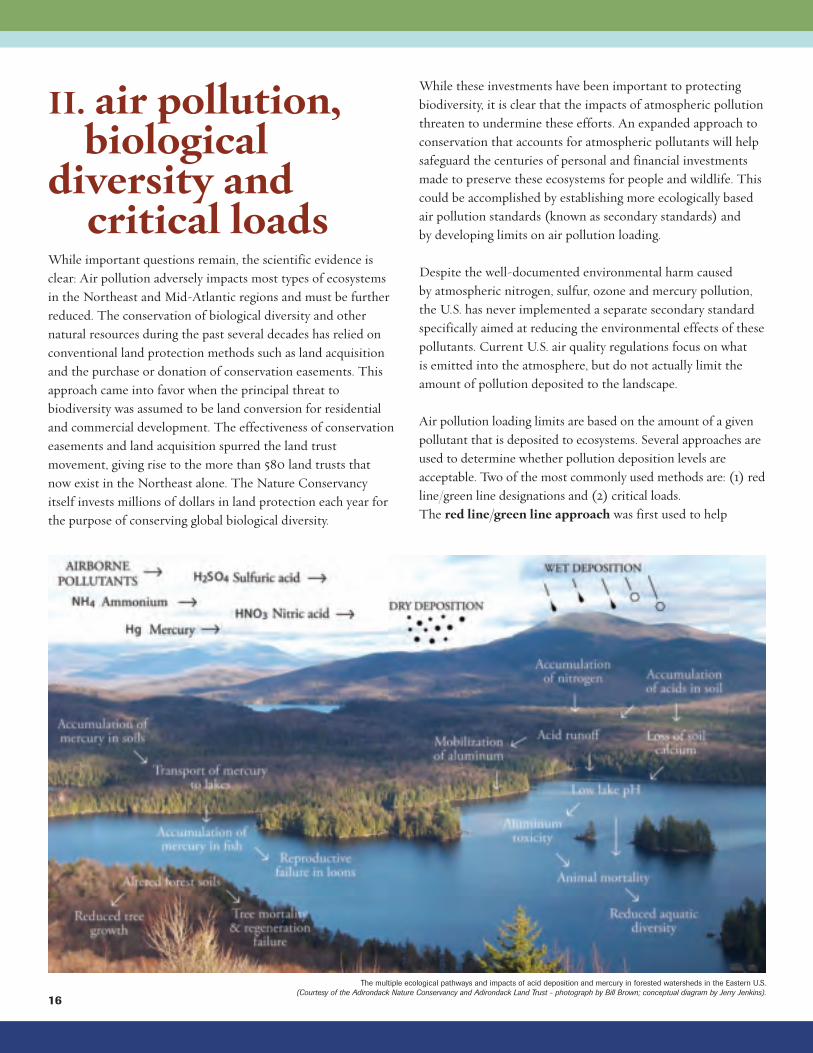
The multiple ecological pathways and impacts of acid deposition and mercury in forested watersheds in the Eastern U.S.
(Courtesy of the Adirondack Nature Conservancy and Adirondack Land Trust - photograph by Bill Brown; conceptual diagram by Jerry Jenkins).
17793:Layout 1 5/29/08 5:15 PM Page 16
managers of U.S. Forest Service wilderness areas determine thepotential impacts of new air pollution sources proposed upwindof wilderness areas97. The green line is the deposition orconcentration level below which there is high certainty of noadverse impacts, and the red line is the deposition orconcentration level above which there is high certainty ofadverse impacts on at least some component of the ecosystem.The selection of green and red line values is largely based onexisting evidence and professional judgment. Between the redline and the green line is the “yellow zone” where moreinformation is needed to determine if air pollution will have a significant impact.
The critical load is a pollutant’s maximum level of depositionthat does not incur long-term harm to ecological health. Theconcept and its application first emerged in Europe to addresspollution problems under the Convention on Long-rangeTransboundary Air Pollution (LRTAP). Critical loadcalculations typically determine the amount of pollution thatcan be deposited in a specific geographic area without harmingnatural resources. In theory, if pollution loads are kept belowthese critical values, environmental harm can be avoided orperhaps reversed. Comparing critical load values to currentdeposition levels can determine where and by how muchcurrent pollution levels should be reduced.
Researchers must identify and define a number of factors in order to quantitatively estimate the critical loads foratmospheric pollutants. These factors include the type ofpollution causing the disturbance, the characteristics of thereceiving ecosystem, the sensitive elements within thatecosystem and a definition of harm. In addition, a numericalrelationship must be developed between the deposition and theimpacts to the ecosystem. This relationship is generally basedon either an empirical dose-response relationship or modelsimulation. Given the wide variation in sensitivity across thelandscape, an analysis of critical loads may result in severalcritical load values for a given atmospheric pollutant.
The development of critical loads is a complex process thatoften requires years of supporting data. However, several studiesprovide a substantial start. Many relevant critical load studies of U.S. forests in the Northeast generally use a catchment-basedapproach98. Several critical loads of acid deposition have beenestimated for lakes in the Northeast99 and for streams in theMid-Atlantic States and central Appalachians100. In the westernU.S., the primary concern is establishing critical loads fornitrogen deposition affecting terrestrial and aquatic resources
through eutrophication or nitrogen enrichment101. Thisconsiderable body of research clearly indicates that ampleresources exist to begin developing and implementing criticalloads in key areas of the U.S.
Several efforts are underway to promote the use of critical loadsto both manage air pollution and protect key public resources in the U.S.102 Such efforts include:
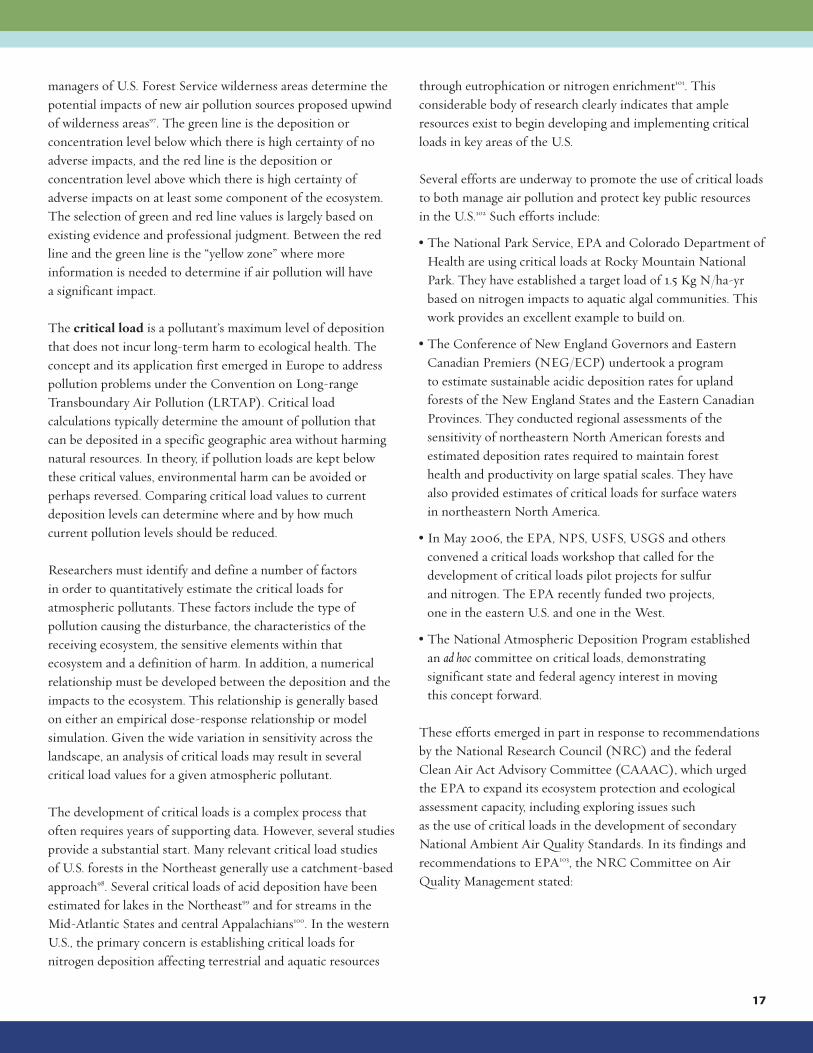
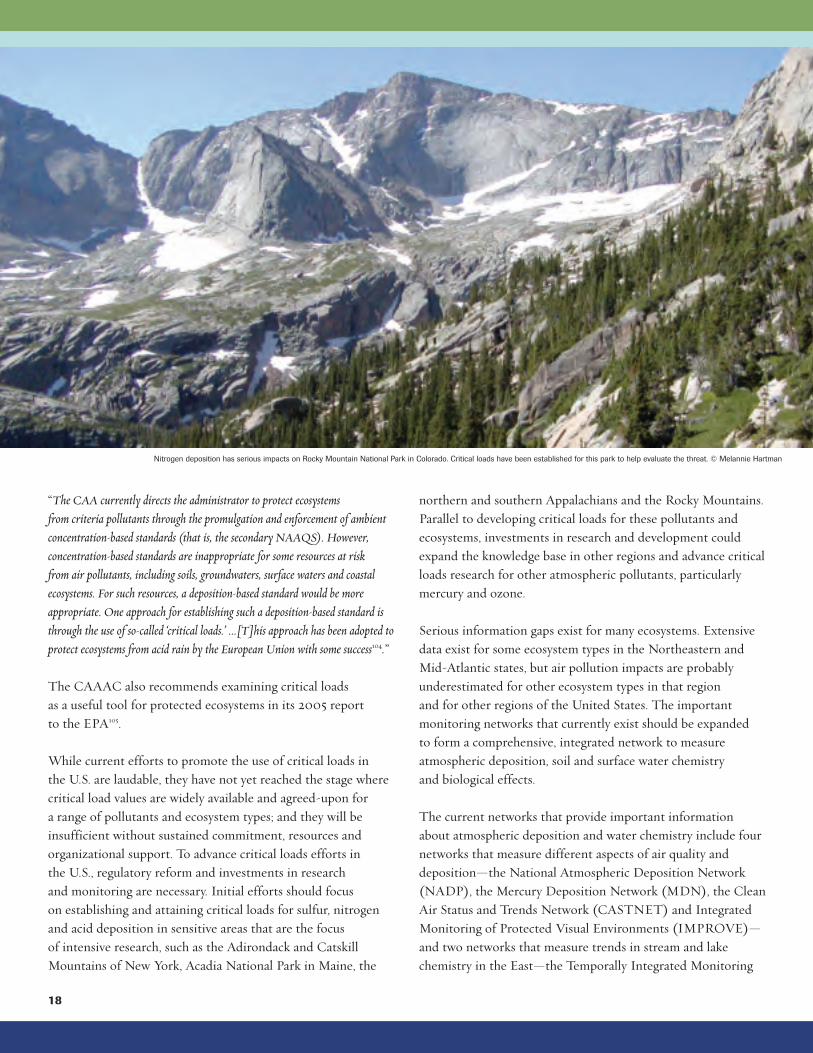
• The National Park Service, EPA and Colorado Depart ment ofHealth are using critical loads at Rocky Mountain NationalPark. They have established a target load of 1.5 Kg N/ha-yrbased on nitrogen impacts to aquatic algal commun ities. Thiswork provides an excellent example to build on.
• The Conference of New England Governors and EasternCanadian Premiers (NEG/ECP) undertook a program to estimate sustainable acidic deposition rates for uplandforests of the New England States and the Eastern CanadianProvinces. They conducted regional assessments of thesensitivity of northeastern North American forests andestimated deposition rates required to maintain forest health and productivity on large spatial scales. They have also provided estimates of critical loads for surface waters in northeastern North America.
• In May 2006, the EPA, NPS, USFS, USGS and othersconvened a critical loads workshop that called for thedevelopment of critical loads pilot projects for sulfur and nitrogen. The EPA recently funded two projects, one in the eastern U.S. and one in the West.
• The National Atmospheric Deposition Program establishedan ad hoc committee on critical loads, demonstrating significant state and federal agency interest in moving this concept forward.
These efforts emerged in part in response to recommendationsby the National Research Council (NRC) and the federalClean Air Act Advisory Committee (CAAAC), which urgedthe EPA to expand its ecosystem protection and ecologicalassessment capacity, including exploring issues such as the use of critical loads in the development of secondaryNational Ambient Air Quality Standards. In its findings andrecommendations to EPA103, the NRC Committee on AirQuality Management stated:
17
17793:Layout 1 5/29/08 5:15 PM Page 17
“The CAA currently directs the administrator to protect ecosystems from criteria pollutants through the promulgation and enforcement of ambientconcentration-based standards (that is, the secondary NAAQS). However,concentration-based standards are inappropriate for some resources at risk from air pollutants, including soils, groundwaters, surface waters and coastalecosystems. For such resources, a deposition-based standard would be moreappropriate. One approach for establishing such a deposition-based standard isthrough the use of so-called ‘critical loads.’ …[T]his approach has been adopted toprotect ecosystems from acid rain by the European Union with some success104.”
The CAAAC also recommends examining critical loads as a useful tool for protected ecosystems in its 2005 report to the EPA105.
While current efforts to promote the use of critical loads in the U.S. are laudable, they have not yet reached the stage wherecritical load values are widely available and agreed-upon for a range of pollutants and ecosystem types; and they will beinsufficient without sustained commitment, resources andorganizational support. To advance critical loads efforts in the U.S., regulatory reform and investments in research and monitoring are necessary. Initial efforts should focus on establishing and attaining critical loads for sulfur, nitrogenand acid deposition in sensitive areas that are the focus of intensive research, such as the Adirondack and CatskillMountains of New York, Acadia National Park in Maine, the
northern and southern Appalachians and the Rocky Mountains.Parallel to developing critical loads for these pollutants andecosystems, investments in research and development couldexpand the knowledge base in other regions and advance criticalloads research for other atmospheric pollutants, particularlymercury and ozone.
Serious information gaps exist for many ecosystems. Extensivedata exist for some ecosystem types in the Northeastern andMid-Atlantic states, but air pollution impacts are probablyunderestimated for other ecosystem types in that region and for other regions of the United States. The importantmonitoring networks that currently exist should be expanded to form a comprehensive, integrated network to measureatmospheric deposition, soil and surface water chemistry and biological effects.
The current networks that provide important informationabout atmospheric deposition and water chemistry include fournetworks that measure different aspects of air quality anddeposition—the National Atmospheric Deposition Network(NADP), the Mercury Deposition Network (MDN), the CleanAir Status and Trends Network (CASTNET) and IntegratedMonitoring of Protected Visual Environments (IMPROVE)—and two networks that measure trends in stream and lakechemistry in the East—the Temporally Integrated Monitoring
18
Nitrogen deposition has serious impacts on Rocky Mountain National Park in Colorado. Critical loads have been established for this park to help evaluate the threat. © Melannie Hartman
17793:Layout 1 5/29/08 5:15 PM Page 18
of Ecosystems (TIME) and Long-Term Monitoring Network(LTM). It is essential that each of these networks receive thefunding they need to thrive. But supporting existing monitoringis not enough. Establishing a more comprehensive, integratedmonitoring network would provide the information needed toevaluate and refine critical loads for sulfur and nitrogen,develop critical loads for mercury and track ecological responsesto changes in air pollution loading over time.
III. a call to action
Air pollution harms every major ecosystem type in theNortheastern and Mid-Atlantic states, producing economiclosses, reducing scenic beauty, decreasing the value ofconservation investments, and damaging forests, lakes, rivers,wetlands and coastal waters. Despite these widespread impacts,there are no standards in place to actually limit the amount of pollution deposited to the landscape.
Conventional land protection tools and current air pollutionregulations are necessary but insufficient to protect the nation’slife support systems from high levels of atmospheric pollutantssuch as sulfur, nitrogen, mercury and ozone. The science shows that we must act to address this dangerous gap.Investments that serve to reduce air pollution can reap
benefits for ecosystem productivity, human health and economiclivelihoods.
In 2006, The Nature Conservancy and the Cary Institute of Ecosystem Studies convened a workshop of scientists andconservationists to examine air pollution impacts on plants,animals and habitats in the Northeast and Mid-Atlantic states.The participants produced a workshop report detailing thenature and scope of the problem (Lovett and Tear 2007, seewww.ecostudies.org/reprints/Effects_of_atmospheric_deposition_on_biodiversity.pdf ).
Based on the cumulative weight of the scientific evidence, The Nature Conservancy and the Cary Institute of Ecosystem Studies issue this call to action to confront the pervasive problem of air pollution damage to our nation’s natural resources.
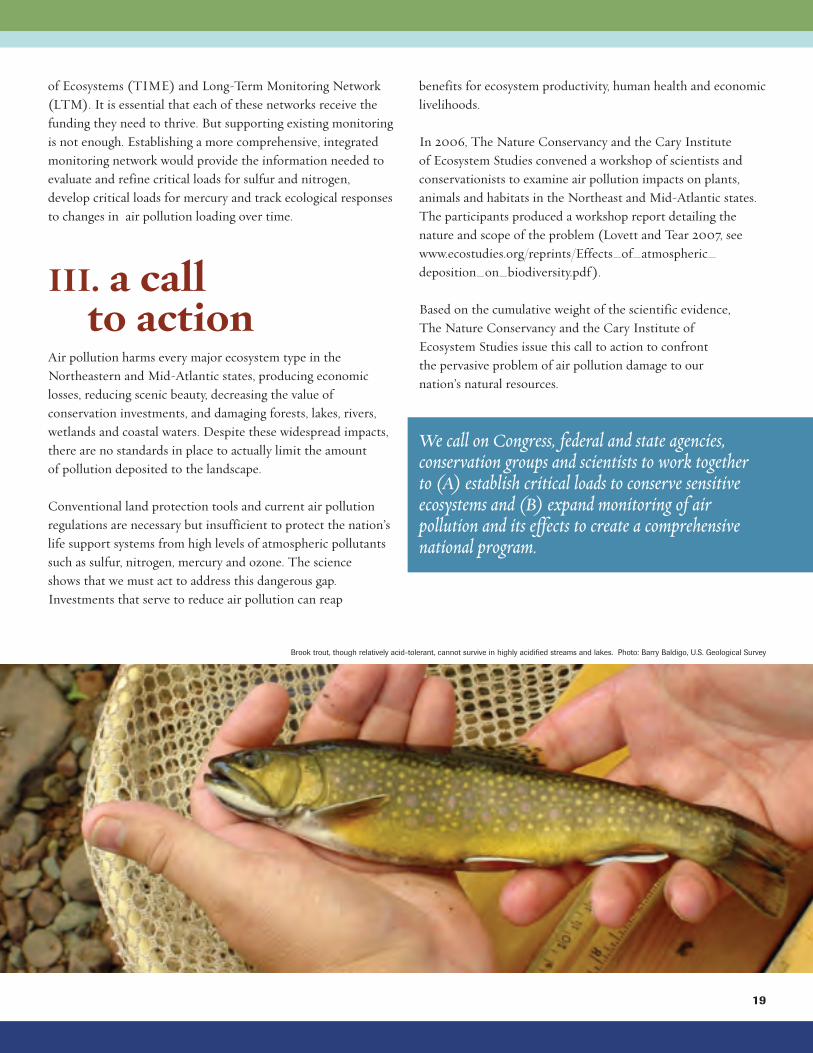
We call on Congress, federal and state agencies,conservation groups and scientists to work together to (A) establish critical loads to conserve sensitiveecosystems and (B) expand monitoring of airpollution and its effects to create a comprehensivenational program.
19
Brook trout, though relatively acid-tolerant, cannot survive in highly acidified streams and lakes. Photo: Barry Baldigo, U.S. Geological Survey
17793:Layout 1 5/29/08 5:15 PM Page 19

20
A. Establish Critical Loads to Conserve Sensitive EcosystemsWe recommend the development and implementation ofcritical loads to protect sensitive ecosystems. We know thatcurrent deposition exceeds harmful levels in many landscapes.In other regions, we lack the data needed to recommendspecific deposition limits. Air pollution doesn’t recognizeregional boundaries and therefore requires a national solution.Members of Congress, federal and state regulators, landmanagers, research scientists and conservation organizationsmust work together to advance policy and managementsolutions. We offer the following specific recommendations:
1. Congress should direct the Environmental ProtectionAgency (EPA) to develop and implement critical loads forsulfur, nitrogen and mercury pollution, beginning withsensitive ecosystems that receive high deposition levels.Congress also should allocate funding for the research andmonitoring needed to support this national initiative. Settingcritical loads should be viewed as an evolving process, inwhich loading limits are established based on the bestavailable data and later refined as more data become availablefrom targeted studies.
2. The EPA should use critical loads to assess the progress madeunder the Clean Air Act and other regulations such as theClean Air Interstate Rule. We cannot rely on air chemistrymeasurements alone to determine whether air pollution iscontinuing to damage our natural resources.
3. While critical load development is underway, the EPAshould use the best available science to establish enforceable,ecologically based air quality standards for sulfur, nitrogenand ozone through the National Ambient Air QualityStandards. However, because the air quality standards onlyaddress the concentration of pollution in the air, critical loadsmust supplement these standards for sulfur, nitrogen andmercury.
4. Federal land management agencies such as the U.S. ForestService and the National Park Service should expand theirefforts to develop site-specific critical loads to protect keypublic resources in high-pollution areas such as the Whiteand Green Mountain National Forests and Acadia andShenandoah National Parks, following the precedent set in the Rocky Mountain National Park.
5. Partnerships between research scientists and governmentagencies should be formalized and expanded to further assessthe impact of atmospheric deposition to our nation’s biologicalresources and to develop dose-response relationships forspecific pollutants that can be used to support and refinecritical loads.
6. Conservation organizations should include atmosphericdeposition in their conservation agendas and should advancethe development of critical loads by supporting necessarylegislative changes, adapting land management activities toaccount for impacts of atmospheric deposition and offeringtheir lands and waters for critical loads research anddevelopment.
Bald eagles are at high risk of mercury accumulation because they often consume fish.
© Daniel Poleschook Jr. and Ginger Gumm
17793:Layout 1 5/29/08 5:15 PM Page 20
21
B. Expand Monitoring of Air Pollution andits Effects to Create a ComprehensiveNational ProgramDespite years of research documenting the impacts of airpollution on our natural life support systems, currently there isno integrated national monitoring program in place to measurethe comprehensive effects of changing emissions. Monitoring of atmospheric deposition and surface water chemistry has beenessential to U.S. policy formulation and assessment, but thefunding for these programs is constantly under threat. Further,there is no comprehensive monitoring of the impacts of airpollution on forests, soils, or most plants and animals.Therefore, we recommend that:
1. Increased funding should be allocated to expand existingmulti-pollutant monitoring programs so that currentefforts to monitor air pollution and surface water chemistrycan expand, and new programs can be implemented tomonitor forests, soils, wildlife and other natural resources thatare threatened by air pollution. A comprehensive andintegrated monitoring network would help address importantinformation gaps and inform the development andrefinement of critical loads.
2. The comprehensive air pollution monitoring programshould be established as soon as possible and should buildon existing efforts. As part of this effort, current air pollutionmonitoring programs should be fully funded. These programsinclude: the National Atmospheric Deposition Program, the Mercury Deposition Network, the Clean Air Status andTrends Network, Integrated Monitoring of Protected VisualEnvironments and the Temporally Integrated Monitoring ofEcosystems and Long-Term Monitoring Network.
3. The comprehensive air pollution monitoring programshould be long-term and national in scope, it should useestablished monitoring procedures, and it should initiallyfocus on the impacts of atmospheric deposition on naturalresources. The program should also be designed with capacityto expand in the future to measure responses to otherenvironmental changes such as climate change, invasivespecies and urbanization.
ACKNOWLEDGMENTSWe thank the contributors to this report, who are listed on thecover, for their valuable help with writing and reviewing thereport. We are grateful to the participants in the workshop thatwas the genesis of this report. We also thank Charles Canhamwho helped us conceive the project and organize the workshop,and Gene Likens for his encouragement, assistance andparticipation in the workshop. This effort is possible due to agrant from the Rodney Johnson and Katherine OrdwayStewardship Fund within The Nature Conservancy.
CREDITSProject consultant: Kathy Fallon Lambert, Ecologic: Analysis & Communications
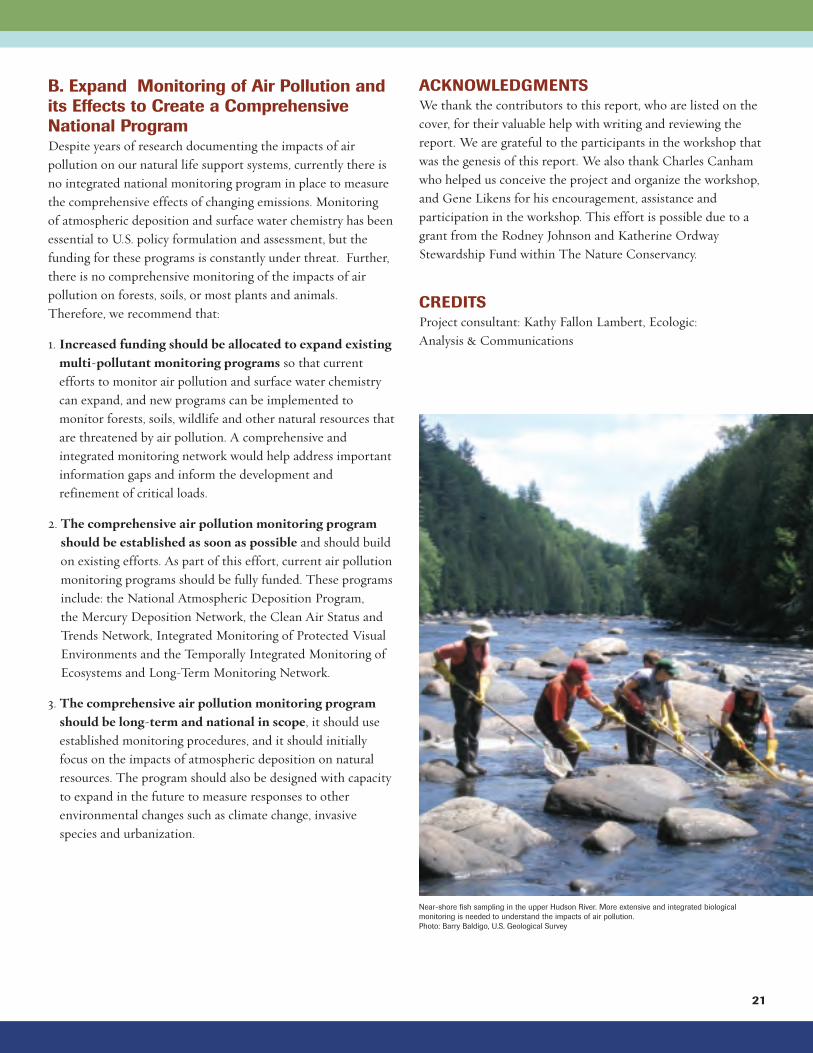
Near-shore fish sampling in the upper Hudson River. More extensive and integrated biological
monitoring is needed to understand the impacts of air pollution.
Photo: Barry Baldigo, U.S. Geological Survey
17793:Layout 1 5/29/08 5:15 PM Page 21
22
REFERENCES1 Lovett, G.M. and T. Tear. 2007. Effects of Atmospheric Deposition on Biological Diversity in the Eastern UnitedStates. Workshop Report. The Nature Conservancy and the Cary Institute of Ecosystem Studies. 56 pp.
2 Gorham, E. 1989. Scientific understanding of ecosystem acidification - a historical review. Ambio. 18:150-154.
3 Lovett and Tear, 2007.
4 Driscoll, C.T., G.B. Lawrence, A.J. Bulger, T.J. Butler, C.S. Cronan, C. Eagar, K.F. Lambert, G.E. Likens, J.L.Stoddard, and K.C. Weathers. 2001. Acidic deposition in the northeastern United States: Sources and inputs,ecosystem effects, and management strategies. Bioscience. 51:180-198.
5 Driscoll, C.T., Y.-J. Han, C.Y. Chen, D.C. Evers, K.F. Lambert, T.M. Holsen, N.C. Kamman, and R.K. Munson. 2007. Mercury contamination in forest and freshwater ecosystems in the Northeastern United States. BioScience. 57:17-28.
6 Vitousek, P.M., J.D. Aber, R.W. Howarth, G.E. Likens, P.A. Matson, D.W. Schindler, W.H. Schlesinger, D.G.Tilman. 1997. Technical Report: Human Alteration of the Global Nitrogen Cycle: Sources and Consequences.Ecological Applications. 7(3):737-750.
7 Galloway, J.N. and E.B. Cowling. 2002. Reactive Nitrogen and the World: 200 Years of Change. Ambio.31(2):64-71; Galloway, J.N., J.D. Aber, J.W. Erisman, S.P. Seitzinger, R.W. Howarth, E.B. Cowling, and B.J. Cosby. 2003. The nitrogen cascade. Bioscience. 53:341-356.
8 e.g., Aber, J., W. McDowell, K. Nadelhoffer, A. Magill, G. Berntson, M. Kamakea, S. McNulty, W. Currie, L. Rustad, and I. Fernandez. 1998. Nitrogen saturation in temperate forest ecosystems: Hypotheses revisited.Bioscience 48:921-934.
9 Bowman, W.D., J.R. Gartner, K. Holland, and M. Wiedermann. 2006. Nitrogen critical loads for alpinevegetation and terrestrial ecosystem response: Are we there yet? Ecological Applications. 16:1183-1193
10 Weathers, K.C., M.L. Cadenasso, and S.T.A. Pickett. 2001. Forest edges as nutrient and pollutant concentrators: Potential synergisms between fragmentation, forest canopies, and the atmosphere. Conservation Biology. 15:1506-1514.
Weathers, K.C., S.M. Simkin, G.M. Lovett, and S.E. Lindberg. 2006. Empirical modeling of atmosphericdeposition in mountainous landscapes. Ecological Applications. 16:1590-1607.
11 Aber, J.D., C.L. Goodale, S.V. Ollinger, M.L. Smith, A.H. Magill, M.E. Martin, R.A. Hallett, and J.L. Stoddard.2003. Is nitrogen deposition altering the nitrogen status of northeastern forests? Bioscience. 53:375-389.
12 Aber et al., 2003.
13 Nadelhoffer, K.J., B. Emmet, P. Gundersen, O.J. Kjonaas, C.J. Koopmans, P. Schleppi, A. Tietema, and R.F.Wright. 1999. Nitrogen deposition makes a minor contribution to carbon sequestration in temperate forests.Nature. 398:145-148.
Magnani, F., M. Maurizio Mencuccini, M. Borghetti, P. Berbigier, F. Berninger, S. Delzon, A. Grelle, P. Hari, P.G. Jarvis, P. Kolari, A.S. Kowalski, H. Lankreijer, B.E. Law, A. Lindroth, D. Loustau, G. Manca, J. B. Moncrieff,M. Rayment, V. Tedeschi, R. Valentini, J. Grace. 2007. The human footprint on the carbon cycle of temperate and boreal forests. Nature. 447:849-851.
14 See Caspersen, J.P., S.W. Pacala, J.C. Jenkins, G.C. Hurtt, P.R. Moorcroft, R.A. Birdsey. 2000. Contributions of LandUse History to Carbon Accumulation in U.S. Forests. Science. 290(5494):1148 – 1151;
Hicke, J.A., G.P. Asner, J.T. Randerson, C. Tucker, S. Los, R. Birdsey, Richard, J.C. Jenkins, and C. Field. 2002. Trendsin North American net primary productivity derived from satellite observations, 1982-1998. Global BiogeochemicalCycles. 16(2): 2-1.
17793:Layout 1 5/29/08 5:15 PM Page 22
23
15 Bobbink, R., M. Hornung, and J.G.M. Roelofs. 1998. The effects of air-borne nitrogen pollutants on speciesdiversity in natural and semi-natural European vegetation. Journal of Ecology. 86:717-738.
16 e.g., McClure, M. S. 1991. Nitrogen Fertilization of Hemlock Increases Susceptibility to Hemlock WoollyAdelgid. Journal of Arboriculture 17:227-231.
Latty, E.F., C.D. Canham, and P.L. Marks. 2003. Beech bark disease in northern hardwood forests: the importanceof nitrogen dynamics and forest history for disease severity. Canadian Journal of Forest Research-RevueCanadienne de Recherche Forestiere. 33:257-268.
17 Lovett, G.M., C.D. Canham, M.A. Arthur, K.C. Weathers, and R.D. Fitzhugh. 2006. Forest ecosystem responses to exotic pests and pathogens in eastern North America. Bioscience. 56:395-405.
18 McNulty, S.G., J.D. Aber, and S.D. Newman. 1996. Nitrogen saturation in a high-elevation spruce-fir stand.Forest Ecology and Management. 84:109-121;
Magill, A.H., J.D. Aber, J.J. Hendricks, R.D. Bowden, J.M. Melillo, and P.A. Steudler. 1997. Biogeochemicalresponse of forest ecosystems to simulated chronic nitrogen deposition. Ecological Applications. 7:402-415.
Wallace, Z. P., G. M. Lovett, J. E. Hart, and B. Machona. 2007. Effects of nitrogen saturation on tree growth and death in a mixed-oak forest. Forest Ecology and Management 243:210-218.
19 Bobbink et al., 1998.
20 Gotelli, N. J. and A. M. Ellison. 2002. Nitrogen deposition and extinction risk in the northern pitcher plant, Sarracenia purpurea. Ecology 83:2758-2765.
Gotelli, N. J. and A. M. Ellison. 2006. Forecasting extinction risk with non-stationary matrix models. Ecological Applications 16: 51-61.
21 Gotelli and Ellison, 2002; Gotelli and Ellison, 2006.
22 Gotelli and Ellison, 2002; Gotelli and Ellison, 2006.
23 Bernhardt, E.S., G.E. Likens, R.O. Hall, D.C. Buso, S.G. Fisher, T.M. Burton, J.L. Meyer, M.H. McDowell, M.S. Mayer, W.B. Bowden, S.E.G. Findlay, K.H. Macneale, R.S. Stelzer, and W.H. Lowe. 2005. Can't see the forest for the stream? In-stream processing and terrestrial nitrogen exports. Bioscience. 55:219-230.
Kniffen, M.L., C. Neill and R. McHorney. 2007. Nutrient Limitation of periphyton and phytoplankton growth in freshwater coastal plain ponds on Cape Cod. Abstract #311, ALO 2007 Aquatic Sciences Meeting.https://www.sgmeet.com/aslo/santafe2007/viewabstract2.asp?AbstractID=311&SessionID=SS41.
24 Boyer, E.W., C.L. Goodale, N.A. Jaworski, and R.W. Howarth. 2002. Anthropogenic nitrogen sources andrelationships to riverine nitrogen export in the northeastern USA. Biogeochemistry. 57:137-169.
Driscoll, C.T., D. Whitall, J. Aber, E. Boyer, M. Castro, C. Cronan, C.L. Goodale, P. Groffman, C. Hopkinson, K. Lambert, G. Lawrence, and S. Ollinger. 2003. Nitrogen pollution in the northeastern United States: Sources, effects, and management options. Bioscience. 53:357-374.
25 Boyer et al., 2002.
Driscoll et al., 2003.
26 Scavia, D. and S.B. Bricker. 2006. Coastal eutrophication assessment in the United States. Biogeochemistry.79:187-208.
27 Bricker, S., B. Longstaff, W. Dennison, A. Jones, K. Boicourt, C. Wicks, and J. Woerner. 2007. Effects of NutrientEnrichment In the Nation’s Estuaries: A Decade of Change. NOAA Coastal Ocean Program Decision AnalysisSeries No. 26. National Centers for Coastal Ocean Science, Silver Spring, MD. 328 pp.
28 Bricker et al., 2007.
17793:Layout 1 5/29/08 5:15 PM Page 23
24
29 Valiela, I., J.M. Teak, and W.J. Sass. 1975. Production and dynamics of salt marsh vegetation and the effects of experimental treatment with sewage sludge. Journal of Applied Ecology. 12:973-981.
30 Sarda R., I. Valiela, K. Foreman. 1996. Decadal shifts in a salt marsh macroinfaunal community in response to sustained long-term experimental nutrient enrichment. Journal of Experimental Marine Biology and Ecology.205(1-2):63-81;
Levine, J.M., J.S. Brewer, and M.D. Bertness. 1998. Nutrients, competition and plant zonation in a New England salt marsh. Journal of Ecology. 86:285-292.
Emery N.C., P.J. Ewanchuk and M. Bertness. 2001. Competition and salt marsh plant zonation: Stress toleratorsmay be dominant competitors. Ecology. 82:2471-2485.
31 Sarda et al., 1998.Emery et al., 2001.
32 Dennison, W.C., R.J. Orth, K.A. Moore, J.C. Stevenson, V. Carter, S. Kollar, P.W. Bergstrom, and R.A. Batiuk.1993. Assessing water quality with submersed aquatic vegetation. BioScience. 43:86 94.
33 See Hauxwell J., J. Cebrian, I. Valiela. 2003. Eelgrass (Zostera marina) loss in temperate estuaries: relationship to land-derived nitrogen loads and effect of light limitation imposed by algae. Marine Ecology-Progress Series.247:59-73.
34 Hauxwell et al., 2003.
35 Cronan, C.S. and D.F. Grigal. 1995. Use of calcium aluminum ratios as indicators of stress in forest ecosystems.Journal of Environmental Quality. 24:209-226; See note 4.
36 Weathers, K.C., G.E. Likens, F.H. Bormann, J.S. Eaton, W.B. Bowden, J.L. Anderson, D.A. Cass, J.N. Galloway,W.C. Keene, K.D. Kimball, P. Huth, and D. Smiley. 1986. A regional acidic cloud/fog event in the eastern UnitedStates. Nature. 319:657-658.
Lovett, G.M. 1994. Atmospheric Deposition of Nutrients and Pollutants in North America: An EcologicalPerspective. Ecological Applications. 4(4):629-650.
37 DeHayes, D. H., P. G. Schaberg, G. J. Hawley, and G. R. Strimbeck. 1999. Acid rain impacts on calcium nutrition and forest health. Bioscience. 49:789-800.
38 Hawley, G.J., P.G. Schaberg, C. Eagar, and C.H. Borer. 2006. Calcium addition at the Hubbard BrookExperimental Forest reduced winter injury to red spruce in a high-injury year. Canadian Journal of ForestResearch-Revue Canadienne de Recherche Forestiere. 36:2544-2549.
39 Horsley, S.B., R.P. Long, S.W. Bailey, R.A. Hallett, and P.M. Wargo. 2002. Health of eastern North American sugar maple forests and factors affecting decline. Northern Journal of Applied Forestry. 19:34-44.
40 Juice, S.M., T.J. Fahey, T.G. Siccama, C.T. Driscoll, E.G. Denny, C. Eager, N.L. Cleavitt, R. Minocha, and A.D. Richardson. 2006. Response of sugar maple to calcium addition to northern hardwood forest. Ecology.87:1267-1280.
41 Long, R.P., S.B. Horsley, and P.R. Lilja. 1997. Impact of forest liming on growth and crown vigor of sugar maple and associated hardwoods. Canadian Journal of Forest Research-Revue Canadienne de RechercheForestiere. 27:1560-1573.
42 See note 36; Weathers, K.C., G.E. Likens, F.H. Bormann, S.H. Bicknell, B.T. Bormann, B.C. Daube, Jr., J.S.Eaton, J.N. Galloway, W.C. Keene, K.D. Kimball, W.H. McDowell, T.G. Siccama, D. Smiley, and R. Tarrant. 1988.Cloud water chemistry from ten sites in North America. Environmental Science and Technology. 22:1018-1026.
43 DeHayes, D. H., P. G. Schaberg, G. J. Hawley, and G. R. Strimbeck. 1999. Acid rain impacts on calcium nutrition and forest health. Bioscience 49:789-800.
Schaberg, P. G., D. H. DeHayes, G. J. Hawley, G. R. Strimbeck, J. R. Cumming, P. F. Murakami, and C. H. Borer. 2000. Acid mist and soil Ca and Al alter the mineral nutrition and physiology of red spruce. Tree Physiology 20:73-85.
17793:Layout 1 5/29/08 5:15 PM Page 24
25
44 Hawley et al., 2006.
45 Rusek, J. and V.G. Marshall. 2000. Impacts of airborne pollutants on soil fauna. Annual Review of Ecology and Systematics. 31:395-423.
46 Hames, R.S., K.V. Rosenberg, J.D. Lowe, S.E. Barker, and A.A. Dhondt. 2002. Adverse effects of acid rain on the distribution of the Wood Thrush Hylocichla mustelina in North America. Proceedings of the NationalAcademy of Sciences of the United States of America. 99:11235-11240.
47 Graveland, J., R. Van Der Wal, J.H. Van Balen, J. Van Noordwuk. 1994. Poor Reproduction in Forest Passerines from Decline of Snail Abundance in Acidified Soils. Nature. 368:446-448.
48 Pabian, S.E. and M.C. Brittingham. 2007. Terrestrial Liming Benefits Birds in an Acidified Forest in the Northeast. Ecological Applications. 17(8):2184-94.
49 Driscoll et al., 2001.
50 Sullivan, T. J., B.J. Cosby, J.R. Webb, K.U. Snyder, A.T. Herlihy, A.J. Bulger, E.H. Gilbert, and D. Moore. 2002. Assessment of the Effects of Acidic Deposition on Aquatic Resources in the Southern AppalachianMountains. Report for Southern Appalachian Mountain Initiative, Prepared by E&S Environmental Chemistry, Inc., Corvallis, OR.
51 Driscoll et al., 2001.
52 Confer, J., T. Kaaret and G. E..Likens. 1983. Zooplankton diversity and biomass in recently acidified lakes. Can. Spec. Publ. Fish and Aquat. Sci.. 40:36-42.
53 Brakke, D.F., J.P. Baker, J. Bohmer, A. Hartmann, M. Havas, A. Jenkins, C. Kelly, S.J. Ormerod, T. Paces, R. Putz, B.O. Rossland, D.W. Schindler, and H. Segner. 1994. Group report: Physiological and ecological effects of acidification on aquatic biota. Pp. 275-312 in C.E.W. Steinberg and R.F Wright (eds.) Acidification of Freshwater Ecosystems: Implications for the Future. John Wiley.
54 Diamond, A.W. 1989. Impacts of Acid Rain on Aquatic Birds. Environmental Monitoring and Assessment.12(3):245-254.
55 Baker, J.P., D.P. Bernard, S.W. Christensen and M.J. Sale. 1990. Biological effects of changes in surface wateracid-base chemistry. In: Acidic Deposition: State of Science and Technology, Volume II. Aquatic processes and effects. National Acid Precipitation and Assessment Program, Washington, D.C.
56 Bergweiler, C. J. and W. J. Manning. 1999. Inhibition of flowering and reproductive success in spreading dogbane(Apocynum androsaemifolium) by exposure to ambient ozone. Environmental Pollution. 105:333-339.
57 Findlay, S. and C. Jones. 1990. Exposure of cottonwood plants to ozone alters subsequent leaf litterdecomposition. Oecologia (Berlin). 82:248-250.
58 Miller P.R. and McBride J.R. 1999. Oxidant Air Pollution Impacts in the Montane Forest of SouthernCalifornia. Springer, NY.
59 Taylor, Jr, G.E., L.F. Pitelka, and M.T. Klegg, eds. 1991. Ecological Genetics. Springer-Verlag. New York, NY. 359 pp.; Davison, A.W. and K. Reiling. 1995. A rapid change in ozone resistance of Plantago major after summers with high ozone concentrations. New Phytologist. 131:337-344.
60 Ollinger, S.V., J.D. Aber, and P.B. Reich. 1997. Simulating ozone effects on forest productivity: Interactionsamong leaf-, canopy-, and stand-level processes. Ecological Applications. 7:15.
61 Heck, W.W. and E.B. Cowling. 1997. The Need for a Long-term Cumulative Secondary Ozone Standard - AnEcological Perspective. Environmental Management. January 1997.
62 Menzel, D.B. 1984. Ozone - an overview of its toxicity in man and animals. Journal of Toxicology andEnvironmental Health.13:183-204.
17793:Layout 1 5/29/08 5:15 PM Page 25
63 Evers, D.C., Y-J HAN, C.T. Driscoll, N.C. Kamman, M.W. Goodale, K.F. Lambert, T.M. Holsen, C.Y. Chen,T.A. Clair, and T. Butler. 2007. Biological Mercury Hotspots in the Northeastern United States and SoutheasternCanada. BioScience. 57(1):29-43.
64 Rimmer, C.C., K.P. Mcfarland, D.C. Evers, E.K. Miller, Y. Aubry, D. Busby, and R.J. Taylor. 2005. Mercuryconcentrations in Bicknell's thrush and other insectivorous passerines in Montane forests of northeastern North America. Ecotoxicology. 14:223-240.
65 Rimmer et al., 2005.
66 Driscoll et al., 2007.
67 Benoit, J.M., C. Gilmour, A. Heyes, R.P. Mason, and C. Miller. 2003. Geochemical and biological controls overmethylmercury production and degradation in aquatic ecosystems. Pages 262-297 in Y. Chai and O.C. Braids, eds. Biogeochemistry of Environmentally Important Trace Elements, ACS Symposium Series #835. AmericanChemical Society, Washington, DC.
68 Jeremiason, J.D., D.R. Engstrom, E.B. Swain, E.A. Nater, B.M. Johnson, J.E. Almendinger, B.A. Monson, and R.K. Kolka. 2006. Sulfate addition increases methylmercury production in an experimental wetland.Environmental Science and Technology. 40:3800-3806.
69 Benoit et al., 2003.
70 Chen, C.Y., R.S. Stemberger, N.C. Kamman, B. Mayes, and C. Folt. 2005. Patterns of mercury bioaccumulationand transfer in aquatic food webs across multi-lake studies in the northeast U.S. Ecotoxicology. 14:135-14
Driscoll et al., 2007.
71 Friedmann, A.S., M.C. Watzin, T. Brinck-Johnson, J.C. Leitner. 1996. Low levels of dietary methylmercury inhibitgrowth and gonadal development in juvenile walleye (Stizostedion vitreum). Aquatic Toxicology. 35:265-278.
72 Webber, H.M. and T.A. Haines. 2003. Mercury effect son predation avoidance behavior of a forage fish goldenshiner (Noemigonus crysoleucas). Environmental Toxicology and Chemistry. 22(7):1556-1561.
73 Hammerschmidt , C.R., M.B. Sandheinrich, J.G. Wiener, and R.G. Rada. 2002. Effects of dietary methylmercuryon reproduction of fathead minnows. Environ. Sci. Technol. 36:877-883
74 Bank, M.S., J.B. Crocker, S. Davis, D.K. Brotherton, R. Cook, J. Behler, and B. Connery. 2006. Population declineof northern dusky salamanders at Acadia National Park, Maine, USA. Biological Conservation. 130:230-238.
75 Bank et al., 2006.
76 Heinz, G.H. 1979. Methylmercury: reproductive and behavioral effects on three generations of Mallard ducks.Journal of Wildlife Management. 43:394-401.
77 Evers, D.C. 2005. Mercury Connections: The extent and effects of mercury pollution in northeastern NorthAmerica. BioDiversity Research Institute. Gorham, Maine. 28 pp.
78 Evers, D.C., L.J. Savoy, C.R. DeSorbo, D.E. Yates, W. Hanson, K.M. Taylor, L.S. Siegel, J.H. Cooley, M.S. Bank, A. Major, K. Munney, B.F. Mower, H.S. Vogel, N. Schoch, M. Pokras, M.W. Goodale and J. Fair. 2008. Adverseeffects from environmental mercury loads on breeding common loons. Ecotoxicology. 17(2):69-81.
Burgess, N.M. and M.W. Meyer. 2008.Methylmercury exposure associated with reduced productivity in common loons. Ecotoxicology. 17(2):83-91.
79 Desorbo, C.L. and D.C. Evers. 2005. Evaluating exposure of Maine’s Bald Eagle population to mercury:assessingimpacts on productivity and spatial exposure patterns. Report BRI 2005-008. Biodiversity Research Institute,Gorham, Maine. 27 pp.
80 Frederick, P.C., B. Hylton, J.A. Heath, and M.G. Spalding. 2004. A Historical Record of MercuryContamination in Southern Florida (USA) as Inferred from Avian Feather Tissue. Environmental Toxicology and Chemistry. 23(6): 1474-1478.
26
17793:Layout 1 5/29/08 5:15 PM Page 26
81 Schwarzbach, S.E., T.H. Suchanek, G.H. Heinz, J.T. Ackerman, C.A. Eagles-Smith, T.L. Adelsbach, J.Y. Takekawa,A.K. Miles, D.J. Hoffman, S.E. Wainwright-De La Cruz, S.E. Spring, M.A. Ricca, and T.C. Maurer. 2005. Mercury in birds of the San Francisco Bay-Delta: trophic pathways, bioaccumulation and ecotoxicological risk to avianreproduction. 2005 Annual Report to CALFED, U. S. Geological Survey, Western Ecological Research
Center, and U. S. Fish and Wildlife Service, Sacramento Fish and Wildlife Office, 17 pp.
82 Henny, C.J., E.F. Hill, D.J. Hoffman, M.G. Spalding, and R.A. Grove. 2002. Nineteenth century mercury:Hazard to wading birds and cormorants of the Carson River, Nevada. Ecotoxicology. 11:213-231.
83 Aulerich R.J., Ringer R.K., and Iwamoto S. 1974. Effects of dietary mercury on mink. Archives of Environmental Contamination and Toxicology. 2:43-51.
Wren, C.D. 1985. Probable case of mercury-poisoning in a wild otter, Lontra-canadensis, in northwestern Ontario. Canadian Field-Naturalist. 99:112-114.
Wren, C.D. 1986. A review of metal accumulation and toxicity in wild mammals. Environmental Research. 40:210-244.
Dansereau, M., N. Lariviere, D. Du Tremblay, and D. Belanger. 1999. Reproductive performance of twogenerations of female semidomesticated mink fed diets containing organic mercury contaminated freshwater fish. Archives of Environmental Contamination and Toxicology 36:221-226.
84 Evers et al., 2007
85 Evers et al., 2007.
86 Marvin-DiPasquale, M.C., J.L. Agee, R.M. Bouse, and B.E. Jaffe. 2003. Microbial cycling of mercury incontaminated pelagic and wetland sediments of San Pablo Bay, California. Environmental Geology. 43:260-267.
87 Lane, O.P. and D.C. Evers. 2006. Developing a geographic exposure profile of methylmercury availability in salt marshes of New England. Report BRI 2006-01. BioDiversity Research Institute, Gorham, Maine.
88 Shriver, W.G., D.C. Evers, and T. Hodgman. 2006. Mercury exposure profile for Sharp-tailed Sparrows breeding in coastal wetlands. Environmental Bioindicators. 1(2):129-135.
89 Likens G.E. 2000. A long-term record of ice cover for Mirror Lake, New Hampshire: effects of global warming? Verh. Internat. Verein. Limnol. 27(5):2765-2769.
90 DeHayes et al., 1999.
91 e.g., Iverson, L. R. and A. M. Prasad. 2001. Potential changes in tree species richness and forest community types following climate change. Ecosystems 4:186-199.
92 Howard, T.G., J. Gurevitch, L. Hyatt, M. Carreiro, and M. Lerdau. 2004. Forest invasibility in communities in southeastern New York. Biological Invasions. 6:393-410;
Jordan, M.J., K. Nadelhoffer and B. Fry. 1997. Nitrogen cycling in forest and grass ecosystems irrigated with 15Nenriched wastewater. Ecological Applications. 7(3):864-881.
93 e.g., McClure, 1991.
94 Weathers, K.C., G.E. Likens, and T.J. Butler. 2006. Acid rain. Pp. 1549-1561. 2006. W. Rom (ed.).Environmental and Occupational Medicine, 4th edition. Lippincott-Raven Publishers, Philadelphia.
95 Weathers et al., 2001.
96 Driscoll et al., 2003.
97 Fox, D.G., Bartuska, A.M., Byrne, J.G., and others. 1989. A screening procedure to evaluate air pollution effects on Class I wilderness areas. Gen. Tech. Rep. RM-168. Fort Collins, CO: U.S. Department of Agriculture,Forest Service, Rocky Mountain Forest and Range Experiment Status. 36 pp.
27
17793:Layout 1 5/29/08 5:15 PM Page 27
98 Pardo, L.H. and C.T. Driscoll. 1996. Critical loads for nitrogen deposition: Case studies at two northernhardwood forests. Water, Air, and Soil Pollution. 89(1-2):105-128.
Pardo, L.H. and C. T. Driscoll. 1993. A critical review of mass balance methods for calculating critical loads of nitrogen for forested ecosystems. Environ. Rev. 1:145-156.
Driscoll et al., 2003.
Aber et al., 2003.
99 Pembrook, H. 2004. Calculating critical loads of acidity for acid-impaired New Hampshire lakes using the Steady State Water Chemistry Model. 9 pp.http://www.des.state.nh.us/WMB/tmdl/documents/20040920_Final_NH_Acid_Pond_TMDL_App.A.pdf.
Driscoll et al., 2001.
100 Sverdrup, H., P. Warfvinge, M. Rabenhorst, A. Janicki, R, Morgan, and M. Bowman. 1992. Critical Loads and Steady State Chemistry for Streams in the State of Maryland. Environmental Pollution. 77:192-203.
Sullivan, T.J. and B.J. Cosby. 2002. Critical Loads of Sulfur Deposition to Protect Streams within Joyce Kilmer and Shining Rock Wilderness Areas from Future Acidification. Report to the USDA Forest Service. Asheville,NC. Prepared by ES Environmental, Corvallis, OR.
Sullivan, T.J. and B.J. Cosby. 2004. Aquatic Critical Load Development for the Monongahela National Forest,West Virginia. Report to the USDA Forest Service. 75 pp.
Sullivan, T.J., B.J. Cosby, K.A. Tonnessen, and D.W. Clow. 2004. Surface water acidification responses and critical loads of sulfur and nitrogen deposition in Loch Vale watershed, Colorado. Water Resources Research. 41, W01021, doi:10.1029/2004WR003414.
101 Williams, W.M. and K.A. Tonnessen. 2000. Critical Loads for Inorganic Nitrogen Deposition in the Colorado Front Range, USA. Ecological Applications. 10(6):1648-1665.
Fenn, M.E., R. Haeuber, G.S. Tonnessen, J.S. Baron, S. Grossman-Clarke, D. Hope, D.A. Jaffe, S. Copeland, L. Geiser, H.M. Rueth, and J.O. Sickman. 2003. Nitrogen Emissions, Deposition, and Monitoring in the Western United States. BioScience. 53(4):391-403.
Baron, J.S., D.S. Ojima, E.A. Holland, and W.J. Parton. 1994. Analysis of nitrogen saturation potential in Rocky Mountain tundra and forest: implications for aquatic systems. Biogeochemistry. 27(1): 61-82.
Baron, J.S., H.M. Rueth, A.M. Wolfe, K.R. Nydick, E.J. Allstott, J.T. Minear and B. Moraska. 2000. EcosystemResponses to Nitrogen Deposition in the Colorado Front Range. Ecosystems. 3(4):352-368.
Bar on, J. 2006. Hindcasting Nitrogen Deposition to Determine an Ecological Critical Load. EcologicalApplications. 16(2):443-439; Bowman et al. 2006 – see note 9.
102 Porter, E., Blett, T., Potter, D.U. and Huber, C. 2005. Protecting resources on federal lands: Implications ofcritical loads for atmospheric deposition of nitrogen and sulfur. Bioscience 55(7):603-612.
Burns, D.A., Blett, T., Haeuber, R., and Pardo, L.H. 2008. Critical loads as a policy tool for protecting ecosystemsfrom the effects of air pollutants. Frontiers in Ecology and the Environment 6(3):156-159.
103 National Research Council (NRC). 2004. Air Quality Management in the United States. Report by theCommittee on Air Quality Management in the United States, Board on Environmental Studies and Toxicology,Board on Atmospheric Sciences and Climate, Division on Earth and Life Studies. The National Academy Press:Washington, D.C.
104 NRC, 2004.
105 Clean Air Act Advisory Committee. 2005. Air Quality Management Group Report to the Clean Air ActAdvisory Committee. 190 pages. http://www.epa.gov/air/caac/aqm/report1-17-05.pdf.
28
17793:Layout 1 5/29/08 5:15 PM Page 28

Many streams in the Shenandoah Mountains of Virginia are acidified due to air pollution. © S. Gogolev/ BigStockPhoto.com
Watching wildlife on an Adirondack pond. © S. Langdon
17793:Layout 1 5/29/08 5:15 PM Page c3

© Daniel Poleschook Jr. and Ginger Gumm
The science behind environmental solutions.
Cary Institute of Ecosystem StudiesBox AB, Millbrook, NY 12545
845-677-5343www.ecostudies.org
The Nature Conservancy • Maryland/D.C. Chapter5410 Grosvenor Land, Suite 100
Bethesda, Maryland 20814301-897-0858
www.nature.org
© 2008 MRCE 81783
17793:Layout 1 6/3/08 3:31 PM Page c4