Embed Size (px)
Citation preview
VOLUME 22, NUMBER 1, 2016 n LINCOLN LABORATORY JOURNAL 33
Threat-Based Risk Assessment for Enterprise NetworksRichard P. Lippmann and James F. Riordan
Protecting enterprise networks requires continuous risk assessment that automatically identifies and prioritizes cyber security risks, enables efficient allocation of cyber security resources, and enhances protection against modern cyber threats. Lincoln Laboratory created a network security model to guide the development of such risk assessments and, for the most important cyber threats, designed practical risk metrics that can be computed automatically and continuously from security-relevant network data.
Computer networks are under constant cyber attack. In 2013, in one of the most his-torically devastating insider attacks, Edward Snowden exfiltrated 1.7 million documents
from the National Security Agency [1]. That same year, the security company Mandiant released a report on the likely Chinese government–sponsored cyber espionage group APT 1 (for advanced persistent threats), who stole 100s of terabytes of proprietary information from at least 141 organizations by maintaining a long-term presence in the victims’ networks [2]. More recently, the widespread Heartbleed [3] and Shellshock [4] attacks exploited vulnerabilities in common Internet web and encryption services, and the U.S. Office of Personnel Management announced the theft of sensitive information, including the Social Security numbers of 21.5 million individuals, from the background investigation databases for persons seeking government clearances [5].
Assessing important security risks at large enter-prises to make sure that risks from all current threats are addressed is costly, takes time, requires trained security specialists, and involves a high degree of organizational accountability. As a result of these factors, many orga-nizations adopt a best-practices approach by installing popular baseline security controls, such as antivirus soft-ware and email spam filters, and scanners that find and patch software vulnerabilities. Because this approach is not tailored to meet the unique security needs of indi-vidual organizations, resources may be wasted on imple-menting unnecessary controls while important threats go unaddressed. Metrics that result from this approach (e.g., counts of files scanned or of high-severity vulnerabilities)
»
34 LINCOLN LABORATORY JOURNAL n VOLUME 22, NUMBER 1, 2016
THREAT-BASED RISK ASSESSMENT FOR ENTERPRISE NETWORKS
are difficult to interpret because their relationship to risk from modern threats is unknown.
Many organizations also perform some type of qualitative risk assessment in which a list of threats is considered and the likelihood and impact of each threat are rated on an ordinal scale from low to high. Threat management involves addressing those threats for which the likelihood and impact are both high. This approach can be effective when performed by skilled security practitioners who understand an enterprise network, can enumerate all threats and their likelihoods, and can accurately assess the effectiveness of controls against the threats and their expected impacts. Unfortunately, it is difficult to find such trained practitioners, and even skilled security experts can miss key threats or misunder-stand the impact of breaches.
Our goal is to automate and improve the current state of the art in risk assessment. Using a list of import-ant modern threats, we describe how to compute risk for each threat and also how to specify the data required to compute risk. We provide an initial list of threats that can be updated over time to capture recent threat types. The required data can be gathered online in real time to provide continuous risk assessment. The resulting risk values can be compared across threats, time, and different enterprises. The accuracy of this method should approach that of the best skilled security experts because we pro-vide a carefully selected list of threats and specify how to compute risk objectively without relying on unsupported qualitative human judgments.
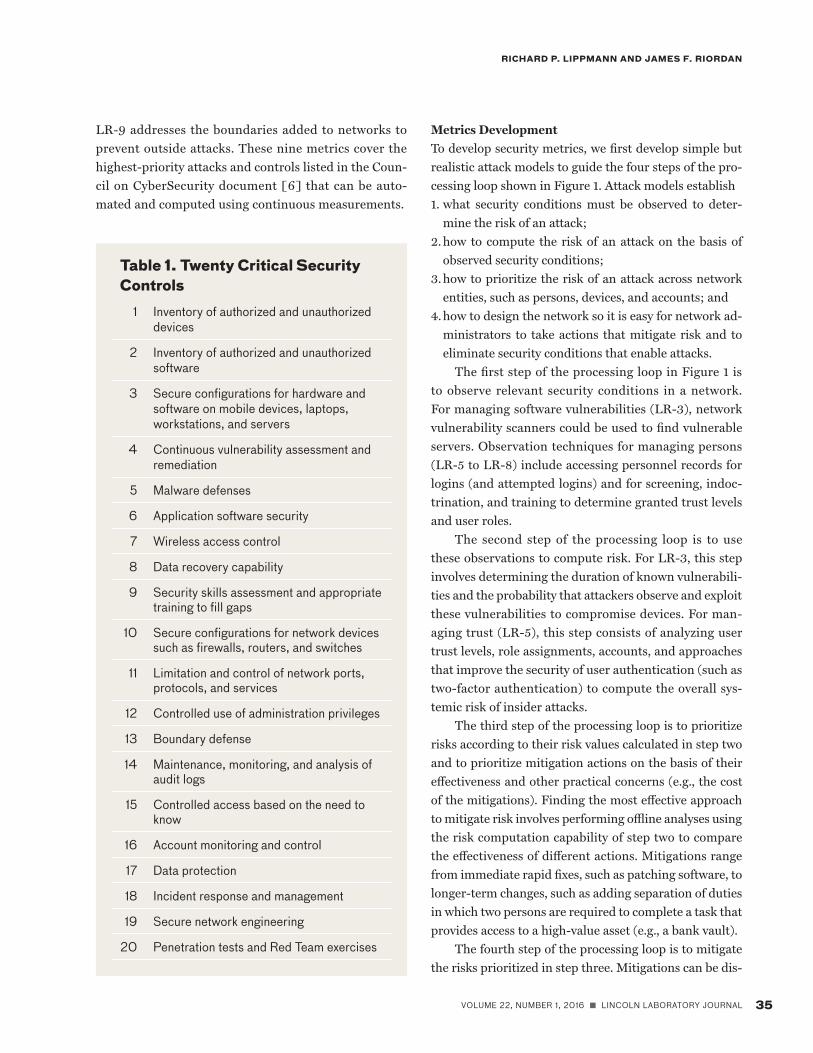
Modeling and Mitigating Modern ThreatsRecently, security experts from companies, government agencies, and academia joined forces to create a set of security controls and adversary models specifically focused on modeling and preventing advanced persistent threats and other current threats. Their work led to the 20 critical security controls shown in Table 1 and described by the Council on CyberSecurity [6]. These controls are prioritized by their capability to provide a direct defense against attacks. Subcontrols from the first four criti-cal controls constitute most of the so-called “five quick wins” that have the most immediate impact on prevent-ing common attacks [6]. The remaining controls provide additional protection against attacks. These widely used controls are the most effective and specific set of tech-
nical measures available to detect, prevent, respond to, and mitigate damage from current threats. We have used these critical controls to prioritize the threats that should be addressed in enterprise networks and to recommend and model controls that should be in place to mitigate those threats. Metrics we have developed focus on auto-matically computing risk for the most important critical control threats, and they directly model the effectiveness of critical controls that should be in place.
Security MetricsWe have developed nine security metrics, each of which is associated with a specific cyber threat and critical control(s) from the critical controls document [6]. Table 2 lists these metrics, the threat each metric addresses, and the control(s) from Table 1 that mitigate each threat. Each metric is assigned a Lincoln Risk (LR) number ranging from LR-1 to LR-9. The LR-3 metric, for example, is concerned with attackers who search for and exploit known software vulnerabilities in a network. The risk of these attacks is reduced when the durations of software vulnerabilities (i.e., the time between when a vulnerability is first published to when it is removed) are shortened. These durations can be shortened by per-forming continuous vulnerability assessment and reme-diation as suggested by critical control 4, which includes detecting and patching vulnerabilities more frequently. The LR-3 metric is discussed further in the “Two Exam-ple Metrics” section.
The first four metrics we developed (LR-1 to LR-4) focus on the same management areas as the “five quick wins” mentioned previously. These metrics prevent common attacks, such as gaining access to devices via well-known default passwords and accessing computers remotely by using previously published exploits. They also support higher-numbered metrics by providing important baseline observations concerning the pres-ence and characteristics of devices, software, and con-figurations that exist in a network. Detailed descriptions of LR-1 to LR-4 are available in Lippmann et al. [7]. The next three metrics (LR-5 to LR-7) focus on users’ roles, credentials, and accounts, and they cover insider attacks, credential theft, and attacks that require physi-cal access to victim devices. LR-8 concerns user behav-iors that enable attacks, such as providing passwords over the phone or in response to an unverified email.
VOLUME 22, NUMBER 1, 2016 n LINCOLN LABORATORY JOURNAL 35
RICHARD P. LIPPMANN AND JAMES F. RIORDAN
LR-9 addresses the boundaries added to networks to prevent outside attacks. These nine metrics cover the highest-priority attacks and controls listed in the Coun-cil on CyberSecurity document [6] that can be auto-mated and computed using continuous measurements.
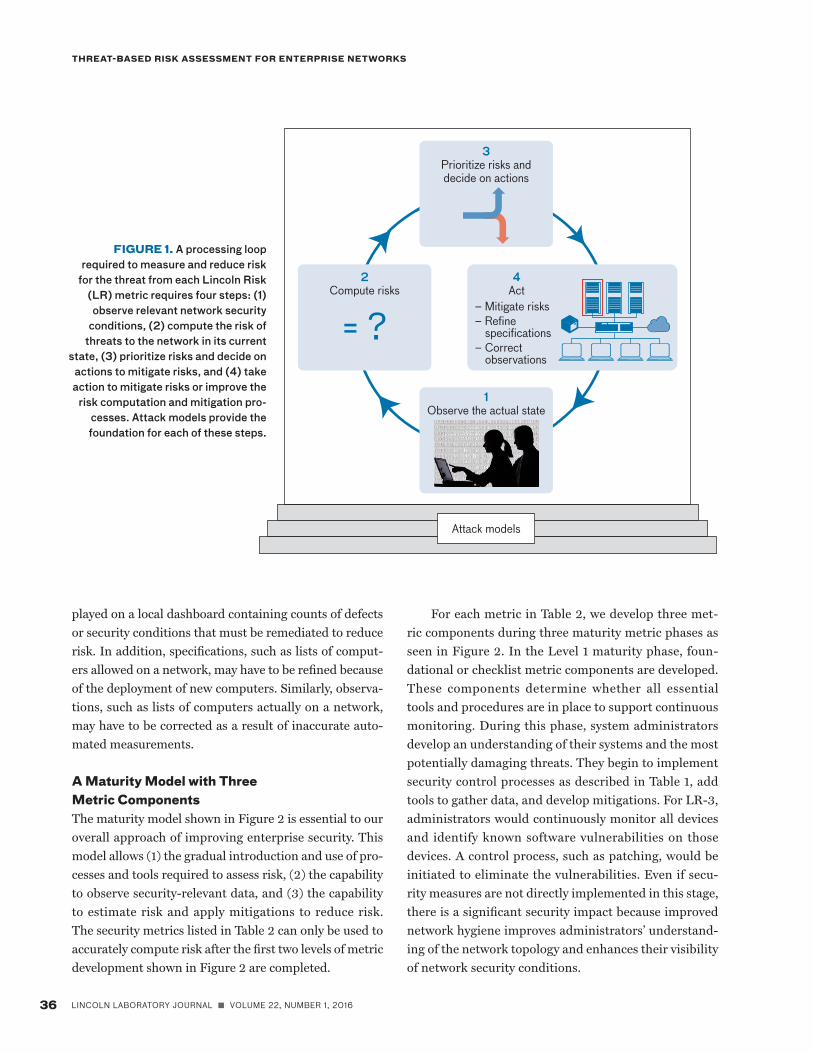
Metrics DevelopmentTo develop security metrics, we first develop simple but realistic attack models to guide the four steps of the pro-cessing loop shown in Figure 1. Attack models establish1. what security conditions must be observed to deter-
mine the risk of an attack; 2. how to compute the risk of an attack on the basis of
observed security conditions; 3. how to prioritize the risk of an attack across network
entities, such as persons, devices, and accounts; and 4. how to design the network so it is easy for network ad-
ministrators to take actions that mitigate risk and to eliminate security conditions that enable attacks.
The first step of the processing loop in Figure 1 is to observe relevant security conditions in a network. For managing software vulnerabilities (LR-3), network vulnerability scanners could be used to find vulnerable servers. Observation techniques for managing persons (LR-5 to LR-8) include accessing personnel records for logins (and attempted logins) and for screening, indoc-trination, and training to determine granted trust levels and user roles.
The second step of the processing loop is to use these observations to compute risk. For LR-3, this step involves determining the duration of known vulnerabili-ties and the probability that attackers observe and exploit these vulnerabilities to compromise devices. For man-aging trust (LR-5), this step consists of analyzing user trust levels, role assignments, accounts, and approaches that improve the security of user authentication (such as two-factor authentication) to compute the overall sys-temic risk of insider attacks.
The third step of the processing loop is to prioritize risks according to their risk values calculated in step two and to prioritize mitigation actions on the basis of their effectiveness and other practical concerns (e.g., the cost of the mitigations). Finding the most effective approach to mitigate risk involves performing offline analyses using the risk computation capability of step two to compare the effectiveness of different actions. Mitigations range from immediate rapid fixes, such as patching software, to longer-term changes, such as adding separation of duties in which two persons are required to complete a task that provides access to a high-value asset (e.g., a bank vault).
The fourth step of the processing loop is to mitigate the risks prioritized in step three. Mitigations can be dis-
Table 1. Twenty Critical Security Controls
1 Inventory of authorized and unauthorized devices
2 Inventory of authorized and unauthorized software
3 Secure configurations for hardware and software on mobile devices, laptops, workstations, and servers
4 Continuous vulnerability assessment and remediation
5 Malware defenses
6 Application software security
7 Wireless access control
8 Data recovery capability
9 Security skills assessment and appropriate training to fill gaps
10 Secure configurations for network devices such as firewalls, routers, and switches
11 Limitation and control of network ports, protocols, and services
12 Controlled use of administration privileges
13 Boundary defense
14 Maintenance, monitoring, and analysis of audit logs
15 Controlled access based on the need to know
16 Account monitoring and control
17 Data protection
18 Incident response and management
19 Secure network engineering
20 Penetration tests and Red Team exercises
36 LINCOLN LABORATORY JOURNAL n VOLUME 22, NUMBER 1, 2016
THREAT-BASED RISK ASSESSMENT FOR ENTERPRISE NETWORKS
played on a local dashboard containing counts of defects or security conditions that must be remediated to reduce risk. In addition, specifications, such as lists of comput-ers allowed on a network, may have to be refined because of the deployment of new computers. Similarly, observa-tions, such as lists of computers actually on a network, may have to be corrected as a result of inaccurate auto-mated measurements.
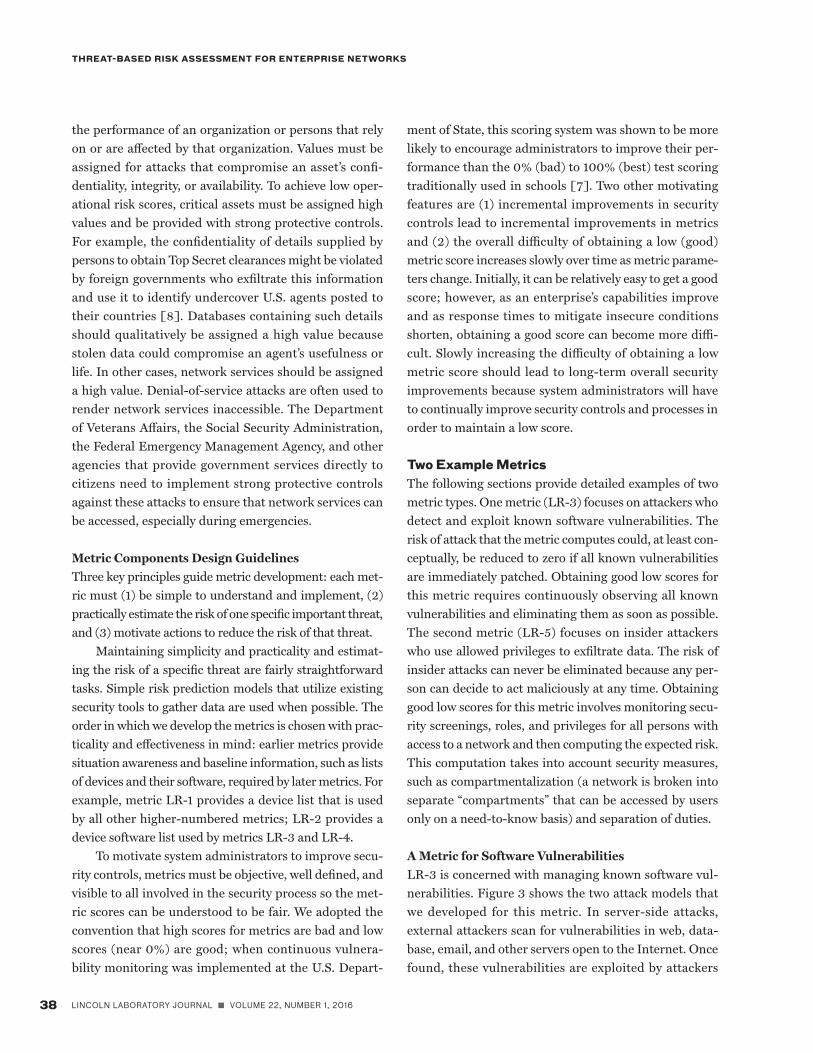
A Maturity Model with Three Metric ComponentsThe maturity model shown in Figure 2 is essential to our overall approach of improving enterprise security. This model allows (1) the gradual introduction and use of pro-cesses and tools required to assess risk, (2) the capability to observe security-relevant data, and (3) the capability to estimate risk and apply mitigations to reduce risk. The security metrics listed in Table 2 can only be used to accurately compute risk after the first two levels of metric development shown in Figure 2 are completed.
For each metric in Table 2, we develop three met-ric components during three maturity metric phases as seen in Figure 2. In the Level 1 maturity phase, foun-dational or checklist metric components are developed. These components determine whether all essential tools and procedures are in place to support continuous monitoring. During this phase, system administrators develop an understanding of their systems and the most potentially damaging threats. They begin to implement security control processes as described in Table 1, add tools to gather data, and develop mitigations. For LR-3, administrators would continuously monitor all devices and identify known software vulnerabilities on those devices. A control process, such as patching, would be initiated to eliminate the vulnerabilities. Even if secu-rity measures are not directly implemented in this stage, there is a significant security impact because improved network hygiene improves administrators’ understand-ing of the network topology and enhances their visibility of network security conditions.
1Observe the actual state
3Prioritize risks and decide on actions
2Compute risks
= ?4
Act– Mitigate risks– Refine specifications– Correct observations
Attack models
FIGURE 1. A processing loop required to measure and reduce risk
for the threat from each Lincoln Risk (LR) metric requires four steps: (1) observe relevant network security
conditions, (2) compute the risk of threats to the network in its current
state, (3) prioritize risks and decide on actions to mitigate risks, and (4) take action to mitigate risks or improve the
risk computation and mitigation pro-cesses. Attack models provide the foundation for each of these steps.
VOLUME 22, NUMBER 1, 2016 n LINCOLN LABORATORY JOURNAL 37
RICHARD P. LIPPMANN AND JAMES F. RIORDAN
In the Level 2 maturity phase, capability metric com-ponents are developed. These components determine whether the coverage, frequency, and accuracy of observa-tions are sufficient to estimate risk. Specifications, such as lists of the types of software allowed on each device or of the correct configurations of each device, are also created in this phase. Until the values of capability metrics are low (indicating good capabilities), risk cannot be computed accurately. Security improves slowly during this stage, as indicated by the slope of the graph in Figure 2. This slow progression is due to further discovery and repair of security issues as coverage improves across the entire network, specifications are developed, previously missed short-duration security conditions are identified because of more frequent observations, and security conditions are accurately measured.
In the final maturity phase, Level 3, operational risk metric components are developed. These components compute the actual risk associated with a given threat. They can be used to determine which devices, software packages, misconfigurations, vulnerabilities, persons, or other security conditions are responsible for the greatest increase in risk. With this information, network person-nel can take actions that reduce risk. Operational risk metrics continuously assess the risk of the most import-
ant threats in real time by estimating the impact caused by attackers directly compromising assets (e.g., propri-etary information, hardware, services).
The risk score for any threat is calculated by multi-plying the value of assets under attack by the probability that an insider or outsider attack succeeds (see equations in “A Metric for Software Vulnerabilities” section). In cases of fraud and theft, the asset value is easy to assign because it is simply the total value of money or goods stolen. In most cases, however, the asset value is assigned subjectively and is related to how an attack would impact
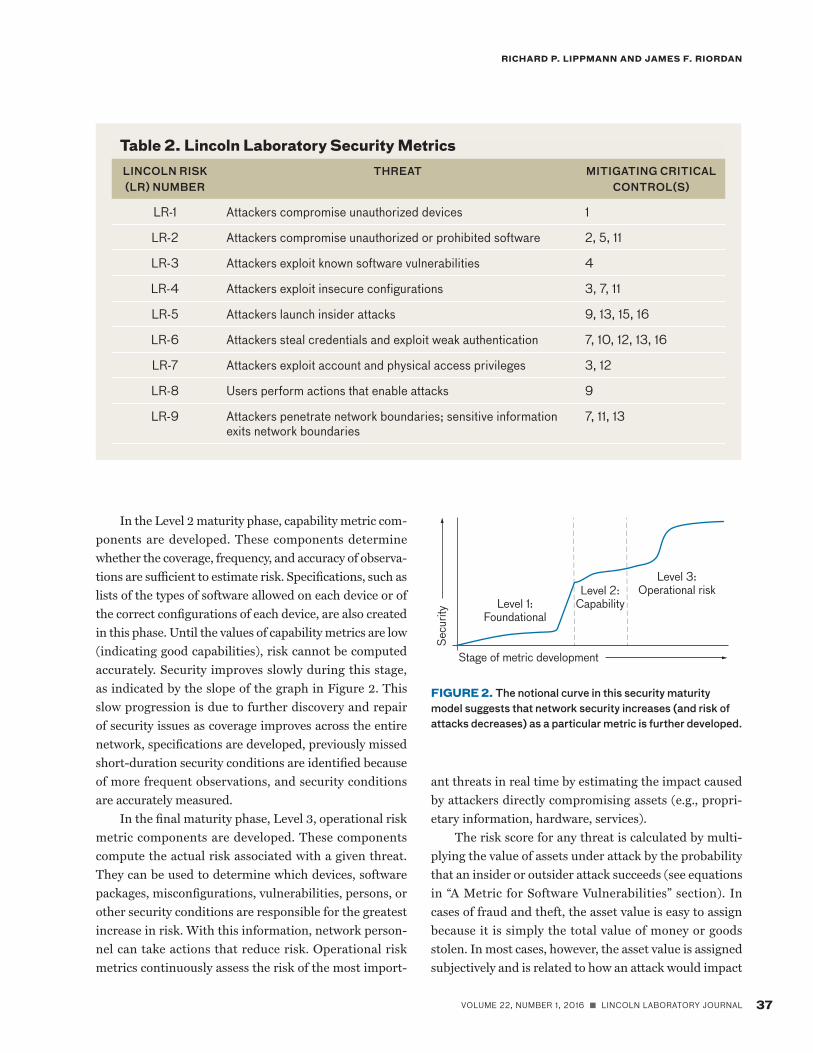
Table 2. Lincoln Laboratory Security MetricsLINCOLN RISK (LR) NUMBER
THREAT MITIGATING CRITICAL CONTROL(S)
LR-1 Attackers compromise unauthorized devices 1
LR-2 Attackers compromise unauthorized or prohibited software 2, 5, 11
LR-3 Attackers exploit known software vulnerabilities 4
LR-4 Attackers exploit insecure configurations 3, 7, 11
LR-5 Attackers launch insider attacks 9, 13, 15, 16
LR-6 Attackers steal credentials and exploit weak authentication 7, 10, 12, 13, 16
LR-7 Attackers exploit account and physical access privileges 3, 12
LR-8 Users perform actions that enable attacks 9
LR-9 Attackers penetrate network boundaries; sensitive information exits network boundaries
7, 11, 13
Stage of metric development
Secu
rity Level 1:
Foundational
Level 2: Capability
Level 3: Operational risk
FIGURE 2. The notional curve in this security maturity model suggests that network security increases (and risk of attacks decreases) as a particular metric is further developed.
38 LINCOLN LABORATORY JOURNAL n VOLUME 22, NUMBER 1, 2016
THREAT-BASED RISK ASSESSMENT FOR ENTERPRISE NETWORKS
the performance of an organization or persons that rely on or are affected by that organization. Values must be assigned for attacks that compromise an asset’s confi-dentiality, integrity, or availability. To achieve low oper-ational risk scores, critical assets must be assigned high values and be provided with strong protective controls. For example, the confidentiality of details supplied by persons to obtain Top Secret clearances might be violated by foreign governments who exfiltrate this information and use it to identify undercover U.S. agents posted to their countries [8]. Databases containing such details should qualitatively be assigned a high value because stolen data could compromise an agent’s usefulness or life. In other cases, network services should be assigned a high value. Denial-of-service attacks are often used to render network services inaccessible. The Department of Veterans Affairs, the Social Security Administration, the Federal Emergency Management Agency, and other agencies that provide government services directly to citizens need to implement strong protective controls against these attacks to ensure that network services can be accessed, especially during emergencies.
Metric Components Design GuidelinesThree key principles guide metric development: each met-ric must (1) be simple to understand and implement, (2) practically estimate the risk of one specific important threat, and (3) motivate actions to reduce the risk of that threat.
Maintaining simplicity and practicality and estimat-ing the risk of a specific threat are fairly straightforward tasks. Simple risk prediction models that utilize existing security tools to gather data are used when possible. The order in which we develop the metrics is chosen with prac-ticality and effectiveness in mind: earlier metrics provide situation awareness and baseline information, such as lists of devices and their software, required by later metrics. For example, metric LR-1 provides a device list that is used by all other higher-numbered metrics; LR-2 provides a device software list used by metrics LR-3 and LR-4.
To motivate system administrators to improve secu-rity controls, metrics must be objective, well defined, and visible to all involved in the security process so the met-ric scores can be understood to be fair. We adopted the convention that high scores for metrics are bad and low scores (near 0%) are good; when continuous vulnera-bility monitoring was implemented at the U.S. Depart-
ment of State, this scoring system was shown to be more likely to encourage administrators to improve their per-formance than the 0% (bad) to 100% (best) test scoring traditionally used in schools [7]. Two other motivating features are (1) incremental improvements in security controls lead to incremental improvements in metrics and (2) the overall difficulty of obtaining a low (good) metric score increases slowly over time as metric parame-ters change. Initially, it can be relatively easy to get a good score; however, as an enterprise’s capabilities improve and as response times to mitigate insecure conditions shorten, obtaining a good score can become more diffi-cult. Slowly increasing the difficulty of obtaining a low metric score should lead to long-term overall security improvements because system administrators will have to continually improve security controls and processes in order to maintain a low score.
Two Example MetricsThe following sections provide detailed examples of two metric types. One metric (LR-3) focuses on attackers who detect and exploit known software vulnerabilities. The risk of attack that the metric computes could, at least con-ceptually, be reduced to zero if all known vulnerabilities are immediately patched. Obtaining good low scores for this metric requires continuously observing all known vulnerabilities and eliminating them as soon as possible. The second metric (LR-5) focuses on insider attackers who use allowed privileges to exfiltrate data. The risk of insider attacks can never be eliminated because any per-son can decide to act maliciously at any time. Obtaining good low scores for this metric involves monitoring secu-rity screenings, roles, and privileges for all persons with access to a network and then computing the expected risk. This computation takes into account security measures, such as compartmentalization (a network is broken into separate “compartments” that can be accessed by users only on a need-to-know basis) and separation of duties.
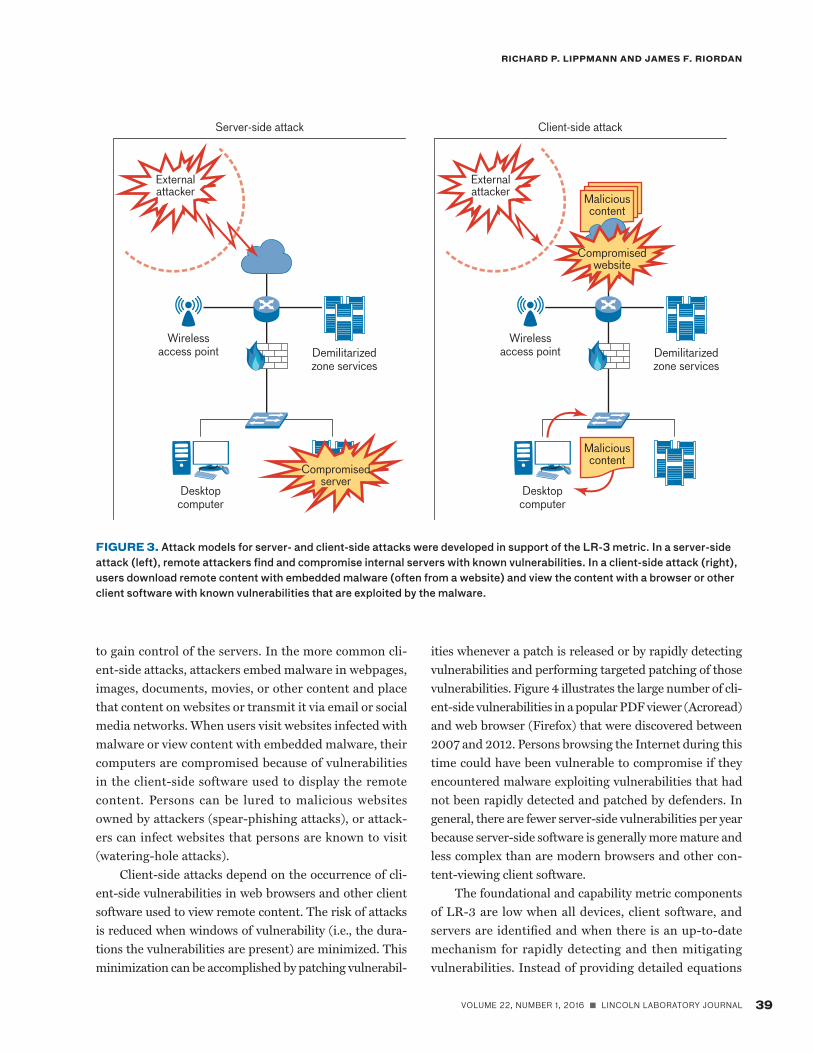
A Metric for Software Vulnerabilities LR-3 is concerned with managing known software vul-nerabilities. Figure 3 shows the two attack models that we developed for this metric. In server-side attacks, external attackers scan for vulnerabilities in web, data-base, email, and other servers open to the Internet. Once found, these vulnerabilities are exploited by attackers
VOLUME 22, NUMBER 1, 2016 n LINCOLN LABORATORY JOURNAL 39
RICHARD P. LIPPMANN AND JAMES F. RIORDAN
to gain control of the servers. In the more common cli-ent-side attacks, attackers embed malware in webpages, images, documents, movies, or other content and place that content on websites or transmit it via email or social media networks. When users visit websites infected with malware or view content with embedded malware, their computers are compromised because of vulnerabilities in the client-side software used to display the remote content. Persons can be lured to malicious websites owned by attackers (spear-phishing attacks), or attack-ers can infect websites that persons are known to visit (watering-hole attacks).
Client-side attacks depend on the occurrence of cli-ent-side vulnerabilities in web browsers and other client software used to view remote content. The risk of attacks is reduced when windows of vulnerability (i.e., the dura-tions the vulnerabilities are present) are minimized. This minimization can be accomplished by patching vulnerabil-
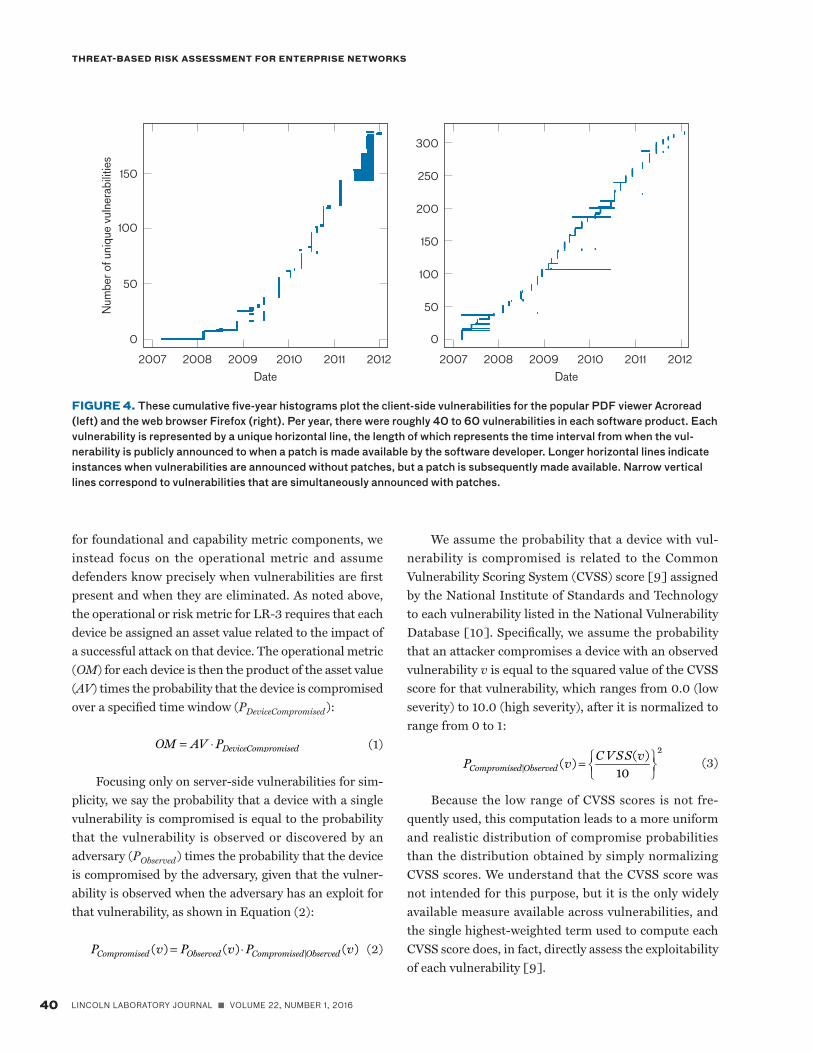
ities whenever a patch is released or by rapidly detecting vulnerabilities and performing targeted patching of those vulnerabilities. Figure 4 illustrates the large number of cli-ent-side vulnerabilities in a popular PDF viewer (Acroread) and web browser (Firefox) that were discovered between 2007 and 2012. Persons browsing the Internet during this time could have been vulnerable to compromise if they encountered malware exploiting vulnerabilities that had not been rapidly detected and patched by defenders. In general, there are fewer server-side vulnerabilities per year because server-side software is generally more mature and less complex than are modern browsers and other con-tent-viewing client software.
The foundational and capability metric components of LR-3 are low when all devices, client software, and servers are identified and when there is an up-to-date mechanism for rapidly detecting and then mitigating vulnerabilities. Instead of providing detailed equations
Demilitarized zone services
Demilitarized zone services
Server-side attack
Compromised server
Wireless access point
Desktop computer
Desktop computer
Wireless access point
External attacker
External attacker
Client-side attack
Malicious content
Malicious content
Compromised website
FIGURE 3. Attack models for server- and client-side attacks were developed in support of the LR-3 metric. In a server-side attack (left), remote attackers find and compromise internal servers with known vulnerabilities. In a client-side attack (right), users download remote content with embedded malware (often from a website) and view the content with a browser or other client software with known vulnerabilities that are exploited by the malware.
40 LINCOLN LABORATORY JOURNAL n VOLUME 22, NUMBER 1, 2016
THREAT-BASED RISK ASSESSMENT FOR ENTERPRISE NETWORKS
for foundational and capability metric components, we instead focus on the operational metric and assume defenders know precisely when vulnerabilities are first present and when they are eliminated. As noted above, the operational or risk metric for LR-3 requires that each device be assigned an asset value related to the impact of a successful attack on that device. The operational metric (OM) for each device is then the product of the asset value (AV) times the probability that the device is compromised over a specified time window (PDeviceCompromised ):
(1)
Focusing only on server-side vulnerabilities for sim-plicity, we say the probability that a device with a single vulnerability is compromised is equal to the probability that the vulnerability is observed or discovered by an adversary (PObserved ) times the probability that the device is compromised by the adversary, given that the vulner-ability is observed when the adversary has an exploit for that vulnerability, as shown in Equation (2):
(2)
OM = AV ⋅PDeviceCompromised
PCompromised (v) = PObserved (v) ⋅PCompromised|Observed (v)
We assume the probability that a device with vul-nerability is compromised is related to the Common Vulnerability Scoring System (CVSS) score [9] assigned by the National Institute of Standards and Technology to each vulnerability listed in the National Vulnerability Database [10]. Specifically, we assume the probability that an attacker compromises a device with an observed vulnerability v is equal to the squared value of the CVSS score for that vulnerability, which ranges from 0.0 (low severity) to 10.0 (high severity), after it is normalized to range from 0 to 1:
(3)
Because the low range of CVSS scores is not fre-quently used, this computation leads to a more uniform and realistic distribution of compromise probabilities than the distribution obtained by simply normalizing CVSS scores. We understand that the CVSS score was not intended for this purpose, but it is the only widely available measure available across vulnerabilities, and the single highest-weighted term used to compute each CVSS score does, in fact, directly assess the exploitability of each vulnerability [9].
PCompromised|Observed (v) =CVSS(v)
10⎧⎨⎩
⎫⎬⎭
2
250
300
200
100
150
50
0
Date201220112010200920082007
Num
ber o
f uni
que
vuln
erab
ilitie
s
150
100
50
0
Date201220112010200920082007
FIGURE 4. These cumulative five-year histograms plot the client-side vulnerabilities for the popular PDF viewer Acroread (left) and the web browser Firefox (right). Per year, there were roughly 40 to 60 vulnerabilities in each software product. Each vulnerability is represented by a unique horizontal line, the length of which represents the time interval from when the vul-nerability is publicly announced to when a patch is made available by the software developer. Longer horizontal lines indicate instances when vulnerabilities are announced without patches, but a patch is subsequently made available. Narrow vertical lines correspond to vulnerabilities that are simultaneously announced with patches.
VOLUME 22, NUMBER 1, 2016 n LINCOLN LABORATORY JOURNAL 41
RICHARD P. LIPPMANN AND JAMES F. RIORDAN
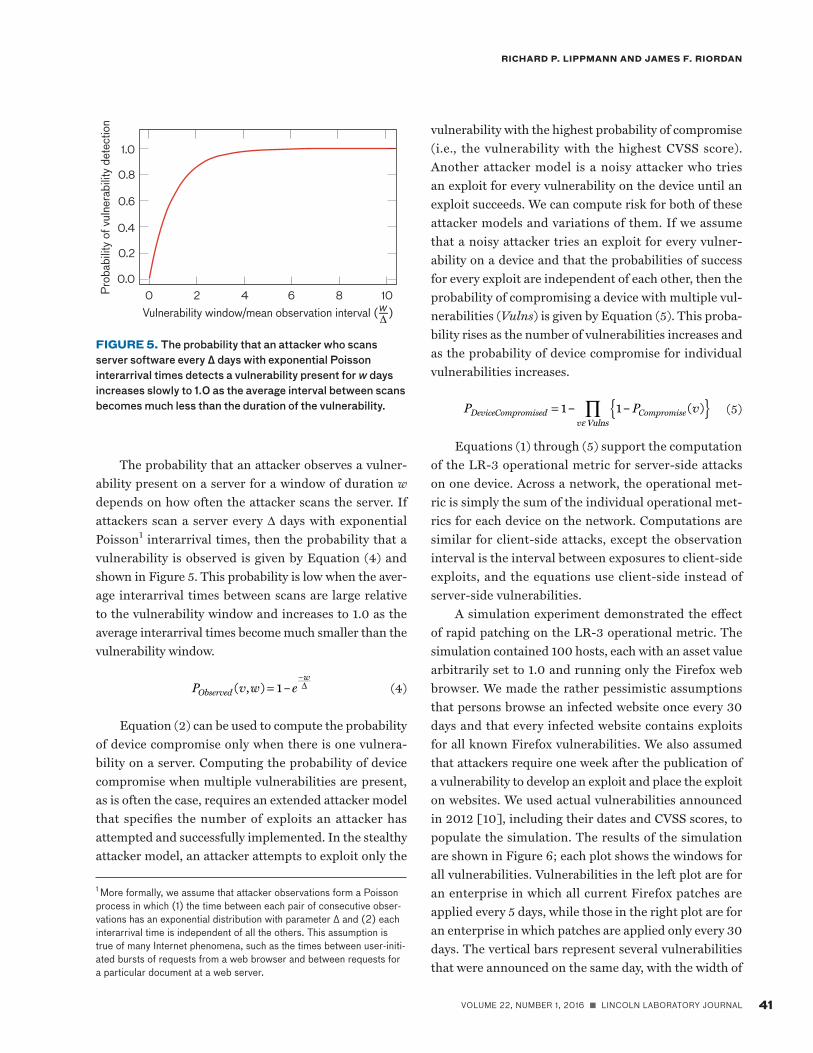
The probability that an attacker observes a vulner-ability present on a server for a window of duration w depends on how often the attacker scans the server. If attackers scan a server every Δ days with exponential Poisson1 interarrival times, then the probability that a vulnerability is observed is given by Equation (4) and shown in Figure 5. This probability is low when the aver-age interarrival times between scans are large relative to the vulnerability window and increases to 1.0 as the average interarrival times become much smaller than the vulnerability window.
(4)
Equation (2) can be used to compute the probability of device compromise only when there is one vulnera-bility on a server. Computing the probability of device compromise when multiple vulnerabilities are present, as is often the case, requires an extended attacker model that specifies the number of exploits an attacker has attempted and successfully implemented. In the stealthy attacker model, an attacker attempts to exploit only the
1 More formally, we assume that attacker observations form a Poisson process in which (1) the time between each pair of consecutive obser-vations has an exponential distribution with parameter Δ and (2) each interarrival time is independent of all the others. This assumption is true of many Internet phenomena, such as the times between user-initi-ated bursts of requests from a web browser and between requests for a particular document at a web server.
PObserved (v,w) = 1–e–wΔ
vulnerability with the highest probability of compromise (i.e., the vulnerability with the highest CVSS score). Another attacker model is a noisy attacker who tries an exploit for every vulnerability on the device until an exploit succeeds. We can compute risk for both of these attacker models and variations of them. If we assume that a noisy attacker tries an exploit for every vulner-ability on a device and that the probabilities of success for every exploit are independent of each other, then the probability of compromising a device with multiple vul-nerabilities (Vulns) is given by Equation (5). This proba-bility rises as the number of vulnerabilities increases and as the probability of device compromise for individual vulnerabilities increases.
(5)
Equations (1) through (5) support the computation of the LR-3 operational metric for server-side attacks on one device. Across a network, the operational met-ric is simply the sum of the individual operational met-rics for each device on the network. Computations are similar for client-side attacks, except the observation interval is the interval between exposures to client-side exploits, and the equations use client-side instead of server-side vulnerabilities.
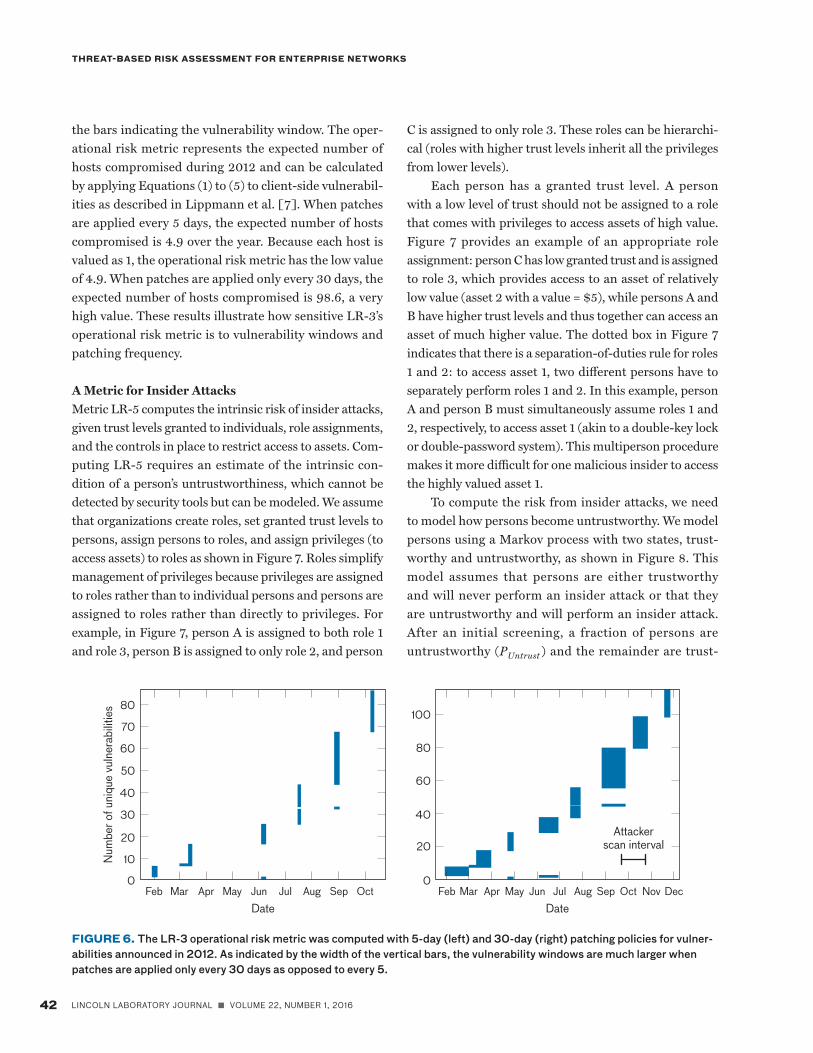
A simulation experiment demonstrated the effect of rapid patching on the LR-3 operational metric. The simulation contained 100 hosts, each with an asset value arbitrarily set to 1.0 and running only the Firefox web browser. We made the rather pessimistic assumptions that persons browse an infected website once every 30 days and that every infected website contains exploits for all known Firefox vulnerabilities. We also assumed that attackers require one week after the publication of a vulnerability to develop an exploit and place the exploit on websites. We used actual vulnerabilities announced in 2012 [10], including their dates and CVSS scores, to populate the simulation. The results of the simulation are shown in Figure 6; each plot shows the windows for all vulnerabilities. Vulnerabilities in the left plot are for an enterprise in which all current Firefox patches are applied every 5 days, while those in the right plot are for an enterprise in which patches are applied only every 30 days. The vertical bars represent several vulnerabilities that were announced on the same day, with the width of
PDeviceCompromised = 1– 1– PCompromise(v){ }vεVulns∏
Prob
abili
ty o
f vul
nera
bilit
y de
tect
ion
0.2
0.4
0.6
0.8
1.0
0.00 2 4 6 8 10Vulnerability window/mean observation interval (—)w
FIGURE 5. The probability that an attacker who scans server software every Δ days with exponential Poisson interarrival times detects a vulnerability present for w days increases slowly to 1.0 as the average interval between scans becomes much less than the duration of the vulnerability.
42 LINCOLN LABORATORY JOURNAL n VOLUME 22, NUMBER 1, 2016
THREAT-BASED RISK ASSESSMENT FOR ENTERPRISE NETWORKS
the bars indicating the vulnerability window. The oper-ational risk metric represents the expected number of hosts compromised during 2012 and can be calculated by applying Equations (1) to (5) to client-side vulnerabil-ities as described in Lippmann et al. [7]. When patches are applied every 5 days, the expected number of hosts compromised is 4.9 over the year. Because each host is valued as 1, the operational risk metric has the low value of 4.9. When patches are applied only every 30 days, the expected number of hosts compromised is 98.6, a very high value. These results illustrate how sensitive LR-3’s operational risk metric is to vulnerability windows and patching frequency.
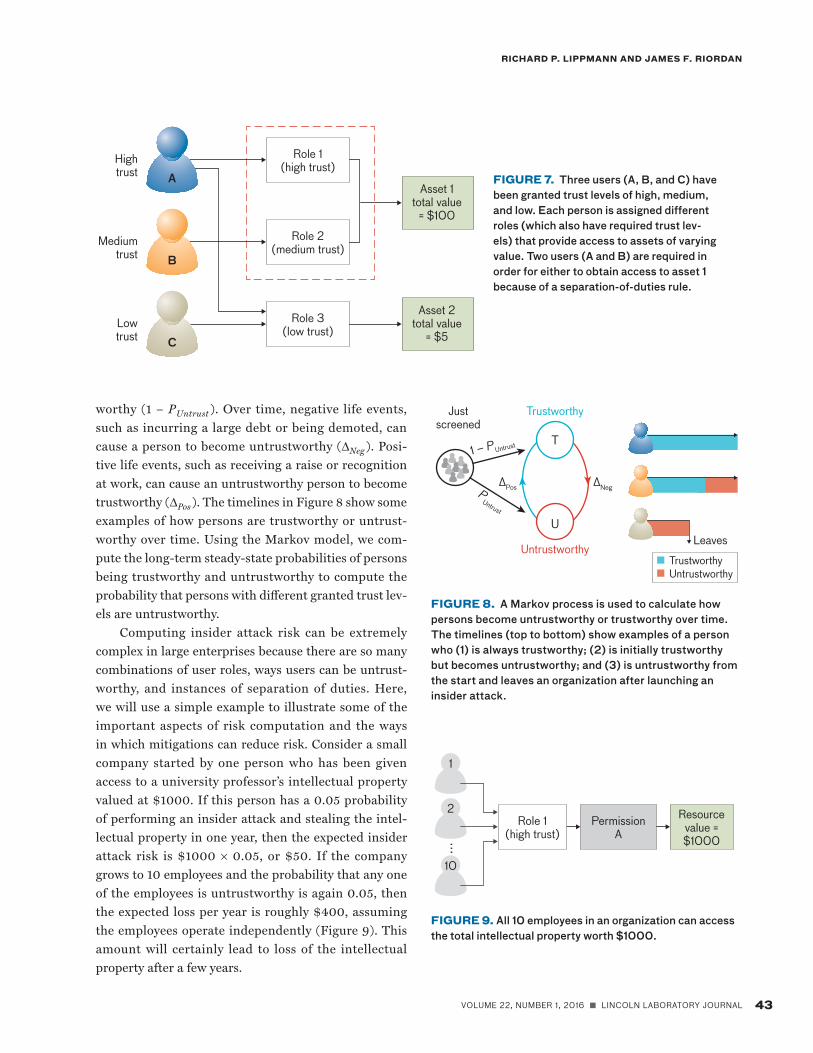
A Metric for Insider AttacksMetric LR-5 computes the intrinsic risk of insider attacks, given trust levels granted to individuals, role assignments, and the controls in place to restrict access to assets. Com-puting LR-5 requires an estimate of the intrinsic con-dition of a person’s untrustworthiness, which cannot be detected by security tools but can be modeled. We assume that organizations create roles, set granted trust levels to persons, assign persons to roles, and assign privileges (to access assets) to roles as shown in Figure 7. Roles simplify management of privileges because privileges are assigned to roles rather than to individual persons and persons are assigned to roles rather than directly to privileges. For example, in Figure 7, person A is assigned to both role 1 and role 3, person B is assigned to only role 2, and person
C is assigned to only role 3. These roles can be hierarchi-cal (roles with higher trust levels inherit all the privileges from lower levels).
Each person has a granted trust level. A person with a low level of trust should not be assigned to a role that comes with privileges to access assets of high value. Figure 7 provides an example of an appropriate role assignment: person C has low granted trust and is assigned to role 3, which provides access to an asset of relatively low value (asset 2 with a value = $5), while persons A and B have higher trust levels and thus together can access an asset of much higher value. The dotted box in Figure 7 indicates that there is a separation-of-duties rule for roles 1 and 2: to access asset 1, two different persons have to separately perform roles 1 and 2. In this example, person A and person B must simultaneously assume roles 1 and 2, respectively, to access asset 1 (akin to a double-key lock or double-password system). This multiperson procedure makes it more difficult for one malicious insider to access the highly valued asset 1.
To compute the risk from insider attacks, we need to model how persons become untrustworthy. We model persons using a Markov process with two states, trust-worthy and untrustworthy, as shown in Figure 8. This model assumes that persons are either trustworthy and will never perform an insider attack or that they are untrustworthy and will perform an insider attack. After an initial screening, a fraction of persons are untrustworthy (PUntrust ) and the remainder are trust-
Num
ber o
f uni
que
vuln
erab
ilitie
s 80
70
60
50
40
30
20
10
0
DateMay Jun Jul Aug Sep OctMar AprFeb
80
100
60
40
20
0
DateMay Jun Jul Aug Sep Oct Nov DecMar AprFeb
Attacker scan interval
FIGURE 6. The LR-3 operational risk metric was computed with 5-day (left) and 30-day (right) patching policies for vulner-abilities announced in 2012. As indicated by the width of the vertical bars, the vulnerability windows are much larger when patches are applied only every 30 days as opposed to every 5.
VOLUME 22, NUMBER 1, 2016 n LINCOLN LABORATORY JOURNAL 43
RICHARD P. LIPPMANN AND JAMES F. RIORDAN
worthy (1 − PUntrust ). Over time, negative life events, such as incurring a large debt or being demoted, can cause a person to become untrustworthy (ΔNeg ). Posi-tive life events, such as receiving a raise or recognition at work, can cause an untrustworthy person to become trustworthy (ΔPos ). The timelines in Figure 8 show some examples of how persons are trustworthy or untrust-worthy over time. Using the Markov model, we com-pute the long-term steady-state probabilities of persons being trustworthy and untrustworthy to compute the probability that persons with different granted trust lev-els are untrustworthy.
Computing insider attack risk can be extremely complex in large enterprises because there are so many combinations of user roles, ways users can be untrust-worthy, and instances of separation of duties. Here, we will use a simple example to illustrate some of the important aspects of risk computation and the ways in which mitigations can reduce risk. Consider a small company started by one person who has been given access to a university professor’s intellectual property valued at $1000. If this person has a 0.05 probability of performing an insider attack and stealing the intel-lectual property in one year, then the expected insider attack risk is $1000 × 0.05, or $50. If the company grows to 10 employees and the probability that any one of the employees is untrustworthy is again 0.05, then the expected loss per year is roughly $400, assuming the employees operate independently (Figure 9). This amount will certainly lead to loss of the intellectual property after a few years.
High trust
Medium trust
Low trust
Role 1(high trust)
Asset 1total value
= $100
Asset 2total value
= $5
Role 2(medium trust)
Role 3(low trust)
A
B
C
Trustworthy
Untrustworthy
T
U
ΔNegΔPos
1 – PUntrust
PUntrust
Just screened
TrustworthyUntrustworthy
Leaves
FIGURE 7. Three users (A, B, and C) have been granted trust levels of high, medium, and low. Each person is assigned different roles (which also have required trust lev-els) that provide access to assets of varying value. Two users (A and B) are required in order for either to obtain access to asset 1 because of a separation-of-duties rule.
FIGURE 8. A Markov process is used to calculate how persons become untrustworthy or trustworthy over time. The timelines (top to bottom) show examples of a person who (1) is always trustworthy; (2) is initially trustworthy but becomes untrustworthy; and (3) is untrustworthy from the start and leaves an organization after launching an insider attack.
PermissionA
Resource value = $1000
Role 1(high trust)
...
10
2
1
FIGURE 9. All 10 employees in an organization can access the total intellectual property worth $1000.
44 LINCOLN LABORATORY JOURNAL n VOLUME 22, NUMBER 1, 2016
THREAT-BASED RISK ASSESSMENT FOR ENTERPRISE NETWORKS
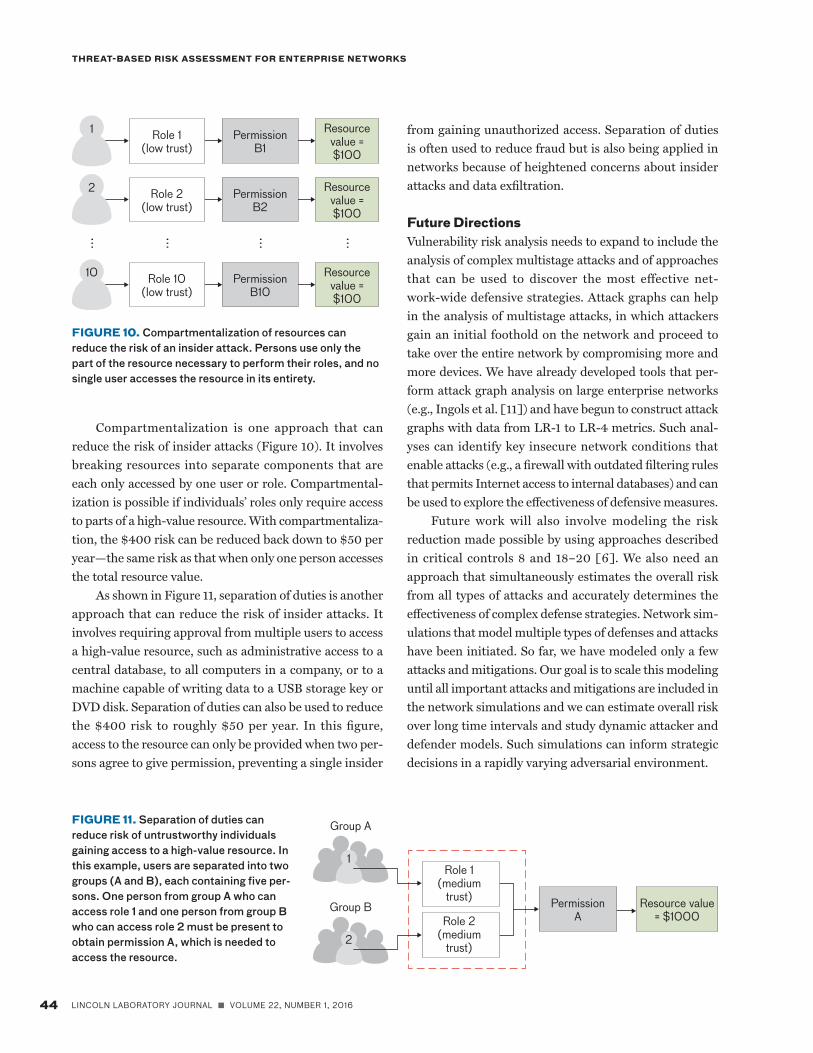
Compartmentalization is one approach that can reduce the risk of insider attacks (Figure 10). It involves breaking resources into separate components that are each only accessed by one user or role. Compartmental-ization is possible if individuals’ roles only require access to parts of a high-value resource. With compartmentaliza-tion, the $400 risk can be reduced back down to $50 per year—the same risk as that when only one person accesses the total resource value.
As shown in Figure 11, separation of duties is another approach that can reduce the risk of insider attacks. It involves requiring approval from multiple users to access a high-value resource, such as administrative access to a central database, to all computers in a company, or to a machine capable of writing data to a USB storage key or DVD disk. Separation of duties can also be used to reduce the $400 risk to roughly $50 per year. In this figure, access to the resource can only be provided when two per-sons agree to give permission, preventing a single insider
from gaining unauthorized access. Separation of duties is often used to reduce fraud but is also being applied in networks because of heightened concerns about insider attacks and data exfiltration.
Future DirectionsVulnerability risk analysis needs to expand to include the analysis of complex multistage attacks and of approaches that can be used to discover the most effective net-work-wide defensive strategies. Attack graphs can help in the analysis of multistage attacks, in which attackers gain an initial foothold on the network and proceed to take over the entire network by compromising more and more devices. We have already developed tools that per-form attack graph analysis on large enterprise networks (e.g., Ingols et al. [11]) and have begun to construct attack graphs with data from LR-1 to LR-4 metrics. Such anal-yses can identify key insecure network conditions that enable attacks (e.g., a firewall with outdated filtering rules that permits Internet access to internal databases) and can be used to explore the effectiveness of defensive measures.
Future work will also involve modeling the risk reduction made possible by using approaches described in critical controls 8 and 18–20 [6]. We also need an approach that simultaneously estimates the overall risk from all types of attacks and accurately determines the effectiveness of complex defense strategies. Network sim-ulations that model multiple types of defenses and attacks have been initiated. So far, we have modeled only a few attacks and mitigations. Our goal is to scale this modeling until all important attacks and mitigations are included in the network simulations and we can estimate overall risk over long time intervals and study dynamic attacker and defender models. Such simulations can inform strategic decisions in a rapidly varying adversarial environment.
PermissionB1
Resource value = $100
Role 1(low trust)
1
PermissionB2
Resource value = $100
Role 2(low trust)
2
...
...
...
...
PermissionB10
Resource value = $100
Role 10(low trust)
10
FIGURE 10. Compartmentalization of resources can reduce the risk of an insider attack. Persons use only the part of the resource necessary to perform their roles, and no single user accesses the resource in its entirety.
Group A
Role 1(medium
trust)
Role 2(medium
trust)
Resource value = $1000
PermissionA
Group B
1
2
FIGURE 11. Separation of duties can reduce risk of untrustworthy individuals gaining access to a high-value resource. In this example, users are separated into two groups (A and B), each containing five per-sons. One person from group A who can access role 1 and one person from group B who can access role 2 must be present to obtain permission A, which is needed to access the resource.
VOLUME 22, NUMBER 1, 2016 n LINCOLN LABORATORY JOURNAL 45
RICHARD P. LIPPMANN AND JAMES F. RIORDAN
AcknowledgmentsWe would like to thank Kimberly Watson, George Moore, and John Streufert for their support and insights into cyber security. We would also like to thank the many Lin-coln Laboratory staff members who have contributed to this effort, including David Bigelow, Thomas Hobson, Robert Lychev, Sebastian Neumayer, Shannon Rob-erts, Era Vuksani, Neal Wagner, David Weller-Fahy, and Tamara Yu.
References1. G. Greenwald, No Place to Hide: Edward Snowden, the NSA,
and the U.S. Surveillance State. London: Hamish Hamilton, 2014.
2. “APT1: Exposing One of China’s Cyber Espionage Units,” Mandiant Intelligence Center Report, 2013, pp. 1–74.
3. H. Kelly, “The ‘Heartbleed’ Security Flaw That Affects Most of the Internet,” CNN website, 9 Apr. 2014, available at www.cnn.com/2014/04/08/tech/web/heartbleed-openssl/.
4. N. Perlroth, “Companies Rush to Fix Shellshock Software Bug as Hackers Launch Thousands of Attacks,” The New York Times, 26 Sept. 2014, available at www.bits.blogs.nytimes.com/2014/09/26/companies-rush-to-fix-shellshock-soft-ware-bug-as-hackers-launch-thousands-of-attacks/?_r=0.
5. U. S. Office of Personnel Management, “Cybersecurity Resource Center, Cybersecurity Incidents,” available at https://www.opm.gov/cybersecurity/cybersecurity-inci-dents/.
6. “The Critical Security Controls for Effective Cyber Defense,” version 5.0, Council on CyberSecurity, SANS Institute, avail-able at www.sans.org/media/critical-security-controls/CSC-5.pdf.
7. R.P. Lippmann, J.F. Riordan, T.H. Yu, and K.K. Wat-son, “Continuous Security Metrics for Prevalent Network Threats: Introduction and First Four Metrics,” MIT Lincoln Laboratory Project Report IA-3, 22 May 2012, available at https://www.ll.mit.edu/mission/cybersec/publications/pub-lication-files/full_papers/2012_05_22_Lippmann_TechRe-port_FP.pdf.
8. M. Mazzetti and D.E. Sanger, “U.S. Fears Data Stolen by Chi-nese Hacker Could Identify Spies,” The New York Times, 24 July 2015, available at http://www.nytimes.com/2015/07/25/world/asia/us-fears-data-stolen-by-chinese-hacker-could-identify-spies.html.
9. P. Mell, K. Scarfone, and S. Romanosky, “CVSS: A Complete Guide to the Common Vulnerability Scoring System Version 2.0,” National Institute of Standards and Technology, June 2007, pp. 1–23, available at www.first.org/cvss/cvss-v2-guide.pdf.
10. “National Vulnerability Database,” National Institute of Stan-dards and Technology, 2015, available at https://nvd.nist.gov/.
11. K. Ingols, M. Chu, R. Lippmann, S. Webster, and S. Boyer, “Modeling Modern Network Attacks and Countermeasures Using Attack Graphs,” Proceedings of the Annual Computer Security Applications Conference, 2009, pp. 117–126.
About the AuthorsRichard P. Lippmann is a Lincoln Laboratory Fellow working in the Cyber Analytics and Decision Systems Group. He joined Lincoln Laboratory in 1981. His research interests include aids for the hearing impaired, speech recognition, pattern classification, neural networks, and cyber security. He has taught three
courses on machine learning; has been an IEEE Distinguished Lec-turer; won the first IEEE Signal Processing Magazine Best Paper Award for an early article on neural networks; and has authored or coauthored more than 100 papers on topics including speech recognition, machine learning, and cyber security. He served as the program chair of the Research in Attacks, Intrusions, and Defenses Workshop; the Neural Information Processing Systems (NIPS) annual conference; and the NIPS Workshop on Machine Learning in Adversarial Environments. He has participated in four national-level government studies on cyber security. He received a bachelor’s degree in electrical engineering from the Polytechnic Institute of Brooklyn and a doctoral degree in electrical engineering from MIT.
James F. Riordan is a technical staff member in the Cyber Analytics and Deci-sion Systems Group. His research inter-ests include operational security, applied cryptography, risk assessment, resilient computing, and the semantic web. Prior to joining the Laboratory in 2009, he was a researcher at the IBM Research Labo-
ratory in Zurich, Switzerland, for 12 years. During this time, he led numerous security-related projects on topics ranging from mobile computing to intrusion detection to web-centric trust enhancement, was named an IBM Master Inventor, and served on the executive board of the European Union’s Resilient Computing Network of Excellence. He received a bachelor’s degree in mathematics from the University of Massachusetts, Amherst, and a doctoral degree in mathematics from the University of Minnesota. While pursuing his doctoral studies, he was a member of the Architecture, Research, and Technology Group at the Secure Computing Corporation and a consultant to Counterpane Internet Security.


![Download[1].pdf cdj 100s](https://img.pdfslide.us/doc/110x75/5460c745af79593a708b5571/download1pdf-cdj-100s.jpg)


![JavaOne2016 - Microservices: Terabytes in Microseconds [CON4516]](https://img.pdfslide.us/doc/110x75/58887b4a1a28ab34788b644d/javaone2016-microservices-terabytes-in-microseconds-con4516-58b31e1ae0dea.jpg)