Embed Size (px)
Citation preview
7252019 Thoughts From RenMan-280915(5)
httpslidepdfcomreaderfullthoughts-from-renman-2809155 115
Thoughts from a Renaissance manWhen will the EM FX sell-off be complete
Thoughts from aRenaissance manEconomics amp Strategy
28 September 2015
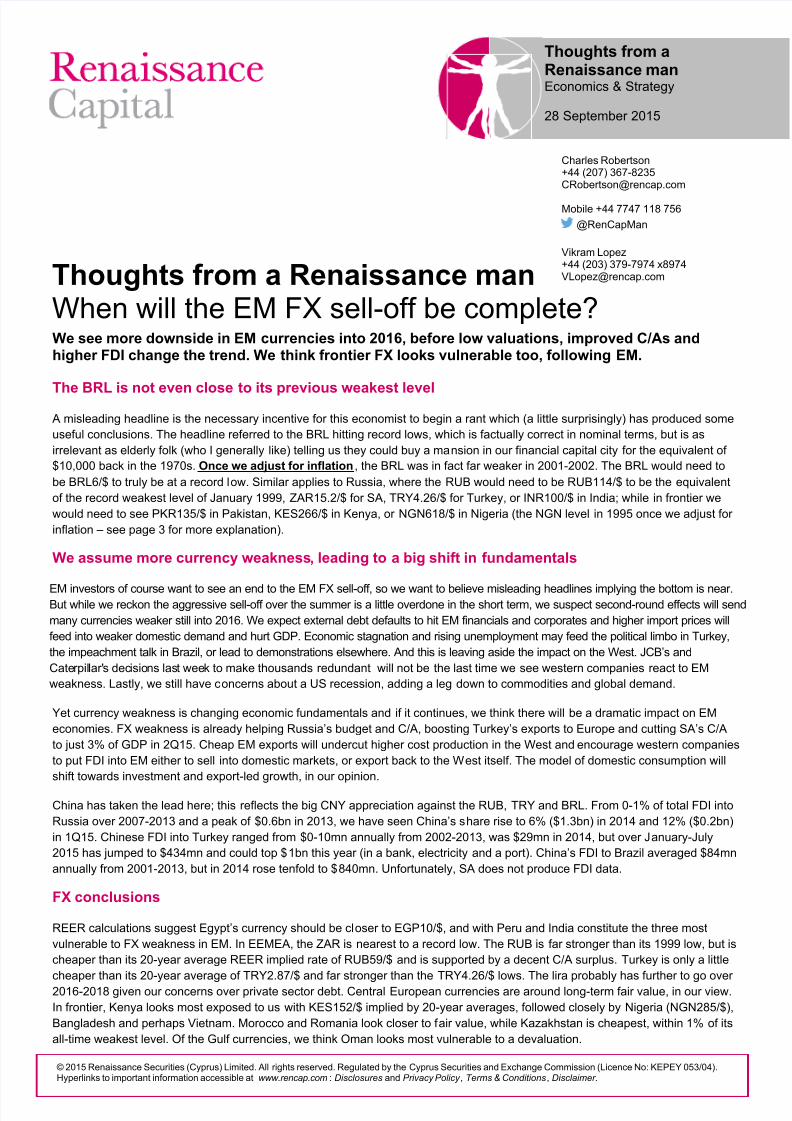
We see more downside in EM currencies into 2016 before low valuations improved CAs andhigher FDI change the trend We think frontier FX looks vulnerable too following EM
The BRL is not even close to its previous weakest level
A misleading headline is the necessary incentive for this economist to begin a rant which (a little surprisingly) has produced some
useful conclusions The headline referred to the BRL hitting record lows which is factually correct in nominal terms but is as
irrelevant as elderly folk (who I generally like) telling us they could buy a mansion in our financial capital city for the equivalent of
$10000 back in the 1970s Once we adjust for inflation the BRL was in fact far weaker in 2001-2002 The BRL would need to
be BRL6$ to truly be at a record low Similar applies to Russia where the RUB would need to be RUB114$ to be the equivalent
of the record weakest level of January 1999 ZAR152$ for SA TRY426$ for Turkey or INR100$ in India while in frontier we
would need to see PKR135$ in Pakistan KES266$ in Kenya or NGN618$ in Nigeria (the NGN level in 1995 once we adjust for
inflation ndash see page 3 for more explanation)
We assume more currency weakness leading to a big shift in fundamentals
EM investors of course want to see an end to the EM FX sell-off so we want to believe misleading headlines implying the bottom is nearBut while we reckon the aggressive sell-off over the summer is a little overdone in the short term we suspect second-round effects will send
many currencies weaker still into 2016 We expect external debt defaults to hit EM financials and corporates and higher import prices will
feed into weaker domestic demand and hurt GDP Economic stagnation and rising unemployment may feed the political limbo in Turkey
the impeachment talk in Brazil or lead to demonstrations elsewhere And this is leaving aside the impact on the West JCBrsquos and
Caterpillars decisions last week to make thousands redundant will not be the last time we see western companies react to EM
weakness Lastly we still have concerns about a US recession adding a leg down to commodities and global demand
Yet currency weakness is changing economic fundamentals and if it continues we think there will be a dramatic impact on EM
economies FX weakness is already helping Russiarsquos budget and CA boosting Turkeyrsquos exports to Europe and cutting SArsquos CA
to just 3 of GDP in 2Q15 Cheap EM exports will undercut higher cost production in the West and encourage western companies
to put FDI into EM either to sell into domestic markets or export back to the West itself The model of domestic consumption will
shift towards investment and export-led growth in our opinion
China has taken the lead here this reflects the big CNY appreciation against the RUB TRY and BRL From 0-1 of total FDI into
Russia over 2007-2013 and a peak of $06bn in 2013 we have seen Chinarsquos share rise to 6 ($13bn) in 2014 and 12 ($02bn)
in 1Q15 Chinese FDI into Turkey ranged from $0-10mn annually from 2002-2013 was $29mn in 2014 but over January-July
2015 has jumped to $434mn and could top $1bn this year (in a bank electricity and a port) Chinarsquos FDI to Brazil averaged $84mn
annually from 2001-2013 but in 2014 rose tenfold to $840mn Unfortunately SA does not produce FDI data
FX conclusions
REER calculations suggest Egyptrsquos currency should be closer to EGP10$ and with Peru and India constitute the three most
vulnerable to FX weakness in EM In EEMEA the ZAR is nearest to a record low The RUB is far stronger than its 1999 low but is
cheaper than its 20-year average REER implied rate of RUB59$ and is supported by a decent CA surplus Turkey is only a little
cheaper than its 20-year average of TRY287$ and far stronger than the TRY426$ lows The lira probably has further to go over
2016-2018 given our concerns over private sector debt Central European currencies are around long-term fair value in our view
In frontier Kenya looks most exposed to us with KES152$ implied by 20-year averages followed closely by Nigeria (NGN285$)
Bangladesh and perhaps Vietnam Morocco and Romania look closer to fair value while Kazakhstan is cheapest within 1 of its
all-time weakest level Of the Gulf currencies we think Oman looks most vulnerable to a devaluation
copy 2015 Renaissance Securities (Cyprus) Limited All rights reserved Regulated by the Cyprus Securities and Exchange Commission (Licence No KEPEY 05304)Hyperlinks to important information accessible at wwwrencapcom Disclosures and Privacy Policy Terms amp Conditions Disclaimer
Charles Robertson+44 (207) 367-8235CRobertsonrencapcom
Mobile +44 7747 118 756
RenCapMan
Vikram Lopez+44 (203) 379-7974 x8974
VLopezrencapcom
7252019 Thoughts From RenMan-280915(5)
httpslidepdfcomreaderfullthoughts-from-renman-2809155 215
2
Renaissance Capital28 September 2015
Thoughts from a Renaissance man
EM investors we meet are feeling pretty downbeat We spend more time discussing the
Syrian refugee crisis and the UK premierrsquos alleged predilection for roast pork than we do
discussing Russian inflation figures or SArsquos CA
The reason is obvious as Dan Salter pointed out in his Hindsight is a wonderful thing report published 13 April 2015 currency return is the second most important determinant
of total investor return ndash and currencies are getting crushed The BRL has collapsed from
BRL225$ in mid-2014 through BRL300$ in early 2015 and beyond BRL400$ in 3Q15
The ZAR has also been a very naughty currency breaking out (to the weaker side) of
what had become a relatively predictable four-year bearish channel
Figure 1 ZAR vs $
Source Bloomberg
Despite modest geopolitical improvements in Ukraine the RUB managed to lose all its
1H15 gains and weaken to beyond where it was in January when fighting was surging inUkraine and the US feared a Russian assault to create a land bridge to Crimea While all
of the above could be attributed in part to Chinarsquos slowdown and commodity prices
Turkey which should be a key beneficiary has seen its currency weaken sharply too
This recent currency weakness feels a litt le overdone to us in the short term but we doubt
the multi-year trend is over
We have yet to see the second-round effect of this currency weakness We expect to see
sovereign corporate or financial defaults on external debt as we explained in About that
1982 debt default published 4 September 2015 Weaker GDP could also intensify
problems domestically too via bank or corporate failures and rising unemployment
Politics represents a third threat via impeachment in Brazil political limbo in Turkey andthe risk of demonstrations against the authorities due to economic factors (such as the
wage disputes in SA over recent years) It is hard after over a decade in power to blame
economic problems on external factors alone
Indeed three of the four major EM currencies shown in the following chart are nowhere
near the lows seen in the five-year wake of the Asian crisis of 1997 Default weak GDP
and politics as well as the threat of a US recession (see our 13 January 2015 report SampP
500 at 1100 by March 2016) taking away a key leg in the global growth story could all
push EM currencies weaker still However after three-to-four years of REER depreciation
we think we might now be within a year or two of the bottom
6
7
8
9
10
1112
13
14
15
J a n - 1 1
F e b - 1 1
A p r - 1 1
J u n - 1 1
J u l - 1 1
S e p - 1 1
N o v - 1 1
D e c - 1 1
F e b - 1 2
M a r - 1 2
M a y - 1 2
J u l - 1 2
A u g - 1 2
O c t - 1 2
D e c - 1 2
J a n - 1 3
M a r - 1 3
M a y - 1 3
J u n - 1 3
A u g - 1 3
O c t - 1 3
N o v - 1 3
J a n - 1 4
M a r - 1 4
A p r - 1 4
J u n - 1 4
A u g - 1 4
S e p - 1 4
N o v - 1 4
J a n - 1 5
F e b - 1 5
A p r - 1 5
J u n - 1 5
J u l - 1 5
S e p - 1 5
Rand breaks out
7252019 Thoughts From RenMan-280915(5)
httpslidepdfcomreaderfullthoughts-from-renman-2809155 315
3
Renaissance Capital28 September 2015
Thoughts from a Renaissance man
Figure 2 EM currencies ndash REER (Dec 2007 = 100)
Note Bruegel uses CPI to adjust the index we have not made any CPI adjustment for June to September 2015
Source Bruegel Renaissance Capital (June to September 2015)
We need to explain the figure above and those below We have taken the REER numbersfrom Bruegel ndash which strips out consumer price inflation (CPI) from main trading partnersand the countries themselves ndash to give the ldquorealrdquo picture of currency valuation So while theBRL may now be weaker against the dollar than it was in 2002 there has been so muchmore inflation in Brazil than the US that comparing the exchange rate in 2002 and 2015really tells us very little The same applies to Nigeria Nigerias currency has never been asweak as NGN618 against the dollar but what the REER does is let us estimate what theNGN would have been in 1995 in todays money And the answer is NGN618
Note the Bruegel estimates stop in May 2015 ndash so for June to September 2015 we have
adjusted the index figure by currency moves but not by inflation This probably distorts the
figures by a percent or two but we donrsquot think this is significant enough to matter
So if we look at MSCI EM the graph below shows the highest REER rate a currency has
seen the lowest rate the May 2015 figure which is the last accurate REER reading and the
currency price on 22 September 2015 Lastly we add the long-term average REER rate
Colombia has a currency that is actually at its REER lows and well below its long-term
average Greece Chile and Taiwan also look competitive relative to their own histories
Countries on the left from Egypt to China to the Gulf countries are close to the strongest
they have ever been
Figure 3 Latest REER vs all-time high and low (Dec 2007 = 100) in MSCI EM
Source Bruegel Bloomberg Renaissance Capital
40
50
60
70
80
90
100
110
120
130
140
1 9 9 5 M 0 1
1 9 9 5 M 0 9
1 9 9 6 M 0 5
1 9 9 7 M 0 1
1 9 9 7 M 0 9
1 9 9 8 M 0 5
1 9 9 9 M 0 1
1 9 9 9 M 0 9
2 0 0 0 M 0 5
2 0 0 1 M 0 1
2 0 0 1 M 0 9
2 0 0 2 M 0 5
2 0 0 3 M 0 1
2 0 0 3 M 0 9
2 0 0 4 M 0 5
2 0 0 5 M 0 1
2 0 0 5 M 0 9
2 0 0 6 M 0 5
2 0 0 7 M 0 1
2 0 0 7 M 0 9
2 0 0 8 M 0 5
2 0 0 9 M 0 1
2 0 0 9 M 0 9
2 0 1 0 M 0 5
2 0 1 1 M 0 1
2 0 1 1 M 0 9
2 0 1 2 M 0 5
2 0 1 3 M 0 1
2 0 1 3 M 0 9
2 0 1 4 M 0 5
2 0 1 5 M 0 1
2 0 1 5 M 0 9
Brazil Turkey Russia South Africa
WEAKER
STRONGER
0
20
40
60
80
100
120
140
160180
E g y p t
C h i n a
Q a t a r
P h i l i p p i n e s
U A E
P e r u
I n d i a
T h a i l a n d
T a i w a n
I n d o n e s i a
C z e c h
C h i l e
G r e e c e
K o r e a
M a l a y s i a
P o l a n d
H u n g a r y
M e x i c o
S A f r i c a
R u s s i a
T u r k e y
C o l o m b i a
B r a z i l
Estimated current REER REER High REER Low REER May 2015 LT Avg REER
7252019 Thoughts From RenMan-280915(5)
httpslidepdfcomreaderfullthoughts-from-renman-2809155 415
4
Renaissance Capital28 September 2015
Thoughts from a Renaissance man
To look at this in another way ndash the following chart shows how much MSCI EM currencies
have fallen from their highs Gulf countries with fixed pegs have fallen the least while SA
Brazil and Colombia have fallen the most
Figure 4 MSCI EM currencies ndash change in REER from highs
Source Bruegel Bloomberg Renaissance Capital
So the BRL and ZAR are oversold Not necessarily as that chart doesnrsquot tell us if they
might have further to fall
If we compare our estimate of the current REER in September 2015 with prior lows we
find that Indonesiarsquos currency is 140 higher priced than when it was at its lows and
Russia is over 70 above its lows
The currencies that actually look like they have sold off enough ndash or arguably too much ndash
are Colombia Taiwan Greece Chile and yes maybe SA too There may be a longColombia and short Peru trade in their somewhere
Our only caveat for SA is that the ZAR is an ideal proxy for EM so it could be shorted by
investors even if is absolutely and relatively undervalued Currency trends can be
sustained beyond what is justified by fundamentals for a long time as the USD showed
us in the run-up to the Plaza accord The same may happen to the ZAR in 2016
Figure 5 REER change from lows ndash MSCI EM countries
Source Bruegel Bloomberg Renaissance Capital
But what we really need to see is the currency levels implied by all these graphs In
particular there are three things we think investors need to know
-50
-45
-40
-35
-30
-25
-20
-15
-10
-5
0
Q a t a r
U A E
C h i n a
E g y p t
P h i l i p
p i n e s
I n d i a
P e r u
G r e e c e
T h a i l a n d
K o r e a
C
z e c h
C h i l e
P
o l a n d
H u n g a r y
I n d o
n e s i a
T
u r k e y
T a i w a n
R
u s s i a
M
e x i c o
M a l a y s i a
C o l o
m b i a
S A f r i c a
B r a z i l
change from highs - EM countries
0
20
40
60
80
100120
140
160
I n d o n e s i a
E g y p t
R u s s i a
C h i n a
P h i l i p p i n e s
C z e c h
K o r e a
I n d i a
T h a i l a n d
B r a z i l
T u r k e y
M e x i c o
H u n g a r y
M a l a y s i a
Q a t a r
P o l a n d
U A E
P e r u
S A f r i c a
C h i l e
G r e e c e
T a i w a n
C o l o m b i a
change from lows - EM countries
These currencies arevery near their 20-year lows
RUB BRL and TRYare all still well abovetheir lows
7252019 Thoughts From RenMan-280915(5)
httpslidepdfcomreaderfullthoughts-from-renman-2809155 515
5
Renaissance Capital28 September 2015
Thoughts from a Renaissance man
What nominal currency rate is the worst-case scenario (assuming the past 20
years is a long enough sample) ndash see the third column of data below
How do currencies look now relative to their 20-year average ndash see the second
column of data below
Is the current rate justified by the current account position ndash see the last column
of data below
Note that the numbers below ndash eg the implication that the EGP would need to be
EGP981$ to equal its long-term average REER rate ndash do not take future inflation
differentials into account So if Egypt ran inflation of 10 a year while its trading
partners such as the US and Europe had inf lation of 2 and if Egypt took two years to
depreciate its currency then the eventual spot rate may need to be roughly 16 weaker
at EGP114$ to be the equivalent of todayrsquos implied lsquofair valuersquo of EGP981 $
Figure 6 Current FX rate vs $
Current FXrate vs $
FX rate implied by long-term average REER
FX rate if REER falls tolows
Current rate divided bylong-term average
2015 CA(GDP)
China 638 841 11 132 32Egypt 784 981 149 125 -33Philippines 468 58 782 124 55India 66 782 100 118 -13Qatar 364 412 452 113 84UAE 367 409 444 111 53Czech 243 27 403 111 16Thailand 361 381 543 106 44Peru 322 333 371 103 -46Hungary 279 285 384 102 33Poland 377 378 458 1 -18Korea 1191 1184 1819 099 71Indonesia 14647 14057 36071 096 -3Turkey 303 287 426 095 -42
Greece 09 085 098 094 14Chile 698 627 776 09 -12Russia 659 59 114 09 54Taiwan 33 292 346 088 124Malaysia 434 364 559 084 21Mexico 169 141 236 083 -22S Africa 136 102 152 075 -46Brazil 404 302 585 075 -37Colombia 3073 2269 3103 074 -58
SourceBruegel IMF April World economic Outlook Bloomberg R enaissance Capital
In terms of fair value Poland is the benchmark with a currency that is within 1 of its
long-term implied rate
Ten EMs have currencies stronger than the long-term implied rate Of these seven are
due to record current account surpluses in 2015 according to the IMF April World
Economic Outlook We think that a CA surplus justifies a currency stronger than the 20-
year average rate
We are content to argue that a country like China does not need to see more than a 10
devaluation in the currency from current levels when its current account has a surplus of
this size See our report FX and commodities ndash itrsquos just so 1981 published11 August 2015
This leaves us three countries ndash Egypt India and Peru ndash whose currencies look
particularly exposed Not only are they failing to keep pace with the general EM trend of
significant depreciation but they are also overvalued relative to their own long-term
history and lastly they are running CA deficits
7252019 Thoughts From RenMan-280915(5)
httpslidepdfcomreaderfullthoughts-from-renman-2809155 615
6
Renaissance Capital28 September 2015
Thoughts from a Renaissance man
On the other side of the equation ndash Taiwan Russia Malaysia Greece and Korea
look relatively good value These currencies may be considerably more expensive than
their historical lows ndash Russia would need to see RUB114$ to equal January 1999 ndash but
each has a CA surplus and each is cheaper than their long-term 20-year average In
Greecersquos case ndash given it has the euro ndash this simply means that Greece is roughly 6more competitive today than it has been for most of the past 20 years which is a modest
positive for company earnings In Greecersquos case we do not see that as offsetting the
damage that may be done by the ideologically anti-market Syriza government
Taiwan and Korea look like strong buys from a currency perspective but they do have to
compete with Japan which at the current JPY1205$ is around its all-time low of
JPY1225$ Any bounce for these two would presumably require a stronger yen
For SA we would now expect to see the CA improve more than the 46 of GDP that the
IMF expected in April 2015 Indeed the 2Q15 figure was around 3 of GDP We think
similar improvement is likely in Brazil Colombia and Mexico
What about frontier
Below we analyse 12 countries in MSCI Frontier plus Saudi Arabia Iran and Georgia
What jumps out first is that so many of them have a currency level that is very near their
20-year record strongest level Frontier FX has clearly not depreciated in line with EM FX
A number of factors may explain this First frontier markets are less globally integrated
than EM so we might expect them to react later Second their financial markets are far
more shallow which means it is easier for the authorities to resist market pressure ndash even
if economic fundamentals tell us this may not be the right policy stance to take It also
means that it does not take much money in the way of foreign aid or IMF support to keepa currency stable Third perhaps the underlying economic structure in frontier markets is
changing more than in emerging markets so their current exchange rates should not be
compared with their history We are however sceptical about that excuse Fourth frontier
markets tend to be poorer than EM countries so REER measures may not be as
applicable (see below) Fifth a few of these countries such as Kuwait (off-index) Saudi
Arabia Bahrain and Oman have historical pegs that have not changed much in 20 years
or more bolstered by large sovereign wealth funds (less true of Oman)
Figure 7 A number of Frontier and Beyond Frontier markets are near their strongest levels of the past 20 years
Note Argentinas strongest point was 250 which is off the scaleSource Bruegel Bloomberg Renaissance Capital
0
20
40
60
80
100
120
140
160
180
B a n g l a d e s h
V i e t n a m
S a u d i A r a b i a
I r a n
N i g e r i a
O m a n
K e n y a
K u w a i t
P a k i s t a n
S r i L a n k a
M o r o c c o
G e o r g i a
R o m a n i a
A r g e n t i n a
K a z a k h s t a n
Latest REER vs all-time high and low (Dec 2007 = 100) - selected Frontier countriesEstimated current REER REER High REER Low REER May 2015
7252019 Thoughts From RenMan-280915(5)
httpslidepdfcomreaderfullthoughts-from-renman-2809155 715
7
Renaissance Capital28 September 2015
Thoughts from a Renaissance man
Only Morocco Argentina and Kazakhstan are at or near their lows ndash but we are sceptical
about Argentinean data The IMF does not trust Argentinarsquos inflation data so if Bruegel is
using Argentinarsquos official inflation figures these are likely to distort their calculations More
positively Kazakhstan looks a particularly interesting investment given these graphs
Figure 8 REER change from strongest level ndash MSCI FM
Source Bruegel Renaissance Capital Bloomberg
Even more dramatic is when we compare the currency levels today with the lowest levels
seen over the past 20 years
Nigeria still has a very strong currency which we think is hurting the Nigerian economy ndash
see Yvonne Mhangorsquos report The cost of defending NGN199$1 from 11 September
2015 We doubt that improved fiscal management can do enough to support this Former
central bank governor Lamido Sanusi estimated that Nigeria was losing about $20bn over
2011-2013 due to theft from the budget or roughly $6-7bn a year With the oil price nowcut in half we estimate Nigeria could be saving $3bn a year by rooting out corruption in
the oil sector ndash which is less than 1 of GDP We doubt this is enough to support the
current naira rate if oil remains in a $40-60bl range in the medium-term
Kenya also comes out poorly on these charts ndash although we must note that the IMF does
its own analysis and it argued as recently as 23 September 2015 that the KES real
exchange rate is ldquobroadly in line with fundamentalsrdquo
Figure 9 REER change from lows ndash MSCI Frontier countries
Source Bruegel Bloomberg Renaissance Capital
Nigeria and Kenya look particularly extreme here but Morocco also interests us It is
curious how little volatility there has been in this REER rate ndash its Bloomberg currency
-80
-70
-60
-50
-40
-30
-20
-10
0
B a n g l a d e s h
K u w
a i t
O m
a n
S a u d i A r a
b i a
P a k i s
t a n
V i e t n
a m
S r i L a n k a
M o r o c c o
N i g e r i a
K e n y a
R o m a
n i a
G e o r g i a
K a z a k h s
t a n
I r a n
A r g e n t i n a
change from highs
0
50
100
150
200
250
N i g e r i a
K e n y a
R o m a n i a
I r a n
G e o r g i a
V i e t n a m
B a n g l a d e s h
S r i L a n k a
K u w a i t
S a u d i A r a b i a
P a k i s t a n
O m a n
A r g e n t i n a
M o r o c c o
K a z a k h s t a n
change from lows - FM countries
7252019 Thoughts From RenMan-280915(5)
httpslidepdfcomreaderfullthoughts-from-renman-2809155 815
8
Renaissance Capital28 September 2015
Thoughts from a Renaissance man
code MAD could not be a greater misnomer This is particularly interesting given that
Morocco is the only country we know that of that has experienced a private sector boom
and subsequent slowdown without this distorting its exchange rate significantly Irsquom
increasingly keen to meet a Moroccan central bank governor or two
So when we put numbers to these graphs we find that Kenya and Nigeria have currencies
that are the most overvalued relative to their own histories Moreover the IMF now
forecasts that Kenya will run a significant 10 of GDP current account deficit in 2015-16
The IMF did not expect Nigeria to have a CA deficit when it made its April 2015 forecasts
but Yvonne Mhango thinks there will be a 3 of GDP deficit ndash and we trust her to be more
up to date Just to reach their 20-year average implied rate would require Kenya and
Nigeria to see depreciation to KES152$ and NGN285$ respectively
Vietnam looks expensive to us It had a chunky CA surplus in 2014 but it may want to
keep it that way by allowing further depreciation of the currency We will be visiting
Vietnam next month and expect to learn more about the authorities thinking on this
Bangladesh would need to see the currency at around BDT100$ and Pakistan at around
PKR120$ to match their 20-year average implied rate We see this as representing
depreciation risk to our PKR110$ forecast for June 2016 (see Reform Awakens
published 18 May 2015) and we will not argue strongly against investors suggesting
PKR120$ is more realistic
If any Gulf peg looks vulnerable we think it is Oman with a currency that is a little too
strong and a big CA deficit We have also previously noted in Dan Salterrsquos report When
Fed patience is a virtue published 19 December 2014 that its sovereign wealth fund is
very limited in size relative to others
Figure 10 Gulf sovereign wealth fund (SWF) assets to GDP 2014-15SWF assets ($bn) GDP $bn (2015E) SWF assets to GDP
Kuwait 592 134 440
UAE 1215 364 334Qatar 256 197 130Saudi Arabia 677 649 104Bahrain 11 31 34Oman 19 63 30Note SWF assets data for Kuwait Qatar Bahrain and Oman have not been updated since 2014 ndash it would be wise to assume these are lower now
Source Sovereign wealth fund institute Renaissance Capital
Saudi Arabia looks okay in our view and like Kuwait it has substantial reserves There
has been modest currency appreciation We assume Saudi Arabia will have to cut budget
spending and provoke disinflation to bring its currency back into alignment and push the
current account back to into surplus A devaluation would be more surprising to us than
the CHF move earlier this year
We do not see much to worry about in Romania or Morocco
Georgia also has a currency that is now near long-term fair value although its external
debt (see About that 1982 debt default ) and CA deficit warrant continued attention Our
economist Oleg Kouzmin argues that from here the GELrsquos direction will be driven by
moves in the RUB AZM and TRY Further depreciation of the TRY towards its all-time
lows would therefore pull the GEL weaker too unless the RUB appreciated to offset this
7252019 Thoughts From RenMan-280915(5)
httpslidepdfcomreaderfullthoughts-from-renman-2809155 915
9
Renaissance Capital28 September 2015
Thoughts from a Renaissance man
Figure 11 REER implied exchange rates in MSCI Frontier
Current FXrate vs $
FX rate impliedby long-term average REER
FX rate if REERfalls to lows
Current rate divided bylong-term average
2015 CA(GDP)
Kenya 106 152 266 143 -77Nigeria 199 285 618 143 07Vietnam 22470 29114 35506 130 48Bangladesh 777 992 117 128 -06Sri Lanka 141 166 205 118 -20Kuwait 030 035 042 117 157Oman 038 044 049 116 -150Pakistan 104 120 135 115 -13Romania 396 449 935 113 -11Saudi Arabia 375 424 505 113 -10Georgia 238 237 392 100 -66Morocco 974 926 992 095 -34Iran 29856 26224 60389 088 08Kazakhstan 270 216 272 080 -19
Argentina 939 519 108 055 -17Note We expect Nigerias current account deficit to be 3 of GDP in 2015 the IMF revised its Kenya forecast to -99 of GDP in September 2015
Source IMF April WEO Bruegel Bloomberg Renaissance Capital
We have one fundamental problem with the REER methodology that is applicable to
Kenya and Nigeria We think it is flawed because inflation rates between rich and poor
countries are not the same
US per capita GDP was nearly $55000 in 2014 while Kenyarsquos was around $1400 If we
see 1 inflation in the US and 10 in Kenya and if we use those per capita GDP figures
as a proxy for wages then in 2015 US wages would have risen by $550 and Kenyan
wages would have risen by $140 A REER comparison would tell us that i f the Kenyan
shilling did not move in nominal terms then Kenya has lost about 9 competitiveness
against the US (10 Kenyan inflation minus 1 US inflation) but for a company
employing people in the US and Kenya the absolute cost of employing a worker has risen
much less in Kenya than it has in the US Kenya would need to have seen inflation closer
to 30 for wages in both countries to have risen by the same absolute amount Moreoverwe can imagine that productivity is much easier to improve in Kenya than the US
The implication then is that REER methodologies are fine when we compare rich
countries to rich countries or poor countries to poor countries but not when we compare
rich to poor
This is a key reason why we are not about to alter Yvonne Mhangorsquos exchange forecasts
for the NGN or the KES with the figures implied by this work on REER rates
However our problem with REER figures for poor countries also apply to Pakistan
Bangladesh Georgia and others We do think the REER methodology helps us see
where the risks are greatest And in the frontier space that risk would appear to begreatest in both Nigeria and Kenya and much less dramatic in Pakistan or Romania
while the Kazakh tenge looks very good value to us
How will cheaper currencies improve the situation
Amidst all the doom and gloom about EM we should be careful not to throw the baby out
with the bath water It is right for chief investment officers (CIOs) to ask why they should
invest in economies growing slower than the US with worse corporate governance than
the US and in companies that donrsquot have the global success of a Google or an Apple
and in currencies that keep weakening against the US dollar We are also fully aware of
some of the negative common themes in certain emerging markets see The problem with
political longevity published 12 August 2013
7252019 Thoughts From RenMan-280915(5)
httpslidepdfcomreaderfullthoughts-from-renman-2809155 1015
10
Renaissance Capital28 September 2015
Thoughts from a Renaissance man
But there is reform in EM ndash see Reform Awakens in which we highlighted positive trends
in Pakistan Romania Egypt Ukraine and probably Nigeria Russia is not generally seen
as being at the forefront of reform but here the central bank has let the currency float
management in key firms is being replaced (we think in a bid to improve productivity)
while the government has lifted its position from 120th
in the Ease of Doing businesssurvey in 2012 to 62nd today and targets 20th place by 2018
Eventually valuations will convince CIOs ndash and indeed western companies ndash that EM cannot
be written off and that it is worth making this move from allocating to the US to EM The
currency is going to play a key role in this The competitiveness gain that EM is experiencing
will be hard to ignore EM demand is likely to be hurt by the higher cost of imported goods
and in time this should translate into import substitution (where possible) and some
additional export lift even if much of the competitiveness gains are between emerging
markets at present (Russian mining competing with Brazilian mining for example)
In addition when over 30 of US exports go to (depreciating) Canada and Mexico US
companies will have few choices open to them They can either cut US costs dramatically
but this will require nominal wage cuts which is hard to imagine or they can choose to
produce in Mexico and sell in Mexico or they can choose to produce in Mexico and sell
back to the US We expect to see US FDI to EM pick up
Figure 12 Currencies vs the $ (nominal change) Sept 2005 to Sept 2015
Source Bloomberg
China has seen its currency appreciate even more significantly against most EM
currencies We expect Chinese firms to take advantage of their strong currency to buy up
assets in EM Since 2005 in nominal terms some of the largest EM currency falls relative
to the CNY have been seen in the RUB ZAR BRL and TRY
Figure 13 Currencies vs CNY nominal change Sept 2005 to Sept 2015
Source Bloomberg
-80
-60
-40
-20
0
20
40
C N Y
P H P
S G D
T H B
P E N
T W D
H K D
C Z K
B G N
M Y R
K R W
P L N
C L P
C O P
H U F
R O N
I D R
I N R
M X N
B R L
Z A R
T R Y
R U B
A R S
C H F
A U D
J P Y
D K K
E U R
S E K
N Z D
C A D
G B P
N O K
-80
-70
-60
-50
-40
-30
-20
-10
0
10
P H
P
S G
D
T H
B
P E
N
T W
D
H K
D
C Z
K
B G
N
M Y
R
K R
W
P L
N
C L
P
C O
P
H U
F
R O
N
I D
R
I N
R
M X
N
B R
L
Z A
R
T R
Y
R U
B
A R
S
C H
F
U S
D
A U
D
J P
Y
D K
K
E U
R
S E
K
N Z
D
C A
D
G B
P
N O
K
7252019 Thoughts From RenMan-280915(5)
httpslidepdfcomreaderfullthoughts-from-renman-2809155 1115
11
Renaissance Capital28 September 2015
Thoughts from a Renaissance man
Indeed China is already leading the way Over 40 of all the Chinese FDI that has
entered Brazil since 2001 arrived in 2014 Chinarsquos share of annual FDI flows into Brazil
Russia and Turkey was 0-1 in every year we have data for until 2014 when it rose to
15 in Brazil and 6 in Russia while latest 2015 data show it was 12 in Russia and
6 in Turkey Unfortunately SA does not produce FDI data by country
Figure 14 Chinese FDI into key EM countries is suddenly picking up
Note 2015 is 1Q15 for Russia and January-July 2015 for TurkeySource Turkish central bank Brazilian central bank Russian central bank
This echoes what happened with Japan in the 1980s a stronger JPY prompted a surge in
outward FDI For more on this comparison ndash see FX and commodities ndash itrsquos just so 1981
Figure 15 US and Japanese outward FDI in $mn 1980-1990
Note The US dollar peaked in strength in 1985 the JPY rose strongly vs the US dollar after 1985Source UNCTAD
The FDI flows also grow in importance as the EM GDP shrinks so even if the dollar
amount going into EM shrinks (as seen in Russia recently) EM GDP in dollars may be
shrinking faster So when the BRL was approaching its record lows in REER terms (see
Figure 2) we also saw FDI reach record levels of around 5 of GDP annually While FDI
is much higher in dollar terms now it has only had half the impact (2-3 of GDP) on the
Brazilian economy
0
2
4
6
8
10
12
14
-200
0
200
400
600
800
1000
2001 2002 2003 2004 2005 2006 2007 2008 2009 2010 2011 2012 2013 2014 2015
Chinese FDI in $m (lhs) and as of recipients total annual FDI (rhs)
Chinese FDI into Russia Chinese FDI into BrazilChinese FDI into Turkey Chinese FDI as of all Russian FDIChinese FDI as of all Brazilian FDI Chinese FDI as of all Turkish FDI
-
1000
2000
3000
4000
5000
6000
7000
1980 1981 1982 1983 1984 1985 1986 1987 1988 1989 1990
Japanese FDI outflows ($mn) rose with JPY strengthJapan US
7252019 Thoughts From RenMan-280915(5)
httpslidepdfcomreaderfullthoughts-from-renman-2809155 1215
12
Renaissance Capital28 September 2015
Thoughts from a Renaissance man
Figure 16 FDI was most important for Brazil over 1999-2001 when BRL was weak
Source UNCTAD
We would expect the surge in FDI to help boost productivity in EM and become part of a
reinvigorated EM contribution to the world economy This is a process that we expect to
see pick up over 2016-2017 ndash or perhaps a little longer if the US goes into a recession
Conclusions
We think that based on time considerations we are most of the way through the EM FX sell-
off that began in in 2012 but not necessarily three-quarters of the way through in terms of
value Half of EM currencies are still above their long-term average value based on our
REER analysis
Over 2016-2017 we would not be surprised to see previous lows tested for currencies
such as the BRL or the TRY before EM FX stabilises and begins to strengthen again
Once we take inflation into account this implies a level of BRL6$ ndash equivalent to what
was seen back in 2001-2002 or in Turkeyrsquos case TRY43$ We would of course be
delighted if EM currencies bounce back earlier than 2016-2017 and we should point out
that half of MSCI EM currencies are already cheaper than their 20-year average rates as
implied by our REER analysis For the long-term investor EM currencies on average are
at fair value in contrast to DM equities or bonds which are expensive relative to the long
term
A few EM currencies are already at or near their absolute lows compared to the past 20
years of history We think these should be seriously considered by EM investors lookingto take long positions either directly in FX or in equities and bonds
Colombia looks very attractive to us but perhaps investors will need to see proof that this
weaker currency is improving fundamentals Today the consensus on the current account
is only that it will improve from 6 of GDP in 2015 to 5 of GDP in 2016 ndash we expect
that will be too pessimistic
Taiwan with its cheap currency relative to the long-term average and a massive (12 of
GDP) CA surplus would also be attractive were it not for the competitive threat from
Japan which has a currency near its record weakest level
SA has a cheap currency near its absolute low (which we estimate at 152$) and which
might already be responsible for recently improved current account data Our only caveat
here is that the ZAR is a highly liquid EM proxy currency that could be driven weaker in
line with others such as the BRL but we would be supportive of investors taking long
0
1
2
3
4
5
6
0
10000
20000
30000
40000
5000060000
70000
1 9 9 0
1 9 9 1
1 9 9 2
1 9 9 3
1 9 9 4
1 9 9 5
1 9 9 6
1 9 9 7
1 9 9 8
1 9 9 9
2 0 0 0
2 0 0 1
2 0 0 2
2 0 0 3
2 0 0 4
2 0 0 5
2 0 0 6
2 0 0 7
2 0 0 8
2 0 0 9
2 0 1 0
2 0 1 1
2 0 1 2
2 0 1 3
FDI inflow to Brazil in $mn (lhs) and as of GDP (rhs)
FDI into Brazil ($m) FDI into Brazil of GDP
7252019 Thoughts From RenMan-280915(5)
httpslidepdfcomreaderfullthoughts-from-renman-2809155 1315
13
Renaissance Capital28 September 2015
Thoughts from a Renaissance man
positions in SA around current or weaker FX levels It is also worth noting that SArsquos equity
market outperformed EM in the Asian crisis of 1997-98 the tech bubble crash of 2000-01
and the global financial crisis of 2007-08 helped by its funds
The short side of the equation is Egypt ndash where a currency level around EGP98$ is justif ied today but where Gulf inflows could help the authorities resist this for some
time We would also recommend selling India which also happens to be a widely-
owned overweight in GEM funds as this currency is stronger than its long-term average
and it runs a current account deficit The other most vulnerable currency we think is
Perursquos for the same reasons
Elsewhere in EEMEA we see Poland Hungary and the Czech Republic as offering
low-risk alternatives Currencies are close to their 20-year average levels and current
accounts are healthy
Greece is slightly cheap but we donrsquot see that offsetting the problem of having a Syriza
government in power ndash which is likely to be unfriendly to portfolio investors in private
companies
Russiarsquos currency looks cheap to us too ndash at RUB65$ against the 20-year average of
RUB59$ ndash and is supported by a decent current account surplus
In the Gulf the UAE and Qatar have somewhat expensive currencies but these have
never been that volatile in 20 years In addition they have SWF reserves which we
estimate at over 300 and 100 of GDP respectively We doubt the currency regimes
will be altered in either so the main downside stems from the impact of budget cuts
The story for Frontier FX is very different Very few currencies have seen significant
depreciation Half are near the strongest levels they have ever been in REER terms
By far the best value from our perspective is now Kazakhstan ndash with a currency at its
absolute lows in a country that we expect to run a current account surplus in 2016 ndash see
our report Kazakhstanrsquos devaluation Implications for frontier currencies published 20
August 2015 In addition the government has a dynamic reform agenda that has been
likened to what Singapore has done in the past ndash see Kazakhstan Impressive reform plan
initiated published 9 July 2015
We also like the look of Morocco which has an enviable record of currency stability Like
South Africa equities may be relatively expensive to its peers but for a decent reason
assuming the currency is stable
Romania carries modest currency risk in our view but is inside the EU envelope which
offers some protection and has a healthy CA
We see risks being higher in Pakistan where a 15 devaluation to PKR120$ is
plausible and higher still in Bangladesh where history implies that fair value is
BDT100$ Vietnam is trading even further from long-term fair value and might also be
getting more vulnerable since its CA entered deficit territory in 1Q15
We always doubt Gulf currencies will move significantly but we are concerned by Oman
The 2008-2009 crisis hit that country hard reserves are far lower than in other countries
(Omanrsquos sovereign wealth fund would not cover a budget deficit on the scale of Saudirsquos
for even 12 months) and we think the currency looks expensive
The most vulnerable currencies of all according to this REER analysis are in Kenyarunning an estimated 10 of GDP current account deficit this year and Nigeria Their
current exchange rates look hard to justify if this REER analysis is valid (as noted above
7252019 Thoughts From RenMan-280915(5)
httpslidepdfcomreaderfullthoughts-from-renman-2809155 1415
14
Renaissance Capital28 September 2015
Thoughts from a Renaissance man
the IMF thinks not) Yvonne Mhango does expect depreciation to KES109 in 2015 and
KES115 in 2016 and NGN230 and NGN225 respectively for Kenya and Nigeria but
these Bruegel-derived REER calculations imply more than 30 deprecation risk above
those numbers
So our top picks in our universe would be Kazakhstan (in frontier) and SA (in EEMEA)
from a currency perspective
For currency trends to turn we need a change in fundamentals that we expect to see via
improved trade and CA numbers and a rise in FDI The latter is already picking up
sharply from China into Brazil Turkey and Russia We expect these trends will help re-
invigorate growth in EM from 2017-2018 and encourage investors to renew their interest
in the asset class
Figure 17 REER implied exchange rates for MSCI EM and some MSCI Frontier and Beyond Frontier countries
CurrentRate implied by
long-term average REER$ rate if REERfalls to lows
Date REERhit its low point
2015 CA ( GDP)
IMF April 2015forecasts
Bloomberg consensusforecasts (Sept 2015)
China 638 841 11 Apr-95 32 27India 661 782 100 Feb-96 -13 -11Indonesia 14684 14057 36071 Jun-98 -3 -24Korea 1193 1184 1819 Jan-98 71 79Malaysia 437 364 559 Dec-98 21 28Philippines 468 58 782 Feb-04 55 42Taiwan 331 292 346 Nov-09 124 139Thailand 363 381 543 Jan-98 44 45
Brazil 418 302 585 Oct-02 -37 -41Colombia 3117 2269 3103 Mar-03 -58 -58Chile 704 627 776 Jun-03 -12 -04Mexico 171 141 236 Mar-95 -22 -25Peru 322 333 371 Jul-07 -46 -4
Czech 242 27 403 Jan-95 16 07
Egypt 783 981 149 Dec-03 -33 -24Greece 089 085 098 Sep-00 14 02Hungary 279 285 384 Apr-95 33 48Poland 377 378 458 Nov-97 -18 -03Qatar 364 412 452 Aug-11 84 71Russia 665 59 114 Jan-99 54 49S Africa 139 102 152 Dec-01 -46 -44Turkey 306 287 426 Oct-01 -42 -5UAE 367 409 444 Aug-11 53 41
Argentina 94 519 108 Apr-14 -17 -15Bangladesh 777 992 117 Dec-06 -06 naGeorgia 238 237 392 Apr-95 -66 naKazakhstan 269 216 272 Oct-99 -19 -38Kenya 106 152 266 Jul-95 -77 -9Kuwait 03 035 042 Jun-95 157 126
Morocco 972 926 992 Aug-12 -34 -38Nigeria 199 285 618 Apr-95 07 -23Oman 039 044 049 Nov-07 -15 -85Pakistan 104 120 135 Sep-01 -13 -06Romania 394 449 935 Feb-97 -11 -1Sri Lanka 141 166 205 Jan-96 -2 -28Vietnam 22480 29114 35506 Jan-04 48 -05
Iran 29856 26224 60389 Jun-95 08 naSaudi Arabia 375 424 505 Mar-08 -1 -17Zambia 106 108 176 Dec-92 03 naNote More recent IMF CA forecasts include -06 for Zambia (June 2015) and -99 for Kenya (September 2015)
Source Bruegel Bloomberg IMF April World Economic Outlook Renaissance Capital
7252019 Thoughts From RenMan-280915(5)
httpslidepdfcomreaderfullthoughts-from-renman-2809155 1515
Renaissance CapitalMoscowT + 7 (495) 258 7777
Renaissance Capital LtdLondonT + 44 (203) 379 7777
Renaissance CapitalJohannesburgT +27 (11) 750 1400
Renaissance Securities (Cyprus)LtdNicosiaT + 357 (22) 505 800
Renaissance Securities (Nigeria) LtdLagosT +234 (1) 448 5300
Renaissance CapitalNairobiT +254 (20) 368 2000
Renaissance CapitalIstanbulT +90 (212) 362 3500
Renaissance CapitalDubaiT +971 (4) 409 2000
A complete set of disclosure statements associated with the issuers discussed in this report is available using the lsquoStock Finderrsquo or lsquoBond Finderrsquo for individualissuers on the Renaissance Capital Research Portal at httpresearchrencapcomengdefaultasp
This Communication is for information purposes only The Communication does not form a fiduciary relationship or constitute advice and is not and should not be construed asa recommendation or an offer or a solicitation of an offer of securities or related financial instruments or an invitation or inducement to engage in investment activity and cannotbe relied upon as a representation that any particular transaction necessarily could have been or can be effected at the stated price The Communication is not anadvertisement of securities nor independent investment research and has not been prepared in accordance with legal requirements designed to promote the independence ofinvestment research and is not subject to any prohibition on dealing ahead of the dissemination of investment research Opinions expressed therein may differ or be contrary toopinions expressed by other business areas or groups of the Renaissance Capital as a result of using different assumptions and criteria All such information is subject tochange without notice and neither Renaissance Capital nor any of its subsidiaries or affiliates is under any obligation to update or keep current the information contained in theCommunication or in any other medium
Descriptions of any company or issuer or their securities or the markets or developments mentioned in the Communication are not intended to be complete TheCommunication should not be regarded by recipients as a substitute for the exercise o f their own judgment as the Communication has no regard to the specific investmentobjectives financial situation or particular needs of any specific recipient The material (whether or not it states any opinions) is for general information purposes only and doesnot take into account your personal circumstances or objectives and nothing in this material is or should be considered to be financial investment or other advice on whichreliance should be placed Any reliance you place on such information is therefore strictly at your own risk The application of taxation laws depends on an investorrsquos individualcircumstances and accordingly each investor should seek independent professional advice on taxation implications before making any investment decision TheCommunication has been compiled or arrived at based on information obtained from sources believed to be reliable and in good faith Such information has not beenindependently verified is provided on an lsquoas isrsquo basis and no representation or warranty either expressed or implied is provided in relation to the accuracy completenessreliability merchantability or fitness for a particular purpose of such information except with respect to information concerning Renaissance Capital its subsidiaries andaffiliates All statements of opinion and all projections forecasts or statements relating to expectations regarding future events or the possible future performance ofinvestments represent Renaissance Capitalrsquos own assessment and interpretation of information available to them currently Any information relating to past performance of aninvestment does not necessarily guarantee future performance
The Communication is not intended for distribution to the public and may be confidential It may not be reproduced redistributed or published in whole or in part for anypurpose without the written permission of Renaissance Capital and neither Renaissance Capital nor any of its affiliates accepts any liability whatsoever for the actions of thirdparties in this respect The information may not be used to create any financial instruments or products or any indices Neither Renaissance Capital and its affiliates nor theirdirectors representatives or employees accept any liability for any direct or consequential loss or damage arising out of the use of all or any part of the Communication
copy 2015 Renaissance Securities (Cyprus) Limited All rights reserved Regulated by the Cyprus Securities and Exchange Commission (Licence No KEPEY 05304)
This research is for general information purposes only and should not be interpreted that Renaissance Capital is encouraging investment dealings ie buyingand selling securities in Iran Under US law ldquocriminal penalties for violations of the Iranian Transactions Regulations may result in a fine of up to $1000000 andnatural persons may be imprisoned for up to 20 yearsrdquo Under UK law criminal penalties for violating restrictions on investment in and certain financialtransactions with Iran may carry criminal penalties including up to 2 years in prison andor substantial fines

7252019 Thoughts From RenMan-280915(5)
httpslidepdfcomreaderfullthoughts-from-renman-2809155 315
3
Renaissance Capital28 September 2015
Thoughts from a Renaissance man
Figure 2 EM currencies ndash REER (Dec 2007 = 100)
Note Bruegel uses CPI to adjust the index we have not made any CPI adjustment for June to September 2015
Source Bruegel Renaissance Capital (June to September 2015)
We need to explain the figure above and those below We have taken the REER numbersfrom Bruegel ndash which strips out consumer price inflation (CPI) from main trading partnersand the countries themselves ndash to give the ldquorealrdquo picture of currency valuation So while theBRL may now be weaker against the dollar than it was in 2002 there has been so muchmore inflation in Brazil than the US that comparing the exchange rate in 2002 and 2015really tells us very little The same applies to Nigeria Nigerias currency has never been asweak as NGN618 against the dollar but what the REER does is let us estimate what theNGN would have been in 1995 in todays money And the answer is NGN618
Note the Bruegel estimates stop in May 2015 ndash so for June to September 2015 we have
adjusted the index figure by currency moves but not by inflation This probably distorts the
figures by a percent or two but we donrsquot think this is significant enough to matter
So if we look at MSCI EM the graph below shows the highest REER rate a currency has
seen the lowest rate the May 2015 figure which is the last accurate REER reading and the
currency price on 22 September 2015 Lastly we add the long-term average REER rate
Colombia has a currency that is actually at its REER lows and well below its long-term
average Greece Chile and Taiwan also look competitive relative to their own histories
Countries on the left from Egypt to China to the Gulf countries are close to the strongest
they have ever been
Figure 3 Latest REER vs all-time high and low (Dec 2007 = 100) in MSCI EM
Source Bruegel Bloomberg Renaissance Capital
40
50
60
70
80
90
100
110
120
130
140
1 9 9 5 M 0 1
1 9 9 5 M 0 9
1 9 9 6 M 0 5
1 9 9 7 M 0 1
1 9 9 7 M 0 9
1 9 9 8 M 0 5
1 9 9 9 M 0 1
1 9 9 9 M 0 9
2 0 0 0 M 0 5
2 0 0 1 M 0 1
2 0 0 1 M 0 9
2 0 0 2 M 0 5
2 0 0 3 M 0 1
2 0 0 3 M 0 9
2 0 0 4 M 0 5
2 0 0 5 M 0 1
2 0 0 5 M 0 9
2 0 0 6 M 0 5
2 0 0 7 M 0 1
2 0 0 7 M 0 9
2 0 0 8 M 0 5
2 0 0 9 M 0 1
2 0 0 9 M 0 9
2 0 1 0 M 0 5
2 0 1 1 M 0 1
2 0 1 1 M 0 9
2 0 1 2 M 0 5
2 0 1 3 M 0 1
2 0 1 3 M 0 9
2 0 1 4 M 0 5
2 0 1 5 M 0 1
2 0 1 5 M 0 9
Brazil Turkey Russia South Africa
WEAKER
STRONGER
0
20
40
60
80
100
120
140
160180
E g y p t
C h i n a
Q a t a r
P h i l i p p i n e s
U A E
P e r u
I n d i a
T h a i l a n d
T a i w a n
I n d o n e s i a
C z e c h
C h i l e
G r e e c e
K o r e a
M a l a y s i a
P o l a n d
H u n g a r y
M e x i c o
S A f r i c a
R u s s i a
T u r k e y
C o l o m b i a
B r a z i l
Estimated current REER REER High REER Low REER May 2015 LT Avg REER
7252019 Thoughts From RenMan-280915(5)
httpslidepdfcomreaderfullthoughts-from-renman-2809155 415
4
Renaissance Capital28 September 2015
Thoughts from a Renaissance man
To look at this in another way ndash the following chart shows how much MSCI EM currencies
have fallen from their highs Gulf countries with fixed pegs have fallen the least while SA
Brazil and Colombia have fallen the most
Figure 4 MSCI EM currencies ndash change in REER from highs
Source Bruegel Bloomberg Renaissance Capital
So the BRL and ZAR are oversold Not necessarily as that chart doesnrsquot tell us if they
might have further to fall
If we compare our estimate of the current REER in September 2015 with prior lows we
find that Indonesiarsquos currency is 140 higher priced than when it was at its lows and
Russia is over 70 above its lows
The currencies that actually look like they have sold off enough ndash or arguably too much ndash
are Colombia Taiwan Greece Chile and yes maybe SA too There may be a longColombia and short Peru trade in their somewhere
Our only caveat for SA is that the ZAR is an ideal proxy for EM so it could be shorted by
investors even if is absolutely and relatively undervalued Currency trends can be
sustained beyond what is justified by fundamentals for a long time as the USD showed
us in the run-up to the Plaza accord The same may happen to the ZAR in 2016
Figure 5 REER change from lows ndash MSCI EM countries
Source Bruegel Bloomberg Renaissance Capital
But what we really need to see is the currency levels implied by all these graphs In
particular there are three things we think investors need to know
-50
-45
-40
-35
-30
-25
-20
-15
-10
-5
0
Q a t a r
U A E
C h i n a
E g y p t
P h i l i p
p i n e s
I n d i a
P e r u
G r e e c e
T h a i l a n d
K o r e a
C
z e c h
C h i l e
P
o l a n d
H u n g a r y
I n d o
n e s i a
T
u r k e y
T a i w a n
R
u s s i a
M
e x i c o
M a l a y s i a
C o l o
m b i a
S A f r i c a
B r a z i l
change from highs - EM countries
0
20
40
60
80
100120
140
160
I n d o n e s i a
E g y p t
R u s s i a
C h i n a
P h i l i p p i n e s
C z e c h
K o r e a
I n d i a
T h a i l a n d
B r a z i l
T u r k e y
M e x i c o
H u n g a r y
M a l a y s i a
Q a t a r
P o l a n d
U A E
P e r u
S A f r i c a
C h i l e
G r e e c e
T a i w a n
C o l o m b i a
change from lows - EM countries
These currencies arevery near their 20-year lows
RUB BRL and TRYare all still well abovetheir lows
7252019 Thoughts From RenMan-280915(5)
httpslidepdfcomreaderfullthoughts-from-renman-2809155 515
5
Renaissance Capital28 September 2015
Thoughts from a Renaissance man
What nominal currency rate is the worst-case scenario (assuming the past 20
years is a long enough sample) ndash see the third column of data below
How do currencies look now relative to their 20-year average ndash see the second
column of data below
Is the current rate justified by the current account position ndash see the last column
of data below
Note that the numbers below ndash eg the implication that the EGP would need to be
EGP981$ to equal its long-term average REER rate ndash do not take future inflation
differentials into account So if Egypt ran inflation of 10 a year while its trading
partners such as the US and Europe had inf lation of 2 and if Egypt took two years to
depreciate its currency then the eventual spot rate may need to be roughly 16 weaker
at EGP114$ to be the equivalent of todayrsquos implied lsquofair valuersquo of EGP981 $
Figure 6 Current FX rate vs $
Current FXrate vs $
FX rate implied by long-term average REER
FX rate if REER falls tolows
Current rate divided bylong-term average
2015 CA(GDP)
China 638 841 11 132 32Egypt 784 981 149 125 -33Philippines 468 58 782 124 55India 66 782 100 118 -13Qatar 364 412 452 113 84UAE 367 409 444 111 53Czech 243 27 403 111 16Thailand 361 381 543 106 44Peru 322 333 371 103 -46Hungary 279 285 384 102 33Poland 377 378 458 1 -18Korea 1191 1184 1819 099 71Indonesia 14647 14057 36071 096 -3Turkey 303 287 426 095 -42
Greece 09 085 098 094 14Chile 698 627 776 09 -12Russia 659 59 114 09 54Taiwan 33 292 346 088 124Malaysia 434 364 559 084 21Mexico 169 141 236 083 -22S Africa 136 102 152 075 -46Brazil 404 302 585 075 -37Colombia 3073 2269 3103 074 -58
SourceBruegel IMF April World economic Outlook Bloomberg R enaissance Capital
In terms of fair value Poland is the benchmark with a currency that is within 1 of its
long-term implied rate
Ten EMs have currencies stronger than the long-term implied rate Of these seven are
due to record current account surpluses in 2015 according to the IMF April World
Economic Outlook We think that a CA surplus justifies a currency stronger than the 20-
year average rate
We are content to argue that a country like China does not need to see more than a 10
devaluation in the currency from current levels when its current account has a surplus of
this size See our report FX and commodities ndash itrsquos just so 1981 published11 August 2015
This leaves us three countries ndash Egypt India and Peru ndash whose currencies look
particularly exposed Not only are they failing to keep pace with the general EM trend of
significant depreciation but they are also overvalued relative to their own long-term
history and lastly they are running CA deficits
7252019 Thoughts From RenMan-280915(5)
httpslidepdfcomreaderfullthoughts-from-renman-2809155 615
6
Renaissance Capital28 September 2015
Thoughts from a Renaissance man
On the other side of the equation ndash Taiwan Russia Malaysia Greece and Korea
look relatively good value These currencies may be considerably more expensive than
their historical lows ndash Russia would need to see RUB114$ to equal January 1999 ndash but
each has a CA surplus and each is cheaper than their long-term 20-year average In
Greecersquos case ndash given it has the euro ndash this simply means that Greece is roughly 6more competitive today than it has been for most of the past 20 years which is a modest
positive for company earnings In Greecersquos case we do not see that as offsetting the
damage that may be done by the ideologically anti-market Syriza government
Taiwan and Korea look like strong buys from a currency perspective but they do have to
compete with Japan which at the current JPY1205$ is around its all-time low of
JPY1225$ Any bounce for these two would presumably require a stronger yen
For SA we would now expect to see the CA improve more than the 46 of GDP that the
IMF expected in April 2015 Indeed the 2Q15 figure was around 3 of GDP We think
similar improvement is likely in Brazil Colombia and Mexico
What about frontier
Below we analyse 12 countries in MSCI Frontier plus Saudi Arabia Iran and Georgia
What jumps out first is that so many of them have a currency level that is very near their
20-year record strongest level Frontier FX has clearly not depreciated in line with EM FX
A number of factors may explain this First frontier markets are less globally integrated
than EM so we might expect them to react later Second their financial markets are far
more shallow which means it is easier for the authorities to resist market pressure ndash even
if economic fundamentals tell us this may not be the right policy stance to take It also
means that it does not take much money in the way of foreign aid or IMF support to keepa currency stable Third perhaps the underlying economic structure in frontier markets is
changing more than in emerging markets so their current exchange rates should not be
compared with their history We are however sceptical about that excuse Fourth frontier
markets tend to be poorer than EM countries so REER measures may not be as
applicable (see below) Fifth a few of these countries such as Kuwait (off-index) Saudi
Arabia Bahrain and Oman have historical pegs that have not changed much in 20 years
or more bolstered by large sovereign wealth funds (less true of Oman)
Figure 7 A number of Frontier and Beyond Frontier markets are near their strongest levels of the past 20 years
Note Argentinas strongest point was 250 which is off the scaleSource Bruegel Bloomberg Renaissance Capital
0
20
40
60
80
100
120
140
160
180
B a n g l a d e s h
V i e t n a m
S a u d i A r a b i a
I r a n
N i g e r i a
O m a n
K e n y a
K u w a i t
P a k i s t a n
S r i L a n k a
M o r o c c o
G e o r g i a
R o m a n i a
A r g e n t i n a
K a z a k h s t a n
Latest REER vs all-time high and low (Dec 2007 = 100) - selected Frontier countriesEstimated current REER REER High REER Low REER May 2015
7252019 Thoughts From RenMan-280915(5)
httpslidepdfcomreaderfullthoughts-from-renman-2809155 715
7
Renaissance Capital28 September 2015
Thoughts from a Renaissance man
Only Morocco Argentina and Kazakhstan are at or near their lows ndash but we are sceptical
about Argentinean data The IMF does not trust Argentinarsquos inflation data so if Bruegel is
using Argentinarsquos official inflation figures these are likely to distort their calculations More
positively Kazakhstan looks a particularly interesting investment given these graphs
Figure 8 REER change from strongest level ndash MSCI FM
Source Bruegel Renaissance Capital Bloomberg
Even more dramatic is when we compare the currency levels today with the lowest levels
seen over the past 20 years
Nigeria still has a very strong currency which we think is hurting the Nigerian economy ndash
see Yvonne Mhangorsquos report The cost of defending NGN199$1 from 11 September
2015 We doubt that improved fiscal management can do enough to support this Former
central bank governor Lamido Sanusi estimated that Nigeria was losing about $20bn over
2011-2013 due to theft from the budget or roughly $6-7bn a year With the oil price nowcut in half we estimate Nigeria could be saving $3bn a year by rooting out corruption in
the oil sector ndash which is less than 1 of GDP We doubt this is enough to support the
current naira rate if oil remains in a $40-60bl range in the medium-term
Kenya also comes out poorly on these charts ndash although we must note that the IMF does
its own analysis and it argued as recently as 23 September 2015 that the KES real
exchange rate is ldquobroadly in line with fundamentalsrdquo
Figure 9 REER change from lows ndash MSCI Frontier countries
Source Bruegel Bloomberg Renaissance Capital
Nigeria and Kenya look particularly extreme here but Morocco also interests us It is
curious how little volatility there has been in this REER rate ndash its Bloomberg currency
-80
-70
-60
-50
-40
-30
-20
-10
0
B a n g l a d e s h
K u w
a i t
O m
a n
S a u d i A r a
b i a
P a k i s
t a n
V i e t n
a m
S r i L a n k a
M o r o c c o
N i g e r i a
K e n y a
R o m a
n i a
G e o r g i a
K a z a k h s
t a n
I r a n
A r g e n t i n a
change from highs
0
50
100
150
200
250
N i g e r i a
K e n y a
R o m a n i a
I r a n
G e o r g i a
V i e t n a m
B a n g l a d e s h
S r i L a n k a
K u w a i t
S a u d i A r a b i a
P a k i s t a n
O m a n
A r g e n t i n a
M o r o c c o
K a z a k h s t a n
change from lows - FM countries
7252019 Thoughts From RenMan-280915(5)
httpslidepdfcomreaderfullthoughts-from-renman-2809155 815
8
Renaissance Capital28 September 2015
Thoughts from a Renaissance man
code MAD could not be a greater misnomer This is particularly interesting given that
Morocco is the only country we know that of that has experienced a private sector boom
and subsequent slowdown without this distorting its exchange rate significantly Irsquom
increasingly keen to meet a Moroccan central bank governor or two
So when we put numbers to these graphs we find that Kenya and Nigeria have currencies
that are the most overvalued relative to their own histories Moreover the IMF now
forecasts that Kenya will run a significant 10 of GDP current account deficit in 2015-16
The IMF did not expect Nigeria to have a CA deficit when it made its April 2015 forecasts
but Yvonne Mhango thinks there will be a 3 of GDP deficit ndash and we trust her to be more
up to date Just to reach their 20-year average implied rate would require Kenya and
Nigeria to see depreciation to KES152$ and NGN285$ respectively
Vietnam looks expensive to us It had a chunky CA surplus in 2014 but it may want to
keep it that way by allowing further depreciation of the currency We will be visiting
Vietnam next month and expect to learn more about the authorities thinking on this
Bangladesh would need to see the currency at around BDT100$ and Pakistan at around
PKR120$ to match their 20-year average implied rate We see this as representing
depreciation risk to our PKR110$ forecast for June 2016 (see Reform Awakens
published 18 May 2015) and we will not argue strongly against investors suggesting
PKR120$ is more realistic
If any Gulf peg looks vulnerable we think it is Oman with a currency that is a little too
strong and a big CA deficit We have also previously noted in Dan Salterrsquos report When
Fed patience is a virtue published 19 December 2014 that its sovereign wealth fund is
very limited in size relative to others
Figure 10 Gulf sovereign wealth fund (SWF) assets to GDP 2014-15SWF assets ($bn) GDP $bn (2015E) SWF assets to GDP
Kuwait 592 134 440
UAE 1215 364 334Qatar 256 197 130Saudi Arabia 677 649 104Bahrain 11 31 34Oman 19 63 30Note SWF assets data for Kuwait Qatar Bahrain and Oman have not been updated since 2014 ndash it would be wise to assume these are lower now
Source Sovereign wealth fund institute Renaissance Capital
Saudi Arabia looks okay in our view and like Kuwait it has substantial reserves There
has been modest currency appreciation We assume Saudi Arabia will have to cut budget
spending and provoke disinflation to bring its currency back into alignment and push the
current account back to into surplus A devaluation would be more surprising to us than
the CHF move earlier this year
We do not see much to worry about in Romania or Morocco
Georgia also has a currency that is now near long-term fair value although its external
debt (see About that 1982 debt default ) and CA deficit warrant continued attention Our
economist Oleg Kouzmin argues that from here the GELrsquos direction will be driven by
moves in the RUB AZM and TRY Further depreciation of the TRY towards its all-time
lows would therefore pull the GEL weaker too unless the RUB appreciated to offset this
7252019 Thoughts From RenMan-280915(5)
httpslidepdfcomreaderfullthoughts-from-renman-2809155 915
9
Renaissance Capital28 September 2015
Thoughts from a Renaissance man
Figure 11 REER implied exchange rates in MSCI Frontier
Current FXrate vs $
FX rate impliedby long-term average REER
FX rate if REERfalls to lows
Current rate divided bylong-term average
2015 CA(GDP)
Kenya 106 152 266 143 -77Nigeria 199 285 618 143 07Vietnam 22470 29114 35506 130 48Bangladesh 777 992 117 128 -06Sri Lanka 141 166 205 118 -20Kuwait 030 035 042 117 157Oman 038 044 049 116 -150Pakistan 104 120 135 115 -13Romania 396 449 935 113 -11Saudi Arabia 375 424 505 113 -10Georgia 238 237 392 100 -66Morocco 974 926 992 095 -34Iran 29856 26224 60389 088 08Kazakhstan 270 216 272 080 -19
Argentina 939 519 108 055 -17Note We expect Nigerias current account deficit to be 3 of GDP in 2015 the IMF revised its Kenya forecast to -99 of GDP in September 2015
Source IMF April WEO Bruegel Bloomberg Renaissance Capital
We have one fundamental problem with the REER methodology that is applicable to
Kenya and Nigeria We think it is flawed because inflation rates between rich and poor
countries are not the same
US per capita GDP was nearly $55000 in 2014 while Kenyarsquos was around $1400 If we
see 1 inflation in the US and 10 in Kenya and if we use those per capita GDP figures
as a proxy for wages then in 2015 US wages would have risen by $550 and Kenyan
wages would have risen by $140 A REER comparison would tell us that i f the Kenyan
shilling did not move in nominal terms then Kenya has lost about 9 competitiveness
against the US (10 Kenyan inflation minus 1 US inflation) but for a company
employing people in the US and Kenya the absolute cost of employing a worker has risen
much less in Kenya than it has in the US Kenya would need to have seen inflation closer
to 30 for wages in both countries to have risen by the same absolute amount Moreoverwe can imagine that productivity is much easier to improve in Kenya than the US
The implication then is that REER methodologies are fine when we compare rich
countries to rich countries or poor countries to poor countries but not when we compare
rich to poor
This is a key reason why we are not about to alter Yvonne Mhangorsquos exchange forecasts
for the NGN or the KES with the figures implied by this work on REER rates
However our problem with REER figures for poor countries also apply to Pakistan
Bangladesh Georgia and others We do think the REER methodology helps us see
where the risks are greatest And in the frontier space that risk would appear to begreatest in both Nigeria and Kenya and much less dramatic in Pakistan or Romania
while the Kazakh tenge looks very good value to us
How will cheaper currencies improve the situation
Amidst all the doom and gloom about EM we should be careful not to throw the baby out
with the bath water It is right for chief investment officers (CIOs) to ask why they should
invest in economies growing slower than the US with worse corporate governance than
the US and in companies that donrsquot have the global success of a Google or an Apple
and in currencies that keep weakening against the US dollar We are also fully aware of
some of the negative common themes in certain emerging markets see The problem with
political longevity published 12 August 2013
7252019 Thoughts From RenMan-280915(5)
httpslidepdfcomreaderfullthoughts-from-renman-2809155 1015
10
Renaissance Capital28 September 2015
Thoughts from a Renaissance man
But there is reform in EM ndash see Reform Awakens in which we highlighted positive trends
in Pakistan Romania Egypt Ukraine and probably Nigeria Russia is not generally seen
as being at the forefront of reform but here the central bank has let the currency float
management in key firms is being replaced (we think in a bid to improve productivity)
while the government has lifted its position from 120th
in the Ease of Doing businesssurvey in 2012 to 62nd today and targets 20th place by 2018
Eventually valuations will convince CIOs ndash and indeed western companies ndash that EM cannot
be written off and that it is worth making this move from allocating to the US to EM The
currency is going to play a key role in this The competitiveness gain that EM is experiencing
will be hard to ignore EM demand is likely to be hurt by the higher cost of imported goods
and in time this should translate into import substitution (where possible) and some
additional export lift even if much of the competitiveness gains are between emerging
markets at present (Russian mining competing with Brazilian mining for example)
In addition when over 30 of US exports go to (depreciating) Canada and Mexico US
companies will have few choices open to them They can either cut US costs dramatically
but this will require nominal wage cuts which is hard to imagine or they can choose to
produce in Mexico and sell in Mexico or they can choose to produce in Mexico and sell
back to the US We expect to see US FDI to EM pick up
Figure 12 Currencies vs the $ (nominal change) Sept 2005 to Sept 2015
Source Bloomberg
China has seen its currency appreciate even more significantly against most EM
currencies We expect Chinese firms to take advantage of their strong currency to buy up
assets in EM Since 2005 in nominal terms some of the largest EM currency falls relative
to the CNY have been seen in the RUB ZAR BRL and TRY
Figure 13 Currencies vs CNY nominal change Sept 2005 to Sept 2015
Source Bloomberg
-80
-60
-40
-20
0
20
40
C N Y
P H P
S G D
T H B
P E N
T W D
H K D
C Z K
B G N
M Y R
K R W
P L N
C L P
C O P
H U F
R O N
I D R
I N R
M X N
B R L
Z A R
T R Y
R U B
A R S
C H F
A U D
J P Y
D K K
E U R
S E K
N Z D
C A D
G B P
N O K
-80
-70
-60
-50
-40
-30
-20
-10
0
10
P H
P
S G
D
T H
B
P E
N
T W
D
H K
D
C Z
K
B G
N
M Y
R
K R
W
P L
N
C L
P
C O
P
H U
F
R O
N
I D
R
I N
R
M X
N
B R
L
Z A
R
T R
Y
R U
B
A R
S
C H
F
U S
D
A U
D
J P
Y
D K
K
E U
R
S E
K
N Z
D
C A
D
G B
P
N O
K
7252019 Thoughts From RenMan-280915(5)
httpslidepdfcomreaderfullthoughts-from-renman-2809155 1115
11
Renaissance Capital28 September 2015
Thoughts from a Renaissance man
Indeed China is already leading the way Over 40 of all the Chinese FDI that has
entered Brazil since 2001 arrived in 2014 Chinarsquos share of annual FDI flows into Brazil
Russia and Turkey was 0-1 in every year we have data for until 2014 when it rose to
15 in Brazil and 6 in Russia while latest 2015 data show it was 12 in Russia and
6 in Turkey Unfortunately SA does not produce FDI data by country
Figure 14 Chinese FDI into key EM countries is suddenly picking up
Note 2015 is 1Q15 for Russia and January-July 2015 for TurkeySource Turkish central bank Brazilian central bank Russian central bank
This echoes what happened with Japan in the 1980s a stronger JPY prompted a surge in
outward FDI For more on this comparison ndash see FX and commodities ndash itrsquos just so 1981
Figure 15 US and Japanese outward FDI in $mn 1980-1990
Note The US dollar peaked in strength in 1985 the JPY rose strongly vs the US dollar after 1985Source UNCTAD
The FDI flows also grow in importance as the EM GDP shrinks so even if the dollar
amount going into EM shrinks (as seen in Russia recently) EM GDP in dollars may be
shrinking faster So when the BRL was approaching its record lows in REER terms (see
Figure 2) we also saw FDI reach record levels of around 5 of GDP annually While FDI
is much higher in dollar terms now it has only had half the impact (2-3 of GDP) on the
Brazilian economy
0
2
4
6
8
10
12
14
-200
0
200
400
600
800
1000
2001 2002 2003 2004 2005 2006 2007 2008 2009 2010 2011 2012 2013 2014 2015
Chinese FDI in $m (lhs) and as of recipients total annual FDI (rhs)
Chinese FDI into Russia Chinese FDI into BrazilChinese FDI into Turkey Chinese FDI as of all Russian FDIChinese FDI as of all Brazilian FDI Chinese FDI as of all Turkish FDI
-
1000
2000
3000
4000
5000
6000
7000
1980 1981 1982 1983 1984 1985 1986 1987 1988 1989 1990
Japanese FDI outflows ($mn) rose with JPY strengthJapan US
7252019 Thoughts From RenMan-280915(5)
httpslidepdfcomreaderfullthoughts-from-renman-2809155 1215
12
Renaissance Capital28 September 2015
Thoughts from a Renaissance man
Figure 16 FDI was most important for Brazil over 1999-2001 when BRL was weak
Source UNCTAD
We would expect the surge in FDI to help boost productivity in EM and become part of a
reinvigorated EM contribution to the world economy This is a process that we expect to
see pick up over 2016-2017 ndash or perhaps a little longer if the US goes into a recession
Conclusions
We think that based on time considerations we are most of the way through the EM FX sell-
off that began in in 2012 but not necessarily three-quarters of the way through in terms of
value Half of EM currencies are still above their long-term average value based on our
REER analysis
Over 2016-2017 we would not be surprised to see previous lows tested for currencies
such as the BRL or the TRY before EM FX stabilises and begins to strengthen again
Once we take inflation into account this implies a level of BRL6$ ndash equivalent to what
was seen back in 2001-2002 or in Turkeyrsquos case TRY43$ We would of course be
delighted if EM currencies bounce back earlier than 2016-2017 and we should point out
that half of MSCI EM currencies are already cheaper than their 20-year average rates as
implied by our REER analysis For the long-term investor EM currencies on average are
at fair value in contrast to DM equities or bonds which are expensive relative to the long
term
A few EM currencies are already at or near their absolute lows compared to the past 20
years of history We think these should be seriously considered by EM investors lookingto take long positions either directly in FX or in equities and bonds
Colombia looks very attractive to us but perhaps investors will need to see proof that this
weaker currency is improving fundamentals Today the consensus on the current account
is only that it will improve from 6 of GDP in 2015 to 5 of GDP in 2016 ndash we expect
that will be too pessimistic
Taiwan with its cheap currency relative to the long-term average and a massive (12 of
GDP) CA surplus would also be attractive were it not for the competitive threat from
Japan which has a currency near its record weakest level
SA has a cheap currency near its absolute low (which we estimate at 152$) and which
might already be responsible for recently improved current account data Our only caveat
here is that the ZAR is a highly liquid EM proxy currency that could be driven weaker in
line with others such as the BRL but we would be supportive of investors taking long
0
1
2
3
4
5
6
0
10000
20000
30000
40000
5000060000
70000
1 9 9 0
1 9 9 1
1 9 9 2
1 9 9 3
1 9 9 4
1 9 9 5
1 9 9 6
1 9 9 7
1 9 9 8
1 9 9 9
2 0 0 0
2 0 0 1
2 0 0 2
2 0 0 3
2 0 0 4
2 0 0 5
2 0 0 6
2 0 0 7
2 0 0 8
2 0 0 9
2 0 1 0
2 0 1 1
2 0 1 2
2 0 1 3
FDI inflow to Brazil in $mn (lhs) and as of GDP (rhs)
FDI into Brazil ($m) FDI into Brazil of GDP
7252019 Thoughts From RenMan-280915(5)
httpslidepdfcomreaderfullthoughts-from-renman-2809155 1315
13
Renaissance Capital28 September 2015
Thoughts from a Renaissance man
positions in SA around current or weaker FX levels It is also worth noting that SArsquos equity
market outperformed EM in the Asian crisis of 1997-98 the tech bubble crash of 2000-01
and the global financial crisis of 2007-08 helped by its funds
The short side of the equation is Egypt ndash where a currency level around EGP98$ is justif ied today but where Gulf inflows could help the authorities resist this for some
time We would also recommend selling India which also happens to be a widely-
owned overweight in GEM funds as this currency is stronger than its long-term average
and it runs a current account deficit The other most vulnerable currency we think is
Perursquos for the same reasons
Elsewhere in EEMEA we see Poland Hungary and the Czech Republic as offering
low-risk alternatives Currencies are close to their 20-year average levels and current
accounts are healthy
Greece is slightly cheap but we donrsquot see that offsetting the problem of having a Syriza
government in power ndash which is likely to be unfriendly to portfolio investors in private
companies
Russiarsquos currency looks cheap to us too ndash at RUB65$ against the 20-year average of
RUB59$ ndash and is supported by a decent current account surplus
In the Gulf the UAE and Qatar have somewhat expensive currencies but these have
never been that volatile in 20 years In addition they have SWF reserves which we
estimate at over 300 and 100 of GDP respectively We doubt the currency regimes
will be altered in either so the main downside stems from the impact of budget cuts
The story for Frontier FX is very different Very few currencies have seen significant
depreciation Half are near the strongest levels they have ever been in REER terms
By far the best value from our perspective is now Kazakhstan ndash with a currency at its
absolute lows in a country that we expect to run a current account surplus in 2016 ndash see
our report Kazakhstanrsquos devaluation Implications for frontier currencies published 20
August 2015 In addition the government has a dynamic reform agenda that has been
likened to what Singapore has done in the past ndash see Kazakhstan Impressive reform plan
initiated published 9 July 2015
We also like the look of Morocco which has an enviable record of currency stability Like
South Africa equities may be relatively expensive to its peers but for a decent reason
assuming the currency is stable
Romania carries modest currency risk in our view but is inside the EU envelope which
offers some protection and has a healthy CA
We see risks being higher in Pakistan where a 15 devaluation to PKR120$ is
plausible and higher still in Bangladesh where history implies that fair value is
BDT100$ Vietnam is trading even further from long-term fair value and might also be
getting more vulnerable since its CA entered deficit territory in 1Q15
We always doubt Gulf currencies will move significantly but we are concerned by Oman
The 2008-2009 crisis hit that country hard reserves are far lower than in other countries
(Omanrsquos sovereign wealth fund would not cover a budget deficit on the scale of Saudirsquos
for even 12 months) and we think the currency looks expensive
The most vulnerable currencies of all according to this REER analysis are in Kenyarunning an estimated 10 of GDP current account deficit this year and Nigeria Their
current exchange rates look hard to justify if this REER analysis is valid (as noted above
7252019 Thoughts From RenMan-280915(5)
httpslidepdfcomreaderfullthoughts-from-renman-2809155 1415
14
Renaissance Capital28 September 2015
Thoughts from a Renaissance man
the IMF thinks not) Yvonne Mhango does expect depreciation to KES109 in 2015 and
KES115 in 2016 and NGN230 and NGN225 respectively for Kenya and Nigeria but
these Bruegel-derived REER calculations imply more than 30 deprecation risk above
those numbers
So our top picks in our universe would be Kazakhstan (in frontier) and SA (in EEMEA)
from a currency perspective
For currency trends to turn we need a change in fundamentals that we expect to see via
improved trade and CA numbers and a rise in FDI The latter is already picking up
sharply from China into Brazil Turkey and Russia We expect these trends will help re-
invigorate growth in EM from 2017-2018 and encourage investors to renew their interest
in the asset class
Figure 17 REER implied exchange rates for MSCI EM and some MSCI Frontier and Beyond Frontier countries
CurrentRate implied by
long-term average REER$ rate if REERfalls to lows
Date REERhit its low point
2015 CA ( GDP)
IMF April 2015forecasts
Bloomberg consensusforecasts (Sept 2015)
China 638 841 11 Apr-95 32 27India 661 782 100 Feb-96 -13 -11Indonesia 14684 14057 36071 Jun-98 -3 -24Korea 1193 1184 1819 Jan-98 71 79Malaysia 437 364 559 Dec-98 21 28Philippines 468 58 782 Feb-04 55 42Taiwan 331 292 346 Nov-09 124 139Thailand 363 381 543 Jan-98 44 45
Brazil 418 302 585 Oct-02 -37 -41Colombia 3117 2269 3103 Mar-03 -58 -58Chile 704 627 776 Jun-03 -12 -04Mexico 171 141 236 Mar-95 -22 -25Peru 322 333 371 Jul-07 -46 -4
Czech 242 27 403 Jan-95 16 07
Egypt 783 981 149 Dec-03 -33 -24Greece 089 085 098 Sep-00 14 02Hungary 279 285 384 Apr-95 33 48Poland 377 378 458 Nov-97 -18 -03Qatar 364 412 452 Aug-11 84 71Russia 665 59 114 Jan-99 54 49S Africa 139 102 152 Dec-01 -46 -44Turkey 306 287 426 Oct-01 -42 -5UAE 367 409 444 Aug-11 53 41
Argentina 94 519 108 Apr-14 -17 -15Bangladesh 777 992 117 Dec-06 -06 naGeorgia 238 237 392 Apr-95 -66 naKazakhstan 269 216 272 Oct-99 -19 -38Kenya 106 152 266 Jul-95 -77 -9Kuwait 03 035 042 Jun-95 157 126
Morocco 972 926 992 Aug-12 -34 -38Nigeria 199 285 618 Apr-95 07 -23Oman 039 044 049 Nov-07 -15 -85Pakistan 104 120 135 Sep-01 -13 -06Romania 394 449 935 Feb-97 -11 -1Sri Lanka 141 166 205 Jan-96 -2 -28Vietnam 22480 29114 35506 Jan-04 48 -05
Iran 29856 26224 60389 Jun-95 08 naSaudi Arabia 375 424 505 Mar-08 -1 -17Zambia 106 108 176 Dec-92 03 naNote More recent IMF CA forecasts include -06 for Zambia (June 2015) and -99 for Kenya (September 2015)
Source Bruegel Bloomberg IMF April World Economic Outlook Renaissance Capital
7252019 Thoughts From RenMan-280915(5)
httpslidepdfcomreaderfullthoughts-from-renman-2809155 1515
Renaissance CapitalMoscowT + 7 (495) 258 7777
Renaissance Capital LtdLondonT + 44 (203) 379 7777
Renaissance CapitalJohannesburgT +27 (11) 750 1400
Renaissance Securities (Cyprus)LtdNicosiaT + 357 (22) 505 800
Renaissance Securities (Nigeria) LtdLagosT +234 (1) 448 5300
Renaissance CapitalNairobiT +254 (20) 368 2000
Renaissance CapitalIstanbulT +90 (212) 362 3500
Renaissance CapitalDubaiT +971 (4) 409 2000
A complete set of disclosure statements associated with the issuers discussed in this report is available using the lsquoStock Finderrsquo or lsquoBond Finderrsquo for individualissuers on the Renaissance Capital Research Portal at httpresearchrencapcomengdefaultasp
This Communication is for information purposes only The Communication does not form a fiduciary relationship or constitute advice and is not and should not be construed asa recommendation or an offer or a solicitation of an offer of securities or related financial instruments or an invitation or inducement to engage in investment activity and cannotbe relied upon as a representation that any particular transaction necessarily could have been or can be effected at the stated price The Communication is not anadvertisement of securities nor independent investment research and has not been prepared in accordance with legal requirements designed to promote the independence ofinvestment research and is not subject to any prohibition on dealing ahead of the dissemination of investment research Opinions expressed therein may differ or be contrary toopinions expressed by other business areas or groups of the Renaissance Capital as a result of using different assumptions and criteria All such information is subject tochange without notice and neither Renaissance Capital nor any of its subsidiaries or affiliates is under any obligation to update or keep current the information contained in theCommunication or in any other medium
Descriptions of any company or issuer or their securities or the markets or developments mentioned in the Communication are not intended to be complete TheCommunication should not be regarded by recipients as a substitute for the exercise o f their own judgment as the Communication has no regard to the specific investmentobjectives financial situation or particular needs of any specific recipient The material (whether or not it states any opinions) is for general information purposes only and doesnot take into account your personal circumstances or objectives and nothing in this material is or should be considered to be financial investment or other advice on whichreliance should be placed Any reliance you place on such information is therefore strictly at your own risk The application of taxation laws depends on an investorrsquos individualcircumstances and accordingly each investor should seek independent professional advice on taxation implications before making any investment decision TheCommunication has been compiled or arrived at based on information obtained from sources believed to be reliable and in good faith Such information has not beenindependently verified is provided on an lsquoas isrsquo basis and no representation or warranty either expressed or implied is provided in relation to the accuracy completenessreliability merchantability or fitness for a particular purpose of such information except with respect to information concerning Renaissance Capital its subsidiaries andaffiliates All statements of opinion and all projections forecasts or statements relating to expectations regarding future events or the possible future performance ofinvestments represent Renaissance Capitalrsquos own assessment and interpretation of information available to them currently Any information relating to past performance of aninvestment does not necessarily guarantee future performance
The Communication is not intended for distribution to the public and may be confidential It may not be reproduced redistributed or published in whole or in part for anypurpose without the written permission of Renaissance Capital and neither Renaissance Capital nor any of its affiliates accepts any liability whatsoever for the actions of thirdparties in this respect The information may not be used to create any financial instruments or products or any indices Neither Renaissance Capital and its affiliates nor theirdirectors representatives or employees accept any liability for any direct or consequential loss or damage arising out of the use of all or any part of the Communication
copy 2015 Renaissance Securities (Cyprus) Limited All rights reserved Regulated by the Cyprus Securities and Exchange Commission (Licence No KEPEY 05304)
This research is for general information purposes only and should not be interpreted that Renaissance Capital is encouraging investment dealings ie buyingand selling securities in Iran Under US law ldquocriminal penalties for violations of the Iranian Transactions Regulations may result in a fine of up to $1000000 andnatural persons may be imprisoned for up to 20 yearsrdquo Under UK law criminal penalties for violating restrictions on investment in and certain financialtransactions with Iran may carry criminal penalties including up to 2 years in prison andor substantial fines
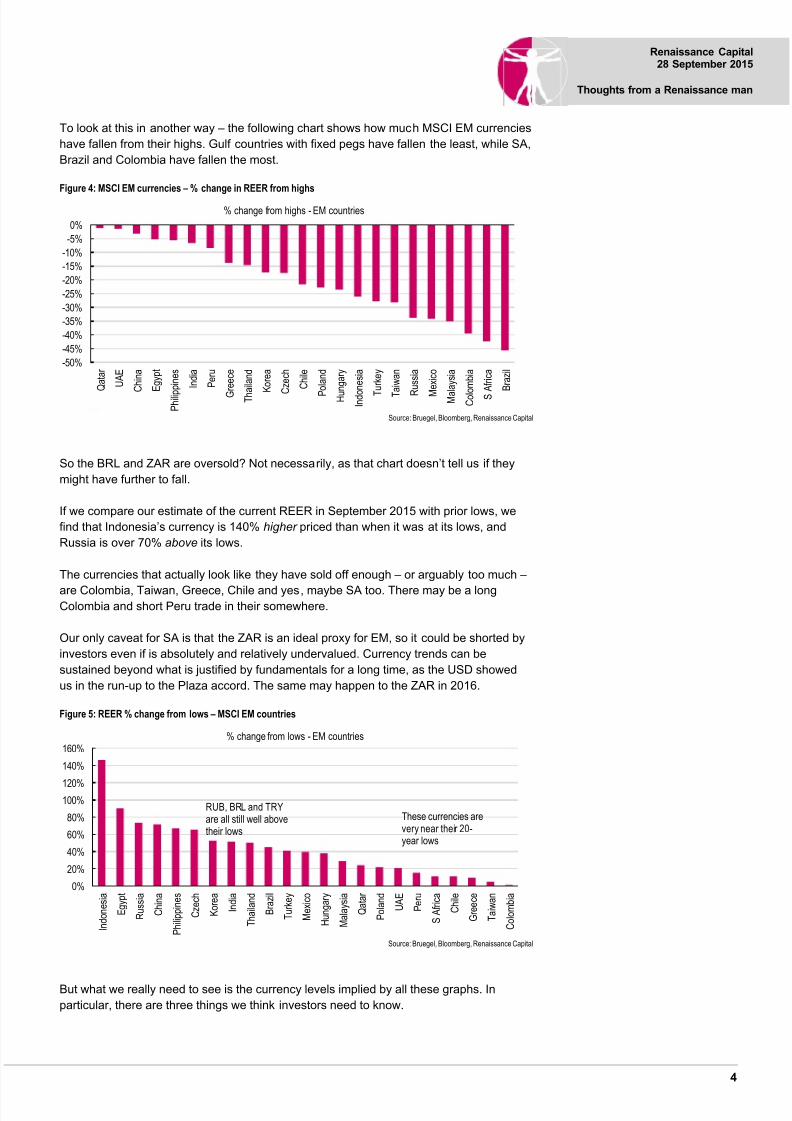
7252019 Thoughts From RenMan-280915(5)
httpslidepdfcomreaderfullthoughts-from-renman-2809155 415
4
Renaissance Capital28 September 2015
Thoughts from a Renaissance man
To look at this in another way ndash the following chart shows how much MSCI EM currencies
have fallen from their highs Gulf countries with fixed pegs have fallen the least while SA
Brazil and Colombia have fallen the most
Figure 4 MSCI EM currencies ndash change in REER from highs
Source Bruegel Bloomberg Renaissance Capital
So the BRL and ZAR are oversold Not necessarily as that chart doesnrsquot tell us if they
might have further to fall
If we compare our estimate of the current REER in September 2015 with prior lows we
find that Indonesiarsquos currency is 140 higher priced than when it was at its lows and
Russia is over 70 above its lows
The currencies that actually look like they have sold off enough ndash or arguably too much ndash
are Colombia Taiwan Greece Chile and yes maybe SA too There may be a longColombia and short Peru trade in their somewhere
Our only caveat for SA is that the ZAR is an ideal proxy for EM so it could be shorted by
investors even if is absolutely and relatively undervalued Currency trends can be
sustained beyond what is justified by fundamentals for a long time as the USD showed
us in the run-up to the Plaza accord The same may happen to the ZAR in 2016
Figure 5 REER change from lows ndash MSCI EM countries
Source Bruegel Bloomberg Renaissance Capital
But what we really need to see is the currency levels implied by all these graphs In
particular there are three things we think investors need to know
-50
-45
-40
-35
-30
-25
-20
-15
-10
-5
0
Q a t a r
U A E
C h i n a
E g y p t
P h i l i p
p i n e s
I n d i a
P e r u
G r e e c e
T h a i l a n d
K o r e a
C
z e c h
C h i l e
P
o l a n d
H u n g a r y
I n d o
n e s i a
T
u r k e y
T a i w a n
R
u s s i a
M
e x i c o
M a l a y s i a
C o l o
m b i a
S A f r i c a
B r a z i l
change from highs - EM countries
0
20
40
60
80
100120
140
160
I n d o n e s i a
E g y p t
R u s s i a
C h i n a
P h i l i p p i n e s
C z e c h
K o r e a
I n d i a
T h a i l a n d
B r a z i l
T u r k e y
M e x i c o
H u n g a r y
M a l a y s i a
Q a t a r
P o l a n d
U A E
P e r u
S A f r i c a
C h i l e
G r e e c e
T a i w a n
C o l o m b i a
change from lows - EM countries
These currencies arevery near their 20-year lows
RUB BRL and TRYare all still well abovetheir lows
7252019 Thoughts From RenMan-280915(5)
httpslidepdfcomreaderfullthoughts-from-renman-2809155 515
5
Renaissance Capital28 September 2015
Thoughts from a Renaissance man
What nominal currency rate is the worst-case scenario (assuming the past 20
years is a long enough sample) ndash see the third column of data below
How do currencies look now relative to their 20-year average ndash see the second
column of data below
Is the current rate justified by the current account position ndash see the last column
of data below
Note that the numbers below ndash eg the implication that the EGP would need to be
EGP981$ to equal its long-term average REER rate ndash do not take future inflation
differentials into account So if Egypt ran inflation of 10 a year while its trading
partners such as the US and Europe had inf lation of 2 and if Egypt took two years to
depreciate its currency then the eventual spot rate may need to be roughly 16 weaker
at EGP114$ to be the equivalent of todayrsquos implied lsquofair valuersquo of EGP981 $
Figure 6 Current FX rate vs $
Current FXrate vs $
FX rate implied by long-term average REER
FX rate if REER falls tolows
Current rate divided bylong-term average
2015 CA(GDP)
China 638 841 11 132 32Egypt 784 981 149 125 -33Philippines 468 58 782 124 55India 66 782 100 118 -13Qatar 364 412 452 113 84UAE 367 409 444 111 53Czech 243 27 403 111 16Thailand 361 381 543 106 44Peru 322 333 371 103 -46Hungary 279 285 384 102 33Poland 377 378 458 1 -18Korea 1191 1184 1819 099 71Indonesia 14647 14057 36071 096 -3Turkey 303 287 426 095 -42
Greece 09 085 098 094 14Chile 698 627 776 09 -12Russia 659 59 114 09 54Taiwan 33 292 346 088 124Malaysia 434 364 559 084 21Mexico 169 141 236 083 -22S Africa 136 102 152 075 -46Brazil 404 302 585 075 -37Colombia 3073 2269 3103 074 -58
SourceBruegel IMF April World economic Outlook Bloomberg R enaissance Capital
In terms of fair value Poland is the benchmark with a currency that is within 1 of its
long-term implied rate
Ten EMs have currencies stronger than the long-term implied rate Of these seven are
due to record current account surpluses in 2015 according to the IMF April World
Economic Outlook We think that a CA surplus justifies a currency stronger than the 20-
year average rate
We are content to argue that a country like China does not need to see more than a 10
devaluation in the currency from current levels when its current account has a surplus of
this size See our report FX and commodities ndash itrsquos just so 1981 published11 August 2015
This leaves us three countries ndash Egypt India and Peru ndash whose currencies look
particularly exposed Not only are they failing to keep pace with the general EM trend of
significant depreciation but they are also overvalued relative to their own long-term
history and lastly they are running CA deficits
7252019 Thoughts From RenMan-280915(5)
httpslidepdfcomreaderfullthoughts-from-renman-2809155 615
6
Renaissance Capital28 September 2015
Thoughts from a Renaissance man
On the other side of the equation ndash Taiwan Russia Malaysia Greece and Korea
look relatively good value These currencies may be considerably more expensive than
their historical lows ndash Russia would need to see RUB114$ to equal January 1999 ndash but
each has a CA surplus and each is cheaper than their long-term 20-year average In
Greecersquos case ndash given it has the euro ndash this simply means that Greece is roughly 6more competitive today than it has been for most of the past 20 years which is a modest
positive for company earnings In Greecersquos case we do not see that as offsetting the
damage that may be done by the ideologically anti-market Syriza government
Taiwan and Korea look like strong buys from a currency perspective but they do have to
compete with Japan which at the current JPY1205$ is around its all-time low of
JPY1225$ Any bounce for these two would presumably require a stronger yen
For SA we would now expect to see the CA improve more than the 46 of GDP that the
IMF expected in April 2015 Indeed the 2Q15 figure was around 3 of GDP We think
similar improvement is likely in Brazil Colombia and Mexico
What about frontier
Below we analyse 12 countries in MSCI Frontier plus Saudi Arabia Iran and Georgia
What jumps out first is that so many of them have a currency level that is very near their
20-year record strongest level Frontier FX has clearly not depreciated in line with EM FX
A number of factors may explain this First frontier markets are less globally integrated
than EM so we might expect them to react later Second their financial markets are far
more shallow which means it is easier for the authorities to resist market pressure ndash even
if economic fundamentals tell us this may not be the right policy stance to take It also
means that it does not take much money in the way of foreign aid or IMF support to keepa currency stable Third perhaps the underlying economic structure in frontier markets is
changing more than in emerging markets so their current exchange rates should not be
compared with their history We are however sceptical about that excuse Fourth frontier
markets tend to be poorer than EM countries so REER measures may not be as
applicable (see below) Fifth a few of these countries such as Kuwait (off-index) Saudi
Arabia Bahrain and Oman have historical pegs that have not changed much in 20 years
or more bolstered by large sovereign wealth funds (less true of Oman)
Figure 7 A number of Frontier and Beyond Frontier markets are near their strongest levels of the past 20 years
Note Argentinas strongest point was 250 which is off the scaleSource Bruegel Bloomberg Renaissance Capital
0
20
40
60
80
100
120
140
160
180
B a n g l a d e s h
V i e t n a m
S a u d i A r a b i a
I r a n
N i g e r i a
O m a n
K e n y a
K u w a i t
P a k i s t a n
S r i L a n k a
M o r o c c o
G e o r g i a
R o m a n i a
A r g e n t i n a
K a z a k h s t a n
Latest REER vs all-time high and low (Dec 2007 = 100) - selected Frontier countriesEstimated current REER REER High REER Low REER May 2015
7252019 Thoughts From RenMan-280915(5)
httpslidepdfcomreaderfullthoughts-from-renman-2809155 715
7
Renaissance Capital28 September 2015
Thoughts from a Renaissance man
Only Morocco Argentina and Kazakhstan are at or near their lows ndash but we are sceptical
about Argentinean data The IMF does not trust Argentinarsquos inflation data so if Bruegel is
using Argentinarsquos official inflation figures these are likely to distort their calculations More
positively Kazakhstan looks a particularly interesting investment given these graphs
Figure 8 REER change from strongest level ndash MSCI FM
Source Bruegel Renaissance Capital Bloomberg
Even more dramatic is when we compare the currency levels today with the lowest levels
seen over the past 20 years
Nigeria still has a very strong currency which we think is hurting the Nigerian economy ndash
see Yvonne Mhangorsquos report The cost of defending NGN199$1 from 11 September
2015 We doubt that improved fiscal management can do enough to support this Former
central bank governor Lamido Sanusi estimated that Nigeria was losing about $20bn over
2011-2013 due to theft from the budget or roughly $6-7bn a year With the oil price nowcut in half we estimate Nigeria could be saving $3bn a year by rooting out corruption in
the oil sector ndash which is less than 1 of GDP We doubt this is enough to support the
current naira rate if oil remains in a $40-60bl range in the medium-term
Kenya also comes out poorly on these charts ndash although we must note that the IMF does
its own analysis and it argued as recently as 23 September 2015 that the KES real
exchange rate is ldquobroadly in line with fundamentalsrdquo
Figure 9 REER change from lows ndash MSCI Frontier countries
Source Bruegel Bloomberg Renaissance Capital
Nigeria and Kenya look particularly extreme here but Morocco also interests us It is
curious how little volatility there has been in this REER rate ndash its Bloomberg currency
-80
-70
-60
-50
-40
-30
-20
-10
0
B a n g l a d e s h
K u w
a i t
O m
a n
S a u d i A r a
b i a
P a k i s
t a n
V i e t n
a m
S r i L a n k a
M o r o c c o
N i g e r i a
K e n y a
R o m a
n i a
G e o r g i a
K a z a k h s
t a n
I r a n
A r g e n t i n a
change from highs
0
50
100
150
200
250
N i g e r i a
K e n y a
R o m a n i a
I r a n
G e o r g i a
V i e t n a m
B a n g l a d e s h
S r i L a n k a
K u w a i t
S a u d i A r a b i a
P a k i s t a n
O m a n
A r g e n t i n a
M o r o c c o
K a z a k h s t a n
change from lows - FM countries
7252019 Thoughts From RenMan-280915(5)
httpslidepdfcomreaderfullthoughts-from-renman-2809155 815
8
Renaissance Capital28 September 2015
Thoughts from a Renaissance man
code MAD could not be a greater misnomer This is particularly interesting given that
Morocco is the only country we know that of that has experienced a private sector boom
and subsequent slowdown without this distorting its exchange rate significantly Irsquom
increasingly keen to meet a Moroccan central bank governor or two
So when we put numbers to these graphs we find that Kenya and Nigeria have currencies
that are the most overvalued relative to their own histories Moreover the IMF now
forecasts that Kenya will run a significant 10 of GDP current account deficit in 2015-16
The IMF did not expect Nigeria to have a CA deficit when it made its April 2015 forecasts
but Yvonne Mhango thinks there will be a 3 of GDP deficit ndash and we trust her to be more
up to date Just to reach their 20-year average implied rate would require Kenya and
Nigeria to see depreciation to KES152$ and NGN285$ respectively
Vietnam looks expensive to us It had a chunky CA surplus in 2014 but it may want to
keep it that way by allowing further depreciation of the currency We will be visiting
Vietnam next month and expect to learn more about the authorities thinking on this
Bangladesh would need to see the currency at around BDT100$ and Pakistan at around
PKR120$ to match their 20-year average implied rate We see this as representing
depreciation risk to our PKR110$ forecast for June 2016 (see Reform Awakens
published 18 May 2015) and we will not argue strongly against investors suggesting
PKR120$ is more realistic
If any Gulf peg looks vulnerable we think it is Oman with a currency that is a little too
strong and a big CA deficit We have also previously noted in Dan Salterrsquos report When
Fed patience is a virtue published 19 December 2014 that its sovereign wealth fund is
very limited in size relative to others
Figure 10 Gulf sovereign wealth fund (SWF) assets to GDP 2014-15SWF assets ($bn) GDP $bn (2015E) SWF assets to GDP
Kuwait 592 134 440
UAE 1215 364 334Qatar 256 197 130Saudi Arabia 677 649 104Bahrain 11 31 34Oman 19 63 30Note SWF assets data for Kuwait Qatar Bahrain and Oman have not been updated since 2014 ndash it would be wise to assume these are lower now
Source Sovereign wealth fund institute Renaissance Capital
Saudi Arabia looks okay in our view and like Kuwait it has substantial reserves There
has been modest currency appreciation We assume Saudi Arabia will have to cut budget
spending and provoke disinflation to bring its currency back into alignment and push the
current account back to into surplus A devaluation would be more surprising to us than
the CHF move earlier this year
We do not see much to worry about in Romania or Morocco
Georgia also has a currency that is now near long-term fair value although its external
debt (see About that 1982 debt default ) and CA deficit warrant continued attention Our
economist Oleg Kouzmin argues that from here the GELrsquos direction will be driven by
moves in the RUB AZM and TRY Further depreciation of the TRY towards its all-time
lows would therefore pull the GEL weaker too unless the RUB appreciated to offset this
7252019 Thoughts From RenMan-280915(5)
httpslidepdfcomreaderfullthoughts-from-renman-2809155 915
9
Renaissance Capital28 September 2015
Thoughts from a Renaissance man
Figure 11 REER implied exchange rates in MSCI Frontier
Current FXrate vs $
FX rate impliedby long-term average REER
FX rate if REERfalls to lows
Current rate divided bylong-term average
2015 CA(GDP)
Kenya 106 152 266 143 -77Nigeria 199 285 618 143 07Vietnam 22470 29114 35506 130 48Bangladesh 777 992 117 128 -06Sri Lanka 141 166 205 118 -20Kuwait 030 035 042 117 157Oman 038 044 049 116 -150Pakistan 104 120 135 115 -13Romania 396 449 935 113 -11Saudi Arabia 375 424 505 113 -10Georgia 238 237 392 100 -66Morocco 974 926 992 095 -34Iran 29856 26224 60389 088 08Kazakhstan 270 216 272 080 -19
Argentina 939 519 108 055 -17Note We expect Nigerias current account deficit to be 3 of GDP in 2015 the IMF revised its Kenya forecast to -99 of GDP in September 2015
Source IMF April WEO Bruegel Bloomberg Renaissance Capital
We have one fundamental problem with the REER methodology that is applicable to
Kenya and Nigeria We think it is flawed because inflation rates between rich and poor
countries are not the same
US per capita GDP was nearly $55000 in 2014 while Kenyarsquos was around $1400 If we
see 1 inflation in the US and 10 in Kenya and if we use those per capita GDP figures
as a proxy for wages then in 2015 US wages would have risen by $550 and Kenyan
wages would have risen by $140 A REER comparison would tell us that i f the Kenyan
shilling did not move in nominal terms then Kenya has lost about 9 competitiveness
against the US (10 Kenyan inflation minus 1 US inflation) but for a company
employing people in the US and Kenya the absolute cost of employing a worker has risen
much less in Kenya than it has in the US Kenya would need to have seen inflation closer
to 30 for wages in both countries to have risen by the same absolute amount Moreoverwe can imagine that productivity is much easier to improve in Kenya than the US
The implication then is that REER methodologies are fine when we compare rich
countries to rich countries or poor countries to poor countries but not when we compare
rich to poor
This is a key reason why we are not about to alter Yvonne Mhangorsquos exchange forecasts
for the NGN or the KES with the figures implied by this work on REER rates
However our problem with REER figures for poor countries also apply to Pakistan
Bangladesh Georgia and others We do think the REER methodology helps us see
where the risks are greatest And in the frontier space that risk would appear to begreatest in both Nigeria and Kenya and much less dramatic in Pakistan or Romania
while the Kazakh tenge looks very good value to us
How will cheaper currencies improve the situation
Amidst all the doom and gloom about EM we should be careful not to throw the baby out
with the bath water It is right for chief investment officers (CIOs) to ask why they should
invest in economies growing slower than the US with worse corporate governance than
the US and in companies that donrsquot have the global success of a Google or an Apple
and in currencies that keep weakening against the US dollar We are also fully aware of
some of the negative common themes in certain emerging markets see The problem with
political longevity published 12 August 2013
7252019 Thoughts From RenMan-280915(5)
httpslidepdfcomreaderfullthoughts-from-renman-2809155 1015
10
Renaissance Capital28 September 2015
Thoughts from a Renaissance man
But there is reform in EM ndash see Reform Awakens in which we highlighted positive trends
in Pakistan Romania Egypt Ukraine and probably Nigeria Russia is not generally seen
as being at the forefront of reform but here the central bank has let the currency float
management in key firms is being replaced (we think in a bid to improve productivity)
while the government has lifted its position from 120th
in the Ease of Doing businesssurvey in 2012 to 62nd today and targets 20th place by 2018
Eventually valuations will convince CIOs ndash and indeed western companies ndash that EM cannot
be written off and that it is worth making this move from allocating to the US to EM The
currency is going to play a key role in this The competitiveness gain that EM is experiencing
will be hard to ignore EM demand is likely to be hurt by the higher cost of imported goods
and in time this should translate into import substitution (where possible) and some
additional export lift even if much of the competitiveness gains are between emerging
markets at present (Russian mining competing with Brazilian mining for example)
In addition when over 30 of US exports go to (depreciating) Canada and Mexico US
companies will have few choices open to them They can either cut US costs dramatically
but this will require nominal wage cuts which is hard to imagine or they can choose to
produce in Mexico and sell in Mexico or they can choose to produce in Mexico and sell
back to the US We expect to see US FDI to EM pick up
Figure 12 Currencies vs the $ (nominal change) Sept 2005 to Sept 2015
Source Bloomberg
China has seen its currency appreciate even more significantly against most EM
currencies We expect Chinese firms to take advantage of their strong currency to buy up
assets in EM Since 2005 in nominal terms some of the largest EM currency falls relative
to the CNY have been seen in the RUB ZAR BRL and TRY
Figure 13 Currencies vs CNY nominal change Sept 2005 to Sept 2015
Source Bloomberg
-80
-60
-40
-20
0
20
40
C N Y
P H P
S G D
T H B
P E N
T W D
H K D
C Z K
B G N
M Y R
K R W
P L N
C L P
C O P
H U F
R O N
I D R
I N R
M X N
B R L
Z A R
T R Y
R U B
A R S
C H F
A U D
J P Y
D K K
E U R
S E K
N Z D
C A D
G B P
N O K
-80
-70
-60
-50
-40
-30
-20
-10
0
10
P H
P
S G
D
T H
B
P E
N
T W
D
H K
D
C Z
K
B G
N
M Y
R
K R
W
P L
N
C L
P
C O
P
H U
F
R O
N
I D
R
I N
R
M X
N
B R
L
Z A
R
T R
Y
R U
B
A R
S
C H
F
U S
D
A U
D
J P
Y
D K
K
E U
R
S E
K
N Z
D
C A
D
G B
P
N O
K
7252019 Thoughts From RenMan-280915(5)
httpslidepdfcomreaderfullthoughts-from-renman-2809155 1115
11
Renaissance Capital28 September 2015
Thoughts from a Renaissance man
Indeed China is already leading the way Over 40 of all the Chinese FDI that has
entered Brazil since 2001 arrived in 2014 Chinarsquos share of annual FDI flows into Brazil
Russia and Turkey was 0-1 in every year we have data for until 2014 when it rose to
15 in Brazil and 6 in Russia while latest 2015 data show it was 12 in Russia and
6 in Turkey Unfortunately SA does not produce FDI data by country
Figure 14 Chinese FDI into key EM countries is suddenly picking up
Note 2015 is 1Q15 for Russia and January-July 2015 for TurkeySource Turkish central bank Brazilian central bank Russian central bank
This echoes what happened with Japan in the 1980s a stronger JPY prompted a surge in
outward FDI For more on this comparison ndash see FX and commodities ndash itrsquos just so 1981
Figure 15 US and Japanese outward FDI in $mn 1980-1990
Note The US dollar peaked in strength in 1985 the JPY rose strongly vs the US dollar after 1985Source UNCTAD
The FDI flows also grow in importance as the EM GDP shrinks so even if the dollar
amount going into EM shrinks (as seen in Russia recently) EM GDP in dollars may be
shrinking faster So when the BRL was approaching its record lows in REER terms (see
Figure 2) we also saw FDI reach record levels of around 5 of GDP annually While FDI
is much higher in dollar terms now it has only had half the impact (2-3 of GDP) on the
Brazilian economy
0
2
4
6
8
10
12
14
-200
0
200
400
600
800
1000
2001 2002 2003 2004 2005 2006 2007 2008 2009 2010 2011 2012 2013 2014 2015
Chinese FDI in $m (lhs) and as of recipients total annual FDI (rhs)
Chinese FDI into Russia Chinese FDI into BrazilChinese FDI into Turkey Chinese FDI as of all Russian FDIChinese FDI as of all Brazilian FDI Chinese FDI as of all Turkish FDI
-
1000
2000
3000
4000
5000
6000
7000
1980 1981 1982 1983 1984 1985 1986 1987 1988 1989 1990
Japanese FDI outflows ($mn) rose with JPY strengthJapan US
7252019 Thoughts From RenMan-280915(5)
httpslidepdfcomreaderfullthoughts-from-renman-2809155 1215
12
Renaissance Capital28 September 2015
Thoughts from a Renaissance man
Figure 16 FDI was most important for Brazil over 1999-2001 when BRL was weak
Source UNCTAD
We would expect the surge in FDI to help boost productivity in EM and become part of a
reinvigorated EM contribution to the world economy This is a process that we expect to
see pick up over 2016-2017 ndash or perhaps a little longer if the US goes into a recession
Conclusions
We think that based on time considerations we are most of the way through the EM FX sell-
off that began in in 2012 but not necessarily three-quarters of the way through in terms of
value Half of EM currencies are still above their long-term average value based on our
REER analysis
Over 2016-2017 we would not be surprised to see previous lows tested for currencies
such as the BRL or the TRY before EM FX stabilises and begins to strengthen again
Once we take inflation into account this implies a level of BRL6$ ndash equivalent to what
was seen back in 2001-2002 or in Turkeyrsquos case TRY43$ We would of course be
delighted if EM currencies bounce back earlier than 2016-2017 and we should point out
that half of MSCI EM currencies are already cheaper than their 20-year average rates as
implied by our REER analysis For the long-term investor EM currencies on average are
at fair value in contrast to DM equities or bonds which are expensive relative to the long
term
A few EM currencies are already at or near their absolute lows compared to the past 20
years of history We think these should be seriously considered by EM investors lookingto take long positions either directly in FX or in equities and bonds
Colombia looks very attractive to us but perhaps investors will need to see proof that this
weaker currency is improving fundamentals Today the consensus on the current account
is only that it will improve from 6 of GDP in 2015 to 5 of GDP in 2016 ndash we expect
that will be too pessimistic
Taiwan with its cheap currency relative to the long-term average and a massive (12 of
GDP) CA surplus would also be attractive were it not for the competitive threat from
Japan which has a currency near its record weakest level
SA has a cheap currency near its absolute low (which we estimate at 152$) and which
might already be responsible for recently improved current account data Our only caveat
here is that the ZAR is a highly liquid EM proxy currency that could be driven weaker in
line with others such as the BRL but we would be supportive of investors taking long
0
1
2
3
4
5
6
0
10000
20000
30000
40000
5000060000
70000
1 9 9 0
1 9 9 1
1 9 9 2
1 9 9 3
1 9 9 4
1 9 9 5
1 9 9 6
1 9 9 7
1 9 9 8
1 9 9 9
2 0 0 0
2 0 0 1
2 0 0 2
2 0 0 3
2 0 0 4
2 0 0 5
2 0 0 6
2 0 0 7
2 0 0 8
2 0 0 9
2 0 1 0
2 0 1 1
2 0 1 2
2 0 1 3
FDI inflow to Brazil in $mn (lhs) and as of GDP (rhs)
FDI into Brazil ($m) FDI into Brazil of GDP
7252019 Thoughts From RenMan-280915(5)
httpslidepdfcomreaderfullthoughts-from-renman-2809155 1315
13
Renaissance Capital28 September 2015
Thoughts from a Renaissance man
positions in SA around current or weaker FX levels It is also worth noting that SArsquos equity
market outperformed EM in the Asian crisis of 1997-98 the tech bubble crash of 2000-01
and the global financial crisis of 2007-08 helped by its funds
The short side of the equation is Egypt ndash where a currency level around EGP98$ is justif ied today but where Gulf inflows could help the authorities resist this for some
time We would also recommend selling India which also happens to be a widely-
owned overweight in GEM funds as this currency is stronger than its long-term average
and it runs a current account deficit The other most vulnerable currency we think is
Perursquos for the same reasons
Elsewhere in EEMEA we see Poland Hungary and the Czech Republic as offering
low-risk alternatives Currencies are close to their 20-year average levels and current
accounts are healthy
Greece is slightly cheap but we donrsquot see that offsetting the problem of having a Syriza
government in power ndash which is likely to be unfriendly to portfolio investors in private
companies
Russiarsquos currency looks cheap to us too ndash at RUB65$ against the 20-year average of
RUB59$ ndash and is supported by a decent current account surplus
In the Gulf the UAE and Qatar have somewhat expensive currencies but these have
never been that volatile in 20 years In addition they have SWF reserves which we
estimate at over 300 and 100 of GDP respectively We doubt the currency regimes
will be altered in either so the main downside stems from the impact of budget cuts
The story for Frontier FX is very different Very few currencies have seen significant
depreciation Half are near the strongest levels they have ever been in REER terms
By far the best value from our perspective is now Kazakhstan ndash with a currency at its
absolute lows in a country that we expect to run a current account surplus in 2016 ndash see
our report Kazakhstanrsquos devaluation Implications for frontier currencies published 20
August 2015 In addition the government has a dynamic reform agenda that has been
likened to what Singapore has done in the past ndash see Kazakhstan Impressive reform plan
initiated published 9 July 2015
We also like the look of Morocco which has an enviable record of currency stability Like
South Africa equities may be relatively expensive to its peers but for a decent reason
assuming the currency is stable
Romania carries modest currency risk in our view but is inside the EU envelope which
offers some protection and has a healthy CA
We see risks being higher in Pakistan where a 15 devaluation to PKR120$ is
plausible and higher still in Bangladesh where history implies that fair value is
BDT100$ Vietnam is trading even further from long-term fair value and might also be
getting more vulnerable since its CA entered deficit territory in 1Q15
We always doubt Gulf currencies will move significantly but we are concerned by Oman
The 2008-2009 crisis hit that country hard reserves are far lower than in other countries
(Omanrsquos sovereign wealth fund would not cover a budget deficit on the scale of Saudirsquos
for even 12 months) and we think the currency looks expensive
The most vulnerable currencies of all according to this REER analysis are in Kenyarunning an estimated 10 of GDP current account deficit this year and Nigeria Their
current exchange rates look hard to justify if this REER analysis is valid (as noted above
7252019 Thoughts From RenMan-280915(5)
httpslidepdfcomreaderfullthoughts-from-renman-2809155 1415
14
Renaissance Capital28 September 2015
Thoughts from a Renaissance man
the IMF thinks not) Yvonne Mhango does expect depreciation to KES109 in 2015 and
KES115 in 2016 and NGN230 and NGN225 respectively for Kenya and Nigeria but
these Bruegel-derived REER calculations imply more than 30 deprecation risk above
those numbers
So our top picks in our universe would be Kazakhstan (in frontier) and SA (in EEMEA)
from a currency perspective
For currency trends to turn we need a change in fundamentals that we expect to see via
improved trade and CA numbers and a rise in FDI The latter is already picking up
sharply from China into Brazil Turkey and Russia We expect these trends will help re-
invigorate growth in EM from 2017-2018 and encourage investors to renew their interest
in the asset class
Figure 17 REER implied exchange rates for MSCI EM and some MSCI Frontier and Beyond Frontier countries
CurrentRate implied by
long-term average REER$ rate if REERfalls to lows
Date REERhit its low point
2015 CA ( GDP)
IMF April 2015forecasts
Bloomberg consensusforecasts (Sept 2015)
China 638 841 11 Apr-95 32 27India 661 782 100 Feb-96 -13 -11Indonesia 14684 14057 36071 Jun-98 -3 -24Korea 1193 1184 1819 Jan-98 71 79Malaysia 437 364 559 Dec-98 21 28Philippines 468 58 782 Feb-04 55 42Taiwan 331 292 346 Nov-09 124 139Thailand 363 381 543 Jan-98 44 45
Brazil 418 302 585 Oct-02 -37 -41Colombia 3117 2269 3103 Mar-03 -58 -58Chile 704 627 776 Jun-03 -12 -04Mexico 171 141 236 Mar-95 -22 -25Peru 322 333 371 Jul-07 -46 -4
Czech 242 27 403 Jan-95 16 07
Egypt 783 981 149 Dec-03 -33 -24Greece 089 085 098 Sep-00 14 02Hungary 279 285 384 Apr-95 33 48Poland 377 378 458 Nov-97 -18 -03Qatar 364 412 452 Aug-11 84 71Russia 665 59 114 Jan-99 54 49S Africa 139 102 152 Dec-01 -46 -44Turkey 306 287 426 Oct-01 -42 -5UAE 367 409 444 Aug-11 53 41
Argentina 94 519 108 Apr-14 -17 -15Bangladesh 777 992 117 Dec-06 -06 naGeorgia 238 237 392 Apr-95 -66 naKazakhstan 269 216 272 Oct-99 -19 -38Kenya 106 152 266 Jul-95 -77 -9Kuwait 03 035 042 Jun-95 157 126
Morocco 972 926 992 Aug-12 -34 -38Nigeria 199 285 618 Apr-95 07 -23Oman 039 044 049 Nov-07 -15 -85Pakistan 104 120 135 Sep-01 -13 -06Romania 394 449 935 Feb-97 -11 -1Sri Lanka 141 166 205 Jan-96 -2 -28Vietnam 22480 29114 35506 Jan-04 48 -05
Iran 29856 26224 60389 Jun-95 08 naSaudi Arabia 375 424 505 Mar-08 -1 -17Zambia 106 108 176 Dec-92 03 naNote More recent IMF CA forecasts include -06 for Zambia (June 2015) and -99 for Kenya (September 2015)
Source Bruegel Bloomberg IMF April World Economic Outlook Renaissance Capital
7252019 Thoughts From RenMan-280915(5)
httpslidepdfcomreaderfullthoughts-from-renman-2809155 1515
Renaissance CapitalMoscowT + 7 (495) 258 7777
Renaissance Capital LtdLondonT + 44 (203) 379 7777
Renaissance CapitalJohannesburgT +27 (11) 750 1400
Renaissance Securities (Cyprus)LtdNicosiaT + 357 (22) 505 800
Renaissance Securities (Nigeria) LtdLagosT +234 (1) 448 5300
Renaissance CapitalNairobiT +254 (20) 368 2000
Renaissance CapitalIstanbulT +90 (212) 362 3500
Renaissance CapitalDubaiT +971 (4) 409 2000
A complete set of disclosure statements associated with the issuers discussed in this report is available using the lsquoStock Finderrsquo or lsquoBond Finderrsquo for individualissuers on the Renaissance Capital Research Portal at httpresearchrencapcomengdefaultasp
This Communication is for information purposes only The Communication does not form a fiduciary relationship or constitute advice and is not and should not be construed asa recommendation or an offer or a solicitation of an offer of securities or related financial instruments or an invitation or inducement to engage in investment activity and cannotbe relied upon as a representation that any particular transaction necessarily could have been or can be effected at the stated price The Communication is not anadvertisement of securities nor independent investment research and has not been prepared in accordance with legal requirements designed to promote the independence ofinvestment research and is not subject to any prohibition on dealing ahead of the dissemination of investment research Opinions expressed therein may differ or be contrary toopinions expressed by other business areas or groups of the Renaissance Capital as a result of using different assumptions and criteria All such information is subject tochange without notice and neither Renaissance Capital nor any of its subsidiaries or affiliates is under any obligation to update or keep current the information contained in theCommunication or in any other medium
Descriptions of any company or issuer or their securities or the markets or developments mentioned in the Communication are not intended to be complete TheCommunication should not be regarded by recipients as a substitute for the exercise o f their own judgment as the Communication has no regard to the specific investmentobjectives financial situation or particular needs of any specific recipient The material (whether or not it states any opinions) is for general information purposes only and doesnot take into account your personal circumstances or objectives and nothing in this material is or should be considered to be financial investment or other advice on whichreliance should be placed Any reliance you place on such information is therefore strictly at your own risk The application of taxation laws depends on an investorrsquos individualcircumstances and accordingly each investor should seek independent professional advice on taxation implications before making any investment decision TheCommunication has been compiled or arrived at based on information obtained from sources believed to be reliable and in good faith Such information has not beenindependently verified is provided on an lsquoas isrsquo basis and no representation or warranty either expressed or implied is provided in relation to the accuracy completenessreliability merchantability or fitness for a particular purpose of such information except with respect to information concerning Renaissance Capital its subsidiaries andaffiliates All statements of opinion and all projections forecasts or statements relating to expectations regarding future events or the possible future performance ofinvestments represent Renaissance Capitalrsquos own assessment and interpretation of information available to them currently Any information relating to past performance of aninvestment does not necessarily guarantee future performance
The Communication is not intended for distribution to the public and may be confidential It may not be reproduced redistributed or published in whole or in part for anypurpose without the written permission of Renaissance Capital and neither Renaissance Capital nor any of its affiliates accepts any liability whatsoever for the actions of thirdparties in this respect The information may not be used to create any financial instruments or products or any indices Neither Renaissance Capital and its affiliates nor theirdirectors representatives or employees accept any liability for any direct or consequential loss or damage arising out of the use of all or any part of the Communication
copy 2015 Renaissance Securities (Cyprus) Limited All rights reserved Regulated by the Cyprus Securities and Exchange Commission (Licence No KEPEY 05304)
This research is for general information purposes only and should not be interpreted that Renaissance Capital is encouraging investment dealings ie buyingand selling securities in Iran Under US law ldquocriminal penalties for violations of the Iranian Transactions Regulations may result in a fine of up to $1000000 andnatural persons may be imprisoned for up to 20 yearsrdquo Under UK law criminal penalties for violating restrictions on investment in and certain financialtransactions with Iran may carry criminal penalties including up to 2 years in prison andor substantial fines
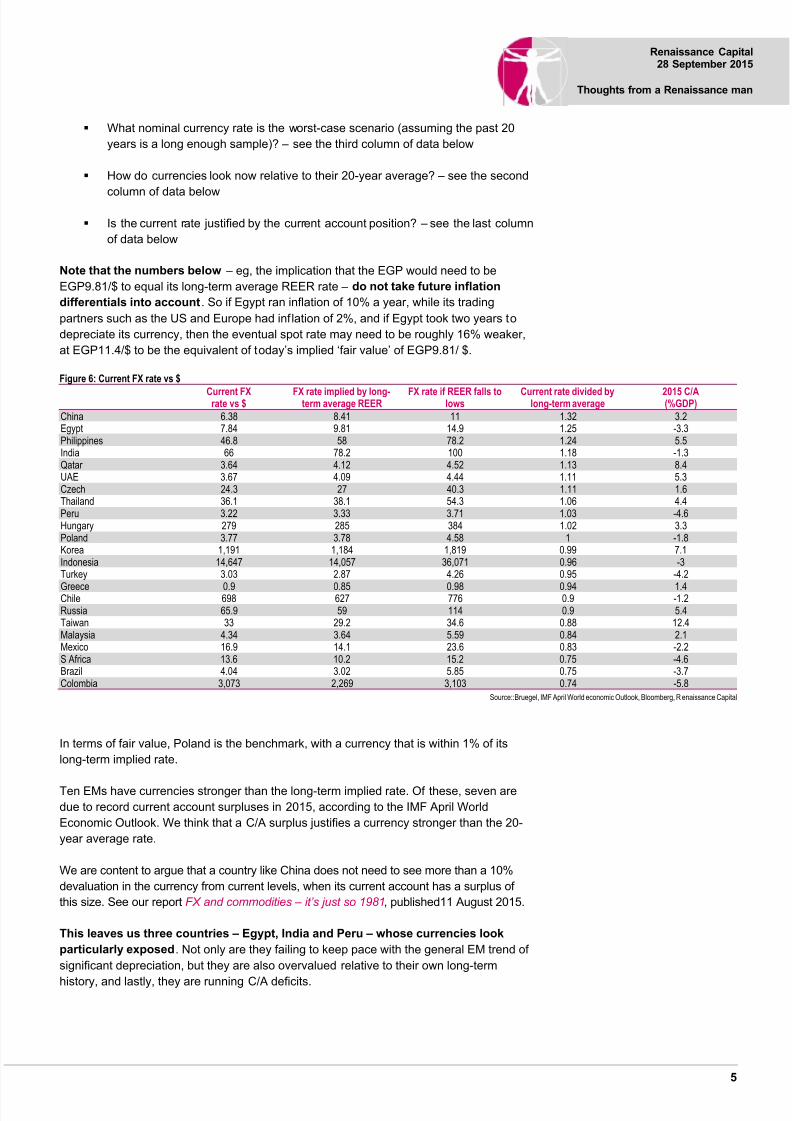
7252019 Thoughts From RenMan-280915(5)
httpslidepdfcomreaderfullthoughts-from-renman-2809155 915
9
Renaissance Capital28 September 2015
Thoughts from a Renaissance man
Figure 11 REER implied exchange rates in MSCI Frontier
Current FXrate vs $
FX rate impliedby long-term average REER
FX rate if REERfalls to lows
Current rate divided bylong-term average
2015 CA(GDP)
Kenya 106 152 266 143 -77Nigeria 199 285 618 143 07Vietnam 22470 29114 35506 130 48Bangladesh 777 992 117 128 -06Sri Lanka 141 166 205 118 -20Kuwait 030 035 042 117 157Oman 038 044 049 116 -150Pakistan 104 120 135 115 -13Romania 396 449 935 113 -11Saudi Arabia 375 424 505 113 -10Georgia 238 237 392 100 -66Morocco 974 926 992 095 -34Iran 29856 26224 60389 088 08Kazakhstan 270 216 272 080 -19
Argentina 939 519 108 055 -17Note We expect Nigerias current account deficit to be 3 of GDP in 2015 the IMF revised its Kenya forecast to -99 of GDP in September 2015
Source IMF April WEO Bruegel Bloomberg Renaissance Capital
We have one fundamental problem with the REER methodology that is applicable to
Kenya and Nigeria We think it is flawed because inflation rates between rich and poor
countries are not the same
US per capita GDP was nearly $55000 in 2014 while Kenyarsquos was around $1400 If we
see 1 inflation in the US and 10 in Kenya and if we use those per capita GDP figures
as a proxy for wages then in 2015 US wages would have risen by $550 and Kenyan
wages would have risen by $140 A REER comparison would tell us that i f the Kenyan
shilling did not move in nominal terms then Kenya has lost about 9 competitiveness
against the US (10 Kenyan inflation minus 1 US inflation) but for a company
employing people in the US and Kenya the absolute cost of employing a worker has risen
much less in Kenya than it has in the US Kenya would need to have seen inflation closer
to 30 for wages in both countries to have risen by the same absolute amount Moreoverwe can imagine that productivity is much easier to improve in Kenya than the US
The implication then is that REER methodologies are fine when we compare rich
countries to rich countries or poor countries to poor countries but not when we compare
rich to poor
This is a key reason why we are not about to alter Yvonne Mhangorsquos exchange forecasts
for the NGN or the KES with the figures implied by this work on REER rates
However our problem with REER figures for poor countries also apply to Pakistan
Bangladesh Georgia and others We do think the REER methodology helps us see
where the risks are greatest And in the frontier space that risk would appear to begreatest in both Nigeria and Kenya and much less dramatic in Pakistan or Romania
while the Kazakh tenge looks very good value to us
How will cheaper currencies improve the situation
Amidst all the doom and gloom about EM we should be careful not to throw the baby out
with the bath water It is right for chief investment officers (CIOs) to ask why they should
invest in economies growing slower than the US with worse corporate governance than
the US and in companies that donrsquot have the global success of a Google or an Apple
and in currencies that keep weakening against the US dollar We are also fully aware of
some of the negative common themes in certain emerging markets see The problem with
political longevity published 12 August 2013
7252019 Thoughts From RenMan-280915(5)
httpslidepdfcomreaderfullthoughts-from-renman-2809155 1015
10
Renaissance Capital28 September 2015
Thoughts from a Renaissance man
But there is reform in EM ndash see Reform Awakens in which we highlighted positive trends
in Pakistan Romania Egypt Ukraine and probably Nigeria Russia is not generally seen
as being at the forefront of reform but here the central bank has let the currency float
management in key firms is being replaced (we think in a bid to improve productivity)
while the government has lifted its position from 120th
in the Ease of Doing businesssurvey in 2012 to 62nd today and targets 20th place by 2018
Eventually valuations will convince CIOs ndash and indeed western companies ndash that EM cannot
be written off and that it is worth making this move from allocating to the US to EM The
currency is going to play a key role in this The competitiveness gain that EM is experiencing
will be hard to ignore EM demand is likely to be hurt by the higher cost of imported goods
and in time this should translate into import substitution (where possible) and some
additional export lift even if much of the competitiveness gains are between emerging
markets at present (Russian mining competing with Brazilian mining for example)
In addition when over 30 of US exports go to (depreciating) Canada and Mexico US
companies will have few choices open to them They can either cut US costs dramatically
but this will require nominal wage cuts which is hard to imagine or they can choose to
produce in Mexico and sell in Mexico or they can choose to produce in Mexico and sell
back to the US We expect to see US FDI to EM pick up
Figure 12 Currencies vs the $ (nominal change) Sept 2005 to Sept 2015
Source Bloomberg
China has seen its currency appreciate even more significantly against most EM
currencies We expect Chinese firms to take advantage of their strong currency to buy up
assets in EM Since 2005 in nominal terms some of the largest EM currency falls relative
to the CNY have been seen in the RUB ZAR BRL and TRY
Figure 13 Currencies vs CNY nominal change Sept 2005 to Sept 2015
Source Bloomberg
-80
-60
-40
-20
0
20
40
C N Y
P H P
S G D
T H B
P E N
T W D
H K D
C Z K
B G N
M Y R
K R W
P L N
C L P
C O P
H U F
R O N
I D R
I N R
M X N
B R L
Z A R
T R Y
R U B
A R S
C H F
A U D
J P Y
D K K
E U R
S E K
N Z D
C A D
G B P
N O K
-80
-70
-60
-50
-40
-30
-20
-10
0
10
P H
P
S G
D
T H
B
P E
N
T W
D
H K
D
C Z
K
B G
N
M Y
R
K R
W
P L
N
C L
P
C O
P
H U
F
R O
N
I D
R
I N
R
M X
N
B R
L
Z A
R
T R
Y
R U
B
A R
S
C H
F
U S
D
A U
D
J P
Y
D K
K
E U
R
S E
K
N Z
D
C A
D
G B
P
N O
K
7252019 Thoughts From RenMan-280915(5)
httpslidepdfcomreaderfullthoughts-from-renman-2809155 1115
11
Renaissance Capital28 September 2015
Thoughts from a Renaissance man
Indeed China is already leading the way Over 40 of all the Chinese FDI that has
entered Brazil since 2001 arrived in 2014 Chinarsquos share of annual FDI flows into Brazil
Russia and Turkey was 0-1 in every year we have data for until 2014 when it rose to
15 in Brazil and 6 in Russia while latest 2015 data show it was 12 in Russia and
6 in Turkey Unfortunately SA does not produce FDI data by country
Figure 14 Chinese FDI into key EM countries is suddenly picking up
Note 2015 is 1Q15 for Russia and January-July 2015 for TurkeySource Turkish central bank Brazilian central bank Russian central bank
This echoes what happened with Japan in the 1980s a stronger JPY prompted a surge in
outward FDI For more on this comparison ndash see FX and commodities ndash itrsquos just so 1981
Figure 15 US and Japanese outward FDI in $mn 1980-1990
Note The US dollar peaked in strength in 1985 the JPY rose strongly vs the US dollar after 1985Source UNCTAD
The FDI flows also grow in importance as the EM GDP shrinks so even if the dollar
amount going into EM shrinks (as seen in Russia recently) EM GDP in dollars may be
shrinking faster So when the BRL was approaching its record lows in REER terms (see
Figure 2) we also saw FDI reach record levels of around 5 of GDP annually While FDI
is much higher in dollar terms now it has only had half the impact (2-3 of GDP) on the
Brazilian economy
0
2
4
6
8
10
12
14
-200
0
200
400
600
800
1000
2001 2002 2003 2004 2005 2006 2007 2008 2009 2010 2011 2012 2013 2014 2015
Chinese FDI in $m (lhs) and as of recipients total annual FDI (rhs)
Chinese FDI into Russia Chinese FDI into BrazilChinese FDI into Turkey Chinese FDI as of all Russian FDIChinese FDI as of all Brazilian FDI Chinese FDI as of all Turkish FDI
-
1000
2000
3000
4000
5000
6000
7000
1980 1981 1982 1983 1984 1985 1986 1987 1988 1989 1990
Japanese FDI outflows ($mn) rose with JPY strengthJapan US
7252019 Thoughts From RenMan-280915(5)
httpslidepdfcomreaderfullthoughts-from-renman-2809155 1215
12
Renaissance Capital28 September 2015
Thoughts from a Renaissance man
Figure 16 FDI was most important for Brazil over 1999-2001 when BRL was weak
Source UNCTAD
We would expect the surge in FDI to help boost productivity in EM and become part of a
reinvigorated EM contribution to the world economy This is a process that we expect to
see pick up over 2016-2017 ndash or perhaps a little longer if the US goes into a recession
Conclusions
We think that based on time considerations we are most of the way through the EM FX sell-
off that began in in 2012 but not necessarily three-quarters of the way through in terms of
value Half of EM currencies are still above their long-term average value based on our
REER analysis
Over 2016-2017 we would not be surprised to see previous lows tested for currencies
such as the BRL or the TRY before EM FX stabilises and begins to strengthen again
Once we take inflation into account this implies a level of BRL6$ ndash equivalent to what
was seen back in 2001-2002 or in Turkeyrsquos case TRY43$ We would of course be
delighted if EM currencies bounce back earlier than 2016-2017 and we should point out
that half of MSCI EM currencies are already cheaper than their 20-year average rates as
implied by our REER analysis For the long-term investor EM currencies on average are
at fair value in contrast to DM equities or bonds which are expensive relative to the long
term
A few EM currencies are already at or near their absolute lows compared to the past 20
years of history We think these should be seriously considered by EM investors lookingto take long positions either directly in FX or in equities and bonds
Colombia looks very attractive to us but perhaps investors will need to see proof that this
weaker currency is improving fundamentals Today the consensus on the current account
is only that it will improve from 6 of GDP in 2015 to 5 of GDP in 2016 ndash we expect
that will be too pessimistic
Taiwan with its cheap currency relative to the long-term average and a massive (12 of
GDP) CA surplus would also be attractive were it not for the competitive threat from
Japan which has a currency near its record weakest level
SA has a cheap currency near its absolute low (which we estimate at 152$) and which
might already be responsible for recently improved current account data Our only caveat
here is that the ZAR is a highly liquid EM proxy currency that could be driven weaker in
line with others such as the BRL but we would be supportive of investors taking long
0
1
2
3
4
5
6
0
10000
20000
30000
40000
5000060000
70000
1 9 9 0
1 9 9 1
1 9 9 2
1 9 9 3
1 9 9 4
1 9 9 5
1 9 9 6
1 9 9 7
1 9 9 8
1 9 9 9
2 0 0 0
2 0 0 1
2 0 0 2
2 0 0 3
2 0 0 4
2 0 0 5
2 0 0 6
2 0 0 7
2 0 0 8
2 0 0 9
2 0 1 0
2 0 1 1
2 0 1 2
2 0 1 3
FDI inflow to Brazil in $mn (lhs) and as of GDP (rhs)
FDI into Brazil ($m) FDI into Brazil of GDP
7252019 Thoughts From RenMan-280915(5)
httpslidepdfcomreaderfullthoughts-from-renman-2809155 1315
13
Renaissance Capital28 September 2015
Thoughts from a Renaissance man
positions in SA around current or weaker FX levels It is also worth noting that SArsquos equity
market outperformed EM in the Asian crisis of 1997-98 the tech bubble crash of 2000-01
and the global financial crisis of 2007-08 helped by its funds
The short side of the equation is Egypt ndash where a currency level around EGP98$ is justif ied today but where Gulf inflows could help the authorities resist this for some
time We would also recommend selling India which also happens to be a widely-
owned overweight in GEM funds as this currency is stronger than its long-term average
and it runs a current account deficit The other most vulnerable currency we think is
Perursquos for the same reasons
Elsewhere in EEMEA we see Poland Hungary and the Czech Republic as offering
low-risk alternatives Currencies are close to their 20-year average levels and current
accounts are healthy
Greece is slightly cheap but we donrsquot see that offsetting the problem of having a Syriza
government in power ndash which is likely to be unfriendly to portfolio investors in private
companies
Russiarsquos currency looks cheap to us too ndash at RUB65$ against the 20-year average of
RUB59$ ndash and is supported by a decent current account surplus
In the Gulf the UAE and Qatar have somewhat expensive currencies but these have
never been that volatile in 20 years In addition they have SWF reserves which we
estimate at over 300 and 100 of GDP respectively We doubt the currency regimes
will be altered in either so the main downside stems from the impact of budget cuts
The story for Frontier FX is very different Very few currencies have seen significant
depreciation Half are near the strongest levels they have ever been in REER terms
By far the best value from our perspective is now Kazakhstan ndash with a currency at its
absolute lows in a country that we expect to run a current account surplus in 2016 ndash see
our report Kazakhstanrsquos devaluation Implications for frontier currencies published 20
August 2015 In addition the government has a dynamic reform agenda that has been
likened to what Singapore has done in the past ndash see Kazakhstan Impressive reform plan
initiated published 9 July 2015
We also like the look of Morocco which has an enviable record of currency stability Like
South Africa equities may be relatively expensive to its peers but for a decent reason
assuming the currency is stable
Romania carries modest currency risk in our view but is inside the EU envelope which
offers some protection and has a healthy CA
We see risks being higher in Pakistan where a 15 devaluation to PKR120$ is
plausible and higher still in Bangladesh where history implies that fair value is
BDT100$ Vietnam is trading even further from long-term fair value and might also be
getting more vulnerable since its CA entered deficit territory in 1Q15
We always doubt Gulf currencies will move significantly but we are concerned by Oman
The 2008-2009 crisis hit that country hard reserves are far lower than in other countries
(Omanrsquos sovereign wealth fund would not cover a budget deficit on the scale of Saudirsquos
for even 12 months) and we think the currency looks expensive
The most vulnerable currencies of all according to this REER analysis are in Kenyarunning an estimated 10 of GDP current account deficit this year and Nigeria Their
current exchange rates look hard to justify if this REER analysis is valid (as noted above
7252019 Thoughts From RenMan-280915(5)
httpslidepdfcomreaderfullthoughts-from-renman-2809155 1415
14
Renaissance Capital28 September 2015
Thoughts from a Renaissance man
the IMF thinks not) Yvonne Mhango does expect depreciation to KES109 in 2015 and
KES115 in 2016 and NGN230 and NGN225 respectively for Kenya and Nigeria but
these Bruegel-derived REER calculations imply more than 30 deprecation risk above
those numbers
So our top picks in our universe would be Kazakhstan (in frontier) and SA (in EEMEA)
from a currency perspective
For currency trends to turn we need a change in fundamentals that we expect to see via
improved trade and CA numbers and a rise in FDI The latter is already picking up
sharply from China into Brazil Turkey and Russia We expect these trends will help re-
invigorate growth in EM from 2017-2018 and encourage investors to renew their interest
in the asset class
Figure 17 REER implied exchange rates for MSCI EM and some MSCI Frontier and Beyond Frontier countries
CurrentRate implied by
long-term average REER$ rate if REERfalls to lows
Date REERhit its low point
2015 CA ( GDP)
IMF April 2015forecasts
Bloomberg consensusforecasts (Sept 2015)
China 638 841 11 Apr-95 32 27India 661 782 100 Feb-96 -13 -11Indonesia 14684 14057 36071 Jun-98 -3 -24Korea 1193 1184 1819 Jan-98 71 79Malaysia 437 364 559 Dec-98 21 28Philippines 468 58 782 Feb-04 55 42Taiwan 331 292 346 Nov-09 124 139Thailand 363 381 543 Jan-98 44 45
Brazil 418 302 585 Oct-02 -37 -41Colombia 3117 2269 3103 Mar-03 -58 -58Chile 704 627 776 Jun-03 -12 -04Mexico 171 141 236 Mar-95 -22 -25Peru 322 333 371 Jul-07 -46 -4
Czech 242 27 403 Jan-95 16 07
Egypt 783 981 149 Dec-03 -33 -24Greece 089 085 098 Sep-00 14 02Hungary 279 285 384 Apr-95 33 48Poland 377 378 458 Nov-97 -18 -03Qatar 364 412 452 Aug-11 84 71Russia 665 59 114 Jan-99 54 49S Africa 139 102 152 Dec-01 -46 -44Turkey 306 287 426 Oct-01 -42 -5UAE 367 409 444 Aug-11 53 41
Argentina 94 519 108 Apr-14 -17 -15Bangladesh 777 992 117 Dec-06 -06 naGeorgia 238 237 392 Apr-95 -66 naKazakhstan 269 216 272 Oct-99 -19 -38Kenya 106 152 266 Jul-95 -77 -9Kuwait 03 035 042 Jun-95 157 126
Morocco 972 926 992 Aug-12 -34 -38Nigeria 199 285 618 Apr-95 07 -23Oman 039 044 049 Nov-07 -15 -85Pakistan 104 120 135 Sep-01 -13 -06Romania 394 449 935 Feb-97 -11 -1Sri Lanka 141 166 205 Jan-96 -2 -28Vietnam 22480 29114 35506 Jan-04 48 -05
Iran 29856 26224 60389 Jun-95 08 naSaudi Arabia 375 424 505 Mar-08 -1 -17Zambia 106 108 176 Dec-92 03 naNote More recent IMF CA forecasts include -06 for Zambia (June 2015) and -99 for Kenya (September 2015)
Source Bruegel Bloomberg IMF April World Economic Outlook Renaissance Capital
7252019 Thoughts From RenMan-280915(5)
httpslidepdfcomreaderfullthoughts-from-renman-2809155 1515
Renaissance CapitalMoscowT + 7 (495) 258 7777
Renaissance Capital LtdLondonT + 44 (203) 379 7777
Renaissance CapitalJohannesburgT +27 (11) 750 1400
Renaissance Securities (Cyprus)LtdNicosiaT + 357 (22) 505 800
Renaissance Securities (Nigeria) LtdLagosT +234 (1) 448 5300
Renaissance CapitalNairobiT +254 (20) 368 2000
Renaissance CapitalIstanbulT +90 (212) 362 3500
Renaissance CapitalDubaiT +971 (4) 409 2000
A complete set of disclosure statements associated with the issuers discussed in this report is available using the lsquoStock Finderrsquo or lsquoBond Finderrsquo for individualissuers on the Renaissance Capital Research Portal at httpresearchrencapcomengdefaultasp
This Communication is for information purposes only The Communication does not form a fiduciary relationship or constitute advice and is not and should not be construed asa recommendation or an offer or a solicitation of an offer of securities or related financial instruments or an invitation or inducement to engage in investment activity and cannotbe relied upon as a representation that any particular transaction necessarily could have been or can be effected at the stated price The Communication is not anadvertisement of securities nor independent investment research and has not been prepared in accordance with legal requirements designed to promote the independence ofinvestment research and is not subject to any prohibition on dealing ahead of the dissemination of investment research Opinions expressed therein may differ or be contrary toopinions expressed by other business areas or groups of the Renaissance Capital as a result of using different assumptions and criteria All such information is subject tochange without notice and neither Renaissance Capital nor any of its subsidiaries or affiliates is under any obligation to update or keep current the information contained in theCommunication or in any other medium
Descriptions of any company or issuer or their securities or the markets or developments mentioned in the Communication are not intended to be complete TheCommunication should not be regarded by recipients as a substitute for the exercise o f their own judgment as the Communication has no regard to the specific investmentobjectives financial situation or particular needs of any specific recipient The material (whether or not it states any opinions) is for general information purposes only and doesnot take into account your personal circumstances or objectives and nothing in this material is or should be considered to be financial investment or other advice on whichreliance should be placed Any reliance you place on such information is therefore strictly at your own risk The application of taxation laws depends on an investorrsquos individualcircumstances and accordingly each investor should seek independent professional advice on taxation implications before making any investment decision TheCommunication has been compiled or arrived at based on information obtained from sources believed to be reliable and in good faith Such information has not beenindependently verified is provided on an lsquoas isrsquo basis and no representation or warranty either expressed or implied is provided in relation to the accuracy completenessreliability merchantability or fitness for a particular purpose of such information except with respect to information concerning Renaissance Capital its subsidiaries andaffiliates All statements of opinion and all projections forecasts or statements relating to expectations regarding future events or the possible future performance ofinvestments represent Renaissance Capitalrsquos own assessment and interpretation of information available to them currently Any information relating to past performance of aninvestment does not necessarily guarantee future performance
The Communication is not intended for distribution to the public and may be confidential It may not be reproduced redistributed or published in whole or in part for anypurpose without the written permission of Renaissance Capital and neither Renaissance Capital nor any of its affiliates accepts any liability whatsoever for the actions of thirdparties in this respect The information may not be used to create any financial instruments or products or any indices Neither Renaissance Capital and its affiliates nor theirdirectors representatives or employees accept any liability for any direct or consequential loss or damage arising out of the use of all or any part of the Communication
copy 2015 Renaissance Securities (Cyprus) Limited All rights reserved Regulated by the Cyprus Securities and Exchange Commission (Licence No KEPEY 05304)
This research is for general information purposes only and should not be interpreted that Renaissance Capital is encouraging investment dealings ie buyingand selling securities in Iran Under US law ldquocriminal penalties for violations of the Iranian Transactions Regulations may result in a fine of up to $1000000 andnatural persons may be imprisoned for up to 20 yearsrdquo Under UK law criminal penalties for violating restrictions on investment in and certain financialtransactions with Iran may carry criminal penalties including up to 2 years in prison andor substantial fines
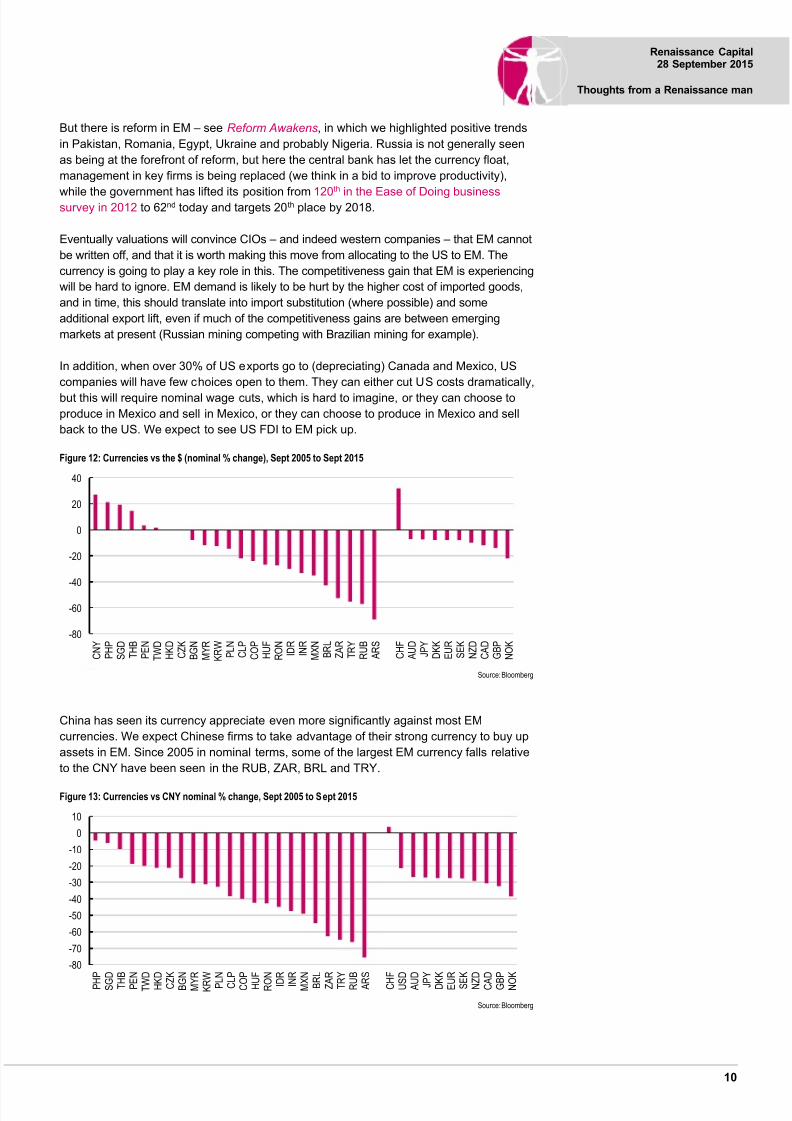
7252019 Thoughts From RenMan-280915(5)
httpslidepdfcomreaderfullthoughts-from-renman-2809155 1015
10
Renaissance Capital28 September 2015
Thoughts from a Renaissance man
But there is reform in EM ndash see Reform Awakens in which we highlighted positive trends
in Pakistan Romania Egypt Ukraine and probably Nigeria Russia is not generally seen
as being at the forefront of reform but here the central bank has let the currency float
management in key firms is being replaced (we think in a bid to improve productivity)
while the government has lifted its position from 120th
in the Ease of Doing businesssurvey in 2012 to 62nd today and targets 20th place by 2018
Eventually valuations will convince CIOs ndash and indeed western companies ndash that EM cannot
be written off and that it is worth making this move from allocating to the US to EM The
currency is going to play a key role in this The competitiveness gain that EM is experiencing
will be hard to ignore EM demand is likely to be hurt by the higher cost of imported goods
and in time this should translate into import substitution (where possible) and some
additional export lift even if much of the competitiveness gains are between emerging
markets at present (Russian mining competing with Brazilian mining for example)
In addition when over 30 of US exports go to (depreciating) Canada and Mexico US
companies will have few choices open to them They can either cut US costs dramatically
but this will require nominal wage cuts which is hard to imagine or they can choose to
produce in Mexico and sell in Mexico or they can choose to produce in Mexico and sell
back to the US We expect to see US FDI to EM pick up
Figure 12 Currencies vs the $ (nominal change) Sept 2005 to Sept 2015
Source Bloomberg
China has seen its currency appreciate even more significantly against most EM
currencies We expect Chinese firms to take advantage of their strong currency to buy up
assets in EM Since 2005 in nominal terms some of the largest EM currency falls relative
to the CNY have been seen in the RUB ZAR BRL and TRY
Figure 13 Currencies vs CNY nominal change Sept 2005 to Sept 2015
Source Bloomberg
-80
-60
-40
-20
0
20
40
C N Y
P H P
S G D
T H B
P E N
T W D
H K D
C Z K
B G N
M Y R
K R W
P L N
C L P
C O P
H U F
R O N
I D R
I N R
M X N
B R L
Z A R
T R Y
R U B
A R S
C H F
A U D
J P Y
D K K
E U R
S E K
N Z D
C A D
G B P
N O K
-80
-70
-60
-50
-40
-30
-20
-10
0
10
P H
P
S G
D
T H
B
P E
N
T W
D
H K
D
C Z
K
B G
N
M Y
R
K R
W
P L
N
C L
P
C O
P
H U
F
R O
N
I D
R
I N
R
M X
N
B R
L
Z A
R
T R
Y
R U
B
A R
S
C H
F
U S
D
A U
D
J P
Y
D K
K
E U
R
S E
K
N Z
D
C A
D
G B
P
N O
K
7252019 Thoughts From RenMan-280915(5)
httpslidepdfcomreaderfullthoughts-from-renman-2809155 1115
11
Renaissance Capital28 September 2015
Thoughts from a Renaissance man
Indeed China is already leading the way Over 40 of all the Chinese FDI that has
entered Brazil since 2001 arrived in 2014 Chinarsquos share of annual FDI flows into Brazil
Russia and Turkey was 0-1 in every year we have data for until 2014 when it rose to
15 in Brazil and 6 in Russia while latest 2015 data show it was 12 in Russia and
6 in Turkey Unfortunately SA does not produce FDI data by country
Figure 14 Chinese FDI into key EM countries is suddenly picking up
Note 2015 is 1Q15 for Russia and January-July 2015 for TurkeySource Turkish central bank Brazilian central bank Russian central bank
This echoes what happened with Japan in the 1980s a stronger JPY prompted a surge in
outward FDI For more on this comparison ndash see FX and commodities ndash itrsquos just so 1981
Figure 15 US and Japanese outward FDI in $mn 1980-1990
Note The US dollar peaked in strength in 1985 the JPY rose strongly vs the US dollar after 1985Source UNCTAD
The FDI flows also grow in importance as the EM GDP shrinks so even if the dollar
amount going into EM shrinks (as seen in Russia recently) EM GDP in dollars may be
shrinking faster So when the BRL was approaching its record lows in REER terms (see
Figure 2) we also saw FDI reach record levels of around 5 of GDP annually While FDI
is much higher in dollar terms now it has only had half the impact (2-3 of GDP) on the
Brazilian economy
0
2
4
6
8
10
12
14
-200
0
200
400
600
800
1000
2001 2002 2003 2004 2005 2006 2007 2008 2009 2010 2011 2012 2013 2014 2015
Chinese FDI in $m (lhs) and as of recipients total annual FDI (rhs)
Chinese FDI into Russia Chinese FDI into BrazilChinese FDI into Turkey Chinese FDI as of all Russian FDIChinese FDI as of all Brazilian FDI Chinese FDI as of all Turkish FDI
-
1000
2000
3000
4000
5000
6000
7000
1980 1981 1982 1983 1984 1985 1986 1987 1988 1989 1990
Japanese FDI outflows ($mn) rose with JPY strengthJapan US
7252019 Thoughts From RenMan-280915(5)
httpslidepdfcomreaderfullthoughts-from-renman-2809155 1215
12
Renaissance Capital28 September 2015
Thoughts from a Renaissance man
Figure 16 FDI was most important for Brazil over 1999-2001 when BRL was weak
Source UNCTAD
We would expect the surge in FDI to help boost productivity in EM and become part of a
reinvigorated EM contribution to the world economy This is a process that we expect to
see pick up over 2016-2017 ndash or perhaps a little longer if the US goes into a recession
Conclusions
We think that based on time considerations we are most of the way through the EM FX sell-
off that began in in 2012 but not necessarily three-quarters of the way through in terms of
value Half of EM currencies are still above their long-term average value based on our
REER analysis
Over 2016-2017 we would not be surprised to see previous lows tested for currencies
such as the BRL or the TRY before EM FX stabilises and begins to strengthen again
Once we take inflation into account this implies a level of BRL6$ ndash equivalent to what
was seen back in 2001-2002 or in Turkeyrsquos case TRY43$ We would of course be
delighted if EM currencies bounce back earlier than 2016-2017 and we should point out
that half of MSCI EM currencies are already cheaper than their 20-year average rates as
implied by our REER analysis For the long-term investor EM currencies on average are
at fair value in contrast to DM equities or bonds which are expensive relative to the long
term
A few EM currencies are already at or near their absolute lows compared to the past 20
years of history We think these should be seriously considered by EM investors lookingto take long positions either directly in FX or in equities and bonds
Colombia looks very attractive to us but perhaps investors will need to see proof that this
weaker currency is improving fundamentals Today the consensus on the current account
is only that it will improve from 6 of GDP in 2015 to 5 of GDP in 2016 ndash we expect
that will be too pessimistic
Taiwan with its cheap currency relative to the long-term average and a massive (12 of
GDP) CA surplus would also be attractive were it not for the competitive threat from
Japan which has a currency near its record weakest level
SA has a cheap currency near its absolute low (which we estimate at 152$) and which
might already be responsible for recently improved current account data Our only caveat
here is that the ZAR is a highly liquid EM proxy currency that could be driven weaker in
line with others such as the BRL but we would be supportive of investors taking long
0
1
2
3
4
5
6
0
10000
20000
30000
40000
5000060000
70000
1 9 9 0
1 9 9 1
1 9 9 2
1 9 9 3
1 9 9 4
1 9 9 5
1 9 9 6
1 9 9 7
1 9 9 8
1 9 9 9
2 0 0 0
2 0 0 1
2 0 0 2
2 0 0 3
2 0 0 4
2 0 0 5
2 0 0 6
2 0 0 7
2 0 0 8
2 0 0 9
2 0 1 0
2 0 1 1
2 0 1 2
2 0 1 3
FDI inflow to Brazil in $mn (lhs) and as of GDP (rhs)
FDI into Brazil ($m) FDI into Brazil of GDP
7252019 Thoughts From RenMan-280915(5)
httpslidepdfcomreaderfullthoughts-from-renman-2809155 1315
13
Renaissance Capital28 September 2015
Thoughts from a Renaissance man
positions in SA around current or weaker FX levels It is also worth noting that SArsquos equity
market outperformed EM in the Asian crisis of 1997-98 the tech bubble crash of 2000-01
and the global financial crisis of 2007-08 helped by its funds
The short side of the equation is Egypt ndash where a currency level around EGP98$ is justif ied today but where Gulf inflows could help the authorities resist this for some
time We would also recommend selling India which also happens to be a widely-
owned overweight in GEM funds as this currency is stronger than its long-term average
and it runs a current account deficit The other most vulnerable currency we think is
Perursquos for the same reasons
Elsewhere in EEMEA we see Poland Hungary and the Czech Republic as offering
low-risk alternatives Currencies are close to their 20-year average levels and current
accounts are healthy
Greece is slightly cheap but we donrsquot see that offsetting the problem of having a Syriza
government in power ndash which is likely to be unfriendly to portfolio investors in private
companies
Russiarsquos currency looks cheap to us too ndash at RUB65$ against the 20-year average of
RUB59$ ndash and is supported by a decent current account surplus
In the Gulf the UAE and Qatar have somewhat expensive currencies but these have
never been that volatile in 20 years In addition they have SWF reserves which we
estimate at over 300 and 100 of GDP respectively We doubt the currency regimes
will be altered in either so the main downside stems from the impact of budget cuts
The story for Frontier FX is very different Very few currencies have seen significant
depreciation Half are near the strongest levels they have ever been in REER terms
By far the best value from our perspective is now Kazakhstan ndash with a currency at its
absolute lows in a country that we expect to run a current account surplus in 2016 ndash see
our report Kazakhstanrsquos devaluation Implications for frontier currencies published 20
August 2015 In addition the government has a dynamic reform agenda that has been
likened to what Singapore has done in the past ndash see Kazakhstan Impressive reform plan
initiated published 9 July 2015
We also like the look of Morocco which has an enviable record of currency stability Like
South Africa equities may be relatively expensive to its peers but for a decent reason
assuming the currency is stable
Romania carries modest currency risk in our view but is inside the EU envelope which
offers some protection and has a healthy CA
We see risks being higher in Pakistan where a 15 devaluation to PKR120$ is
plausible and higher still in Bangladesh where history implies that fair value is
BDT100$ Vietnam is trading even further from long-term fair value and might also be
getting more vulnerable since its CA entered deficit territory in 1Q15
We always doubt Gulf currencies will move significantly but we are concerned by Oman
The 2008-2009 crisis hit that country hard reserves are far lower than in other countries
(Omanrsquos sovereign wealth fund would not cover a budget deficit on the scale of Saudirsquos
for even 12 months) and we think the currency looks expensive
The most vulnerable currencies of all according to this REER analysis are in Kenyarunning an estimated 10 of GDP current account deficit this year and Nigeria Their
current exchange rates look hard to justify if this REER analysis is valid (as noted above
7252019 Thoughts From RenMan-280915(5)
httpslidepdfcomreaderfullthoughts-from-renman-2809155 1415
14
Renaissance Capital28 September 2015
Thoughts from a Renaissance man
the IMF thinks not) Yvonne Mhango does expect depreciation to KES109 in 2015 and
KES115 in 2016 and NGN230 and NGN225 respectively for Kenya and Nigeria but
these Bruegel-derived REER calculations imply more than 30 deprecation risk above
those numbers
So our top picks in our universe would be Kazakhstan (in frontier) and SA (in EEMEA)
from a currency perspective
For currency trends to turn we need a change in fundamentals that we expect to see via
improved trade and CA numbers and a rise in FDI The latter is already picking up
sharply from China into Brazil Turkey and Russia We expect these trends will help re-
invigorate growth in EM from 2017-2018 and encourage investors to renew their interest
in the asset class
Figure 17 REER implied exchange rates for MSCI EM and some MSCI Frontier and Beyond Frontier countries
CurrentRate implied by
long-term average REER$ rate if REERfalls to lows
Date REERhit its low point
2015 CA ( GDP)
IMF April 2015forecasts
Bloomberg consensusforecasts (Sept 2015)
China 638 841 11 Apr-95 32 27India 661 782 100 Feb-96 -13 -11Indonesia 14684 14057 36071 Jun-98 -3 -24Korea 1193 1184 1819 Jan-98 71 79Malaysia 437 364 559 Dec-98 21 28Philippines 468 58 782 Feb-04 55 42Taiwan 331 292 346 Nov-09 124 139Thailand 363 381 543 Jan-98 44 45
Brazil 418 302 585 Oct-02 -37 -41Colombia 3117 2269 3103 Mar-03 -58 -58Chile 704 627 776 Jun-03 -12 -04Mexico 171 141 236 Mar-95 -22 -25Peru 322 333 371 Jul-07 -46 -4
Czech 242 27 403 Jan-95 16 07
Egypt 783 981 149 Dec-03 -33 -24Greece 089 085 098 Sep-00 14 02Hungary 279 285 384 Apr-95 33 48Poland 377 378 458 Nov-97 -18 -03Qatar 364 412 452 Aug-11 84 71Russia 665 59 114 Jan-99 54 49S Africa 139 102 152 Dec-01 -46 -44Turkey 306 287 426 Oct-01 -42 -5UAE 367 409 444 Aug-11 53 41
Argentina 94 519 108 Apr-14 -17 -15Bangladesh 777 992 117 Dec-06 -06 naGeorgia 238 237 392 Apr-95 -66 naKazakhstan 269 216 272 Oct-99 -19 -38Kenya 106 152 266 Jul-95 -77 -9Kuwait 03 035 042 Jun-95 157 126
Morocco 972 926 992 Aug-12 -34 -38Nigeria 199 285 618 Apr-95 07 -23Oman 039 044 049 Nov-07 -15 -85Pakistan 104 120 135 Sep-01 -13 -06Romania 394 449 935 Feb-97 -11 -1Sri Lanka 141 166 205 Jan-96 -2 -28Vietnam 22480 29114 35506 Jan-04 48 -05
Iran 29856 26224 60389 Jun-95 08 naSaudi Arabia 375 424 505 Mar-08 -1 -17Zambia 106 108 176 Dec-92 03 naNote More recent IMF CA forecasts include -06 for Zambia (June 2015) and -99 for Kenya (September 2015)
Source Bruegel Bloomberg IMF April World Economic Outlook Renaissance Capital
7252019 Thoughts From RenMan-280915(5)
httpslidepdfcomreaderfullthoughts-from-renman-2809155 1515
Renaissance CapitalMoscowT + 7 (495) 258 7777
Renaissance Capital LtdLondonT + 44 (203) 379 7777
Renaissance CapitalJohannesburgT +27 (11) 750 1400
Renaissance Securities (Cyprus)LtdNicosiaT + 357 (22) 505 800
Renaissance Securities (Nigeria) LtdLagosT +234 (1) 448 5300
Renaissance CapitalNairobiT +254 (20) 368 2000
Renaissance CapitalIstanbulT +90 (212) 362 3500
Renaissance CapitalDubaiT +971 (4) 409 2000
A complete set of disclosure statements associated with the issuers discussed in this report is available using the lsquoStock Finderrsquo or lsquoBond Finderrsquo for individualissuers on the Renaissance Capital Research Portal at httpresearchrencapcomengdefaultasp
This Communication is for information purposes only The Communication does not form a fiduciary relationship or constitute advice and is not and should not be construed asa recommendation or an offer or a solicitation of an offer of securities or related financial instruments or an invitation or inducement to engage in investment activity and cannotbe relied upon as a representation that any particular transaction necessarily could have been or can be effected at the stated price The Communication is not anadvertisement of securities nor independent investment research and has not been prepared in accordance with legal requirements designed to promote the independence ofinvestment research and is not subject to any prohibition on dealing ahead of the dissemination of investment research Opinions expressed therein may differ or be contrary toopinions expressed by other business areas or groups of the Renaissance Capital as a result of using different assumptions and criteria All such information is subject tochange without notice and neither Renaissance Capital nor any of its subsidiaries or affiliates is under any obligation to update or keep current the information contained in theCommunication or in any other medium
Descriptions of any company or issuer or their securities or the markets or developments mentioned in the Communication are not intended to be complete TheCommunication should not be regarded by recipients as a substitute for the exercise o f their own judgment as the Communication has no regard to the specific investmentobjectives financial situation or particular needs of any specific recipient The material (whether or not it states any opinions) is for general information purposes only and doesnot take into account your personal circumstances or objectives and nothing in this material is or should be considered to be financial investment or other advice on whichreliance should be placed Any reliance you place on such information is therefore strictly at your own risk The application of taxation laws depends on an investorrsquos individualcircumstances and accordingly each investor should seek independent professional advice on taxation implications before making any investment decision TheCommunication has been compiled or arrived at based on information obtained from sources believed to be reliable and in good faith Such information has not beenindependently verified is provided on an lsquoas isrsquo basis and no representation or warranty either expressed or implied is provided in relation to the accuracy completenessreliability merchantability or fitness for a particular purpose of such information except with respect to information concerning Renaissance Capital its subsidiaries andaffiliates All statements of opinion and all projections forecasts or statements relating to expectations regarding future events or the possible future performance ofinvestments represent Renaissance Capitalrsquos own assessment and interpretation of information available to them currently Any information relating to past performance of aninvestment does not necessarily guarantee future performance
The Communication is not intended for distribution to the public and may be confidential It may not be reproduced redistributed or published in whole or in part for anypurpose without the written permission of Renaissance Capital and neither Renaissance Capital nor any of its affiliates accepts any liability whatsoever for the actions of thirdparties in this respect The information may not be used to create any financial instruments or products or any indices Neither Renaissance Capital and its affiliates nor theirdirectors representatives or employees accept any liability for any direct or consequential loss or damage arising out of the use of all or any part of the Communication
copy 2015 Renaissance Securities (Cyprus) Limited All rights reserved Regulated by the Cyprus Securities and Exchange Commission (Licence No KEPEY 05304)
This research is for general information purposes only and should not be interpreted that Renaissance Capital is encouraging investment dealings ie buyingand selling securities in Iran Under US law ldquocriminal penalties for violations of the Iranian Transactions Regulations may result in a fine of up to $1000000 andnatural persons may be imprisoned for up to 20 yearsrdquo Under UK law criminal penalties for violating restrictions on investment in and certain financialtransactions with Iran may carry criminal penalties including up to 2 years in prison andor substantial fines
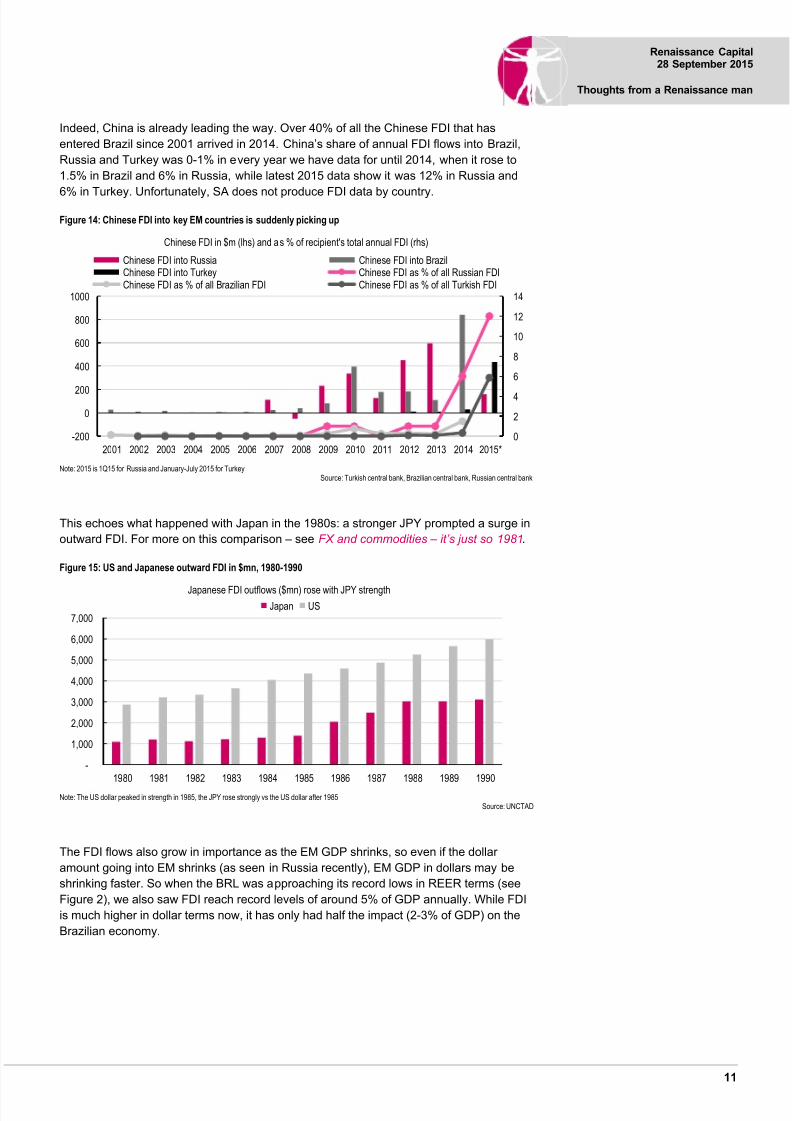
7252019 Thoughts From RenMan-280915(5)
httpslidepdfcomreaderfullthoughts-from-renman-2809155 1115
11
Renaissance Capital28 September 2015
Thoughts from a Renaissance man
Indeed China is already leading the way Over 40 of all the Chinese FDI that has
entered Brazil since 2001 arrived in 2014 Chinarsquos share of annual FDI flows into Brazil
Russia and Turkey was 0-1 in every year we have data for until 2014 when it rose to
15 in Brazil and 6 in Russia while latest 2015 data show it was 12 in Russia and
6 in Turkey Unfortunately SA does not produce FDI data by country
Figure 14 Chinese FDI into key EM countries is suddenly picking up
Note 2015 is 1Q15 for Russia and January-July 2015 for TurkeySource Turkish central bank Brazilian central bank Russian central bank
This echoes what happened with Japan in the 1980s a stronger JPY prompted a surge in
outward FDI For more on this comparison ndash see FX and commodities ndash itrsquos just so 1981
Figure 15 US and Japanese outward FDI in $mn 1980-1990
Note The US dollar peaked in strength in 1985 the JPY rose strongly vs the US dollar after 1985Source UNCTAD
The FDI flows also grow in importance as the EM GDP shrinks so even if the dollar
amount going into EM shrinks (as seen in Russia recently) EM GDP in dollars may be
shrinking faster So when the BRL was approaching its record lows in REER terms (see
Figure 2) we also saw FDI reach record levels of around 5 of GDP annually While FDI
is much higher in dollar terms now it has only had half the impact (2-3 of GDP) on the
Brazilian economy
0
2
4
6
8
10
12
14
-200
0
200
400
600
800
1000
2001 2002 2003 2004 2005 2006 2007 2008 2009 2010 2011 2012 2013 2014 2015
Chinese FDI in $m (lhs) and as of recipients total annual FDI (rhs)
Chinese FDI into Russia Chinese FDI into BrazilChinese FDI into Turkey Chinese FDI as of all Russian FDIChinese FDI as of all Brazilian FDI Chinese FDI as of all Turkish FDI
-
1000
2000
3000
4000
5000
6000
7000
1980 1981 1982 1983 1984 1985 1986 1987 1988 1989 1990
Japanese FDI outflows ($mn) rose with JPY strengthJapan US
7252019 Thoughts From RenMan-280915(5)
httpslidepdfcomreaderfullthoughts-from-renman-2809155 1215
12
Renaissance Capital28 September 2015
Thoughts from a Renaissance man
Figure 16 FDI was most important for Brazil over 1999-2001 when BRL was weak
Source UNCTAD
We would expect the surge in FDI to help boost productivity in EM and become part of a
reinvigorated EM contribution to the world economy This is a process that we expect to
see pick up over 2016-2017 ndash or perhaps a little longer if the US goes into a recession
Conclusions
We think that based on time considerations we are most of the way through the EM FX sell-
off that began in in 2012 but not necessarily three-quarters of the way through in terms of
value Half of EM currencies are still above their long-term average value based on our
REER analysis
Over 2016-2017 we would not be surprised to see previous lows tested for currencies
such as the BRL or the TRY before EM FX stabilises and begins to strengthen again
Once we take inflation into account this implies a level of BRL6$ ndash equivalent to what
was seen back in 2001-2002 or in Turkeyrsquos case TRY43$ We would of course be
delighted if EM currencies bounce back earlier than 2016-2017 and we should point out
that half of MSCI EM currencies are already cheaper than their 20-year average rates as
implied by our REER analysis For the long-term investor EM currencies on average are
at fair value in contrast to DM equities or bonds which are expensive relative to the long
term
A few EM currencies are already at or near their absolute lows compared to the past 20
years of history We think these should be seriously considered by EM investors lookingto take long positions either directly in FX or in equities and bonds
Colombia looks very attractive to us but perhaps investors will need to see proof that this
weaker currency is improving fundamentals Today the consensus on the current account
is only that it will improve from 6 of GDP in 2015 to 5 of GDP in 2016 ndash we expect
that will be too pessimistic
Taiwan with its cheap currency relative to the long-term average and a massive (12 of
GDP) CA surplus would also be attractive were it not for the competitive threat from
Japan which has a currency near its record weakest level
SA has a cheap currency near its absolute low (which we estimate at 152$) and which
might already be responsible for recently improved current account data Our only caveat
here is that the ZAR is a highly liquid EM proxy currency that could be driven weaker in
line with others such as the BRL but we would be supportive of investors taking long
0
1
2
3
4
5
6
0
10000
20000
30000
40000
5000060000
70000
1 9 9 0
1 9 9 1
1 9 9 2
1 9 9 3
1 9 9 4
1 9 9 5
1 9 9 6
1 9 9 7
1 9 9 8
1 9 9 9
2 0 0 0
2 0 0 1
2 0 0 2
2 0 0 3
2 0 0 4
2 0 0 5
2 0 0 6
2 0 0 7
2 0 0 8
2 0 0 9
2 0 1 0
2 0 1 1
2 0 1 2
2 0 1 3
FDI inflow to Brazil in $mn (lhs) and as of GDP (rhs)
FDI into Brazil ($m) FDI into Brazil of GDP
7252019 Thoughts From RenMan-280915(5)
httpslidepdfcomreaderfullthoughts-from-renman-2809155 1315
13
Renaissance Capital28 September 2015
Thoughts from a Renaissance man
positions in SA around current or weaker FX levels It is also worth noting that SArsquos equity
market outperformed EM in the Asian crisis of 1997-98 the tech bubble crash of 2000-01
and the global financial crisis of 2007-08 helped by its funds
The short side of the equation is Egypt ndash where a currency level around EGP98$ is justif ied today but where Gulf inflows could help the authorities resist this for some
time We would also recommend selling India which also happens to be a widely-
owned overweight in GEM funds as this currency is stronger than its long-term average
and it runs a current account deficit The other most vulnerable currency we think is
Perursquos for the same reasons
Elsewhere in EEMEA we see Poland Hungary and the Czech Republic as offering
low-risk alternatives Currencies are close to their 20-year average levels and current
accounts are healthy
Greece is slightly cheap but we donrsquot see that offsetting the problem of having a Syriza
government in power ndash which is likely to be unfriendly to portfolio investors in private
companies
Russiarsquos currency looks cheap to us too ndash at RUB65$ against the 20-year average of
RUB59$ ndash and is supported by a decent current account surplus
In the Gulf the UAE and Qatar have somewhat expensive currencies but these have
never been that volatile in 20 years In addition they have SWF reserves which we
estimate at over 300 and 100 of GDP respectively We doubt the currency regimes
will be altered in either so the main downside stems from the impact of budget cuts
The story for Frontier FX is very different Very few currencies have seen significant
depreciation Half are near the strongest levels they have ever been in REER terms
By far the best value from our perspective is now Kazakhstan ndash with a currency at its
absolute lows in a country that we expect to run a current account surplus in 2016 ndash see
our report Kazakhstanrsquos devaluation Implications for frontier currencies published 20
August 2015 In addition the government has a dynamic reform agenda that has been
likened to what Singapore has done in the past ndash see Kazakhstan Impressive reform plan
initiated published 9 July 2015
We also like the look of Morocco which has an enviable record of currency stability Like
South Africa equities may be relatively expensive to its peers but for a decent reason
assuming the currency is stable
Romania carries modest currency risk in our view but is inside the EU envelope which
offers some protection and has a healthy CA
We see risks being higher in Pakistan where a 15 devaluation to PKR120$ is
plausible and higher still in Bangladesh where history implies that fair value is
BDT100$ Vietnam is trading even further from long-term fair value and might also be
getting more vulnerable since its CA entered deficit territory in 1Q15
We always doubt Gulf currencies will move significantly but we are concerned by Oman
The 2008-2009 crisis hit that country hard reserves are far lower than in other countries
(Omanrsquos sovereign wealth fund would not cover a budget deficit on the scale of Saudirsquos
for even 12 months) and we think the currency looks expensive
The most vulnerable currencies of all according to this REER analysis are in Kenyarunning an estimated 10 of GDP current account deficit this year and Nigeria Their
current exchange rates look hard to justify if this REER analysis is valid (as noted above
7252019 Thoughts From RenMan-280915(5)
httpslidepdfcomreaderfullthoughts-from-renman-2809155 1415
14
Renaissance Capital28 September 2015
Thoughts from a Renaissance man
the IMF thinks not) Yvonne Mhango does expect depreciation to KES109 in 2015 and
KES115 in 2016 and NGN230 and NGN225 respectively for Kenya and Nigeria but
these Bruegel-derived REER calculations imply more than 30 deprecation risk above
those numbers
So our top picks in our universe would be Kazakhstan (in frontier) and SA (in EEMEA)
from a currency perspective
For currency trends to turn we need a change in fundamentals that we expect to see via
improved trade and CA numbers and a rise in FDI The latter is already picking up
sharply from China into Brazil Turkey and Russia We expect these trends will help re-
invigorate growth in EM from 2017-2018 and encourage investors to renew their interest
in the asset class
Figure 17 REER implied exchange rates for MSCI EM and some MSCI Frontier and Beyond Frontier countries
CurrentRate implied by
long-term average REER$ rate if REERfalls to lows
Date REERhit its low point
2015 CA ( GDP)
IMF April 2015forecasts
Bloomberg consensusforecasts (Sept 2015)
China 638 841 11 Apr-95 32 27India 661 782 100 Feb-96 -13 -11Indonesia 14684 14057 36071 Jun-98 -3 -24Korea 1193 1184 1819 Jan-98 71 79Malaysia 437 364 559 Dec-98 21 28Philippines 468 58 782 Feb-04 55 42Taiwan 331 292 346 Nov-09 124 139Thailand 363 381 543 Jan-98 44 45
Brazil 418 302 585 Oct-02 -37 -41Colombia 3117 2269 3103 Mar-03 -58 -58Chile 704 627 776 Jun-03 -12 -04Mexico 171 141 236 Mar-95 -22 -25Peru 322 333 371 Jul-07 -46 -4
Czech 242 27 403 Jan-95 16 07
Egypt 783 981 149 Dec-03 -33 -24Greece 089 085 098 Sep-00 14 02Hungary 279 285 384 Apr-95 33 48Poland 377 378 458 Nov-97 -18 -03Qatar 364 412 452 Aug-11 84 71Russia 665 59 114 Jan-99 54 49S Africa 139 102 152 Dec-01 -46 -44Turkey 306 287 426 Oct-01 -42 -5UAE 367 409 444 Aug-11 53 41
Argentina 94 519 108 Apr-14 -17 -15Bangladesh 777 992 117 Dec-06 -06 naGeorgia 238 237 392 Apr-95 -66 naKazakhstan 269 216 272 Oct-99 -19 -38Kenya 106 152 266 Jul-95 -77 -9Kuwait 03 035 042 Jun-95 157 126
Morocco 972 926 992 Aug-12 -34 -38Nigeria 199 285 618 Apr-95 07 -23Oman 039 044 049 Nov-07 -15 -85Pakistan 104 120 135 Sep-01 -13 -06Romania 394 449 935 Feb-97 -11 -1Sri Lanka 141 166 205 Jan-96 -2 -28Vietnam 22480 29114 35506 Jan-04 48 -05
Iran 29856 26224 60389 Jun-95 08 naSaudi Arabia 375 424 505 Mar-08 -1 -17Zambia 106 108 176 Dec-92 03 naNote More recent IMF CA forecasts include -06 for Zambia (June 2015) and -99 for Kenya (September 2015)
Source Bruegel Bloomberg IMF April World Economic Outlook Renaissance Capital
7252019 Thoughts From RenMan-280915(5)
httpslidepdfcomreaderfullthoughts-from-renman-2809155 1515
Renaissance CapitalMoscowT + 7 (495) 258 7777
Renaissance Capital LtdLondonT + 44 (203) 379 7777
Renaissance CapitalJohannesburgT +27 (11) 750 1400
Renaissance Securities (Cyprus)LtdNicosiaT + 357 (22) 505 800
Renaissance Securities (Nigeria) LtdLagosT +234 (1) 448 5300
Renaissance CapitalNairobiT +254 (20) 368 2000
Renaissance CapitalIstanbulT +90 (212) 362 3500
Renaissance CapitalDubaiT +971 (4) 409 2000
A complete set of disclosure statements associated with the issuers discussed in this report is available using the lsquoStock Finderrsquo or lsquoBond Finderrsquo for individualissuers on the Renaissance Capital Research Portal at httpresearchrencapcomengdefaultasp
This Communication is for information purposes only The Communication does not form a fiduciary relationship or constitute advice and is not and should not be construed asa recommendation or an offer or a solicitation of an offer of securities or related financial instruments or an invitation or inducement to engage in investment activity and cannotbe relied upon as a representation that any particular transaction necessarily could have been or can be effected at the stated price The Communication is not anadvertisement of securities nor independent investment research and has not been prepared in accordance with legal requirements designed to promote the independence ofinvestment research and is not subject to any prohibition on dealing ahead of the dissemination of investment research Opinions expressed therein may differ or be contrary toopinions expressed by other business areas or groups of the Renaissance Capital as a result of using different assumptions and criteria All such information is subject tochange without notice and neither Renaissance Capital nor any of its subsidiaries or affiliates is under any obligation to update or keep current the information contained in theCommunication or in any other medium
Descriptions of any company or issuer or their securities or the markets or developments mentioned in the Communication are not intended to be complete TheCommunication should not be regarded by recipients as a substitute for the exercise o f their own judgment as the Communication has no regard to the specific investmentobjectives financial situation or particular needs of any specific recipient The material (whether or not it states any opinions) is for general information purposes only and doesnot take into account your personal circumstances or objectives and nothing in this material is or should be considered to be financial investment or other advice on whichreliance should be placed Any reliance you place on such information is therefore strictly at your own risk The application of taxation laws depends on an investorrsquos individualcircumstances and accordingly each investor should seek independent professional advice on taxation implications before making any investment decision TheCommunication has been compiled or arrived at based on information obtained from sources believed to be reliable and in good faith Such information has not beenindependently verified is provided on an lsquoas isrsquo basis and no representation or warranty either expressed or implied is provided in relation to the accuracy completenessreliability merchantability or fitness for a particular purpose of such information except with respect to information concerning Renaissance Capital its subsidiaries andaffiliates All statements of opinion and all projections forecasts or statements relating to expectations regarding future events or the possible future performance ofinvestments represent Renaissance Capitalrsquos own assessment and interpretation of information available to them currently Any information relating to past performance of aninvestment does not necessarily guarantee future performance
The Communication is not intended for distribution to the public and may be confidential It may not be reproduced redistributed or published in whole or in part for anypurpose without the written permission of Renaissance Capital and neither Renaissance Capital nor any of its affiliates accepts any liability whatsoever for the actions of thirdparties in this respect The information may not be used to create any financial instruments or products or any indices Neither Renaissance Capital and its affiliates nor theirdirectors representatives or employees accept any liability for any direct or consequential loss or damage arising out of the use of all or any part of the Communication
copy 2015 Renaissance Securities (Cyprus) Limited All rights reserved Regulated by the Cyprus Securities and Exchange Commission (Licence No KEPEY 05304)
This research is for general information purposes only and should not be interpreted that Renaissance Capital is encouraging investment dealings ie buyingand selling securities in Iran Under US law ldquocriminal penalties for violations of the Iranian Transactions Regulations may result in a fine of up to $1000000 andnatural persons may be imprisoned for up to 20 yearsrdquo Under UK law criminal penalties for violating restrictions on investment in and certain financialtransactions with Iran may carry criminal penalties including up to 2 years in prison andor substantial fines
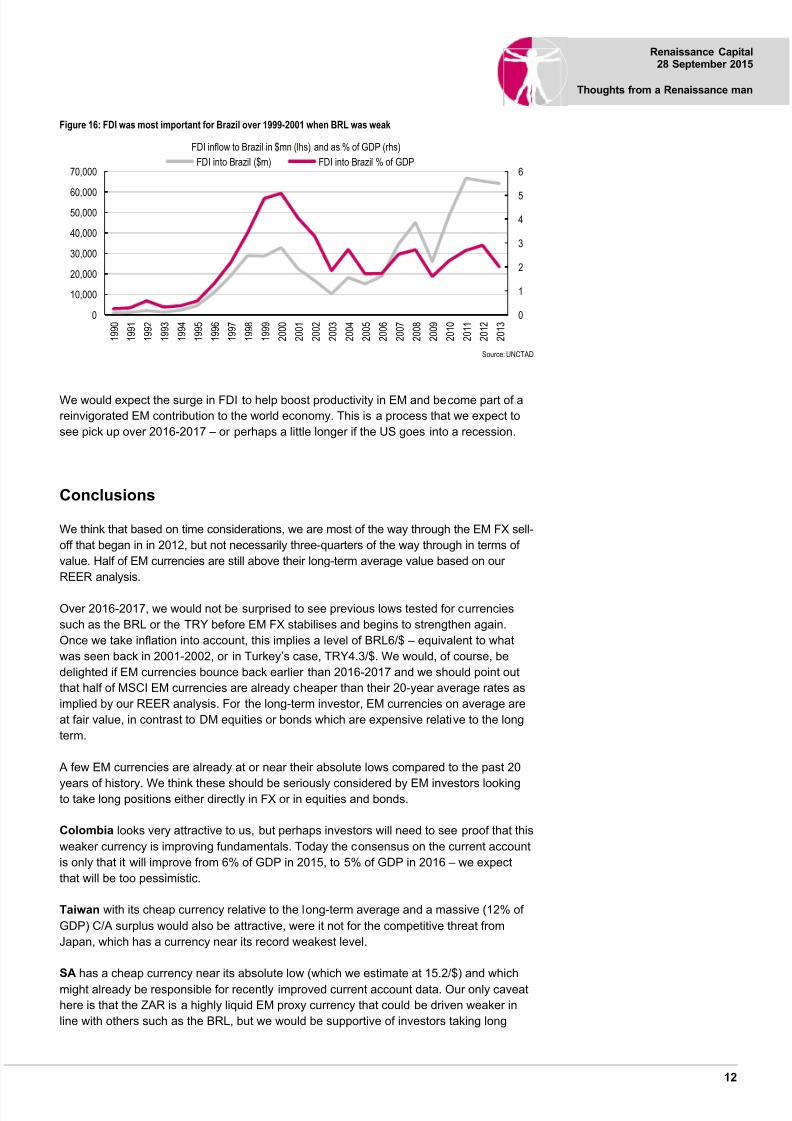
7252019 Thoughts From RenMan-280915(5)
httpslidepdfcomreaderfullthoughts-from-renman-2809155 1315
13
Renaissance Capital28 September 2015
Thoughts from a Renaissance man
positions in SA around current or weaker FX levels It is also worth noting that SArsquos equity
market outperformed EM in the Asian crisis of 1997-98 the tech bubble crash of 2000-01
and the global financial crisis of 2007-08 helped by its funds
The short side of the equation is Egypt ndash where a currency level around EGP98$ is justif ied today but where Gulf inflows could help the authorities resist this for some
time We would also recommend selling India which also happens to be a widely-
owned overweight in GEM funds as this currency is stronger than its long-term average
and it runs a current account deficit The other most vulnerable currency we think is
Perursquos for the same reasons
Elsewhere in EEMEA we see Poland Hungary and the Czech Republic as offering
low-risk alternatives Currencies are close to their 20-year average levels and current
accounts are healthy
Greece is slightly cheap but we donrsquot see that offsetting the problem of having a Syriza
government in power ndash which is likely to be unfriendly to portfolio investors in private
companies
Russiarsquos currency looks cheap to us too ndash at RUB65$ against the 20-year average of
RUB59$ ndash and is supported by a decent current account surplus
In the Gulf the UAE and Qatar have somewhat expensive currencies but these have
never been that volatile in 20 years In addition they have SWF reserves which we
estimate at over 300 and 100 of GDP respectively We doubt the currency regimes
will be altered in either so the main downside stems from the impact of budget cuts
The story for Frontier FX is very different Very few currencies have seen significant
depreciation Half are near the strongest levels they have ever been in REER terms
By far the best value from our perspective is now Kazakhstan ndash with a currency at its
absolute lows in a country that we expect to run a current account surplus in 2016 ndash see
our report Kazakhstanrsquos devaluation Implications for frontier currencies published 20
August 2015 In addition the government has a dynamic reform agenda that has been
likened to what Singapore has done in the past ndash see Kazakhstan Impressive reform plan
initiated published 9 July 2015
We also like the look of Morocco which has an enviable record of currency stability Like
South Africa equities may be relatively expensive to its peers but for a decent reason
assuming the currency is stable
Romania carries modest currency risk in our view but is inside the EU envelope which
offers some protection and has a healthy CA
We see risks being higher in Pakistan where a 15 devaluation to PKR120$ is
plausible and higher still in Bangladesh where history implies that fair value is
BDT100$ Vietnam is trading even further from long-term fair value and might also be
getting more vulnerable since its CA entered deficit territory in 1Q15
We always doubt Gulf currencies will move significantly but we are concerned by Oman
The 2008-2009 crisis hit that country hard reserves are far lower than in other countries
(Omanrsquos sovereign wealth fund would not cover a budget deficit on the scale of Saudirsquos
for even 12 months) and we think the currency looks expensive
The most vulnerable currencies of all according to this REER analysis are in Kenyarunning an estimated 10 of GDP current account deficit this year and Nigeria Their
current exchange rates look hard to justify if this REER analysis is valid (as noted above
7252019 Thoughts From RenMan-280915(5)
httpslidepdfcomreaderfullthoughts-from-renman-2809155 1415
14
Renaissance Capital28 September 2015
Thoughts from a Renaissance man
the IMF thinks not) Yvonne Mhango does expect depreciation to KES109 in 2015 and
KES115 in 2016 and NGN230 and NGN225 respectively for Kenya and Nigeria but
these Bruegel-derived REER calculations imply more than 30 deprecation risk above
those numbers
So our top picks in our universe would be Kazakhstan (in frontier) and SA (in EEMEA)
from a currency perspective
For currency trends to turn we need a change in fundamentals that we expect to see via
improved trade and CA numbers and a rise in FDI The latter is already picking up
sharply from China into Brazil Turkey and Russia We expect these trends will help re-
invigorate growth in EM from 2017-2018 and encourage investors to renew their interest
in the asset class
Figure 17 REER implied exchange rates for MSCI EM and some MSCI Frontier and Beyond Frontier countries
CurrentRate implied by
long-term average REER$ rate if REERfalls to lows
Date REERhit its low point
2015 CA ( GDP)
IMF April 2015forecasts
Bloomberg consensusforecasts (Sept 2015)
China 638 841 11 Apr-95 32 27India 661 782 100 Feb-96 -13 -11Indonesia 14684 14057 36071 Jun-98 -3 -24Korea 1193 1184 1819 Jan-98 71 79Malaysia 437 364 559 Dec-98 21 28Philippines 468 58 782 Feb-04 55 42Taiwan 331 292 346 Nov-09 124 139Thailand 363 381 543 Jan-98 44 45
Brazil 418 302 585 Oct-02 -37 -41Colombia 3117 2269 3103 Mar-03 -58 -58Chile 704 627 776 Jun-03 -12 -04Mexico 171 141 236 Mar-95 -22 -25Peru 322 333 371 Jul-07 -46 -4
Czech 242 27 403 Jan-95 16 07
Egypt 783 981 149 Dec-03 -33 -24Greece 089 085 098 Sep-00 14 02Hungary 279 285 384 Apr-95 33 48Poland 377 378 458 Nov-97 -18 -03Qatar 364 412 452 Aug-11 84 71Russia 665 59 114 Jan-99 54 49S Africa 139 102 152 Dec-01 -46 -44Turkey 306 287 426 Oct-01 -42 -5UAE 367 409 444 Aug-11 53 41
Argentina 94 519 108 Apr-14 -17 -15Bangladesh 777 992 117 Dec-06 -06 naGeorgia 238 237 392 Apr-95 -66 naKazakhstan 269 216 272 Oct-99 -19 -38Kenya 106 152 266 Jul-95 -77 -9Kuwait 03 035 042 Jun-95 157 126
Morocco 972 926 992 Aug-12 -34 -38Nigeria 199 285 618 Apr-95 07 -23Oman 039 044 049 Nov-07 -15 -85Pakistan 104 120 135 Sep-01 -13 -06Romania 394 449 935 Feb-97 -11 -1Sri Lanka 141 166 205 Jan-96 -2 -28Vietnam 22480 29114 35506 Jan-04 48 -05
Iran 29856 26224 60389 Jun-95 08 naSaudi Arabia 375 424 505 Mar-08 -1 -17Zambia 106 108 176 Dec-92 03 naNote More recent IMF CA forecasts include -06 for Zambia (June 2015) and -99 for Kenya (September 2015)
Source Bruegel Bloomberg IMF April World Economic Outlook Renaissance Capital
7252019 Thoughts From RenMan-280915(5)
httpslidepdfcomreaderfullthoughts-from-renman-2809155 1515
Renaissance CapitalMoscowT + 7 (495) 258 7777
Renaissance Capital LtdLondonT + 44 (203) 379 7777
Renaissance CapitalJohannesburgT +27 (11) 750 1400
Renaissance Securities (Cyprus)LtdNicosiaT + 357 (22) 505 800
Renaissance Securities (Nigeria) LtdLagosT +234 (1) 448 5300
Renaissance CapitalNairobiT +254 (20) 368 2000
Renaissance CapitalIstanbulT +90 (212) 362 3500
Renaissance CapitalDubaiT +971 (4) 409 2000
A complete set of disclosure statements associated with the issuers discussed in this report is available using the lsquoStock Finderrsquo or lsquoBond Finderrsquo for individualissuers on the Renaissance Capital Research Portal at httpresearchrencapcomengdefaultasp
This Communication is for information purposes only The Communication does not form a fiduciary relationship or constitute advice and is not and should not be construed asa recommendation or an offer or a solicitation of an offer of securities or related financial instruments or an invitation or inducement to engage in investment activity and cannotbe relied upon as a representation that any particular transaction necessarily could have been or can be effected at the stated price The Communication is not anadvertisement of securities nor independent investment research and has not been prepared in accordance with legal requirements designed to promote the independence ofinvestment research and is not subject to any prohibition on dealing ahead of the dissemination of investment research Opinions expressed therein may differ or be contrary toopinions expressed by other business areas or groups of the Renaissance Capital as a result of using different assumptions and criteria All such information is subject tochange without notice and neither Renaissance Capital nor any of its subsidiaries or affiliates is under any obligation to update or keep current the information contained in theCommunication or in any other medium
Descriptions of any company or issuer or their securities or the markets or developments mentioned in the Communication are not intended to be complete TheCommunication should not be regarded by recipients as a substitute for the exercise o f their own judgment as the Communication has no regard to the specific investmentobjectives financial situation or particular needs of any specific recipient The material (whether or not it states any opinions) is for general information purposes only and doesnot take into account your personal circumstances or objectives and nothing in this material is or should be considered to be financial investment or other advice on whichreliance should be placed Any reliance you place on such information is therefore strictly at your own risk The application of taxation laws depends on an investorrsquos individualcircumstances and accordingly each investor should seek independent professional advice on taxation implications before making any investment decision TheCommunication has been compiled or arrived at based on information obtained from sources believed to be reliable and in good faith Such information has not beenindependently verified is provided on an lsquoas isrsquo basis and no representation or warranty either expressed or implied is provided in relation to the accuracy completenessreliability merchantability or fitness for a particular purpose of such information except with respect to information concerning Renaissance Capital its subsidiaries andaffiliates All statements of opinion and all projections forecasts or statements relating to expectations regarding future events or the possible future performance ofinvestments represent Renaissance Capitalrsquos own assessment and interpretation of information available to them currently Any information relating to past performance of aninvestment does not necessarily guarantee future performance
The Communication is not intended for distribution to the public and may be confidential It may not be reproduced redistributed or published in whole or in part for anypurpose without the written permission of Renaissance Capital and neither Renaissance Capital nor any of its affiliates accepts any liability whatsoever for the actions of thirdparties in this respect The information may not be used to create any financial instruments or products or any indices Neither Renaissance Capital and its affiliates nor theirdirectors representatives or employees accept any liability for any direct or consequential loss or damage arising out of the use of all or any part of the Communication
copy 2015 Renaissance Securities (Cyprus) Limited All rights reserved Regulated by the Cyprus Securities and Exchange Commission (Licence No KEPEY 05304)
This research is for general information purposes only and should not be interpreted that Renaissance Capital is encouraging investment dealings ie buyingand selling securities in Iran Under US law ldquocriminal penalties for violations of the Iranian Transactions Regulations may result in a fine of up to $1000000 andnatural persons may be imprisoned for up to 20 yearsrdquo Under UK law criminal penalties for violating restrictions on investment in and certain financialtransactions with Iran may carry criminal penalties including up to 2 years in prison andor substantial fines
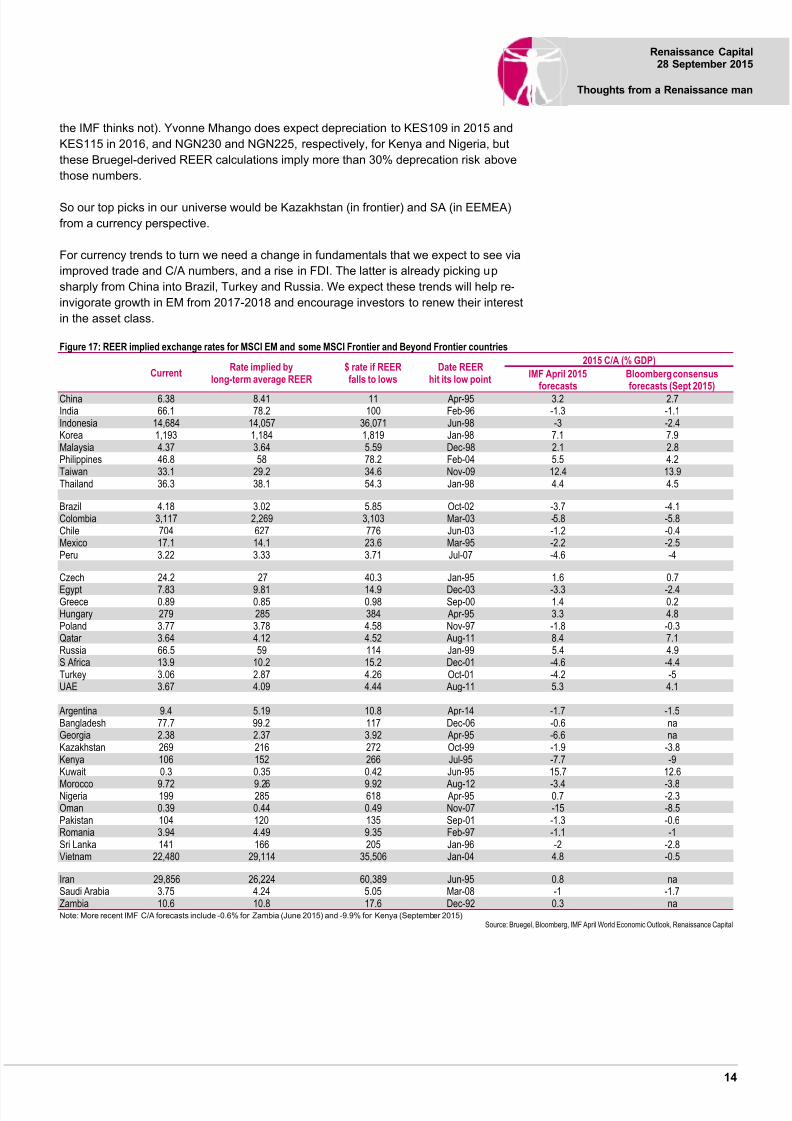
7252019 Thoughts From RenMan-280915(5)
httpslidepdfcomreaderfullthoughts-from-renman-2809155 1515
Renaissance CapitalMoscowT + 7 (495) 258 7777
Renaissance Capital LtdLondonT + 44 (203) 379 7777
Renaissance CapitalJohannesburgT +27 (11) 750 1400
Renaissance Securities (Cyprus)LtdNicosiaT + 357 (22) 505 800
Renaissance Securities (Nigeria) LtdLagosT +234 (1) 448 5300
Renaissance CapitalNairobiT +254 (20) 368 2000
Renaissance CapitalIstanbulT +90 (212) 362 3500
Renaissance CapitalDubaiT +971 (4) 409 2000
A complete set of disclosure statements associated with the issuers discussed in this report is available using the lsquoStock Finderrsquo or lsquoBond Finderrsquo for individualissuers on the Renaissance Capital Research Portal at httpresearchrencapcomengdefaultasp
This Communication is for information purposes only The Communication does not form a fiduciary relationship or constitute advice and is not and should not be construed asa recommendation or an offer or a solicitation of an offer of securities or related financial instruments or an invitation or inducement to engage in investment activity and cannotbe relied upon as a representation that any particular transaction necessarily could have been or can be effected at the stated price The Communication is not anadvertisement of securities nor independent investment research and has not been prepared in accordance with legal requirements designed to promote the independence ofinvestment research and is not subject to any prohibition on dealing ahead of the dissemination of investment research Opinions expressed therein may differ or be contrary toopinions expressed by other business areas or groups of the Renaissance Capital as a result of using different assumptions and criteria All such information is subject tochange without notice and neither Renaissance Capital nor any of its subsidiaries or affiliates is under any obligation to update or keep current the information contained in theCommunication or in any other medium
Descriptions of any company or issuer or their securities or the markets or developments mentioned in the Communication are not intended to be complete TheCommunication should not be regarded by recipients as a substitute for the exercise o f their own judgment as the Communication has no regard to the specific investmentobjectives financial situation or particular needs of any specific recipient The material (whether or not it states any opinions) is for general information purposes only and doesnot take into account your personal circumstances or objectives and nothing in this material is or should be considered to be financial investment or other advice on whichreliance should be placed Any reliance you place on such information is therefore strictly at your own risk The application of taxation laws depends on an investorrsquos individualcircumstances and accordingly each investor should seek independent professional advice on taxation implications before making any investment decision TheCommunication has been compiled or arrived at based on information obtained from sources believed to be reliable and in good faith Such information has not beenindependently verified is provided on an lsquoas isrsquo basis and no representation or warranty either expressed or implied is provided in relation to the accuracy completenessreliability merchantability or fitness for a particular purpose of such information except with respect to information concerning Renaissance Capital its subsidiaries andaffiliates All statements of opinion and all projections forecasts or statements relating to expectations regarding future events or the possible future performance ofinvestments represent Renaissance Capitalrsquos own assessment and interpretation of information available to them currently Any information relating to past performance of aninvestment does not necessarily guarantee future performance
The Communication is not intended for distribution to the public and may be confidential It may not be reproduced redistributed or published in whole or in part for anypurpose without the written permission of Renaissance Capital and neither Renaissance Capital nor any of its affiliates accepts any liability whatsoever for the actions of thirdparties in this respect The information may not be used to create any financial instruments or products or any indices Neither Renaissance Capital and its affiliates nor theirdirectors representatives or employees accept any liability for any direct or consequential loss or damage arising out of the use of all or any part of the Communication
copy 2015 Renaissance Securities (Cyprus) Limited All rights reserved Regulated by the Cyprus Securities and Exchange Commission (Licence No KEPEY 05304)
This research is for general information purposes only and should not be interpreted that Renaissance Capital is encouraging investment dealings ie buyingand selling securities in Iran Under US law ldquocriminal penalties for violations of the Iranian Transactions Regulations may result in a fine of up to $1000000 andnatural persons may be imprisoned for up to 20 yearsrdquo Under UK law criminal penalties for violating restrictions on investment in and certain financialtransactions with Iran may carry criminal penalties including up to 2 years in prison andor substantial fines