Embed Size (px)
Citation preview

2011
-1Sw
iss
Nati
onal
Ban
k W
orki
ng P
aper
sWhich Households Use Banks?Evidence from the Transition EconomiesThorsten Beck and Martin Brown

The views expressed in this paper are those of the author(s) and do not necessarily represent those of the Swiss National Bank. Working Papers describe research in progress. Their aim is to elicit comments and to further debate.
Copyright ©The Swiss National Bank (SNB) respects all third-party rights, in particular rights relating to works protectedby copyright (information or data, wordings and depictions, to the extent that these are of an individualcharacter).SNB publications containing a reference to a copyright (© Swiss National Bank/SNB, Zurich/year, or similar) may, under copyright law, only be used (reproduced, used via the internet, etc.) for non-commercial purposes and provided that the source is mentioned. Their use for commercial purposes is only permitted with the prior express consent of the SNB.General information and data published without reference to a copyright may be used without mentioning the source.To the extent that the information and data clearly derive from outside sources, the users of such information and data are obliged to respect any existing copyrights and to obtain the right of use from the relevant outside source themselves.
Limitation of liabilityThe SNB accepts no responsibility for any information it provides. Under no circumstances will it accept any liability for losses or damage which may result from the use of such information. This limitation of liability applies, in particular, to the topicality, accuracy, validity and availability of the information.
ISSN 1660-7716 (printed version)ISSN 1660-7724 (online version)
© 2011 by Swiss National Bank, Börsenstrasse 15, P.O. Box, CH-8022 Zurich

1
Which Households Use Banks?
Evidence from the Transition Economies
Thorsten Beck* and Martin Brown**
This draft: August 2010
Abstract: This paper uses survey data for 29,000 households from 29 transition economies to explore how the use of banking services is related to household characteristics, bank ownership structure and the development of the financial infrastructure. At the household level we find that the holding of a bank account or bank card increases with income, wealth and education in most countries and also find evidence for an urban-rural gap, as well as for a role of religion and social integration. Our results show that foreign bank ownership is associated with more bank accounts among high-wealth, high-income, and educated households. State ownership, on the other hand, does not induce financial inclusion of rural and poorer households. We find that higher deposit insurance coverage, better payment systems and creditor protection encourage the holding of bank accounts in particular by high-income and high-wealth households. All in all, our findings shed doubt on the ability of policy levers to broaden the financial system to disadvantaged groups. Keywords: Access to finance, Bank-ownership, Deposit insurance, Payment system, Creditor protection. JEL Codes: G2, G18, O16, P34 * Beck: CentER and EBC, Tilburg University and CEPR, [email protected]. **Brown: Swiss National Bank and CentER and EBC, Tilburg University, [email protected]. We are grateful to Ralph de Haas, Karolin Kirschenmann, Marta Serra-Garcia, Fabiana Penas, Franklin Steves, as well as seminar participants at Tilburg University for helpful comments. We also thank Ralph de Haas for sharing data. Any views expressed are those of the authors and do not necessarily reflect those of the Swiss National Bank.

2
1. Introduction
Access to banking services is viewed as a key determinant of economic well-being for
households, especially in low-income countries. Savings and credit products make it easier
for households to align income and expenditure patterns across time, to insure themselves
against income and expenditure shocks, as well as to undertake investments in human or
physical capital. Given the importance attributed to financial service access it is striking that
there is little cross-country evidence which documents how financial access differs across
households and, in particular how cross-country variation in the structure of the financial
sector affects the type of households which are banked.
This paper uses household survey data from 28 transition economies and Turkey from
the EBRD’s Life in Transition Survey (LITS) database to (i) document the use of formal
banking services across these 29 counties, (ii) relate this use to an array of household and
individual characteristics and (iii) assess whether specific ownership structures in the banking
sector and cross-country variation in financial infrastructure can explain who uses banking
services. The LITS database provides a rich set of information about a representative sample
of individuals across countries in Eastern and Central Europe, including information on the
use of bank accounts and bank cards. We relate variation in the use of formal banking
products to an array of individual and household characteristics and assess whether the
variation in the relationship between individual and household characteristics and the use of
formal banking services is associated with variation in bank-ownership and the development
of the financial infrastructure across countries.
The relationship between the ownership structure of the banking system and access to
financial services has been intensively discussed, both in the theoretical and empirical
literature. On the one hand, government-owned banks often have the mandate to increase
access to financial services by firms and households. On the other hand, foreign-owned banks

3
are often conjectured to have too centralized organizational structures and to be too risk-
averse to reach out towards the low-end of the market. While the recent literature has
explored the relationship between the ownership structure of banking markets and access to
credit by enterprises, little evidence exists on the relationship between ownership structure in
the banking system and the use of formal banking services by households.
Upgrades in the financial infrastructure have often been advocated as instruments to
not only deepen but also broaden financial systems. Deposit insurance has been mentioned as
a tool to create trust in the financial system, especially for “small” savers. Similarly,
improvements in payment systems and a broader physical outreach of the banking system, in
the form of ATMs and POS (points of sale) terminals and branches, can reduce the
geographic barrier that households might face when accessing banking services. Finally,
creditor protection through credit information sharing and creditor rights might reduce costs
and risks for banks to extend credit to larger segments of the population.
Transition economies are an almost ideal sample to study the relationship between
bank ownership, the financial infrastructure and household use of banking services. After the
fall of communism, all these countries had to transform their state-owned, mono-banking
systems into two-tier market-based financial systems.1 Countries, however, chose different
financial sector reform paths. 2
1 The state-bank systems before the transition had quite extensive networks with large shares of the population having savings accounts. However, besides the notable exceptions of the Czechoslovakia, Bulgaria and Hungary with high levels of financial intermediation there was little cross-country variation before the on-set of the transition process.
Some countries opted for domestic privately-owned banking
systems through privatization or the entry of new domestic players. Others opted for foreign
bank entry early on, be it through privatization or by encouraging greenfield entry (Claeys
and Hainz, 2008). Countries also moved at different speed in terms of upgrading payment
systems (Cirasino and Garcia, 2008) and institutional solutions to protect depositors, e.g.
deposit insurance (Demirguc-Kunt et al., 2005). Finally, the transition economies display
2 See Bonin and Wachtel (2003) for a survey of financial sector reforms in the transition economies.

4
substantial variation in the legislation and institutions introduced to protect creditors (Pistor et
al., 2000; Brown et al., 2009).
Our empirical analysis shows a large variation in the use of banking services.
Specifically, we find that more than 90% of households in Estonia and Slovenia have a bank
account, while less than 10% do so in Armenia, Azerbaijan, Georgia, Kyrgyzstan, Tajikistan
and Uzbekistan. We find that the use of banking services is more common among households
located in urban areas, households with higher income and wealth, as well as for households
in which an adult member has professional education and formal employment. By contrast,
banking products are used less often by households which rely on transfer income and by
Muslim households. We find evidence that foreign bank presence is positively associated
with the use of banking products among high-income and well-educated households, while
negatively associated with the use of banking products by households which rely on transfer
income. By contrast, we find no evidence that state-bank ownership leads to a broader use of
banking products among low-income or rural households. We also find that improvements in
the financial infrastructure, i.e. higher deposit insurance coverage, better payment system
development and stronger creditor protection , are associated mostly with higher use of
banking services among high-income and high-wealth households and not necessarily
members of marginal groups, such as the rural population or minorities.
This paper contributes to the nascent literature on household use of formal banking
services. Beck and Martinez Peria (2010) find a negative impact of foreign bank entry in
Mexico on branch penetration and the number of deposit and loan accounts. On a cross-
country level, Beck et al. (2007) find that government (foreign) ownership is negatively
associated with outreach as measured by branch penetration (number of accounts per capita) ,
while Beck et al. (2008) find that barriers for bank customers are higher where banking
systems are predominantly government-owned and lower where there is more foreign bank

5
participation. Recent household survey collection efforts in Southern and Eastern Africa
using FinScope surveys have allowed rigorous analysis of household’s use of formal and
informal services (see for example, Honohan and King, 2009; Beck et al., 2010; Atiero et al.,
2010). 3
We also contribute to the extensive literature on the relationship between bank
ownership structure and the use of banking services. This literature makes ambiguous
predictions, both for the effect of foreign bank and state bank ownership. Gerschenkron
(1962) claims that state-owned banks can overcome market failures and help channeling
funds to strategically important projects that are neglected by private financial institutions.
None of the previous literature, however, has used survey data for such a broad
cross-section of countries as the LITS data.
4
Similarly ambiguous predictions have been made about the effect of foreign bank
ownership. Studies of foreign bank entry in developing countries have indicated that local
profit motives are an important driving force for entry.
However, a large theoretical and empirical literature suggests mission drift by these banks
(La Porta et al., 2002), especially where political interference in the financial system is
rampant (Cole, 2009; Sapienza, 2004; and Khwaja and Mian, 2005).
5
3 There have been a series of country-level studies on Brazil, Mexico, and Romania, among others, over the past ten years. Most of these, however, use a sample that is geographically limited, even within the respective country. For a broader overview and discussion, see World Bank (2007).
This would suggest that foreign
banks are interested in offering services to a broader clientele (see, for example, Focarelli and
Pozzolo, 2001; Buch and DeLong, 2004; and Buch and Lipponer, 2004). However, the most
recent theoretical and empirical studies suggest that foreign banks tend to “cherry pick” (see,
for example, Detragiache et al. 2008; Gormley, 2010; and Mian, 2006), which would imply
that foreign bank penetration would be negatively related to the broader use of financial
4 Government-owned savings banks in Western Europe were often founded with the explicit goal of expanding access to formal banking services to low-income individuals and postal savings banks often achieve a large clientele (Baums, 1994; World Bank, 2006). 5 Earlier U.S. based studies on foreign bank entry in the 1980s suggest that foreign banks are not interested in offering services to the population at large but that they primarily “follow their clients” (see Goldberg and Saunders, 1981a,b; Cho et al., 1987; Hultman and McGee, 1989; and Goldberg and Grosse, 1994, among others).

6
services. Using firm-level data from Eastern and Central Europe Giannetti and Ongena
(2009) find that firms of all sizes benefit from foreign bank presence. Rueda Maurer (2008)
finds that larger companies report lower financing obstacles in transition countries with
higher foreign bank penetration, while small firms’ perceived financing obstacles do not vary
with ownership structure. De Haas and Naaborg (2005) find that while foreign banks in
Eastern and Central Europe initially focused on large corporates, they have increasingly gone
down-market in recent years. We add to this literature on the effect of bank ownership
structure by focusing on the use of banking services by individuals rather than enterprises.
Our paper is the first to our knowledge which examines how the quality of the
financial infrastructure and creditor protection affect the use of banking services at the
household-level. Evidence based on aggregate cross-country data suggests that generous
deposit insurance does not foster financial intermediation but increases the fragility of the
financial sector Cull et al. (2005). Concerning payment system development and physical
outreach of banks, Beck et al. (2007) show that firms’financing constraints are negatively
associated with larger physical bank networks, as measured by branches and ATMs. Cross-
country variation in information sharing and creditor rights have been related to aggregate
credit levels (Djankov et al. 2007) as well as to firms’ access to credit (Beck et al., 2004;
Love and Mylenko, 2003). With respect to transition countries Brown et al. (2009) show that
countries that established credit registries at an earlier stage have already seen a positive
impact on firm financing, by increasing availability and lowering cost, especially to more
opaque firms. Haselman and Wachtel (2007) show that banks in better functioning legal
environment more willing to lend to SMEs and to provide mortgages.
While this is the first paper documenting the use of banking services at the household-
level across transition economies and linking this to bank ownership and the financial
infrastructure, some words of caution are due. Given the cross-sectional nature of our data,

7
and the potential endogeneity of bank ownership and financial infrastructure, we are not able
to make causal inferences on the relationship between the structure of the banking system and
the level of use of banking services. At the country-level our analysis therefore focuses on
how bank ownership and financial infrastructure affects the composition of households which
are banked. Interacting country-level characteristics with individual and household
characteristics allows us to mitigate endogeneity concerns. Second, given the nature of the
survey, we have limited information on the different financial services used by individuals
and have to focus on bank accounts and bank cards. On the other hand, the survey does allow
us to correlate the use of these two principal financial products with an array of individual
and household characteristics.
The remainder of this paper is organized as follows. The next section introduces the
data and methodology. Section 3 presents the empirical results and section 4 concludes.
2. Data and Methodology
Our household-level data are taken from the EBRD-World Bank Life in Transition Survey
(LITS) implemented in 2006. The survey covers 29 countries including 28 transition
countries in which the EBRD operates and Turkey.6 In each country, 1,000 interviews were
conducted with randomly selected households, yielding a total of 29,000 observations. The
LITS dataset includes sampling weights to account for the differences in the ratio of sample
size to population size across countries, as well as for sampling biases within countries. We
use these weights when calculating summary statistics, as well as throughout our univariate
and multivariate analysis.7
6 The survey does not cover Turkmenistan.
The first part of the LITS questionnaire is conducted with the
household head and elicits information on household composition, housing, and expenses.
7 Details of the LITS methodology are available at http://www.ebrd.com/country/sector/econo/surveys/lits.htm.

8
The second part of the questionnaire is administered to one adult member of the household8
and yields information on that person’s attitudes and values, current economic activity, life
history, as well as personal information. We use information from the first part of the survey
to yield indicators of household use of banking services, location, income, and economic
activity. From the second part of the survey we yield indicators of education, current and
past employment status, nationality and religion Table 1 provides definitions, the sources and
summary statistics for all variables which we employ from the LITS.
Table 1 here
We employ two indicators of household use of banking services. The dummy variable
Account measures whether any member of the household has a bank account. The dummy
variable Card measures whether any member of the household has a bank (debit or credit)
card. Only 36 percent of surveyed households have a bank account while 31 percent have a
bank card. The use of bank accounts and bank cards are naturally highly correlated: 68
percent of households with a bank account also have a debit or credit card, and 81 percent of
households with a debit or credit card also have a bank account.
Table 2 shows that there is substantial variation in the use of banking services across
countries, with banked households much more common in Central Europe than in the CIS
countries. More than 75 percent of households in Croatia, the Czech Republic, Estonia,
Slovakia and Slovenia have a bank account, while less than 5 percent of households in
Armenia, Azerbaijan, Kyrgyzstan, Tajikistan and Uzbekistan do so. Table 2 also compares
our indicators of banking service use to existing aggregate measures of financial access from
the EBRD transition report (Credit / GDP), the World Bank- CGAP database on financial 8 The second part of the questionnaire was conducted with the adult household member with the most recent birthday. This implies that for 40% of the households two people (the household head and another adult member) were interviewed, while for 60% of the households one person was interviewed (the household head).

9
access (Savings accounts and Loan accounts in proportion to the population), and Honohan’s
(2008) estimates of the share of population that uses formal banking services. The country
means reported in panel A of the table suggest that the aggregate number of savings and loan
accounts may substantially overestimate the use of banking services at household level. For
example, the total number of accounts as reported by CGAP suggests that every second adult
person in Albania has a savings account with a bank. Our household data, by contrast shows
that less than one-fifth of the households in Albania have a bank account. Rank correlations
reported in panel B of the table suggest that our household-level indicators of bank use are
highly correlated with Credit / GDP and the Honohan composite indicator, but somewhat less
correlated with the more recently gathered measures of financial access.
Table 2 here
In the first step of our empirical analysis we relate our indicators of banking service
use Bh,c of household h in country c to characteristics of the household Xh controlling for
country level determinants with country-fixed effects c:
chhcch XB ,1, (1)
At the household-level we expect the use of banking services to be related to
household location, wealth, income and income sources. The dummy variable Urban captures
whether the household is located in an urban rather than a rural area. The dummy variable
Homeowner measures whether the household owns its dwelling and is our indicator of
household wealth. The variable Expenses is our measure of household income and measures
total household expenses in USD per year.9
9 Household expenses are measured according to the OECD household equivalized scale
In addition to our measures of income level we

10
use four dummy variables to capture the main source of household income; Self-employed
income, Capital income, and Transfer income, with Wage income as the reference category.10
We expect household use of banking service to be related to the respondent’s level of
education, current and past economic activity, religion and social integration. The dummy
variable Professional captures whether the respondent to the survey has professional training
or a tertiary-level degree. The variables Formal employed and State employed capture the
respondent’s most recent employment history, i.e. whether the respondent had a formal
employment contract or was employed by the government during the past 12 months. The
variable Worked indicates whether the respondent ever worked for wages after 1989. We use
two indicators of social integration: Minority captures whether the respondent belongs to a
national minority, while Language indicates whether (s)he speaks at least one official
language. The variable Muslim is a dummy variable indicating followers of Islam.
We expect that urban households and households with higher income and wealth are
more likely to use banking services. We expect that households, which had formal
employment in the past year, or where a family member worked for wages in the past, are
more likely to have a bank account, while we expect that households which rely on self-
employment and transfer income to be less likely to use banking services. Minority
households and households which do not speak an official language are hypothesized to be
less likely to have a bank account. We expect that Muslim households may be less likely to
use bank accounts for two reasons: First, these households may, for religious reasons choose
not to deal with non-Islamic financial institutions which demand and offer interest payments.
Second, in countries or regions where Muslims constitute a minority population they may
face discrimination by banks or their employees.
10 Capital income includes income from renting out real estate and as well as income from other assets. Transfer income covers both state and private (charity) transfers. Using separate dummy variables for these two transfer categories yields qualitatively similar findings.

11
In the second step of our analysis we examine how the structure of bank-ownership in
each country as well as the development of the financial infrastructure affect the use of
banking services across household types. Specifically, we focus on the interaction of four
indicators of bank-ownership as well as four indicators of the financial infrastructure with our
vector of household-level explanatory variables, controlling for level effects across countries
with country fixed effects.
chchCch ZXB ,h1, X* (2)
where Zc is one of eight country-level indicators.
We use four indicators of bank-ownership. Foreign banks and State banks measure
the share of banking assets controlled by foreign-owned and state-owned banks respectively
and are taken from the EBRD transition report. While in Turkey foreign banks had only 4
percent of total banking assets in 2003-2005, their market share was over 90 percent in
Croatia, Estonia, Lithuania and Slovak Republic. While there were no state-owned banks in
Armenia, Estonia, Georgia and Lithuania, their market share was 56% in Azerbaijan. Using
data from de Haas et al. (2010) we consider two separate categories of foreign banks, the
market share of Foreign greenfield banks and the share of Foreign takeover banks.11
We also employ four indicators of the financial infrastructure. First, we consider
Deposit insurance coverage as indicator of the financial safety net to assess whether the
While
the former are banks that were established anew by international banks, the latter are existing
banks that changed ownership through sale to international banks. In Estonia, international
banks only entered through takeovers, while 56 percent of foreign banks in Croatia are
greenfield and 39 percent takeover banks.
11 The sum of foreign greenfield and foreign takeover banks does necessarily add up to the share of all foreign banks, as the data come from two different data sources. The foreign bank variable is from the EBRD transition report and is based on the full sample of banks in each country. The foreign greenfield and foreign takeover variables are taken from the EBRD Banking Environment and Performance Survey (BEPS), which only covers a subsample of the banks in each country (de Haas et al, 2010)

12
degree to which depositors are insured is associated with differences in the composition of
the depositor population. This variable indicates the deposit insurance coverage relative to
GDP per capita and is from Demirguc-Kunt et al. (2005). Azerbaijan, Georgia, Moldova, and
Mongolia do not have an explicit deposit insurance (and therefore a value of zero), while
Macedonia has a value of 9.9. Turkey is the only country with unlimited deposit insurance
and we therefore set its value to 10. Second, we use an indicator of payment system
development and the physical outreach of the banking system, as captured by the number of
point of sales terminals (POS terminals) per one million inhabitants. This indicator is
measured for 2006 and taken from the World Bank’s Global Payment Survey (Cirasino and
Garcia, 2008). In Kyrgyzstan, there are 100 POS terminals per one million inhabitants, while
there are almost 18,000 in Turkey. 12
Based on the hypothesis that foreign banks cherry pick clients in host countries, we
expect that foreign bank ownership may encourage the use of banking services particularly
among urban, wealthy, formally employed, and professional households. This effect should
be more pronounced for foreign banks that are greenfield investments than for foreign banks
that were previously domestic, be it private or state-owned. By contrast, if state-owned banks
Third, we use an indicator of the information sharing
framework between banks. The variable Credit information is scaled between zero and six
and captures the extent to which borrower information is being collected and shared among
financial institutions. It ranges from zero in eight countries without credit registry to five in
Bosnia, Estonia, Hungary and Turkey. Finally, we use an indicator of the legal framework to
protect creditors. Creditor rights is an index the legal rights of secured creditors in- and
outside insolvency of a company and ranges from zero to ten. The index ranges from two in
Tajikistan to nine in Albania, Latvia, Montenegro, and Slovak Republic. Both indicators of
creditor protection are taken from the World Bank Doing Business database.
12 Given its skewed distribution, we use the log of this indicator in our empirical analysis.

13
contribute to a broader access of financial services we expect that rural households, lower-
income households, and the self-employed benefit in particular from state-bank presence.
Our predictions concerning the relation between our indicators of financial
infrastructure and the use of bank services are ambiguous. Low income and marginalized
population segments, including minorities, might be more likely to open bank accounts in
countries with a higher deposit insurance coverage. On the other hand, it might be richer,
wealthier and better educated segments of the population who are informed about deposit
insurance and are attracted to banks in countries with higher deposit insurance coverage.
Finally, too generous but incredible deposit insurance might also undermine trust in banks
(Cull et al., 2005). Better payment systems in the form of more POS terminals might entice
especially rural population and less wealthy segments of the population to use banking
services. On the other hand, it might be as well the richer, wealthier and more educated
segments who are more attracted to banks in countries with better physical access
possibilities.
We predict that in countries with better credit information sharing and creditor rights,
the costs and risk for banks to reach out to more marginal segments of the population might
be reduced. On the other hand, improved creditor protection may encourage those households
to open bank accounts which are more likely to use credit, i.e. households with wage income
and wealthier households which anticipate that they might require a consumer or mortgage
loan.
3. Results
A. Household determinants of the use of bank services
Table 3 reports univariate results for household determinants of banking service use: We
compare characteristics of those households with a bank account to those of households

14
without an account, as well as those with a bank card to those without a bank card. These
sub-sample comparisons confirm our main predictions. Households with a bank account or a
bank card are more often located in urban areas, have higher incomes, and more often have
professional training. Also as expected, households that use banking services are less often
self-employed, rely less on transfer income, belong less often to a minority, are more likely
to speak an official language, and are less likely to be Muslim. Perhaps surprisingly, users of
bank accounts and bank cards are less likely to be home owners. This may reflect the fact that
urban households which have more bank accounts are less likely to own their own house than
rural households.
Table 3 here
Many of the differences between households which use banking services and those that
do not are not only statistically, but also economically significant. For example, households
with a bank account have average household expenses of just over 3,400 USD per year
compared to just 1,306 USD for households without a bank account. In 63 percent of the
households with a bank account the responding adult has professional training, while 50
percent of these households have formal employment. The corresponding shares for
households without a bank account are just 44 percent and 26 percent, respectively. Further,
while only 8 percent of the households with a bank account are Muslim, this is the case for 30
percent of the households without a bank account.
While these univariate comparisons show a clear difference between the banked and the
unbanked population, many of the household and individual characteristics are strongly
correlated with each other. What then drives the use of banking services – income,
education, geography, societal status or religion? To answer this question, we next turn to

15
multivariate analysis. Table 4 displays marginal effects of probit estimates for the dependant
variables Account (columns 1-2) and Card (columns 3-4). The standard errors in each model
account for clustering at the country-level. For each dependent variable, we report first a
regression with household characteristics and country-fixed effects only, before adding
individual characteristics of the adult respondent in the household. The overall fit of our
model is reasonably good, with Pseudo R2 ranging from 0.37 to 0.44. While a large share of
this is due to country-fixed effects, regressions without the country-fixed effects yield Pseudo
R2 of at least 0.24.
Table 4 here
The Table 4 results show that the use of banking services is significantly related to
household location, income, wealth, economic activity and religion. The reported estimates in
columns (2) and (4) suggest that urban households are 5 percent more likely to have a bank
account and 8 percent more likely to have a bank card than rural households. Raising
household expenses by one standard deviation (2,331 USD) from the sample mean (2,570
USD) increases the probability of having a bank account by roughly 12 percent and that of
having a bank card by 10 percent. Homeowners are 3 percent more likely to have a bank
account, although they are not more likely to have a bank card. Households that rely on
transfer income are 11 percent (15 percent) less likely to have a bank account (card). After
controlling for household location and income, self-employed households are not less likely
to have a bank account than households with wage income. However, households which rely
on self-employment are less likely to have a bank card, suggesting that such products are
offered more to households with a formal income source.
16
Controlling for household income and economic activity, households with a professional
adult are 9 percent more likely to have a bank account and 5 percent more likely to have a
bank card, suggesting that literacy (and thus maybe also financial literacy) does affect bank
use. Households with an adult who has formal employment are 8 percent more likely to have
a bank account and bank card. Finally, our multivariate results suggest that there is a
significant impact of social status and religion on the use of banking services. Not speaking
the official language reduces the likelihood of having a bank account by 8 percent, while
being member of a national minority reduces the probability of having a bank card by 2
percent. Being a Muslim reduces the probability of having a bank account / card by 8 and 5
percent, respectively.
How robust are our household-level results across countries? To check the robustness of
our results we replicate model 2 in Table 4 for each country separately. The results displayed
in Table 5 suggest that the positive relation between the use of a bank account and household
income, household education or reliance on transfer income are highly robust. While we find
substantial variation in the economic magnitude of their effect, household Expenses yield a
highly significant coefficient in each of our country-specific regressions except for
Azerbaijan and Tajikistan.13 Our indicators of education (Professional) and Transfer income
are significant at the 10 percent level in 17 of the 29 regressions. By contrast, the effects of
household location (Urban), economic activity (Formal employed), wealth (Homeowner) and
religion (Muslim) are less robust across countries. 14
Table 5 here
13 The estimates for some countries are imprecise, due to the fact that the prevalence of bank accounts is either very low ( less than 10% in Armenia, Georgia, Kyrgyzstan, Moldova, Tajikistan, and Uzbekistan) or very high (more than 90% in Slovenia and Estonia) 14 Several of the variables are dropped from the probit regressions as they perfectly predict the outcome. We therefore re-run the regressions with OLS. This affects especially the estimates for the Muslim dummy, which is also negative and significant for Belarus, Estonia, Hungary, Kyrgyzstan, and Romania.

17
Interestingly, the negative coefficient for Muslims in our full sample is confirmed mainly
in the south-east European countries Bosnia, Macedonia and Montenegro which have
significant Muslim populations.15 We explore whether this negative effect of Muslim in
south-east Europe is demand driven, i.e. the disapproval of interest-bearing accounts or
conventional banks by practicing Muslims, or the result of supply constraints, such as
discrimination. In order to distinguish between these two explanations, we focus on Bosnia
and distinguish between the Serbian (Republika Srpska, RS) and the Croatian-Muslim part
(Federation, FBH) of the country.16
If the demand constraint is dominating, we should
observe a significant difference between Muslim and non-Muslim households in both parts of
Bosnia. If the supply constraint is dominating, we should observe a significant difference
between Muslims and non-Muslims in RS, but not in FBH. Univariate comparisons show
indeed no significant difference between Muslims and non-Muslims in FBH, while non-
Muslims are almost three times as likely to have a bank account as Muslims in RS (50% vis-
a-vis 17%). Multivariate regressions as in Tables 5 that control for our full set of individual
and household characteristics including income show that Muslims are 11 percent less likely
to have a bank account in FBH and 27 percent less likely to have a bank account in RS.
While this points to some demand constraints (as there is still a difference even in FBH),
supply constraints seem to feature prominently as can be seen by the much larger difference
between Muslim and non- Muslims in the use of bank accounts in RS.
B. Bank-ownership, financial infrastructure, and the use of banking services
15 Table 5 also reports a negative effect of Muslim for Poland and a positive effect for Bulgaria, but less than 1% of the surveyed polish households and only 11% of the Bulgarian households are Muslim. 16 Since the LITS survey data contains the primary sampling unit in which the households are located, we are able to assign households to different parts of Bosnia. Our sample contains 660 households in the Bosniak and 340 households in the Serbian part.

18
The results displayed in Table 5 show that the use of bank services across households
displays strong country-specific patterns. These differences in the composition of banked
households may be related to the large differences in economic development across our
sample of countries. They may however also be driven by differences in the ownership
structure of the banking sector as well as the financial infrastructure, which have been shown
to affect the level of financial outreach across countries Beck et al.(2007, 2008).
Our data confirms that the level of financial outreach across the transition economies is
also related to bank ownership and financial infrastructure. Figure 1 displays scatter-plots
relating the share of households with bank accounts by country to our country-level
indicators of bank ownership (Foreign banks, State banks) and the financial infrastructure
(Deposit insurance, POS terminals, Credit information, Creditor rights).17
The figure
suggests that the use of bank accounts is higher in countries with a stronger presence of
foreign-owned banks and lower in countries with a stronger presence of state-owned banks.
We also find a positive relationship between deposit insurance coverage and the use of bank
accounts, a relationship that is stronger if we exclude the two outliers Turkey and Macedonia.
Similarly, we find a strong positive relationship between the development of the payment
system (as measured by POS terminals per million inhabitants) and the share of households
with bank accounts. Finally, the graphs suggest a positive, though weak, relationship between
creditor rights and credit information sharing, on the one hand, and the share of households
with bank accounts, on the other hand.
Figure 1 here
17 Using the share of households with bank cards rather than bank accounts yields similar findings.
19
The objective of this study is to examine the composition of households which are
banked, rather than the level of financial outreach. In the following we therefore present
multivariate regressions in which we examine the interaction effects of our country-level
indicators of bank ownership (Table 6) and financial infrastructure (Table 7) with our
household-level explanatory variables. For each model reported in Table 6 and 7 we present
the main effects of our household-level explanatory variables in the first column and the
interaction terms of our country-level indicators with the household variables in the second
column. All models are estimated with OLS due to the difficulty of interpreting the marginal
effects of interaction terms in non-linear models (Ai and Norton, 2003). Our findings,
however, are confirmed when considering the coefficient estimates of probit models.
Examining the differential effects of our country-level variables rather than their level
effect mitigates the endogeneity issue inherent in our cross-sectional data. For example, it is
just as likely that the presence of foreign banks is be driven by the number of banked
households in a country, as that financial outreach is driven by the presence of foreign banks.
By contrast, while it is likely that cherry-picking foreign banks will increase the share of
wealthy, urban and professional households which have bank accounts, it is less plausible
that foreign bank entry is driven in by the share of such households which already have
accounts with a domestic bank. If anything, one would expect the opposite.
Table 6 here
Table 6 presents our analysis of how bank ownership is related to the use of bank services
by different household types. The results presented for model (1, 3, and 4) of the table
confirm our prediction that foreign banks may cherry-pick their clients among households in
the transition economies. In model (1) we find that Homeowners and households with higher

20
Expenses or a Professional adult are more likely to use bank accounts in countries with
stronger foreign bank presence. In line with these results households which rely on transfer
income are less likely to have a bank account in countries with stronger foreign bank
presence. The composition effect of foreign bank entry seems to be stronger for greenfield
foreign banks than for takeover foreign banks, as shown by models (3) and (4). We find that
homeowners and households with wage earners with state employment are more likely to
have a bank account in countries with a higher share of foreign greenfield banks, while
households relying on transfer income are less likely to use banking services. By contrast
foreign takeover banks only have a (weak) negative effect on households which rely on
transfer income.
The results for model (2) in table 4 do not support the conjecture that state banks
disproportionally benefit rural (rather than urban) or poorer households. In fact, our results
suggest that state-bank ownership has no impact at all on the composition of banked
households.
Table 7 here
The Table 7 regressions show a significant impact of financial infrastructure on the
composition of the banked population across countries. Column (1) shows that a higher
Deposit insurance coverage benefits mainly urban, high-wealth, high-income households and
households with capital income. The interaction effect of Deposit insurance with household
expenses is not only statistically, but also economically significant. Raising household
expenses by one standard deviation (2,331 USD) from the sample mean (2,570 USD)
increases the probability of having a bank account by 5.6 percent in a country with no deposit

21
insurance (e.g. Azerbaijan). By comparison, in a country like Poland with a deposit insurance
coverage of 5 times per capita GDP the same income increase would raise the probability of
having a bank account by 9.4 percent. Households that do not belong to a minority and speak
the official language are also more likely to have a bank account in countries with higher
deposit insurance coverage. These results suggest that higher deposit insurance coverage does
not help expand bank penetration to marginal or “small” savers, but rather benefits the better-
off and socially-integrated households.
The column (2) results show that a better development of the payment system, as
measured by the log of POS terminals per 1 million inhabitants, also encourages wealthier
and high-income households to use bank accounts. Payment system development further has
a stronger effect on bank use by households with a history of formal employment (Worked)
and a weaker effect on households which rely on transfer income.18
The column (3) results of Table 7 show that high-income households are more likely to
have a bank account in countries with more effective Credit information sharing. Also
recipients of transfer income are less likely to do so than wage earners. None of the other
interaction terms enter significantly. The column (4) results of Table 7, finally, show that
homeowners are more likely to use banking services in countries with better Creditor rights.
While households that belong to a minority are less likely to have a bank account, the results
in column (4) suggest that better creditor rights mitigate this effect. Better creditor rights
seem to encourage the use of banks more among households which speak the official national
language, than households that do not.
One concern with our results is that some of the ownership and regulatory variables
are highly correlated with GDP per capita and thus that the interaction terms with household
characteristics might therefore reflect the effect of economic development on the composition 18 Using ATMs per capita as an alternative indicator of payment system development, we find that homeowners are more likely to have a bank account in countries with higher ATM penetration, while the other interactions are not significant. Results are available on request.

22
of the banked population. Spearman rank correlations show that our indicators Foreign
banks (.45) and State banks (-.35), Deposit insurance (.42) and Credit information (.41) are
only moderately correlated with per capita GDP, while the correlation is particularly strong
for POS terminals (.75) and weak for Creditor rights (.00).
To disentangle the compositional effects of economic development from those of our
bank ownership and the financial infrastructure we re-run the regressions of Tables 6 and 7
including interaction terms of all household and individual characteristics with log GDP per
capita.19
Overall, the results in Table 6 and 7 suggest that bank ownership and the development
of the financial infrastructure have substantial compositional effects on the banked
population. Our results are consistent with hypotheses that see foreign banks catering more to
high-income households rather than broadening access. They are not consistent with
The results of these regressions confirm most of our findings, but do show a weaker
relation between foreign bank ownership, financial infrastructure and the holding of bank
accounts by high-income and wealthier households: We find that transfer recipients are less
likely to have a bank account in countries with more Foreign banks, while the interaction
term of Foreign banks with Homeowner, Expenses and Professional are no longer significant
once we control for the interactions with GDP per capita. We continue to find that a higher
Deposit insurance coverage encourages urban residents, and recipients of capital income to
use bank accounts, while it discourages minority households. Again, the interaction term with
Homeowner and Expenses are no longer significant once we control for the interactions with
GDP per capita. A better developed payments system (POS terminals) and the sharing Credit
information encourage richer households (as measured by Expenses) to use bank accounts,
By contrast, the interaction term between Creditor rights and homeownership is no longer
significant once we control for the interactions with GDP per capita.
19 We take the log of GDP per capita in US dollars averaged over 2003-2005 from the EBRD transition report. Results of these non-reported regressions are available on request.

23
hypotheses that see state bank ownership and financial infrastructure improvements
benefitting mainly previously unbanked groups. Higher deposit insurance coverage and
payment system development seem to mostly encourage higher-income segments of the
population to hold bank accounts.
4. Conclusions
This paper explores the characteristics of households which hold bank accounts and bank
cards in transition countries and relates the composition of the banked population across
countries to variations in bank ownership, deposit insurance, payment systems and creditor
protection. Using data across 28 transition economies and Turkey, we find a strong
correlation of household location, income level, economic activity, education and religion
and the use of bank accounts and bank cards. We find that households with higher wealth,
income, and education are more likely to hold bank accounts in countries with stronger
foreign bank presence. By contrast we find no evidence that state-bank ownership is
associated with financial inclusion of rural and poorer households. We find a strong effect of
deposit insurance coverage and payment system development on the composition of the
banked population, with higher income and wealthier segments benefiting more.
Our result on the distributional effects of foreign bank ownership on the use of bank
services, however, are also consistent with Beck and Martinez Peria (2010) who show for
Mexico a reorientation of foreign entrants towards urban and richer areas of the country. The
fact that foreign banks cater more towards households with higher incomes, higher education
and less reliant on transfer income might indicate that foreign banks see higher profitability
among these groups. Our finding that government ownership of banks is not associated with
cross-country variation in the use of banking services and does not benefit any specific group
is consistent with a large literature on the consequences of government ownership in banking.
24
Our results shed doubt on the ability of policy levers to broaden the financial system to
disadvantaged groups. Specifically, attempts to broaden the use of financial services through
state-owned banks and deposit insurance do not increase the likelihood that poorer, less
wealthy and socially less included segments of the population use formal financial services.
Similarly, a better contractual and information framework seems to benefit mostly the higher-
income and wealthy segments of the population, most likely by allowing the banks to
differentiate more carefully among potential clients. Our results do not imply that these
policies do not help broaden financial access rather that it is difficult to target them to certain
groups.
We see this study as a first attempt at documenting and exploring intra- and cross-country
variation in the use of financial services. As more household surveys become available, we
will be able to exploit time-series variation and thus address to a larger extent concerns of
endogeneity and omitted variable bias.

25
References Ai, Chunrong and Edward Norton. 2003. Interaction terms in logit and probit models. Economics Letters 80,123 Atiero, Reyes, Thorsten Beck and Leo Iacovone. 2010. Gender and finance in sub-Saharan Africa: are women disadvantaged? World Bank mimeo. Baums, Theodor. 1994. The German banking system and its impacts on corporate finance and governance. Economic Development Institute of the World Bank. Beck, Thorsten, Robert Cull, Michael Fuchs, Jared Getenga, Peter Gatere, John Randa, and Mircea Trandafir. 2010. Banking sector stability, efficiency and outreach in Kenya in: Christopher Adam, Paul Collier and Njuguna Ndung’u (Eds.): Kenya: Policies for Prosperity Beck, Thorsten and Maria Soledad Martinez Peria. 2010. Foreign bank entry and outreach: evidence from Mexico. Journal of Financial Intermediation 19, 52-73. Beck, Thorsten, Asli Demirgüç-Kunt, and Vojislav Maksimovic. 2004. Bank competition and access to finance: international evidence. Journal of Money, Credit and Banking 36, 627-48. Beck, Thorsten, Asli Demirguc-Kunt, and Maria Soledad Martinez Peria, 2007. Reaching out: access to and use of banking services around the world. Journal of Financial Economics 85, 234-66. Beck, Thorsten, Asli Demirguc-Kunt, and Maria Soledad Martinez Peria. 2008. Banking services for everyone? Barriers to bank access and use around the world. World Bank Economic Review 22, 397-430. Bonin, John and Paul Wachtel. 2003. Financial sector development in transition economies: lessons from the first decade. Financial Markets, Institutions and Instruments 12, 1-66. Brown, Martin, Tullio Jappelli, and Marco Pagano. 2009. Information sharing and credit: firm-level evidence from transition countries, Journal of Financial Intermediation 18, 151-172. Buch, Claudia and Gayle DeLong. 2004. Cross-border bank merger: what lures the rare animal? Journal of Banking and Finance 28, 2077-102. Buch, Claudia and Alexander Lipponer. 2004. FDI versus cross-border financial services: the globalization of German banks. Discussion Paper Series 1, Studies of the Economic Research Centre, No. 05. Cho, Kang Rae, Suresh Krishnan, and Douglas Nigh. 1987. The state of foreign banking presence in the United States. International Journal of Bank Marketing 5, 59-75. Cirasino Massimo and Jose Antonio Garcia. 2008. Measuring payment system development. World Bank Working Paper.

26
Claeys, Sophie and Christa Hainz. 2007 Acquisition versus greenfield: the impact of the mode of foreign bank entry on information and bank lending rates, Sveriges Riksbank Working Paper 210. Cole, Shawn. 2009. Fixing market failures or fixing elections? Agricultural credit in India. American Economic Journal: Applied Economics 1, 219-250. Cull, Robert, Lemma Senbet and Marco Sorge. 2005. Deposit insurance and financial development. Journal of Money, Credit, and Banking 37, 43-82. De Haas, Ralph and Ilko Naaborg. 2005. Does foreign bank entry reduce small firms’ access to credit? Evidence from European transition economies. DNB Working Paper No. 50. Demirguc-Kunt, Asli, Baybars Karacaovali, and Luc Laeven, 2005. Deposit insurance around the world : a comprehensive database, World Bank Policy Research Working Paper 3628. Detragiache, Enrica, Thierry Tressel, Poonam Gupta. 2008. Foreign banks in poor countries: theory and evidence. Journal of Finance 63, 2123-2160. Djankov, Simeon, Caralee McLiesh, and Andrei Shleifer. 2007. Private credit in 129 countries. Journal of Financial Economics 84, 299-329. European Bank for Reconstruction and Development. Various Years. Transition Report. London. Focarelli, Dario and Alberto Pozzolo. 2001. The patterns of cross-border bank mergers and shareholdings in OECD countries. Journal of Banking and Finance 25, 2305-37. Gerschenkron, Alexander. 1962. Economic Backwardness in Historical Perspective. A Book of Essays. Harvard University Press, Cambridge, MA. Gianneti, Mariassunta and Steven Ongena. 2009. Financial integration and enetrepreneurial activity: evidence from foreign bank entry in emerging markets. Review of Finance 13,181-223. Goldberg, Lawrence and Anthony Saunders. 1981a. The determinants of foreign banking activity in the United States. Journal of Banking and Finance 5, 17-32. Goldberg, Lawrence and Anthony Saunders. 1981b. The growth of organizational forms of foreign banks in the U.S.: a note. Journal of Money, Credit, and Banking 13, 365-74. Goldberg, Lawrence, Grosse, Robert. 1994. Location choice of foreign bank in the United States. Journal of Economics and Business 46, 367-79. Gormley, Todd. 2010. Banking competition in developing countries: does foreign bank entry improve credit access? Journal of Financial Intermediation 19, 26-51. Haselmann, Rainer and Paul Wachtel. 2007. Risk taking by banks in the transition countries. Comparative Economic Studies 49, 411-29.
27
Honohan, Patrick. 2008. Cross-country variation in household access to financial services. Journal of Banking and Finance 32, 2493-2500. Honohan, Patrick and Michael King. 2009. Cause and effect of financial access: cross-country evidence from the Finscope surveys. World Bank mimeo. Hultman, Charles W. and Randolph McGee. 1989. Factors affecting the foreign banking presence in the United States. Journal of Banking and Finance 13, 383-96. Khwaja, Asim Ijaz, and Atif Mian. 2005. Do lenders favor politically connected firms? Rent provision in an emerging financial market. Quarterly Journal of Economics 120, 1371-411. La Porta, Rafael, Florencio Lopez-de-Silanes, and Andrei Shleifer. 2002. Government ownership of commercial banks. Journal of Finance 57 , 265–301. Love Inessa and Nataliya Mylenko. 2003. Credit reporting and financing constraints. World Bank Policy Research Working Paper 3142. Mian, Atif. 2006. Distance constraints: the limits of foreign lending in poor economies. Journal of Finance 61, 1465-1505. Pistor, Katharina, Martin Raiser and Stanislaw Gelfer. 2000. Law and finance in transition economies. Economics of Transition 8, 325-68. Rueda-Maurer, Maria Clara. 2008. Foreign bank entry, institutional development and credit access: firm-level evidence from 22 transition countries. Swiss National Bank Working Paper 2008-4. Sapienza, Paola. 2004. The effects of government ownership on bank lending. Journal of Financial Economics 72, 357-384. World Bank. 2006. The Role of Postal Networks in Expanding Access to Financial Services. Washington, DC World Bank. 2007. Finance for All? Policies and Pitfalls in Expanding Access. Washington, DC

28
Var
iabl
e na
me
Def
initi
onSo
urce
Perio
dO
bser
vatio
nsM
ean
Std.
Dev
.M
inM
ax
Acc
ount
Dum
my=
1 if
a ho
useh
old
mem
ber h
as a
ban
k ac
coun
t, =0
oth
erw
iseLI
TS20
0628
980
0.36
0.48
01
Car
dD
umm
y=1
if a
hous
ehol
d m
embe
r has
a d
ebit
or c
redi
t car
d, =
0 ot
herw
iseLI
TS20
0628
977
0.30
0.46
01
Urb
anD
umm
y =1
if h
ouse
hold
live
s in
an u
rban
or m
etro
polit
an a
rea,
=0
othe
rwise
LITS
2006
2900
20.
570.
490
1
Hom
eow
ner
Dum
my
=1 if
hou
seho
ld o
wns
its d
wel
ling,
=0
othe
rwise
LITS
2006
2900
20.
890.
320
1
Expe
nses
Hou
seho
ld e
quiv
aliz
ed e
xpen
ses u
sing
OEC
D sc
ales
in U
SD p
er y
ear (
Log)
LITS
2006
2893
37.
480.
911.
010
.3
Self
empl
oyed
inco
me
Dum
my
=1 if
mai
n ho
useh
old
inco
me
sour
ce is
self-
empl
oym
ent o
r far
min
g, =
0 ot
herw
iseLI
TS20
0629
002
0.17
0.37
01
Cap
ital i
ncom
e D
umm
y =1
if m
ain
hous
ehol
d in
com
e so
urce
is in
com
e fr
om c
apita
l / re
nt, =
0 ot
herw
iseLI
TS20
0629
002
0.00
0.06
01
Tran
sfer
inco
me
Dum
my
=1 if
mai
n ho
useh
old
inco
me
sour
ce a
re st
ate
or p
rivat
e tra
nsfe
rs ,
=0 o
ther
wise
LITS
2006
2900
20.
330.
470
1
Prof
essio
nal
Dum
my=
1 if
resp
onde
nt h
as p
rofe
ssio
nal t
rain
ing
or d
egre
e, =
0 ot
herw
iseLI
TS20
0628
995
0.49
0.50
01
Form
al e
mpl
oyed
Dum
my
=1 if
resp
onde
nt h
ad fo
rmal
labo
r con
tract
in p
ast 1
2 m
onth
s , =
0 ot
herw
iseLI
TS20
0629
002
0.32
0.47
01
Stat
e em
ploy
edD
umm
y =1
if re
spon
dent
wor
ked
for a
stat
e co
mpa
ny o
r ins
titut
ion
in p
ast 1
2 m
onth
s , =
0 ot
herw
iseLI
TS20
0629
002
0.18
0.39
01
Wor
ked
Dum
my
=1 if
resp
onde
nt w
orke
d fo
r wag
es 1
989-
2005
, =0
othe
rwise
LITS
2006
2900
20.
640.
480
1
Min
ority
Dum
my
=1 if
resp
onde
nt is
per
ceiv
ed to
be
mem
ber o
f an
min
ority
, =0
othe
rwise
LITS
2006
2897
60.
110.
310
1
Lang
uage
Dum
my
=1 if
resp
onde
nt sp
eaks
an
offic
ial n
atio
nal l
angu
age
=0 o
ther
wise
LITS
2006
2897
20.
940.
230
1
Mus
limD
umm
y =1
if re
spon
dent
is m
uslim
, =0
othe
rwise
LITS
2006
2897
10.
220.
420
1
Cre
dit /
GD
P Pr
ivat
e cr
edit
in %
of G
DP
EBR
D20
03-2
005
2925
.913
.86.
660
.0
Savi
ng a
ccou
nts
Savi
ng a
ccou
nts i
n co
mm
erci
al b
anks
per
100
adu
ltsC
GA
P20
0918
144.
491
.411
.537
5.5
Loan
acc
ount
sLo
an a
ccou
nts i
n co
mm
erci
al b
anks
per
100
adu
ltsC
GA
P20
0913
42.6
30.0
2.5
102.
2
Com
posit
eC
ompo
site
inde
x of
acc
ess t
o fin
anci
al se
rvic
esH
onoh
an20
0827
41.7
28.5
1.0
97.0
Fore
ign
bank
sA
sset
s sha
re o
f for
eign
con
trolle
d ba
nks i
n do
mes
tic b
anki
ng sy
stem
, in
%.
EBR
D /B
CL
2003
-200
529
50.3
31.5
4.3
98.3
Fore
ign
gree
nfie
ldA
sset
s sha
re o
f for
eign
gre
enfie
ld b
anks
in d
omes
tic b
anki
ng sy
stem
, in
%.
dHFT
2004
2015
.416
.60.
056
.0
Fore
ign
take
over
Ass
ets s
hare
of f
orei
gn ta
keov
er b
anks
in d
omes
tic b
anki
ng sy
stem
, in
%.
dHFT
2004
2045
.234
.10.
099
.6
Stat
e ba
nks
Ass
ets s
hare
of s
tate
con
trolle
d ba
nks i
n do
mes
tic b
anki
ng sy
stem
, in
%.
EBR
D /B
CL
2003
-200
529
15.9
20.0
0.0
69.0
Dep
osit
insu
ranc
eD
epos
it in
sura
nce
cove
rage
/ pe
r cap
ita G
DP
DK
L20
0329
2.0
2.6
0.0
10.0
POS
term
inal
sPo
int o
f sal
e te
rmin
als p
er 1
mio
inha
bita
nts (
log)
GPS
S20
0626
7.7
1.4
4.6
9.8
Cre
dit i
nfor
mat
ion
Info
rmat
ion
shar
ing
inde
x, sc
ale
0-6
DB
2004
-200
527
2.5
1.9
0.0
5.0
Cre
dito
r rig
hts
Lega
l rig
hts i
ndex
for s
ecur
ed c
redi
tors
, sca
le 0
-10
DB
2004
-200
529
6.1
2.0
2.0
9.0
Sour
ces:
LITS
: EB
RD
Life
in T
rans
ition
surv
ey. E
BR
D: E
BR
D (2
009)
. DB
: ww
w.d
oing
busin
ess.o
rg. C
GA
P: w
ww
.cga
p.or
g/fin
anci
alin
dica
tors
. DK
L: D
emin
rgüc
-Kun
t, K
arac
aova
lli &
Lae
ven
(200
5). d
HFT
: De
Haa
s, Fe
reira
& T
aci (
2010
). H
onoh
an: H
onoh
an (2
008)
. BC
L: B
arth
, Cap
rio a
nd L
evin
e (2
009)
, 200
3 an
d 20
07 d
atas
ets.
GPS
S: G
loba
l Pay
men
t Sys
tem
s Sur
vey
(Cira
sino
and
Gar
cia,
200
8).
Hou
seho
ld-le
vel d
ata
(n=2
9'00
2)
Tab
le 1
. Var
iabl
e de
finiti
ons a
nd so
urce
s
Acc
ess t
o fin
ance
Ban
king
stru
ctur
e &
insti
tutio
ns
Hou
seho
ld c
hara
cter
istic
s
Acc
ess t
o fin
ance
Cou
ntry
-leve
l dat
a (n
= 2
9)
Res
pond
ent c
hara
cter
istic
s

29
Account Card Credit / GDP Saving accounts Loan accounts Composite(share) (share) (in %) (per 100 adults) (per 100 adults) (in %)
Albania 0.18 0.17 10 45 10 34Armenia 0.04 0.04 7 57 19 9Azerbaijan 0.01 0.02 8 70 . 17Belarus 0.15 0.23 14 . . 16Bosnia 0.40 0.29 17 38 34 17Bulgaria 0.18 0.41 35 199 46 56Croatia 0.80 0.75 60 . . 42Czech Rep 0.79 0.61 33 168 . 85Estonia 0.94 0.82 42 275 102 86Georgia 0.05 0.09 11 66 35 15Hungary 0.64 0.50 45 157 . 66Kazakhstan 0.11 0.12 28 . . 48Kyrgyzstan 0.02 0.01 7 11 3 1Latvia 0.65 0.63 53 122 69 64Lithuania 0.69 0.53 31 214 38 70Macedonia 0.20 0.14 21 130 96 20Moldova 0.09 0.11 22 . . 13Mongolia 0.32 0.10 29 194 27 25Montenegro 0.29 0.21 17 . . .Poland 0.66 0.43 29 153 . 66Romania 0.27 0.35 16 . 43 23Russia 0.31 0.21 24 . . 69Serbia 0.56 0.42 26 . . .Slovak Rep 0.79 0.48 32 . . 83Slovenia 0.97 0.75 49 139 . 97Tajikistan 0.01 0.01 16 . . 16Turkey 0.24 0.30 18 185 32 49Ukraine 0.15 0.18 27 376 . 24Uzbekistan 0.04 0.02 25 . . 16Mean 0.36 0.31 26 145 43 45
This panel reports means for each variable by country. The means for the variables Account and Card are adjusted forsampling weights in the LITS survey. Definitions and sources of the variables are provided in Table 1.
Table 2. Household use of banking services and access to finance
Panel A. Means by country

30
Account Card Credit / GDPSaving
accountsLoan
accounts CompositeAccount 1Card 0.8252* 1Credit / GDP 0.7622* 0.8531* 1Saving accounts 0.5944* 0.6573* 0.7902* 1Loan accounts 0.6014* 0.7063* 0.8182* 0.6573* 1Composite 0.7902* 0.9441* 0.8601* 0.7972* 0.6364* 1
Table 2. Household use of banking services and access to finance
Panel B. Rank correlations
This panel reports Spearman rank correlations between the country averages for each variable. * denotessignificance at the 0.05 level. The means for the variables Account and Card are adjusted for samplingweights in the LITS survey. Definitions and sources of the variables are provided in Table 1.

31
All
Hou
seho
lds
yes
noSa
mpl
e te
stye
sno
Sam
ple
test
Urb
an0.
600.
690.
55**
*0.
730.
54**
*H
omeo
wne
r0.
870.
830.
89**
*0.
810.
89**
*Ex
pens
es7.
538.
157.
18**
*8.
207.
23**
*Se
lf em
ploy
ed in
com
e0.
160.
120.
18**
*0.
110.
18**
*Ca
pita
l inc
ome
0.01
0.01
0.00
***
0.01
0.00
***
Tran
sfer
inco
me
0.34
0.25
0.39
***
0.19
0.41
***
Prof
essi
onal
0.51
0.63
0.44
***
0.64
0.45
***
Form
al e
mpl
oyed
0.35
0.50
0.26
***
0.56
0.26
***
Stat
e em
ploy
ed0.
190.
230.
17**
*0.
260.
16**
*W
orke
d0.
670.
760.
62**
*0.
780.
62**
*M
inor
ity0.
110.
090.
12**
*0.
090.
12**
*La
ngua
ge0.
940.
960.
93**
*0.
950.
94**
*M
uslim
0.22
0.08
0.30
***
0.09
0.28
***
Hou
seho
ld h
as b
ank
acco
unt
Hou
seho
ld h
as d
ebit
/ cr
edit
card
The
tabl
ere
ports
mea
nsfo
reac
hva
riabl
efo
rthe
full
sam
ple
asw
ella
sfo
rthe
sub-
sam
ples
ofho
useh
olds
with
and
with
outa
bank
acco
unt,
and
fort
hesu
b-sa
mpl
esof
hous
ehol
dsw
ithan
dw
ithou
tade
bit/
cred
itca
rd.A
llm
eans
are
adju
sted
fors
ampl
ew
eigh
ting
inth
eLI
TSsu
rvey
.The
Smpl
ete
sts
repo
rtsth
ere
sults
oflin
ear
inde
pend
ants
ampl
ete
sts
whi
chex
amin
ew
heth
erho
useh
old
char
acte
ristic
sdi
ffer
for
hous
ehol
dsw
ithan
dw
ithou
taba
nkac
coun
tord
ebit
/cre
ditc
ard.
***,
**,*
deno
tesi
gnifi
canc
eat
the
0.01
,0.0
5an
d0.
10-le
vel.
Def
initi
onan
dso
urce
sof
the
varia
bles
are
pro
vide
d in
Tab
le 1
.
Tab
le 3
. H
ouse
hold
det
erm
inan
ts o
f ban
king
serv
ices
- U
niva
riat
e te
sts

32
Dependant variableModel (1) (2) (3) (4)
Urban 0.0662*** 0.0542*** 0.0855*** 0.0787***[0.0161] [0.0157] [0.0141] [0.0144]
Homeowner 0.0308** 0.0251** 0.003 -0.001[0.0126] [0.0124] [0.0150] [0.0151]
Expenses 0.199*** 0.182*** 0.168*** 0.154***[0.0125] [0.0113] [0.00872] [0.00763]
Self employed income -0.016 0.035 -0.0760*** -0.0338*[0.0192] [0.0219] [0.0147] [0.0184]
Capital income 0.053 0.099 -0.0817** -0.049[0.0749] [0.0807] [0.0378] [0.0442]
Transfer income -0.166*** -0.113*** -0.195*** -0.148***[0.0288] [0.0296] [0.0110] [0.0135]
Professional 0.0864*** 0.0517***[0.0126] [0.0102]
Formal employed 0.0853*** 0.0849***[0.0181] [0.0181]
State employed -0.006 0.018[0.0122] [0.0137]
Worked 0.0310*** 0.012[0.0106] [0.0118]
Minority -0.021 -0.0229*[0.0161] [0.0120]
Language 0.0865*** 0.037[0.0278] [0.0352]
Muslim -0.0765*** -0.0500***[0.0207] [0.0189]
Method Probit Probit Probit ProbitPseudo R2 0.43 0.44 0.37 0.38Country fixed effects yes yes yes yes# Households 28,911 28,825 28,908 28,822# countries 29 29 29 29
Table 4. Household-level determinants of banking servicesThe dependent variables in this table are Account (models 1-2) and Card (models 3-4). All models report marginaleffects from probit estimations and include country fixed effects. Observations are weighted according to sampleweighting in the LITS survey. Standard errors are reported in brackets and are adjusted for clustering at the countrylevel. ***, **, * denote significance at the 0.01, 0.05 and 0.10-level. All variables are defined in Table 1.
Account Card

33
Expl
anat
ory
vari
able
:U
rban
Hom
eow
ner
Expe
nses
Tran
sfer
inco
me
Prof
essi
onal
Form
al e
mpl
oyed
Wor
ked
Lang
uage
Mus
limO
bs.
Pseu
do R
2Co
untr
yFu
ll sa
mpl
e0.
0542
***
0.02
51**
0.18
2***
-0.1
13**
*0.
0864
***
0.08
53**
*0.
0310
***
0.08
65**
*-0
.076
5***
2882
50.
44
Alb
ania
0.10
0***
0.05
10.
103*
**-0
.096
7***
0.11
1***
0.00
8-0
.031
-0.0
3799
70.
23
Arm
enia
-0.0
150.
0341
***
-0.0
080.
0224
**0.
007
-0.0
13-0
.162
954
0.22
Aze
rbai
jan
-0.0
01-0
.021
0.00
30.
007
-0.0
020.
007
-0.0
1673
30.
33
Bela
rus
0.02
5-0
.016
0.08
69**
*-0
.071
6**
0.03
6-0
.003
-0.0
290.
072
983
0.13
Bosn
ia0.
003
-0.1
13*
0.25
2***
-0.1
60**
*0.
054
0.16
6***
-0.0
17-0
.107
-0.1
61**
*97
10.
16
Bulg
aria
0.06
47**
0.08
56**
*0.
117*
**-0
.036
0.10
3***
-0.0
020.
039
-0.2
650.
108*
999
0.15
Croa
tia0.
0464
*0.
0837
*0.
0943
***
-0.1
06**
*0.
0877
***
0.08
20**
0.01
90.
144
-0.0
0397
50.
28
Czec
h Re
p0.
017
0.01
90.
150*
**-0
.278
***
0.03
40.
0773
*0.
0511
*99
10.
37
Esto
nia
0.03
20**
0.01
30.
0123
**-0
.032
8**
0.03
84**
*0.
020
0.00
50.
006
-0.5
7593
60.
28
Geo
rgia
0.00
8-0
.002
0.01
81**
*-0
.015
4**
0.00
758*
0.02
00.
001
0.00
494
40.
31
Hun
gary
0.06
70.
136*
*0.
199*
**-0
.245
***
0.23
2***
0.03
50.
131*
**99
70.
25
Kaza
khst
an-0
.002
-0.1
02**
0.05
82**
*0.
0616
*0.
0598
***
-0.0
390.
024
-0.0
18-0
.011
997
0.07
Kyrg
yzst
an-0
.002
0.00
00.
0060
0**
0.00
60.
0124
**0.
000
0.00
00.
0047
4*-0
.018
992
0.26
Latv
ia-0
.084
3**
-0.0
080.
279*
**-0
.011
0.11
0***
0.18
2***
0.07
00.
191*
**99
40.
28
Lith
uani
a-0
.050
0.02
50.
249*
**-0
.030
0.10
3**
0.09
29*
0.02
40.
182*
998
0.17
Mac
edon
ia0.
0585
*0.
023
0.18
5***
-0.0
698*
*-0
.023
0.05
70.
011
0.07
5-0
.094
8***
977
0.14
Mol
dova
0.03
95**
-0.0
310.
0440
***
0.00
40.
0583
***
0.03
3-0
.002
0.05
10**
*0.
098
995
0.16
Mon
golia
-0.0
040.
014
0.18
2***
-0.0
540.
120*
**0.
164*
**0.
019
-0.0
4399
90.
14
Mon
tene
gro
0.01
30.
048
0.18
6***
-0.2
03**
*0.
0609
*-0
.027
-0.0
54-0
.056
-0.0
751*
977
0.13
Pola
nd0.
156*
**0.
011
0.29
1***
-0.1
39**
*0.
0996
***
0.10
9**
0.02
2-0
.407
*99
90.
23
Rom
ania
0.21
4***
-0.0
580.
178*
**0.
025
0.04
50.
045
0.09
11**
*0.
063
997
0.22
Russ
ia0.
0626
*0.
028
0.15
0***
0.19
5***
0.07
31*
0.09
75**
-0.0
150.
010
-0.0
2210
000.
07
Serb
ia0.
036
0.09
10.
117*
**-0
.243
***
0.11
5***
0.13
0**
0.08
10*
0.05
8-0
.118
994
0.16
Slov
ak R
ep0.
0509
*0.
104
0.13
6***
-0.3
04**
*0.
019
0.05
50.
0565
*0.
298
988
0.32
Slov
enia
-0.0
168*
0.00
90.
0232
***
-0.0
520*
**0.
005
-0.0
090.
006
894
0.15
Tajik
ista
n0.
000
0.00
10.
001
-0.0
02-0
.002
0.00
019
60.
57
Turk
ey0.
140*
**0.
042
0.12
7***
0.02
80.
114
0.11
80.
009
0.18
9***
0.06
399
90.
12
Ukr
aine
-0.0
26-0
.044
0.08
70**
*-0
.082
2***
-0.0
02-0
.007
0.05
55**
0.02
3-0
.019
987
0.11
Uzb
ekis
tan
0.00
40.
0302
***
0.01
98*
-0.0
210.
014
0.00
70.
008
0.01
40.
002
998
0.08
This
tabl
ere
ports
mar
gina
leff
ects
ofse
lect
edho
useh
old-
leve
lexp
lana
tory
varia
bles
for
the
depe
nden
tvar
iabl
eAc
coun
tba
sed
onre
gres
sion
sby
coun
try.T
hees
timat
edpr
obit
mod
elfo
rea
chco
untry
isid
entic
alto
mod
el(2
)in
Tabl
e4
(exc
ludi
ngco
untry
fixed
effe
cts)
.Non
repo
rted
varia
bles
incl
uded
inea
chre
gres
sion
are
Self
empl
oyed
,Cap
itali
ncom
e ,St
ate
empl
oyed
and
Min
ority
.Obs
erva
tions
are
wei
ghte
dac
cord
ing
tosa
mpl
e w
eigh
ting
in th
e LI
TS su
rvey
. ***
, **,
* d
enot
e si
gnifi
canc
e at
the
0.01
, 0.0
5 an
d 0.
10-le
vel.
All
varia
bles
are
def
ined
in T
able
1.
Tab
le 5
. H
ouse
hold
-leve
l det
erm
inan
ts o
f Acc
ount
by
coun
try

34
Figu
re 1
. H
ouse
hold
use
of b
ank
acco
unts
, ban
k ow
ners
hip
and
finan
cial
infr
astr
uctu
reTh
isfig
ure
plot
sthe
coun
trym
ean
ofAc
coun
tag
ains
teac
hof
the
follo
win
gco
untry
-leve
lvar
iabl
es:F
orei
gnba
nks,
Stat
eba
nks,
Dep
osit
insu
ranc
e,PO
Ste
rmin
als,
Cre
dit i
nfor
mat
ion
and
Cre
dito
r rig
hts.
All
varia
bles
are
def
ined
in T
able
1.
ALB
AR
MA
ZE
BLR
BIH
BG
R
HR
VC
ZE
ES
T
GE
O
HU
N
KA
Z
KG
Z
LVA
LTU
MK
D
MD
AMN
G MN
E
PO
L
RO
MR
US
SR
B
SV
K
SV
N
TJK
TU
R
UK
R
UZB
R2=
0.3
20.2.4.6.81
Account (mean)
020
4060
8010
0F
orei
gn b
anks
ALB
AR
MA
ZE
BLR
BIH
BG
R
HR
VC
ZE
ES
T
GE
OHU
N
KA
Z
KG
Z
LVA
LTU
MK
D
MD
A
MN
GM
NE
PO
L
RO
MR
US
SR
B
SV
K
SV
N
TJK
TU
R
UK
R
UZB
R2=
0.1
1
0.2.4.6.81Account (mean)
020
4060
80S
tate
ban
ks
ALB
AR
MA
ZEBLR
BIH
BG
R
HR
VC
ZE
ES
T
GE
O
HU
N
KA
Z
KG
Z
LVA
LTU
MK
D
MD
A
MN
GM
NE
PO
L
RO
MR
US
SR
B
SV
K
SV
N
TJK
TU
R
UK
R
UZB
R2=
0.0
5
0.2.4.6.81Account (mean)
02
46
810
Dep
osit
insu
ranc
e
ALB A
RM
AZE
BLR
BIH
BG
R
HR
VC
ZE
ES
T
GE
O
HU
N
KA
Z
KG
Z
LVA
LTU
MK
D
MD
A
MN
G
PO
L
RO
MR
US
SR
B
SV
K
SV
N
TU
R
UK
R
R2=
0.6
3
0.51Account (mean)
46
810
PO
S te
rmin
als
ALB
AR
MA
ZE
BLR
BIH
BG
R
HR
VC
ZE
ES
T
GE
O
HU
N
KA
Z
KG
Z
LVA
LTU
MK
D
MD
A
MN
G
PO
L
RO
MR
US
SR
B
SV
K
SV
N
TU
R
UK
R
UZBR2=
0.2
2
0.2.4.6.81Account (mean)
01
23
45
Cre
dit i
nfor
mat
ion
ALB
AR
MA
ZE
BLR
BIH
BG
R
HR
VC
ZE
ES
T
GE
O
HU
N
KA
Z
KG
Z
LVA
LTU
MK
D
MD
A
MN
GM
NE
PO
L
RO
MR
US
SR
B
SV
K
SV
N
TJK
TU
R
UK
R
UZB
R2=
0.0
5
0.2.4.6.81Account (mean)
24
68
10C
redi
tor
right
s

35
Mod
el(1
)(2
)(3
)(4
)M
ain
effe
cts
Fore
ign
bank
s *
Mai
n ef
fect
sSt
ate
bank
s *
Mai
n ef
fect
sFo
reig
n gr
eenf
ield
*M
ain
effe
cts
Fore
ign
take
over
*U
rban
0.02
00.
000
0.02
92**
0.00
00.
031
0.00
10.
0361
*0.
000
[0.0
173]
[0.0
0028
6][0
.012
3][0
.000
444]
[0.0
196]
[0.0
0051
7][0
.019
9][0
.000
317]
Hom
eow
ner
-0.0
080.
0004
76*
0.02
60**
0.00
0-0
.003
0.00
157*
**0.
001
0.00
0[0
.012
6][0
.000
247]
[0.0
111]
[0.0
0029
9][0
.011
0][0
.000
414]
[0.0
168]
[0.0
0028
5]Ex
pens
es0.
0727
***
0.00
0710
*0.
119*
**-0
.001
0.12
6***
0.00
00.
101*
**0.
001
[0.0
194]
[0.0
0037
2][0
.017
2][0
.000
522]
[0.0
237]
[0.0
0071
1][0
.018
0][0
.000
449]
Self
empl
oyed
inco
me
0.04
04*
0.00
00.
009
0.00
10.
0606
**-0
.001
0.07
12**
-0.0
01[0
.021
2][0
.000
356]
[0.0
154]
[0.0
0051
6][0
.027
5][0
.001
00]
[0.0
319]
[0.0
0050
3]C
apita
l inc
ome
0.05
80.
000
0.02
00.
003
0.10
90.
001
0.01
60.
002
[0.1
12]
[0.0
0212
][0
.057
5][0
.002
30]
[0.0
793]
[0.0
0385
][0
.066
8][0
.001
89]
Tran
sfer
inco
me
0.03
6-0
.002
03**
*-0
.092
2***
0.00
1-0
.027
-0.0
0350
**-0
.017
-0.0
0144
*[0
.026
3][0
.000
570]
[0.0
297]
[0.0
0084
9][0
.039
0][0
.001
65]
[0.0
429]
[0.0
0080
0]Pr
ofes
sion
al0.
0300
**0.
0004
68*
0.05
81**
*0.
000
0.03
95**
*0.
001
0.05
39**
*0.
000
[0.0
125]
[0.0
0026
3][0
.013
2][0
.000
325]
[0.0
135]
[0.0
0084
7][0
.013
2][0
.000
234]
Form
al e
mpl
oyed
0.03
71*
0.00
00.
0759
***
-0.0
010.
0804
***
-0.0
010.
0476
*0.
000
[0.0
215]
[0.0
0035
2][0
.020
6][0
.000
560]
[0.0
254]
[0.0
0078
6][0
.023
7][0
.000
412]
Stat
e em
ploy
ed-0
.007
0.00
0-0
.014
0.00
0-0
.024
0.00
113*
*0.
002
0.00
0[0
.013
1][0
.000
290]
[0.0
130]
[0.0
0042
5][0
.014
9][0
.000
482]
[0.0
125]
[0.0
0034
9]W
orke
d0.
008
0.00
00.
0231
**0.
000
0.01
60.
001
0.03
50*
0.00
0[0
.010
2][0
.000
192]
[0.0
0950
][0
.000
274]
[0.0
108]
[0.0
0054
4][0
.017
3][0
.000
287]
Min
ority
-0.0
230.
000
-0.0
100.
000
0.00
6-0
.001
-0.0
210.
000
[0.0
152]
[0.0
0031
2][0
.012
5][0
.000
593]
[0.0
172]
[0.0
0099
7][0
.024
2][0
.000
451]
Lang
uage
0.03
30.
000
0.05
00.
000
0.06
53*
0.00
00.
0577
*0.
000
[0.0
277]
[0.0
0061
2][0
.029
7][0
.000
728]
[0.0
362]
[0.0
0144
][0
.031
8][0
.000
686]
Mus
lim-0
.012
-0.0
01-0
.049
6**
0.00
0-0
.057
2*0.
000
-0.0
557*
*0.
000
[0.0
165]
[0.0
0047
6][0
.022
8][0
.000
861]
[0.0
316]
[0.0
0123
][0
.024
2][0
.000
582]
Met
hod
OLS
OLS
OLS
OLS
R20.
480.
470.
440.
44Co
untr
y fix
ed e
ffec
tsye
sye
sye
sye
s#
Hou
seho
lds
28,8
2528
,825
19,8
5119
,851
# co
untr
ies
2929
2020
Tab
le 6
. Ban
k ow
ners
hip
and
bank
acc
ount
sTh
e de
pend
ent v
aria
ble
in th
is ta
ble
is A
ccou
nt.
All
mod
els r
epor
t est
imat
es fr
om O
LS re
gres
sion
s inc
ludi
ng c
ount
ry fi
xed
effe
cts.
Obs
erva
tions
are
wei
ghte
d ac
cord
ing
to sa
mpl
e w
eigh
ting
in th
e LI
TS su
rvey
. Sta
ndar
d er
rors
are
repo
rted
in b
rack
ets a
nd a
re a
djus
ted
for c
lust
erin
g at
the
coun
try le
vel.
***
, **,
* d
enot
e si
gnifi
canc
e at
the
0.01
, 0.0
5 an
d 0.
10-
leve
l. A
ll va
riabl
es a
re d
efin
ed in
Tab
le 1
.
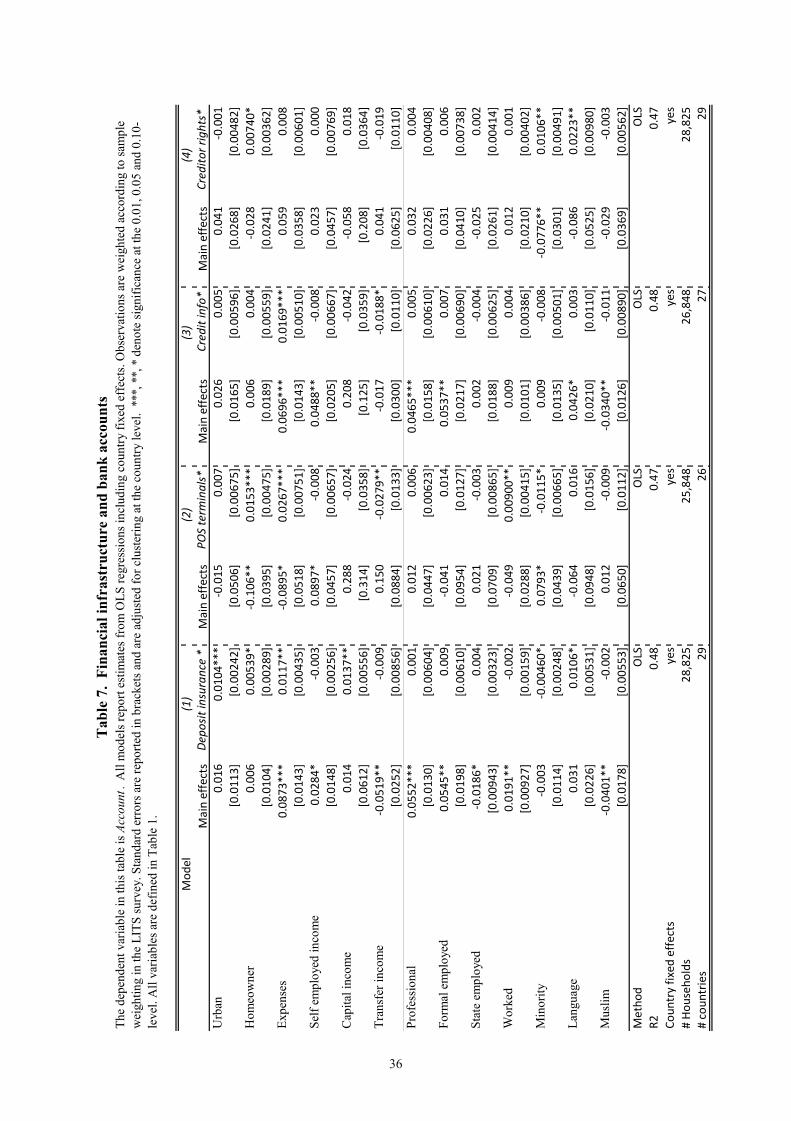
36
Mod
el(1
)(2
)(3
)(4
)M
ain
effe
cts
Dep
osit
insu
ranc
e *
Mai
n ef
fect
sPO
S te
rmin
als*
Mai
n ef
fect
sCr
edit
info
*M
ain
effe
cts
Cred
itor r
ight
s*U
rban
0.01
60.
0104
***
-0.0
150.
007
0.02
60.
005
0.04
1-0
.001
[0.0
113]
[0.0
0242
][0
.050
6][0
.006
75]
[0.0
165]
[0.0
0596
][0
.026
8][0
.004
82]
Hom
eow
ner
0.00
60.
0053
9*-0
.106
**0.
0153
***
0.00
60.
004
-0.0
280.
0074
0*[0
.010
4][0
.002
89]
[0.0
395]
[0.0
0475
][0
.018
9][0
.005
59]
[0.0
241]
[0.0
0362
]Ex
pens
es0.
0873
***
0.01
17**
-0.0
895*
0.02
67**
*0.
0696
***
0.01
69**
*0.
059
0.00
8[0
.014
3][0
.004
35]
[0.0
518]
[0.0
0751
][0
.014
3][0
.005
10]
[0.0
358]
[0.0
0601
]Se
lf em
ploy
ed in
com
e0.
0284
*-0
.003
0.08
97*
-0.0
080.
0488
**-0
.008
0.02
30.
000
[0.0
148]
[0.0
0256
][0
.045
7][0
.006
57]
[0.0
205]
[0.0
0667
][0
.045
7][0
.007
69]
Cap
ital i
ncom
e 0.
014
0.01
37**
0.28
8-0
.024
0.20
8-0
.042
-0.0
580.
018
[0.0
612]
[0.0
0556
][0
.314
][0
.035
8][0
.125
][0
.035
9][0
.208
][0
.036
4]Tr
ansf
er in
com
e-0
.051
9**
-0.0
090.
150
-0.0
279*
*-0
.017
-0.0
188*
0.04
1-0
.019
[0.0
252]
[0.0
0856
][0
.088
4][0
.013
3][0
.030
0][0
.011
0][0
.062
5][0
.011
0]Pr
ofes
sion
al0.
0552
***
0.00
10.
012
0.00
60.
0465
***
0.00
50.
032
0.00
4[0
.013
0][0
.006
04]
[0.0
447]
[0.0
0623
][0
.015
8][0
.006
10]
[0.0
226]
[0.0
0408
]Fo
rmal
em
ploy
ed0.
0545
**0.
009
-0.0
410.
014
0.05
37**
0.00
70.
031
0.00
6[0
.019
8][0
.006
10]
[0.0
954]
[0.0
127]
[0.0
217]
[0.0
0690
][0
.041
0][0
.007
38]
Stat
e em
ploy
ed-0
.018
6*0.
004
0.02
1-0
.003
0.00
2-0
.004
-0.0
250.
002
[0.0
0943
][0
.003
23]
[0.0
709]
[0.0
0865
][0
.018
8][0
.006
25]
[0.0
261]
[0.0
0414
]W
orke
d0.
0191
**-0
.002
-0.0
490.
0090
0**
0.00
90.
004
0.01
20.
001
[0.0
0927
][0
.001
59]
[0.0
288]
[0.0
0415
][0
.010
1][0
.003
86]
[0.0
210]
[0.0
0402
]M
inor
ity-0
.003
-0.0
0460
*0.
0793
*-0
.011
5*0.
009
-0.0
08-0
.077
6**
0.01
06**
[0.0
114]
[0.0
0248
][0
.043
9][0
.006
65]
[0.0
135]
[0.0
0501
][0
.030
1][0
.004
91]
Lang
uage
0.03
10.
0106
*-0
.064
0.01
60.
0426
*0.
003
-0.0
860.
0223
**[0
.022
6][0
.005
31]
[0.0
948]
[0.0
156]
[0.0
210]
[0.0
110]
[0.0
525]
[0.0
0980
]M
uslim
-0.0
401*
*-0
.002
0.01
2-0
.009
-0.0
340*
*-0
.011
-0.0
29-0
.003
[0.0
178]
[0.0
0553
][0
.065
0][0
.011
2][0
.012
6][0
.008
90]
[0.0
369]
[0.0
0562
]M
etho
dO
LSO
LSO
LSO
LSR2
0.48
0.47
0.48
0.47
Coun
try
fixed
eff
ects
yes
yes
yes
yes
# H
ouse
hold
s28
,825
25,8
4826
,848
28,8
25#
coun
trie
s29
2627
29
Tab
le 7
. Fi
nanc
ial i
nfra
stru
ctur
e an
d ba
nk a
ccou
nts
The
depe
nden
t var
iabl
e in
this
tabl
e is
Acc
ount
. A
ll m
odel
s rep
ort e
stim
ates
from
OLS
regr
essi
ons i
nclu
ding
cou
ntry
fixe
d ef
fect
s. O
bser
vatio
ns a
re w
eigh
ted
acco
rdin
g to
sam
ple
wei
ghtin
g in
the
LITS
surv
ey. S
tand
ard
erro
rs a
re re
porte
d in
bra
cket
s and
are
adj
uste
d fo
r clu
ster
ing
at th
e co
untry
leve
l. *
**, *
*, *
den
ote
sign
ifica
nce
at th
e 0.
01, 0
.05
and
0.10
-le
vel.
All
varia
bles
are
def
ined
in T
able
1.
Swiss National Bank Working Papers published since 2004: 2004-1 Samuel Reynard: Financial Market Participation and the Apparent Instability of
Money Demand 2004-2 Urs W. Birchler and Diana Hancock: What Does the Yield on Subordinated Bank Debt Measure? 2005-1 Hasan Bakhshi, Hashmat Khan and Barbara Rudolf: The Phillips curve under state-dependent pricing 2005-2 Andreas M. Fischer: On the Inadequacy of Newswire Reports for Empirical Research on Foreign Exchange Interventions 2006-1 Andreas M. Fischer: Measuring Income Elasticity for Swiss Money Demand: What do the Cantons say about Financial Innovation? 2006-2 Charlotte Christiansen and Angelo Ranaldo: Realized Bond-Stock Correlation:
Macroeconomic Announcement Effects 2006-3 Martin Brown and Christian Zehnder: Credit Reporting, Relationship Banking, and Loan Repayment 2006-4 Hansjörg Lehmann and Michael Manz: The Exposure of Swiss Banks to
Macroeconomic Shocks – an Empirical Investigation 2006-5 Katrin Assenmacher-Wesche and Stefan Gerlach: Money Growth, Output Gaps and
Inflation at Low and High Frequency: Spectral Estimates for Switzerland 2006-6 Marlene Amstad and Andreas M. Fischer: Time-Varying Pass-Through from Import
Prices to Consumer Prices: Evidence from an Event Study with Real-Time Data 2006-7 Samuel Reynard: Money and the Great Disinflation 2006-8 Urs W. Birchler and Matteo Facchinetti: Can bank supervisors rely on market data?
A critical assessment from a Swiss perspective 2006-9 Petra Gerlach-Kristen: A Two-Pillar Phillips Curve for Switzerland 2006-10 Kevin J. Fox and Mathias Zurlinden: On Understanding Sources of Growth and
Output Gaps for Switzerland 2006-11 Angelo Ranaldo: Intraday Market Dynamics Around Public Information Arrivals 2007-1 Andreas M. Fischer, Gulzina Isakova and Ulan Termechikov: Do FX traders in
Bishkek have similar perceptions to their London colleagues? Survey evidence of market practitioners’ views

2007-2 Ibrahim Chowdhury and Andreas Schabert: Federal Reserve Policy viewed through a Money Supply Lens
2007-3 Angelo Ranaldo: Segmentation and Time-of-Day Patterns in Foreign Exchange
Markets 2007-4 Jürg M. Blum: Why ‘Basel II’ May Need a Leverage Ratio Restriction 2007-5 Samuel Reynard: Maintaining Low Inflation: Money, Interest Rates, and Policy
Stance 2007-6 Rina Rosenblatt-Wisch: Loss Aversion in Aggregate Macroeconomic Time Series 2007-7 Martin Brown, Maria Rueda Maurer, Tamara Pak and Nurlanbek Tynaev: Banking
Sector Reform and Interest Rates in Transition Economies: Bank-Level Evidence from Kyrgyzstan
2007-8 Hans-Jürg Büttler: An Orthogonal Polynomial Approach to Estimate the Term
Structure of Interest Rates 2007-9 Raphael Auer: The Colonial Origins Of Comparative Development: Comment.
A Solution to the Settler Mortality Debate
2007-10 Franziska Bignasca and Enzo Rossi: Applying the Hirose-Kamada filter to Swiss data: Output gap and exchange rate pass-through estimates
2007-11 Angelo Ranaldo and Enzo Rossi: The reaction of asset markets to Swiss National
Bank communication 2007-12 Lukas Burkhard and Andreas M. Fischer: Communicating Policy Options at the Zero
Bound 2007-13 Katrin Assenmacher-Wesche, Stefan Gerlach, and Toshitaka Sekine: Monetary
Factors and Inflation in Japan 2007-14 Jean-Marc Natal and Nicolas Stoffels: Globalization, markups and the natural rate
of interest 2007-15 Martin Brown, Tullio Jappelli and Marco Pagano: Information Sharing and Credit:
Firm-Level Evidence from Transition Countries 2007-16 Andreas M. Fischer, Matthias Lutz and Manuel Wälti: Who Prices Locally? Survey
Evidence of Swiss Exporters 2007-17 Angelo Ranaldo and Paul Söderlind: Safe Haven Currencies
2008-1 Martin Brown and Christian Zehnder: The Emergence of Information Sharing in Credit Markets
2008-2 Yvan Lengwiler and Carlos Lenz: Intelligible Factors for the Yield Curve 2008-3 Katrin Assenmacher-Wesche and M. Hashem Pesaran: Forecasting the Swiss
Economy Using VECX* Models: An Exercise in Forecast Combination Across Models and Observation Windows
2008-4 Maria Clara Rueda Maurer: Foreign bank entry, institutional development and
credit access: firm-level evidence from 22 transition countries 2008-5 Marlene Amstad and Andreas M. Fischer: Are Weekly Inflation Forecasts
Informative? 2008-6 Raphael Auer and Thomas Chaney: Cost Pass Through in a Competitive Model of
Pricing-to-Market 2008-7 Martin Brown, Armin Falk and Ernst Fehr: Competition and Relational Contracts:
The Role of Unemployment as a Disciplinary Device 2008-8 Raphael Auer: The Colonial and Geographic Origins of Comparative Development 2008-9 Andreas M. Fischer and Angelo Ranaldo: Does FOMC News Increase Global FX
Trading? 2008-10 Charlotte Christiansen and Angelo Ranaldo: Extreme Coexceedances in New EU
Member States’ Stock Markets
2008-11 Barbara Rudolf and Mathias Zurlinden: Measuring capital stocks and capital services in Switzerland
2008-12 Philip Sauré: How to Use Industrial Policy to Sustain Trade Agreements 2008-13 Thomas Bolli and Mathias Zurlinden: Measuring growth of labour quality and the
quality-adjusted unemployment rate in Switzerland 2008-14 Samuel Reynard: What Drives the Swiss Franc? 2008-15 Daniel Kaufmann: Price-Setting Behaviour in Switzerland – Evidence from CPI
Micro Data
2008-16 Katrin Assenmacher-Wesche and Stefan Gerlach: Financial Structure and the Impact of Monetary Policy on Asset Prices
2008-17 Ernst Fehr, Martin Brown and Christian Zehnder: On Reputation: A
Microfoundation of Contract Enforcement and Price Rigidity

2008-18 Raphael Auer and Andreas M. Fischer: The Effect of Low-Wage Import Competition on U.S. Inflationary Pressure
2008-19 Christian Beer, Steven Ongena and Marcel Peter: Borrowing in Foreign Currency:
Austrian Households as Carry Traders
2009-1 Thomas Bolli and Mathias Zurlinden: Measurement of labor quality growth caused by unobservable characteristics
2009-2 Martin Brown, Steven Ongena and Pinar Ye,sin: Foreign Currency Borrowing by
Small Firms 2009-3 Matteo Bonato, Massimiliano Caporin and Angelo Ranaldo: Forecasting realized
(co)variances with a block structure Wishart autoregressive model 2009-4 Paul Söderlind: Inflation Risk Premia and Survey Evidence on Macroeconomic
Uncertainty 2009-5 Christian Hott: Explaining House Price Fluctuations 2009-6 Sarah M. Lein and Eva Köberl: Capacity Utilisation, Constraints and Price
Adjustments under the Microscope 2009-7 Philipp Haene and Andy Sturm: Optimal Central Counterparty Risk Management 2009-8 Christian Hott: Banks and Real Estate Prices 2009-9 Terhi Jokipii and Alistair Milne: Bank Capital Buffer and Risk
Adjustment Decisions
2009-10 Philip Sauré: Bounded Love of Variety and Patterns of Trade 2009-11 Nicole Allenspach: Banking and Transparency: Is More Information
Always Better?
2009-12 Philip Sauré and Hosny Zoabi: Effects of Trade on Female Labor Force Participation 2009-13 Barbara Rudolf and Mathias Zurlinden: Productivity and economic growth in
Switzerland 1991-2005 2009-14 Sébastien Kraenzlin and Martin Schlegel: Bidding Behavior in the SNB's Repo
Auctions 2009-15 Martin Schlegel and Sébastien Kraenzlin: Demand for Reserves and the Central
Bank's Management of Interest Rates 2009-16 Carlos Lenz and Marcel Savioz: Monetary determinants of the Swiss franc

2010-1 Charlotte Christiansen, Angelo Ranaldo and Paul Söderlind: The Time-Varying Systematic Risk of Carry Trade Strategies
2010-2 Daniel Kaufmann: The Timing of Price Changes and the Role of Heterogeneity 2010-3 Loriano Mancini, Angelo Ranaldo and Jan Wrampelmeyer: Liquidity in the Foreign
Exchange Market: Measurement, Commonality, and Risk Premiums 2010-4 Samuel Reynard and Andreas Schabert: Modeling Monetary Policy 2010-5 Pierre Monnin and Terhi Jokipii: The Impact of Banking Sector Stability on the
Real Economy 2010-6 Sébastien Kraenzlin and Thomas Nellen: Daytime is money 2010-7 Philip Sauré: Overreporting Oil Reserves 2010-8 Elizabeth Steiner: Estimating a stock-flow model for the Swiss housing market 2010-9 Martin Brown, Steven Ongena, Alexander Popov, and Pinar Ye,sin: Who Needs
Credit and Who Gets Credit in Eastern Europe? 2010-10 Jean-Pierre Danthine and André Kurmann: The Business Cycle Implications of
Reciprocity in Labor Relations 2010-11 Thomas Nitschka: Momentum in stock market returns: Implications for risk premia
on foreign currencies 2010-12 Petra Gerlach-Kristen and Barbara Rudolf: Macroeconomic and interest rate
volatility under alternative monetary operating procedures 2010-13 Raphael Auer: Consumer Heterogeneity and the Impact of Trade Liberalization:
How Representative is the Representative Agent Framework? 2010-14 Tommaso Mancini Griffoli and Angelo Ranaldo: Limits to arbitrage during the
crisis: funding liquidity constraints and covered interest parity 2010-15 Jean-Marc Natal: Monetary Policy Response to Oil Price Shocks 2010-16 Kathrin Degen and Andreas M. Fischer: Immigration and Swiss House Prices 2010-17 Andreas M. Fischer: Immigration and large banknotes 2010-18 Raphael Auer: Are Imports from Rich Nations Deskilling Emerging Economies?
Human Capital and the Dynamic Effects of Trade

2010-19 Jean-Pierre Danthine and John B. Donaldson: Executive Compensation: A General Equilibrium Perspective
2011-1 Thorsten Beck and Martin Brown: Which Households Use Banks? Evidence from the
Transition Economies

Swiss National Bank Working Papers are also available at www.snb.ch, section Publications/ResearchSubscriptions or individual issues can be ordered at Swiss National Bank, Fraumünsterstrasse 8, CH-8022 Zurich, fax +41 44 631 81 14, E-mail [email protected]