Embed Size (px)
Citation preview

Thornton Water Project Work Package 1
Pipeline Dewatering Quantity Baseline Report
City of Thornton
Windsor Segment, Project No. 12-777H3 and
Johnstown Segment, Project No. 12-777H4 BMcD Project No. 108405
Revision 1May 13, 2019

City of Thornton / Thornton Water Project Table of Contents
108405 / Work Package 1 Page-1 Burns & McDonnell
TABLE OF CONTENTS
Page No.
1.0 INTRODUCTION .................................................................................................. 11.1 Project Background and Description .......................................................................1
1.2 Report Purpose .........................................................................................................2
1.3 Trenchless Construction Coordination ....................................................................3
2.0 PROJECT GEOLOGY ......................................................................................... 52.1 Regional Geology ....................................................................................................5
2.2 Subsurface Investigation ..........................................................................................7
3.0 QUALITATIVE DEWATERING EVALUATION .................................................... 8
4.0 AQUIFER TESTING ........................................................................................... 124.1 Slug Testing ...........................................................................................................12
4.2 Aquifer Pumping Tests ..........................................................................................13
4.2.1 Cache La Poudre River Site ....................................................................13
4.2.2 Little Thompson River Site .....................................................................15
4.2.3 Aquifer Test Analysis .............................................................................16
4.2.4 Water Quality ..........................................................................................18
5.0 DEWATERING ESTIMATES.............................................................................. 195.1 Windsor Alignment ................................................................................................19
5.2 Johnston Alignment ...............................................................................................20
5.3 Limited Dewatering Classification ........................................................................22
6.0 REFERENCES ................................................................................................... 23
APPENDIX A – AQUIFER PUMPING TEST RESULTSAPPENDIX B – WATER QUALITY RESULTSAPPENDIX C – DEWATERING CALCULATIONS

City of Thornton / Thornton Water Project Table of Contents
108405 / Work Package 1 Page-2 Burns & McDonnell
LIST OF TABLES
Page No.
Table 4-1: Summary of Slug Test Hydraulic Conductivity Results ..............................................12
Table 4-2: Summary of Aquifer Test Water Level Conditions .....................................................15
Table 4-3: Summary of Aquifer Test Water Level Conditions .....................................................16
Table 4-4: Summary of Aquifer Test Results ................................................................................17
Table 4-5: Summary of Aquifer Test Results ................................................................................18
Table 5-1: Baseline Dewatering Estimate Windsor Alignment Stations 0+00 to 55+00 ..............20
Table 5-2: Baseline Dewatering Estimate Johnston Alignment Stations 155+00 to
165+00 ......................................................................................................................21
LIST OF FIGURES
Page No.
Figure 1-1 Windsor Segment Alignment .........................................................................................2
Figure 1-2 Johnstown Segment Alignment......................................................................................2
Figure 2-1 Surficial Geology Windsor Segment .............................................................................5
Figure 2-2 Surficial Geology Windsor Segment .............................................................................6
Figure 3-1 Qualitative Dewatering Evaluation Windsor Segment ..................................................9
Figure 3-2 Qualitative Dewatering Evaluation Johnstown Segment .............................................10
Figure 4-1 Pumping Water Level Response for Cache La Poudre Test Well ...............................15

City of Thornton / Thornton Water Project Pipeline Dewatering Quantity Baseline Report
108405 / Work Package 1 Page-1 Burns & McDonnell
1.0 INTRODUCTION
This document contains the Pipeline Dewatering Quantity Baseline Report (Report) for the Windsor and
Johnstown segments of the City of Thornton raw water pipeline (Figure 1-1 and 1-2, respectively). This
Report presents an interpretation of the data presented in the project Geotechnical Data Report (GDR),
developed by Kumar & Associates, Inc. (Kumar and Associates), as applied to the need for construction
dewatering along the two pipeline segments. The dewatering evaluation presented in the Report is only
applicable for open-cut trench installations that will be constructed within the unconsolidated materials
along the pipeline route. Coordination with the project Geotechnical Baseline Reports (GBRs),
developed by Brierly Associates, is required for pipeline installation where trenchless construction is
specified. The dewatering baseline statements contained in this Report are presented in bold, italic font.
In case of conflict between this Report and the GBR, the GBR has a higher order of precedence, meaning
that in the event of a conflict between these two documents the GBR discussions represent the controlling
characterization of ground conditions.
1.1 Project Background and Description
The Thornton Water Project is a proposed program of various water infrastructure improvements
including an approximately 76-mile raw water transmission waterline. Installations are to be located
within Larimer, Weld, and Adams Counties. The Project will convey raw water owned by the City of
Thornton (Thornton), south, from the Water Supply and Storage Company to Thornton. This project will
help to meet the City of Thornton’s future potable water demand projections.
Thornton has engaged Burns & McDonnell (BMcD) to design Work Package 1 associated with the
transmission waterline. Work Package 1 includes two (2) separate sections of a 48-inch transmission
waterline totaling approximately seven (7) miles. One approximate 3.5-mile segment is located within the
jurisdiction of the Town of Windsor, Colorado (Windsor Segment). The other approximate 3.5-mile
segment is located within the jurisdiction of the Town of Johnstown, Colorado (Johnstown Segment). The
two waterline segments are not continuous, they are separated by approximately 6.2 miles. Figure 1-1 and
Figure 1-2 show the general alignment of the two waterline sections.

City of Thornton / Thornton Water Project Pipeline Dewatering Quantity Baseline Report
108405 / Work Package 1 Page-2 Burns & McDonnell
Figure 1-1 Windsor Segment Alignment
Figure 1-2 Johnstown Segment Alignment
1.2 Report Purpose
The purpose of this Report is to present an interpretive summary of the data presented in the project GDR
(Kumar & Associates, 2018), as applied to the need for open-cut construction dewatering along the
Windsor and Johnstown segments of the City of Thornton raw water pipeline (Figure 1-1 and 1-2,
respectively). The Report provides an interpretation of the data reported in the GDR and an analysis of
those data to develop baseline estimates for construction dewatering needs along both pipeline segments.
The dewatering evaluation presented in this Report is only applicable for open-cut trench installations that
will be constructed within the unconsolidated materials along the pipeline route. This Report does not
evaluate the need for construction dewatering associated with the portions of the pipeline alignment
City of Thornton / Thornton Water Project Pipeline Dewatering Quantity Baseline Report
108405 / Work Package 1 Page-3 Burns & McDonnell
where trenchless construction is required, where both tunnels and shafts are required. Coordination of
baseline dewatering estimates for trenchless construction are discussed in Section 1.3.
The interpretive discussions contained within this Report are intended to establish baseline conditions for
dewatering in portions of the pipeline where open-cut trench installation is expected and presents a
summary of anticipated groundwater conditions in these portions of the alignment. Although alternative
interpretations for ground conditions are possible and this Report is not a guarantee, it does provide a
basis for resolving allegations of differing site conditions encountered during construction. The
Contractor's basis of bid and contracting with regards to expectations of the open-cut dewatering work,
requirements of such work, including all materials, labor, equipment, and work required and subsequent
cost shall be as presented in this Report.
1.3 Trenchless Construction Coordination
Trenchless construction is required for pipeline installation at two (2) locations for Windsor alignment
and six (6) locations for Johnstown alignment, which are shown on the Contract Drawings. Anticipated
groundwater conditions for the pipeline alignment areas where trenchless construction is required are
presented in the project GBRs, prepared by Brierly Associates (Brierly Associates, 2018a and 2018b).
Separate GBRs have been prepared for the Johnstown and Windsor pipeline segments and are included in
the Contract Drawings and Specifications. As discussed in the GBRs, watertight shafts are required at the
Little Thompson and Poudre River trenchless crossings. Watertight shafts are likely to consist of sheet
piles with tight interlocks (grouted as necessary), secant pile drilled shafts, jet grout, slurry walls, or
frozen ground. The bottom of the watertight shafts must be designed for stable shaft bottoms and
watertight floors that account for bottom instability, including boiling subgrades. Shaft bottoms may
consist of concrete installed in the wet or on frozen or jet grout or other adequate methods. Two shafts
will be required for each of the trenchless crossings.
For the Johnstown segment, trenchless construction is required at the following locations:
• WCR 13/Colorado Boulevard;
• Colorado Boulevard;
• Great Northern Railroad;
• Hillsborough Ditch Crossing #1;
• Little Thompson River; and
• Hillsborough Ditch Crossing #2.

City of Thornton / Thornton Water Project Pipeline Dewatering Quantity Baseline Report
108405 / Work Package 1 Page-4 Burns & McDonnell
For the Windsor segment, trenchless construction is required at the following locations:
• Highway 392 Crossing; and
• Cache la Poudre River Crossing.

City of Thornton / Thornton Water Project Pipeline Dewatering Quantity Baseline Report
108405 / Work Package 1 Page-5 Burns & McDonnell
2.0 PROJECT GEOLOGY
2.1 Regional Geology The geology along the Johnstown and Windsor segments of the pipeline route is comprised of relatively
thin surficial deposits underlain by bedrock consisting of claystone, siltstone, sandstone, or shale. The
location and nature of the soils and bedrock likely to be encountered by the pipeline corridors are shown
in Figure 2-1 and Figure 2-2.
Figure 2-1 Surficial Geology Windsor Segment
The geologic map referenced in Figures 2-1 is U.S. Geological Survey Geologic Investigations Series I-
855-G, Geologic Map of the Boulder-Fort Collins-Greeley area, Colorado (Colton, R.B., 1978). Based
on geologic maps of the area (Colton, R.B., 1978), the Windsor pipeline segment geology includes:
• Post-Piney Creek alluvium deposited in the Holocene that is composed of dark gray humic, sandy
to gravelly alluvium containing scattered plant remains. This alluvium is typically adjacent to
City of Thornton / Thornton Water Project Pipeline Dewatering Quantity Baseline Report
108405 / Work Package 1 Page-6 Burns & McDonnell
flood plains of streams and terraces that are less than 10 feet above stream level. In some
instances, the alluvium can be underlain by alluvial gravel with a thickness of 5 to 15 feet. The
bedrock that underlays the surficial deposits is the interbedded claystone, siltstone and sandstone
of the undifferentiated, Upper Cretaceous age Denver and Arapahoe formation.
• Pierre Shale (Upper Transition Member): Friable sandstone, soft shaley sandstone containing
thin-bedded sandy shale.
• Eolium – Light Light-brown to reddish-brown to olive-gray deposits of windblown clay, silt,
sand, and granules (generally referred to as loess). Loess is as much as 15 feet thick but generally
is less than 3 feet thick.
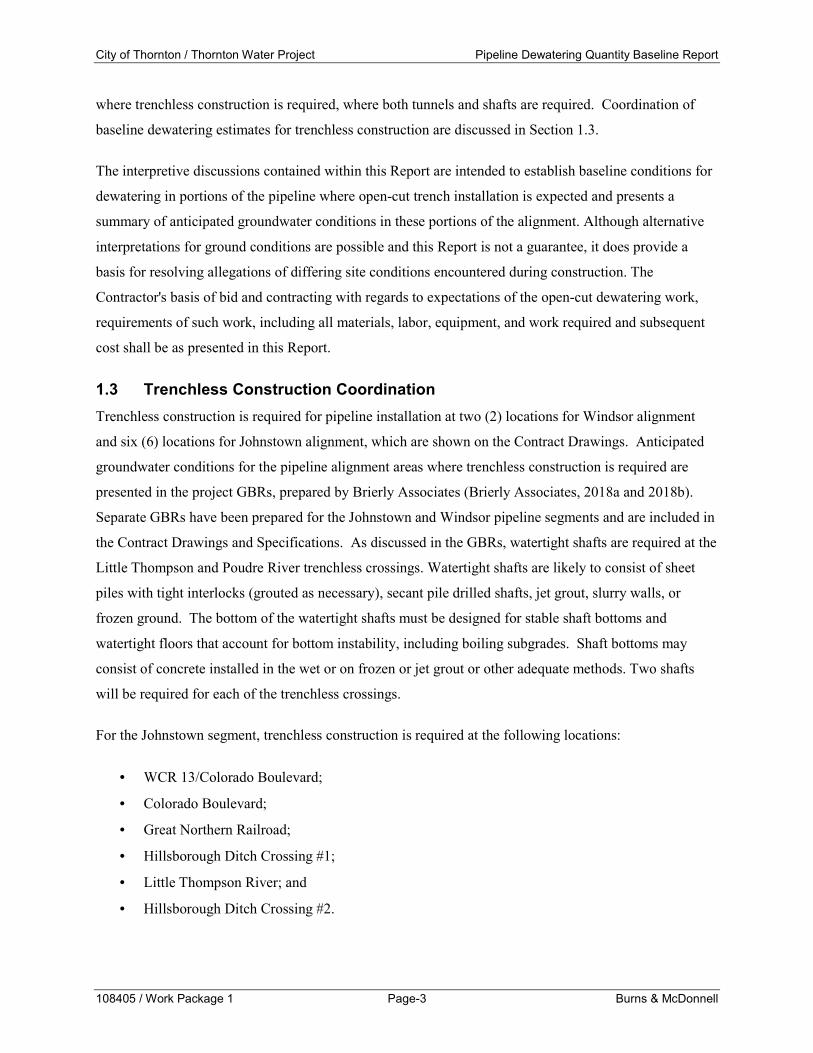
Figure 2-2 Surficial Geology Windsor Segment
The geologic map referenced in Figures 2-2 is Palkovic, M., and Morgan, M.L., 2017, Geologic Map of
the Johnstown quadrangle, Larimer and Weld Counties, Colorado: Colorado Geological Survey Open-
file Report 17-02, scale 1:24,000. Based on geologic map described above (Palkovic, M.J., and Morgan,
M.L., 2017), the geology of the Johnston segment of the pipeline includes the following materials:

City of Thornton / Thornton Water Project Pipeline Dewatering Quantity Baseline Report
108405 / Work Package 1 Page-7 Burns & McDonnell
• Eolium: Light Light-brown to reddish-brown to olive-gray deposits of windblown clay, silt, sand,
and granules (generally referred to as loess). Loess is as much as 15 feet thick but generally is
less than 3 feet thick.
• Broadway Alluvium: Well-sorted and well-stratified; size analyses indicate that the average size
distribution is 50% sand, 25% granules and 25% pebbles. Poorly developed brown soil profile.
Along tributaries the Broadway Alluvium is 10 to 15 feet thick.
• Piney Creek Alluvium: Dark-gray sandy to gravelly alluvium containing organic matter. Upper
part is characterized by weakly developed brown soil. Thickness ranges from 0 to 20 feet.
• Colluvium: Bouldery to pebbly sandy silt and clay deposited by gravity and sheet wash on slopes.
May contain and interfinger with alluvium of various ages. Thickness as much as 25 feet but
generally not more than 5 feet.
2.2 Subsurface Investigation A geotechnical investigation was completed by Kumar and Associates and is documented in the project
GDR. The objective of this investigation was to evaluate the subsurface conditions along the pipeline
corridors. Boring logs from the investigation, along with boring location maps, are included in the GDR.
A general summary of the geology encountered in the geotechnical investigation is provided below:
• Flatland areas generally consist of a surficial section of silty to sandy lean clay, with thickness
ranging from approximately zero to 20 feet. These clay sections are underlain by bedrock,
described as claystone/siltstone (referred to as Pierre Shale).
• Areas through river valleys, streams, or natural drainage ways typically include sections of sand
above the shale/claystone bedrock. Depth to bedrock in these areas ranges from roughly 15 to 25
feet.
In addition to the geotechnical field work, a geotechnical laboratory testing program was undertaken to
assist in classification of soil samples and assessment of the hydraulic properties of the soils. Details of
the procedures used for conducting the field work and laboratory testing, and the results of the subsurface
investigations and laboratory testing performed for this project are summarized in the GDR.

City of Thornton / Thornton Water Project Pipeline Dewatering Quantity Baseline Report
108405 / Work Package 1 Page-8 Burns & McDonnell
3.0 QUALITATIVE DEWATERING EVALUATION
Qualitative descriptions of the need for dewatering/groundwater control during pipeline construction were
developed based on the background geologic data described in Section 2. These qualitative descriptions
are based only on the geology and do not include the depth of the pipeline, which is a factor the contractor
must consider when planning construction dewatering. The qualitative levels of dewatering efforts are
classified as follows:
• Limited: These geologic units will likely yield minimal quantities of water during construction.
Groundwater control should be achievable through methods like sump pumping.
• Likely: These geologic units include sands of low to moderate permeability that could produce
groundwater during construction. Groundwater control may require sump pumping and well
points.
• Significant: These geologic units include sands (and some gravel) of moderate to high
permeability that could produce quantities of water during construction that could require active
dewatering with well points or wells.
Areas along the pipeline corridors were assigned qualitative descriptions based on the estimated need for
dewatering/groundwater control during pipeline construction. The descriptions are based on the
anticipated level of effort required to achieve construction dewatering in an open-cut trench installations
within the unconsolidated materials along the pipeline routes.

City of Thornton / Thornton Water Project Pipeline Dewatering Quantity Baseline Report
108405 / Work Package 1 Page-9 Burns & McDonnell
Figure 3-1 Qualitative Dewatering Evaluation Windsor Segment

City of Thornton / Thornton Water Project Pipeline Dewatering Quantity Baseline Report
108405 / Work Package 1 Page-10 Burns & McDonnell
Figure 3-2 Qualitative Dewatering Evaluation Johnstown Segment

City of Thornton / Thornton Water Project Pipeline Dewatering Quantity Baseline Report
108405 / Work Package 1 Page-11 Burns & McDonnell
A general summary of the classification presented in Figures 3-1 and 3-2 is presented below:
• The majority of the Windsor pipeline segment is classified as Limited dewatering potential;
however, the portion of the alignment that is within the Post-Piney Creek alluvium is classified as
Significant. This area includes the Cache la Poudre River valley.
• Nearly all of the Johnstown pipeline segment is classified as Limited dewatering potential. Only
the pipeline segments near the Little Thompson and the Hillsboro Ditch were classified as Likely
dewatering potential.

City of Thornton / Thornton Water Project Pipeline Alignment Dewatering Baseline Report
108405 / Work Package 1 Page-12 Burns & McDonnell
4.0 AQUIFER TESTING
Additional field testing was performed in areas of the pipeline alignment where the qualitative pipeline
construction dewatering requirement was described as Likely or Significant (Section 3). Dewatering
quantities vary proportionally with the hydraulic conductivity of the soil that will be dewatered; therefore,
specific field activities were performed to collect the data need to develop an estimate of the hydraulic
conductivity of the soils that were quantitatively described as having a Likely or Significant potential for
dewatering. Those activities included:
• In-situ hydraulic conductivity tests (slug tests) at boring locations W-6, J-11, J-13 and J-14. The
slug test field procedures and analysis were performed by Kumar & Associates and are described
in the GDR.
• Short duration aquifer pumping tests; performed in test wells that were installed near the Cache
La Poudre and Little Thompson river crossing sites.
4.1 Slug Testing Slug testing was performed by Kumar and Associates and is documented in the project GDR. The slug
testing was performed using a four foot-long, solid “slug”, which consisted of a sand filled 1.50-inch-
diameter plastic pipe. Changes in water levels were recorded using a pressure transducer/data logger.
Both falling head and rising head slug tests were performed. The data collected was analyzed using the
Bouwer-Rice method. Slug test analyses are presented in the GDR and the results are summarized in
Table 4-1.
Table 4-1: Summary of Slug Test Hydraulic Conductivity Results
Piezometer Hydraulic Conductivity Value Feet per day (ft/day)
W-6 3.3
J-11 3.7
J-13 0.069
J-14 0.015
The results presented above indicate that the soils at the W-6 and J-11 borings have a hydraulic
conductivity that is typical for fine grained sand or silt. The soils at borings J-13 and J-14 have a
hydraulic conductivity that is consistent with silt or clay soils.
City of Thornton / Thornton Water Project Pipeline Alignment Dewatering Baseline Report
108405 / Work Package 1 Page-13 Burns & McDonnell
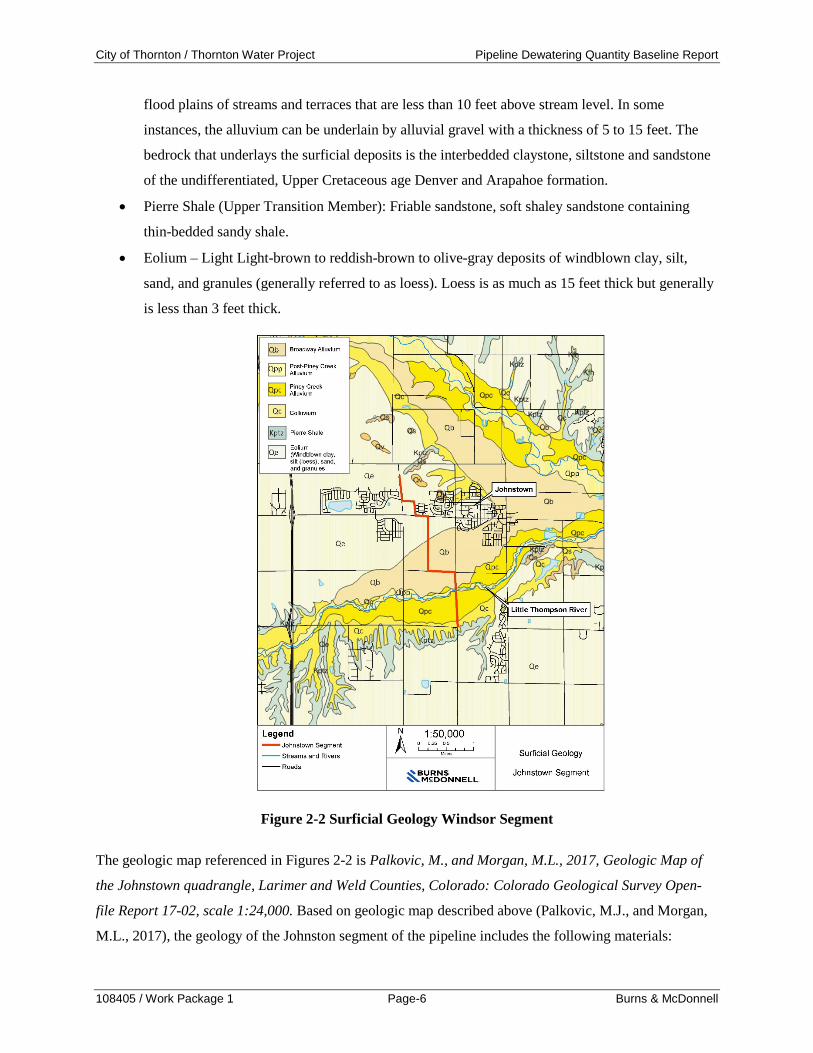
4.2 Aquifer Pumping Tests Short duration (less than eight hour) pumping tests were conducted at the Cache La Poudre and Little
Thompson River crossing sites in order to obtain an estimate of the hydraulic properties of the overburden
materials at these locations. Test pumping wells were constructed near the locations of borings W-5 and
J-15. These test wells were constructed using six-inch diameter PVC casing and PVC screen. The test
wells at Borings W-5 and J-15 were installed as fully penetrating wells, meaning the well screen was
installed from just above the bedrock contact to within a few feet of the ground surface and are screened
across the entire aquifer saturated thickness. Piezometers were installed at both aquifer test sites to
observe water level changes during the pumping test. Like the pumping well, the piezometers were also
completed within the unconsolidated deposits and screened from just above the bedrock surface to near
the ground surface.
Well pumping rates were monitored using an inline flow meter and were also periodically checked by
pumping into a five gallon bucket and measuring the time required to fill the bucket with a stop watch.
All wells were equipped with an In-Situ Level Troll 700 pressure transducer/data logger to monitor and
record changes in water levels observed during the test. In addition to the pressure transducers, manual
water-level data were collected periodically throughout the test using an electronic water-level indicator
to verify the data collected using the pressure transducers. Manual water-level data were recorded in a
field log book and compared to the data from the pressure transducers. A laptop computer was used to
extract the data from the transducers at the end of the tests. A summary of the pumping tests is presented
below.
4.2.1 Cache La Poudre River Site A six-inch diameter test well was installed near the location of boring W-5. This well was used as the
pumping well for the aquifer test performed to characterize the hydrogeology of the unconsolidated
sediments near the Cache La Poudre river crossing. The test well had a total depth of approximately 14.1
feet below ground surface (bgs) and was screened from four to 14 feet bgs. The well casing extended
approximately 3 feet above ground surface. The static water level measured in this test well before the
pumping test began was recorded as 10.2 feet below top of casing, meaning the static depth to water is
approximately 7 feet bgs. The depth to bedrock in the W-5 boring was recorded as 17.5 feet, meaning the
pre-test aquifer thickness at this location is approximately 10.5 feet. The geology of the unconsolidated
materials in the W-5 boring were logged as gravelly and cobbley sand with lesser amounts of clay and
silt. These materials are alluvial deposits of the Post Piney Creek Alluvium.

City of Thornton / Thornton Water Project Pipeline Alignment Dewatering Baseline Report
108405 / Work Package 1 Page-14 Burns & McDonnell
On September 19, 2018, a 335-minute variable rate pumping test was performed using the test well
installed near boring W-5. Two pumping rates were used during the aquifer test, as described below:
• Q1 - 5.5 gallons per minute (gpm) from 0 to 180 minutes;
• Q2 - 10 gpm from 180 to 335 minutes.
Two piezometers were installed near the test well to monitor groundwater levels during the aquifer test;
piezometer MW-NWE was installed 9.4 feet from the test well and piezometer MW-NW was installed
41.2 feet from the test well. A plot of the pumping water level response in the test well in the well is
shown below as Figure 4-1. This figure also illustrates the specific capacity of the pumping well, which
is a measurement of the well discharge per unit drawdown and is presented as gpm per foot of drawdown.
Water levels measurements collected from the piezometers during the aquifer test are presented in
Appendix A. Water level measurements were also collected to monitor recovery of the aquifer after
pumping was stopped. A summary of the water level measurements observed before and at the end of
the aquifer test are provided in Table 4-2.

City of Thornton / Thornton Water Project Pipeline Alignment Dewatering Baseline Report
108405 / Work Package 1 Page-15 Burns & McDonnell
Table 4-2: Summary of Aquifer Test Water Level Conditions Cache La Poudre River Site
Well/Piezometer ID
Distance from Pumping Well (feet)
Depth to Static Water Level (feet below Top of Casing)
Depth to Water at End of Pumping Period (feet bgs)
Drawdown (feet)
Test Well NA 10.19 13.27 3.08
MW NWE 9.4 feet 10.89 11.69 0.80
MW NW 41 feet 10.44 10.74 0.30
Figure 4-1 Pumping Water Level Response for Cache La Poudre Test Well
4.2.2 Little Thompson River Site A six-inch diameter test well was installed near the location of boring J-15. This well was used as the
pumping well for the aquifer test performed to characterize the hydrogeology of the unconsolidated
sediments near the Little Thompson River crossing. The test well had a total depth of approximately 22.7
feet bgs and the well casing extended approximately three feet above ground surface. The static water
level measured in this test well was recorded as 8.1 feet below top of casing, meaning the static depth to
water is approximately five feet bgs. The depth to bedrock in the J-15 boring was recorded as 19.5 feet,
meaning the pre-test aquifer thickness at this location is approximately 14.5 feet. The geology of the

City of Thornton / Thornton Water Project Pipeline Alignment Dewatering Baseline Report
108405 / Work Package 1 Page-16 Burns & McDonnell
unconsolidated deposits encountered at J-15 was described as eolian materials alternating between clayey
sand and sandy lean clay. The geology encountered in boring J-14, drilled on the north side of the Little
Thompson River, showed similar geology to what was observed at J-15 except a poorly graded sand unit
was noted in this boring.
On September 20, 2018, a 180 minute constant rate pumping test was performed using the test well
installed near boring J-15. The well was pumped at a rate of approximately 7.5 gpm. The test was
stopped at 180 minutes because the pumping water level was nearing the suction intake of the well pump.
One piezometer was installed near the test well to monitor groundwater levels during the aquifer test. The
piezometer (LTR MWS) was installed approximately eight feet from the test well. Water level changes in
both the test well and in the piezometer were monitored using the same equipment and approach as
previously described for the Cache La Poudre test. A summary of the water level measurements observed
during the aquifer test are provided in Table 4-3.
Table 4-3: Summary of Aquifer Test Water Level Conditions Little Thompson River Site
Well/Piezometer ID
Distance from Pumping Well (feet)
Depth to Static Water Level (feet bgs)
Depth to Water at End of Pumping Test (feet bgs)
Drawdown (feet)
Test Well NA 8.1 19.29 11.2
LTR MWS 8 feet 8.1 8.73 0.64
4.2.3 Aquifer Test Analysis The water level data collected during the aquifer pumping test were analyzed to estimate the aquifer
parameters that impact how much pumping could be required to achieve dewatering during pipeline
construction. Those aquifer parameters include: aquifer transmissivity, hydraulic conductivity and aquifer
storage. Transmissivity is defined as the rate at which water is transmitted through a unit width of aquifer
under a unit hydraulic gradient. The hydraulic conductivity of the aquifer materials is calculated by
dividing the aquifer transmissivity by the measured aquifer thickness during testing. Aquifer storage, also
known as the storage coefficient, is the volume of water an aquifer releases or takes into storage per unit
surface area of the aquifer per unit change in head.

City of Thornton / Thornton Water Project Pipeline Alignment Dewatering Baseline Report
108405 / Work Package 1 Page-17 Burns & McDonnell
Several standard analytical methods were used to estimate the aquifer parameters for the areas influenced
by the pumping of the test well. The Cooper-Jacob (1946) time drawdown and Theis (1935) recovery
analytical techniques were the primary analytical technique used to estimate the aquifer transmissivity
and storage values for the unconsolidated materials at each river crossing. Details on this analytical
technique are presented in Analysis and Evaluation of Pumping Test Data (Kruseman and deRidder,
1994). The assumptions necessary for the development of each analytical technique used are also
presented in the reference listed above.
The analytical techniques were solved using a Microsoft Excel spreadsheet tool or the pump test analysis
software AQTESOLV®. For both pumping tests, the observed water level changes were first corrected
for changes in aquifer thickness during testing (so that confined aquifer solutions could be used) and then
the corrected water level data were input into the spreadsheet program and AQTESOLV®. The aquifer
test analyses are presented in Appendix A. The estimated aquifer parameter values are summarized
below in Table 4-4 and Table 4-5.
Table 4-4: Summary of Aquifer Test Results Cache La Poudre River Site
Well/ Piezometer ID
Method of Analysis
Depth to Static Water Level* (feet bgs)
Depth to Bedrock (feet bgs)
Transmissivity (ft2/day)
Hydraulic Conductivity (ft/day)
Aquifer Storage (dimensionless)
Test Well (First Step
Only)
Cooper-Jacob Time
Drawdown
7.2 17.5 1,470 143 NA*
MW NW -E Cooper-Jacob Time
Drawdown
1,020 99 0.1
Test Well Theis Recovery
1,060 103 NA*
* Storage cannot be estimated from pumping well data
The aquifer test results for the test performed at the Cache La Poudre River crossing site indicate that the
transmissivity of the unconsolidated materials ranges from 1,000 to 1,400 ft2/day. The saturated thickness
of the unconsolidated materials was measured as approximately 10 feet during testing. The calculated
aquifer transmissivity and hydraulic conductivity values were similar between the test well and
piezometer site, indicating that the unconsolidated materials within the testing radius are relatively
homogenous.

City of Thornton / Thornton Water Project Pipeline Alignment Dewatering Baseline Report
108405 / Work Package 1 Page-18 Burns & McDonnell
Table 4-5: Summary of Aquifer Test Results Little Thompson River Site
Well/ Piezometer ID
Method of Analysis
Depth to Static Water Level* (feet bgs)
Depth to Bedrock (feet bgs)
Transmissivity (ft2/day)
Hydraulic Conductivity (ft/day)
Aquifer Storage (dimensionless)
Test Well Cooper-Jacob Time
Drawdown
8.1 19.5 285 25 NA*
LTR MWS Cooper-Jacob Time
Drawdown
1430 125 0.02
Test Well Theis Recovery
530 NA*
* Storage cannot be estimated from pumping well data
The calculated aquifer transmissivity for unconsolidated materials near the Little Thompson River
crossing range from 260 to 530 ft2/day in the pumping test well to 1,400 ft2/day in the piezometer. The
saturated thickness of the unconsolidated materials was measured as approximately 11.4 feet during
testing. The calculated aquifer transmissivity and hydraulic conductivity values are very different
between the test well and the piezometer site, likely due to desaturation of the aquifer near the test well
and hydraulic inefficiencies of the test well. Since water level responses in the piezometer were not
impacted by well efficiency or desaturation of the aquifer, BMcD considers the aquifer parameters
calculated from the piezometer as representative of the unconsolidated materials and recommends using
these values in evaluation of construction dewatering flow rates.
4.2.4 Water Quality Water samples were collected from the discharge of both test wells in order to characterize the quality of
the water being discharged. The samples were analyzed only for selenium and total suspended solids, as
required for compliance with our site specific Colorado Department of Public Health and Environment
(CDPHE) discharge permit. Sample results are included in Appendix B. The nomenclature used for the
samples is CLP PW1 (Cache La Poudre River test well) and LTR PW1 (Little Thompson River test well).
The sample results indicate that selenium was not detected in the groundwater from the Cache La Poudre
site, but selenium was detected at 21.3 and 21.9 micrograms per liter (ug/L) at the Little Thompson River
site. Total suspended solids ranged from non-detect (ND) at the Cache La Poudre site to 56.8 milligrams
per liter (mg/L) at the Little Thompson River site.

City of Thornton / Thornton Water Project Pipeline Alignment Dewatering Baseline Report
108405 / Work Package 1 Page-19 Burns & McDonnell
5.0 DEWATERING ESTIMATES
A range of plausible dewatering flow rates was developed for the locations along the pipeline route that
were identified as a likely or significant dewatering classification (Figure 3-1 and 3-2). These locations
include:
• Borings W-1 through W-6 along the Windsor segment of the pipeline, and
• Borings J-11/J-12 and J-14/J-15 Johnstown segment of the pipeline.
The dewatering estimates were developed using the geotechnical information presented in the GDR and
the aquifer pumping test analysis presented within this Report. Estimated dewatering quantities are
provided in gallons per day (gpd) for several hypothetical target drawdown scenarios. The amount of
drawdown required will depend upon construction methods. Since dewatering volumes depend upon the
exact construction methods, time of year/season, and exact pipeline burry depths, the calculations
presented in this memorandum focused on estimating the dewatering rate required along a 100 foot long
excavation, for several target drawdown values.
5.1 Windsor Alignment The pipeline alignment corresponding with geotechnical borings W-1 through W-6 was classified as areas
where significant dewatering could be required during construction of the pipeline (see Figure 3-1). This
classification was based solely on the geology observed in the geotechnical boring and did not include
construction considerations such as the burial depth of the pipeline. This portion of the pipeline
alignment corresponds approximately with Stations 0+00 to 56+00. Project drawings indicate that the
pipeline burial depth (top of pipe) in this portion of the alignment is a minimum of five feet and often
more than ten feet below existing grade. This is true for this entire portion of the alignment other than the
undercrossing of the Cache La Poudre River which will be completed by means of trenchless technology.
The water level data presented in the GDR cross sections for borings W-1 through W-6 indicate that the
depth to stabilized (post drilling) groundwater generally ranges from six to eight feet below grade. The
stabilized water level measurements were collected from piezometers several days to over one month
following the drilling of the boring and correlate to the water level measurement observed from the Cache
La Poudre test well and piezometers.
Along the majority of this portion of the pipeline route, at least some portion of the pipeline is typically
below the observed depth to water. An estimate of dewatering requirements for this portion of the
pipeline route was developed for excavations that are performed below the static groundwater level. The

City of Thornton / Thornton Water Project Pipeline Alignment Dewatering Baseline Report
108405 / Work Package 1 Page-20 Burns & McDonnell
dewatering estimate was developed using an equation for long, narrow trenches (Equation 6.12 in
Construction Dewatering, J.P. Powers (1992), 103pg., 2nd ed. John Wiley and Sons, Inc). Dewatering
estimates were developed using the following assumptions:
• Depth to the static groundwater level equals 7 feet bgs.
• Pumping time equals one day.
• Aquifer storage equals 0.1. This value was estimated from the aquifer pumping test.
• Hydraulic conductivity – 140 ft/day. This is the higher value calculated from the aquifer pumping
test.
Given the assumptions listed above, an estimate of the dewatering flow rate per 100 feet of trench
required to achieve a dewatered condition is presented in Table 5-1. This table presents baseline
conditions for dewatering the groundwater level to near the top of the bedrock surface. The required
drawdown needed to install the pipeline will vary based on location within the alignment, burial depth,
construction methods, and time of year of construction. Target dewatering levels should be determined
based on site specific geotechnical conditions and pipeline installation requirements. Calculations are
presented in Appendix C.
Table 5-1: Baseline Dewatering Estimate Windsor Alignment Stations 0+00 to 56+00
Excavation Trench Length (foot)
Excavation Trench Width (foot)
Bottom Depth of Excavation (feet)
Depth to Dewatered Condition (feet)
Target Dewatering Drawdown (feet)
Estimated Dewatering Rate (gallons per day)
100 8 15.0 16 9 208,000
For baseline purposes, in the open-cut sections, a groundwater pumping rate of 145 gpm will exist along any 100 ft portion of the Windsor Alignment Stations 0+00 to 56+00.
5.2 Johnston Alignment In Phase 1 (Desktop Review), the pipeline alignment corresponding with geotechnical borings J-11, J-12,
J-14 and J-15 was classified as areas where dewatering could likely be required during construction of the
pipeline (see Figure 3-2). This classification was based solely on the geology observed in the geotechnical
boring and did not include construction considerations such as the burial depth of the pipeline. Project
drawings indicate that the pipeline burial depth is a minimum of 4.5 feet and more than ten feet below
existing grade near the Hillsborough Ditch.

City of Thornton / Thornton Water Project Pipeline Alignment Dewatering Baseline Report
108405 / Work Package 1 Page-21 Burns & McDonnell
The water level data presented in the GDR cross sections for the Johnston Alignment borings shows a
depth to water generally ranging from five to ten feet bgs. Along the majority of this portion of the
pipeline route, the burial depth is typically within the observed depth to water; however, the
unconsolidated materials along the majority of the alignment are low permeability and are not anticipated
to yield significant volumes of water.
Construction dewatering could be required along the pipeline alignment that includes the crossing of the
Hillsborough Ditch and the Little Thompson River. This corresponds approximately with Stations
134+00 and 140 +00 (Hillsborough Ditch) and stations 155+00 to 165+00 (Little Thompson River). An
estimate of dewatering requirements for the areas of the pipeline route was developed using the
previously described procedure. Assumptions for the calculations are described below:
• Depth to water equals 8 feet bgs.
• Pumping time equals one day.
• Aquifer storage equals 0.02. This value was estimated from the aquifer pumping test.
• Hydraulic conductivity – 125 ft/day. This is the higher value calculated from the aquifer pumping
test.
Given the assumptions listed above, a range of dewatering flow rates per 100 feet of trench was
developed and is presented in Table 5-2. This table presents baseline conditions for dewatering the
groundwater level to near the top of the bedrock surface. The required drawdown needed to install the
pipeline will vary based on location within the alignment, burial depth, construction methods, and time of
year of construction. Target dewatering levels should be determined based on site specific geotechnical
conditions and pipeline installation requirements. Calculations are presented in Appendix C.
Table 5-2: Baseline Dewatering Estimate Johnston Alignment Stations 134+00 to 140+00 and Stations 155+00 to 165+00
Excavation Trench Length (foot)
Excavation Trench Width (foot)
Bottom Depth of Excavation (feet)
Depth to Dewatered Condition (feet)
Target Dewatering Drawdown (feet)
Estimated Dewatering Rate (gallons per day)
100 8 18.0 19 11 160,000
For baseline purposes, in the open-cut sections, a groundwater pumping rate of 110 gpm will exist along any 100 ft portion of the Johnston Alignment Stations 134+00 to 140+00 (Hillsborough Ditch) and Stations 155+00 to 165+00 (Little Thompson River).

City of Thornton / Thornton Water Project Pipeline Alignment Dewatering Baseline Report
108405 / Work Package 1 Page-22 Burns & McDonnell
5.3 Limited Dewatering Classification As presented in Section 3, the majority of both pipeline alignments were classified as having a limited
potential for dewatering during construction. Specifically, these locations include:
• Windsor Alignment Stations 56+00 to End Station.
• Johnston Alignment Stations 00+00 to 134+00, Stations 140+00 to 155+00, and Stations 165+00
to End Station.
For baseline purposes, a groundwater pumping rate of 10 gpm will exist along any 100 ft open-cut section of the Windsor and Johnston Alignments classified as Limited dewatering. By project stationing, these alignment sections are:
• Windsor Alignment Stations 56+00 to End Station.
• Johnston Alignment Stations 00+00 to 134+00, Stations 140+00 to 155+00, andStations 165+00 to End Station.

City of Thornton / Thornton Water Project Pipeline Alignment Dewatering Baseline Report
108405 / Work Package 1 Page-23 Burns & McDonnell
6.0 REFERENCES
Brierly Associates, 2018a. Geotechnical Baseline Report – Draft Thornton Water Project Work Package 1
Windsor Segment. Windsor, Colorado. December.
Brierly Associates, 2018b. Geotechnical Baseline Report – Draft Thornton Water Project Work Package 1
Thornton Segment. Thornton, Colorado. December.
Colton, R.B., 1978. U.S. Geological Survey Geologic Investigations Series I-855-G, Geologic Map of the
Boulder-Fort Collins-Greeley area, Colorado.
Cooper, H. H., and Jacob, C.E. 1946. A Generalized Graphical Method for Evaluating Formation
Constants and Summarizing Well Field History. Amer. Geophys. Union, Vol. 27: pp.526-534.
Kruseman, G.P., and de Ridder, N.A. 1994. Analysis and Evaluation of Pumping Test Data.
International Institute for Land Reclamation and Improvement. The Netherlands.
Kumar and Associates, Inc., 2018. Geotechnical Data Report Thornton Water Line Phase I Windsor And
Johnstown Segments. Weld County, Colorado. November.
Palkovic, M.J., and Morgan, M.L., 2017. Palkovic, M., and Morgan, M.L., 2017, Geologic Map of the
Johnstown quadrangle, Larimer and Weld Counties, Colorado: Colorado Geological Survey Open-file
Report 17-02.
Powers, J.P., 1992. Construction Dewatering, 2nd edition. John Wiley and Sons, Inc.
Theis, C.V., 1935. The Relation Between the Lowering of the Piezometric Surface and the Rate and
Duration of Discharge of a Well Using Groundwater Storage. Am. Geophys. Union Trans., vol. 16, pp.
519-524.

City of Thornton / Thornton Water Project Pipeline Alignment Dewatering Baseline Report
108405 / Work Package 1 Page-23 Burns & McDonnell
APPENDIX A – AQUIFER PUMPING TEST RESULTS

Cache La Poudre RiverTest Well

Cache La Poudre RiverMonitoring Well

Cache La Poudre RiverMonitoring Well

0
0.5
1
1.5
2
2.5
3
3.5
1 10 100 1000 10000
Res
idua
l Dra
wdo
wn
(ft)
Ratio t/t'
THORNTON WATER LINE PHASE I WINDSOR AND JOHNSTOWN SEGMENTSCache La Poudre Test Well Site
Aquifer Test AnalysisTheis Recovery Method
recovery
∆
T = (264*7.5 gpm)/0.25 ftT = 7,920 gpd/ft

Little Thompson River Test Well

Little Thompson RiverMonitoring Well

0
2
4
6
8
10
12
1 10 100 1000 10000
Res
idua
l Dra
wdo
wn
(ft)
Ratio t/t'
THORNTON WATER LINE PHASE I WINDSOR AND JOHNSTOWN SEGMENTS
Little Thompson River Test Well SiteAquifer Test Analysis
Theis Recovery Method
recovery
∆
T = (264*7.5 gpm)/0.5 ftT = 3,960 gpd/ft

City of Thornton / Thornton Water Project Pipeline Alignment Dewatering Baseline Report
108405 / Work Package 1 Page-24 Burns & McDonnell
APPENDIX B – WATER QUALITY RESULTS

#=CL#
October 08, 2018
LIMS USE: FR - DANIEL CLEMENTLIMS OBJECT ID: 60281602
60281602Project:Pace Project No.:
RE:
Daniel ClementBurns & McDonnellP.O. Box 419173Kansas City, MO 64141
Thornton Water Project
Dear Daniel Clement:Enclosed are the analytical results for sample(s) received by the laboratory on September 24, 2018.The results relate only to the samples included in this report. Results reported herein conform to themost current, applicable TNI/NELAC standards and the laboratory's Quality Assurance Manual,where applicable, unless otherwise noted in the body of the report.
If you have any questions concerning this report, please feel free to contact me.
Sincerely,
Keegan [email protected]
PM Lab Management(785)827-1273
Enclosures
REPORT OF LABORATORY ANALYSISThis report shall not be reproduced, except in full,
without the written consent of Pace Analytical Services, LLC.
Pace Analytical Services, LLC525 N. 8th StreetSalina, KS 67401
(785)827-1273
Page 1 of 12

#=CP#
CERTIFICATIONS
Pace Project No.:Project:
60281602Thornton Water Project
Kansas Certification IDs9608 Loiret Boulevard, Lenexa, KS 66219Missouri Certification Number: 10090Arkansas Drinking WaterWY STR Certification #: 2456.01Arkansas Certification #: 18-016-0Arkansas Drinking WaterIllinois Certification #: 004455Iowa Certification #: 118Kansas/NELAP Certification #: E-10116
Louisiana Certification #: 03055Nevada Certification #: KS000212018-1Oklahoma Certification #: 9205/9935Texas Certification #: T104704407Utah Certification #: KS00021Kansas Field Laboratory Accreditation: # E-92587Missouri Certification: 10070Missouri Certification Number: 10090
REPORT OF LABORATORY ANALYSISThis report shall not be reproduced, except in full,
without the written consent of Pace Analytical Services, LLC.
Pace Analytical Services, LLC525 N. 8th StreetSalina, KS 67401
(785)827-1273
Page 2 of 12

#=SS#
SAMPLE SUMMARY
Pace Project No.:Project:
60281602Thornton Water Project
Lab ID Sample ID Matrix Date Collected Date Received
60281602001 CLP PW1 0950 Water 09/19/18 09:50 09/24/18 15:52
60281602002 CLP PW1 1500 Water 09/19/18 15:00 09/24/18 15:52
60281602003 LTR PW1 1355 Water 09/20/18 13:55 09/24/18 15:52
60281602004 LTR PW1 1210 Water 09/20/18 12:10 09/24/18 15:52
REPORT OF LABORATORY ANALYSISThis report shall not be reproduced, except in full,
without the written consent of Pace Analytical Services, LLC.
Pace Analytical Services, LLC525 N. 8th StreetSalina, KS 67401
(785)827-1273
Page 3 of 12

#=SA#
SAMPLE ANALYTE COUNT
Pace Project No.:Project:
60281602Thornton Water Project
Lab ID Sample ID MethodAnalytesReported LaboratoryAnalysts
60281602001 CLP PW1 0950 SM 2540D 1 PASI-KJDA
60281602002 CLP PW1 1500 SM 2540D 1 PASI-KJDA
60281602003 LTR PW1 1355 EPA 6020 1 PASI-KJGP
SM 2540D 1 PASI-KJDA
60281602004 LTR PW1 1210 EPA 6020 1 PASI-KJGP
SM 2540D 1 PASI-KJDA
REPORT OF LABORATORY ANALYSISThis report shall not be reproduced, except in full,
without the written consent of Pace Analytical Services, LLC.
Pace Analytical Services, LLC525 N. 8th StreetSalina, KS 67401
(785)827-1273
Page 4 of 12

#=AR#
ANALYTICAL RESULTS
Pace Project No.:Project:
60281602Thornton Water Project
Sample: CLP PW1 0950 Lab ID: 60281602001 Collected: 09/19/18 09:50 Received: 09/24/18 15:52 Matrix: Water
Parameters Results Units DF Prepared Analyzed CAS No. QualReport Limit
Analytical Method: SM 2540D2540D Total Suspended Solids
Total Suspended Solids ND mg/L 09/26/18 17:095.0 1
Sample: CLP PW1 1500 Lab ID: 60281602002 Collected: 09/19/18 15:00 Received: 09/24/18 15:52 Matrix: Water
Parameters Results Units DF Prepared Analyzed CAS No. QualReport Limit
Analytical Method: SM 2540D2540D Total Suspended Solids
Total Suspended Solids ND mg/L 09/26/18 17:105.0 1
Sample: LTR PW1 1355 Lab ID: 60281602003 Collected: 09/20/18 13:55 Received: 09/24/18 15:52 Matrix: Water
Parameters Results Units DF Prepared Analyzed CAS No. QualReport Limit
Analytical Method: EPA 6020 Preparation Method: EPA 30106020 MET ICPMS
Selenium 21.3 ug/L 10/07/18 14:04 7782-49-210/05/18 11:131.0 1
Analytical Method: SM 2540D2540D Total Suspended Solids
Total Suspended Solids 56.8 mg/L 09/26/18 17:285.0 1
Sample: LTR PW1 1210 Lab ID: 60281602004 Collected: 09/20/18 12:10 Received: 09/24/18 15:52 Matrix: Water
Parameters Results Units DF Prepared Analyzed CAS No. QualReport Limit
Analytical Method: EPA 6020 Preparation Method: EPA 30106020 MET ICPMS
Selenium 21.9 ug/L 10/07/18 14:09 7782-49-210/05/18 11:131.0 1
Analytical Method: SM 2540D2540D Total Suspended Solids
Total Suspended Solids 23.8 mg/L 09/26/18 17:285.0 1
REPORT OF LABORATORY ANALYSISThis report shall not be reproduced, except in full,
without the written consent of Pace Analytical Services, LLC.Date: 10/08/2018 04:39 PM
Pace Analytical Services, LLC525 N. 8th StreetSalina, KS 67401
(785)827-1273
Page 5 of 12

City of Thornton / Thornton Water Project Pipeline Alignment Dewatering Baseline Report
108405 / Work Package 1 Page-25 Burns & McDonnell
APPENDIX C – DEWATERING CALCULATIONS

Client: City of Thornton, CO REV0 date:11/30/2018
Project:THORNTON WATER LINE PHASE I ‐ Windsor Segment Dewatering Estimate
Powers Equation 6.12 ‐ Construction Dewatering, J.P. Powers (1992), 103pg., 2nd ed. John Wiley and Sons, Inc
Q = pumping rate in ft3/d
K = hydraulic conductivity in ft/d
Calculation Variabl Value Description Note:
7Depth to static water (ft)
17
Depth of base of geologic unit to be dewatered (ft)
Approximate depth of bedrock unit below excavation depths
H10
Thickness of geolgic unit prior to dewatering (ft)
K140
ft/day
r w 5 Distance from well point to trench center line (feet)
Calculate Ro for
t (day) 1 Pumping time (days)
T (ft2/d) 1400 Aquifer Transmissivity (ft2/day)
S 0.10 Aquifer Storage (dimensionless)
R o (ft) 177 Radius of Influence (ft)
Calculate L for trench equatoin
L (feet) 89 Distance to Line Source of Recharge
L = 1/2 Ro (Powers, 1992)
Foundation IDa ‐ Excavation Length (ft)
b ‐ Excavation Width (ft)
Bottom Depth of Excavation (ft)Depth to dewatered condition (feet)
Dewatering Drawdown (feet)
Thickness of aquifer prior to dewatering (ft)
hw ‐ Thickness of aquifer after
dewatering (ft)
Equivalent Radius (rw) (ft)
Estimated dewatering Q (gal/day) from the ends of the excavation
Estimated dewatering Q (gal/day) from the sides of the excavation
Total Estimated Dewatering per 100 Foot Trench Length (gal/day)
Pipeline Trench* 100 8 7.0 8 1 10.0 9 5.0 17,512 22,421 39,933
Pipeline Trench* 100 8 9.0 10 3 10.0 7 5.0 47,006 60,183 107,189
Pipeline Trench* 100 8 11.0 12 5 10.0 5 5.0 69,126 88,505 157,631
Pipeline Trench* 100 8 13.0 14 7 10.0 3 5.0 83,873 107,386 191,258
Pipeline Trench* 100 8 15.0 16 9 10.0 1 5.0 91,246 116,826 208,072
Flow from ends Flow from SidesNotes
rw is calculated for an excavation length and width that are 20% larger than the needed excavation size.
*Pipeline dewatering estimate is for a 100 foot pipeline length.
Windsor Segment Station 0+00 to 56+00
Based on geotechnical report
H = hydraulic head of the original water table (ft)
hw = hydraulic head at maximum dewatering (ft)
Ro = radius of influence of well (ft)
rw = equivalent radius of the well (ft)
Hydraulic conductivity from aquifer pumping test
Pipeline Trench Dewatering Estimate
ln2 2

Client: City of Thornton, CO REV0 date:11/30/2018
Project:THORNTON WATER LINE PHASE I ‐ Johnston Segment Dewatering Estimate
Powers Equation 6.12 ‐ Construction Dewatering, J.P. Powers (1992), 103pg., 2nd ed. John Wiley and Sons, Inc
Q = pumping rate in ft3/d
K = hydraulic conductivity in ft/d
Calculation Variabl Value Description Note:
8Depth to static water (ft)
20
Depth of base of geologic unit to be dewatered (ft)
Approximate depth of bedrock unit below excavation depths
H12
Thickness of geolgic unit prior to dewatering (ft)
K125
ft/day
r w 5 Distance from well point to trench center line (feet)
Calculate Ro for
t (day) 1 Pumping time (days)
T (ft2/d) 1500 Aquifer Transmissivity (ft2/day)
S 0.02 Aquifer Storage (dimensionless)
R o (ft) 411 Radius of Influence (ft)
Calculate L for trench equatoin
L (feet) 205 Distance to Line Source of Recharge
L = 1/2 Ro (Powers, 1992)
Foundation IDa ‐ Excavation Length (ft)
b ‐ Excavation Width (ft)
Bottom Depth of Excavation (ft)Depth to dewatered condition (feet)
Dewatering Drawdown (feet)
Thickness of aquifer prior to dewatering (ft)
hw ‐ Thickness of aquifer after
dewatering (ft)
Equivalent Radius (rw) (ft)
Estimated dewatering Q (gal/day) from the ends of the excavation
Estimated dewatering Q (gal/day) from the sides of the excavation
Total Estimated Dewatering per 100 Foot Trench Length (gal/day)
Pipeline Trench* 100 8 8.0 9 1 12.0 11 5.0 15,324 10,470 25,794
Pipeline Trench* 100 8 9.0 10 2 12.0 10 5.0 29,316 20,030 49,346
Pipeline Trench* 100 8 12.0 13 5 12.0 7 5.0 63,296 43,246 106,542
Pipeline Trench* 100 8 15.0 16 8 12.0 4 5.0 85,284 58,268 143,552
Pipeline Trench* 100 8 18.0 19 11 12.0 1 5.0 95,278 65,096 160,374
Flow from ends Flow from SidesNotes
rw is calculated for an excavation length and width that are 20% larger than the needed excavation size.
*Pipeline dewatering estimate is for a 100 foot pipeline length.
Windsor Segment Station 0+00 to 56+00
Based on geotechnical report
H = hydraulic head of the original water table (ft)
hw = hydraulic head at maximum dewatering (ft)
Ro = radius of influence of well (ft)
rw = equivalent radius of the well (ft)
Hydraulic conductivity from aquifer pumping test
Pipeline Trench Dewatering Estimate
ln2 2

Burns & McDonnell World Headquarters 9400 Ward Parkway
Kansas City, MO 64114 O 816-333-9400 F 816-333-3690
www.burnsmcd.com