Embed Size (px)
Citation preview

Thoresen Thai Agencies Plc.
Results Briefing
SET Opportunity Day27 August 2013
Agenda
Page 2 | TTA 3QFY13 Results Briefing
Recap of 3QFY13: Key facts & developments at core business units Financial Review: Consolidated P&L Business Outlook:
Group Transport Group Energy Group Infrastructure
Q&A
Dry Bulk Shipping
Subsea Engineering
OffshoreDrilling
CoalDistribution
FertiliserBusiness
Recap of 3QFY13Freight rates remained weak
| Transport | Energy | Infrastructure
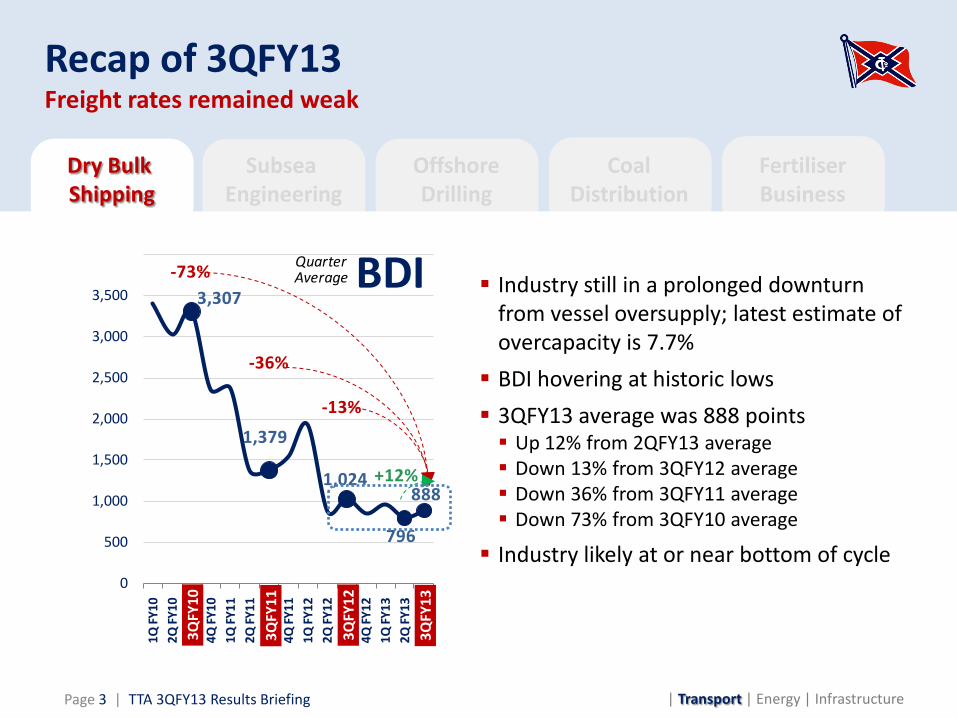
Industry still in a prolonged downturn from vessel oversupply; latest estimate of overcapacity is 7.7% BDI hovering at historic lows 3QFY13 average was 888 points Up 12% from 2QFY13 average Down 13% from 3QFY12 average Down 36% from 3QFY11 average Down 73% from 3QFY10 average
Industry likely at or near bottom of cycle
Page 3 | TTA 3QFY13 Results Briefing
3,307
1,379
1,024
796
888
0
500
1,000
1,500
2,000
2,500
3,000
3,500
4,000
1Q FY
102Q
FY10
3Q FY
104Q
FY10
1Q FY
112Q
FY11
3Q FY
114Q
FY11
1Q FY
122Q
FY12
3Q FY
124Q
FY12
1Q FY
132Q
FY13
3Q FY
13
BDIQuarter Average
+12%
-36%
-13%
-73%
3QFY
13
3QFY
10
3QFY
11
3QFY
12
Dry Bulk Shipping
Subsea Engineering
OffshoreDrilling
CoalDistribution
FertiliserBusiness
Recap of 3QFY13Freight rates remained weak (continued)
| Transport | Energy | InfrastructurePage 4 | TTA 3QFY13 Results Briefing
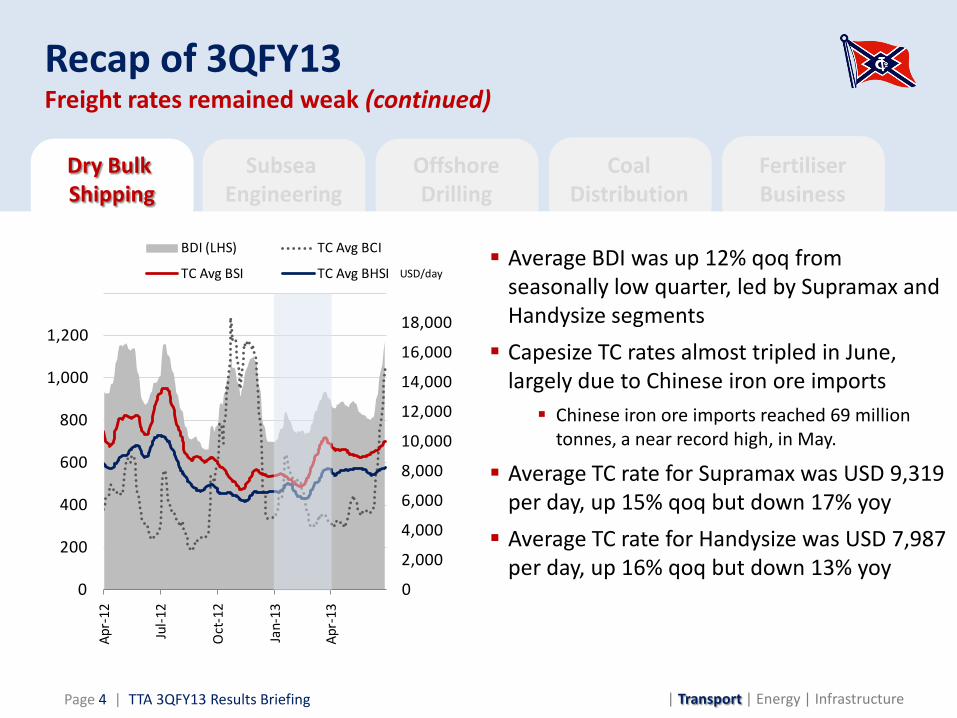
Average BDI was up 12% qoq from seasonally low quarter, led by Supramax and Handysize segments Capesize TC rates almost tripled in June,
largely due to Chinese iron ore imports Chinese iron ore imports reached 69 million
tonnes, a near record high, in May.
Average TC rate for Supramax was USD 9,319 per day, up 15% qoq but down 17% yoy Average TC rate for Handysize was USD 7,987
per day, up 16% qoq but down 13% yoy0
2,000
4,000
6,000
8,000
10,000
12,000
14,000
16,000
18,000
20,000
0
200
400
600
800
1,000
1,200
1,400
Apr-
12
Jul-1
2
Oct
-12
Jan-
13
Apr-
13
BDI (LHS) TC Avg BCI
TC Avg BSI TC Avg BHSI USD/day
Dry Bulk Shipping
Subsea Engineering
OffshoreDrilling
CoalDistribution
FertiliserBusiness
Recap of 3QFY13Strong freight revenue growth from more chartered-in vessels
| Transport | Energy | InfrastructurePage 5 | TTA 3QFY13 Results Briefing
14.9 15.9
6.2
11.8
934
1,144
0
200
400
600
800
1,000
1,200
1,400
0
5
10
15
20
25
30
35
40
3QFY12 3QFY13
Chartered-in FTE - LHS
Owned vessel FTE - LHS
Freight revenue - RHS
Million Baht
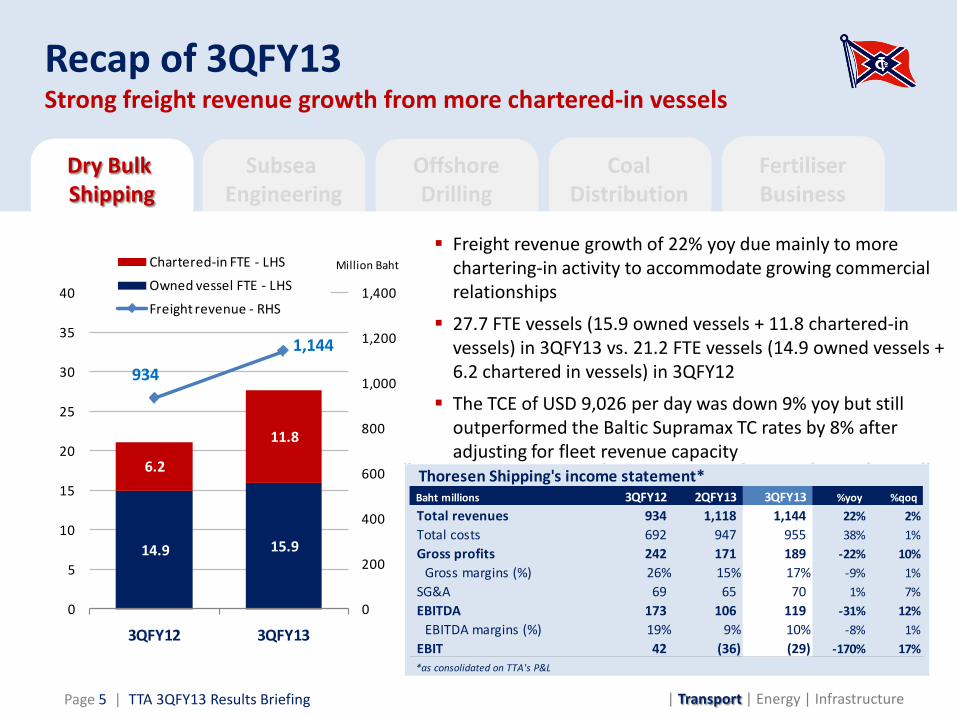
Thoresen Shipping's income statement*Baht millions 3QFY12 2QFY13 3QFY13 %yoy %qoq
Total revenues 934 1,118 1,144 22% 2%Total costs 692 947 955 38% 1%Gross profits 242 171 189 -22% 10%
Gross margins (%) 26% 15% 17% -9% 1%SG&A 69 65 70 1% 7%EBITDA 173 106 119 -31% 12%
EBITDA margins (%) 19% 9% 10% -8% 1%EBIT 42 (36) (29) -170% 17%*as consolidated on TTA's P&L
Freight revenue growth of 22% yoy due mainly to more chartering-in activity to accommodate growing commercial relationships
27.7 FTE vessels (15.9 owned vessels + 11.8 chartered-in vessels) in 3QFY13 vs. 21.2 FTE vessels (14.9 owned vessels + 6.2 chartered in vessels) in 3QFY12
The TCE of USD 9,026 per day was down 9% yoy but still outperformed the Baltic Supramax TC rates by 8% after adjusting for fleet revenue capacity
Dry Bulk Shipping
Subsea Engineering
OffshoreDrilling
CoalDistribution
FertiliserBusiness
Recap of 3QFY13Cost control efforts sustained
| Transport | Energy | InfrastructurePage 6 | TTA 3QFY13 Results Briefing
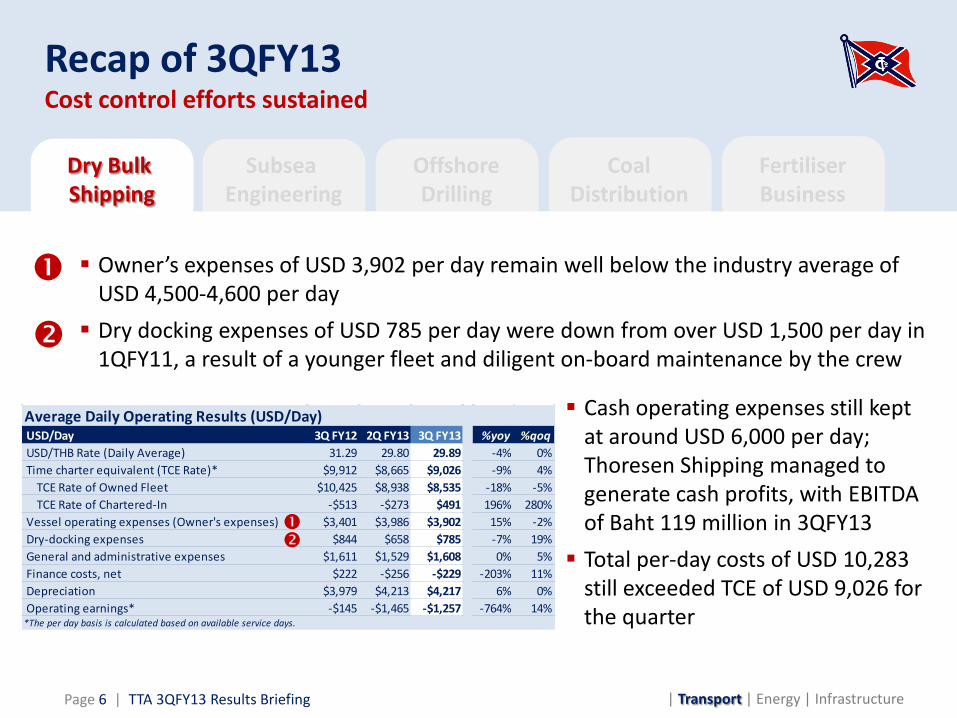
Owner’s expenses of USD 3,902 per day remain well below the industry average of USD 4,500-4,600 per day Dry docking expenses of USD 785 per day were down from over USD 1,500 per day in
1QFY11, a result of a younger fleet and diligent on-board maintenance by the crew
Cash operating expenses still kept at around USD 6,000 per day; Thoresen Shipping managed to generate cash profits, with EBITDA of Baht 119 million in 3QFY13 Total per-day costs of USD 10,283
still exceeded TCE of USD 9,026 for the quarter
Average Daily Operating Results (USD/Day) USD/Day 3Q FY12 2Q FY13 3Q FY13 %yoy %qoq USD/THB Rate (Daily Average) 31.29 29.80 29.89 -4% 0% Time charter equivalent (TCE Rate)* $9,912 $8,665 $9,026 -9% 4% TCE Rate of Owned Fleet $10,425 $8,938 $8,535 -18% -5% TCE Rate of Chartered-In -$513 -$273 $491 196% 280% Vessel operating expenses (Owner's expenses) $3,401 $3,986 $3,902 15% -2% Dry-docking expenses $844 $658 $785 -7% 19% General and administrative expenses $1,611 $1,529 $1,608 0% 5% Finance costs, net $222 -$256 -$229 -203% 11% Depreciation $3,979 $4,213 $4,217 6% 0% Operating earnings* -$145 -$1,465 -$1,257 -764% 14%*The per day basis is calculated based on available service days.
Dry Bulk Shipping
OffshoreDrilling
CoalDistribution
FertiliserBusiness
Recap of 3QFY13Return to profitability
Subsea Engineering
| Transport | Energy | InfrastructurePage 7 | TTA 3QFY13 Results Briefing
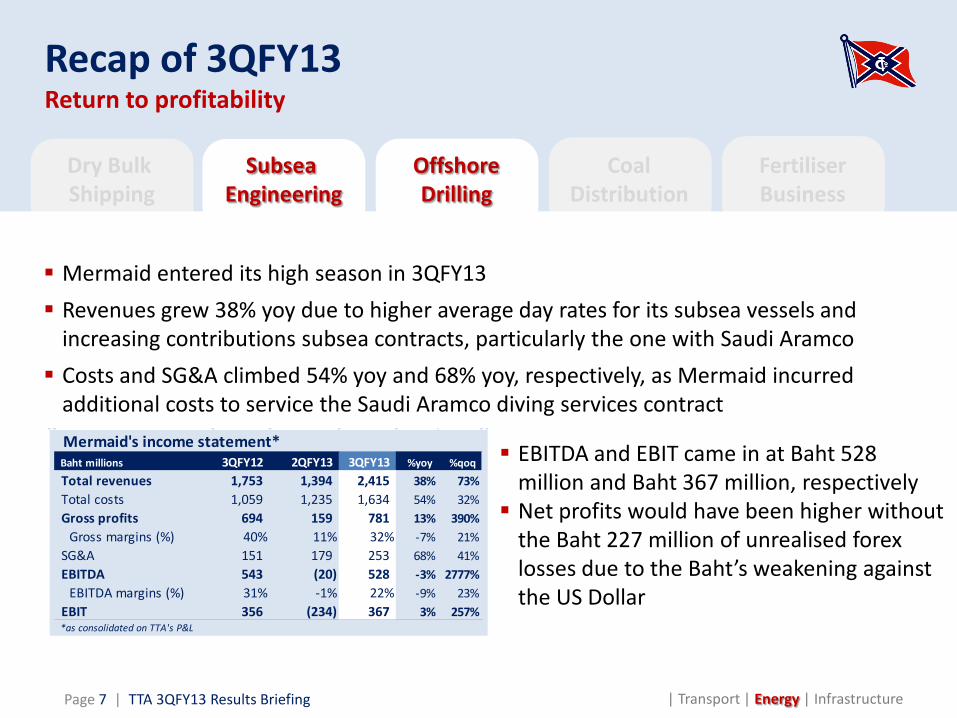
Mermaid entered its high season in 3QFY13 Revenues grew 38% yoy due to higher average day rates for its subsea vessels and
increasing contributions subsea contracts, particularly the one with Saudi Aramco Costs and SG&A climbed 54% yoy and 68% yoy, respectively, as Mermaid incurred
additional costs to service the Saudi Aramco diving services contract
EBITDA and EBIT came in at Baht 528 million and Baht 367 million, respectively Net profits would have been higher without
the Baht 227 million of unrealised forexlosses due to the Baht’s weakening against the US Dollar
Mermaid's income statement*Baht millions 3QFY12 2QFY13 3QFY13 %yoy %qoq
Total revenues 1,753 1,394 2,415 38% 73%Total costs 1,059 1,235 1,634 54% 32%Gross profits 694 159 781 13% 390%
Gross margins (%) 40% 11% 32% -7% 21%SG&A 151 179 253 68% 41%EBITDA 543 (20) 528 -3% 2777%
EBITDA margins (%) 31% -1% 22% -9% 23%EBIT 356 (234) 367 3% 257%*as consolidated on TTA's P&L
Dry Bulk Shipping
OffshoreDrilling
CoalDistribution
FertiliserBusiness
Recap of 3QFY13Better average day rates offset lower utilisation
| Transport | Energy | Infrastructure
Subsea Engineering
Page 8 | TTA 3QFY13 Results Briefing
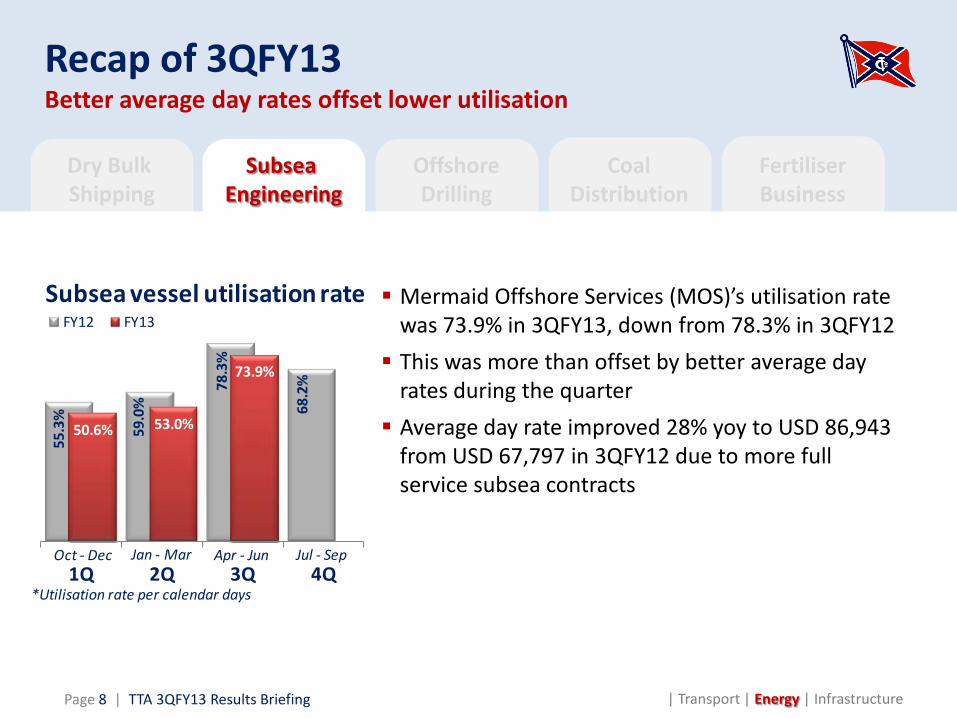
Mermaid Offshore Services (MOS)’s utilisation rate was 73.9% in 3QFY13, down from 78.3% in 3QFY12 This was more than offset by better average day
rates during the quarter Average day rate improved 28% yoy to USD 86,943
from USD 67,797 in 3QFY12 due to more full service subsea contracts
55.3
%
59.0
%
78.3
%
68.2
%
50.6% 53.0%
73.9%
1Q 2Q 3Q 4Q
FY12 FY13Subsea vessel utilisation rate
Oct - Dec Jan - Mar Apr - Jun Jul - Sep
*Utilisation rate per calendar days
Dry Bulk Shipping
OffshoreDrilling
CoalDistribution
FertiliserBusiness
Recap of 3QFY13MTR-2 back on-hire after special periodic survey
| Transport | Energy | Infrastructure
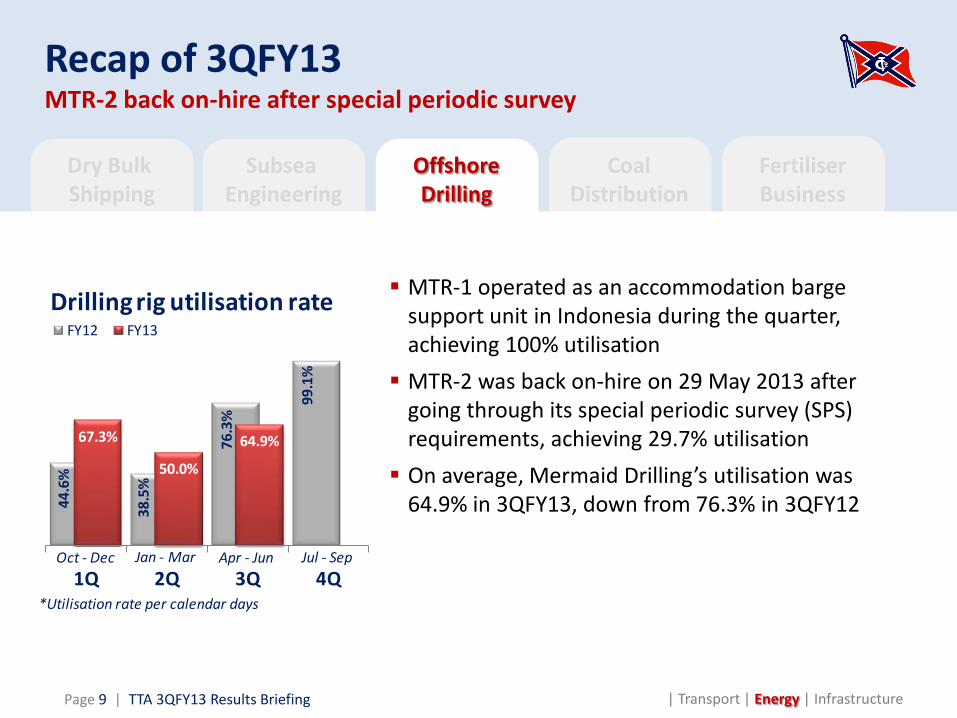
MTR-1 operated as an accommodation barge support unit in Indonesia during the quarter, achieving 100% utilisation MTR-2 was back on-hire on 29 May 2013 after
going through its special periodic survey (SPS) requirements, achieving 29.7% utilisation On average, Mermaid Drilling’s utilisation was
64.9% in 3QFY13, down from 76.3% in 3QFY12
Subsea Engineering
Page 9 | TTA 3QFY13 Results Briefing
44.6
%
38.5
%
76.3
%
99.1
%
67.3%
50.0%
64.9%
1Q 2Q 3Q 4Q
FY12 FY13Drilling rig utilisation rate
Oct - Dec Jan - Mar Apr - Jun Jul - Sep
*Utilisation rate per calendar days
Dry Bulk Shipping
OffshoreDrilling
CoalDistribution
FertiliserBusiness
Recap of 3QFY13Losses deepened on provision for coal inventories
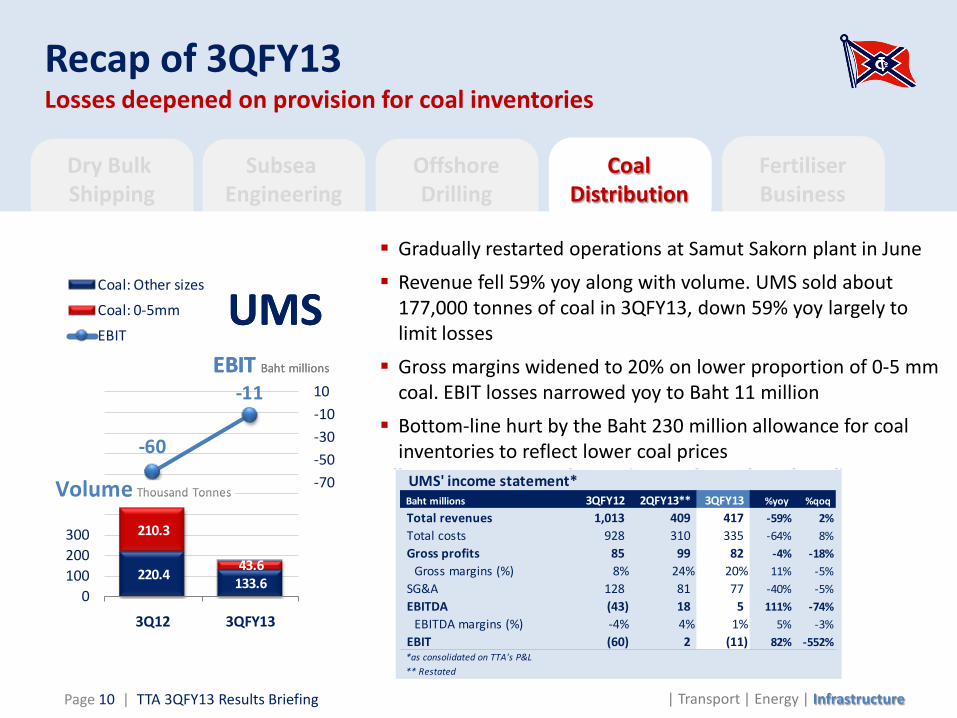
Gradually restarted operations at Samut Sakorn plant in June Revenue fell 59% yoy along with volume. UMS sold about
177,000 tonnes of coal in 3QFY13, down 59% yoy largely to limit losses Gross margins widened to 20% on lower proportion of 0-5 mm
coal. EBIT losses narrowed yoy to Baht 11 million Bottom-line hurt by the Baht 230 million allowance for coal
inventories to reflect lower coal prices
Subsea Engineering
Page 10 | TTA 3QFY13 Results Briefing | Transport | Energy | Infrastructure
220.4 133.6
210.3
43.6
-60
-11
-170-150-130-110-90-70-50-30-1010
0100200300400500600700800900
1,000
3Q12 3QFY13
Coal: Other sizes
Coal: 0-5mm
EBIT
EBIT
EBIT Baht millions
Volume Thousand Tonnes
UMSEBIT
EBIT Baht millions
Volume Thousand Tonnes
UMS
UMS' income statement*Baht millions 3QFY12 2QFY13** 3QFY13 %yoy %qoq
Total revenues 1,013 409 417 -59% 2%Total costs 928 310 335 -64% 8%Gross profits 85 99 82 -4% -18%
Gross margins (%) 8% 24% 20% 11% -5%SG&A 128 81 77 -40% -5%EBITDA (43) 18 5 111% -74%
EBITDA margins (%) -4% 4% 1% 5% -3%EBIT (60) 2 (11) 82% -552%*as consolidated on TTA's P&L** Restated
Dry Bulk Shipping
OffshoreDrilling
CoalDistribution
FertiliserBusiness
Recap of 3QFY13Another good quarter at Baconco
| Transport | Energy | Infrastructure
Subsea Engineering
Page 11 | TTA 3QFY13 Results Briefing
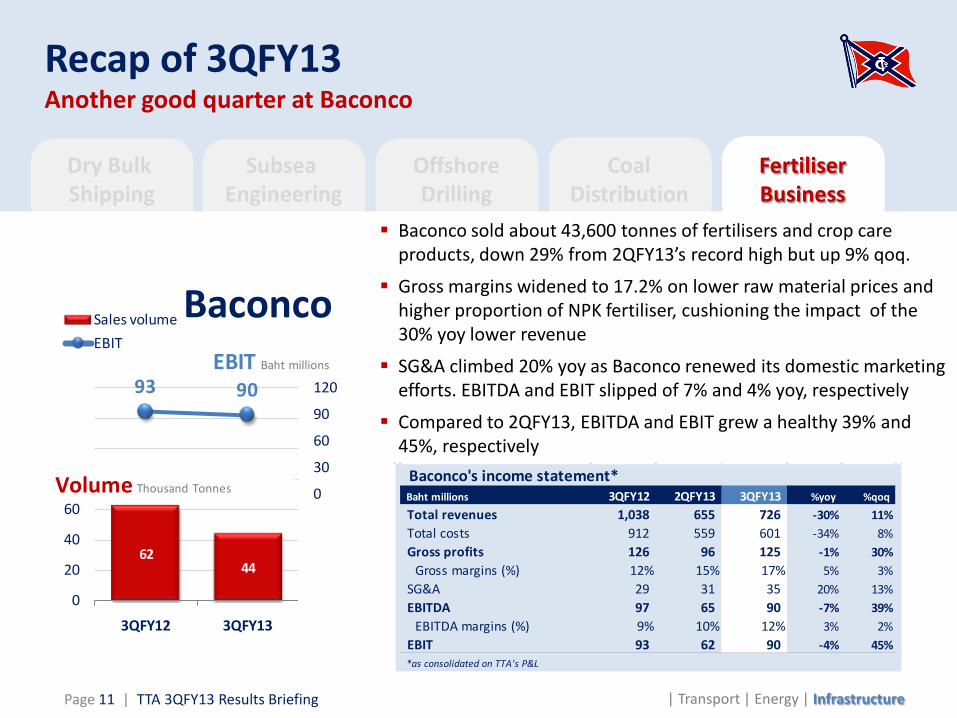
Baconco sold about 43,600 tonnes of fertilisers and crop care products, down 29% from 2QFY13’s record high but up 9% qoq.
Gross margins widened to 17.2% on lower raw material prices and higher proportion of NPK fertiliser, cushioning the impact of the 30% yoy lower revenue
SG&A climbed 20% yoy as Baconco renewed its domestic marketing efforts. EBITDA and EBIT slipped of 7% and 4% yoy, respectively
Compared to 2QFY13, EBITDA and EBIT grew a healthy 39% and 45%, respectively
Baconco's income statement*Baht millions 3QFY12 2QFY13 3QFY13 %yoy %qoq
Total revenues 1,038 655 726 -30% 11%Total costs 912 559 601 -34% 8%Gross profits 126 96 125 -1% 30%
Gross margins (%) 12% 15% 17% 5% 3%SG&A 29 31 35 20% 13%EBITDA 97 65 90 -7% 39%
EBITDA margins (%) 9% 10% 12% 3% 2%EBIT 93 62 90 -4% 45%*as consolidated on TTA's P&L
62 44
93 90
-120
-90
-60
-30
0
30
60
90
120
0
20
40
60
80
100
120
140
3QFY12 3QFY13
Sales volumeEBIT
EBIT Baht millions
Baconco
Volume Thousand Tonnes
Dry Bulk Shipping
OffshoreDrilling
CoalDistribution
FertiliserBusiness
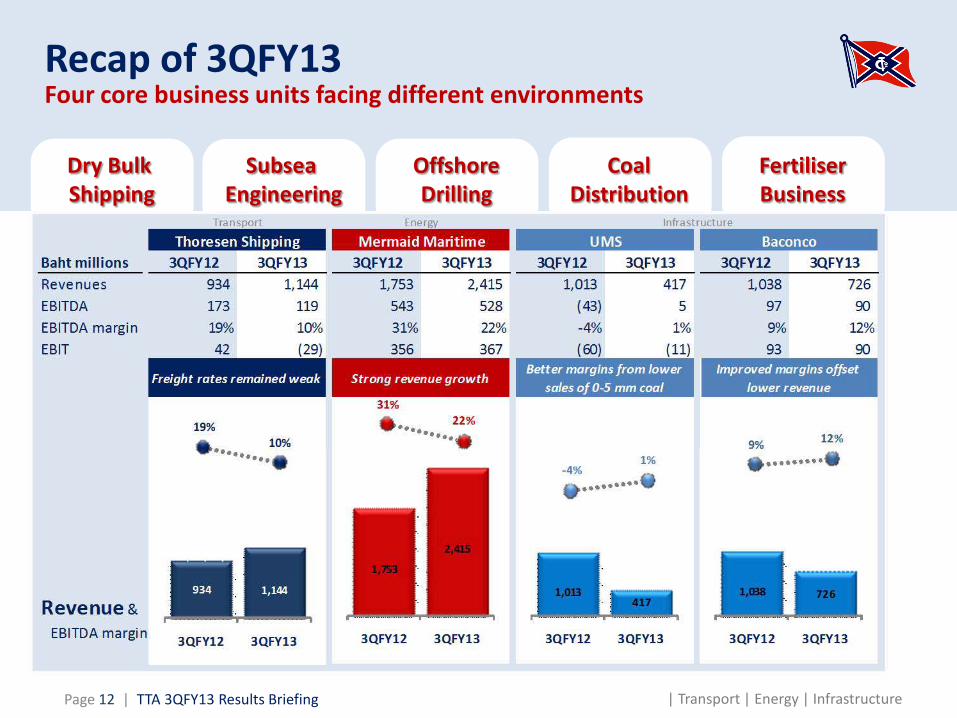
Recap of 3QFY13Four core business units facing different environments
Subsea Engineering
| Transport | Energy | InfrastructurePage 12 | TTA 3QFY13 Results Briefing
Thoresen Thai Agencies Plc.
Results Briefing
Financial ReviewConsolidated Results
| Transport | Energy | Infrastructure
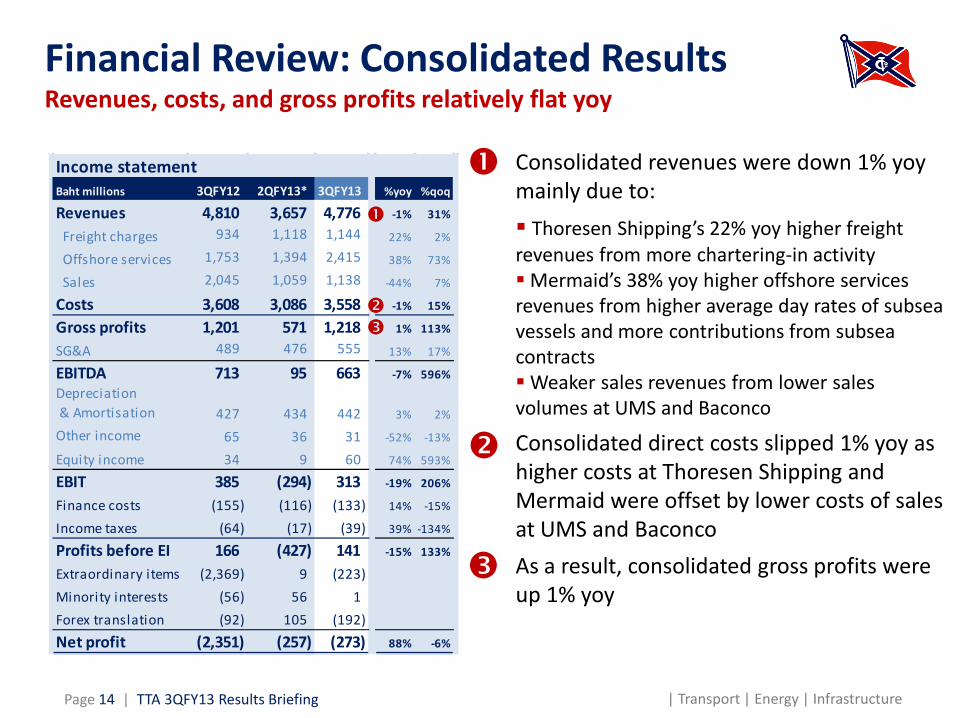
Consolidated revenues were down 1% yoy mainly due to: Thoresen Shipping’s 22% yoy higher freight revenues from more chartering-in activity Mermaid’s 38% yoy higher offshore services revenues from higher average day rates of subsea vessels and more contributions from subsea contractsWeaker sales revenues from lower sales volumes at UMS and Baconco
Consolidated direct costs slipped 1% yoy as higher costs at Thoresen Shipping and Mermaid were offset by lower costs of sales at UMS and BaconcoAs a result, consolidated gross profits were up 1% yoy
Financial Review: Consolidated ResultsRevenues, costs, and gross profits relatively flat yoy
Page 14 | TTA 3QFY13 Results Briefing
Income statementBaht millions 3QFY12 2QFY13* 3QFY13 %yoy %qoq
Revenues 4,810 3,657 4,776 -1% 31%
Freight charges 934 1,118 1,144 22% 2%
Offshore services 1,753 1,394 2,415 38% 73%
Sales 2,045 1,059 1,138 -44% 7%
Costs 3,608 3,086 3,558 -1% 15%
Gross profits 1,201 571 1,218 1% 113%
SG&A 489 476 555 13% 17%
EBITDA 713 95 663 -7% 596%Depreciation & Amortisation 427 434 442 3% 2%
Other income 65 36 31 -52% -13%
Equity income 34 9 60 74% 593%
EBIT 385 (294) 313 -19% 206%
Finance costs (155) (116) (133) 14% -15%
Income taxes (64) (17) (39) 39% -134%
Profits before EI 166 (427) 141 -15% 133%
Extraordinary items (2,369) 9 (223) Minority interests (56) 56 1 Forex translation (92) 105 (192) Net profit (2,351) (257) (273) 88% -6%
| Transport | Energy | Infrastructure
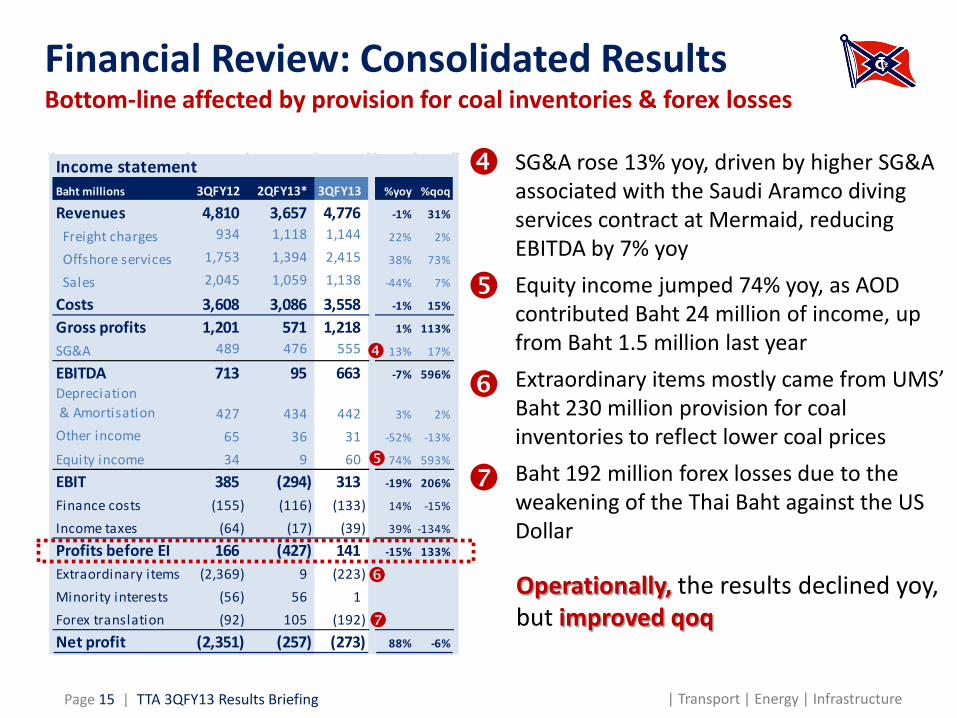
SG&A rose 13% yoy, driven by higher SG&A associated with the Saudi Aramco diving services contract at Mermaid, reducing EBITDA by 7% yoyEquity income jumped 74% yoy, as AOD contributed Baht 24 million of income, up from Baht 1.5 million last yearExtraordinary items mostly came from UMS’ Baht 230 million provision for coal inventories to reflect lower coal pricesBaht 192 million forex losses due to the weakening of the Thai Baht against the US Dollar
Financial Review: Consolidated ResultsBottom-line affected by provision for coal inventories & forex losses
Page 15 | TTA 3QFY13 Results Briefing
Income statementBaht millions 3QFY12 2QFY13* 3QFY13 %yoy %qoq
Revenues 4,810 3,657 4,776 -1% 31%
Freight charges 934 1,118 1,144 22% 2%
Offshore services 1,753 1,394 2,415 38% 73%
Sales 2,045 1,059 1,138 -44% 7%
Costs 3,608 3,086 3,558 -1% 15%
Gross profits 1,201 571 1,218 1% 113%
SG&A 489 476 555 13% 17%
EBITDA 713 95 663 -7% 596%Depreciation & Amortisation 427 434 442 3% 2%
Other income 65 36 31 -52% -13%
Equity income 34 9 60 74% 593%
EBIT 385 (294) 313 -19% 206%
Finance costs (155) (116) (133) 14% -15%
Income taxes (64) (17) (39) 39% -134%
Profits before EI 166 (427) 141 -15% 133%
Extraordinary items (2,369) 9 (223) Minority interests (56) 56 1 Forex translation (92) 105 (192) Net profit (2,351) (257) (273) 88% -6%
Operationally, the results declined yoy, but improved qoq
| Transport | Energy | Infrastructure
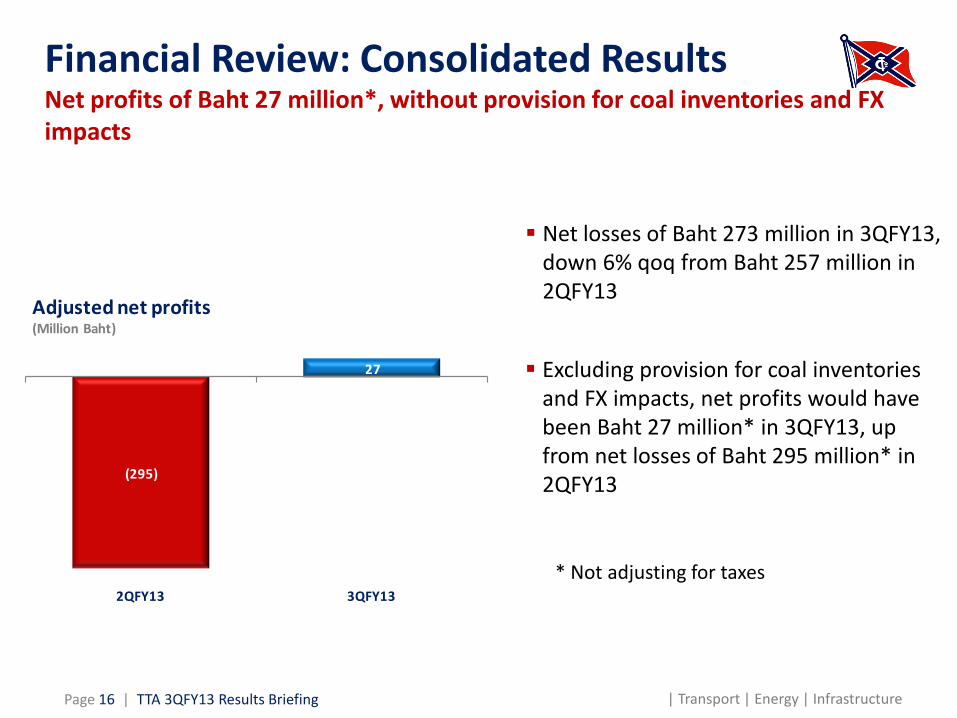
Financial Review: Consolidated ResultsNet profits of Baht 27 million*, without provision for coal inventories and FX impacts
Page 16 | TTA 3QFY13 Results Briefing
Net losses of Baht 273 million in 3QFY13, down 6% qoq from Baht 257 million in 2QFY13
Excluding provision for coal inventories and FX impacts, net profits would have been Baht 27 million* in 3QFY13, up from net losses of Baht 295 million* in 2QFY13
(257) (273)
2QFY13 3QFY13
Reported net profits (Million Baht)
(295)
27
2QFY13 3QFY13
Adjusted net profits (Million Baht)
* Not adjusting for taxes
0.74
0.56
0.270.22
0.45 0.470.55 0.53 0.50 0.53
Sep-06 Sep-07 Sep-08 Sep-09 Sep-10 Sep-11 Sep-12 Dec-12 Mar-13 Jun-13
| Transport | Energy | Infrastructure
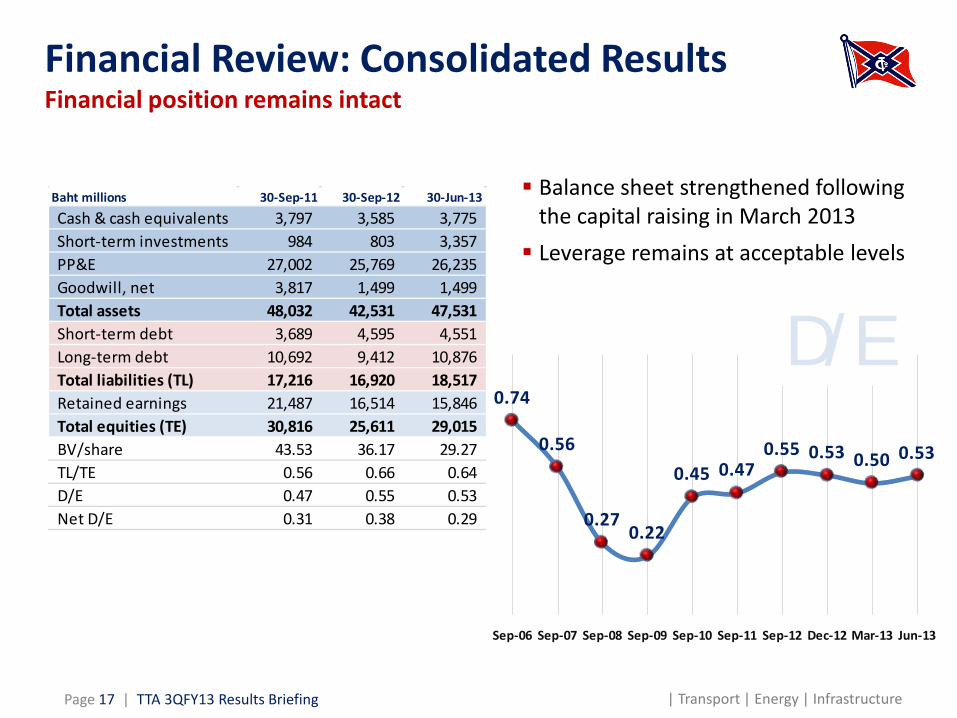
Financial Review: Consolidated ResultsFinancial position remains intact
Page 17 | TTA 3QFY13 Results Briefing
D/E
Balance sheet strengthened following the capital raising in March 2013 Leverage remains at acceptable levels
Baht millions 30-Sep-11 30-Sep-12 30-Jun-13
Cash & cash equivalents 3,797 3,585 3,775 Short-term investments 984 803 3,357 PP&E 27,002 25,769 26,235 Goodwill, net 3,817 1,499 1,499 Total assets 48,032 42,531 47,531 Short-term debt 3,689 4,595 4,551 Long-term debt 10,692 9,412 10,876 Total liabilities (TL) 17,216 16,920 18,517 Retained earnings 21,487 16,514 15,846 Total equities (TE) 30,816 25,611 29,015 BV/share 43.53 36.17 29.27 TL/TE 0.56 0.66 0.64 D/E 0.47 0.55 0.53 Net D/E 0.31 0.38 0.29
| Transport | Energy | Infrastructure
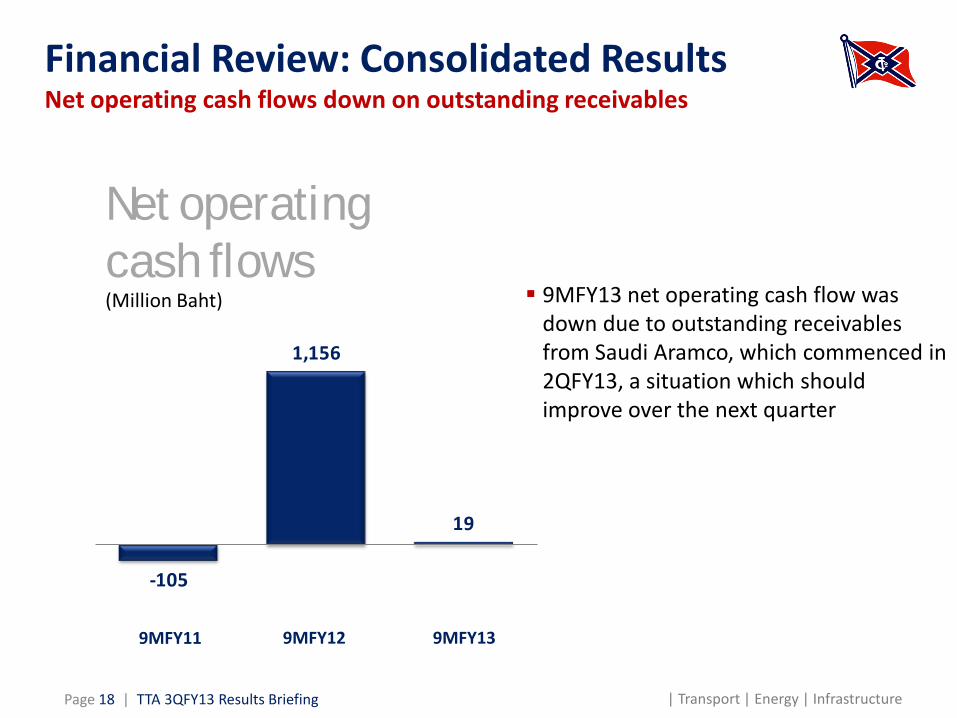
Financial Review: Consolidated ResultsNet operating cash flows down on outstanding receivables
Page 18 | TTA 3QFY13 Results Briefing
9MFY13 net operating cash flow was down due to outstanding receivables from Saudi Aramco, which commenced in 2QFY13, a situation which should improve over the next quarter
Net operating cash flows(Million Baht)
-105
1,156
19
9MFY11 9MFY12 9MFY13
Thoresen Thai Agencies Plc.
Results Briefing
Business OutlookGroup Transport
| Transport | Energy | Infrastructure
Business Outlook: Group TransportDry bulk shippingIndustry prospects show gradual improvements
Page 20 | TTA 3QFY13 Results Briefing
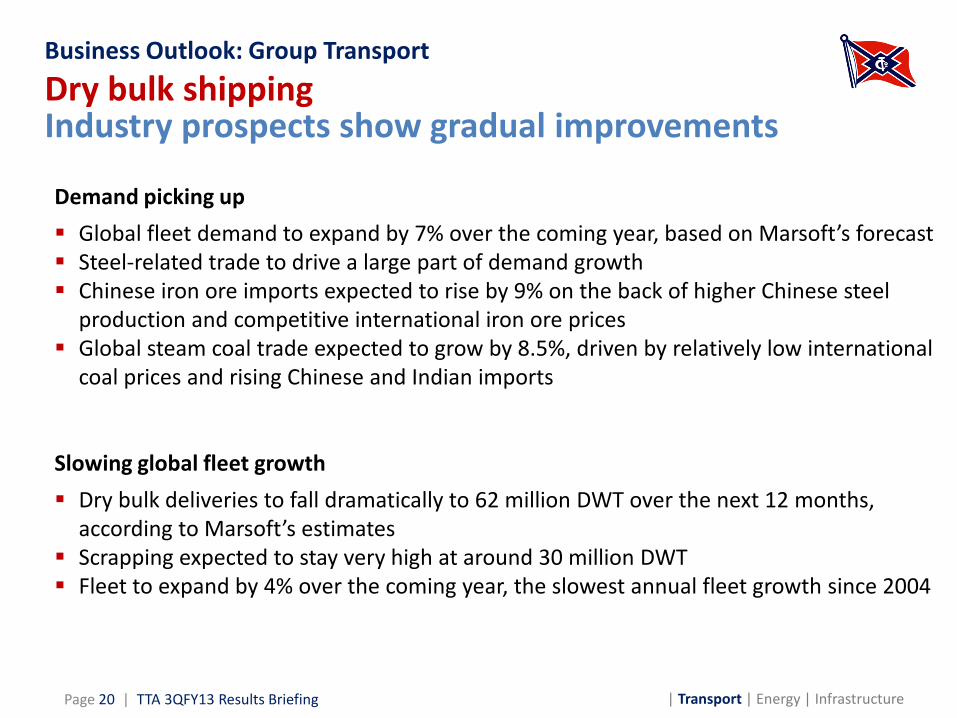
Demand picking up Global fleet demand to expand by 7% over the coming year, based on Marsoft’s forecast Steel-related trade to drive a large part of demand growth Chinese iron ore imports expected to rise by 9% on the back of higher Chinese steel
production and competitive international iron ore prices Global steam coal trade expected to grow by 8.5%, driven by relatively low international
coal prices and rising Chinese and Indian imports
Slowing global fleet growth Dry bulk deliveries to fall dramatically to 62 million DWT over the next 12 months,
according to Marsoft’s estimates Scrapping expected to stay very high at around 30 million DWT Fleet to expand by 4% over the coming year, the slowest annual fleet growth since 2004
| Transport | Energy | Infrastructure
Business Outlook: Group TransportDry bulk shippingGlobal fleet growth slowing down
Page 21 | TTA 3QFY13 Results Briefing
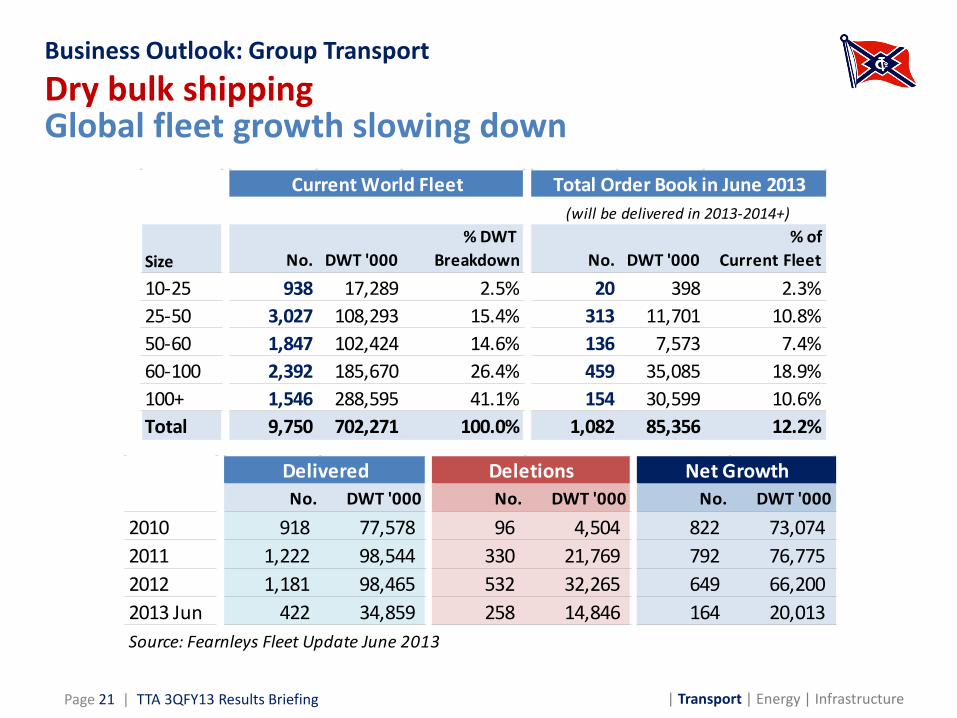
Size No. DWT '000% DWT
Breakdown No. DWT '000% of
Current Fleet
10-25 938 17,289 2.5% 20 398 2.3%25-50 3,027 108,293 15.4% 313 11,701 10.8%50-60 1,847 102,424 14.6% 136 7,573 7.4%60-100 2,392 185,670 26.4% 459 35,085 18.9%100+ 1,546 288,595 41.1% 154 30,599 10.6%Total 9,750 702,271 100.0% 1,082 85,356 12.2%
(will be delivered in 2013-2014+)
Current World Fleet Total Order Book in June 2013
No. DWT '000 No. DWT '000 No. DWT '000
2010 918 77,578 96 4,504 822 73,074 2011 1,222 98,544 330 21,769 792 76,775 2012 1,181 98,465 532 32,265 649 66,200 2013 Jun 422 34,859 258 14,846 164 20,013 Source: Fearnleys Fleet Update June 2013
Delivered Deletions Net Growth
| Transport | Energy | Infrastructure
Business Outlook: Group TransportDry bulk shippingOne vessel delivery in 4QFY13
Page 22 | TTA 3QFY13 Results Briefing
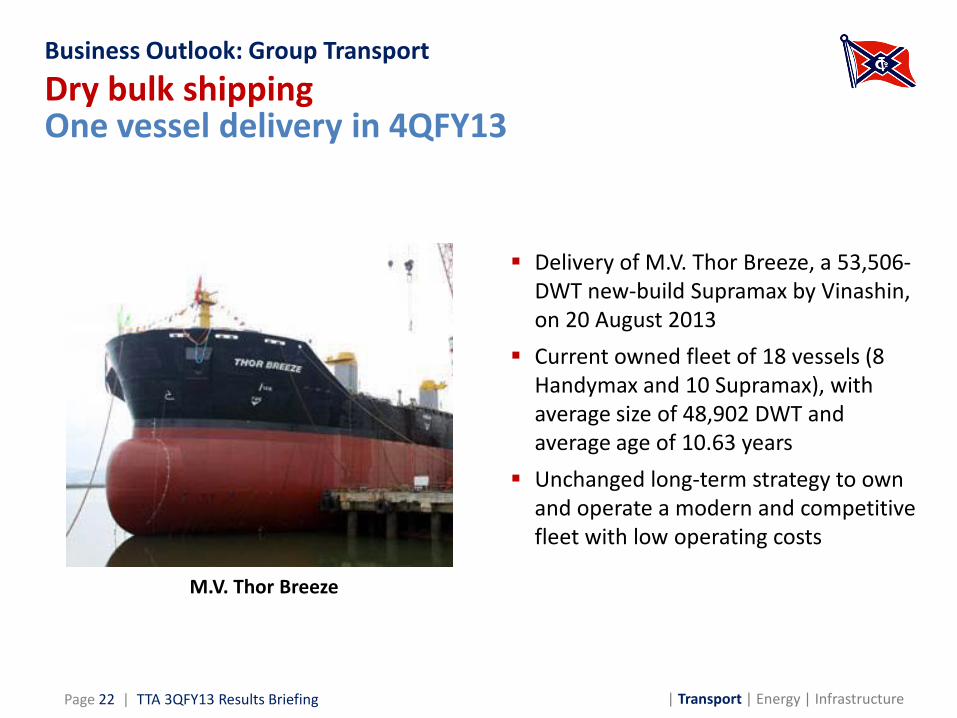
Delivery of M.V. Thor Breeze, a 53,506-DWT new-build Supramax by Vinashin, on 20 August 2013
Current owned fleet of 18 vessels (8 Handymax and 10 Supramax), with average size of 48,902 DWT and average age of 10.63 years
Unchanged long-term strategy to own and operate a modern and competitive fleet with low operating costs
M.V. Thor Breeze
Thoresen Thai Agencies Plc.
Results Briefing
Business OutlookGroup Energy
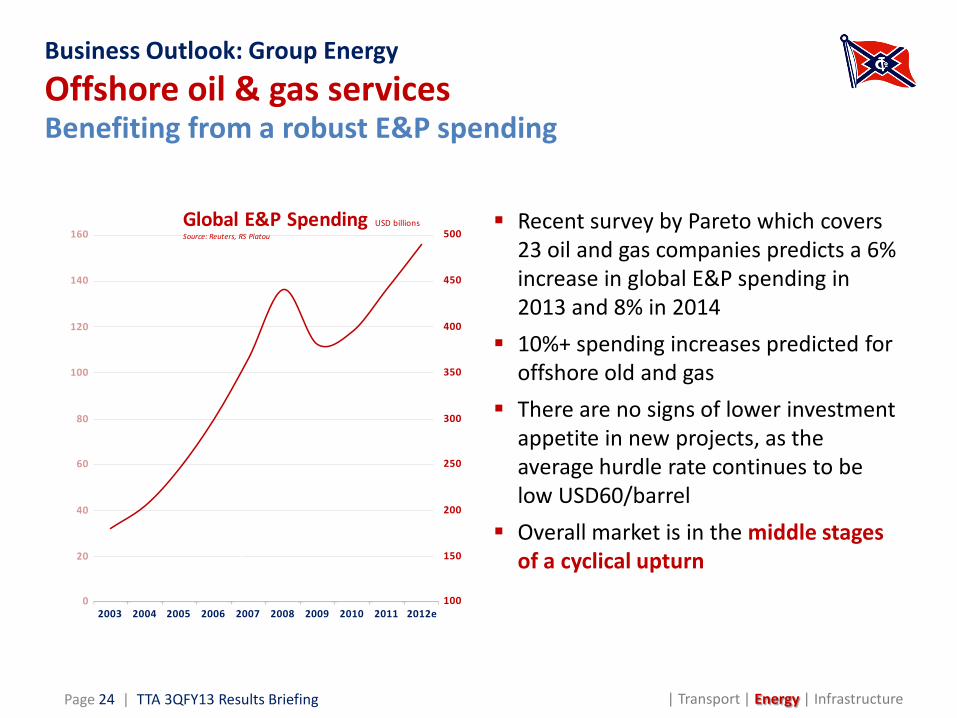
Recent survey by Pareto which covers 23 oil and gas companies predicts a 6% increase in global E&P spending in 2013 and 8% in 2014
10%+ spending increases predicted for offshore old and gas
There are no signs of lower investment appetite in new projects, as the average hurdle rate continues to be low USD60/barrel
Overall market is in the middle stages of a cyclical upturn
0
20
40
60
80
100
120
140
160
May-03 May-04 May-05 May-06 May-07 May-08 May-09 May-10 May-11 May-12
100
150
200
250
300
350
400
450
500
2003 2004 2005 2006 2007 2008 2009 2010 2011 2012E2003 2004 2005 2006 2007 2008 2009 2010 2011 2012e0
20
40
60
80
100
120
140
160Global E&P Spending USD billionsSource: Reuters, RS Platou
100
150
200
250
300
350
400
450
500
Brent Crude Spot USD/Barrel Source: Bloomberg
Business Outlook: Group EnergyOffshore oil & gas servicesBenefiting from a robust E&P spending
Page 24 | TTA 3QFY13 Results Briefing | Transport | Energy | Infrastructure
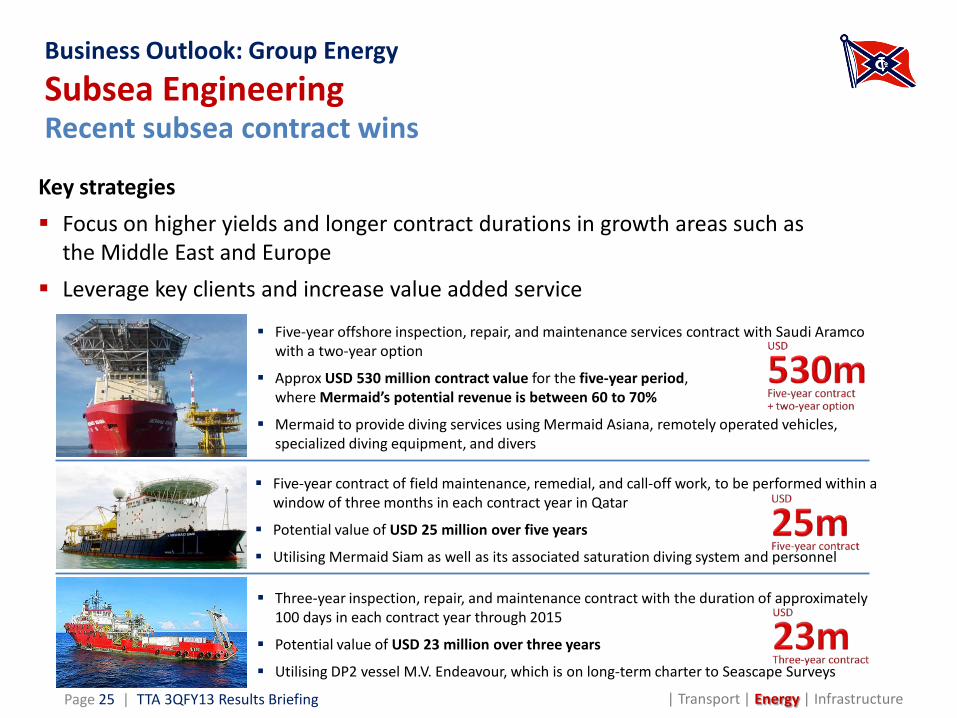
Five-year offshore inspection, repair, and maintenance services contract with Saudi Aramcowith a two-year option
Approx USD 530 million contract value for the five-year period, where Mermaid’s potential revenue is between 60 to 70%
Mermaid to provide diving services using Mermaid Asiana, remotely operated vehicles, specialized diving equipment, and divers
Five-year contract of field maintenance, remedial, and call-off work, to be performed within a window of three months in each contract year in Qatar
Potential value of USD 25 million over five years
Utilising Mermaid Siam as well as its associated saturation diving system and personnel
Page 25 | TTA 3QFY13 Results Briefing
Business Outlook: Group EnergySubsea EngineeringRecent subsea contract wins
| Transport | Energy | Infrastructure
Key strategies Focus on higher yields and longer contract durations in growth areas such as
the Middle East and Europe Leverage key clients and increase value added service
Three-year inspection, repair, and maintenance contract with the duration of approximately 100 days in each contract year through 2015
Potential value of USD 23 million over three years
Utilising DP2 vessel M.V. Endeavour, which is on long-term charter to Seascape Surveys
Business Outlook: Group EnergyOffshore drillingRenewed market interest in tender rig sector
Page 26 | TTA 3QFY13 Results Briefing | Transport | Energy | Infrastructure
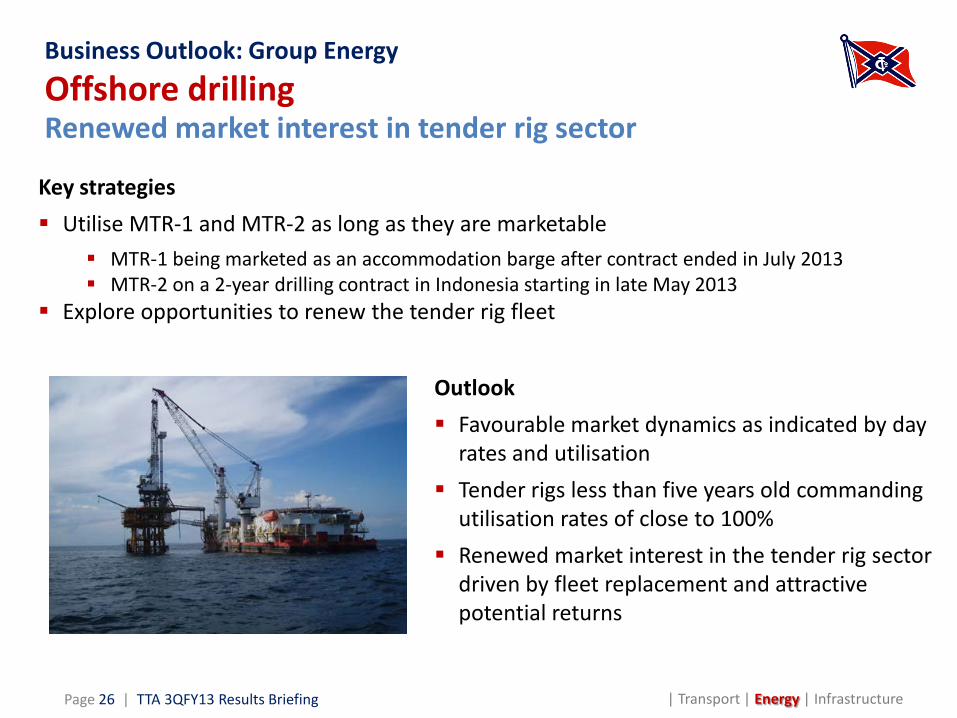
Key strategies Utilise MTR-1 and MTR-2 as long as they are marketable
MTR-1 being marketed as an accommodation barge after contract ended in July 2013 MTR-2 on a 2-year drilling contract in Indonesia starting in late May 2013
Explore opportunities to renew the tender rig fleet
Outlook Favourable market dynamics as indicated by day
rates and utilisation Tender rigs less than five years old commanding
utilisation rates of close to 100% Renewed market interest in the tender rig sector
driven by fleet replacement and attractive potential returns
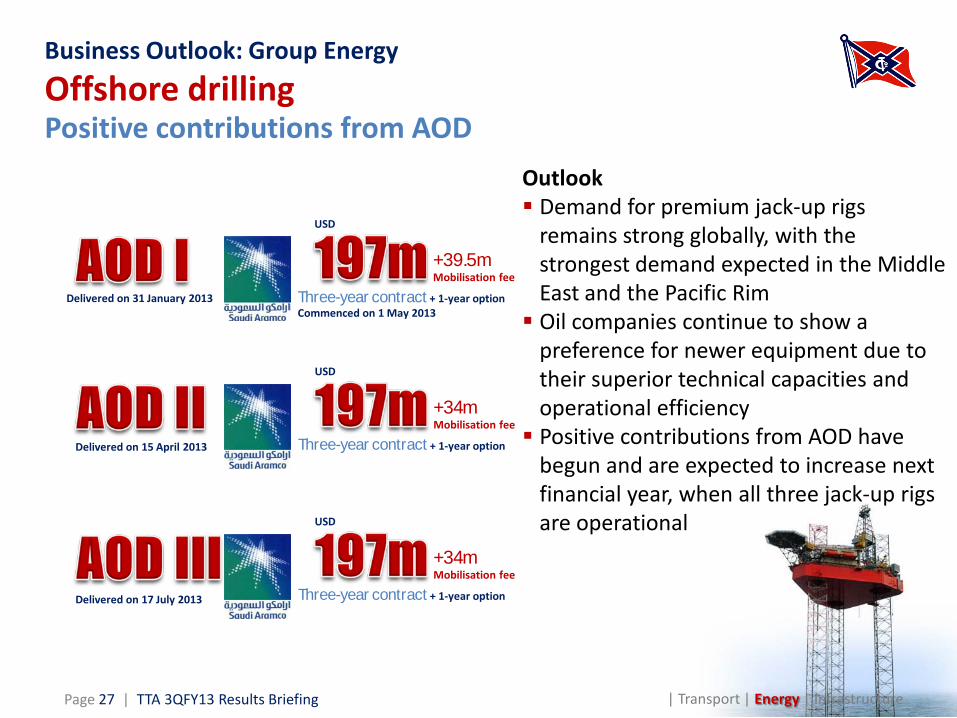
Business Outlook: Group EnergyOffshore drillingPositive contributions from AOD
Outlook Demand for premium jack-up rigs
remains strong globally, with the strongest demand expected in the Middle East and the Pacific Rim Oil companies continue to show a
preference for newer equipment due to their superior technical capacities and operational efficiency Positive contributions from AOD have
begun and are expected to increase next financial year, when all three jack-up rigs are operational
| Transport | Energy | InfrastructurePage 27 | TTA 3QFY13 Results Briefing
USD
Three-year contract + 1-year optionCommenced on 1 May 2013
+39.5mMobilisation fee
USD
Three-year contract + 1-year option
+34mMobilisation fee
USD
Three-year contract + 1-year option
+34mMobilisation fee
Delivered on 31 January 2013
Delivered on 15 April 2013
Delivered on 17 July 2013
Thoresen Thai Agencies Plc.
Results Briefing
Business OutlookGroup Infrastructure
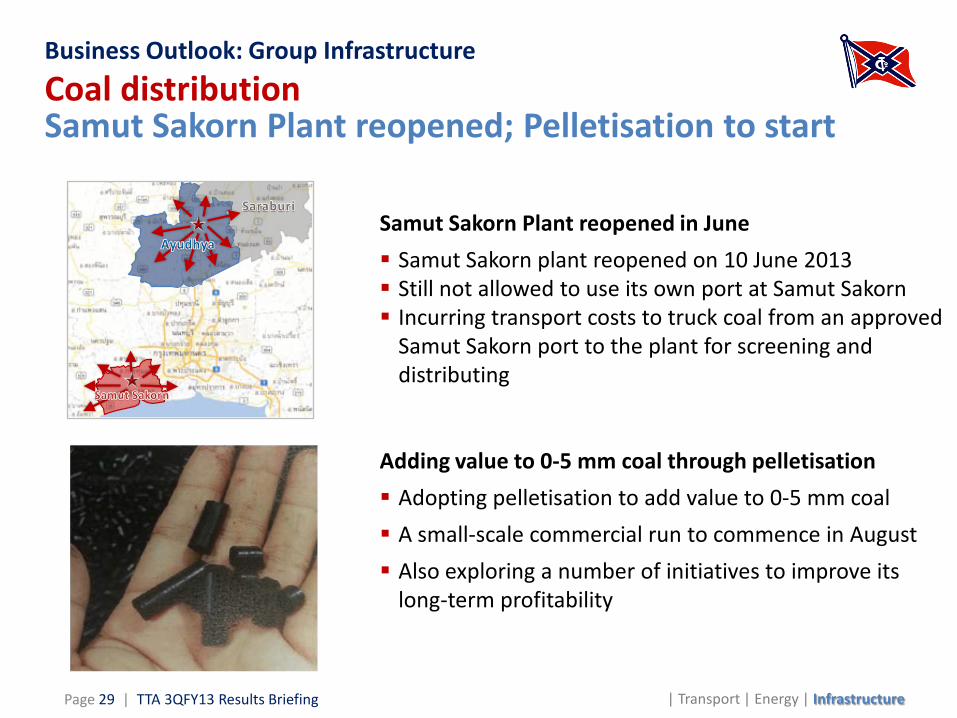
Business Outlook: Group InfrastructureCoal distributionSamut Sakorn Plant reopened; Pelletisation to start
| Transport | Energy | InfrastructurePage 29 | TTA 3QFY13 Results Briefing
Samut Sakorn Plant reopened in June Samut Sakorn plant reopened on 10 June 2013 Still not allowed to use its own port at Samut Sakorn Incurring transport costs to truck coal from an approved
Samut Sakorn port to the plant for screening and distributing
Adding value to 0-5 mm coal through pelletisation Adopting pelletisation to add value to 0-5 mm coal A small-scale commercial run to commence in August Also exploring a number of initiatives to improve its
long-term profitability
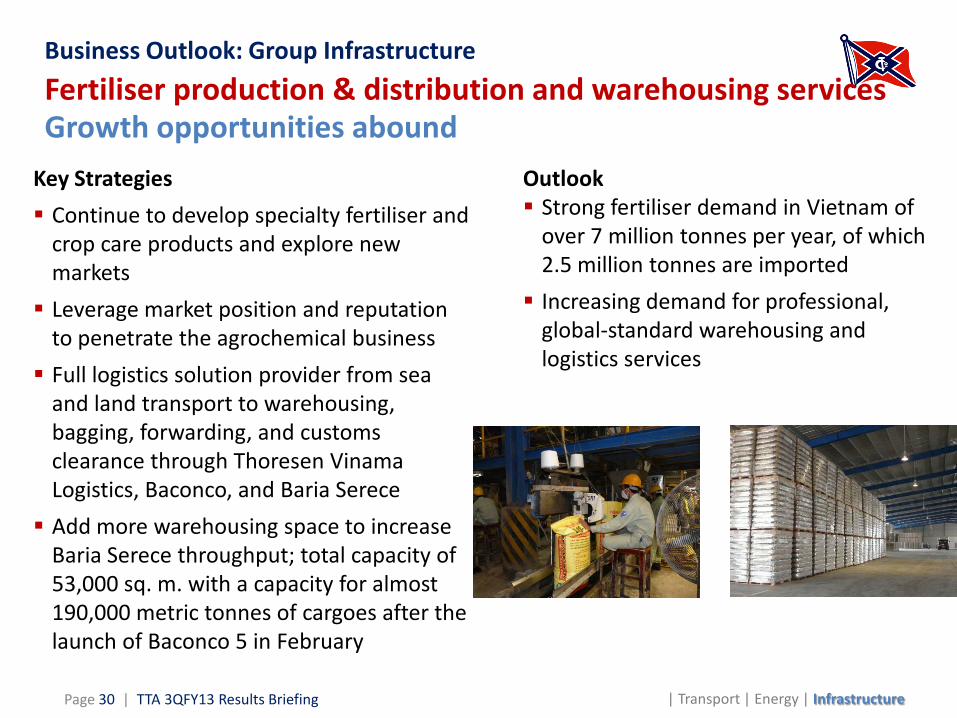
Outlook Strong fertiliser demand in Vietnam of
over 7 million tonnes per year, of which 2.5 million tonnes are imported Increasing demand for professional,
global-standard warehousing and logistics services
Page 30 | TTA 3QFY13 Results Briefing | Transport | Energy | Infrastructure
Business Outlook: Group InfrastructureFertiliser production & distribution and warehousing servicesGrowth opportunities abound
Key Strategies Continue to develop specialty fertiliser and
crop care products and explore new markets Leverage market position and reputation
to penetrate the agrochemical business Full logistics solution provider from sea
and land transport to warehousing, bagging, forwarding, and customs clearance through Thoresen VinamaLogistics, Baconco, and Baria Serece Add more warehousing space to increase
Baria Serece throughput; total capacity of53,000 sq. m. with a capacity for almost 190,000 metric tonnes of cargoes after the launch of Baconco 5 in February
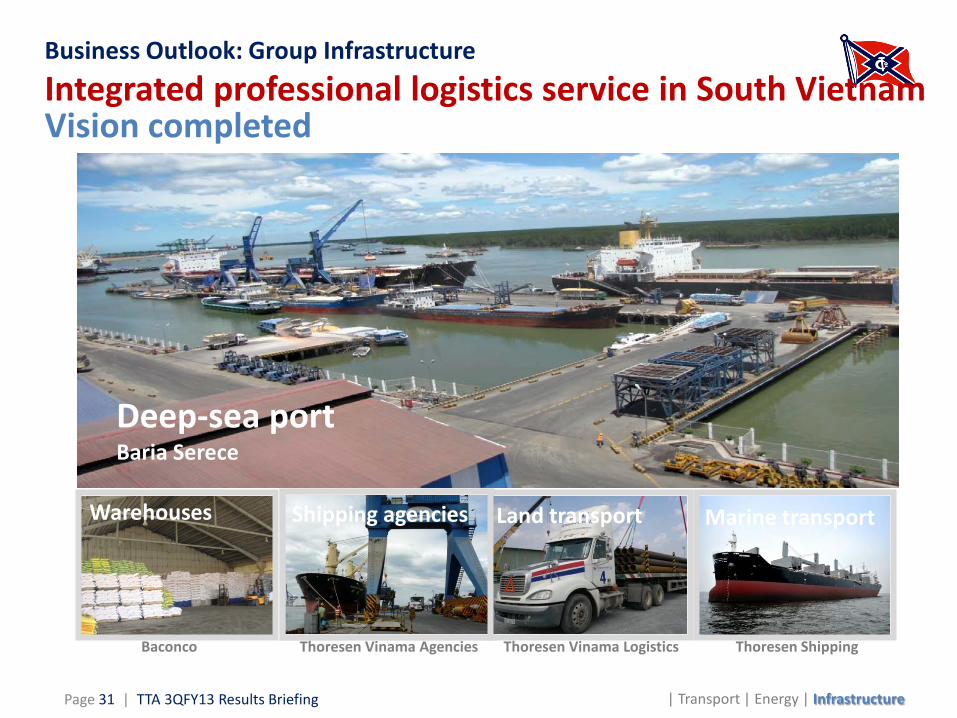
Deep-sea portBaria Serece
Warehouses
Baconco
Shipping agencies Land transport
Thoresen Vinama Agencies Thoresen Vinama Logistics Thoresen Shipping
Marine transport
Page 31 | TTA 3QFY13 Results Briefing | Transport | Energy | Infrastructure
Business Outlook: Group InfrastructureIntegrated professional logistics service in South VietnamVision completed

| Transport | Energy | Infrastructure
Disclaimers
This presentation contains some information from other sources, that TTA does not make any representations regarding the use, validity, accuracy, or reliability of, or the results of the use of information, data but not limited to, all text, and images (“the Content”) on this presentation. Some content may contain forward-looking statements, that based on the Board of Directors and the Management’s view upon the information currently available to us. These statements are subject to certain risks and uncertainties which may cause the actual results, performance or achievements to be materially different from any future results, performance or achievements expressed or implied by such forward-looking statements.
The presentation set forth herein is for informational purposes only. Please note that the Company and executives/staff do not control and cannot guarantee the relevance, timeliness, or accuracy of these statements. The Company undertakes no responsibility on the change after that date stated herein.
Page 32 | TTA 3QFY13 Results Briefing