Embed Size (px)
Citation preview
THE INTERCITY BUS INDUSTRY
IN THE U.S. AND TEXAS
by
Thomas Urbanik II Assistant Research Engineer
Patti L. Bass Research Associate
and
Kenneth R. Marshall Engineering Research Associate
Edited by
A. V. Fitzgerald Assistant Research Specialist
Technical Report 0965-lF
Sponsored by
State Department of Highways and Public Transportation in cooperation with
U.S. Department of Transportation Federal Highway Administration
Texas Transportation Institute The Texas A&M University System
College Station, Texas
August 1981

TABLE OF CONTENTS
I. INTRODUCTION • . . . . . . . . . . . 1
I I.
I I I.
IV.
v.
Study Scope Data Limitations ••
HISTORY AND DEVELOPMENT OF THE NATIONAL INTERCITY BUS INDUSTRY • • • • •••••••••••••
Early Development Growth Trends
. . . . . . . . . Regulation of the Industry • • •••
State Regulation Prior to 1935 •
. . . . . . . . . Federal Regulation •• State Regulation Since 1935 . . . . . . . . . . . .
NATIONAL INDUSTRY PROFILE
Bus Passenger Market • • • •
Estimated Cost of Intercity Passenger Service ••••••• Household and Trip Purpose Characteristics ••••••••• Structure of the Industry • • • • • • • • • • • • •••••
Class I Carriers •••• Class II and Class III Carriers Regular-Route Service
Charter and Special Services Package Express Service
FINANCIAL CONDITION OF THE NATIONAL INDUSTRY •
1
2
5
5
6
• 13 • 13
• 16
• 19
• 21
• • 21
• 25
• • • 26
• 33
• 33 • 35
• 36
• 37
• • • 38
• 41
Profitability of the Industry • 41
Passenger Fares • • • • • • • • • • • • • • • • • • • • • • 45
Operating Expenses • • • • • • • • • • • • • • 46
Profitability of Class I Carriers • • • • • • • • • • • • • 50
Profitability of Class II and III Carriers • • • • • • • • 55
NATIONAL REGULATORY ISSUES • •
Industry Issues and Problems
Industry Structure • Cross-Subsidization
• 59
• 59 • 59
• 60
ii;
Intermodal Competition •••• Small Carrier Concerns ••••••••••••
Issues in the Public Interest ••••••••
Level of Service ••• Fares
The Issue of Regulation Natural Monopoly •••• In the Public Interest
Regulatory Reform Motor Bus Act of 1981 Deregulation Experience
. . . . . . . . . .
. . . . . .
VI. HISTORY AND DEVELOPMENT OF THE TEXAS INTERCITY
VII.
BUS INDUSTRY • • • • ••••
Kerrville Bus Company Growth Trends Current Status . • •
Cities Served Operating Statistics •
REGULATION IN TEXAS
. . . . . . . . . . . . . . . . . . . . . . . . . . . .
Railroad Commission of Texas •
Implications in Texas of Federal Regulatory Reform •
VIII. TEXAS INTERCITY BUS USER SURVEY . . . . . . . . . . . . Intercity Bus User and Travel Characteristics
Age Sex, and Education Occupation
Income ••• Auto Ownership
Travel Characteristics. • ••••••••• Mode of Travel To and From the Bus Station Trip Purpose •• ~rip Length Alternative Mode of Travel Number of Intercity Bus Trips in Past Year •
General Attitudes . . . . . . . . . . . . . . . . . .
iv
61 63
63
63
65
65
65
66 67
68 70
73
74 76
78 85
86
89
90
91
95
98 98
101
101
101
104
104 107
107 107
109 112
Service and Fares •••••••••••••••••••••• Important and Unimportant Features of Intercity Bus Service
Comparison of Texas and Michigan Surveys . . . . IX. TEXAS INTERCITY BUS HOUSEHOLD SURVEY • . . . . . . . . .
Personal Characteristics •
Age, Sex, and Education Occupation •••••••
. . . .
. . .
. . . . . . .
Income • • • • • • • • • . . . . . . . . . . . . . Vehicle Ownership and Licensed Drivers . . . . ' .
General Attitudes . . . . . . . . . . . . . . . . . . ~ . Important and Unimportant Features of Intercity Bus Service
Households Segmented into Users and Nonusers • • ••
Personal Charteristics •••••
General Attitudes ••••••• Households Segmented by Income
. . .
. . . . . . . .
X. OTHER CONSIDERATIONS • . . . . . . . . . Package Express . . . . Secondary Effects of Service Discontinuance . . .
XI. SUMMARY AND CONCLUSIONS . . . . . . . XII. REFERENCES • . . . .
APPENDIX A . . . . . . . . . . .
. . .
. . . . . . . . .
APPENDIX B
APPENDIX C
. . . . . . . . . . . . . . . . . . . . . . . . . . . . . . . . . . .
v
112
114
114
119
121
121
121
126
126
126 129
131'
133 135
136
139
139
140
143
145
147
153
159

I. INTRODUCTION
Significant interest has been generated in recent years concerning the
operation of the intercity bus industry. The reasons for this interest
include the declining financial condition of the industry and the involvement
of government in the subsidy and regulatory reform of other transportation
modes. Recent government involvement in the for-profit intercity bus
industry 1 ed to interest in the Texas industry for assistance in assessing
opportunities for improvements. This study represents one effort by the
Texas State Department of Highways and Public Transportation to provide
technical assistance to the Texas Intercity Bus Industry. The study was
funded by the U.S. Department of Transportation, Federal Highway
Administration.
Study Scope
The primary intent of the study was to develop information and data to
provide a definition of the nature and extent of intercity bus transportation
in Texas. From a sound base of information, various alternative actions
could then be evaluated. A primary area of concern is regulation and the
impacts of regulatory changes on service in Texas. Another area of interest
is possible actions to increase intercity bus use.
The genera 1 organization of the report begins with the presentation of
the available data and analysis concerning the national intercity bus
industry, followed by the data and research on the industry in Texas. The
report then concludes with an examiniation of possible future directions of
the industry. Specific chapters include data on history and development of
the industry, passenger characteristics, financial conditions, and regulatory
1
issues. The report is intended to provide a comp re hens i ve l oak at the
industry in the U.S. and Texas.
Data Limitations
It became clear during the course of the research that there are
limitations on the accuracy of the data generally available. Because of the
data limitations, it was concluded that an explanation of some of the known
problems should preface the discussion of the data. Inconsistencies are
known to exist in the data and other unknown problems may exist. The
authors, therefore, disclaim res pons i bi l i ty for the accuracy of any data
attributed to other sources.
The disclaimer is not a repudiation of the total value of the data; it
is intended only as a strong warning of its limitations. The following will
briefly describe some of the known data limitations.
Much of the data in this report are drawn from Interstate Commerce
Commission reports that are filed on a quarterly and annual basis. There are
strict guidelines describing the methodology to be used to complete the
financial data in these reports, and this information is subject to audits by
the ICC. However, no guidelines exist for the sections containing operating
and nonfinancial statistics. Rather, the individual companies have developed
statistical gathering and reporting methods which fulfill their own internal
needs and governmental requirements, thus many of the statistics are at best
useful to indicate trends rather than specific numbers.
The most salient example of a basic data limitation is the definition
(or in reality, the common lack of definition) of a passenger. Typically,
each bus company (and even each route segment for larger companies) will
count a passenger "on board" a bus. Thus, passengers making a long trip may
2
actually be counted several times when making what the passenger would
consider as one trip. Thus, the number of passengers
relationship with the number of persons who made trips.
reported has no
As wi 11 be shown
later, this method of counting passengers leads to a miscalculation of
average trip length. It is also possible that the trend in passengers over
time may reflect other factors besides the actual number of trips made. As
_routes are consolidated or changed, the number of passengers reported may
change because of the way passengers are counted.
A study by Ramsdel .(1978) suggests that several items of bus passenger
statistics may be inconsistent. Items indicated included type of service
(i.e., local and suburban), bus miles operated, passenger miles and
passengers. Despite the obvious limitations, the reported data does provide
an indication of the nature of the industry.
3


II. HISTORY AND DEVELOPMENT OF THE NATIONAL INTERCITY BUS INDUSTRY
This section presents a brief overview of the historical development of
the intercity bus industry in the United States. Included in this section is
a discussion of the industry's growth, state and federal regulation of the
industry, and the effect these regulatory policies have had on the
development of the industry. Much of this section is based on the
dissertation of Burton B. Crandall, "The Growth of the Intercity Bus
Industry," 1954, his original sources being the only documents available. It
should be noted that some discrepancies exist between the national data and
some of the research findings for Texas. Any discrepancies will be briefly
noted and discussed later in the report.
Early Development
No one date marks the beginning of the intercity bus industry. During
the early 1900's, the use of buses for interurban transportation grew rapidly
throughout scattered sections of the country. These bus operations prospered
as new and better roads were developed and as the popularity of the
automobile increased. By 1915, hundreds of small intercity bus companies
existed throughout the nation.
The rapid growth experienced by the industry has been attributed largely
to the flexibility and convenience of the service, the low capital investment
required and the lack of regulation. Additionally, the lack of strong
opposition from the railroads, their participation in ownership of various
bus companies and their extensive motor bus subsidiaries were important
factors in the development of nationwide bus systems. However, it was
largely the organization of the industry through associations, the
5
realization that regulation was desirable and the publication of a trade
journal that enabled bus operations to become an efficient transportation
system.
Within the intercity bus industry, the need for effective organization
was recognized early. Operators began to form state associations in an
effort to enforce regulations and control irresponsible operators. By 1926
approximately 36 state ass~ciations had been formed. Although the formation
of these associations was an important step for the industry, constant
reorganization made little more than half of them effective, permanent
organizations.
As a result of the ineffectiveness of state associations, efforts were
focused on the formation of a national association. In 1925, the Motor Bus
Division of the American Automobile Association (AAA) was formed. However,
due to the federated form of organization based on state associations, it was
plagued with a lack of cooperation. In 1929, the name was changed to
National Association of Motor Bus Operators and new by-laws were adopted.
This national organization became an independent. organization in 1931, and
since that time has acted in behalf of the industry before national
legislative and administrative agencies.
In 1922, the publication of a trade journal, Bus 'Transportation, was
begun. The purpose of the journal was to help develop bus transportation.
This journal became the journal of the industry and has, from its inception
to the present, helped to foster unity and cohesion within the industry.
Growth Trends
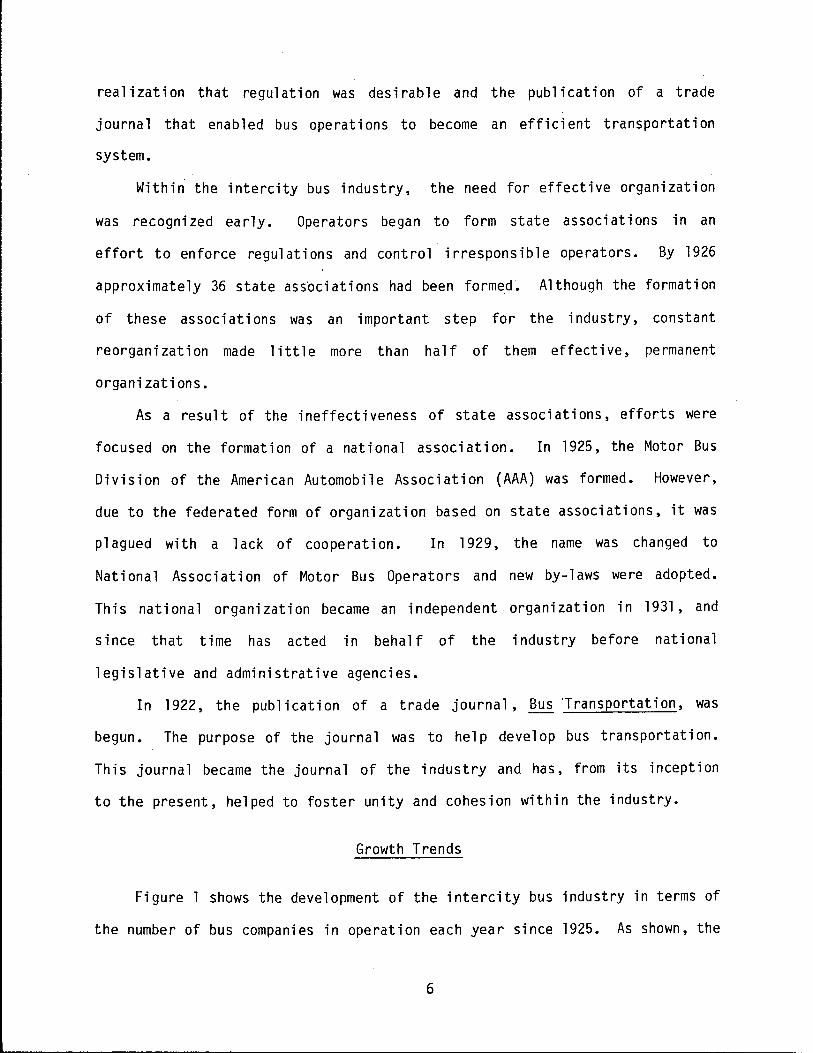
Figure 1 shows the development of the intercity bus industry in terms of
the number of bus companies in operation each year since 1925. As shown, the
6
Vl -0 QJ s.... -0 c: ::l :c
Vl QJ
•r-c: ro CL E 0 u 4-0
s.... QJ
..Cl E ::l z
5000
4000
3000
2000
1000
1925 35 45 55 65 75 Year
Figure 1: Number of Operating Intercity Bus Companies 1
lincludes all Interstate and Intrastate Class I, II and III Carriers.
Sources: Burton B. Crandall; The Growth of the Intercity Bus Industry, Table A-2; Albert E. Meyer and John P. Hoschek. Over the Road: A History of Intercity Bus Transportation in the U.S., p.146; American Bus Association Annual Report, 1980.
7
number of companies declined from a high of 4000 in 1926 to 1800 in 1937. A
major reason for this period of decline was the Depression which forced many
sma 11 owners-operators out of business. During World War I I the number of
companies increased as a result of the additional passengers generated during
this time of gas rationing and increased military service. After 1950, the
number of companies again declined. However, this decline is largely due to
the increased availability and use of automobile and air transportation since
1950.
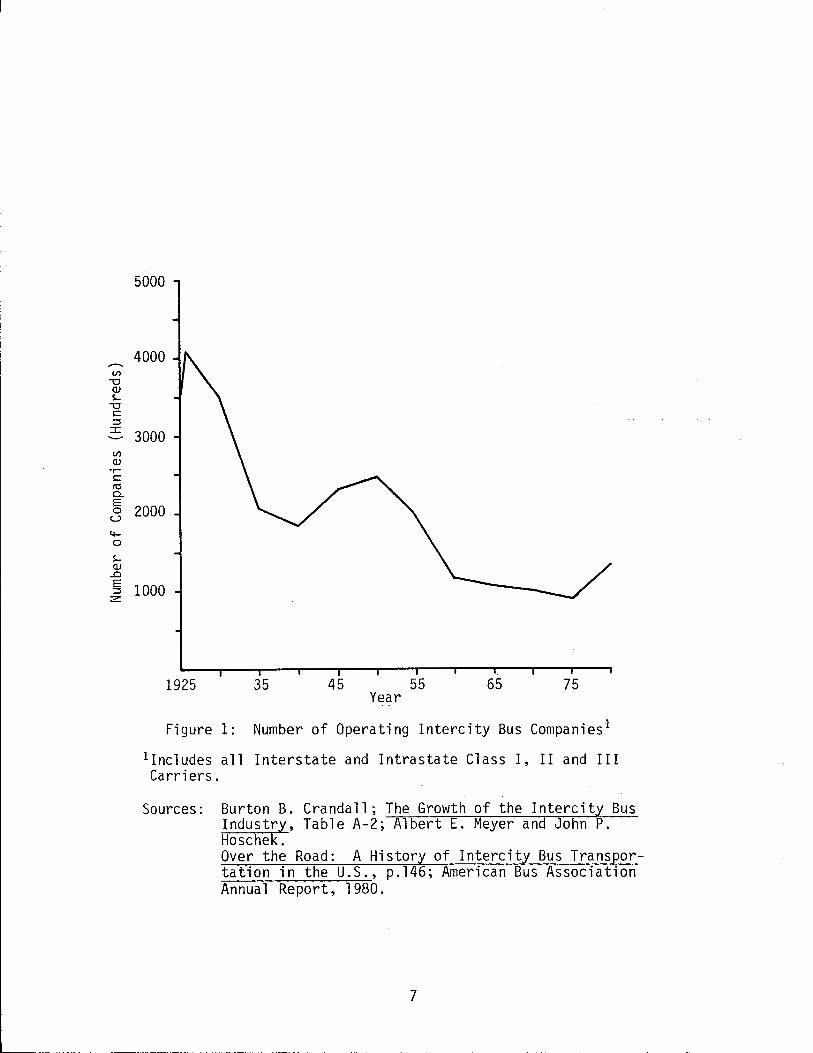
The number of passengers carried by bus fluctuated erratically between
1926 and 1939 as shown in Figure 2. Probably, this was largely due to
economic uncertainties during the Depression. Between 1939 and 1944, during
the height of World War II, the number of revenue passengers increased 330
percent, from 223 mi 11 ion passengers to 958 mi 11 ion passengers. The number
of bus passengers has declined since the World War II peak, and by 1979 the
number of revenue passengers carried had returned to the prewar level.
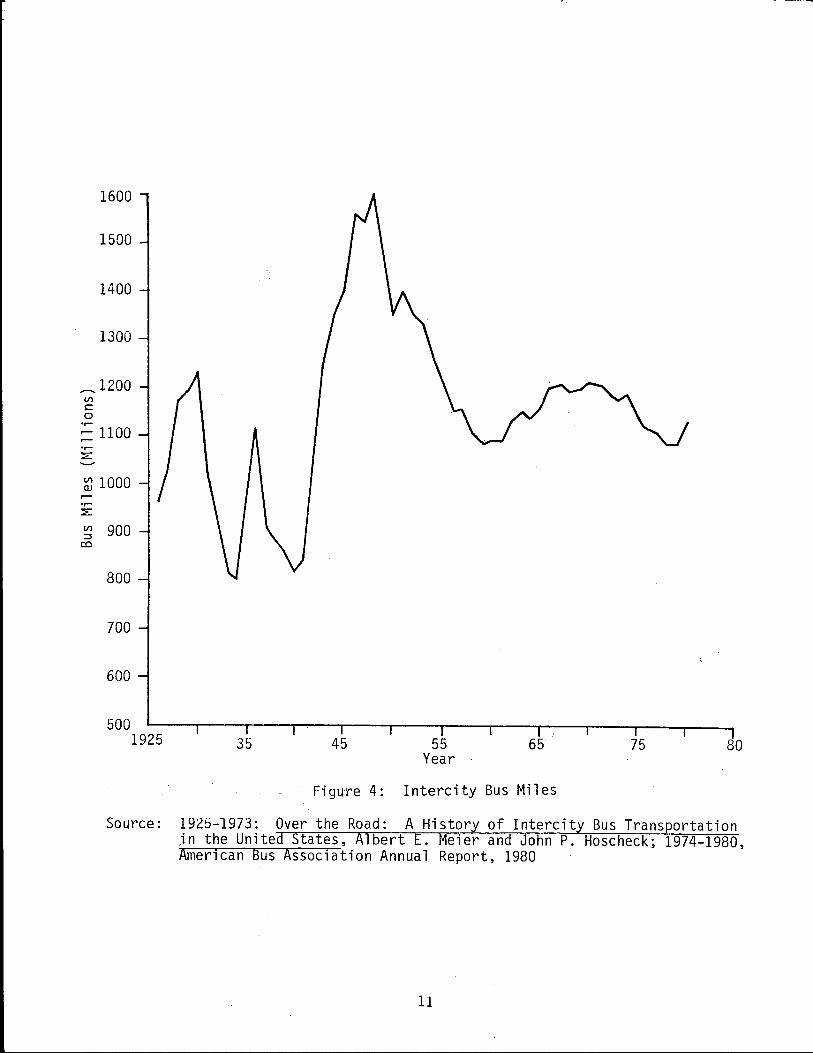
The tot a 1 service provided by the industry in terms of route mil es and
bus miles has, despite dramatic fluctuations, materiall/ increased since
1925, as indicated in Figures 3 and 4. The number of passenger seats
available has more than doubled, from approximately 430,000 seats in 1925 to
almost 922,500 seats in 1979, despite a 10 percent decrease in the number of
buses in operation. This is due to the increase in the average seating
capacity per bus from 23 in 1927 to between 43 and 49 seats today.
(Crandall, 1954; American Bus Association, 1980)
The historical trend in the number of passenger-miles operated by
intercity bus carriers is shown in Figure 5. As with bus-miles and number of
passengers carried, the number of passenger-mil es operated increased
tremendously during the war years and declined during the fifteen years
8
1000
Vl s::: 0
r-r-·.-:;::
Vl s... Q)
en s::: Q) Vl Vl It! 0..
Q) ::I s::: Q)
> Q)
0:::
900
800
700
600
500
400
300
200
100 1925 35 45 55 65 75
Year
Figure 2: Revenue Passengers
Source: 1925-1973, Over the Road: A History of Intercity Bus Transportation in the United States, Albert E. Meier and John P. Hoschek. 1974-1979, American Bus Association Annual Report, 1980.
9

V> -0 c:: C'O V> ::I 0
..s::::: I-:._.,
V> QJ
.--•r-::2::
QJ
+> ::I 0 0::
400 -
350
300
250
200
150
l 00 1925 35 45 55 65 75
Year
Figure 3. Intercity Bus Route Mil es
Source: 1925-1973, Over the Road: A History of Intercity Bus Transportation in the United States, Albert E. Meier and John P. Hoscheck; 1974-1979, American Bus Association Annual Report, 1980.
10
1600
1500
1400
1300
__ 1200 (/)
s:: 0 .,.... r- 1100 r-
:::E:
~ 1000 .,.... ::E:
(/) 900 :::I co
800
700
600
500 1925 35 45 55
Year 65
Figure 4: Intercity Bus Miles
75 80
Source: 1925-1973: Over the Road: A History of Intercity Bus Transportation jn the United States, Albert E. Meier and John P. Hoscheck; 1974-1980, American Bus Association Annual Report, 1980
11
30
25
20 Ill s:: 0 ......
..-
...... co
Ill Q) 15
...... ~
~ Q) C'l s:: Q) Ill Ill
10 tO CL
5
1930 40 50 60 70 80 Year
Figure 5: Intercity Bus Passenger Miles (1930-1980)
Source: 1930-1973, Over the Road: A History of Intercity Bus Transportation in the United States, Albert E. Meier and John P. Hoscheck; 1974-1979, American Bus Association Annual Report, 1980.
12
following the war. Since 1960, the number of passenger-miles has increased
steadily, unlike the number of passengers carried. This is due to the
increase in the average trip length per passenger from 57 miles in 1952 to
125 miles in 1979. (These national trip lengths differ substantially from
the data collected in Texas.)
Although the industry has experienced fluctuations in market demands, it
has 9rown to become the most widely used form of public intercity
transportation. Not only is it the most geographically widespread, serving
approximately 15, 000 communities, but it al so carries more passengers than
any other public intercity mode of transportation. (Transportation Research
Boa rd, 1980)
Regulation of the Industry
State Regulation Prior to 1935
The first state to initiate passenger bus regulations was Pennsylvania
in 1914. By 1930, all states, with the exception of Delaware, had instituted
some form of regulation of the intercity bus industry. The type and amount
of control used by the states varied. Some states extensively controlled
certification, service and rates, while others were concerned solely with
safety regulations. However, the chief method of control utilized by the
states was the power to grant or deny operating certificates. In granting
certificates of authority the state commissions were required to interpret
the meaning of the 'phrase "public convenience and necessity" in each
situation as established in the Code of Fair Competition of the Nati ona 1
Association of Motor Bus Operators. For the most part, the commissions held
that if the public in general, rather than a group or groups of individuals,
was served, a certificate would be granted.
13
Under this type of regulation the industry gained considerable financial
and managerial stability as the state commissions, in granting certificates,
usually favored the existing carrier if adequate service was being rendered.
This resulted in protection for existing carriers from excessive
competition.
During the early years of regulation the industry was undergoing
tremendous growth. Due to the great number of applicants for certificates,
the state commissions had difficulty in determining the status of each. In
order to ease the burden of these applications, many states issued
"grandfather rights". This refers to the policy of issuing a certificate to
any carrier that was in bona fide operation as of a certain date. However,
under this policy the commissions reserved the right to review these
certificates if any questions arose later.
In 1925, the state commissions began adopting the policy of regulated
monopoly in dealing with the intercity bus industry. This policy assumed
that the motor carrier was a public utility and, as such, was subject to
public regulation. Under this policy the existing carrier was considered to
be the established carrier and was given priority as long as adequate service
was being provided. If the existing carrier was not adequately serving the
public interest, the commissions would authorize competing service. This
policy worked to the advantage of the railroads which were often the
established carrier and thus were generally given priority when they chose to
start motor bus operations.
The policy of regulated monopoly helped to provide the maximum
utilization of equipment and also enabled the commissions to tailor service
to meet public demands. The protection from competition allowed owners to
concentrate on improving their services. In addition, the reduction in
14
competitive expenditures al lowed more revenues to be used for expansion of
the companies.
The bus industry's favorable attitude toward regulation was important in
preventing more restrictive regulatory or competitive policies from being
imposed. Lack of opposition to the industry from the public and the
commissions, due to the compliance of the industry with the regulations,
enabled the industry to expand rapidly.
Consolidation The period from 1926 to 1930 was one of rapid
consolidations in the intercity bus industry. The state commissions were
generally in favor of mergers. The regulatory policies followed by the
commissions were such that once sufficient certificates were issued to handle
the demand, the only way to acquire additional operating territory was to
buy-out or merge with existing carriers.
Most consolidations were comprised of integrations of operations between
several small towns, or end-to-end combinations to secure a through route
between urban centers. The greatest amount of growth, however, occurred
within the long-haul interstate lines.
In 1926, a $10 million holding company was formed around the Greyhound
Line operating from Grand Rapids,
interstate routes in the Midwest.
Michigan to Chicago to acquire some
Greyhound deve 1 oped into a nationwide
system through the purchase of local and regional bus systems. It was
largely the policy of regulated monopoly followed by the states that allowed
this national bus company to come about. The regulation of competition gave
existing carriers stability and, thus, value as established carriers.
15
Federal Regulation
Between 1925 and 1930 increasing pressure for federal regulation of the
industry developed. This was largely due to a U.S. Supreme Court decision in
Buck v. Kuykendall. In this decision, state jurisdiction over carriers
operating interstate lines was revoked. As a result of this ruling, carriers
could escape regulation as long as they crossed state lines along their
routes.
In 1928, as the result of a study conducted by the Interstate Commerce
Commission {ICC), it was concluded that regulafion of interstate common
carriers of passengers should be provided. In 1935, seven years after the
study, the Motor Carrier Act was passed by Congress, bringing interstate
motor carrier operations under the jurisdiction of the ICC. The act gave the
ICC the power to regulate certification and mergers or transfers of
certificates of interstate carriers and to regulate the setting of public
fares and safety precautions.
Operating Authority Since gaining regulatory control over the
interstate bus industry, the ICC has not followed the policy of regulated
monopoly which had been utilized by most of the states. Rather, two
different policies have been followed by the ICC. One policy has been to
increase the competition of existing carriers in order to promote adequate
service. This was accomplished by certifying additional long-haul carriers,
by granting extensive certificates to railroad motor bus subsidiaries, and,
after 1942, by granting route extensions to and allowing acquisitions by
members of the Trail ways System in order to unite their routes and compete
with Greyhound. One change that the ICC made that augmented this increase to
competition was the substitution of the phase "in the public interest" for
16
"public convenience and necessity" in the certification and acquisition
cases. This change was determined in 1936 in the case of Pan American Bus
Lines Operation, M.C.C.190. This case involved the granting of a
certificate for a long-di stance route between New York City and Miami ,
Florida. The service was to be superior to the existing service, requiring
no change of buses and following a more scenic route.
The certificate was highly protested, and the case resulted in the
following standards to be considered in the interpretation of public
convenience and necessity. First, the proposed service must serve a useful
purpose and be responsive to a public demand or need. Second, it should be
determined if the proposed service can be provided by the existing carrier.
Third, the proposed operation should not endanger or impair the service of
existing carriers. Fourth, that competition is not forbidden by the Motor
Carrier Act and may serve a useful purpose. These changes al lowed the
Commission to certify competing carriers on less evidence than was formerly
required. (Crandall, 1954)
The second policy followed by the ICC has been to use some restraint in
granting competing certificates in order to promote better service. In
following this policy, the ICC would grant existing carriers exclusive
operating rights within certain areas. Usually, this policy was utilized in
allowing acquisitions that reduced or restrained competition. The authority
to follow this policy was provided in Section 5 of the Motor Carrier Act.
The main problem the Commission faced was in determining the extent to which
competition should be restrained. Generally, it was held that when
substantial public benefits would result, competition should be reduced.
Fares Under the Motor Carrier Act bus fares must be
nondiscrimnatory, just and reasonable, set at the lowest level consistent
17
with providing service and published in tariffs. Motor carriers must file
their tariffs with the ICC 30 days in advance of the effective date to ensure
adequate public notice. If, upon investigation, the Commission finds the
fares to be unlawful, the Commission may prescribe the maximum, minimum
or actual rate to be charged.
Generally, the ICC has used the operating ratio (the ratio of operating
expenses to operating revenues) as the criterion for determining the need for
increased revenue. In 1946 it was determined that an operating ratio of 85
before Federal income taxes would produce a reasonable return. This
operating ratio of 85 is still used today, although other factors are also
analyzed to determine the need for specific rate proposals.
Bus Schedules - The ICC has never required regular route .carriers to
file schedule changes. The carriers are free to adjust the volume and
frequency of interstate service, and can even allow service to become
dormant. However, the operating certificates granted by the Commission do
require that the carrier maintain adequate and reasonably continuous service.
Thus, if the Commission finds that the service rendered is not adequate the
carrier may be forced to improve its service or forfeit its certificate.
Package Express, Charter and Special Services - Under the Interstate
Commerce Act, passenger carriers are permitted to transport package express
traffic within the same vehicle as passengers. Package express authority is
not incidental to regular route operating certificates. Rather, the carrier
must show that the service is required by public convenience and necessity.
In addition, since 1937 it has been held by the ICC that package express
authority must be subordinate to the transport of passengers. This means
that the carriers 1 primary service is passenger transportation, and the
18
comfort, safety and convenience of the passengers must -be their foremost
concern.
Prior to 1967, any grant of certificate for regular route operating
authority included the right for the carrier to engage in charter and/or
special service operations as long as the charter service originated within
the carriers' regular route operating terrority. The only limit to this
Charter Authority was that the carrier must be engaged in regular route
service before it can conduct charter service. In June 1967, however, the
Interstate Commerce Act was amended to require that any carrier seeking
charter authority must specify such a request in an application, and the
carrier must also show that public convenience and necessity requires such
service.
State Regulation Since 1935
Since the initiation of federal regulation in 1935, some states have
continued to consistently follow the policy of regulated monopoly, thereby
restricting competition when the existing carrier is rendering adequate
service. However, the majority of states have followed the role of federal
regulation and adhere to the policy of regulated competition. The reason for
this shift in policy was due to the financial stability achieved by the
industry. Protecting the industry from all competition was no longer
necessary; therefore, the basic consideration used by the states when
granting certificates was that the service be in the public interest, rather
than required by pub 1 i c convenience and necessity. Although most states
began following the policy of regulated competition, they continued to
consistently protect the existing carrier by allowing the operator the
opportunity to provide additional service before competing certificates were
19
issued, or by allowing him the opportunity to show just cause why the
competing certificate should not be issued.
In summary, the intercity bus industry grew rapidly during the early
years of its existence. The interaction between three factors, associations
within the industry, the publication of a trade journal, and the recognized
need for regulation, helped to foster a stable industry by 1925. It is
apparent that regulation, both State and Federal, has had a strong influence
on the structure of .the industry and helped in the development of two
dominant, national carriers, Greyhound and Trailways.
The intercity bus industry has a well-defined market in passenger
transportation. The type and extent of services provided are important to
the future of the industry and are discussed in detail in the following
chapter.
20
III. NATIONAL INDUSTRY PROFILE
Intercity bus is an integral part of the public transportation system;
it also serves passengers who do not have other means of intercity
transportation. It provides inexpensive, widespread service to thousands of
passengers. This section examines the bus market, passenger characterstics
and the structure of the industry in order to facilitate understanding of the
issues and policies discussed in later sections.
Bus Passenger Market
The intercity bus industry provides scheduled passenger and express
freight service to almost 15,000 cities and towns and charter service.to
virtually everywhere within the United States. The industry serves 96% of
the towns with a population between 2500 and 5000, and all towns with a
population greater than 5000. By comparison, approximately 645 cities have
scheduled air service and 500 cities are served by Amtrak. (Transportation
Research Board, 1980) Thus, the intercity bus industry is vital to many
people, particularly people in areas not served by other modes.
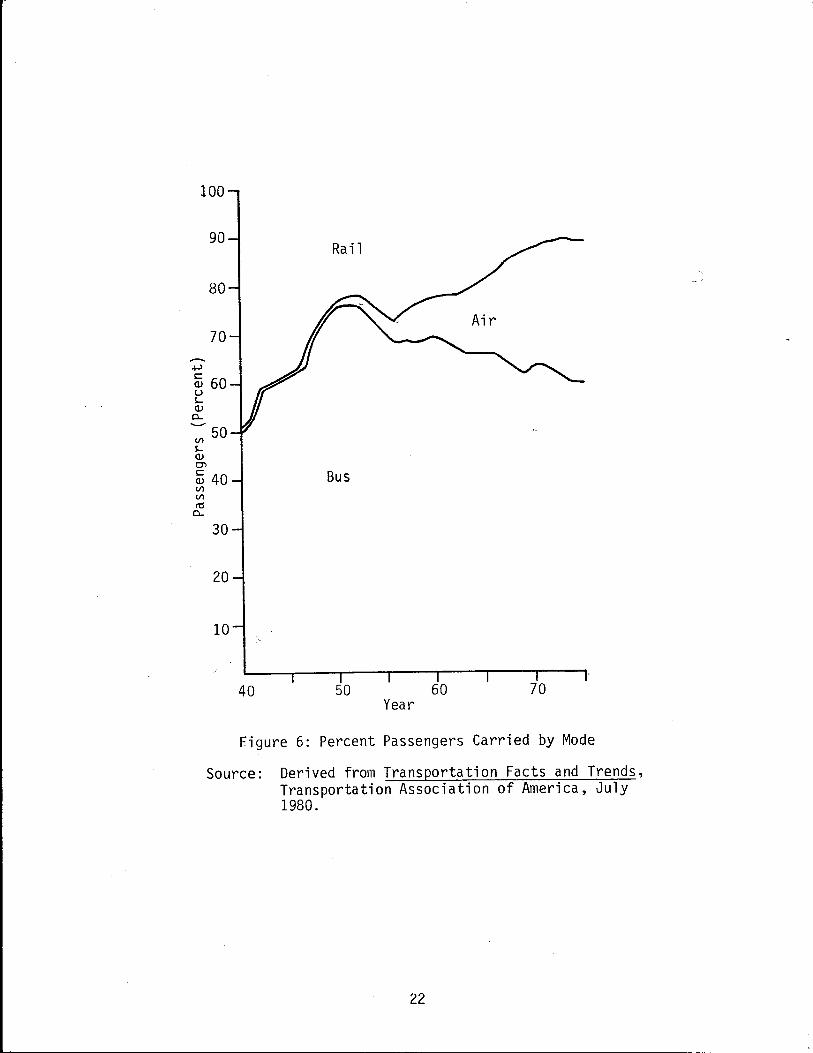
Not only is the bus industry geographically widespread, it also carries
more passengers than any other mode of pub 1 i c intercity transportation. As
shown in Figure 6, the bus industry has, since 1940, carried more intercity
passengers than rail or airlines. However, in terms of passenger-miles,
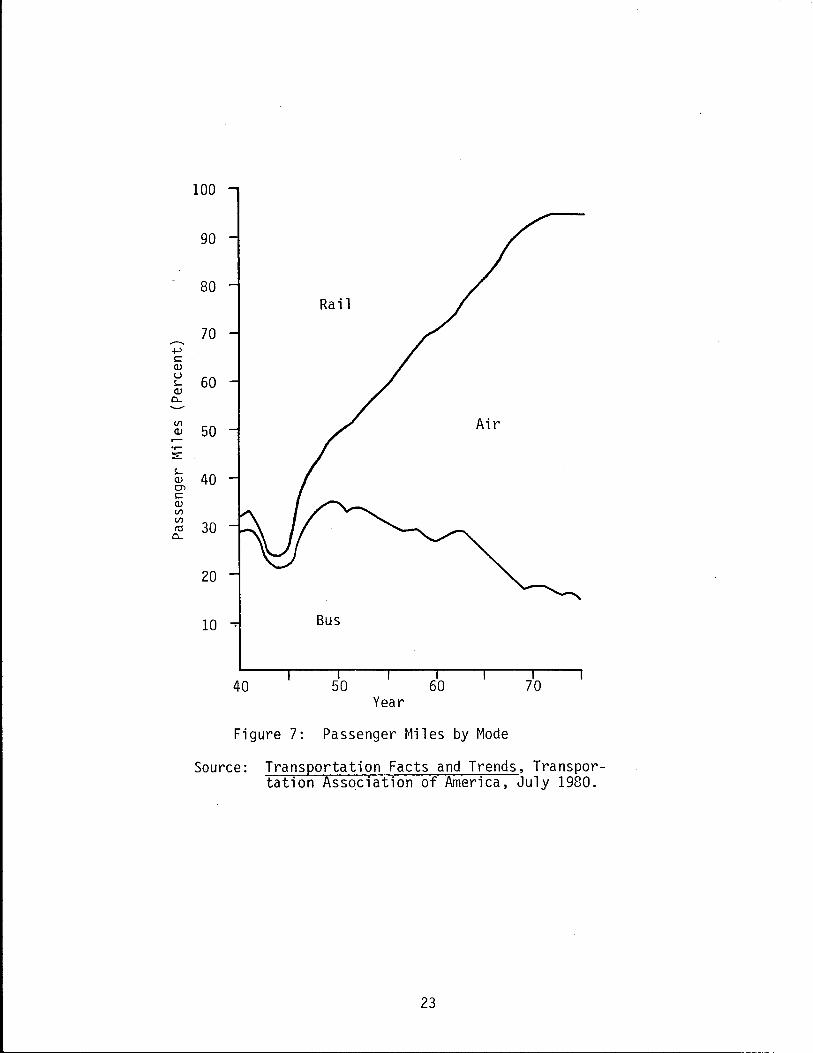
airlines have become dominant as shown in Figure 7. In 1940, airlines
accounted for 3.3 billion passenger-miles, 1.2 percent of public intercity
traffic. In 1979, airlines accounted for almost 85 percent of intercity
public transportation passenger-miles. By comparison, bus passenger-miles
peaked in 1949 accounting for 35 .4 percent of the market, and today account
21
100
90
80
70
+> ~ 60 u s.... Q)
a...
Vl 50
s.... Q) O'>
~ 40 Bus Vl Vl ro
a...
30
20
10
40 50 60 70 Year
Figure 6: Percent Passengers Carried by Mode
Source: Derived from Transportation Facts and Trends, Transportation Association of America, July 1980.
22
.µ s:: (!) u ~ (!)
0...
Vl (!)
·~ ~
~ (!) O'l s:: (!) Vl Vl ro
0...
100
90
80
70
60
50
40
30
20
10 Bus
40 50 60 70 Year
Figure 7: Passenger Miles by Mode
Source: Transportation Facts and Trends, Transportation Association of America, July 1980.
23

for approximately 10 percent of the intercity pub 1 i c transportation
passenger-miles. The great difference in the number of passenger-miles
provided by the various modes of public transportation is largely due to the
differences in the average trip length. Average trip lengths in 1979 for
rail, bus and air passengers were 37 miles, 125 miles and 714 miles,
respectively. {Transportation Association of America, 1980). As wi 11 be
noted later, the actual lrip length for intercity bus trips may be longer
than reported.
Despite competition between the public modes of intercity travel, the
automobile is the strongest competitor of the bus industry. Since the end of
World War II, automobile ownership has grown continuously. In fact, auto
ownership has grown at a rate greater than the general population growth, as
indicated in Table 1.
Table I: Estimated Auto Ownership vs. Population Growth
% Change % Change from from
Auto Previous Population Previous Year Ownership Date (Millions) Date
1947 30,849,353 - 144 -1950 40,399,077 30.9 152 5.5
1960 61,682,304 50.6 181 19.0
1970 89,279,864 44.7 205 13.2
1978 116,574,999 30.5 219 6.8
Source: Transportation .Association of America, Transportation Facts and Trends, July, 1980.
In addition to the growth of auto ownership, total highway mileage
increased by approximately 22% between 1929 and 1975, and, more important,
the quality of the highway system has improved. In 1929, only 41.4 percent
of the primary state roads were paved, while by 1970 over 99 percent of these
roads were paved. (Interstate Commerce Commission, 1978).
24
In terms of share of the intercity passenger market, the automobile has
been the dominant carrier since the end of World War II, consistently
accounting for 80 to 90 percent of all intercity traffic. For example, in
1979 total intercity traffic amounted to 1,553.7 billion passenger-miles.
The automobile accounted for 1,287.9 billion passenger-miles or 82.9 percent
of the total passenger-miles. (Transportation Association of America, 1980)
This is approximately 48 times more passenger-miles than provided by bus and
6 times more than provided by airlines. Indeed, as shown by Table 2, the
automobile is the major transportation mode for intercity travel even for
long di stances.
Table 2: Percentage Distribution of Person-Trips by Distance of Trip, 1972
Percent Percent Distance Person- by by Pub Ii c
Trips Auto Transport
200 - 399 Miles 42% 97%
400 - 599 Miles 20% 93%
600 - 799 Miles 10% 88%
800 - 999 Ml les 5% 77%
1,000 Miles or More 19% 63%
Outside Continental U.S. 4% 49%
Source: Transportation Association of America, Transportation Facts and Trends, July, 1980.
Estimated Cost of Intercity Passenger Service
3% 7%
12% 23%
37%
51%
Historically, the most important factor influencing the bus fare
structure has been competition. As mentioned previously, the bus industry's
greatest competition comes from the private automobile, which possesses the
advantage of complete flexibility in time, direction and movement. In these
respects, the bus is at a disadvantage. However, the advantage of the bus in
25
this competition with the automobile is in its lower cost to the passenger.
The bus industry's present fare structure is the result of the competition
from private autos, rail carriers, airlines, competition within the industry
itself, and regulation.
Table 3 gives the average cost per passenger-mile by transportation
mode. As shown, the differential between the cost of bus and the cost of air
or ra i 1 tra ve 1 has narrowed. The difference between bus and ra i 1 fa res, in
particular, has become small; largely due to government subsidies to rail
carriers which actually make rail fares lower than bus fares for some trips.
The different i a 1 between automobi 1 e costs and bus costs has not narrowed as
much as for other modes. However, the cost differential between auto and bus
is not as great as it appears in Table 3 because the data are for one person.
Thus, it would be cheaper for a family of four to travel by auto than by any
other mode of transportation including bus.
Household and Trip Purpose Characteristics
The National Travel Survey from the 1977 Census of Transportation was
utilized to identify various characteristics of bus passengers and their trip
purposes. Identification of these characteristics can help establish the
particular needs of the bus industry and help provide a basis for public
pol icy decisions regarding the treatment of the services handled by the
industry. Although the National Travel Survey is the most complete source of
public data on travel patterns, there are two potential limitations in
relation to intercity bus trips. First, the census takes into account only
those trips in which a person travels at least 100 miles away from home and
returns. The average distance traveled by bus passengers is reported
(American Bus Association 1980) to be 125 miles. As will be seen later, the
26
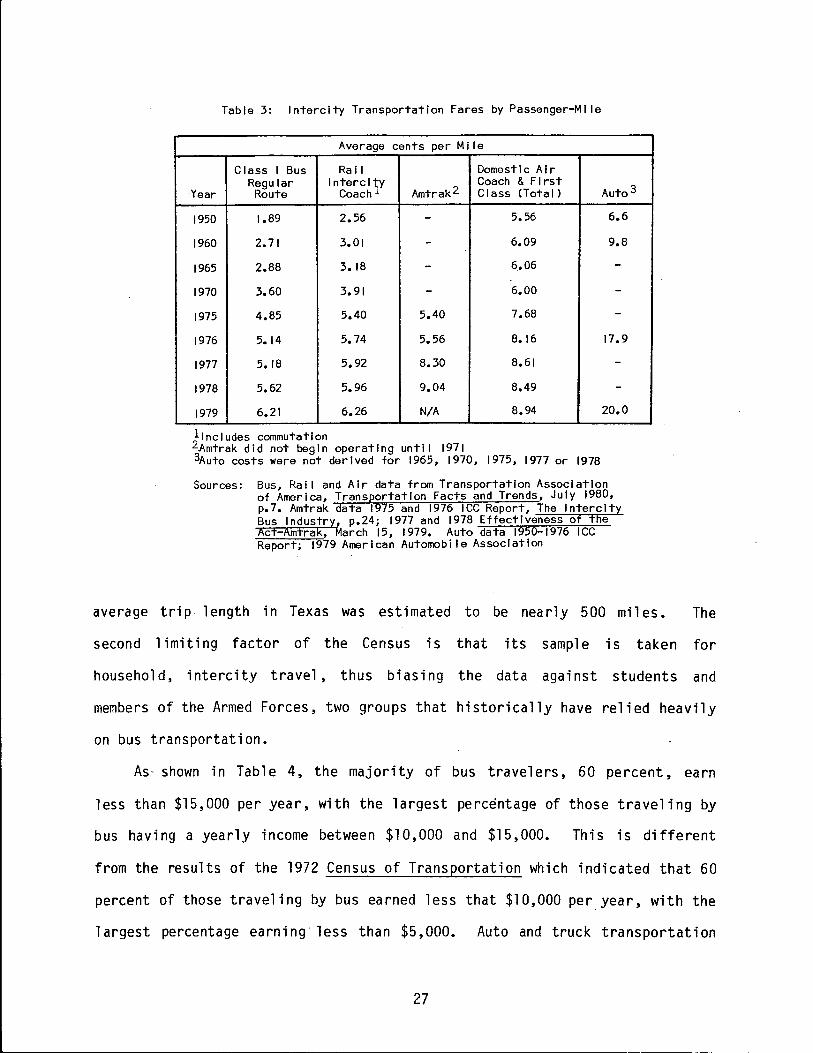
Table 3: Intercity Transportation Fares by Passenger-Mlle
Average cents per M 11 e
Class I Bus Ral I Domestic Air Regular Intercity Coach & First
Auto3 Year Route Coach Amtrak2 Class <Total)
1950 1.89 2.56 - 5. 56 6.6
1960 2.71 3.01 - 6.09 9.8
1965 2.88 3. 18 - 6.06 -1970 3.60 3.91 - 6.00 -
1975 4.85 5.40 5.40 7.68 -1976 5. 14 5.74 5.56 8.16 17.9
1977 5. 18 5.92 8.30 8.61 -
1978 5.62 5.96 9.04 8.49 -
1979 6.21 6.26 N/A 8.94 20.0
11ncludes commutation 2Amtrak did not begin operating until 1971 3Auto costs were not derived for 1965, 1970, 1975, 1977 or 1978
Sources: Bus, Rall and Air data from Transportation Association of America, Transportation Facts and Trends, July 1980, p.7. Amtrak data 1975 and 1976 ICC Report, The Intercity Bus Industry, p.24; 1977 and 1978 Effectiveness of the Act-Amtrak, March 15, 1979. Auto data 1950-1976 ICC Report; 1979 American Automobile Association
average trip length in Texas was estimated to be nearly 500 miles. The
second limiting factor of the Census is that its sample is taken for
household, intercity travel, thus biasing the data against students and
members of the Armed Forces, two groups that historically have relied heavily
on bus transportation.
As- shown in Table 4, the majority of bus travelers, 60 percent, earn
less than $15,000 per year, with the largest percentage of those traveling by
bus having a yearly income between $10,000 and $15,000. This is different
from the results of the 1972 Census of Transportation which indicated that 60
percent of those traveling by bus earned less that $10,000 per year, with the
largest percentage earning less than $5,000. Auto and truck transportation
27
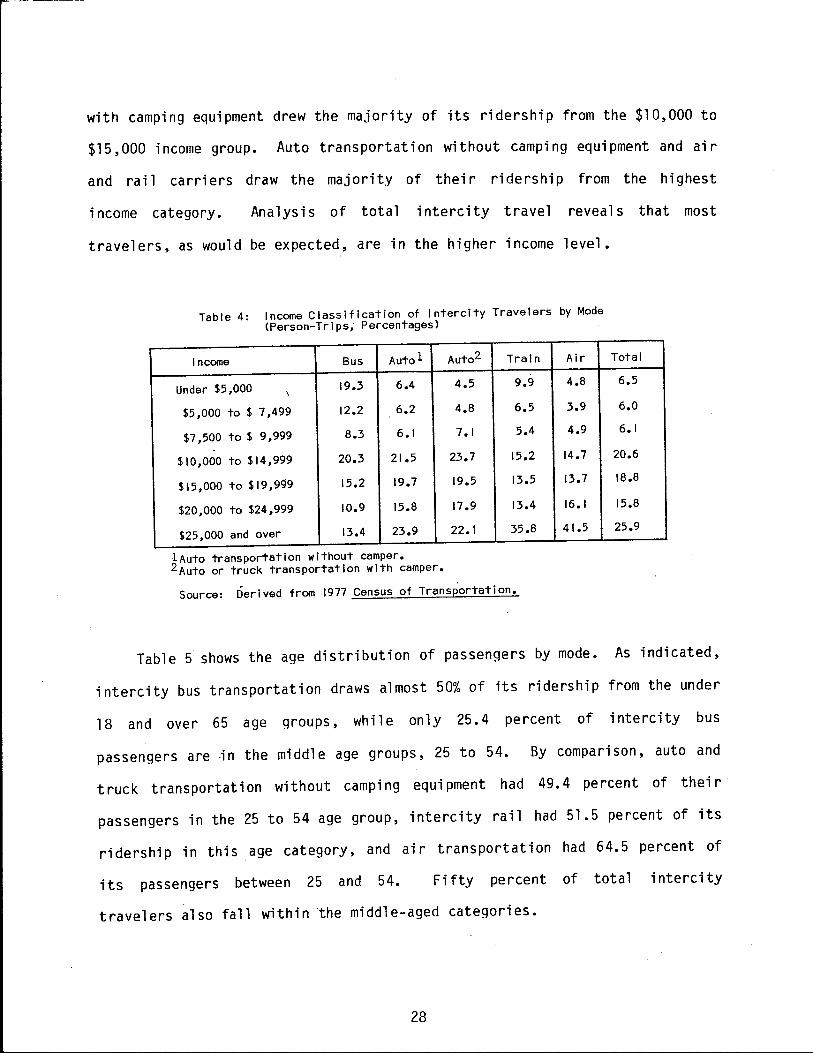
with camping equipment drew the majority of its ridership from the $10,000 to
$15,000 income group. Auto transportation without camping equipment and air
and rai 1 carriers draw the majority of their ride rs hip from the highest
income category. Analysis of total intercity travel reveals that most
travelers, as would be expected, are in the higher income level.
Table 4: Income Classification of Intercity Travelers by Mode (Person-Tri p s; Percentages)
Income Bus Autol
Under $5,000 19.3 6.4 \
$5,000 to$ 7,499 12.2 6.2
$7,500 to$ 9,999 8.3 6.1
$10,000 to $14,999 20.3 21.5
$15,000 to $19,999 15.2 19.7
$20,000 to $24,999 10.9 15.8
$25,000 and over 13.4 23.9
1 Auto transportation without camper. 2Auto or truck transportation with camper.
Auto2 Train
4.5 9.9
4.8 6.5
7. I 5.4
23.7 15.2
19.5 13.5
17.9 13.4
22. I 35.8
Source: Derived from 1977 Census of Transportation.
Air
4.8
3.9
4.9
14.7
13.7
16.1
41.5
Total
6.5
6.0
6.1
20.6
18.8
15.8
25.9
Table 5 shows the age distribution of passengers by mode. As indicated,
intercity bus transportation draws almost 50% of its ridership from the under
18 and over 65 age groups, while only 25.4 percent of intercity bus
passengers are -in the middle age groups, 25 to 54. By comparison, auto and
truck transportation without camping equipment had 49.4 percent of their
passengers in the 25 to 54 age group, intercity rail had 51.5 percent of its
ridership in this age category, and air transportation had 64.5 percent of
its passengers between 25 and 54. Fifty percent of tot a 1 i nte re ity
travelers also fall within the middle-aged categories.
28
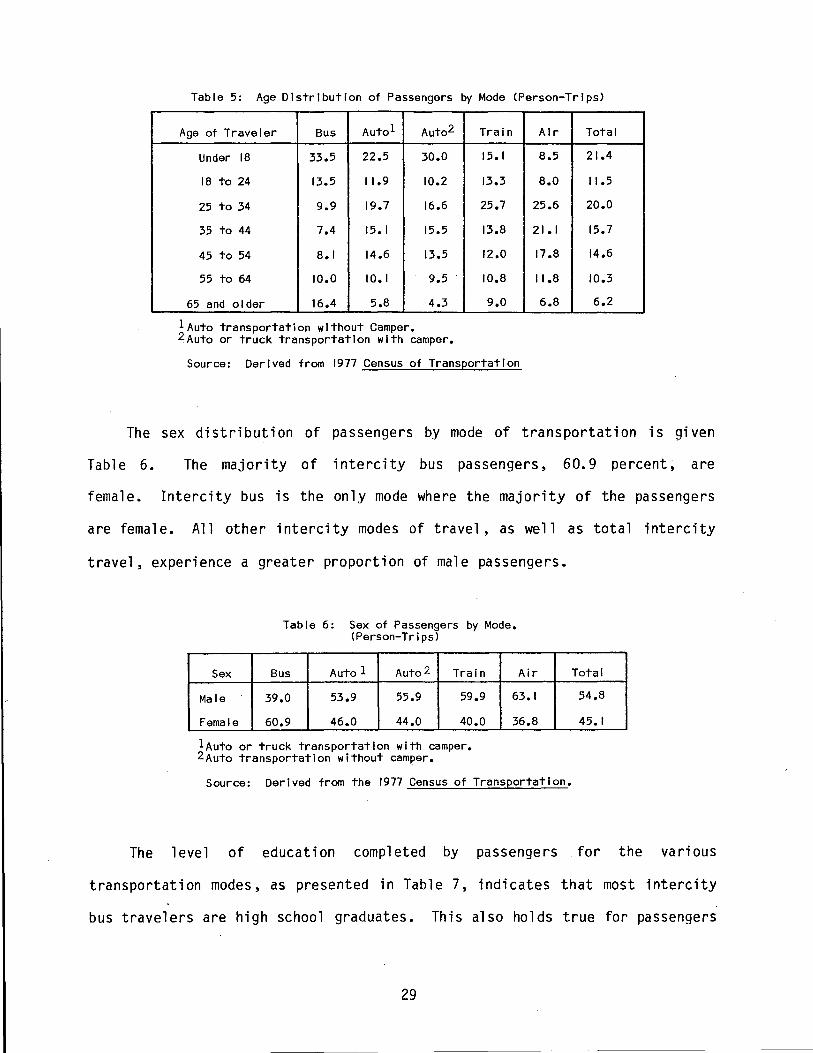
Table 5: Age Distribution of Passengers by Mode (Person-Trips)
Age of Traveler Bus Autol Auto2
Under 18 33.5 22.5 30.0
18 to 24 13.5 11.9 10.2
25 to 34 9.9 19.7 16.6
35 to 44 7.4 15. I 15.5
45 to 54 8.1 14.6 13.5
55 to 64 10.0 10.1 9.5
65 and older 16.4 5.8 4.3
lAuto transportation without Camper. 2Auto or truck transportation with camper.
Train
15. I
13.3
25.7
13.8
12.0
10.8
9.0
Source: Derived from 1977 Census of Transportation
Air Total
8.5 21.4
8.o 11 .5
25.6 20.0
21. I 15.7
17.8 14.6
I 1.8 10.3
6.8 6.2
The sex distribution of passengers by mode of transportation is given
Table 6. The majority of intercity bus passengers, 60.9 percent, are
female. Intercity bus is the only mode where the majority of the passengers
are female. All other intercity modes of travel, as well as total intercity
travel, experience a greater proportion of male passengers.
Sex
Male
Female
Table 6: Sex of Passengers by Mode. (Person-Tri psl
Bus Auto 1 Auto2 Train Air
39.0 53.9 55.9 59.9 63.1
60.9 46.0 44.0 40.0 36.8
lAuto or truck transportation with camper. 2Auto transportation without camper.
Source: Derived from the 1977 Census of Transportation.
Total
54.8
45.1
The level of education completed by passengers for the various
transportation modes, as presented in Table 7, indicates that most intercity
bus travelers are high school graduates. This also holds true for passengers
29
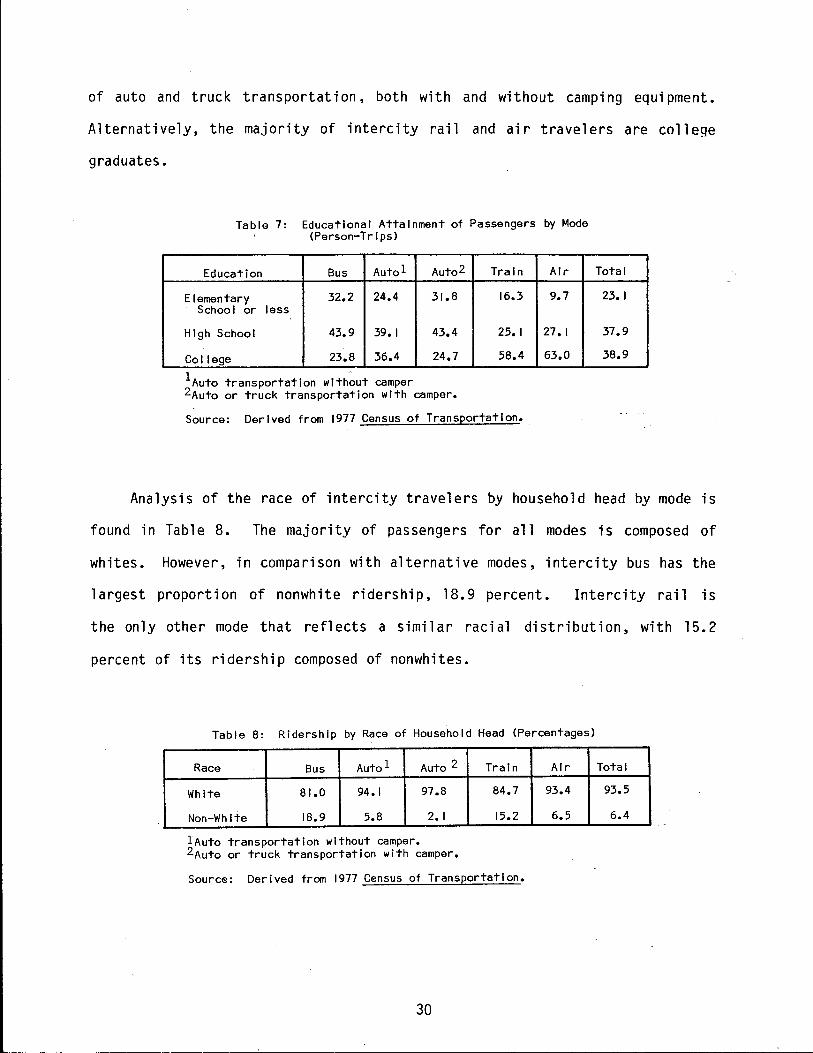
of auto and truck transportation, both with and without camping equipment.
Alternatively, the majority of intercity rail and air travelers are college
graduates.
Table 7: Educational Attainment of Passengers by Mode (Person-Trips)
Education Bus Autol Auto2 Train Air
Elementary 32.2 24.4 31.8 16.3 9.7 School or less
High School 43.9 39. I 43.4 25.1 27. I
College 23.8 36.4 24.7 58.4 63.0
1Auto transportation without camper 2Auto or truck transportation with camper.
Source: Derived from 1977 Census of Transportation.
Total
23.1
37.9
38.9
Analysis of the race of intercity travelers by household head by mode is
found in Table 8. The majority of passengers for all modes is composed of
whites. However, in comparison with alternative modes, intercity bus has the
largest proportion of nonwhite ride rs hip, 18. 9 percent. Intercity rail is
the only other mode that reflects a similar racial distribution, with 15.2
percent of its ridership composed of nonwhites.
Table 8: Ridership by Race of Household Head (Percentages)
Race Bus Autol Auto 2
White 81.0 94. I 97.8
Non-White 18.9 5.8 2. I
lAuto transportation without camper. 2Auto or truck transportation with camper.
Train
84.7
15.2
Source: Derived from 1977 Census of Transportation.
30
Air
93.4
6.5
Total
93.5
6.4
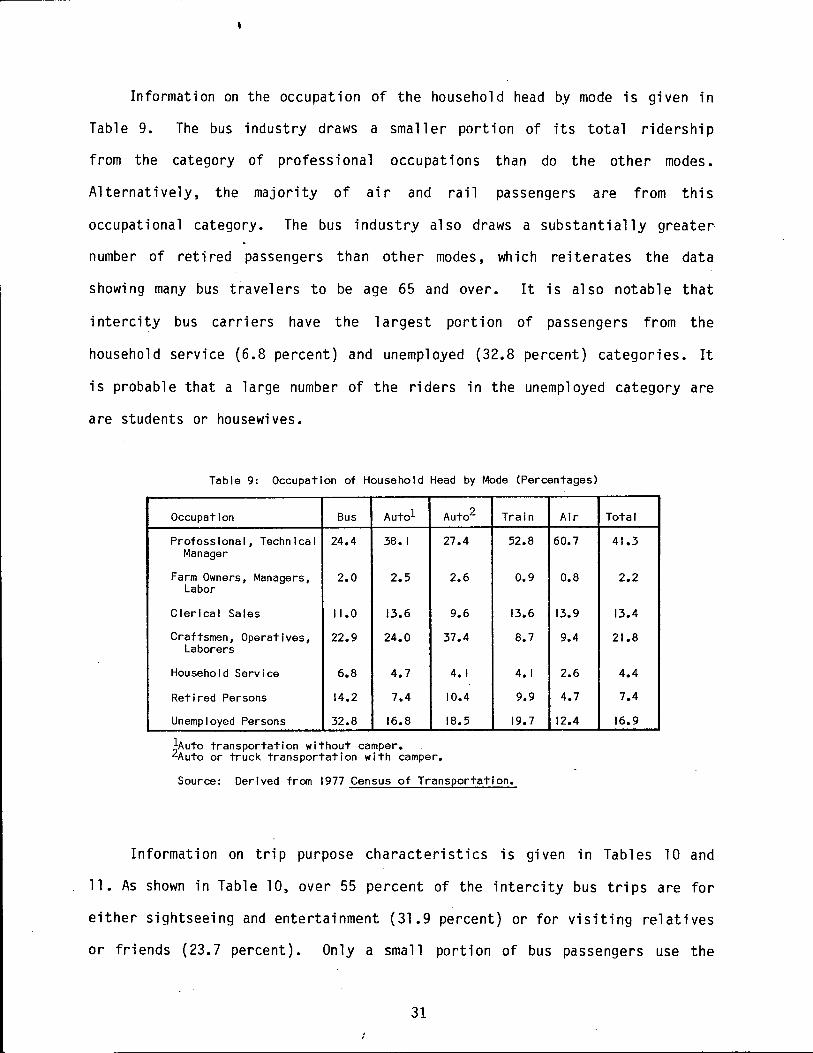
Information on the occupation of the household head by mode is given in
Table 9. The bus industry draws a smaller portion of its total ridership
from the category of professional occupations than do the other modes.
Alternatively, the majority of air and rail passengers are from this
occupational category. The bus industry also draws a substantially greater
number of retired passengers than other modes, which reiterates the data
showing many bus travelers to be age 65 and over. It is also notable that
intercity bus carriers have the largest portion of passengers from the
household service {6.8 percent) and unemployed {32.8 percent) categories. It
is probable that a large number of the riders in the unemployed category are
are students or housewives.
Table 9: Occupation of Household Head by Mode (Percentages)
Occupation Bus Autol Auto2 Train Air Total
Professional, Technical 24.4 38. I 27.4 52.8 60. 7 41.3 Manager
Farm Owners, Managers, 2.0 2.5 2.6 0.9 0.8 2.2 Labor
Clerical Sales 11.0 13.6 9.6 13.6 13.9 13.4
Craftsmen, Operatives, 22.9 24.0 37.4 8.7 9.4 21.8 Laborers
Household Service 6.8 4.7 4.1 4.1 2.6 4.4
Retired Persons 14.2 7.4 10.4 9.9 4.7 7.4
Unemployed Persons 32.8 16.8 18.5 19.7 12.4 16.9
lAuto transportation without camper. 2Auto or truck transportation with camper.
Source: Derived from 1977 Census of Transportation.
Information on trip purpose characteristics is given in Tables 10 and
11. As shown in Table 10, over 55 percent of the intercity bus trips are for
either sightseeing and entertainment {31.9 percent) or for visiting relatives
or friends {23.7 percent). Only a small portion of bus passengers use the
31
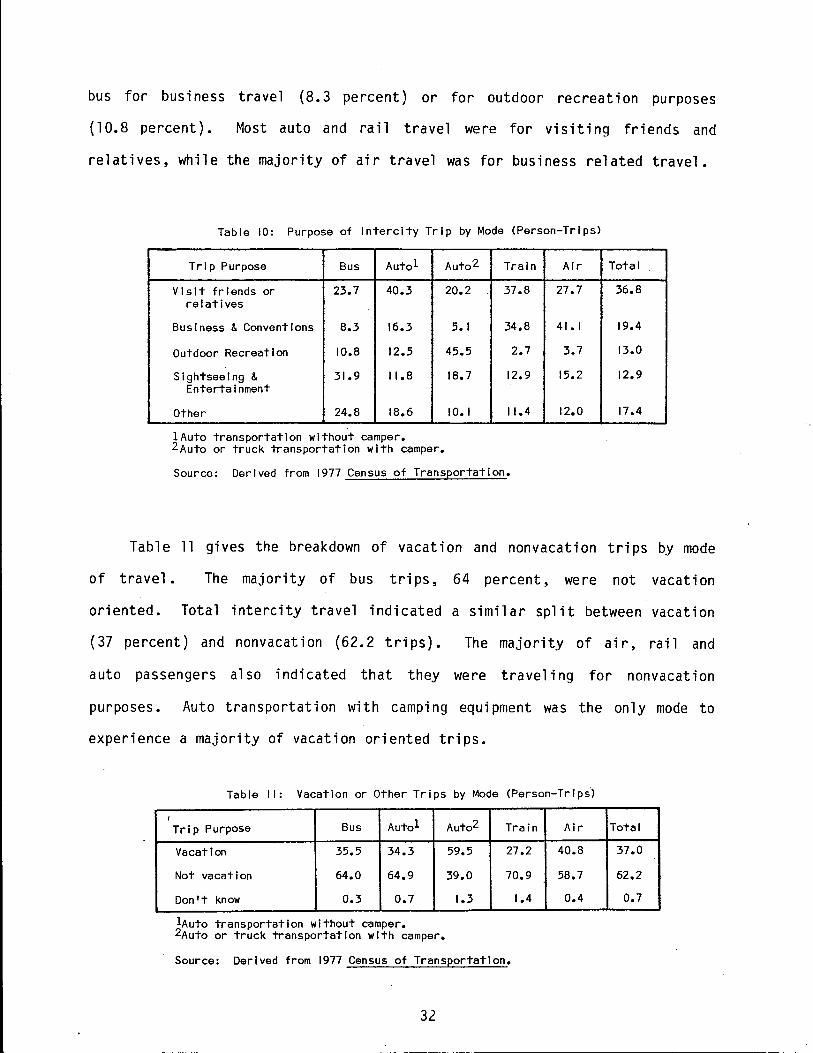
bus for business travel (8.3 percent) or for outdoor recreation purposes
(10.8 percent). Most auto and rail travel were for visiting friends and
relatives, while the majority of air travel was for business related travel.
Table 10: Purpose of Intercity Trip by Mode (Person-Trips)
Trip Purpose Bus Autol
Visit friends or 23.7 40.3 relatives
Business & Conventions 8.3 16.3
Outdoor Recreation 10.8 12.5
Sightseeing & 31.9 11.8 Entertainment
Other 24.8 18.6
lAuto transportation without camper. 2Auto or truck transportation with camper.
Auto2 Train
20.2 37.8
5.1 34.8
45.5 2.7
18.7 12.9
10. I 11.4
Source: Derived from 1977 Census of Transportation.
Air
27.7
41. I
3.7
15.2
12.0
Total
36.8
19.4
13.0
12.9
17.4
Table 11 gives the breakdown of vacation and nonvacat ion trips by mode
of travel. The majority of bus trips, 64 percent, were not vacation
oriented. Total intercity travel indicated a similar split between vacation
(37 percent) and nonvacation (62.2 trips). The majorit.v of air, rail and
auto passengers also indicated that they were traveling for nonvacation
purposes. Auto transportation with camping equipment was the only mode to
experience a majority of vacation oriented trips.
Table 11: Vacation or Other Trips by Mode (Person-Trips)
I Autol Auto2 Trip Purpose Bus Train Air Total
Vacation 35.5 34.3 59.5 27.2 40.8 37.0
Not vacation 64.0 64.9 39.0 70.9 58.7 62.2
Don't know 0.3 0.1 1.3 1.4 0.4 0.7
lAuto transportation without camper. 2Auto or truck transportation with camper.
Source: Derived from 1977 Census of Transportation.
32
Table 12 gives the distribution of person-trips by distance and mode.
The data show that almost 71 percent of the intercity bus trips are under 600
miles, with close to one-half of the intercity bus trips under 400 miles.
Auto transportation, both with and without camping equipment, rail
transportation and total intercity travel show similar distance patterns.
Only air transportation has a larger percentage of long distance trips, with
almost 60 percent of the trips over 1000 miles.
Table 12: Distribution of Person-Trips by Trip Distance by Mode
Round Trip Distance Bus Autol Auto2
200 to 399 miles 47.9 59.1 45.9
400 to 599 miles 22.9 18.6 19.2
600 to 799 miles 7.9 7.2 9.0
800 to 999 miles 4.5 4.0 ; 4.4
1000 to 1999 ml les 8.2 6.3 9.3
2000 miles and over 4.3 2.8 8.9
l·Auto transportation without camper. 2Auto or truck transportation with camper.
Train
38.4
21.9
6.8
2.2
12.7
14.6
Source: Derived from the 1977 Census of Transportation.
Structure of the Industry
Class I Carriers
Air Total
4.5 50.4
7.9 17.4
8.3 7.5
7.0 4.4
22.1 8.8
37.8 7.9
Presently, there are more than a thousand intercity bus companies in
operation. However, the industry is highly concentrated. The forty-six
Class I carriers dominate the industry as shown in Table 13. Although the
interpretation of these statistics is difficult due to the periodic
reclassification of what constitutes a Class I carrier, it appears that Class
I carriers, for most measures, account for 60 to 7 0 percent of the industry
total.
33
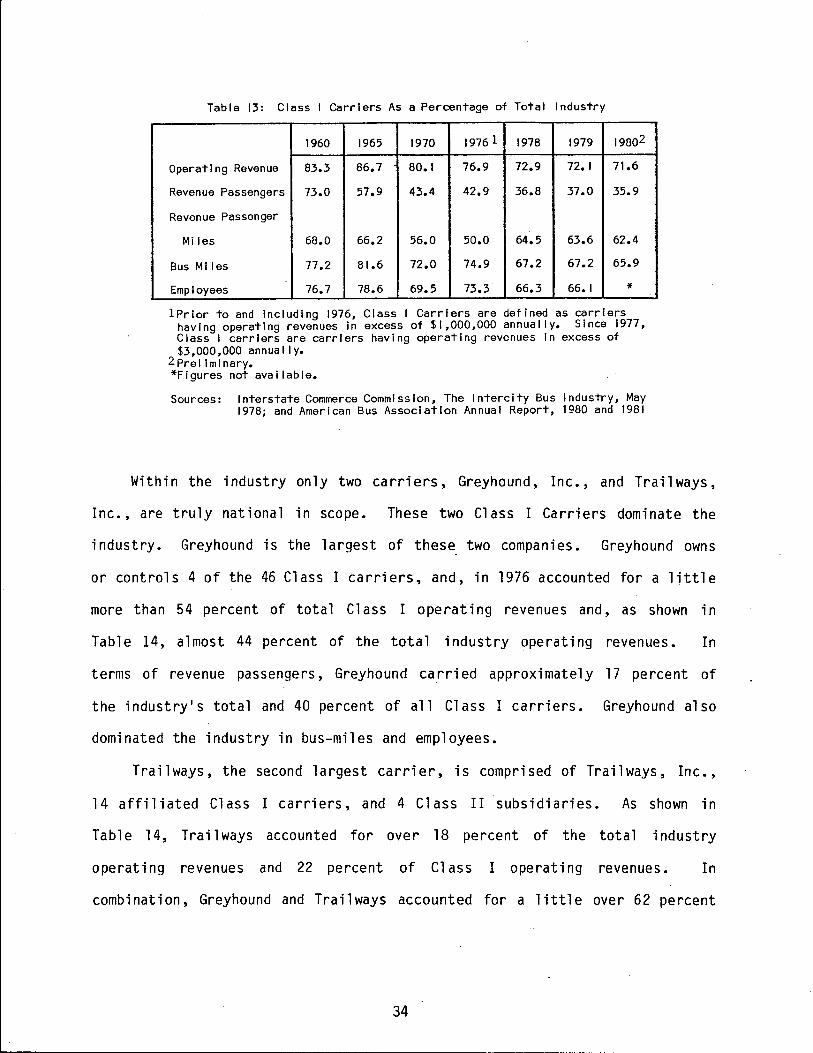
Table 13: Class I Carriers As a Percentage of Total Industry
1960 1965 1970 1976 1 1978 1979 19802
Operating Revenue 83.3 86.7 80.t 76.9 72.9 72.1 71.6
Revenue Passengers 73.0 57.9 43.4 42.9 36.8 37.0 35.9
Revenue Passenger
Miles 68.0 66.2 56.0 50.0 64.5 63.6 62.4
Bus Ml les 77.2 81.6 72.0 74.9 67.2 67.2 6"5.9
Employees 76.7 78.6 69.5 73.3 66.3 66.1 *
lPrior to and Including 1976, Class I Carriers are defined as carriers having operating revenues in excess of $1,000,000 annually. Since 1977, Class I carriers are carriers having operating revenues In excess of $3,000,000 annually.
2Prel iminary. *Figures not available.
Sources: Interstate Commerce Commission, The Intercity Bus Industry, May 1978; and American Bus Association Annual Report, 1980 and 1981
Within the industry only two carriers, Greyhound, Inc., and Trailways,
Inc., are truly national in scope. These two Class I Carriers dominate the
industry. Greyhound is the largest of these two companies. Greyhound owns
or controls 4 of the 46 Class I carriers, and, in 1976 accounted for a little
more than 54 percent of total Class I operating revenues and, as shown in
Table 14, almost 44 percent of the total industry operating revenues. In
terms of revenue passengers, Greyhound carried approximately 17 percent of
the industry's total and 40 percent of all Cl ass I carriers. Greyhound al so
dominated the industry in bus-miles and employees.
Trailways, the second largest carrier, is comprised of Trailways, Inc.,
14 affiliated Class I carriers, and 4 Class II subsidiaries. As shown in
Table 14, Trailways accounted for over 18 percent of the total industry
operating revenues and 22 percent of Cl ass I operating revenues. In
combination, Greyhound and Tra.ilways accounted for a little over 62 percent
34
'-------------------------------------------------- -
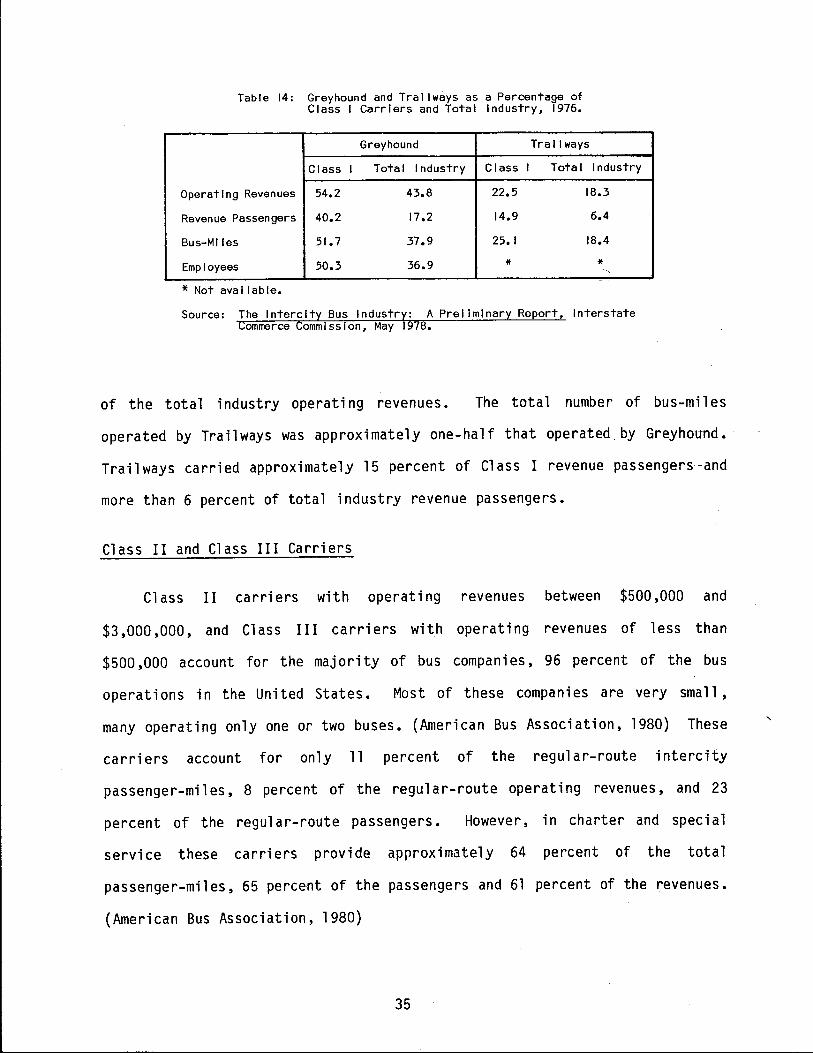
Table 14: Greyhound and Tral I ways as a Percentage of Class I Carriers and Total Industry, i976.
Greyhound Trai I ways
Class i Total Industry Class I Total Industry
Operating Revenues 54.2 43.8 22.5 18.3
Revenue Passengers 40.2 17.2 14.9 6.4
Bus-Miles 51. 7 37.9 25.1 18.4
Employees 50.3 36.9 * * * Not avai I able.
Source: The Intercity Bus Industry: A Preliminary Report, Interstate Commerce Commission, May i978.
of the total industry operating revenues. The total number of bus-mil es
operated by Trailways was approximately one-half that operated by Greyhound.
Trailways carried approximately 15 percent of Class I revenue passengers and
more than 6 percent of total industry revenue passengers.
Class II and Class III Carriers
Cl ass II carriers with operating revenues between $500 ,000 and
$3,000,000, and Class III carriers with operating revenues of less than
$500 ,000 account for the majority of bus companies, 96 percent of the bus
operations in the United States. Most of these companies are very small,
many operating only one or two buses. (American Bus Association, 1980) These
carriers account for only 11 percent of the regular-route intercity
passenger-miles, 8 percent of the regular-route operating revenues, and 23
percent of the regular-route passengers. However, in charter and special
service these carriers provide approximately 64 percent of the total
passenger-miles, 65 percent of the passengers and 61 percent of the revenues.
(American Bus Association, 1980)
35
Regular-Route Service
The primary service of intercity bus companies is that of furnishing
scheduled passenger service over designated routes between cities. The type
of regular-route service varies between companies. Some bus operations
consist solely of long-haul, trunk-line service, while others include
extensive short-distance, branch-line operations. Other carriers, called
bridge carriers, fill a gap in the network of another bus line. (Interstate
Commerce Commission, 1978)
The type and amount of regular-route service is not always directly
related to community size. Many small communities are served by only one
carrier while others of equal size are served by several companies. Usually,
a rura 1 community will have better service if it is on a through route
between.two urban areas, if it is located on an interstate highway, if it is
located in the South where service is more dispersed, if it has little
package express competition, or if it is served by only one carrier.
(Transportation Research Board, 1980). These factors contribute to the
profitabililty of the route and, thus, help determine the quality of the
service rendered.
Since about 1960 there has been a shift in the share of revenue derived
from the various bus services. As shown in Table 15, 76.6 percent of the
total revenue for Class I carriers in 1960 was derived from regular-route
intercity passenger operators. By 1980, only 67 percent of the revenues were
from regular route service. This decline in revenues is largely due to the .
shrinkage in passenger demand for regular-route service. Between 1969 and
1980 the number of regular-route passengers has declined 23 percent, while
regular-route intercity passenger-mil es has experienced an 9 percent
decrease.
36
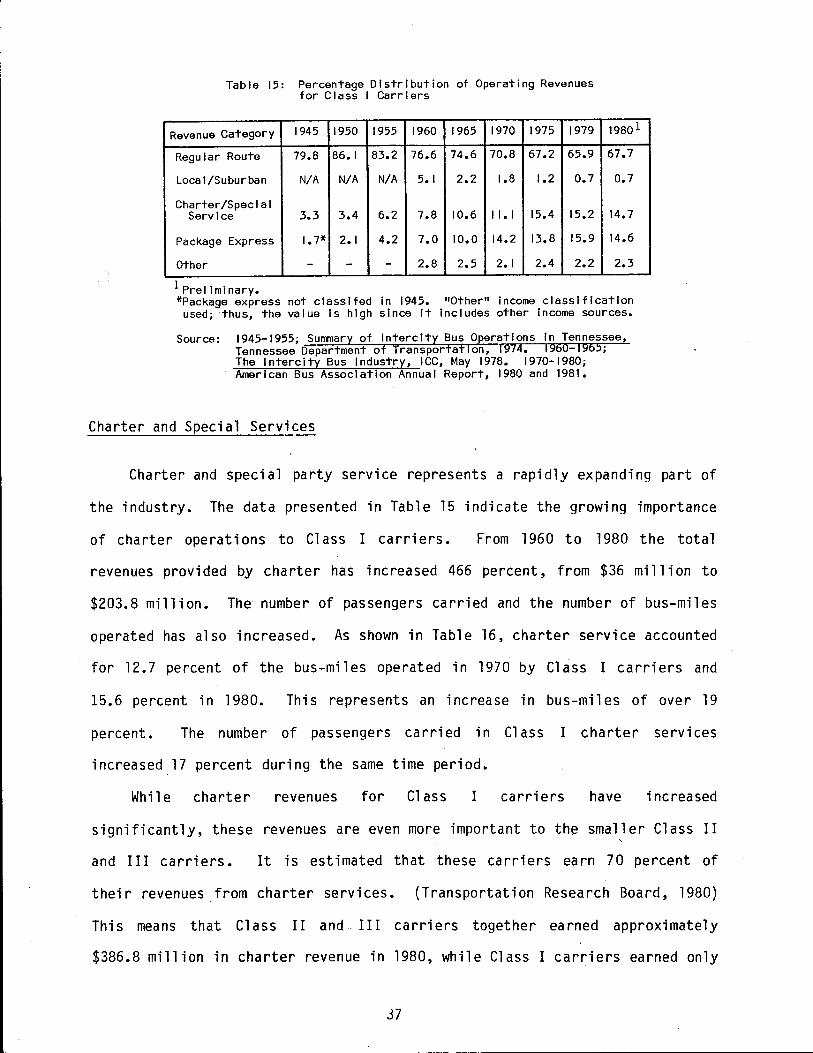
Table 15: Percentage Distribution of Operating Revenues for Class I Carriers
Revenue Category 1945 1950 1955 1960 1965 1970 1975 1979
Regular Route 79.8 86.1 83.2 76.6 74.6 70.8 67.2 65.9
Loca I /Suburban N/A N/A N/A 5.1 2.2 1.8 1.2 0.7
Charter/Special Service 3.3 3.4 6.2 7.8 10.6 II. I 15.4 15.2
Package Express I. 7* 2.1 4.2 7.0 10.0 14.2 13.8 15.9
Other - - - 2.8 2.5 2. I 2.4 2.2
19801
67.7
0.7
14.7
14.6
2.3
1 Prel I mi nary. *Package express not classlfed in 1945. "Other" income classification
used; ·thus, the value Is high since it includes other Income sources.
Source: 1945-1955; Surrrnary of Intercity Bus Operations In Tennessee, Tennessee Department of Transportation, 1974. 1960-1965; The Intercity Bus Industry, ICC, May 1978. 1970-1980; American Bus Association Annual Report, 1980 and 1981.
Charter and Special Services
Charter and special party service represents a rapidly expanding part of
the industry. The data presented in Table 15 indicate the growing importance
of charter operations to Class I carriers. From 1960 to 1980 the total
revenues provided by charter has increased 466 percent, from $36 million to
$203.8 million. The number of passengers carried and the number of bus-miles
operated has also increased. As shown in Table 16, charter service accounted
for 12.7 percent of the bus-miles operated in 1970 by Class I carriers and
15.6 percent in 1980. This represents an increase in bus-miles of over 19
percent. The number of passengers carried in Cl ass I charter services
increased 17 percent during the same time period.
Whi 1 e charter revenues for Cl ass I carriers have increased
significantly, these revenues are even more important to the smaller Class II
and III carriers. It is estimated that these carriers earn 70 percent of
their revenues from charter services. (Transportation Research Board, 1980)
This means that Class II and. III carriers together earned approximately
$386.8 million in charter revenue in 1980, while Class I carriers earned only
37
$203.8 million from charter services. (American Bus Association, 1980} In
addition, Class II and III carriers handled approximately 88 percent of the
estimated 182 million charter passengers in 1979. (American Bus Association,
1980}
Package Express Service
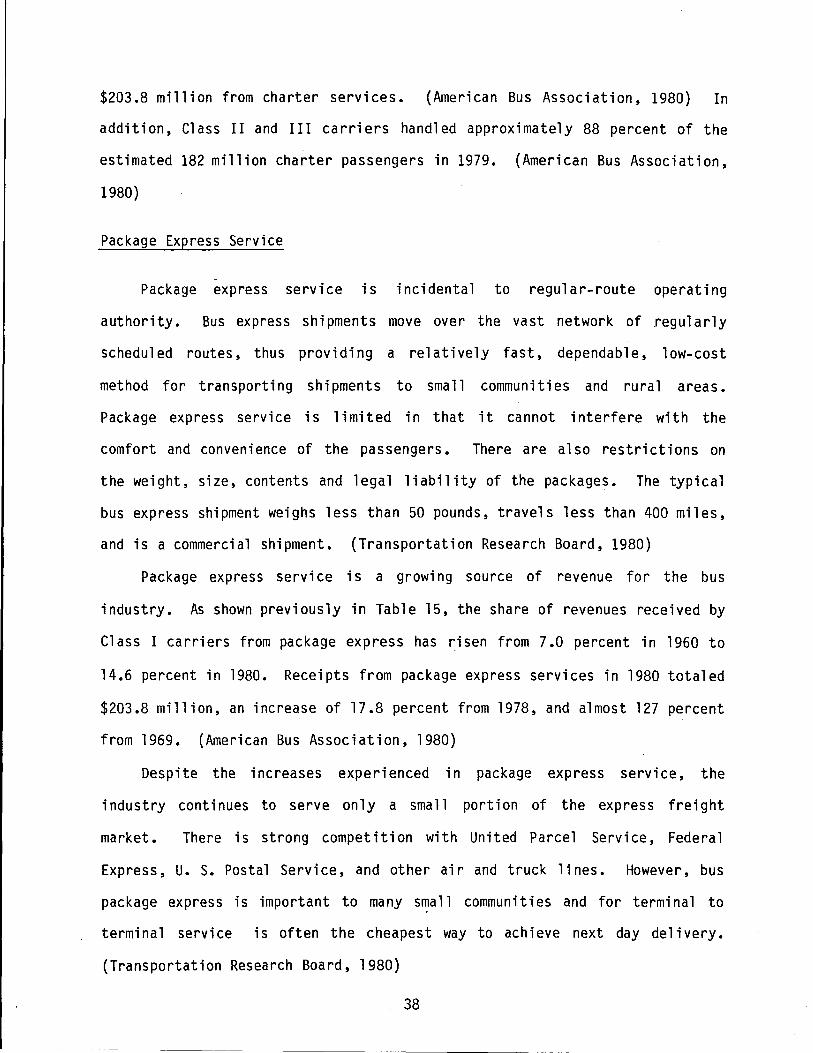
-
Package express service is incidental to regular-route operating
authority. Bus express shipments move over the vast network of regularly
scheduled routes, thus providing a relatively fast, dependable, low-cost
method for transporting shipments to small communities and rural areas.
Package express service is limited in that it cannot interfere with the
comfort and convenience of the passengers. There are also restrictions on
the weight, size, contents and legal liability of the packages. The typical
bus express shipment weighs less than 50 pounds, travels less than 400 miles,
and is a commercial shipment. (Transportation Research Board, 1980}
Package express service is a growing source of revenue for the bus
industry. As shown previously in Table 15, the share of revenues received by
Class I carriers from package express has risen from 7.0 percent in 1960 to
14.6 percent in 1980. Receipts from package express services in 1980 totaled
$203.8 million, an increase of 17.8 percent from 1978, and almost 127 percent
from 1969. (American Bus Association, 1980}
Despite the increases experienced in package express service, the
industry continues to serve only a small portion of the express freight
market. There is strong competition with United Parcel Service, Federal
Express, U. S. Postal Service, and other air and truck lines. However, bus
package express is important to many small communities and for terminal to
terminal service is often the cheapest way to achieve next day delivery.
(Transportation Research Board, 1980)
38
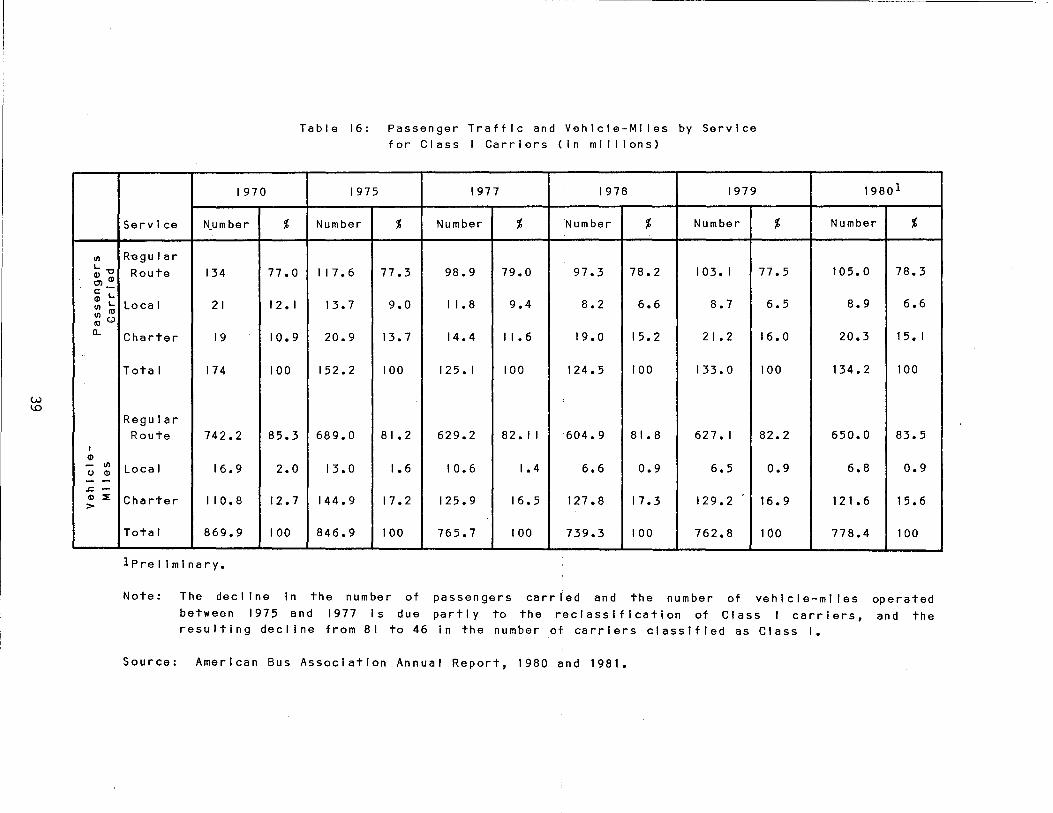
Ul
L. "'O
~ Q)
c: ·~ Q) L. Ul co ~ (.)
a..
I Q) - Ul 0 Q) - -.c. -Q) ::E >
Table 16: Passenger Traffic and Vehicle-Miies by Service for Class I Carriers C in mi I I Ions)
1970 1975 1977 1978 1979 19801
Service N_umber % Number % Number % Number % Number % Number %
R-egu I ar Route 134 77. 0 I I 7. 6 77.3 98.9 79.0 97.3 78.2 I 03. I 77.5 105.0
Local 21 I 2. I 13.7 9.0 I I. 8 9.4 8.2 6.6 8.7 6.5 8.9
Charter 19 10.9 20.9 13.7 14.4 I I • 6 19.0 15.2 2 I • 2 16.0 20.3
Total 174 100 152.2 100 I 2 5. I 100 124.5 100 133.0 100 134.2
Regular Route 742.2 85.3 689.0 8 I. 2 629.2 82. I I 604.9 81. 8 627. I 82.2 650.0
Local 16.9 2.0 13.0 1.6 10.6 1.4 6.6 0.9 6.5 0.9 6.8
Charter I I 0. 8 12.7 144.9 17.2 125.9 16.5 127 .8 17.3 129.2 16.9 121. 6
Total 869.9 100 846.9 100 765.7 100 739.3 100 762.8 100 778.4
lPrel iminary.
Note: The decline in the number of passengers carried and the number of vehicle-ml les between 1975 and 1977 Is due partly to the reclassification of Class I carriers, resulting decline from 81 to 46 In the number of carriers classified as Class I.
Source: American Bus Association Annual Report, 1980 and 1981.
78.3
6.6
1 5. I
100
83.5
0.9
15.6
100
operated and the

In summary, intercity buses serve more cities and towns, carry more
passengers and have lower fares than any other mode of public transportation.
The bus passenger market varies from the passenger markets of other modes,
generally attracting passengers with household incomes under $15,000, who are
either under 18 or over 65 years of age, who are not college graduates, and
who are employed in nonprofessional occupations. Bus trips are usually for
shorter distances than trips by other modes and are generally for sightseeing
or entertainment purposes.
The bus industry is highly concentrated with only two national bus
systems, Greyhound, Inc., and Trailways, Inc., which alone accounted for over
62 percent of total industry revenues in 1976.
Within the industry, charter service and package express have become
increasingly important sources of revenue for the carriers, wh i1 e regular
route profits have been declining. The current financial condition of the
industry is discussed in more detail in the following chapter.
40
IV. FINANCIAL CONDITION OF THE NATIONAL INDUSTRY
This section presents the recent financial performance of the intercity
bus industry, primarily for Class I carriers. The time period analyzed is
from 1968 to 1980, except where data were not available for certain years.
Included in this section is a discussion on overall carrier profitability,
passenger fares, operating revenues, operating expenses and Class II and III
carrier profitability.
Profitability of the Industry
The intercity bus industry, as a whole, has suffered a decline in
profitability since 1950 and particularly since 1970. As indicated by Table
17, net operating revenues fell between 1971 and 1976 from $94.0 million to
$44.2 million, a decrease of 53 percent in five years. During the same time
period net income fell by over 40 percent. Net operating revenues increased
slightly in 1977 due to an 11 percent fare increase effective May 16, 1977,
but fell to a decade low of $38 million in 1978. In addition to the decline
of net operating revenues and net income, the industry has also experienced a
significant reduction in its return on investment.
The reduced profitability of the industry is due to the fact that
operating costs have increased faster than operating revenues, as indicated
in Table 18. During the twelve-year period of 1968 through 1980, operating
revenues for Class I carriers increased 100 percent while operating expenses
increased 114 percent. This rapid increase ·in costs has caused a significant
increase in the operating ratio (the ratio of total operating expenses to
total operating revenues) of the industry. As shown, the operating ratio for
41
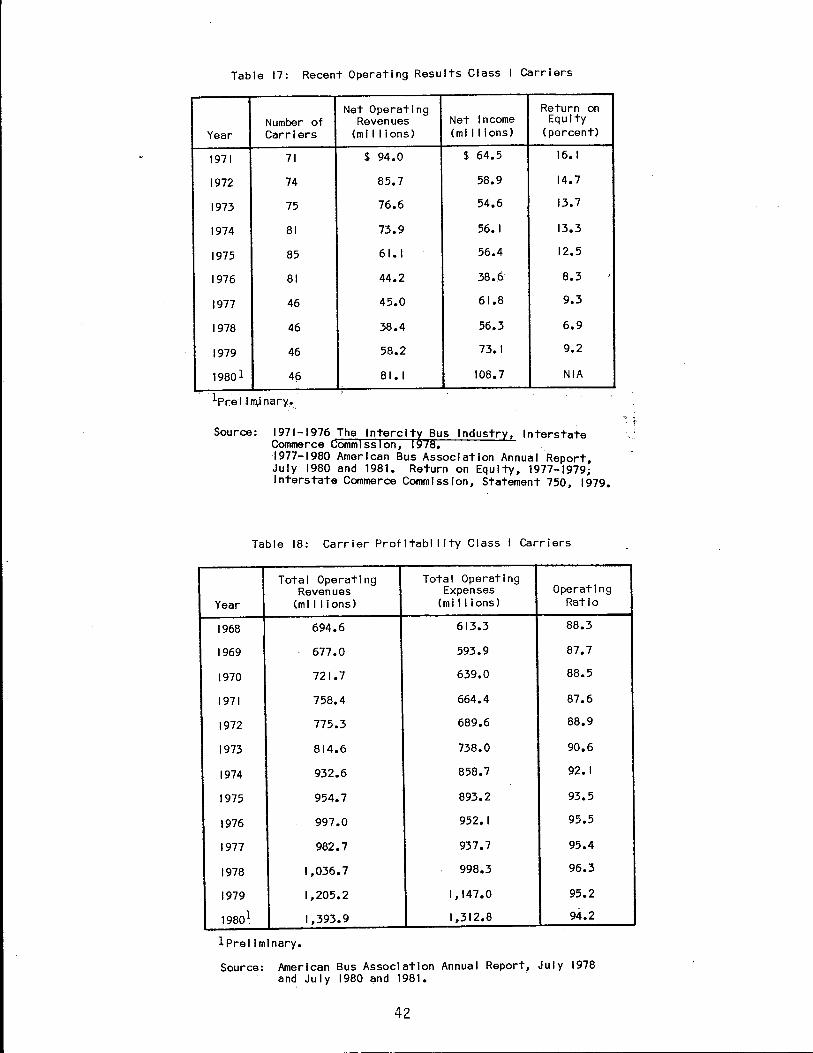
Table 17: Recent Operating Results Class I Carriers
Net Operating Return on Number of Revenues Net Income Equity
Year Carriers {ml I I Ions) {ml I I Ions) {percent)
1971 71 $ 94.0 $ 64.5 16.1
1972 74 85. 7 58.9 14.7
1973 75 76.6 54.6 13.7
1974 81 73.9 56.1 13.3
1975 85 61. I 56.4 12.5
1976 81 44.2 38.6 8.3
1977 46 45.0 61.8 9.3
1978 46 38.4 56.3 6.9
1979 46 58.2 73. I 9.2
19801 49 81. I 108.7 NIA
lpr:e I i m,i nary .•.
Source: 1971-1976 The lnterclt~ Bus Industry, Interstate Commerce Commission, I 78. 1977-1980 American Bus Association Annual Report July 1980 and 1981. Return on Equity, 1977-1979; Interstate Commerce Commission, Statement 750, 1979.
Table 18: Carrier Profitability Class I Carriers
Tota I Operating Total Operating Revenues Expenses Operating
Year {millions) {ml I I Ions) Ratio
1968 694.6 613.3 88.3
1969 677.0 593.9 87.7
1970 721. 7 639.0 88.5
1971 758.4 664.4 87.6
1972 775.3 689.6 88.9
1973 814.6 738.0 90.6
1974 932.6 858.7 92. I
1975 954.7 893.2 93.5
1976 997.0 952.1 95.5
1977 982.7 937. 7 95.4
1978 1,036. 7 998.3 96.3
1979 1,205.2 1,147.0 95.2
1980~ 1,393.9 1,312.8 94.2
lPrel I ml nary.
Source: American Bus Association Annual Report, July 1978 and July 1980 and 1981.
42
" < . -r
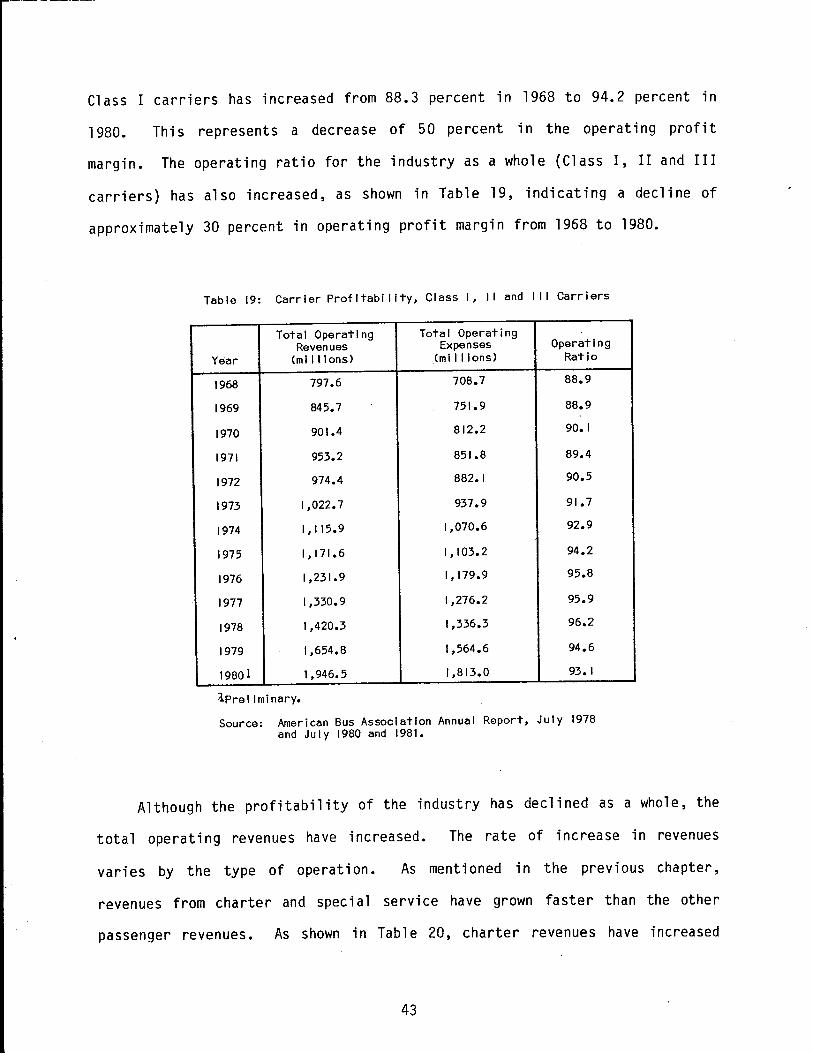
Class I carriers has increased from 88.3 percent in 1968 to 94.2 percent in
1980. This represents a decrease of 50 percent in the operating profit
margin. The operating ratio for the industry as a whole (Class I, II and III
carriers) has also increased, as shown in Table 19, indicating a decline of
approximately 30 percent in operating profit margin from 1968 to 1980.
Table 19: Carrier Profitability, Class I, I I and I I I Carriers
Total Operating Total Operating Revenues Expenses Operating
Year (millions) (mi 11 ions) Ratio
1968 797.6 708.7 88.9
1969 845. 7 751.9 88.9
1970 901.4 812.2 90.1
1971 953.2 851.8 89.4
1972 974.4 882.1 90.5
1973 I ,022. 7 937.9 91. 7
1974 1,115.9 1,070.6 92.9
1975 I, 171.6 1,103.2 94.2
1976 I ,231. 9 1,179.9 95.8
1977 1,330.9 1,276.2 95.9
1978 1,420.3 1,336.3 96.2
1979 I ,654.8 1,564.6 94.6
19801 1,946.5 1,813.0 93. I
1Prel I mi nary.
Source: American Bus Association Annual Report, July 1978 and July 1980 and 1981.
Although the profitability of the industry has declined as a whole, the
total operating revenues have increased. The rate of increase in revenues
varies by the type of operation. As mentioned in the previous chapter,
revenues from charter and special service have grown faster than the other
passenger revenues. As shown in Table 20, charter revenues have increased
43
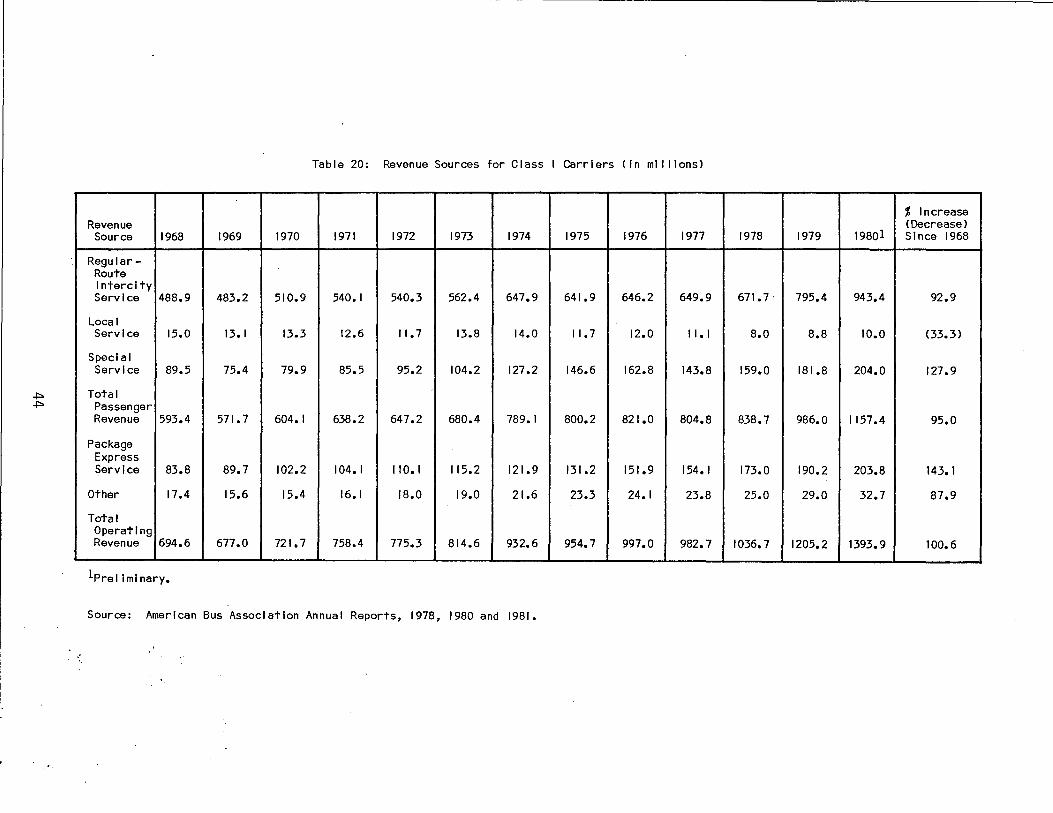
Table 20: Revenue Sources for Class I Carriers (In mil lions)
% Increase Revenue <Decrease)
Source 1968 1969 1970 1971 1972 1973 1974 1975 1976 1977 1978 1979 19801 Since 1968
Regular-Route I ntercl ty Service 488.9 483.2 510.9 540. I 540.3 562.4 647.9 641.9 646.2 649.9 671. 7. 795.4 943.4 92.9
Local Service 15.0 13. I 13.3 12.6 11. 7 13.8 14.0 11. 7 12.0 I I. I 8.0 8.8 10.0 (33.3)
Special Service 89.5 75.4 79.9 85.5 95.2 104.2 127.2 146.6 162.8 143.8 159.0 181.8 204.0 127.9
Total Passenger Revenue 593.4 571. 7 604.1 638.2 647.2 680.4 789.1 800.2 821.0 804.8 838.7 986.0 1157.4 95.0
Package Express Service 83.8 89.7 102.2 104. I 110. I 115.2 121.9 131.2 151.9 154. I 173.0 190.2 203.8 143.1
Other 17.4 15.6 15.4 16. I 18.0 19.0 21.6 23.3 24.1 23.8 25.0 29.0 32.7 87.9
Total Operating Revenue 694.6 677.0 721. 7 758.4 775.3 814.6 932.6 954.7 997.0 982. 7 1036.7 1205.2 1393.9 100.6
lPrel I ml nary.
Source: American Bus Association Annual Reports, 1978, 1980 and 1981.
•.
128 percent between 1968 and 1980 while regular route passenger revenues have
increased only 93 percent, and revenues from local service have decreased 33
percent. Of a 11 the revenue sources of the industry, package express has
grown the most, 143 percent during the same 12 year period.
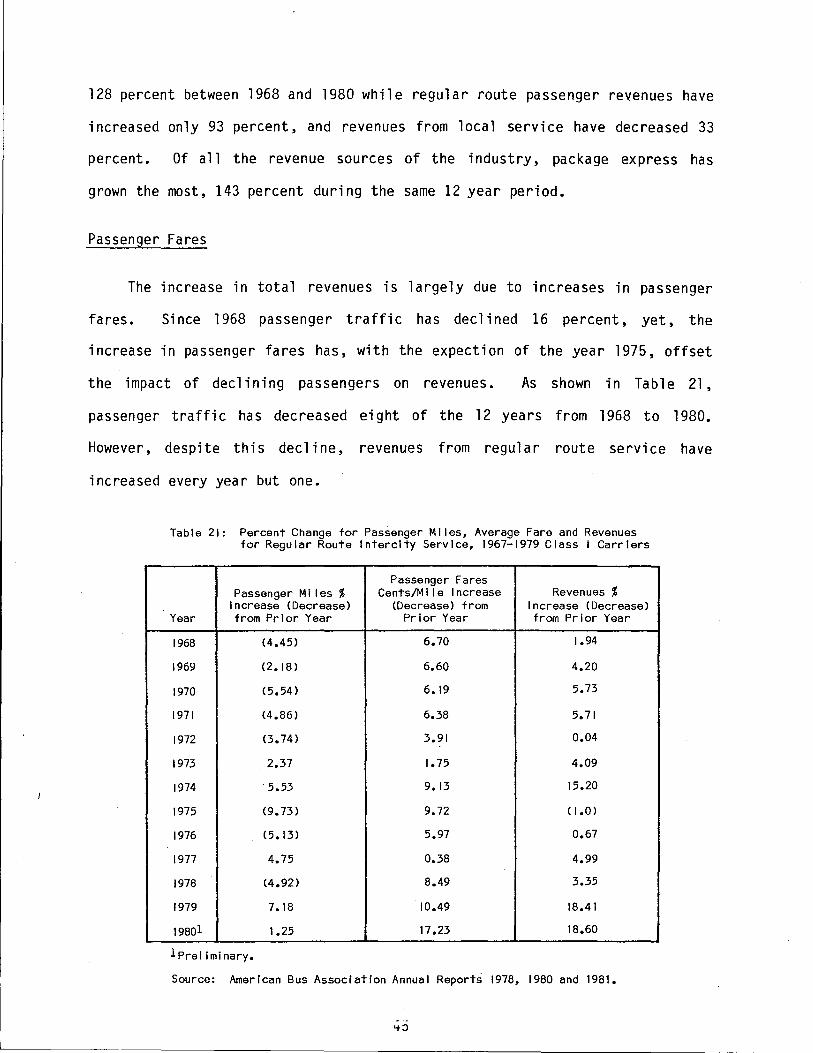
Passenger Fares
The increase in total revenues is largely due to increases in passenger
fares. Si nee 1968 passenger traffic has declined 16 percent, yet, the
increase in passenger fares has, with the expection of the year 1975, offset
the impact of declining passengers on revenues. As shown in Table 21,
passenger traffic has decreased eight of the 12 years from 1968 to 1980.
However, despite this decline, revenues from regular route service have
increased every year but one.
Table 21: Percent Change for Passenger Miles, Average Fare and Revenues for Regular Route Intercity Service, 1967-1979 Class I Carriers
Passenger Fares Passenger Miles % Cents/Mile Increase Revenues %
Increase (Decrease) (Decrease) from Increase (Decrease) Year from Prior Year Prior Year from Prior Year
1968 (4.45) 6.70 1.94
1969 (2.18) 6.60 4.20
1970 (5.54) 6. 19 5.73
1971 (4.86) 6.38 5.71
1972 (3.74) 3.91 0.04
1973 2.37 I. 75 4.09
1974 . 5.53 9.13 15.20
1975 (9.73) 9.72 ( 1.0)
1976 (5.13) 5.97 0.67
1977 4.75 0.38 4.99
1978 (4. 92) 8.49 3.35
1979 7. 18 10.49 18.41
19801 1.25 17.23 18.60
lPrel iminary.
Source: American Bus Association Annual Reports 1978, 1980 and 1981.
'tO
Although fares have steadily increased, 144 percent since 1967, in
11 real 11 terms, bus fares per passenger mile were 0.09 cents or 3 percent
lower in 1980 than 1967 as shown in Table 22.
Year
1967
1968
1969
1970
1971
1972
1973
1974
1975
1976
1977
1978
1979
19801
Table 22: Average Passenger rares Class I Carriers Intercity Regular Route Service
Average Fare Constant 1967 Consumer Price2 f/Passenger Mi I e Doi lars Index ( 1967= 100)
t 2.98 f 2.98 100.0
3.18 3.04 104.6
3.39 3.00 112. 7
3.60 2.80 128.5
3.83 2.78 137.7
3.98 2.77 143.4
4.05 2.79 144.8
4.42 2.98 148.0
4.85 3.06 158.6
5. 14 2.95 174.2
5. 18 2.84 182.4
5.62 2.99 187.8
6.21 3. 10 200.3
7.28 2.89 251.6
1 Preliminary. 2Public Transportation Consumer Price Index, Economic Report of the
President, January 1980. 1981 Public Transportation Consumer Price Index, Survey of Current Business, U. S. Department of Commerce,
May 1981.
Source: American Bus Association Annual Reports, 1978, 1980 and 1981.
Operating Expenses
Table 23 gives the total operating expenses for Class I carriers since
1968. From 1968 to 1980 costs have increased 114 percent, an increase 14
percent above the increase in operating revenues for the same time period.
46
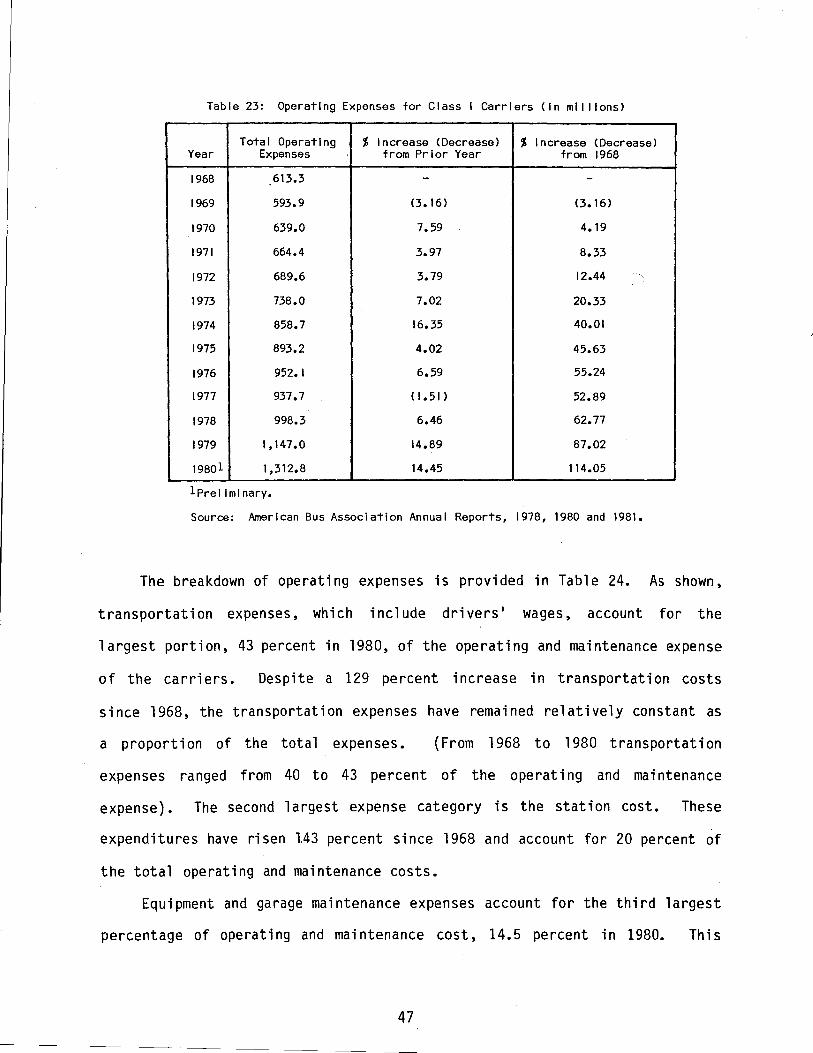
Table 23: Operating Expenses for Class I Carriers (in mil lions)
Total Operating 'f, Increase (Decrease) 'f, Increase (Decrease) Year Expenses from Prior Year from 1968
1968 613.3 - -1969 593.9 (3.16) (3.16)
1970 639.0 7.59 4.19
1971 664.4 3.97 8.33
1972 689.6 3.79 12.44 '
-
1973 738.0 7.02 20.33
1974 858.7 16.35 40.01
1975 893.2 4.02 45.63
1976 952. I 6.59 55.24
1977 937.7 Cl.SI) 52.89
1978 998.3 6.46 62. 77
1979 1,147.0 14.89 87.02
19801 1,312.8 14.45 114.05
lPrel iminary.
Source: American Bus Association Annual Reports, 1978, 1980 and 1981.
The breakdown of operating expenses is provided in Table 24. As shown,
transportation expenses, which include drivers' wages, account for the
largest portion, 43 percent in 1980, of the operating and maintenance expense
of the carriers. Despite a 129 percent increase in transportation costs
since 1968, the transportation expenses have remained relatively constant as
a proportion of the total expenses. (From 1968 to 1980 transportation
expenses ranged from 40 to 43 percent of the operating and maintenance
expense). The second largest expense category is the station cost. These
expenditures have risen 1.43 percent since 1968 and account for 20 percent of
the total operating and maintenance costs.
Equipment and garage maintenance expenses account for the third largest
percentage of operating and maintenance cost, 14.5 percent in 1980. This
47
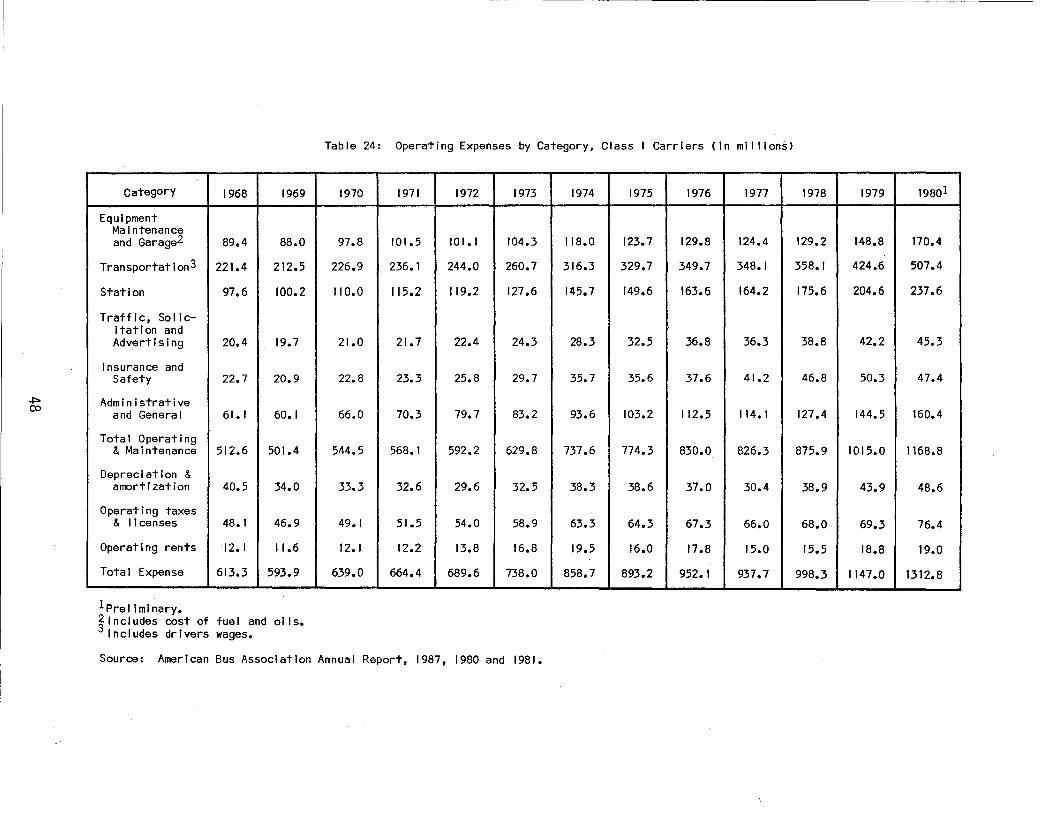
Category 1968 1969
Equipment Maintenance and Garage2 89.4 88.0
Transportatlon3 221.4 212.5
Station 97.6 100.2
Traffic, Sol le-ltatlon and Advertising 20.4 19.7
Insurance and Safety 22.7 20.9
Administrative and General 61. I 60.1
Total Operating & Maintenance 512.6 501.4
Depreciation & amortization 40.5 34.0
Operating taxes & 1 lcenses 48.1 46.9
Operating rents 12. I 11.6
Total Expense 613.3 593.9
lPrel I mi nary. 21nciudes cost of fuel and oils. 3 Includes drivers wages.
Table 24: Operating Expenses by Category, Class I Carriers (in mil lions)
1970 1971 1972 1973 1974 1975 1976 1977
97.8 101.5 10 I. I 104.3 118.0 123. 7 129.8 124.4
226.9 236.1 244.0 260.7 316.3 329.7 349.7 348.1
II 0.0 115.2 119.2 127.6 145.7 149.6 163.6 164.2
21.0 21. 7 22.4 24.3 28.3 32.5 36.8 36.3
22.8 23.3 25.8 29.7 35.7 35.6 37.6 41.2
66.0 70.3 79.7 83.2 93.6 103.2 112.5 114. I
544.5 568.1 592.2 629.8 737.6 774.3 830.0 826.3
33.3 32.6 29.6 32.5 38.3 38.6 37.0 30.4
49.1 51.5 54.0 58.9 63.3 64.3 67.3 66.0
12.1 12.2 13.8 16.8 19.5 16.0 17.8 15.0
639.0 664.4 689.6 738.0 858.7 893.2 952. I 937. 7
Source: American Bus Association Annual Report, 1987, 1980 and 198i.
1978 1979 19801
129.2 148.8 170.4
358.1 424.6 507.4
175.6 204.6 237.6
38.8 42.2 45.3
46.8 50.3 47.4
127.4 144.5 160.4
875.9 1015.0 1168.8
38.9 43.9 48.6
68.0 69.3 76.4
15.5 18.8 19.0
998.3 1147.0 1312.8
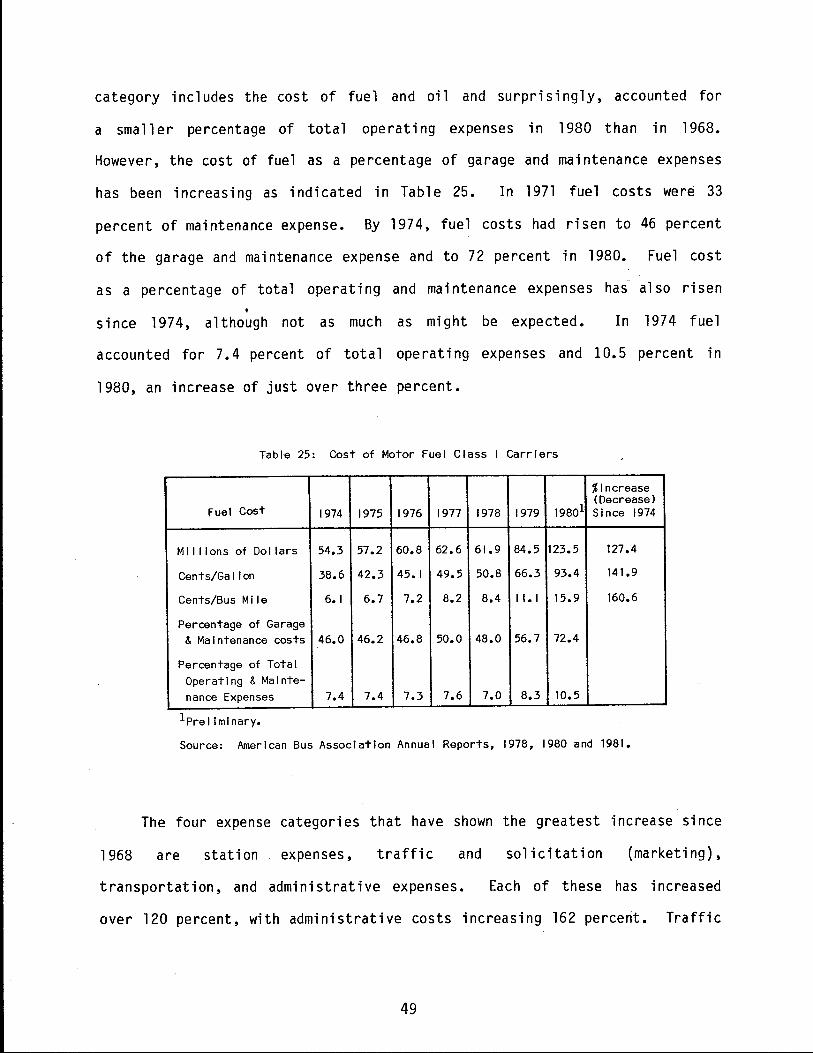
category includes the cost of fuel and oil and surprisingly, accounted for
a smaller percentage of total operating expenses in 1980 than in 1968.
However, the cost of fuel as a percentage of garage and maintenance expenses
has been increasing as indicated in Table 25. In 1971 fuel costs were 33
percent of maintenance expense. By 1974, fuel costs had risen to 46 percent
of the garage and maintenance expense and to 72 percent in 1980. Fuel cost
as a percentage of total operating and maintenance expenses has al so risen
• since 1974, although not as much as might be expected. In 1974 fuel
accounted for 7. 4 percent of tot a 1 operating expenses and 1O.5 percent in
1980, an increase of just over three percent.
Table 25: Cost of Motor Fuel Class I Carriers
% Increase
Fuel Cost 1974 1975 1976 1977 1978 1979 19801 (Decrease) Since 1974
Mi 11 ions of Doi lars 54.3 57.2 60.8 62.6 61.9 84.5 123.5 127.4
Cents/Ga I I on 38.6 42.3 45.1 49.5 50.8 66.3 93.4 141.9
Cents/Bus Mi le 6.1 6.7 7.2 8.2 8.4 I I. I 15.9 160.6
Percentage of Garage & Maintenance costs 46.0 46.2 46.8 50.0 48.0 56.7 72.4
Percentage of Total Operating & Mainte-nance Expenses 7.4 7.4 7.3 7.6 7.0 8.3 10.5
lPrel iminary.
Source: American Bus Association Annual Reports, 1978, 1980 and 1981.
The four expense categories that have shown the greatest increase since
1968 are station expenses, traffic and solicitation (marketing),
transportation, and administrative expenses. Each of these has increased
over 120 percent, with administrative costs increasing 162 percent. Traffic
49
and solicitation is the only category in which outlays are completely at the
discretion of the carrier. These marketing expenses rose 122 percent from
20.4 million in 1968 to $45.3 million in 1980. The promotional efforts are
directed to increase bus ridership, more specifically to increase the average
number of passengers per trip which would significantly increase revenues.
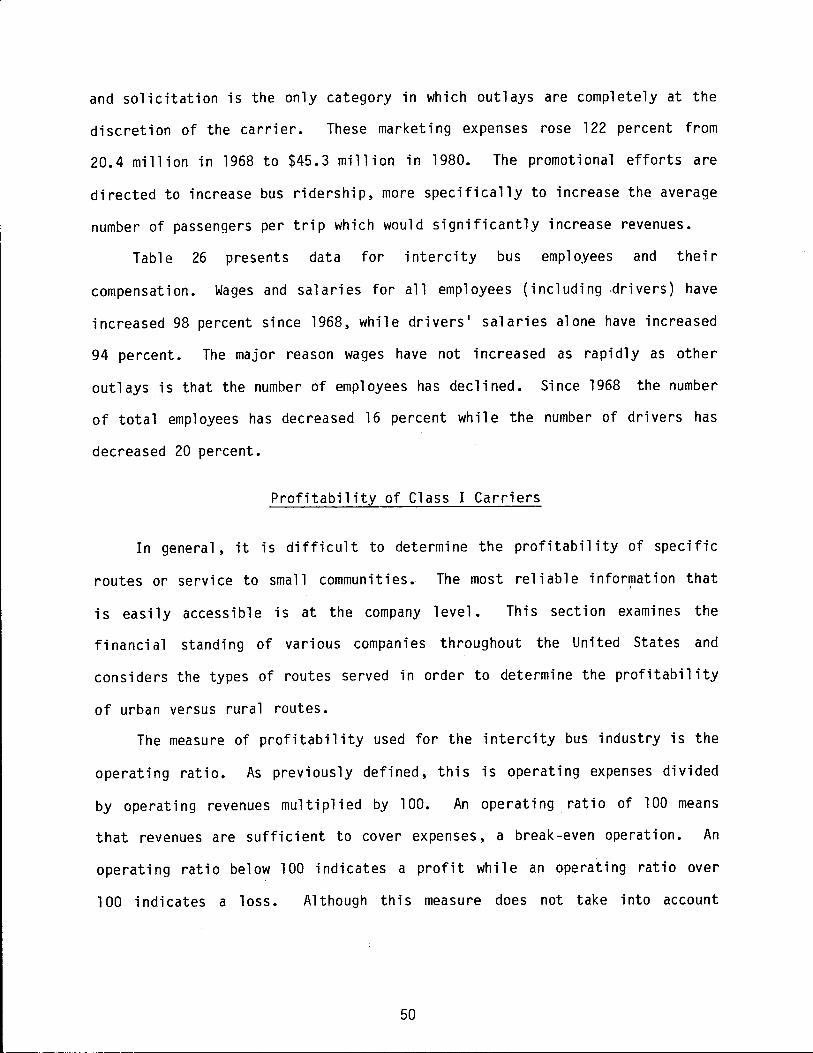
Table 26 presents data for intercity bus employees and their
compensation. Wages and salaries for all employees (including .drivers) have
increased 98 percent since 1968, while drivers' salaries alone have increased
94 percent. The major reason wages have not increased as rapidly as other
outlays is that the number of employees has declined. Since 1968 the number
of total employees has decreased 16 percent while the number of drivers has
decreased 20 percent.
Profitability of Class I Carriers
In general, it is difficult to determine the profitability of specific
routes or service to small communities. The most reliable information that ,
is easily accessible is at the company level. This section examines the
financial standing of various companies throughout the United States and
considers the types of routes served in order to determine the profitability
of urban versus rural routes.
The measure of profitability used for the intercity bus industry is the
operating ratio. As previously defined, this is operating expenses divided
by operating revenues multiplied by 100. An operating ratio of 100 means
that revenues are sufficient to cover expenses, a break-even operation. An
operating ratio below 100 indicates a profit while an operating ratio over
100 indicates a loss. Although this measure does not take into account
50
U1 .......
Table 26: Employees and Compensation
1968 1969 1970 1971 1972 1973 1974 1975 1976
Al I ' EmElo:tees
Average Number 37 ,487 33,628 34,383 34,731 34, 147 33,829 35,621 35, 140 33,740
Payrol 1 (ml 11 ions) 296.8 293.4 316. 7 333.9 343.2 363.5 414.6 431.3 459.7
Average Annual Earnings 7,917 8,725 9,211 9,614 10,051 10,747 11,640 12,270 13,620
Drivers
Average Number 18,480 16,003 16, 111 16,225 16,062 15,598 17,050 17 ,090 16,310
Percentage of Total Employees 50.2 47.5 46.8 46.7 47.0 46.1 47.8 48.6 48.3
Payrol 1 (ml I I Ions) 166.9 163.0 173.9 183.0 188.8 199.8 230.9 238.6 252.7
Percentage of Total Payrol I 56.2 55.5 54.9 54.8 55.0 54.9 55.6 55.3 54.9
Average Annual Earnings 9,032 10, 186 10,794 11,280 11,756 12,812 13,540 13,960 15,490
lpre 11 m I nary.
Source: American Bus Association Annual Reports, 1978, 1980 and 1981.
% Increase
1977 1978 1979 19801 (Decrease) Since 1968
29,700 29,362 29.978 31.190 ( 16. 7)
451.9 470.3 529.8 589.0 98.4
15,215 16,017 17,672 19, 170 142. I
14,400 14, 181 14,215 14,760 (20.1)
48.4 48.2 47.4 47.3 -
250. I 256.5 288.2 324.3 94.3
55.3 54.5 54.3 55.0 -
17,368 18,088 20,274 21,970 143.2
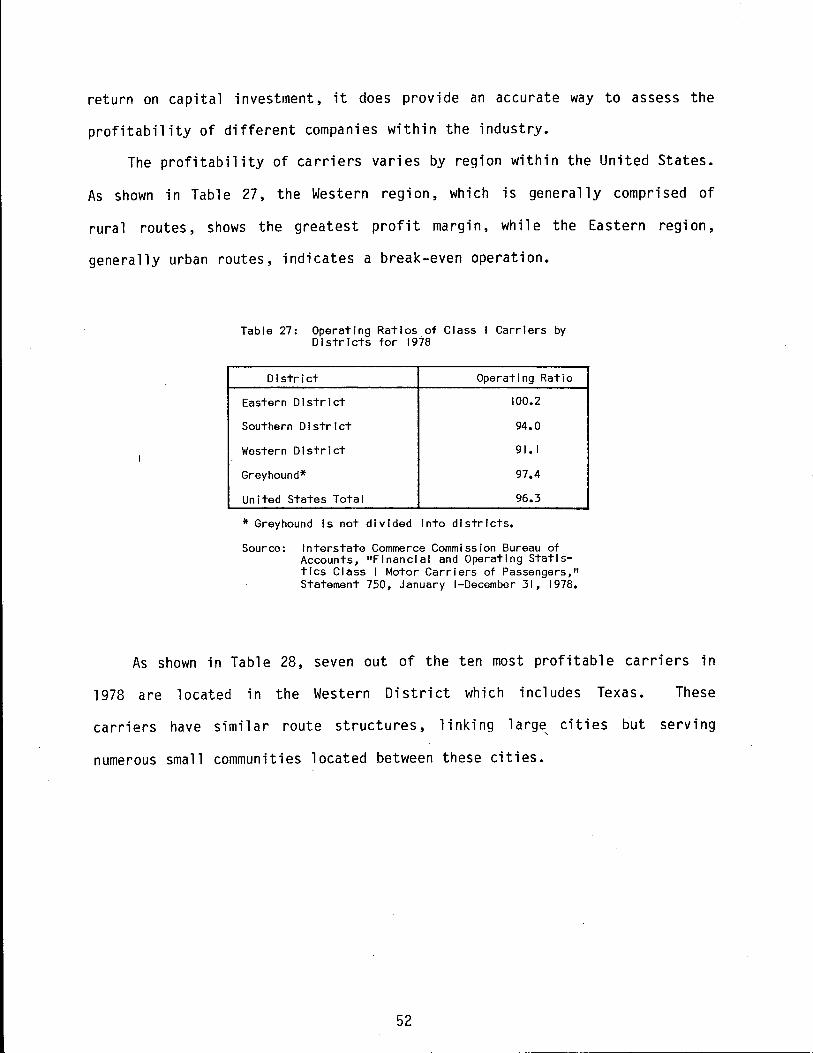
return on capital investment, it does provide an accurate way to assess the
profitability of different companies within the industry.
The profitability of carriers varies by region within the United States.
As shown in Table 27, the Western region, which is generally comprised of
rural routes, shows the greatest profit margin, while the Eastern region,
generally urban routes, indicates a break-even operation.
Table 27: Operating Ratios of Class I Carriers by Districts for 1978
District Operating Ratio
Eastern District 100.2
Southern District 94.0
Western District 91. I
Greyhound* 97.4
United States Total 96.3
*Greyhound ls not divided into districts.
Source: Interstate Commerce Commission Bureau of Accounts, "Financial and Operating Statistics Class I Motor Carriers of Passengers," Statement 750, January I-December 31, 1978.
As shown in Table 28, seven out of the ten most profitable carriers in
1978 are located in the Western District which includes Texas. These
carriers have similar route structures, linking large, cities but serving
numerous small communities located between these cities.
52
\
Table 28: List of Ten Most Profitable Class I Carriers for 1978
Operating Company District
Texas, New Mexico and Oklahoma Coaches, Inc.* Western
Union Bus Lines (Now Trai I ways Texas>* Western
Southeastern States Southern
California Parlour Car Tours Western
Kerrville Bus Company* Western
Midwest Bus Lines, Inc.** Western
Carolina Coach Company Western
New Mexico Transportation Company** Western
Conneticut Limousine Service Eastern
Trallways Bus System** Western
*These companies operate virtually entirely in Texas·. **These companies have significant Texas operations.
Ratio
69.8
73.3
75.5
76.1
78.2
84. I
85.0
85.8
85.9
87.4
Source: Interstate Commerce Commission Bureau of Accounts, "Financial and Operating Statistics Class I Motor Carriers of Passengers," Statement 750, January !December 31, 1978
As shown in Table 29, these carriers are also similar in that they
provide no local service and, with the exception of two carriers, the
percentage of revenues from regular route service is below the national
average. The percentage of revenue earned by each of these carriers in
charter and special service varies greatly, but several of them had
charter revenues well above the national average.
The carriers with the highest operating ratios in 1978 are given in
Table 30. All of these companies experienced operating ratios in excess of
100 percent indicating that each operated at a loss. Most of these carriers
are located in the highly urbanized area of the eastern seaboard states.
Table 31 gives the sources of passenger operating revenue for these
carriers. Generally, these carriers earn a higher portion of their operating
revenues from regular route service than do the more profitable carriers.
53
Table 29: Operating Revenue Sources of the Most Profitable Carriers for 1978
Passenger Operating Revenue (Percent)
Carrier Regular Route Local Charter
Texas, New Mexico, and Oklahoma Coaches, Inc. 37.8 0 14.0
Union Bus Lines 44.0 0 19.4
Southeastern Stages 49.5 0 19.3
California Parlour Car-Tours 33.9 0 0.9 -
Kerrville Bus Company 51.8 0 30.1
Midwest Bus Lines, Inc. 62.6 0 5.8
Caro I Ina Coach 70.6 0 12.6
New Mexico Transportation 57.5 0 12.1
Connecticut Limousine Service 95.9 0 4.0
Trailways Bus System 51. 7 0 15.9
National Averaqe 65.1 1.7 15.0
Note: Revenues do not add to 100 percent as package express and other revenue are not included.
Source: Interstate Commerce Comm I ss ion Bureau of Accounts, "Financl al and Operating Statistics Class I Motor Carriers of Passengers," Statement 750, January I-December 31, 1978.
Table 30: List of Ten Carriers with Highest Operating Ratios in 1978
Carrier District Operating Ratio
Safeway Trai Is Eas"tern 11 I .3
Edwards Mo-tor Transit Co. Eas"tern 109.3
Maplewood Equipment Co. Eas"tern 108.3
Lincoln Transi"t Lines Eas"tern 106.7
Domenico Bus Service Eas"tern 104.4
Hudson Transi"t Lines Eas"tern 103.3
American Bus Lines Wes-tern 102.8
Trai I ways of New Eng land Eas"tern 102.4
Trai I ways of Southeastern Lines Sou"thern IOI. 7
Trailways Tennessee Lines Sou"thern 100.9
Source: Interstate Commerce Commission Bureau of Accoun"ts, "Financial and Opera-ting Sta"tis"tics Class I Motor Carriers of Passengers", S"ta"temen"t 750, January !December 31, 1978.
::i4
The exact reason why these carriers are less profitable is unclear. It could
be due to the strong intermodal competition in the eastern region of the
United States such as Amtrak, or it might be due to the generally shorter
route hauls experienced by carriers in the east.
Table 31: Operating Revenue Sources of the Ten Least Profitable Carriers for 1978
Passenger Operating Revenue (Percent)
Carrier Regular Route Local Charter
Safeway Trails 73.0 0 13.8
Edwards Motor Transit Co. 71. 7 0 15.4
Maplewood Equipment Co. 61.9 26.1 11.4
Lincoln Transit Lines 75. 7 0 7.2
Domenico Bus Service 40.9 0 59. I
Hudson Transit Company 81.8 0 14. I
American Bus Lines 64.2 0 20.4
Trallways of New England 77.2 0 9.9
Trallways Southeastern Lines 52.6 0 22.3
Trallways Tennessee Lines 45.1 0 18.6
National Average 65.1 I. 7 15.0
Note: Revenues may not add to 100 percent as package express and other revenues are not included.
Source: Interstate Commerce Commission Bureau of Accounts, "financial and Operating Statistics Class I Motor Carriers of Passengers," Statement 750, January I-December 31, 1978.
Profitability of Class II and III Carriers
The financial performance of Class II and III carriers has generally
been below the level of that of the Class I carriers. However, during the
past several years these smaller carriers appear to have been increasing
their profitability. As shown in Table 32, Class II and III carriers
experienced a decline in profi tabi 1 i ty between 1968 and 1977. In 1968 the
profit margin for these carriers was 7 .4 and in 1977 the profit margin was
55
only 2.8, less than one-half that of 1968. However, in 1978 and 1979, Class
I I and I I I carriers increased their profitability. During these two years
the operating ratio returned to, and decreased from the 1968 level. Net
operating income increased 440 percent from 9.7 million in 1977 to 52.4
million in 1980.
Table 32: Operating Statistics for Class I I and Class I II Carriers
Net Revenue Operating Operating Operating Oper-
Number of Passengers Revenue Expenses Income at Ing Year Companies (millions) (mi I I Ions) (ml I I Ions) (millions) Ratio
i968 877 168.3 103.0 95.4 7.6 92.6
1969 980 218.2 168.7 158.0 10.7 93.fi
1970 929 227.0 179.7 173.2 6.5 96.3
1971 929 228.2 194.8 187.4 7.4 96.2
1972 926 229.0 199.I 192.5 6.6 96.6
1973 925 226.2 208.1 199.9 8.2 96.0
1974 869 217.3 219.3 211.3 8.0 96.3
1975 865 198.8 216.9 210.0 6.9 96.8
1976 869 194.I 234.9 227.8 7.1 96.9 .
1977 1004 202.9 348.2 338.5 9.7 97.2
1978 1054 213.5 383.6 368.6 15.6 95.9
1979 1104 226.0 449.6 417.6 32.0 92.8
19801 1284 238.8 552.6 500.2 52.4 90.5
lPrel iminary.
Source: American Bus Association Annual Reports, 1978, 1980 and 1981.
As with Class I carriers, these smaller carriers have been plagued with
a faster increase in operatin~ expenses than in operating revenues. Although
the number of revenue passengers has increased and fares have increased,
revenues have not kept pace with expenses.
56
In summary, the trend in financial performance of the intercity bus
industry during the past decade indicates that it may be a declining
industry. What to do, if anything, about the effect of diminishing revenues
and rising costs is a major policy issue facing the industry. Any decision
made in regard to public policy reforms may influence the industry's ability
to serve the public in the future.
57

-----.. -- -·- --······------~-----
v. NATIONAL REGULATORY ISSUES
The regulation of the intercity bus industry controls entry, exit,
fares, safety and insurance. It continues today in essentially the same form
as it did forty years ago, although the Interstate Commerce Commission has
eased the regulatory barriers to entry into the industry. It appears that
economic regulation aided the industry during its development, but may _now be
hindering the ability of the industry to adjust to rapid changes in demand
and costs. Faced with the growing problem of declining ridership and
increasing costs, and the inability to adjust service and fares accordingly,
the industry has begun seeking changes in the current regulation.
This section addresses some of the issues that should be examined in the
consideration of regulatory reform. Some of the issues presented address the
needs and concerns of the industry while others are more directly concerned
with the needs of the public.
Industry Issues and Problems
Industry Structure ·
The intercity bus industry has two very different characters. One
represents the long-distance travel between urban centers and the other
represents the short-haul routes between sma 11 communities or between sma 11
communities and urban centers. Greyhound and Trailways, Inc. (i.e. Trailways
owned companies) typify the long-haul business while small independent
carriers (including Trailways affilliates) typify the short-haul business. A
notable subgroup between the long-haul and short-haul carriers is the bridge
carriers. The bridge carriers enjoy a portion of the long-haul business, but
operate in many respects like the independent carriers. Each of these
59
characters of the industry has different market and cost structures, yet both
have been experiencing declining demand and increasing costs.
(Transportation Research Board, 1980).
The existence of these two segments of the industry pose problems when
considering changes in regulatory policies. Would total or partial
deregulation or a mixture of different levels of regulation serve these
segments of the industry best? Any decisions regarding regulation must
consider the various needs of these two components of the industry to ensure
that policies do not give one component advantages over the other.
Cross-Subsidization
One of the major concerns of the industry is the unprofitabi l ity of
certain routes. Under current regulations, carriers must continue to provide
a "satisfactory" level of service on routes regardless of the demand. Some
of these routes are unprofitable and are supported by cross-subsidies.
The three types of cross-subsidy that are believed to exist in the
operation of intercity bus carriers are the support of unprofitable routes by
l) profitable routes, 2) package express, and 3) charter operations.
Generally, these types of subsidies are categorized two ways, interservi ce
cross-subsidy and' intraservice cross-subsidy. lnterservice cross-subsidy
refers to distinctly different service offerings within the industry. For
example, a carriers's charter service with an operating ratio of 0.7 (cost
divided by revenue) could be said to be providing interservice subsidy to
regular route passenger service with an operating ratio of 1.2. Intraservice
cross-subsidy refers to a divergence of revenues within the same service
offering or group of service offering. Intraservice cross-subsidy is
illustrated by a bus system that has an operating ratio of less than 1.0 in
60
one geographic area or on a certain route and an operating ratio greater than
1.0 in a different area or on a different route. In this situation, it is
assumed that the profitable area or route will be subsidizing the
unprofitable ones. Intraservice cross-subsidy is also believed to occur
where unprofitable regular route service is subsidized from profitable
package express and other incidental services such as baggage, mail and
newspapers. In this situation a certain route may be unprofitable carrying
passengers a 1 one, but become profi tab 1 e when revenues from package express
and other incidental services are taken into account.
Intraservice cross-subsidy, whether between routes or through package express and other incidential services, is not a clear case of cross-subsidy. Evidence of this type of subsidization is difficult to find due to the inability to allocate the cost of operating the bus to passengers and to other sources. (Interstate Commerce Commission, 1978)
The major question raised by the existence of cross-subsidization is
whether it is equitable to require private firms or other passengers to
subsidize the need of a small group of people. This particularly becomes an
issue in light of the public subsidies paid to airlines to continue essential
air services to small communities, and the public subsidization of Amtrak
routes. (Management Analysis Center, Inc., 1981)
Intermodal Competition
The intercity bus industry encounters strong competition from the
recently deregulated airline and the federally subsidized Amtrak rail
services. At issue is the advantage given to these intercity bus competitors
through a deregulated environment and/or federa 1 subsidies.
Under the Airline Deregulation Act, airlines are required to continue
certain essential air services to small communities, utilizing federal
61
subsidies where necessary. Subsidies for these services are based on the
average costs, including return on investment, and revenues received by all
eligible carriers. During 1979, the first full year under deregulation, air
carriers received $84 million in federal support. Although airline
deregulation occurred too recently to determine the effect on intercity bus
operations, it is believed that a portion of the passengers utilizing the new
low-cost air shuttle and commuter services were diverted from the bus.
(Management Analyses Center, Inc., 1981)
The federally subsidized Amtrak began in 1971. In 1979, Amtrak received
$779 million in public aid and still was not profitable on even one route.
(Management Analysis Center, Inc., 1981). The effect of this public aid has
been to enable Amtrak to offer service and fares competitive with bus
operations. The strongest competition between the two modes occurs in the
Northeast Corridor where bus passenger-miles decreased 26% and Amtrak
passenger-miles increased 33% between 1971 and 1976. There is little doubt
that a portion of the Amtrak passengers would otherwise have taken the bus.
(Management Analysis Center, Inc., 1981)
In contrast to the public support provided to airlines and rail service,
intercity bus carriers received no public aid. Under the 1978 ammendment to
the Urban Mass Transportation Act of 1964, Congress authorized funds for the
industry. These funds were to be grants to state and 1 ocal governments to
provide for purchase-of-service agreements to provide intercity bus service
to rural areas, and to provide for facilities that would aid intermodal use
of intercity buses. The funds were never appropriated. However, in
recognition of the fuel efficiency of buses, Congress, in 1978, did reduce
the federal excise tax on intercity bus carriers. (National Transportation
Policy Study Commission, 1979),
62
Small Carrier Concerns
As suggested previously, many small bus firms are opposed to total
deregulation fearing predatory behavior from the larger national companies.
However, studies indicate that significant economies of scale (declining unit
costs as firm size increases) do not exist in the bus industry. (Pinkston,
1,975; Fravel, 1979). Although large carriers do not enjoy cost economies
with their size they do have the advantage of large service networks
attractive to long-distance riders. However, smaller carriers generally have
lower operating costs due to lower wages. Thus, small firms may be able to
offer lower fares than the large carriers. (Transportation Research Board,
1980).
Although it appears that many small carriers could hold their own
against the larger firms in a deregulated environment, it may not be true for
some. What about small firms which solely operate bridge routes, filling in
service gaps of the larger carriers' networks? They may suffer when free
entry allows the larger firms to operate those routes and provide more
direct, convenient. service to passengers. Furthermore, how long can small
firms continue to rely on lower operating costs as the cost of labor and
insurance continue to increase?
Issues in the Public Interest
Level of Service
The present government view, in light of current regulation of service,
appears to be that of maintaining existing service despite changing demands
and costs. (Management Analysis Center, Inc., 1981) One of the major
concerns about bus deregulation is the level of service that will be
63
provided, especially to small communities and rural areas. In many of these
areas intercity bus is the only form of public transportation available.
The demand for bus service has declined with increased auto availability,
making some of these routes unprofitable. It is feared that deregulation of
the industry would allow bus firms to abandon these routes, leaving many
people without transportation. (Committee on Commerce, Science, and
Transportation, 1978)
A recent study indicates that the number of people in small communities
that would be affected by. loss of service would be very small. Seventy
percent of the bus riders traveling over 100 miles reside in Standard
Metropolitan Statistical Areas (SMSAs) and 66% of the trips over 100 miles
are to SMSAs. For trips less than 100 miles in length, these percentages are
even higher. It was estimated that the loss of l 0% of all bus service
originating outside metropolitan areas would affect only 0.15% of all
person-trips over 100 miles in length. Furthermore, 52.1% of the households
living outside of metropolitan areas own a car, and thus have access to an
alternate mode of transportation. (Management Analysis Center, Inc., 1981)
The above data indicate that most individuals living in small
communities and rural areas would not be affected by the loss of intercity
bus service. However, there remains a "captive" market, the poor, the
elderly and the young, who often do not have access to automobile
transportation. Judging from the previous data, 47.9% of the households
living outside of metropolitan areas do not own an automobile. Thus, there
may be a need for continuing to provide bus transportation to small
communities and rural areas. If such a need exists, but demand remains low,
some method of continuing service might be implemented without requiring
64
private bus firms to cover the costs through user subsidies from state or
local agencies. (Committee on Commerce, Science, and Transportation, 1978)
Fares
Another public concern about bus deregulation is the possibility of
unjustified fare increases, particularly where no competition exists. This
situation is most likely to occur if fare restrictions are loosened without
easing entry restrictions. Under total deregulation, however, the threat of
potential competition from new entrants into profitable routes should keep
fares from rising to excessive levels.
Fares on those routes which have been supported by cross-subsidies would
be expected to rise to a level that would cover the marginal cost of the
service. The alternative to this increase is for the bus firms to eliminate
the unprofitable routes. If the service is highly needed but the individuals
are unable to afford the cost, then some form of federal, state or local
subsidy may be required. (Committee on Commerce, Science, and
Transportation, 1978)
The Issue of Regulation
Historically, any industry which has sufficient economies of scale to
make it a natural monopoly or is "affected with the public interest" has been
subjected to regulation. Each of these regulatory rationales, as they apply
to the intercity bus industry, are discussed in this section.
Natural Monopoly
A natural monopoly occurs where unit costs decline with increases in
output of goods or services resulting from economies of scale within a
65
company. The reason for this situation is that a large capital investment is
required in order to serve customers on demand. Natural monopolies are
regulated in order to ensure quality service to the consumer. This is
accomplished by restricting entry, regulating prices and providing mechanisms
to ensure a certain level of output by the industry. (Fravel, 1979)
Economies of scale and large investments, which are indicative of
natural monopolies, have not been found to be present in the intercity bus
industry. (Pinkston, 1975) Small bus firms are able to operate at the same,
or sometimes lower, cost as the large bus companies. Additionally, entry
into the industry is relatively easy to achieve in terms of costs because the
initial investment is relatively low. (Committee on Commerce, Science, and
Transportation, 1978)
It appears that the monopolistic position of bus companies has occurred
because of regulation. Due to strict entry regulation, very few firms have
been granted new operating rights since the passage of the Motor Carrier Act
in 1935. Hence, rather than being regulated because the industry is a
natural monopoly, the industry has become monopolistic because of
regulation. (Committee on Commerce, Science, and Transportation, 1978)
In the Public Interest
Industries which provide goods or services that are essential to the
public are considered to be "affected with the public interest." These
industries are regulated in order to ensure that these goods or services are
available to the public at a certain level of quality or quantity.
The intercity bus industry is considered to be "affected with the public
interest" in that many people depend on its services. Because of this, it is
66
presumed that regulation is necessary to ensure that the industry provides
the service according to its operating authority.
Although regulation of industries "affected with public interest" is
justifiable in many cases, not all industries which are vital to the public
are regulated. In many cases, the forces of competition are a sufficient
restraint to guard against abuse.
Transportation, 1978)
(Committee on Commerce, Science, and
If not all industries essential to the public are regulated, then why is
the intercity bus industry? One study suggests that the existence of
cross-subsidy within the industry provides the rationale for regulation.
Regulation in this case is used to ensure that certain public services are
provided at lower rates, in larger quantities, and in more locations than
would be provided in an unregulated, competitive market. Entry, exit, level
of service and market expansion must be regulated in order to ensure that the
source of the subsidy is maintained and that the subsidy is used to continue
unprofitable service. It appears that this may be why the intercity bus
industry is regulated. Internal cross-subsidization exists within the
industry; regulation ensures these subsidies so that the industry will
continue to provide service in more locations and in larger quantities than
would be provided without the regulation. In this manner, regulation of the
industry protects the public interest. (Fravel, 1979)
Regulatory Reform
Deregulation proposals have come from governmental and industrial
sources, each with various recommendations on what types of regulatory reform
67
should be instituted. In this section the most recently proposed legislative
reform prepared by the Interstate Commerce Cammi ssi on (ICC) is presented,
and the recent bus deregulation in Florida is examined.
The Motor Bus Act of 1981
Due to the overall performance of the industry over the last 10 years,
the Interstate Commerce Commission, in an effort to foster competition and
eliminate needless regulation, has prepared the Motor Bus Act of 1981. This
proposed legislative reform takes into account the similarities between the
trucking industry and the intercity bus industry. With modification and
addition of certain unique characteristics, it is based on the Motor Carrier
Act of 1980, the legislative reform for the trucking industry. In general,
the Motor Bus Act of 1981 proposed reforms in the areas of entry, exit and
rate regulation in the intercity bus industry, and will increase the
opportunities for intercity bus carriers to operate with minimal governmental
interference.
The ICC proposes that entry regulations be loosened so that carriers
applying for certificate of operating authority need only to show fitness to
provide the service, and that the service provided will serve a useful public
purpose and be responsive to demand and need. If these two qualifications
are met, the certificate will be granted unless persons objecting to the
certificate can prove that the new service is inconsistent with the public
interest. The Act requires a fitness only standard for granting operating
authority to charter and special service applicants.
Proposed reform of fare regulation includes extending the zone of rate
freedom and the rule of ratemaking pursuant to that established by the Motor
68
Carri er Act of 1980. The zone of rate freedom wi 11 al 1 ow bus companies to
raise rates not rnore than 10 percent above the rate in effect one year prior
to the effective date of the proposed rate nor to decrease the rate more than
10 percent below the rate in effect. Under the rule of ratemaking, the ICC
will authorize revenue levels that will allow the bus carriers to achieve
revenue levels that will provide a flow of net income, plus depreciation,
adequate to support capital outlays and repayment of debt, permit raising of
needed capital, and take into account reasonable future costs.
The proposed exit. policy will allow interstate carriers to exit from
unprofitable routes by filing such intention with the Commission. All
affected authorities and communities will be given sufficient notice of the
discontinuance of service so that time to seek appropriate subsidy for the
service is provided. In addition, states will be prohibited from requiring a
carrier to continue the intrastate portion of any interstate route which is
abandoned.
The legislative reform also
ci rcuitions
operations
route and
and allows
closed-door
carriers
ca 11 s for the remova 1 of gateway,
restrictions, allows one-way charter
to broaden their existing operating
certificates in respect to charter and package express services.
The proposed Motor Carrier Act of 1981 also includes reforms in the
areas of rate bureaus, temporary authorities, mergers, and state regulation
of carriers. The proposed reforms for rate bureaus and mergers are much the
same as provided in the Motor Carrier Act of 1980. The granting of temporary
authority would only require showing an immediate need for the service and
the fitness of the carrier to provide the service. Applications could be
made orally. In no case would an emergency temporary authority be granted
69
for more than 60 days, including extensions. Under the Act, states must
submit the standards and procedures used by the state in regulating
intrastate rates, fares, classifications, rules and practices to the ICC for
approval. Once approved, the state may exercise its jurisdiction over such
matters for a five-year period, after which it shall resubmit such standards
and procedures for recertification. Without ICC approval, the state may not
exercise jurisdiction over intrastate rates, classifications, fares, rules or
practices.
The ICC believes that, with this proposed. regulatory reform, financial
health of the industry will improve, and a cost-effective, competitive
motor bus system will result. At the same time, the public will benefit from
lower fares and charter rates and increased service brought by increased
competition. (Interstate Commerce Commission, 1980)
Deregulation Experience
There is relatively little knowledge about the effects of deregulation
of transportation systems. The airline and trucking industries have been too
recently deregulated to know what the long-term results will be. The only
experience with deregulation of the intercity bus industry has been in the
State of Florida, the results of which are briefly discussed.
On June 30, 1980, regulation of the intercity bus industry in Florida
ended as the result of Florida Sunset Legislation. Although it is still too
soon to determine the total effect deregulation will have, early analysis
indicates that service has generally improved. The two largest carriers,
Greyhound and Trailways have expanded their services. Between November 1979
and November 1980, the scheduled weekly miles for these carriers increased
7 .8 percent and scheduled weekly trips increased 2. 7 percent. (Management
70
Analysis Center, Inc., 1981) In addition, charter services have expanded
rapidly to satisfy the previously unmet demand, often at reduced rates.
(Sheldon, 1980) There has been a loss of service to some of the small rural
communities where carriers have abandoned unprofitable routes. However, with
entry into the industry more easily achieved, many small carriers are
beginning to serve these abandoned routes and are able to do so profitably.
There have been complaints by residents about loss of service but is is
believed that the ability to experiment with various prices and service
optinns will continue to attract new entrants to supply these markets.
(Shel don, 1980)
In conclusion, data indicate that economic regulation of the intercity
bus industry may no longer be necessary, and in fact may be hindering tbe
ability of the industry to adequately serve the public. There are many
issues that must be addressed in any regulatory reform to ensure that the
needs of the industry and the pub 1 i c can be met. Various proposa 1 s for
regulatory reform have been prepared by governmental agencies and the
industry. The most recent proposal, The Motor Bus Act of 1981, calls for
relaxed entry, fare flexibility and freedom of exit. Although there is
1 ittl e kn owl edge of the 1 ong-term effects deregulation of industry might
have, the experience in Florida indicates that it may be beneficial both for
the industry and the public.
71

VI. HISTORY AND DEVELOPMENT OF TEXAS INTERCITY BUS INDUSTRY
The history of the Texas Intercity Bus Industry is not well-documented.
The first available information results from action of the 40th Legislature
in 1927 requiring certificates of public convenience and necessity. Upon
enactment, operators providing service prior to January 11, 1927 were granted
temporary authority to continue without notice or hearing unless protested.
Even with protests, operations were allowed to continue until a decision was
rendered by the Railroad Commission.
According to the 1928 Texas Almanac there was little motor bus activity
in Texas prior to 1924. The great majority (about 85 percent) of the ' vehicles in 1927 were closed passenger cars seating about 10 persons. There
were a few parlour type cars (approximately 50) seating 12 to 15 and very few
(about 25) streetcar type vehicles seating 28-30 passengers.
The Motor Bus Act resulted· in the first meaningful data concerning the
intercity bus industry in Texas, in addition to setting the future structure
of the industry. The Motor Bus Act gave the Railroad Commission authority to
issue certificates when existing facilities were inadequate. It authorized
the regulation of fares, routes, schedules, service, and safety of operators.
It al so required the filing of annual reports.
Using the records of the Texas Railroad Commission, it appeared that a
limited case study of Kerrville Bus Company would provide an indication of
the evolution of the industry in Texas. The records of even one company such
as the Kerrville Bus Company include several volumes of data. It would be a
major undertaking to examine the record in depth. Furthermore, the lack of
details concerning accounts of some commission actions would probably limit
the value of a complete examination of the Railroad Commission files. The
73
following is a brief synopsis of the Kerrville Bus Company, one of the four
Class I carriers in Texas.
Kerrville Bus Company
In 1927 three separate operators were providing service between San
Antonio and Kerrville. Union Bus Lines operated 2 round trips per day. Mr.
J. L. Powers operated 5 1/2 round trips under the Uni on Bus Company II flag. II
Apparently, flags on the automobiles were used to identify companies. Mr.
Powers was also using the ticketing and terminal facilities of the Union Bus
Company. Hal and Charlie Peterson operated 2 1/2 round trips per day.
The original operating authorities between San Antonio and Kerrville
were the subject of the first hearings of the Railroad Commission concerning
bus operations. The record was voluminous and involved hearings in both
Austin and Kerrville. The decision was an important determinant of the
initial structure of the bus industry in Texas.
Union Bus Lines objected to granting Mr. J. L. Powers authority because
Mr. Powers was operating under the Union Bus Company flag. Union Bus Company
argued unsuccessfully that the authority to operate between Kerrville and San
Antonio should be granted to Union Bus Lines, not Mr. Powers. The Commission
determined that because Mr. Powers owned and operated his own vehicles, he
should be granted separate operating authority. As a result of the decision,
each individual operating even a single vehicle was entitled authority under
the grandfather clause of the Texas Motor Bus Act.
From 1927 to 1970, the Petersons (which formed Kerrville Bus Company in
1928) purchased or leased both duplicate authorities from competitors
(including those of Union Bus Lines and Poners between San Antonio and
74
Kerrvi 11 e) and new authorities to expand its system. In 1970, Kerrvi 11 e
requested that 39 separate operating authorities be consolidated into a
single authority. The following will highlight some of the purchases and
consolidations.
In 1930 Kerrville purchased four separate authorities to provide service
from Lampasas to Houston through Austin, Brenham and Hempstead.
In 1934, Kerrvi 11 e purchased authority from Austin to Kerrville and a
1/2 interest from San Angelo to Big Spring. The second 1/2 interest in San
Angelo to Big Spring was purchased in 1939.
In 1935, Kerrville Bus Company purchased additional authority from
Brenham to Hempstead plus authority from Austin to Smithville. Additional
authority purchased in 1935 included Austin to Gonzales, Kerrville to
Junction and Kerrville to San Antonio.
1939 was also a big purchase year with authorities obtained for Abilene
to Brady, Coleman to Abilene, San Antonio to San Angelo, San Angelo to Big
Spring, San Antonio to Fredericksburg and Austin to Brady.
The preceeding examples are by no means a complete record. They do,
however, indicate the relatively short length of the original certificates
and their large numbers. After 1939, the number of purchases was greatly
reduced.
Perhaps the next major event for the Kerrville Bus Company occurred in
1950 when Southwestern Greyhound instituted through service with Kerrville
Bus Company between Houston and El Paso. The Junction to Pecos authority was
under lease from Southwestern Greyhound to Kerrville since 1937. In 1953 the
leased authority was purchased from Southwestern Greyhound.
75
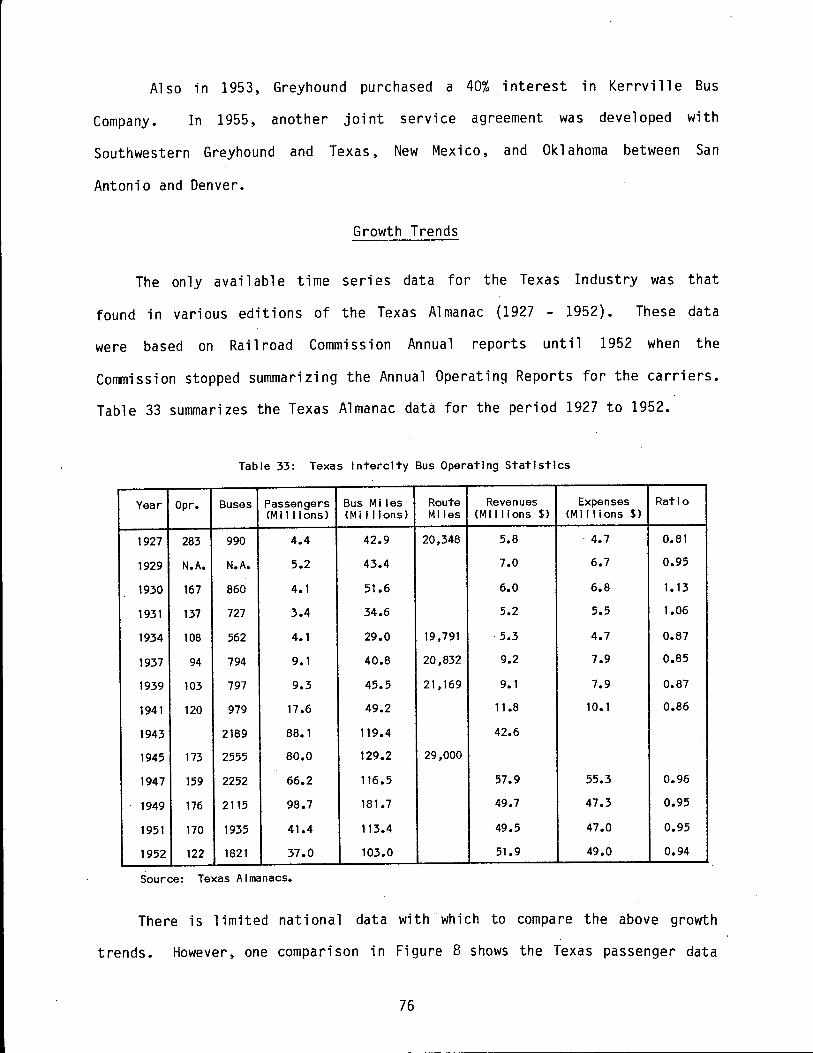
Also in 1953, Greyhound purchased a 40% interest in Kerrville Bus
Company. In 1955, another joint service agreement was developed with
Southwestern Greyhound and Texas, New Mexico, and Oklahoma between San
Antonio and Denver.
Growth Trends
The only available time series data for the Texas Industry was that
found in various editions of the Texas Almanac (1927 - 1952). These data
were based on Railroad Commission Annual reports until 1952 when the
Commission stopped summarizing the Annual Operating Reports for the carriers.
Table 33 summarizes the Texas Almanac data for the period 1927 to 1952.
Table 33: Texas Intercity Bus Operating Statistics
Year Opr. Buses Passengers Bus Ml les Route Revenues Expenses Ratio (Millions) (Millions) Ml les CMI I I Ions $) (Millions$)
1927 283 990 4.4 42.9 20,348 5.8 ' 4. 7 0.81
1929 N.A. N.A. 5.2 43.4 7.0 6.7 0.95
1930 167 860 4.1 51.6 6.0 6.8 1.13
1931 137 727 3.4 34.6 5.2 5.5 1.06
1934 108 562 4.1 29.0 19,791 5.3 4.7 0.87
1937 94 794 9.1 40.8 20,832 9.2 7.9 0.85
1939 103 797 9.3 45.5 21, 169 9. 1 7.9 0.87
1941 120 979 17.6 49.2 11.8 10.1 0.86
1943 2189 88.1 119.4 42.6
1945 173 2555 80.0 129.2 29,000
1947 159 2252 66.2 116.5 57.9 55.3 0.96
1949 176 2115 98.7 181. 7 49.7 47.3 0.95
1951 170 1935 41.4 113.4 49.5 47.0 0.95
1952 122 1821 37.0 103.0 51.9 49.0 0.94
Source: Texas Almanacs.
There is limited national data with which to compare the above growth
trends. However, one comparison in Figure 8 shows the Texas passenger data
76
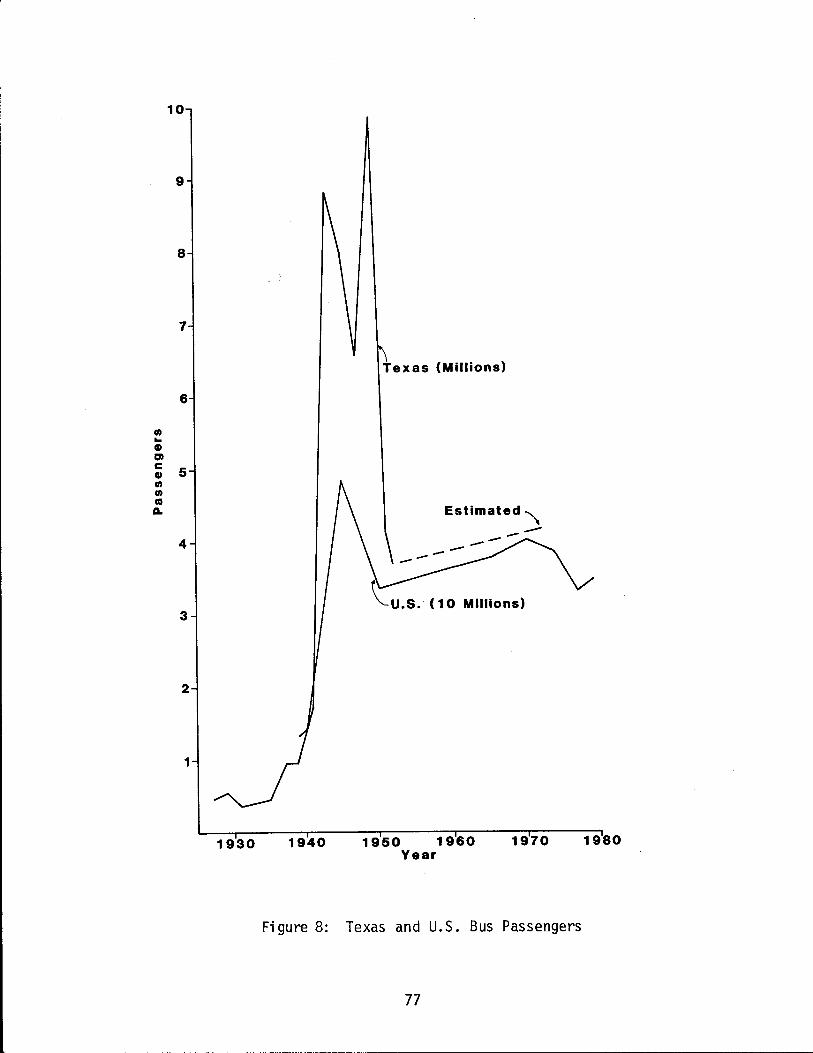
10
9
8
2
1
1930 1940 1950 1960 1970 1980 Year
Figure 8: Texas and U.S. Bus Passengers
77
from 1927 to 1952 and U.S. passenger data from 1939 to 197g (Transportation
Association of America, 1980). The data follow a very similar trend with the
Texas data being close to 10 percent of the U.S. ridership.
Current Status
The Texas Railroad Commission has annual reports for the last 5 years
which provide reasonably detailed financial and operating statistics. In
examining the data, there appears to be some inconsistencies, especially for
carriers operating interstate routes. Nevertheless, the data do pro vi de an
indication of the current condition of the Texas Intercity Bus Industry.
First, it is des i rab 1 e to enumerate the Texas Intercity Bus Industry.
The current operating companies are shown in Table 34. Counting all
Trailways, Inc. subsidiaries (there are 6 subsidiaries operating in Texas),
there are 22 separate operating companies in Texas. However, Southwestern
Transit and Arrow Trailways of Texas are effectively one company. Texas
Motor Coaches was recently purchased by Transportation Enterprises, Inc., the
company that owns Texas Bus Lines. Furthermore, Texas Motor Coaches actually
operates in the Dallas/Fort Worth metropolitan area and is not a typical
intercity bus operation. Similarly, a portion of Valley Transit's bus
operation in the McAllen, Texas area is more typical of urban public
transportation than intercity bus operations. Painter Bus Lines is owned by
the officers of Kerrville Bus Company and operates buses leased from
Kerrville Bus Company.
Further complicating the definition of companies is the fact that two
Texas based Cl ass I companies are partly owned by. Tra i1 ways and Greyhound.
The percentage ownership of Texas carriers by Greyhound and Trailways is
shown in Table 34. Despite ownership by the big two national carriers,
78
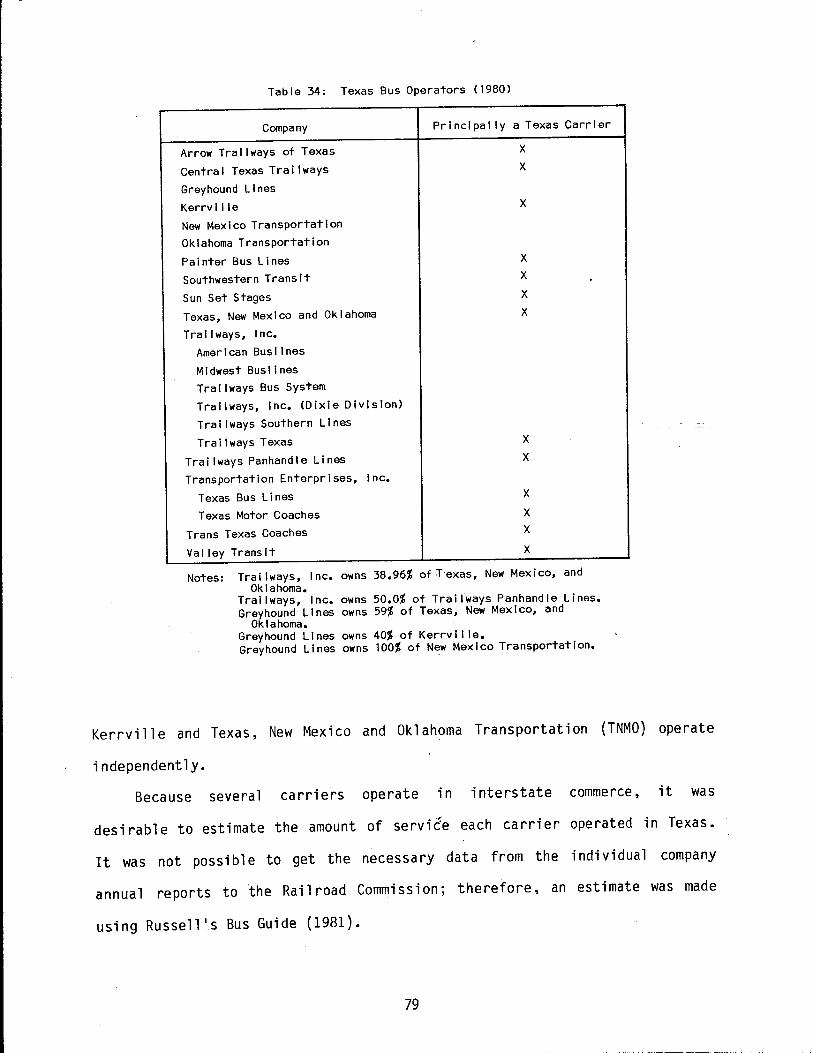
Table 34: Texas Bus Operators (1980)
Company Principally a Texas Carrier
Arrow Tral I ways of Texas X
Centra I Texas Tra i I ways X
Greyhound Lines Kerrville X New Mexico Transportation Oklahoma Transportation
Painter Bus Lines Southwestern Transit
Sun Set Stages Texas, New Mexico and Oklahoma
Trallways, Inc. American Busl Ines
Midwest Busl Ines Trallways Bus System Trailways, Inc. (Dixie Division)
Trailways Southern Lines
Tral I ways Texas Trailways Panhandle Lines Transportation Enterprises, Inc.
Texas Bus Lines Texas Motor Coaches
Trans Texas Coaches
Valley Transit
x x x x
x x
x x x x
Notes: Trai I ways, Inc. owns 38.96% of T·exas, New Mexico, and Oklahoma.
Trallways, Inc. owns 50.0% of Trai lways Panhandle Lines. Greyhound Lines owns 59% of Texas, New Mexico, and
Oklahoma. Greyhound Lines owns 40% of Kerrvll le. Greyhound Lines owns 100% of New Mexico Transportation.
Kerrvi 11 e and Texas, New Mexico and Oklahoma Transportation (TNMO) operate
independently.
Because several carriers operate in interstate commerce, it was
desirable to estimate the amount of service each carrier operated in Texas.
It was not possible to get the necessary data from the individual company
annual reports to ·the Railroad Commission; therefore, an estimate was made
using Russell 1 s Bus Guide (1981).
79
The estimated number of intercity bus miles in Texas is 51 million per
year. This is about 5 percent of the total bus miles in the U.S. A
comparison between the estimate and data reported to the Railroad Commission
for selected carriers appeared to be inconsistent. Small carriers generally
reported a significantly larger number of bus miles than those computed from
the Bus Guide (Russell's, 1981). That inconsistency is likely due to the --
1 a rge charter operations of the smaller carriers. Bus miles reported for
most of the larger carriers to the Railroad Commission appeared to be more
consistent with estimates made from Russell 1 s Bus Guide. The potential error
in the estimates must be considered as being large.
Of the estimated 51 million bus miles in Texas, Greyhound and Trailways
account for approximately 72 percent. Trailways has approximately twice as
many bus mi 1 es as Greyhound. Adding the other two Class I carriers to
Greyhound and Trailways accounts for 85 percent of the total bus miles in
Texas.
The route structure of the carriers is summarized in Figures 9 through
12. Figure 9 shows the routes of Trailways, Inc. including all divisions
operating in Texas. It does not show independent companies affiliated with
the Trailways Bus System. As can be seen from Figure 9, Trailways, Inc., has
an extensive system in Texas. In addition to its transcontinental routes,
Trailways, Inc. has an extensive system in east and south Texas.
Greyhound, the second largest company in Texas, has a route structure as
shown i ~ Figure 10. Greyhound 1 s routes are 1arge1 y transcont i nenta 1 in
nature. It is al so important to note the rel ati onshi p of two Cl ass I
11 bridge 11 carriers in which Greyhound holds a financial .interest. Kerrville
Bus Company connects with Greyhound 1 s east-west routes between San Antonio
80
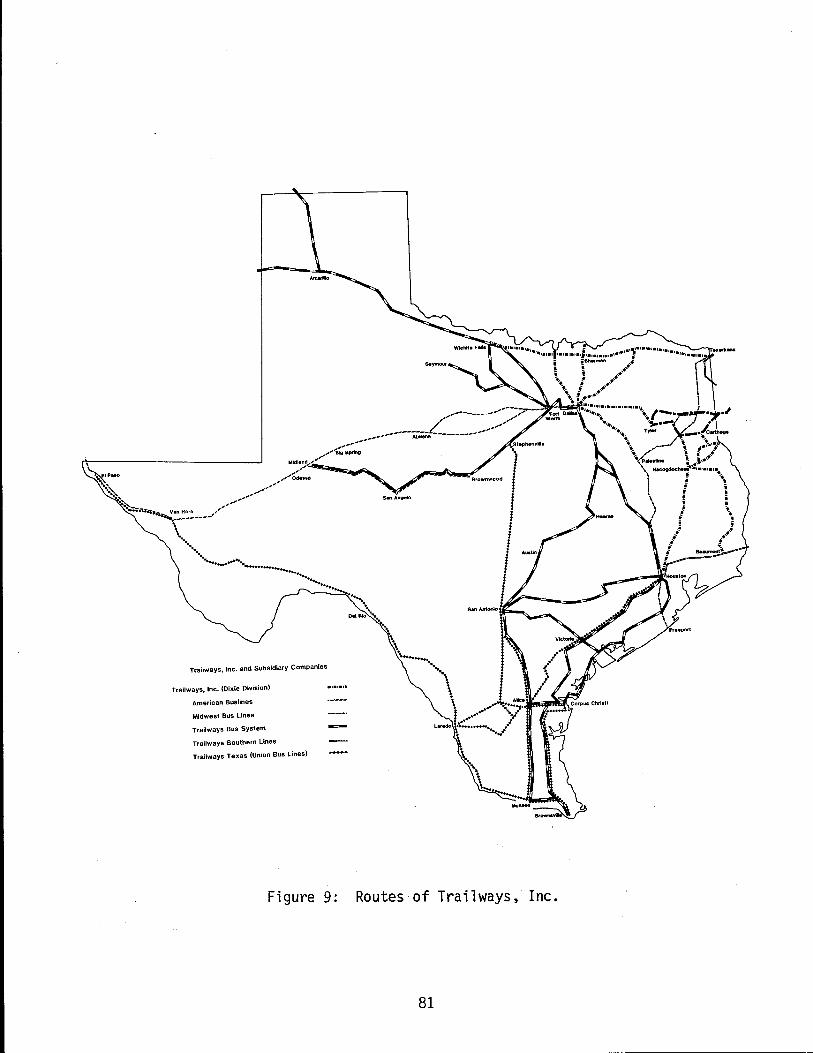
Trailways, Inc. and Subsidiary Companies
Trailways, Inc. (Dixie Division)
American Buslines
Midwest Bus Lines
Trailways Bus System
Trallways Southern Lines
Trailways Texas (Union Bus Lines)
Figure 9: Routes of Trailways, Inc.
81
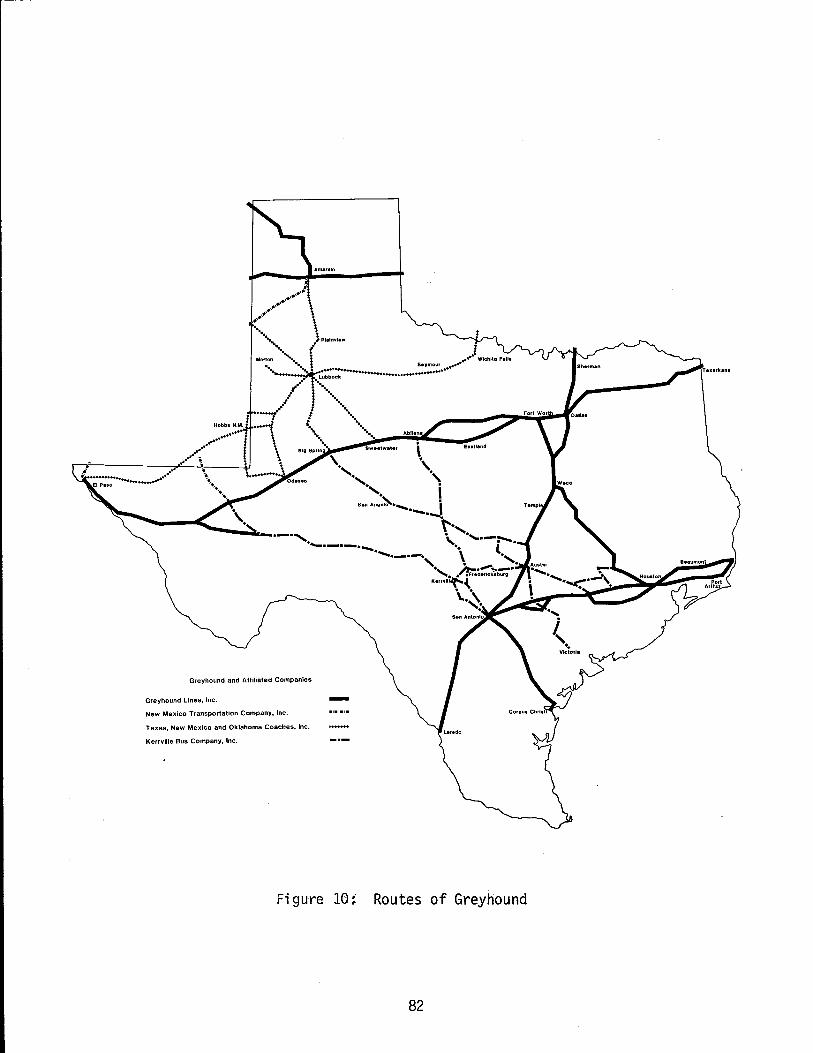
\. '· '· ~
'· I San Ang•~•...... i ....... ....a t·, ·-·,. \. .,.-~.
---·-·-·-.... .. l
Greyhound and Affiliated Companies
Greyhound Lines, Inc.
New Mexico Transportation Company, Inc.
Texas, New Mexico and Oklahoma Coaches, Inc.
Kerrville Bus Company, Inc.
-
Figure 10:
'·--·--· \ ., '· .A-• ...-..,_ •• '• •' :Fr9derlcksburg
Kerrvlll~ ...
\ .. ~
Routes of Greyhound
82
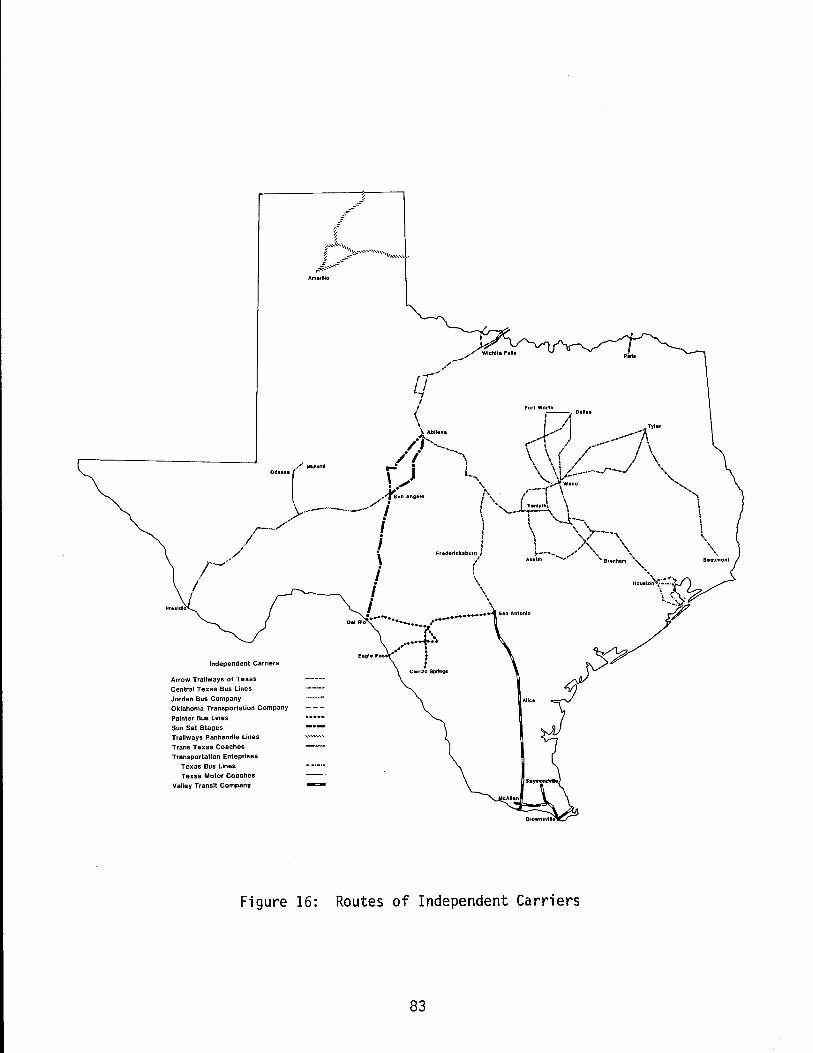
Amar!Ro
,_,_,, i I
,/--
I
/.:chlta Falls
I ,--11oanas
·-~\i Fo•t Wo•th
! / J" Tyler A_ Abilene j.._.....- .~·-~"I\
/
·,-,_ .,,,.- I ~~ I\ /. l ---, \\ \ / /.--· I \
Odom(/ Mldlaod r j L_, . \\ /..--·-···--./""--/ ~ • ~ ' '-...,..~Waco 1'. .... ,----r' \ .
, /'J Soo Angelo t' '\ / I \ '•, \ _ __,.,__ ,,,,/ i "-. ~ample\ \ \
7''" -.-' ' .... __ ,---~ L \I( ;-----/'" i l \ __ },, I · I \ -...;r----.... ... I : , ,x.. '- .,
,,/' ·, Fredericksburg ,J ~--... --_..,,...,../ ·~\\ "" "'··
1---J" 1 Au1tln Brenham ' Beaumont
I. { ~
I~ . \ \ _ ....... ,
I \. Houston~:-·-·•
I • \ PrHldlo
Independent Carriers
Arrow Trailways of Texas
Central Texas Bus Lines
Jordan Bus Company Oklahoma Transportation Company
Painter Bus Lines
Sun Set Stages
Trailways Panhandle Lines
Trans Texas Coaches Transportation Enteprlses
Texas Bus Lines Texas Motor Coaches
Valley Transit Company
Figure 16:
I \ Dal Rio•............. /'_..._.....-• .""7: .... ~·· ... i
Eagle Pas .• f :
Carrtzo Springe
Allee
Routes of Independent Carriers
83
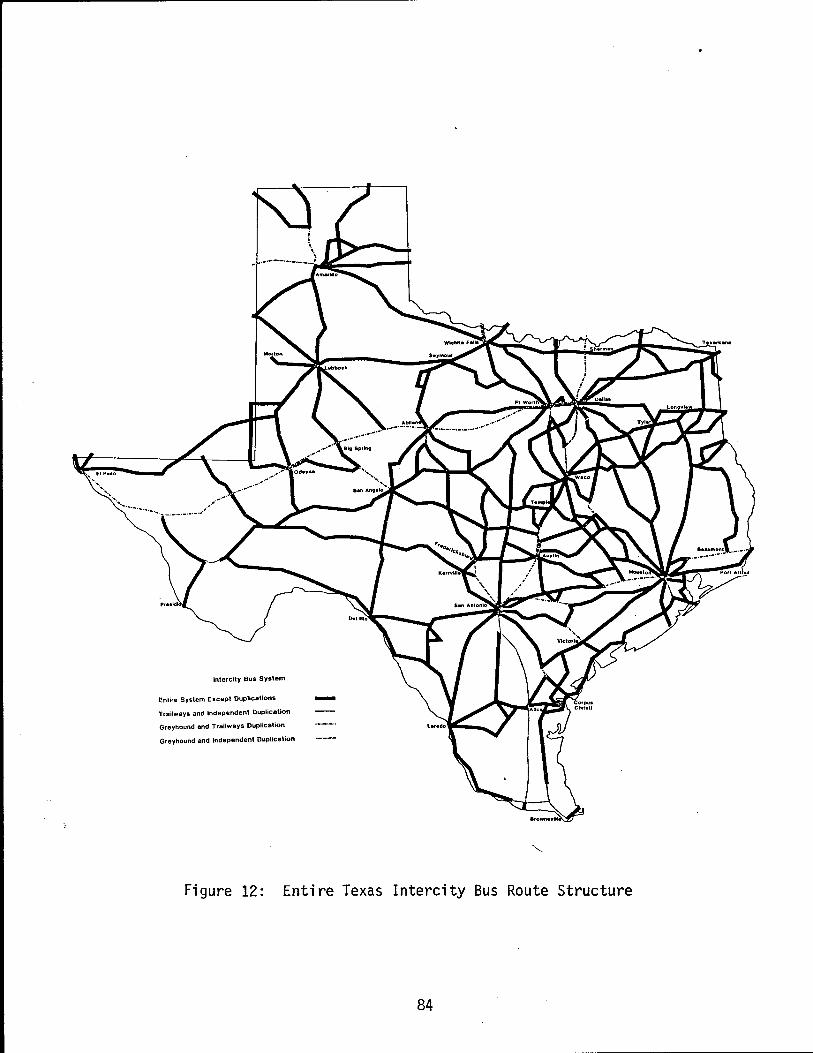
Intercity Bus System
Entire System Except Duplications
Trailways and Independent Duplication
Greyhound and Trailways Duplication
Greyhound and Independent Duplication
Figure 12: Entire Texas Intercity Bus Route Structure
84
and Ft. Stockton. Kerrville Bus Company also connects from San Antonio to
Greyhound routes to Cheyenne. Texas, New Mexico and Oklahoma Transportation
is the other Class I bridge carrier in Texas and is owned in part by both
Greyhound and Trailways. TNMO connects through its Lubbock hub with several
companies in which Greyhound has a financial interest.
Figure 11 shows the independent carriers in Texas except for Kerrville
Bus Company and TNMO which were shown as a part of the Greyhound system
because of their financial ties and large size. The other independents have
a 1 imited route structure and primarily handle local passengers.
The entire Texas Intercity Bus route structure is shown in Figure 12.
The map indicates those routes on which more than one carrier provides
service. The only significant competition is Dallas to El Paso (Trailways
and Greyhound) and San Antonio/Brownsville (Trailways and Valley Transit).
For the most part, only one carrier services a particular route except for
short segments. In most cases, Greyhound and Trail ways may operate between
the same city pairs, but over different routes.
For example, Trailways operates between Dallas and Houston along I-45
while Greyhound operates through Waco along state highways. A short segment
of duplicate service exists in the corridor between Hearne and the junction
of Texas 6 and Texas 14. This duplicate segment is the result of Greyhound's
Dal las/Houston route crossing Trail ways San Antonio/Dal las route. It is
typical of many duplicate segments shown in Figure 12. This type duplication
does indicate significant competition.
Cities Served
The intercity bus industry currently serves nearly 1000 points in Texas
based on schedules published in Russell's Bus Guide. An examination was made
85

to determine the number of points served during previous years. Although it
was determined that the number of points served had dee lined somewhat si nee
1961 (the earliest readily available Bus Guide), an examination of the points
eliminated indicated that the reduction was not generally the result of a
service reduction.
In discussing the Trailways schedules with an employee in the schedule
department, it was confirmed that the schedules in recent years had
eliminated a number of points previously served. Two reasons were given for
the elimination of some schedule points. First, the number of people
travel 1 i ng short di stances between intermediate stops had declined over the
years. Second, in order to simplify tariffs, fewer intermediate points were
shown in the published schedules.
It appears unwarranted to draw any conclusions based on the number of
points served as listed in the Bus Guide. The alternative of examining
schedules in detail was not possible due to the large number of schedules
involved, and also difficulty in obtaining back issues of the Bus Guide.
Operating Statistics
The following analysis includes bus companies that principally operate
in Texas (see Table 34) except for Trailways Texas. Trailways Texas was
excluded for consistency because the other Trailways divisions are not
readily broken down by state. Greyhound is also not readily segregated into
its Texas operations. The data, therefore, represent the approximately 28
percent of the total route-miles in Texas not operated by Greyhound or
Trailways, Inc.
The operating statistics are summarized in Table 35. The data indicate
a more favorable operating ratio for Texas carriers than for the industry as
86
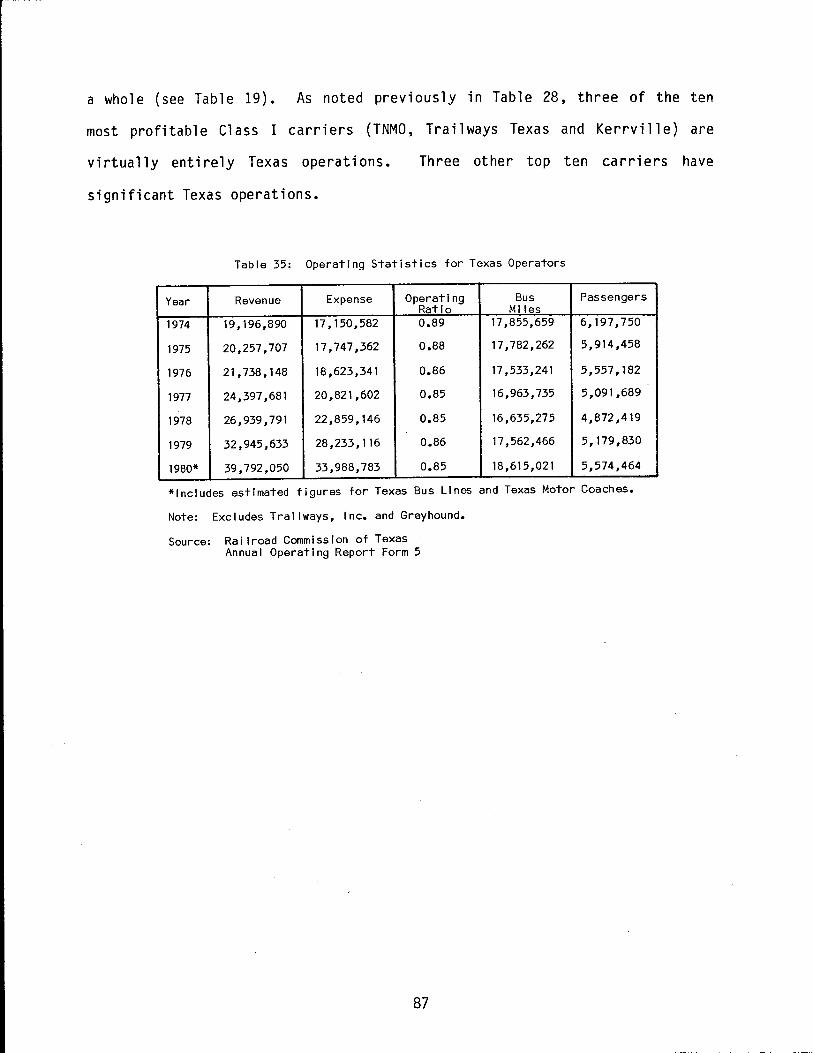
a whole (see Table 19). As noted previously in Table 28, three of the ten
most profitable Class I carriers (TNMO, Trailways Texas and Kerrville) are
virtually entirely Texas operations. Three other top ten carriers have
significant Texas operations.
Table 35: Operating Statistics for Texas Operators
Year Revenue Expense Operating Bus Passengers Ratio Miles
1974 19, 196,890 17, 150,582 0.89 17,855,659 6,197,750
1975 20,257,707 17,747,362 0.88 17,782,262 5,914,458
1976 21, 738, 148 18.,623,341 0.86 17,533,241 5,557,182
1977 24,397,681 20,821,602 0.85 16,963,735 5,091,689
1978 26,939,791 22,859,146 0.85 16,635,275 4,872,419
1979 32,945,633 28,233, 116 0.86 17,562,466 5, 179,830
1980* 39,792,050 33,988,783 0.85 18,615,021 5,574,464
*Includes estimated figures for Texas Bus Lines and Texas Motor Coaches.
Note: Excludes Trailways, Inc. and Greyhound.
Source: Railroad Commission of Texas Annual Operating Report Form 5
87
-

VII. REGULATION IN TEXAS
Chapter 270, General Laws of the Fortieth Legislature in 1927 required
certificates or permits from the Railroad Commission showing public
convenience and necessity. Prior to January 11, 1927, operators were granted
temporary authority to continue. The law stated that certificates of
convenience and necessity shall be issued when existing facilities are
inadequate. The Commission was also granted authority to set fares, routes,
schedules, service standards, safety standards, and to require annual
reports.
Texas was a latecomer in the field of intercity bus regulation.
Pennsylvania was the first state to institute regulation. By 1925, 36 states
had instituted regulation of intercity buses. Most of the early laws were
amended or revised by the time the Texas Legislature enacted the requirement
for certificates in Texas. The industry was largely controlled as a
regulated monopoly. This policy assumed that the motor carrier was a public
utility; therefore, it was subject to public regulation in much the same
manner as rail carriers.
Texas followed the trend of regulated monopoly used by other states.
However, several important Texas cases {Crandall, 1954) established the
precedent of issuing certificates for parallel routes that was followed by
most southern and southwestern states. This granting of competing
authorities did not happen elsewhere because there were relatively few
closely parallel highways in other sections of the country and existing
carriers were usually allowed to operate alternate schedules over new
para ll e 1 highways.
89
An examination of the current route structure in Texas (see Figure 12)
confirms the influence of the regulated monopoly approach to regulation. As
indicated earlier, the principal competition is on alternate routes. Only in
recent years has some limited additional competition been permitted in the
granting of some express service over existing routes of other carriers.
That is, two carriers may operate between the same city pairs, with one
carrier providing local service and the other providing express service.
Railroad Commission of Texas
Motor bus companies are regulated by the Rail road Commission of Texas
(Commission). The Commission has promolgated regulations to implement the
Commission 1 s statutory duty of regulation in the public interest. This
section summarizes the current regulations.
Motor bus companies are those concerns operating motor-propelled
passenger vehicles and engaged in the business of transporting persons for
compensation or hire over the public highways within the State of Texas,
whether operating over fixed routes and schedules or otherwise, except that
operations within any incorporated town or city (including suburbs) are
excluded from regulation.
The Commission accepts the Interstate Commerce Commission (ICC)
accounting and reporting procedures for Class I and II carriers as complying
with State regulations. Other operators only have to submit relatively brief
annual reports. Greyhound and Trailways file ICC reports to the Commission
while the rest of the carriers file Commission forms.
Commission approval is required on a number of changes in operation
including sale, transfer, or lease of a certificate, and changes in fares or
schedules. The Commission also has regulations concerning the condition of
90
buses, driver qualifications, insurance, station facilities, interline and
through bus agreements, tickets, charters and package express. Although the
requirements are generally similar to ICC requirements, they do differ in
some details and do represent additional requirements in some areas. The
most notable difference is the more stringent requirements of the Commission
concerning schedule changes and service discontinuance.
, Implications in Texas of Federal Regulatory Reform
Regulatory reform appears to be supported by Greyhound but is of concern
to other carriers. The smaller carriers, while not necessarily opposed to
deregulation, appear concerned about the competitive advantage of other
companies. There appears to be concern about both big and small carriers.
The concern about Greyhound 1 s competitive advantage centers around the
size of the Greyhound system and Greyhound's large number of terminals.
Given the significant number of long haul passengers (see Chapter VIII),
Greyhound does appear to hold an advantage to the more loosely structured
Trail ways System. Given the stab 1 e nature of the industry in terms of
ridership growth, it appears unlikely that a new company could readily
develop a nationwide system. It must also be remembered that both the
Greyhound and the Trailways, Inc. System are partially the result of
regulatory encouragement and protection. It appears 1 ogi ca 1 that Greyhound
is a supporter of total deregulation since it has an excellent nationwide
system that is unrivalled even by Trailways. However, it must be noted that
Greyhound will be subject to potential competitive pressure in high passenger
volume markets between medium and large cities. The most serious implication
of this competition may be a restructuring of the Greyhound System to
91
eliminate some marginal stops that contribute little to revenue and also
degrade overall service speed.
Trailways appears to desire public envolvement in terminals in order to
eliminate Greyhound 1 s competitive advantage. With separate terminals,
passengers are less likely to evaluate the alternative service offered by
competing companies.
As indicated earlier, the current proposal for regulatory reform
includes virtual preemption of state regulation except for totally intrastate
operations. The critical question is what effect would such a change have on
Texas.
The impacts of regulatory changes (especially more competition) are to a
1 arge extent the subject of speculation. It does seem that some 1ike1 y
impacts can be postulated based on knowledge of the Texas industry.
'\ It is unlikely that less regulation will improve service to small
places. The limited market in small places makes them largely unattractive
as competitive targets. Similarly, it does not appear that a wholesale
abandonment of service to small places will be seen immediately as the result
of regulatory freedom. The most 1 i kely abandonments would be by smal 1
carriers who provide scheduled service in order to obtain and maintain
charter authority. Another 1 i kely type of abandonment is smal 1 pl aces along
major routes that generate only small volumes of business and are served by
perhaps only one schedule per day in each direction.
What seems most likely to change is service between major cities. Major
city service is the most likely competitive target due to the larger
passenger volumes. Intermediate stops may see some service reductions as
carriers with noninterstate routes between major city pairs opt for more
express or limited stop service.
92
A possible scenario can be developed looking at Bryan/College Station.
Bryan/College Station has four Greyhound schedules between Dallas and
Houston (plus two between Ft. Worth/Houston) .in each· direction, with one
Dallas/Houston non-stop schedule each way in the early morning hours.
Trailways serves the corridor via IH-45. In a less restrictive environment,
it is possible that Greyhound will elect to provide some service directly
between Houston and Dallas along IH-45, possibly with a few stops such as
Huntsville and Corsicana. Depending upon the amount of traffic diverted from
the present route through Bryan/College Station, it is conceivable that the
number of schedules through Bryan/College Station could be reduced. Although
service frequency might be reduced, it is unlikely that the route would be
abandoned.
It must be emphasized that the above scenario, while possib 1 e, may not
occur. The actions of the existing carriers will be determined in large
measure by their competitors. Two types of competition appear to be
possible. As will be shown later in the report, the substantial number of
long haul passengers (i.e., 500 miles or more) effectively have the option to
choose between the big two carriers. Greyhound and Trailways are, therefore,
likely to adjust schedules and routes competitively to offer the most
attractive service. The second type of competition is likely to come from
the smaller carriers attempting to capture a portion of the more lucrative
service between medium and large cities. If competition affects profits in
the more lucrative service areas, adjustments are likely in the marginal
areas in order to maintain reasonable profitability.
The desirability of more competition is, therefore, a matter of
priorities. As will be shown later in the report, service is presently
perceived to be good by users. The present system attempts to provide
93
extensive coverage through the use of internal subsidies, if necessary. With
more competition, better service may result in the major corridors. Service
to some points will only continue if external (to the bus company) subsidies
are provided. External subsidies appear to be unlikely in Texas. In an
economic sense, service will be more efficient. Whether the results of
regulatory reform, if implemented, are an improvement, will likely be
debated even after the changes take place.
94
VIII. TEXAS INTERCITY BUS USER SURVEY
The intercity bus industry in Texas and the Southwest appears to be
somewhat healthier than the industry in other parts of the country.
(Committee on Commerce, Science, and Transportation, 1978). In order to
determine if bus passengers in Texas had any unique characteristics, an
on-board survey was conducted throughout the State.
The survey instrument used was designed to gather socioeconomic and
demographic data for users and to identify those features considered
important to passengers in deciding to ride the bus. The survey was prepared
in both English and Spanish because of the significant number of
Spanish-speaking residents in Texas. Copies of both versions are found in
Appendix A.
A stratified sampling frame was selected because of regional differences
within the State. Previous studies (Michigan Department of State Highways
and Transportation, 1977; National Travel Survey, 1977; Interstate Commerce
Commission, 1978) indicated that low income persons are a significant part of
intercity bus ridership. The border area of the State is economically poorer
than the rest of the State. Based on county economic characteristics, one
region includes those counties along the border identified as having a lower
economic base. The remaining counties were roughly divided in half. The
resulting three study regions are shown in Figure 13. The survey points
within these regions are also given.
Within each region, survey points were further segmented by small
(non-SMSAs), medium (SMSAs less than 1,000,000) and large (SMSAs greater than
1,000,000) cities. There are approximately 1000 potential survey points in
95
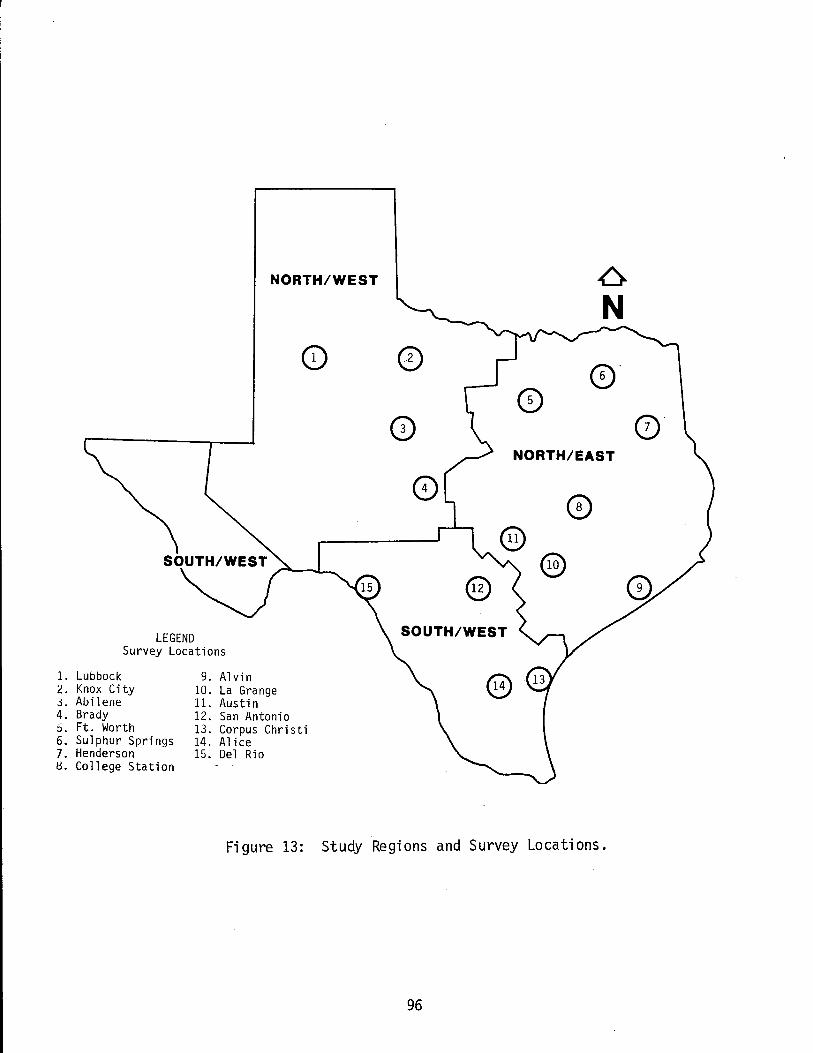
NORTH/WEST
LEGEND Survey Locations
1. Lubbock 9. Alvin 2. Knox City 3. Abilene
10. La Grange 11. Austin
4. Brady 12. San Antonio ti. Ft. Worth 6. Sulphur Springs
13. Corpus Christi 14. Al ice
7. Henderson 15. Del Rio 8. College Station
SOUTH/WEST
@
6 N
NORTH/EAST
©
Figure 13: Study Regions and Survey Locations.
96
Texas with only 25 points being in the medium or large category. The number
of survey points in each strata are shown in Table 36.
Table 36: Survey Points by Strata
Size
Region Smal I Medium Large
North/East 4 2 1
North/West 2 2 O*
South/West 2 1 1
*No large cities in this region.
A nonproportional sampling scheme was selected in order to assure that
each strata was adequately represented; while at the same time, avoiding the
task of undertaking a large number of surveys in some locations to maintain
proportionality. The strata responses were, therefore, appropriately
weighted to reflect the non pro port i ona 1 samp 1 i ng scheme and the different
numbers of departures in each strata.
The survey points in each strata were selected systematically from the
strata. For small cities (towns), al 1 departing buses were surveyed. For
medium and large cities, approximately 10 to 12 departures were
systematically selected from all departures for the day.
selected to include all hours of the day and night.
departures were surveyed.
Departures were
A total of 122
With the cooperation of the bus companies operating in Texas, the buses
to be surveyed were boarded just prior to departure. Questionaires (printed
on heavy card stock) and pencils were distributed to each person 12 years of
age and older who would accept a form. There were a total of 2226 passengers
including 208 children under 12 years of age. From the tot a 1 of 2018
97
passengers, age 12 or more, a total of 1068 useabl e surveys were received.
This is a response rate of 53 percent.
The survey instrument obtained information on personal characteristics
of the passengers, general attitudes towards bus service and information on
the trips made by bus. This section presents a summary of the more pertinent
data collected with the survey.
Intercity Bus User and Travel Characteristics
To obtain a profile of intercity bus users in Texas, questions were
asked concerning age, sex, education, occupation, household income, and
vehicle ownership. The responses to these questions are summarized below.
Age, Sex, and Education
The question "What is your age?" was asked. Figure 14 shows the
cumulation frequency distribution for the responses given.
As shown, bus passengers in Texas are fairly young. Fifty percent of
the ride rs surveyed are under 30 years of age, 30 percent are between the
ages of 18 and 25. Only 10 percent of the participating riders were age 65
or over. Of the 1008 respondents, 54 percent were female and 46 percent were
male.
Figure 15 gives the cumulative frequency distribution for years of
education. Approximately 32 percent had completed less than 12 years of
school. Thirty-six percent of the passengers surveyed had completed high
school and 15 percent had obtained a college degree.
98
~ u c Q.l :::J er Q.l s...
LL.
Q.l >
•r-+l l'tl ..-:::J E :::J u
l 00
90
80 85th Percentile
70
60
50
40
30
20
10
10 20 30 40
50th
50 Age
Percentile
60 70
Figure 14: Cumulative Frequency Distribution, Age of Intercity Bus Passengers
99
80 90 100
100
90 85th Percentile
80
70 >, u s:: Q) 60 :::::i CJ Q) ~
w.... 50th Percentile Q) 50 > .µ ro '; 40 E :::::i u
30
20
10
0 0 5 10 15 20
Years of Education
Figure 15: Cumulative Frequency Distribution, Years of Education for Intercity Bus Passengers
100
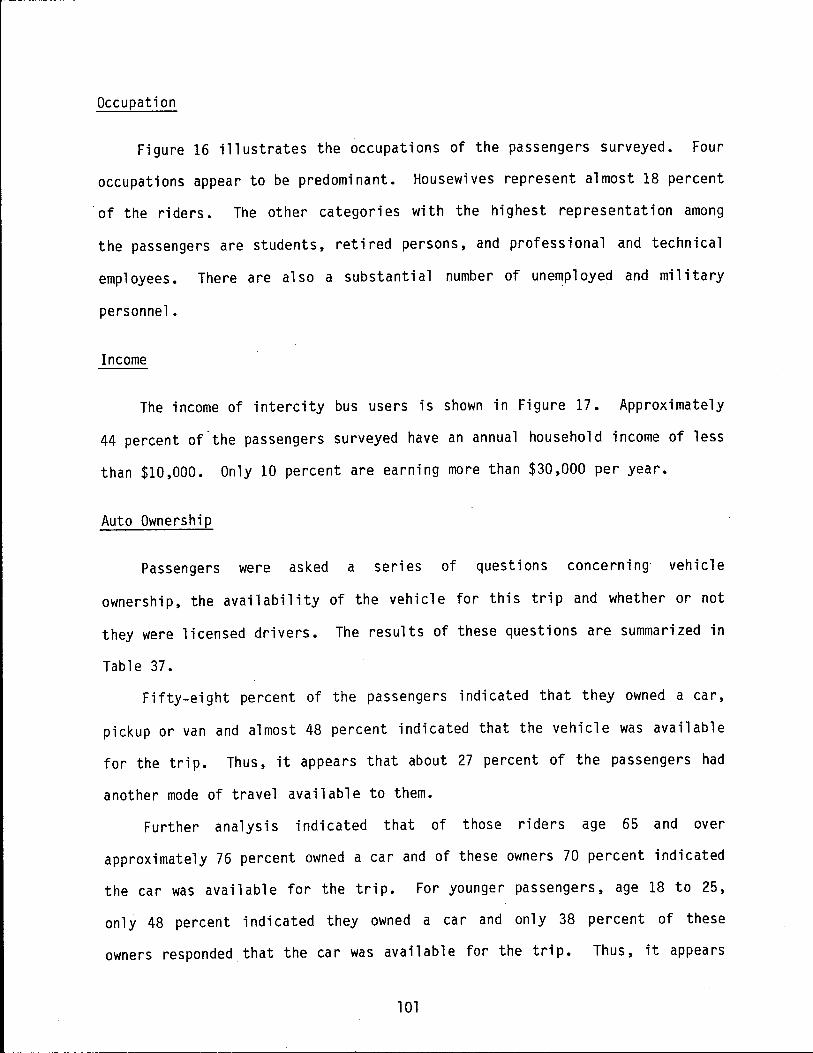
Occupation
Figure 16 illustrates the occupations of the passengers surveyed. Four
occupations appear to be predominant. Housewives represent almost 18 percent
of the ride rs. The other categories with the highest representation among
the passengers are students, retired persons, and professional and technical
employees. There are also a substantial number of unemployed and military
personnel.
Income
The income of intercity bus users is shown in Figure 17. Approximately
44 percent of the passengers surveyed have an annual household income of less
than $10,000. Only 10 percent are earning more than $30,000 per year.
Auto Ownership
Passengers were asked a series of questions concerning vehicle
ownership, the availability of the vehicle for this trip and whether or not
they were licensed drivers. The results of these questions are summarized in
Table 37.
Fifty-eight percent of the passengers indicated that they owned a car,
pickup or van and almost 48 percent indicated that the vehicle was available
for the trip. Thus, it appears that about 27 percent of the passengers had
another mode of travel available to them.
Further analysis indicated that of those riders age 65 and over
approximately 76 percent owned a car and of these owners 70 percent indicated
the car was available for the trip. For younger passengers, age 18 to 25,
only 48 percent indicated they owned a car and only 38 percent of these
owners responded that the car was available for the trip. Thus, it appears
101
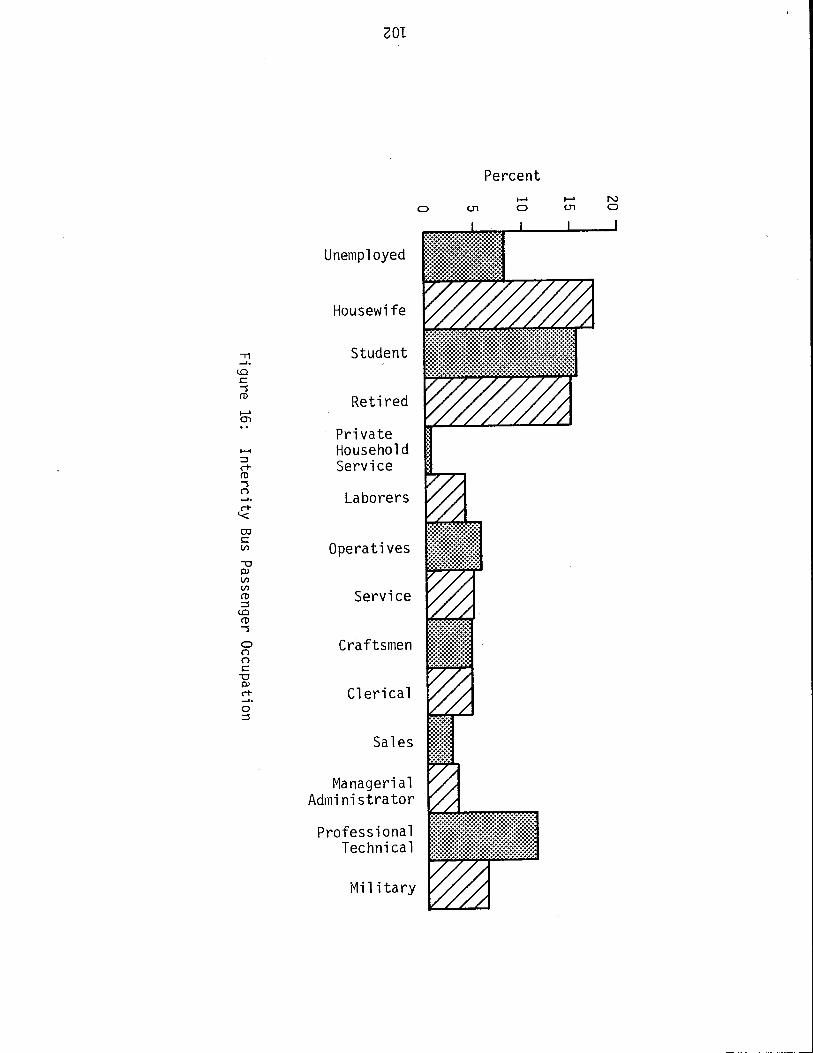
,, ...... <.O c --s ro ...... ())
....... ::s c+ ro --s ('") ...... Q c;o c V>
-0 PJ V> V> ro ::s
<.O ro --s 0 ('") ('") c -0 PJ c+ ...... 0 ::s
ZOT
0 U1
Percent ...... 0
...... U1
Unemployed tilll!lllllll!lllll!l!l!l!lll!llllll\ f;:::::~::::::::::::::::::::::::::::~
Housewife
Student
Retired
Private Household Service
Laborers
Operatives
Service
Craftsmen
Clerical
Sales
Managerial Administrator
Professional Technical
Military
JJ>JS>>>>>>I
N 0
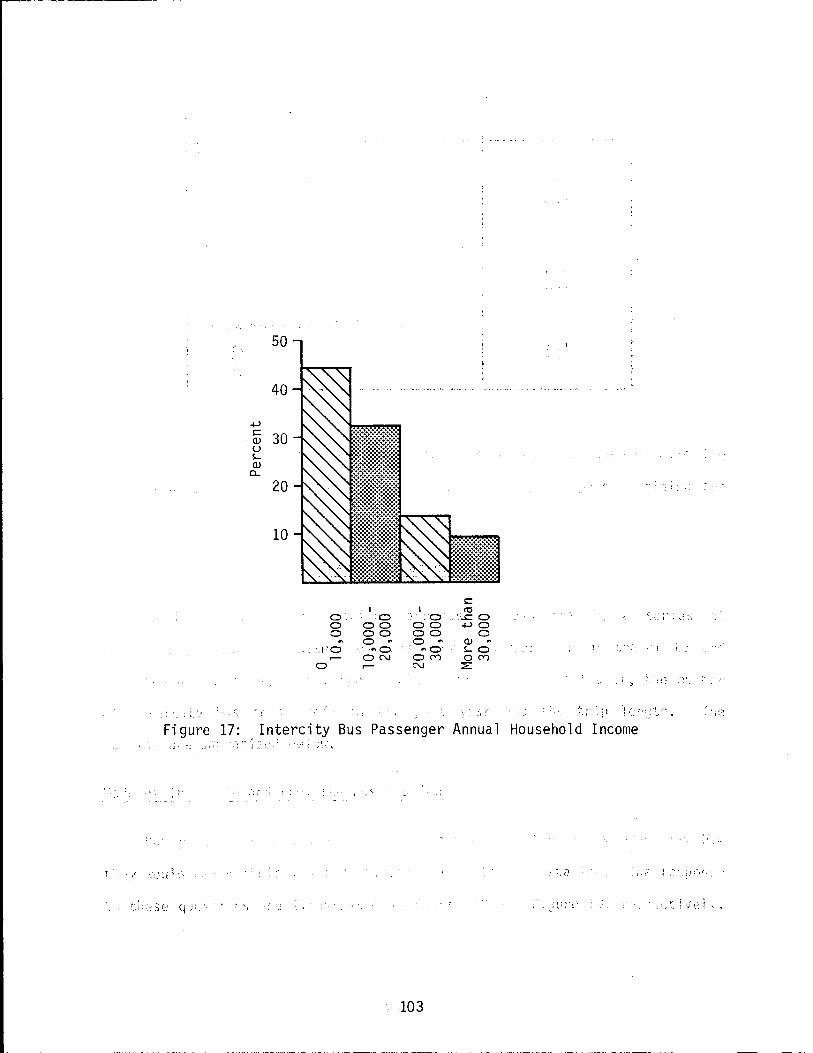
Figure 17:
. ;
50
40
+l s::
30 Q)
u s.... Q)
CL
20
10
0 0 0 ...
· .. l'O .--
0
0 00 00 0 ...
... a: ON .--
s:: . IO
"·-~o +lO
0 Q)
s.... .0' Q(Y) ~
: ( . / .. ; -~ . ...
Interc)ty Bus Passenger Annual Household Income
103
Table 37: Vehicle Ownership, and Availability, and Licensed Drivers
Question
"Do you own a car, pickup, or van?"
Yes
No
n=1011
"If yes, was it available for this trip?"
Yes No
n=657
"Do you have a driver's I icense?"
Yes No
n=1009
Response (Percent)
58.3
41. 7
47.9 52.1
75. 1 24.9
that the younger passengers represent more of a "captive" market than the
elderly which may account for the larger number of young persons riding the
bus.
Travel Characteristics
To better understand various aspects of bus travel, a series of
questions was asked. These questions addressed the mode of travel to and
from the bus station, trip purpose, alternative choice of travel, the number
of intercity bus trips made in the past year and the trip length. The
results are summarized below.
Mode of Travel To and From the Bus Station
Bus passengers were asked how they arrived at the bus station and how
they would reach their final destination from the bus station. The response
to these questions are illustrated in Figure 18 and Figure 19, respectively.
104
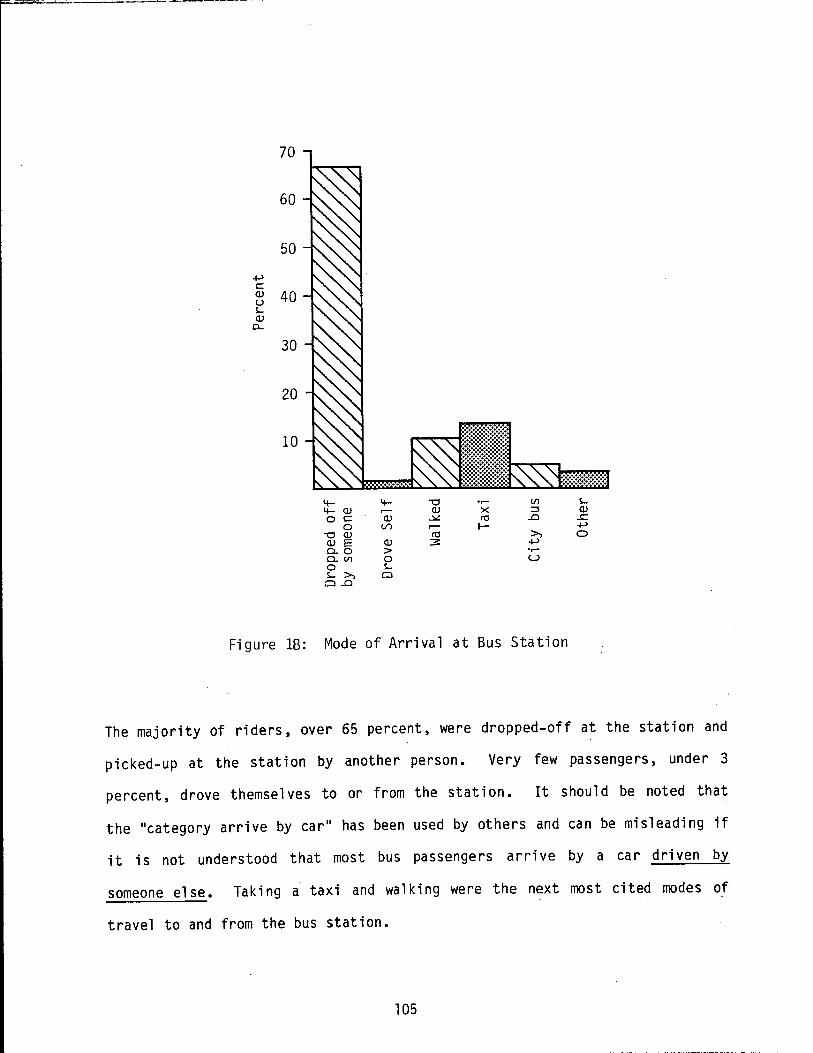
+-' c
70
60
50
~ 40 s... OJ
0..
30
20
10
4-4- OJ 0 c
0 -0 OJ OJ E 0..0 0.. (/) 0 s... >, Cl ..0
4- -0 •r- (/)
.-- OJ x :::::i OJ ~ rO ..0
(./) .-- I-rO >,
OJ 3 +-' > •r-0 u s... Cl
Figure 18: Mode of Arrival at Bus Station
s... OJ ~
+-' 0
The majority of riders, over 65 percent, were dropped-off at the station and
picked-up at the station by another person. Very few passengers, under 3
percent, drove themse 1 ves to or from the station. It should be noted that
the 11 category arrive by car 11 has been used by others and can be misleading if
it is not understood that most bus passengers arrive by a car driven by
someone else. Taking a taxi and walking were the next most cited modes of
travel to and from the bus station.
105
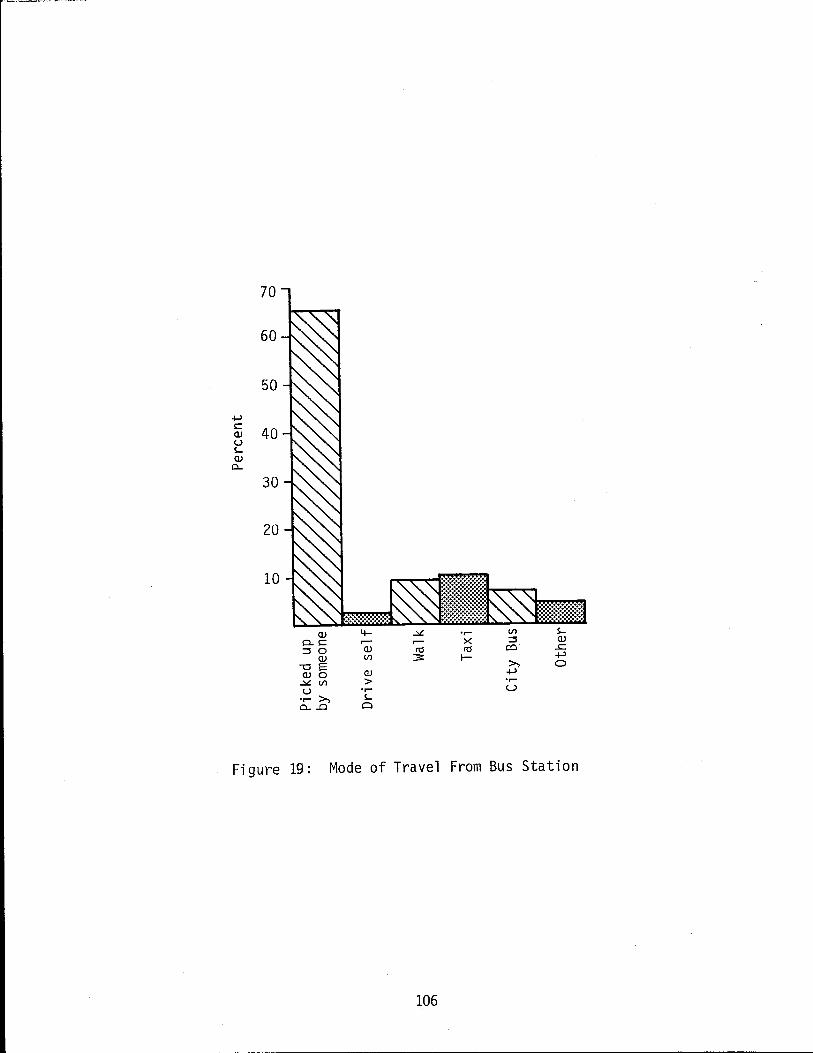
70
60
50
.µ
~ 40 u SQ)
0...
30
20
10
Q) a.. s:: ::::I 0
Q)
-o E (lJ 0
..::,L. Vl u
·.-- >, 0... ..0
4- ..::,L. ·.-- Vl S-...- ...- x ::::I Q)
(lJ rtS rtS co ...s:: Vl 3 I- .µ
>, 0 (lJ ~
> ·.--•r- u S-
0
Figure 19: Mode of Travel From Bus Station
106
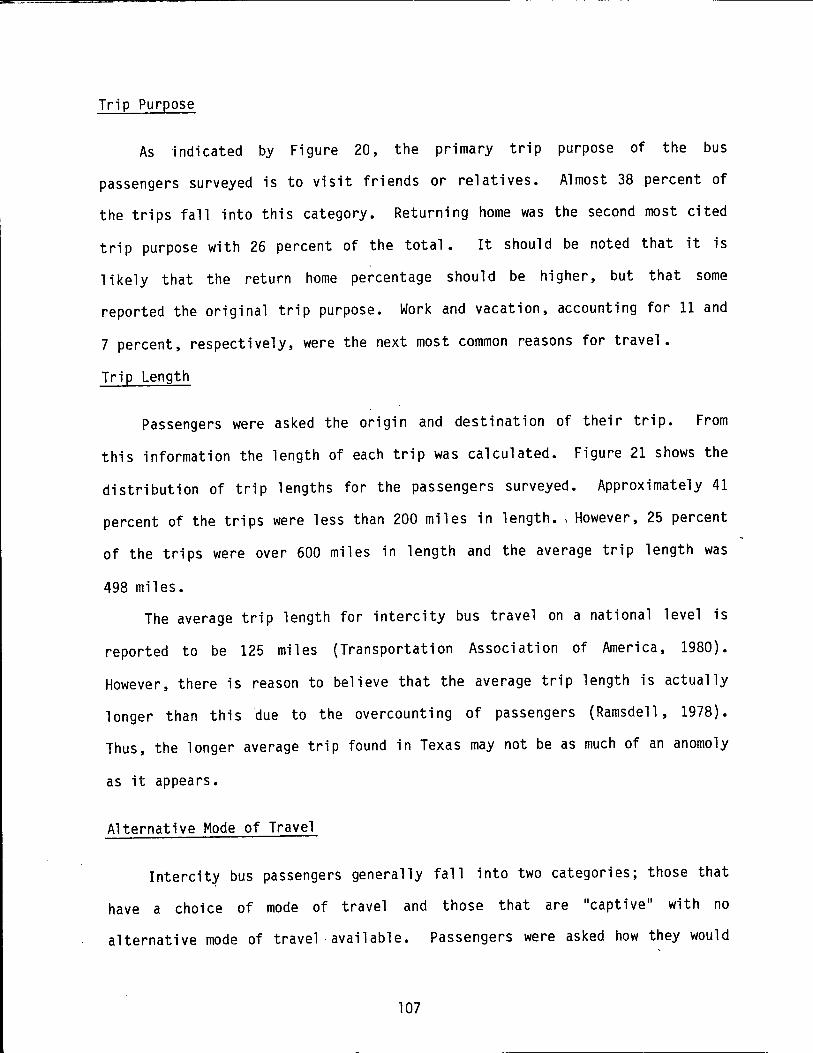
Trip Purpose
As indicated by Figure 20, the primary trip purpose of the bus
passengers surveyed is to visit friends or relatives. Almost 38 percent of
the trips fall into this category. Returning home was the second most cited
trip purpose with 26 percent of the total. It should be noted that it is
1 i kely that the return home percentage should be higher, but that some
reported the original trip purpose. Work and vacation, accounting for 11 and
7 percent, respectively, were the next most common reasons for travel.
Trip Length
Passengers were asked the origin and de st i nation of their trip. From
this information the length of each trip was calculated. Figure 21 shows the
di stri but ion of trip 1 engths for the passengers surveyed. Approxi ma tel y 41
percent of the trips were 1 ess than 200 mi 1 es in 1 ength. , However, 25 percent
of the trips were over 600 mi 1 es in 1 ength and the average trip 1 ength was
498 miles.
The average trip length for intercity bus travel on a national level is
reported to be 125 miles {Transportation Association of America, 1980).
However, there is reason to believe that the average trip length is actually
longer than this due to the overcounting of passengers (Ramsdell, 1978).
Thus, the longer average trip found in Texas may not be as much of an anomoly
as it appears.
Alternative Mode of Travel
Intercit.y bus passengers generally fall into two categories; those that
have a choice of mode of travel and those that are "captive" with no
alternative mode of travel ·available. Passengers were asked how they would
107
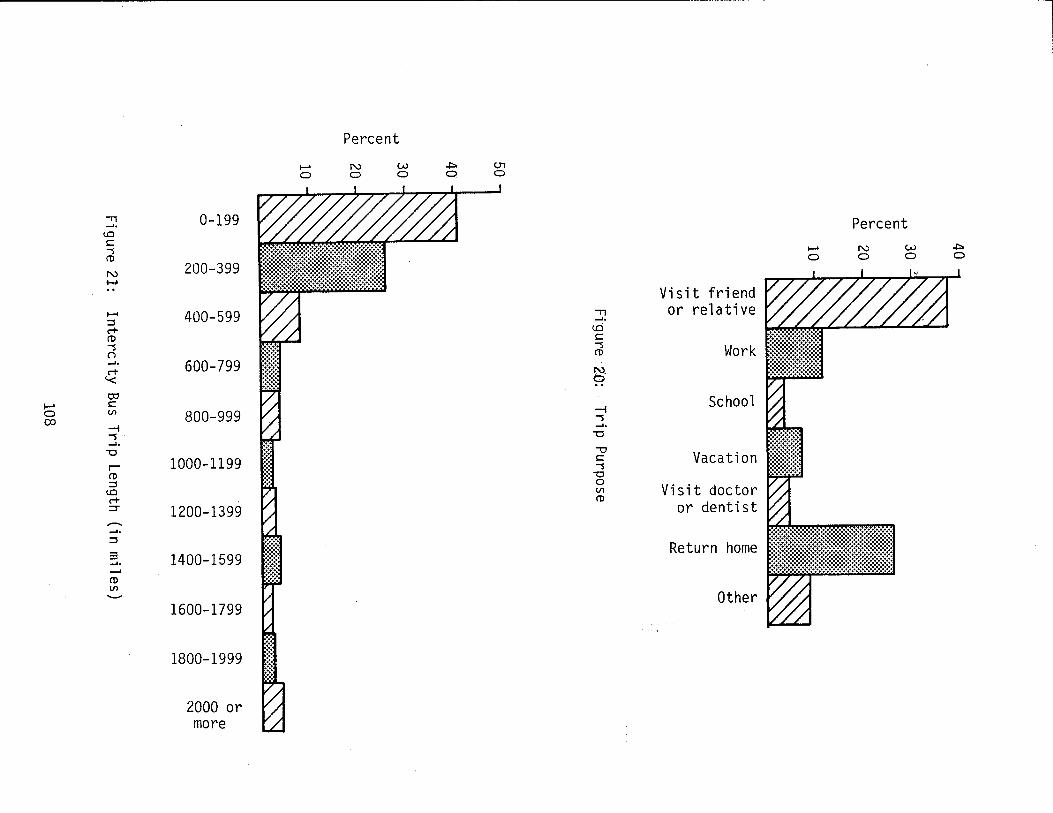
..,, 0-199 ..... <..O i::: -s (I)
N 200-399 ·-...... 400-599 ::::l c+ (I) -s ("') ..... 600-799 c+ '< o:i
I-' s::: 0 Vl 800-999 00
-i -s ..... -c r- 1000-1199 (I) ::::l
<..O c+ :::r 1200-1399 ........ ..... ::::l
3 1400-1599 ..... ..... (I) Vl __.
1600-1799
1800-1999
2000 or more
Percent
....... N w ~ U1 0 0 0 0 0
I V/7/
..,, ..... <.Ci i::: -s (I)
N. 0
-i -s ..... -c ""O s::: -s -c 0 Vl (I)
Visit friend or relative
Work
School
Vacation
Visit doctor or dentist
Return home
Other
....... 0
Percent N 0
w 0
~ 0
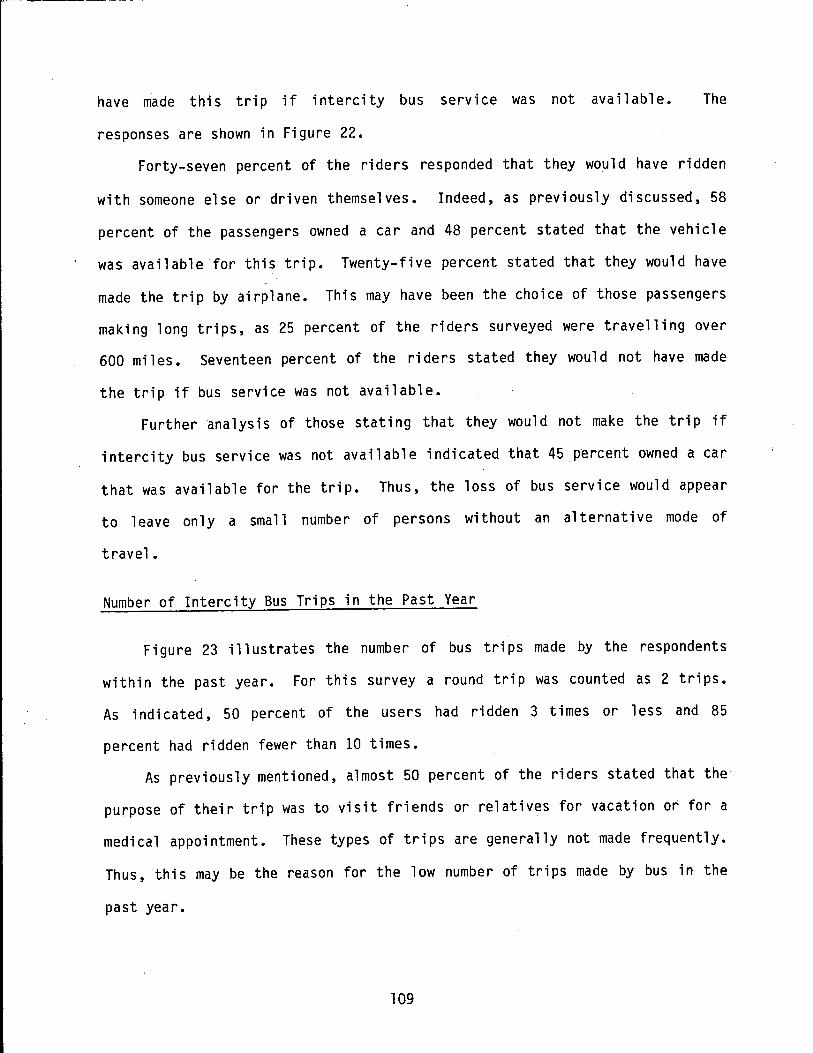
have made this trip if intercity bus service was not available. The
responses are shown in Figure 22.
Forty-seven percent of the ride rs responded that they would have ridden
with someone else or driven themselves. Indeed, as previously discussed, 58
percent of the passengers owned a car and 48 percent stated that the vehicle
was available for this trip. Twenty-five percent stated that they would have
made the trip by airplane. This may have been the choice of those passengers
making long trips, as 25 percent of the riders surveyed were travelling over
600 mil es. Seventeen percent of the ride rs stated they would not have made
the trip if bus service was not available.
Further analysis of those stating that they would not make the trip if
intercity bus service was not available indicated that 45 percent owned a car
that was available for the trip. Thus, the loss of bus service would appear
to leave only a small number of persons without an alternative mode of
travel.
Number of Intercity Bus Trips in the Past Year
Figure 23 i 11 ustrates the number of bus trips made by the respondents
within the past year. For this survey a round trip was counted as 2 trips.
As indicated, 50 percent of the users had ridden 3 times or less and 85
percent had ridden fewer than 10 times.
As previously mentioned, almost 50 percent of the riders stated that the
purpose of their trip was to visit friends or relatives for vacation or for a
medical appointment. These types of trips are generally not made frequently.
Thus, this may be the reason for the low number of trips made by bus in the
past year.
109
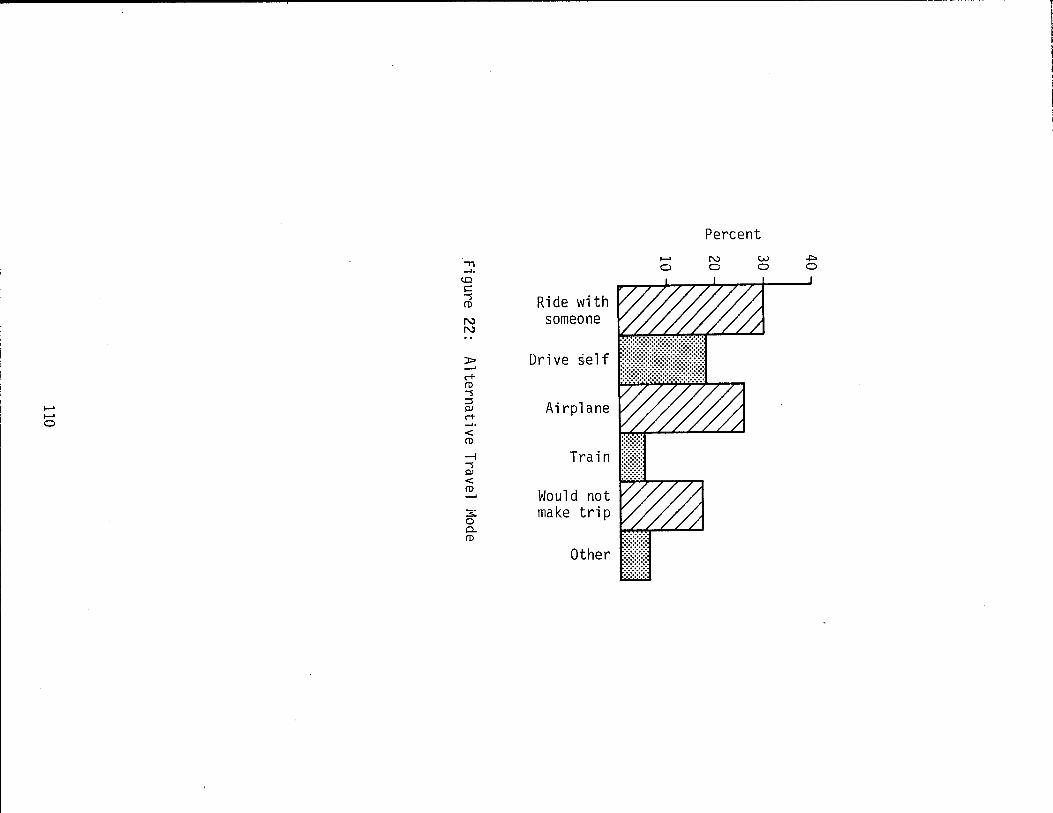
r
I I
Percent ....... N w +::> ,, 0 0 0 0 .....
(Q
c -s Ride with ro N someone N .. ~ Drive self --' M" ro -s ::I Airplane ....... PJ ....... M"
0 -'• < ro -I Train -s PJ < ro Would not --'
3: make trip 0 0... ro
Other
100
90
80
70 >, u c: 60 (I) ::I er (I) s... u..
50 (I)
> ..... +> n:l
40 ....-::I E ::I u
30
20
10
0
0
85th Percentile
50 Percentile
10 20 30 40 50 60 70 80
Number of Trips·
Figure 23: Cumulative Frequency Distribution, Number of Intercity Bus Trips made by Passengers in Past Year
111
90 100
General Attitudes
The survey asked certain questions designed to identify attitudes
concerning intercity bus service and fares, and to identify those features
that were important to users in their decision to use intercity bus service.
The responses to these questions are summarized below.
Service and Fares
Questions were asked concerning satisfaction with the existing bus
service and attitudes toward the cost of the service. The response to the
question "How would you rate your satisfaction with intercity bus service
overall?" is summarized in Table 38. As indicated, the overwhelming majority
thought the existing service was satisfactory. In fact, only 5 percent of
the respondents were not pleased with the current service.
Table 38: Satisfaction With Existing Service_
Level of Satisfaction Response
Very Satisfactory 41.8
Satisfactory 47.6
Not Satisfactory 5.4
No Opinion 5.2
n = 1024
Figure 24 shows the results of the quest i ans concerning how much more
users would be willing to pay for existing service and for improved service.
Most riders surveyed indicated they would be willing to pay a little more for
both the existing service (51 percent), and for improved service (66
percent). Only a small number of persons woulp be willing to pay a lot more
for either existing or improved service.
112

..--~~~~-~~~-
I
Amount Percent
wi 11 i ng to: 0 10 20 30 40 50 60 70 80 90 100
Pay for Existing Service
Pay for Improved Service
LEGEND: Mit\~] Nothing ~ A 1 ittle more DA lot more
Figure 24: Passenger Attitudes Toward Increased Fares
113
Important and Unimportant Features of Intercity Bus Service
This study attempted to identify those features of existing intercity
bus service that were most important to the users in their decision to use
the service. In essence, an attempt was made to document those features of
intercity bus travel that should be emphasized in the planning and operation
of the service.
The survey included the following statement: "A number of different
factors are important in deciding to use intercity bus service. Please
circle the number that best explains how important the following features are
to you in deciding to use the intercity bus. 11 Following that, 15 intercity
bus features were listed; the user rated each feature on a seal e of 1 (not
important) to 5 (very important). These results are summarized in Table 39.
The most important features are safety at the bus station and on the
bus, leaving and arriving on time, and having leg room and comfortable seats
on the bus. Least important factors were the availability of alternative air
or train service and the provision of auto parking near the bus station. The
ten other factors considered in the evalution were considered to be of
intermediate importance. The difference in ratings within each of the three
groups are not statistically significant.
Comparison of Texas and Michigan Surveys
In order to ascertain whether Texas intercity bus riders or trips have
any unique characteristics, portions of the survey results were compared with
the results of a 1977 on-board survey conducted in Michigan. The results of
this comparison are discussed below.
The Texas on-board survey was compared to eight questions from the
Michigan survey. Questions concerning age, sex, occupation, vehicle
114
Table 39: Relative Importance of Various Intercity Bus Features to Users
Overall Significance Ratlngl Level 2 Feature
Safety at the bus station and on the bus 4.44
Leaving and arriving on time
Leg roan and comfortable seats
The availability and cost of gasoline
Having express bus service
Frequency of Intercity bus service
Bus fare
The speed of the bus trip
The cost of owning a car
4.38
4.32
4.13
4.09
4.05
3.98
3.92
3.90
The location of the bus station 3.87
Riding in a new modern bus 3.80
Local city bus transportation at destination 3.67
Food service at bus station 3.64
Availability of air or train service
Auto parking near bus station
3.41
3.31
Most Significant
Intermediate Significance
Least Significant
1 Each feature was rated on a sea I e of 1 (not Important) to 5 (very Important).
2To assess statistically significant differences in the responses, a Duncan's multiple range test for variable rank was performed to Identify significantly different means. The responses fel I into the three general significance levels shown in the table.
ownership, mode of arrival at the bus station, mode of departure from the bus
station, trip purpose, and the number of intercity bus trips made in the past
year were compared. An overview of the responses given to these questions is
presented in Table 40.
The survey results were compared using the Kolmogorov-Smirnov test
(Hollander and Wolfe, 1973), which is a non-parametric test for differences
between two cumulative di stri but ions. The two-sample test analyzes the
hypothesis that the two independent samp 1 es come from identical continuous
distributions. The test is sensitive to population differences with respect
115
Table 40: Overview of Personal and Travel Characteristics for Bus Passengers for Texas and Michigan
Characteristic Texas Michigan
Age Under 18 7. 7 l 6.1 18-29 42.7 46.9 30-39 15.1 11.2 40-49 9.5 9.2 50-64 15.0 15.3 65 and over 10.0 11.3
Sex Male 45.7 42.7 Fama le 54.3 57.3
Occupation Unemployed 8. 1 7.1 Hou sew I fe 17.5 13.3 Student 15.6 29.6 Retired 14.9 12.2 Craftsmen/Laborers/Operatives 13.3 10.2
Service/Sales 7.1 3.1 Clerical 4.3 4.1
Professional/Technical/Managerial 13.7 11.2 Military 5.5 N.A. Other N.A. 9.2
Mode of Arrival at Bus Station 53.52 Dropped off by someone 65.6
Drove self 2.8 Walked 9.4 19.2 Taxi 10.2 10. 1 City Bus 7.3 10.1 Other 4.7 7.1
Mode of departure from bus station 52.5 3 Picked up by someone 66.7
Drive self 1.7 Walk 10.2 15.2 Taxi 13.5 15.2 City bus 4.6 9.1 Other 3.3 8.0
Purpose of Trip Visit friend/relative 37. 7 48.5 Work 11 .5 14.4 Vacation 7.3 6.2 Visit Doctor/Dentist 4.7 N.A. Personal Business N.A. 16.5 Shopp Ing N.A. 1.0 School 3.8 N.A. Return Home 26.4 N.A. Other 8.7 13.4
Own a Car, Pick-up or Van Yes 58.3 66.7 No 41. 7 33.3
Number of times ridden an intercity bus in the past year
0- 9 81. 7 67.5 10-19 8.0 11.3 20-29 4.0 6.3 30-39 1.0 2.5 40-49 1.0 1.2 50-59 1.2 1.2 60-69 o.o o.o 70-79 o.o o.o 80-89 1. 1 o.o 90-99 2.0 o.o 100 or rrore o.o 10.0
Source: Michigan intercity Bus Study, Michigan Department of State Highways and iransporfaffon, f977.
1 Only persons aged 12 and over were surveyed. 2 Indicates persons arriving by automobl le including those dropped-off . and those driving themselves. 3 Indicates persons departing by automobile Including those picked-up and
those driving themselves.
116
......,. ______ ,_..._. __________ .._.,~-"-·· --·--- ·-- - -
to location, dispersion, or skewness. All comparisons were made to a level
of significance of a= 0.05. If the test failed, it was ruled that there was
insufficient evidence to conclude that the two samples were from identical
popul at i ans. However if the test did not fail , sufficient evidence existed
to make such a conclusion.
The results of the Kolmogorov-Smirnov test, shown in Table 41, indicate
that all but one of the comparisons are favorable. There is insufficient
evidence (a= 0.05) to conclude that the two samples are drawn from identical
populations of occupation. Thus, it appears that intercity bus passengers in
Texas and Michigan are similar in terms of age, sex, vehicle ownership, mode
of arrival to and departure from the bus station and the number of intercity
bus trips made during the past year.
Table 41: Results of Michigan Survey and Texas Survey Comparison
Comparison Samples From Samples From Identical Populations Different Populations
Age x
Sex x
Occupation x
Vehicle Ownership x
Mode of Arri va I x
Mode of Departure x
Trip Purpose x
Number of Trips x
117

IX. TEXAS INTERCITY BUS HOUSEHOLD SURVEY
A home mail-out survey was performed throughout the State. This
household survey was designed to collect socioeconomic data as well as data
on the use of, and attitudes toward, intercity bus service by residents in
Texas. In particular, the mail-out attempted to identify what additional
features would need to be incorporated into the intercity bus service to
cause people who do not use intercity bus service to choose to use the
service.
The survey instrument used for the household survey was designed to be
as similar as practical to the user survey. This was done to allow
comparisons between the responses to the two surveys. A copy of the survey
form is included in Appendix B.
The household survey used the same regional stratification (See Figure
13) that was used in the user survey. It was also desired to assure adequate
representation from rural areas. Since the list of households to be used
could not readily be segmented within county, it was decided to cl ass ify
counties based on the size of the largest SMSA in the county. High
population density counties were those with SMSA's of 1,000,000 or more
persons. Medium density counties were those with SMSA's of less than
1,000,000. Low density counties were those that did not have an SMSA.
The data base selected for obtaining household addresses was the
Metromail computerized list of addresses based on all the telephone
directories in Texas. The list has 3.6 million households and is readily
segmented by a computer. Although the list did not have households without
telephones, the bias was not considered important in this survey. Those
119
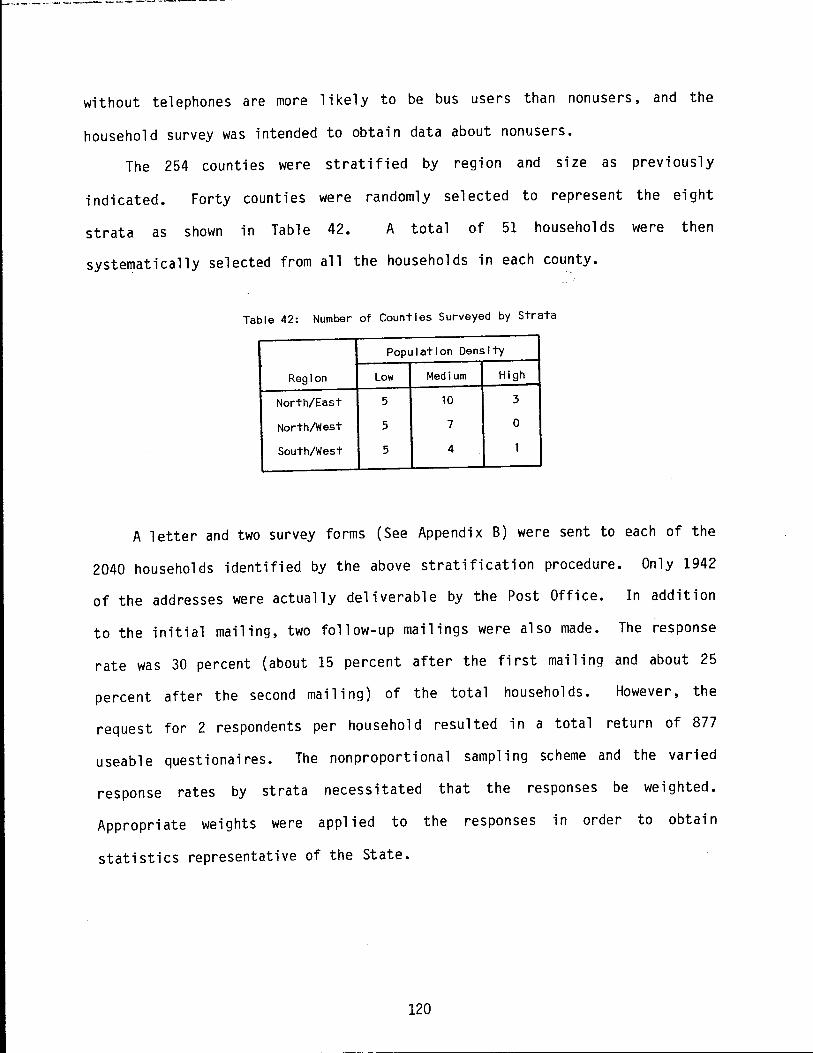
.... ----·-----------__......._. ____ ~--
without telephones are more likely to be bus users than nonusers, and the
household survey was intended to obtain data about nonusers.
The 254 counties were stratified by region and size as previously
indicated. Forty counties were randomly selected to represent the eight
strata as shown in Table 42. A total of 51 households were then
systematically selected from all the households in each county.
Table 42: Number of Counties Surveyed by Strata
Population Density
Region Low Medi um High
North/East 5 10 3
North/West 5 7 0
South/West 5 4 1
A letter and two survey forms {See Appendix B) were sent to each of the
2040 households identified by the above stratification procedure. Only 1942
of the addresses were actually deliverable by the Post Office. In addition
to the initial mailing, two follow-up mailings were also made. The response
rate was 30 percent (about 15 percent after the first mailing and about 25
percent after the second mailing) of the total households. However, the
request for 2 respondents per household resulted in a total return of 877
useable questionaires. The nonproportional sampling scheme and the varied
response rates by strata necessitated that the responses be weighted.
Appropriate weights were applied to the responses in order to obtain
statistics representative of the State.
120
Personal Characteristics
Participants in the household survey were asked various questions
concerning age, sex, education, occupation, household income and vehicle
ownership. The responses to these questions are summarized in this section.
Age, Sex, and Education
Figure 25 shows the cumulative frequency distribution for the age of
household respondents. Thirty percent were under 37 years of age and 23
percent were over age 65. The average age of household respondents was 48,
slightly higher than the average age for the Texas population, 41 years of
age.
Figure 26 shows the breakdown of household respondents by sex. As
indicated, approximately 52 percent were male and 48 percent were female.
The question, 11 What is the highest grade of school compl eted? 11 was
asked. The response to this question is summarized in Figure 27. As shown,
33 percent of the respondents had completed high school and some 30 percent
had completed college.
Occupation
Respondents were asked to identify their current occupation. The
responses to this question were grouped into 13 categories and the results
are illustrated in Figure 28.
Three categories, retired persons, professional and technical employees
and housewives, are predominant, accounting for 22 percent, 18 percent and 15
percent of the responses, respectively. There were only a small number of
121
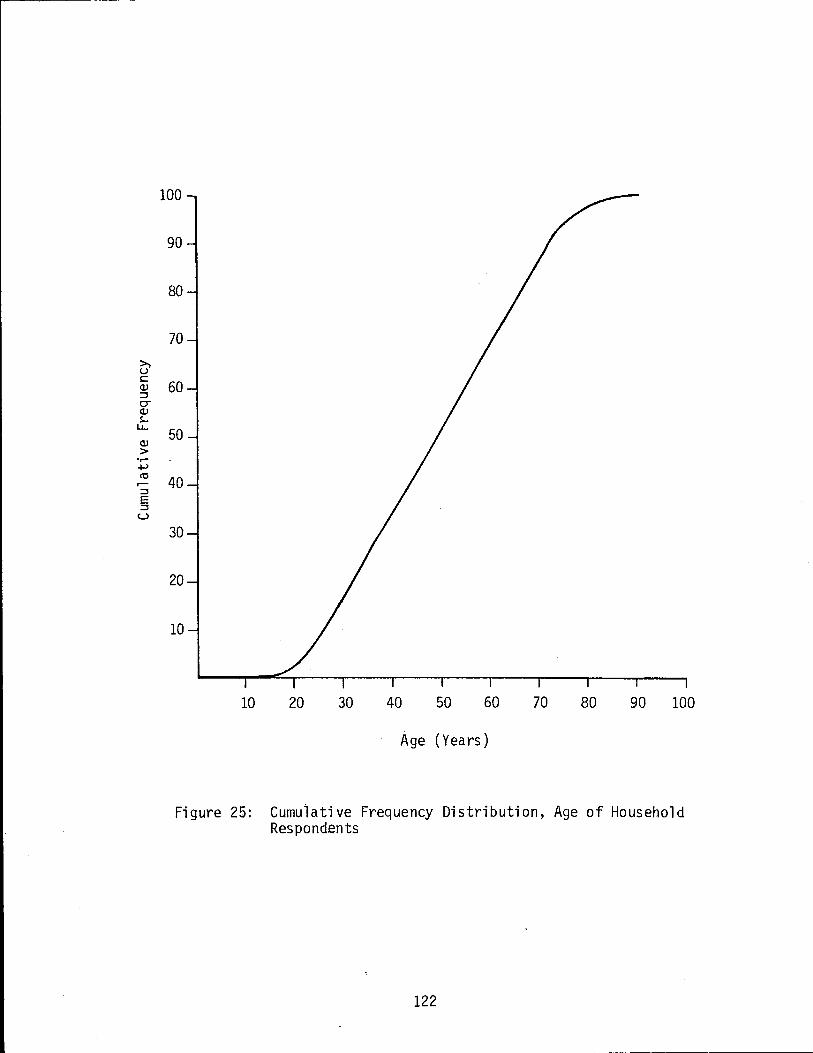
ij> s:: Q) :::J O'" Q) ~ u. Q)
> •r-.µ tO
.--:::J E :::J u
100
90
80
70
60
50
40
30
20
10
10 20 30 40 50 60 70 80 90 100
· Age (Years)
Figure 25: Cumulative Frequency Distribution, Age of Household Respondents
122
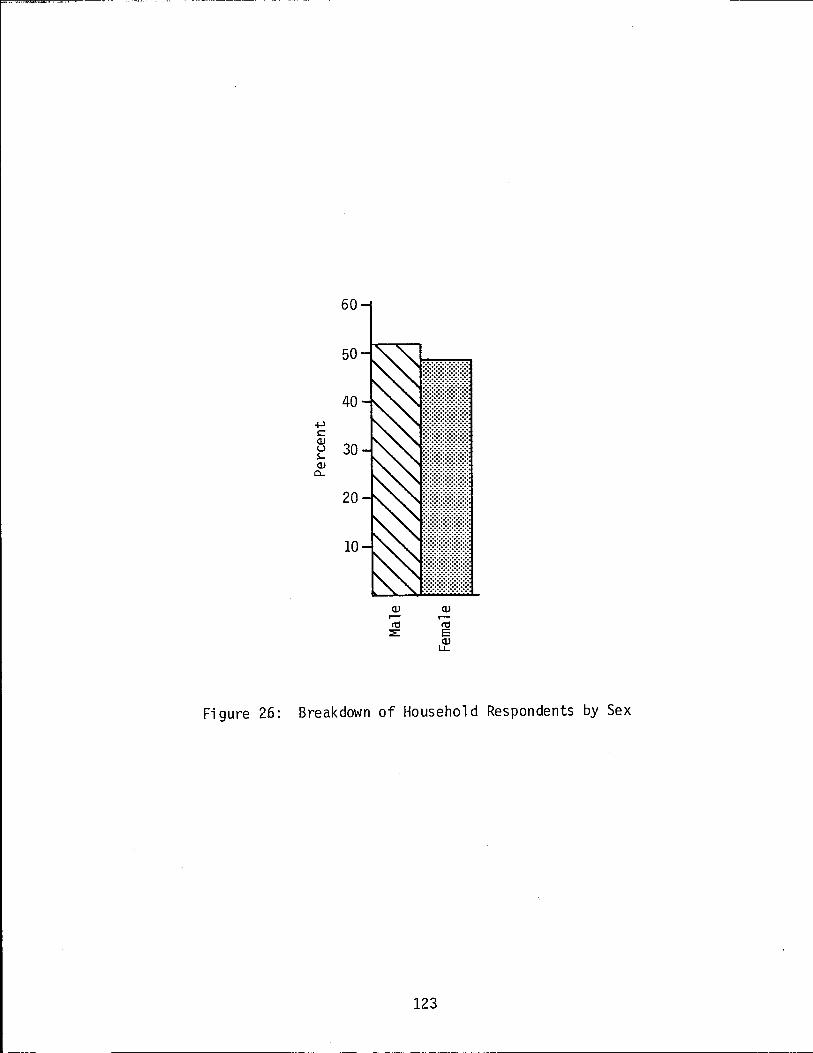
+> t:
60
50
40
~ 30 S-OJ
0..
20
10
OJ OJ r-- r--rtS rtS
::E E ~
Figure 26: Breakdown of Household Respondents by Sex
123
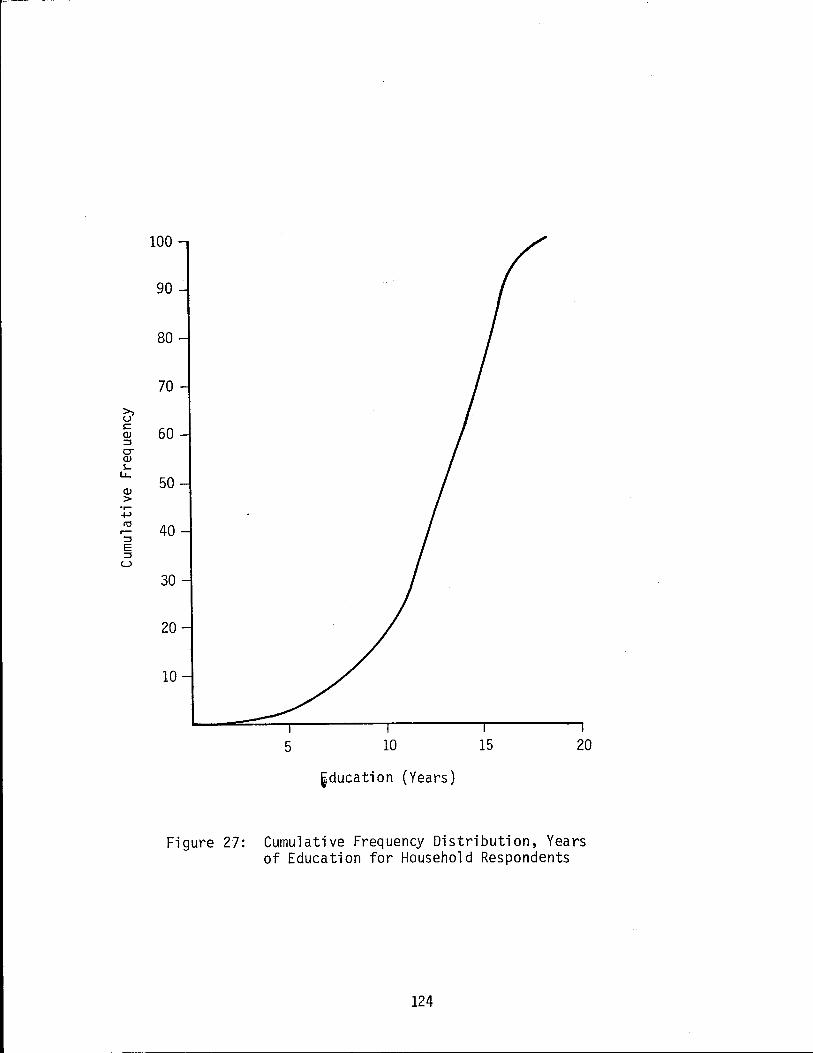
~ c Q) ::s O"' Q) s....
LL..
Q)
> •r-+-' ro ..-::s E ::s u
100
90
80
70
60
50
40
30
20
10
5 10 15 20
iducation (Years)
Figure 27: Cumulative Frequency Distribution, Years of Education for Household Respondents
124
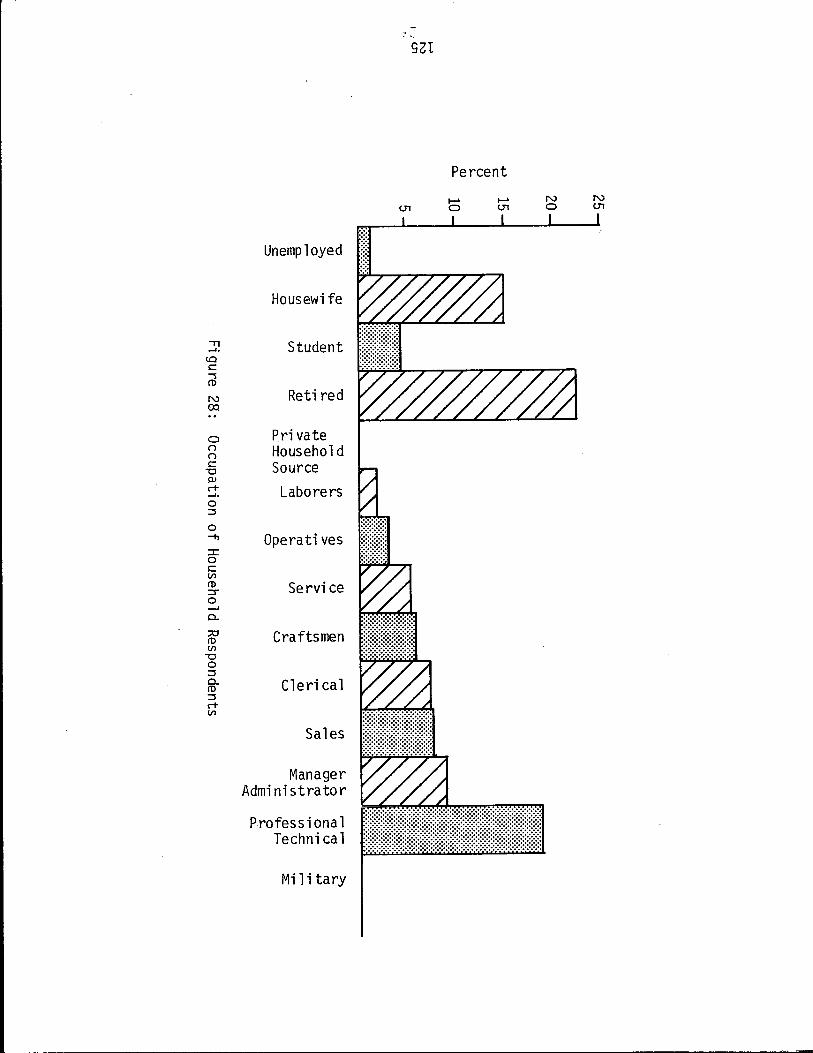
SZI
Percent
........ ...... N N (J1 0 (J1 0 (J1
I
kl Unemployed
Housewife
"'Tl Student --'· <.O c: -s Cl>
N Retired 00 .. 0 Private (') Household (') c: Source '"Cl Q> c-t- Laborers --'• 0 ~
0 -fl Operatives :c 0 c: VI Cl> Service :::r 0 __, 0..
:::u Craftsmen Cl> VI
'"Cl 0 ~ 0.. Clerical Cl> ~ c-t-VI
Sales
Manager Administrator
Professional Technical
Military
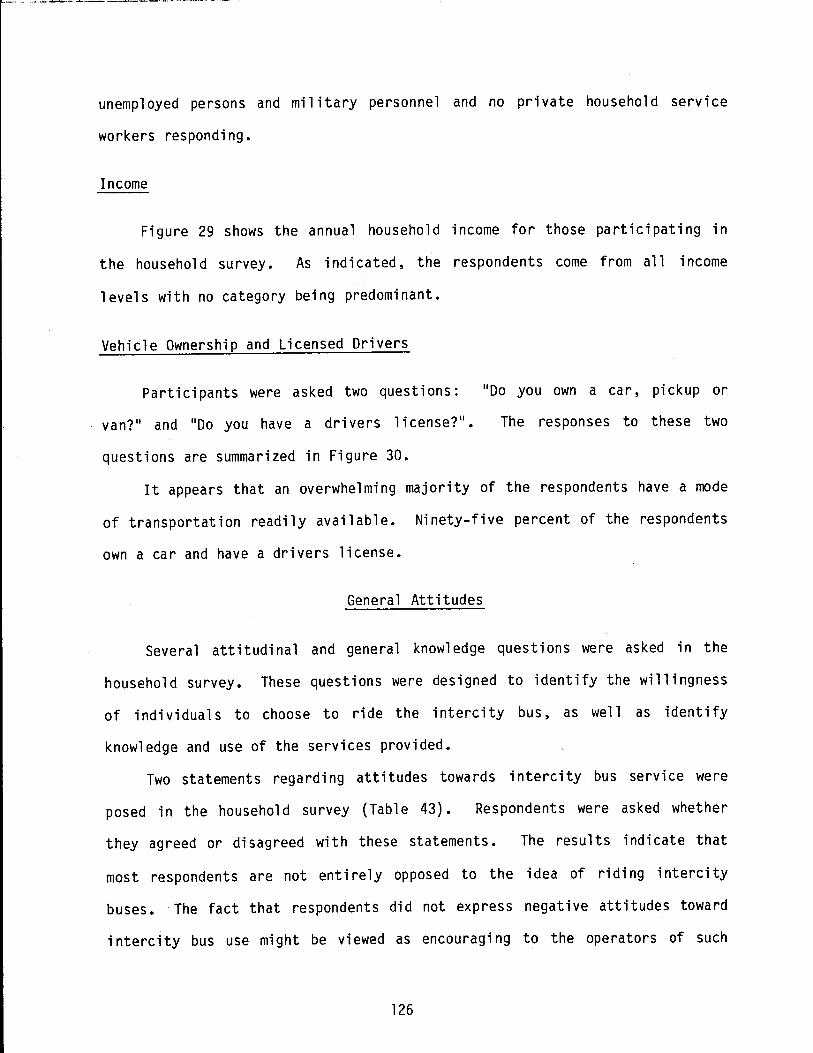
unemployed persons and military personnel and no private household service
workers responding.
Income
Figure 29 shows the annual household income for those participating in
the household survey. As indicated, the respondents come from all income
levels with no category being predominant.
Vehicle Ownership and Licensed Drivers
Participants were asked two questions:
van? 11 and 11 Do you have a drivers l i cense? 11•
questions are summarized in Figure 30.
11 Do you own a car, pickup or
The responses to these two
It appears that an overwhelming majority of the respondents have a mode
of transportation readily available. Ninety-five percent of the respondents
own a car and have a drivers license.
General Attitudes
Several attitudinal and general knowledge questions were asked in the
household survey. These questions were designed to identify the willingness
of individuals to choose to ride the intercity bus, as well as identify
knowledge and use of the services provided.
Two statements regarding attitudes towards intercity bus service were
posed in the household survey (Table 43). Respondents were asked whether
they agreed or disagreed with these statements. The results indicate that
most respondents are not entirely opposed to the idea of riding intercity
buses. The fact that respondents did not express negative attitudes toward
intercity bus use might be viewed as encouraging to the operators of such
126
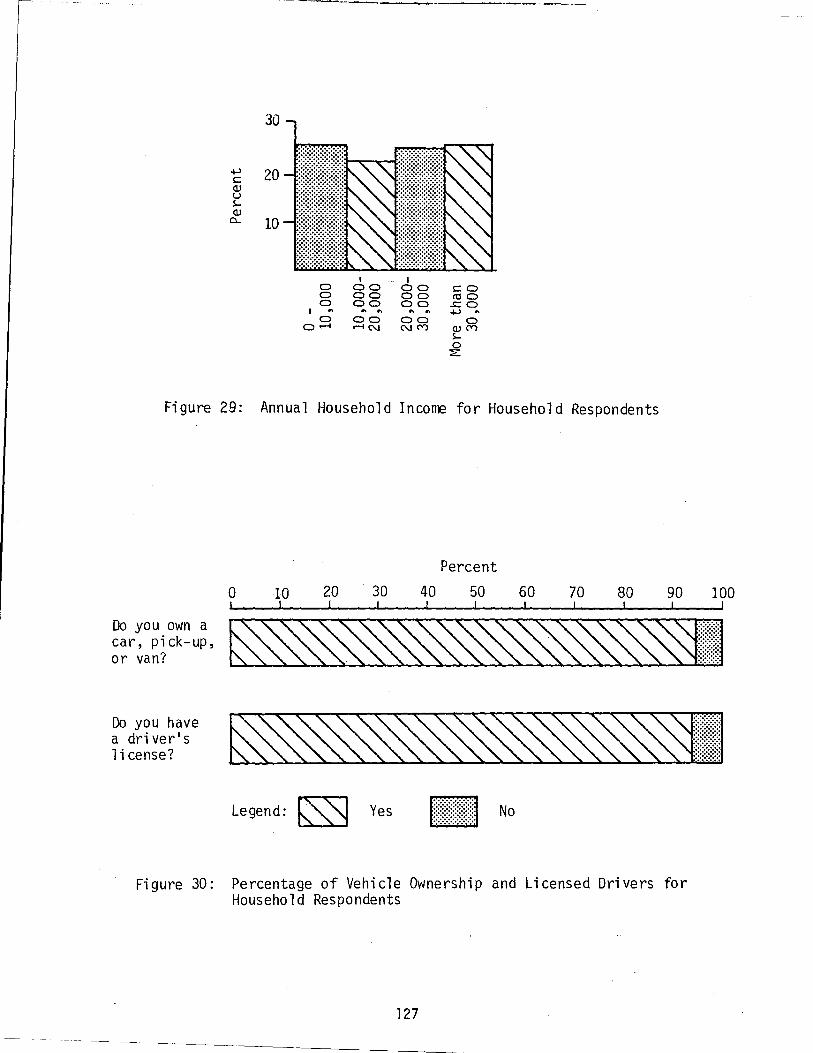
--------·-------..... --------------~-
.µ s:: (!) u Seu
Q...
30
20
10
0 0 0
I "' 0
0....-1
I 00 00 00 .... 00 r-IN
I 00 00 00
00 NM
-~------
s:: 0 coo
..c: 0
.µ .. 0
(!)CV) s-o :a:
Figure 29: Annual Household Incorre for Household Respondents
Percent
0 10 20 30 40 50 60 70 80
Legend: ~ Yes [!j~~f~j!{] No
90
Figure 30: Percentage of Vehicle Ownership and Licensed Drivers for Household Respondents
127
100
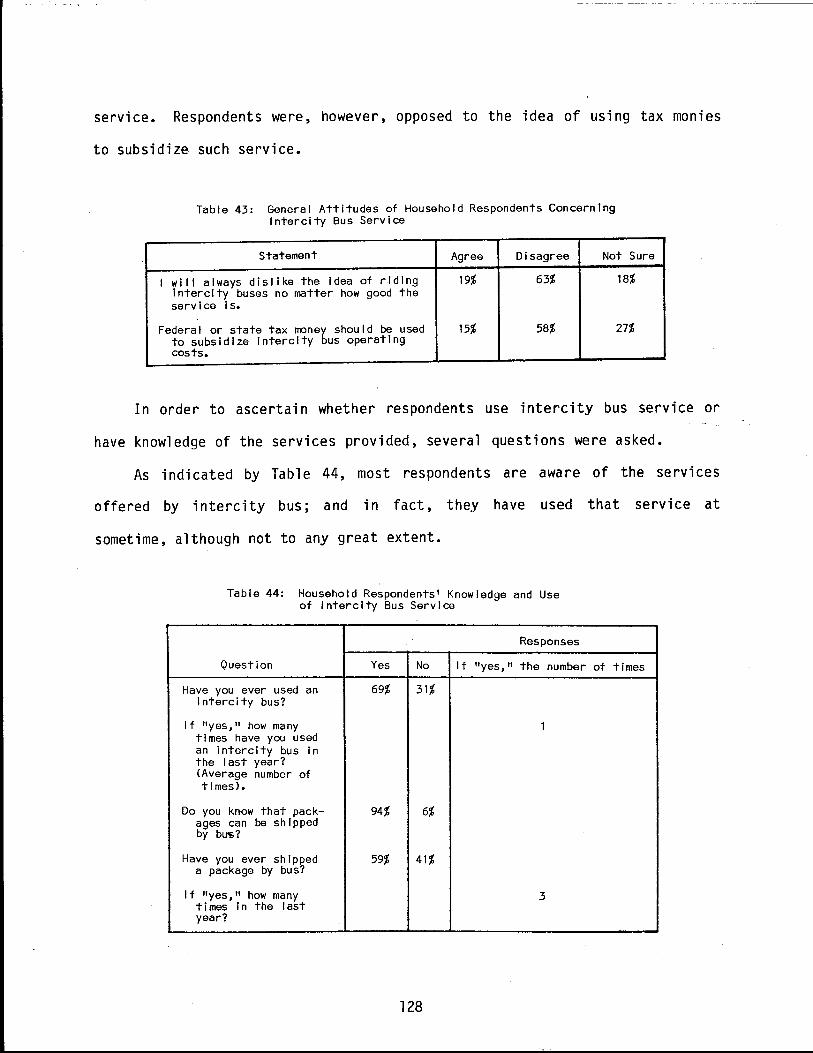
service. Respondents were, however, opposed to the idea of using tax monies
to subsidize such service.
Table 43: General Attitudes of Household Respondents Concerning Intercity Bus Service
Statement Agree Disagree Not Sure
I will always dislike the Idea of riding 19% 63% 18% Intercity buses no matter how good the service is.
Federal or state tax moneb should be used 15% 58% 27% to subsidize intercity us operating costs.
In order to ascertain whether respondents use intercity bus service or
have knowledge of the services provided, several questions were asked.
As indicated by Table 44, most respondents are aware of the services
offered by intercity bus; and in fact, they have used that service at
sometime, although not to any great extent.
Table 44: Household Respondents' Knowledge and Use of Intercity Bus Service
Responses
Question Yes No If "yes," the number
Have you ever used an 69% 31% intercity bus?
If "yes," how many 1 times have you used an intercity bus in the last year? (Average number of times).
Do you know that pack- 94% 6% ages can be shipped by bU'S?
Have you ever shipped a package by bus?
59% 41%
If "yes," how many times In the last
3
year?
128
of times
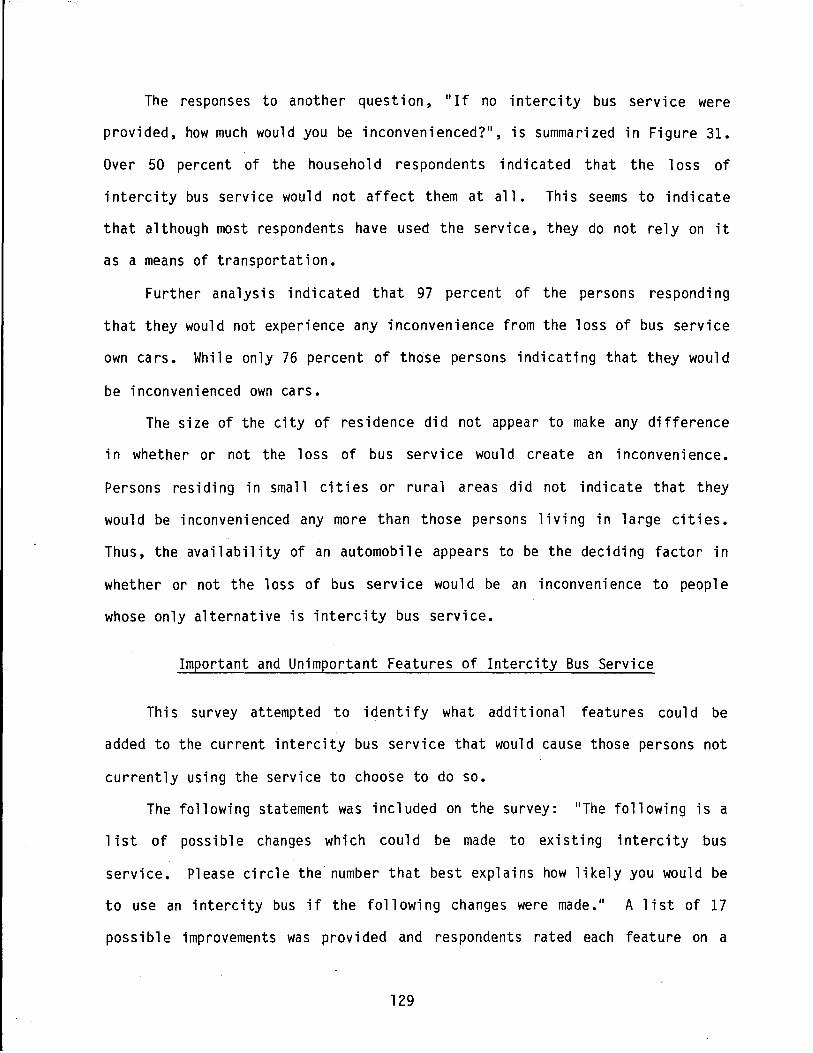
The responses to another question, "If no intercity bus service were
provided, how much would you be inconvenienced? 11, is summarized in Figure 31.
Over 50 percent of the household respondents indicated that the loss of
intercity bus service would not affect them at al 1. This seems to indicate
that although most respondents have used the service, they do not rely on it
as a means of transportation.
Further analysis indicated that 97 percent of the persons responding
that they would not experience any inconvenience from the loss of bus service
own cars. While only 76 percent of those persons indicating that they would
be inconvenienced own cars.
The size of the city of residence did not appear to make any difference
in whether or not the loss of bus service would create an inconvenience.
Persons residing in small cities or rural areas did not indicate that they
would be inconvenienced any more than those persons living in large cities.
Thus, the availability of an automobile appears to be the deciding factor in
whether or not the loss of bus service would be an inconvenience to people
whose only alternative is intercity bus service.
Important and Unimportant Features of Intercity Bus Service
This survey attempted to identify what additional features could be
added to the current intercity bus service that would cause those persons not
currently using the service to choose to do so.
The fo 11 owing statement was inc 1 uded on the survey: 11 The fo 11 owing is a
list of possible changes which could be made to existing intercity bus
service. Please circle the number that best explains how likely you would be
to use an intercity bus if the following changes were made. 11 A list of 17
possible improvements was provided and respondents rated each feature on a
129
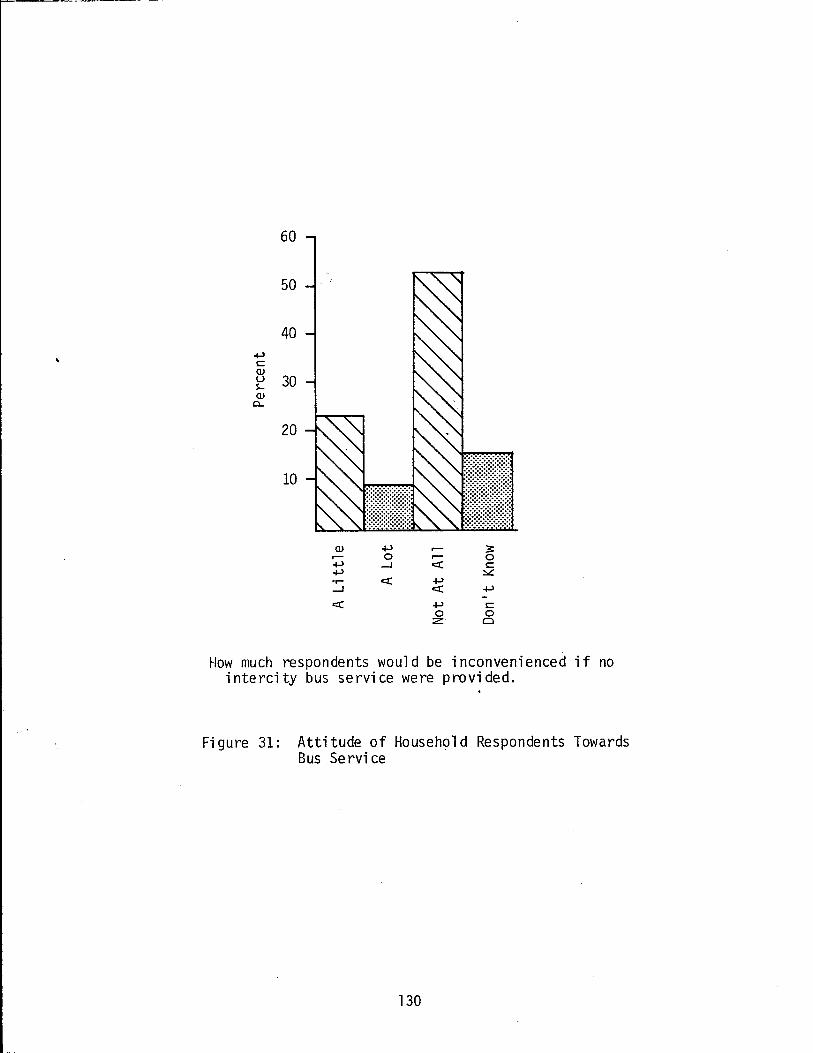
.µ s:: aJ
60
50
40
~ 30 aJ
a...
20
10
•r-.....J
c:i::
.µ 0
.....J
c:i::
rr-c:i:: .µ c:i:: .µ 0 :z:
3: 0 s::
::::..:: .µ
s:: 0 Cl
How much respondents would be inconvenienced if no intercity bus service were provided.
Figure 31: Attitude of Household Respondents Towards Bus Service
130
scale of 1 (not important) to 5 (very important). These results are
summarized in Table 45.
In examining Table 45, it is helpful to compare the results shown in
Table 39 (see p. 115). Two things are apparent when examining the household
responses. The rating are relatively low. None of the ratings are
significantly above 3.0 which could be considered a neutral or indifference
point. In fact, most of the responses were rated below. 3.0.
It should also be noted in examining Table 45, that the two lowest rated
items (purchasing tickets from travel agents and sitting next to strangers)
did receive ratings that were significantly below the other responses. The
order of the other 15 responses is not statistically significant.
Households Segmented Into Users and Non-Users
As pre vi ousl y discussed, household respondents were asked a question
concerning their use of intercity bus service. The response indicated that
69 percent of the respondents have ridden an intercity bus although only 29
percent of these participants have ridden an intercity bus during the past
year. This proportion of users was higher than expected. It was, therefore,
desirable to determine what effect the two population segments had on the
survey results. Based on these responses, household participants were
classified into bus groups; users and non-users. Users are those persons who
have ridden an intercity bus during the past year, and non-users are those
persons who have either never ridden an intercity bus or have not done so
within the past year.
An analysis of these two groups was performed in order to determine if
there were any notable differences between them. The results of this
analysis follow.
131
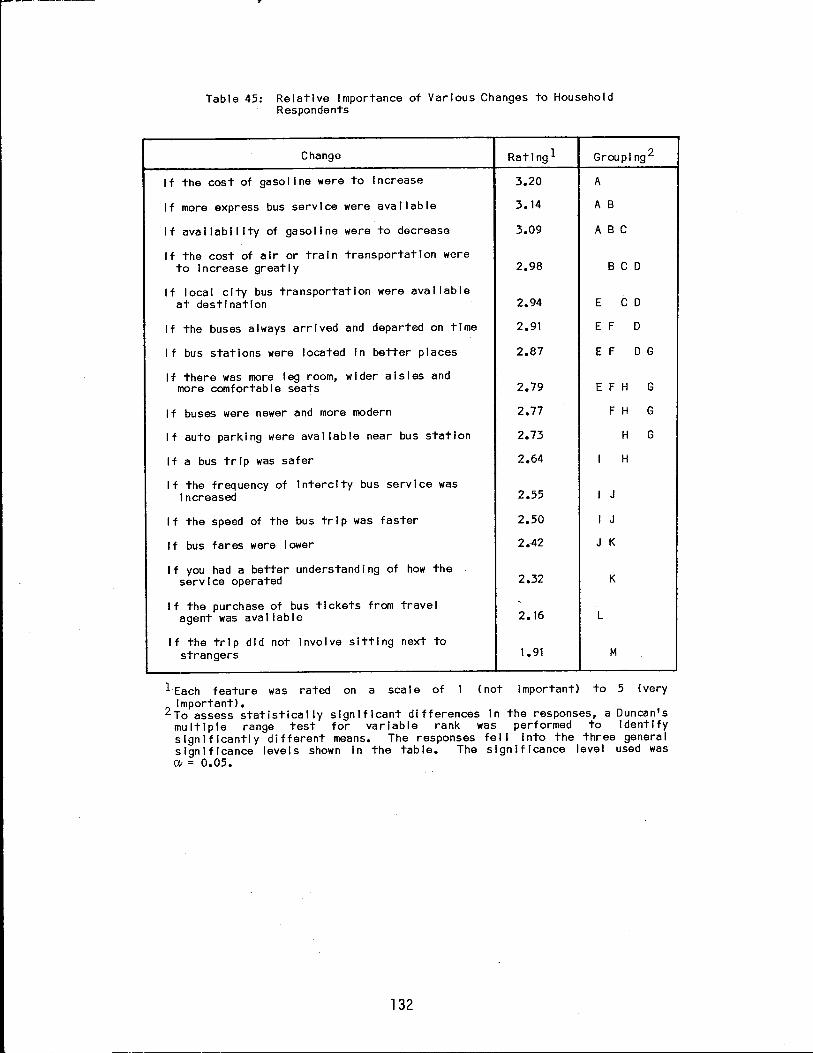
Table 45: Relative Importance of Various Changes to Household Respondents
Change
If the cost of gasoline were to increase
If more express bus service were available
If availability of gasoline were to decrease
If the cost of air or train transportation were to increase greatly
If local city bus transportation were available at destination
If the buses always arrived and departed on time
If bus stations were located In better places
If there was more leg room, wider aisles and more comfortable seats
If buses were newer and more modern
If auto parking were available near bus station
If a bus trip was safer
If the frequency of Intercity bus service was Increased
If the speed of the bus trip was faster
If bus fares were lower
If you had a better understanding of how the service operated
If the purchase of bus tickets from travel agent was available
If the trip did not involve sitting next to strangers
Rating 1
3.20
3.14
3.09
2.98
2.94
2.91
2.87
2.79
2.77
2. 73
2.64
2.55
2.50
2.42
2.32
2.16
1.91
Group I ng 2
A
A B
A B C
B C D
E C D
E F D
E F D G
E F H G
F H G
H G
I J
I J
J K
K
L
M
H
I.Each feature was rated on a scale of (not important) to 5 (very Important).
2To assess statistically significant differences In the.responses, a Duncan's multiple range test for variable rank was performed to identify significantly different means. The responses tel I into the three general significance I eve Is shown in the tab le. The s I gn if I cance level used was
CV = 0.05.
132
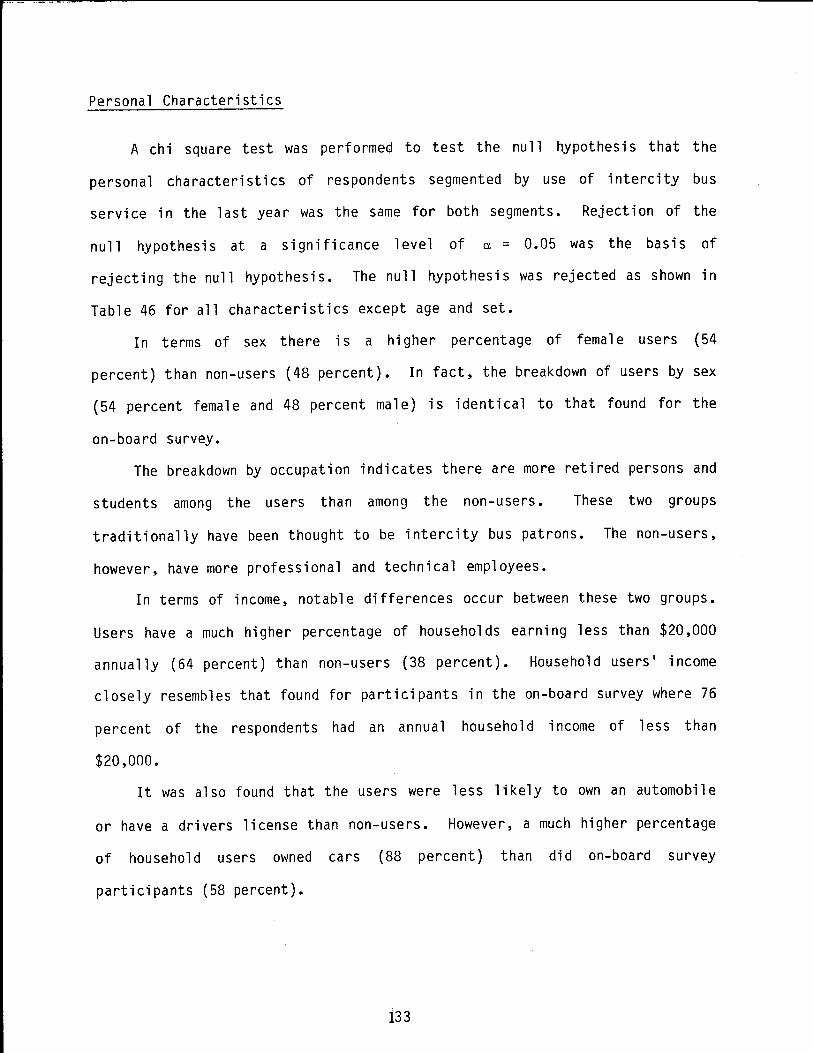
Personal Characteristics
A chi square test was performed to test the null hypothesis that the
personal characteristics of respondents segmented by use of intercity bus
service in the last year was the same for both segments. Rejection of the
null hypothesis at a significance level of a. = 0.05 was the basis of
rejecting the null hypothesis. The null hypothesis was rejected as shown in
Table 46 for all characteristics except age and set.
In terms of sex there is a higher percentage of female users (54
percent) than non-users (48 percent). In fact, the breakdown of users by sex
(54 percent female and 48 percent male) is identical to that found for the
on-board survey.
The breakdown by occupation indicates there are more retired persons and
students among the users than among the non-users. These two groups
traditionally have been thought to be intercity bus patrons. The non-users,
however, have more professional and technical employees.
In terms of income, notable differences occur between these two groups.
Users have a much higher percentage of households earning less than $20,000
annually ( 64 percent) than non-users (38 percent). Household users' income
closely resembles that found for participants in the on-board survey where 76
percent of the respondents had an annual household income of less than
$20,000.
It was also found that the users were less likely to own an automobile
or have a drivers license than non-users. However, a much higher percentage
of household users owned cars (88 percent) than did on-board survey
participants (58 percent).
i33
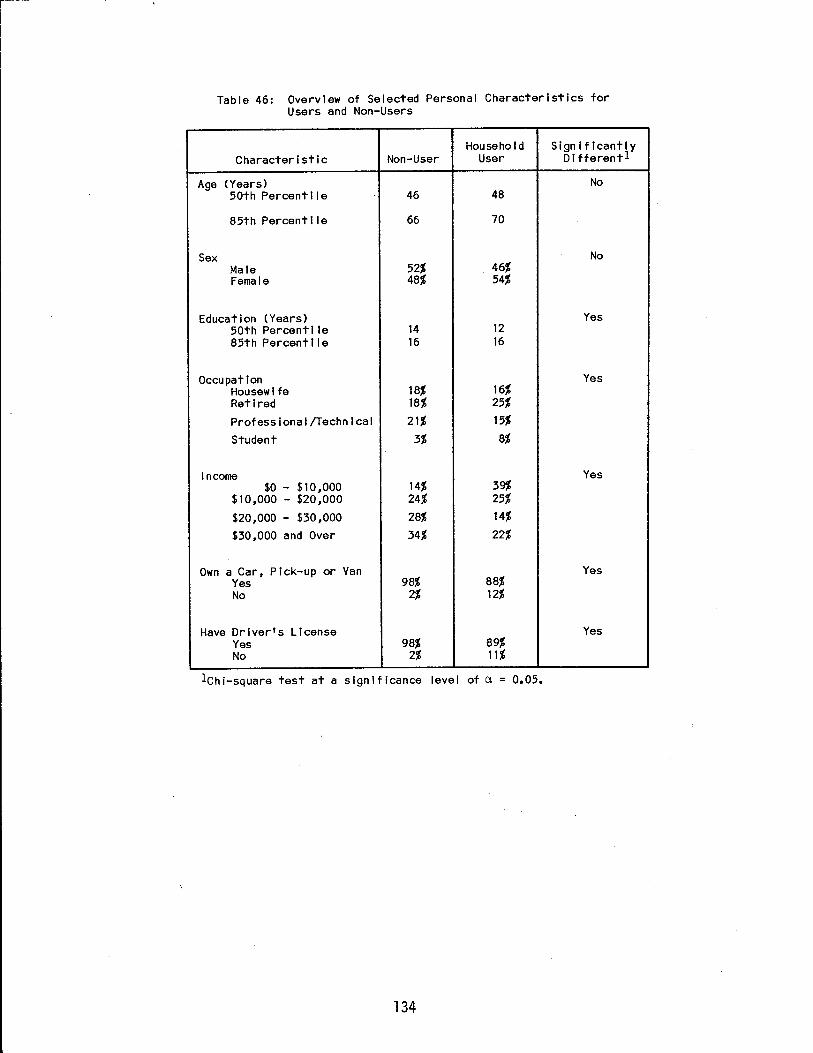
Table 46: Overview of Selected Personal Characteristics for Users and Non-Users
Household Significantly Characteristic Non-User User DI fferentl
Age (Years) No 50th Percent 11 e 46 48
85th Percent I le 66 70
Sex No Male 52% 46% Female 48% 54%
Education (Years) Yes 50th Percent I I e 14 12 85th Percent 11 e 16 16
Occupation Yes Housewife 18% 16% Retired 18% 25%
Professional/Technical 21% 15%
Student 3% 8%
Income Yes $0 - $10,000 14% 39%
$10,000 - $20,000 24% 25%
$20,000 - $30,000 28% 14%
$30,000 and Over 34% 22%
Own a Car, Pick-up or Van Yes Yes 98% 88% No 2% 12%
Have Driver's License Yes Yes 98% 89% No 2% 11%
!chi-square test at a significance level of a 0.05.
134
General Attitudes
There were significant differences, based on a chi square test, between
users and non-users in their response to the general attitude questions as
shown in Table 47. A higher percentage of non-users indicated that they
always disliked riding intercity buses. Both groups agreed that tax monies
should not be used to subsidize intercity bus service, with more non-users
than users against such subsidies.
Table 47: General Attitudes of Household Users and Non-Users Concerning Intercity Bus Ser~lce
Statement Response Non-Users Users
I wll I always dislike the Idea of Agree 20% 10% riding Intercity buses no matter Disagree 63% 82% how good the service is. Not Sure 17% 8%
Federal or State tax money should Agree 12% 26% be used to subsidize intercity Disagree 64% 46% bus operating costs. Not Sure 24% 28%
1Chi-square test at a significance level of a = 0.05.
Significantly Different!
Yes
Yes
The response of users and non-users to the question of whether
respondents would be inconvenienced by the loss of intercity bus service is
given in Table 48. As shown, significantly more persons in the user group
than in the non-user group indicated they would be inconvenienced by the loss
of service. Further analysis (See Table 49) showed that those persons in
both groups, user and non-user, who indicated they woul ~ be inconvenienced
a lot were less likely to own a car than those who indicated they would
experience no inconvenience. Thus, the lack of a readily available alternate
mode of transportation (i.e., an auto) appears to be a major difference in
whether or not the loss of bus service would affect respondents.
135
-~~-- ... .-.----·- - _...----- ·-
If
Tab: -!c 48: User and Non-User Attitude Towards Loss of I nterclty Bus Service
Response User Non-User
no 1 ntercity bus service A I lttle 36% 22% wiere prov I dee • ho"' much A lot 25% - 4% WIOU l d yoo be ; nconven I enced. Not at al I 23% 60%
Do not know 16% 14%
lchl square tert at a significance level of a= 0.05.
Table 49: User and Non-User Attitude Towards Loss of Intercity Bus Service by Car Ownership
Own a Would not be Wou Id be
Group Car I nconven I enced Inconvenienced a Lot
Users Yes 92% 68%
No 8% 32%
Non-Users Yes 98% 86%
No 2% 14%
Households Segmented by Income
Significantly DI f ferent 1
Yes
The research design also included the plan to evaluate possible
relationships between income and ridership. It was desired to evaluate the
proposition that use of intercity bus service declines with income. That is
to say, as an individual's income increases, use of intercity bus service
decreases.
The apprc=.ch taken in this study to examine income relationships is a
cross sec:iona- analysis of intercity bus ridership versus income. This type
of an=lysis is ;JOtentially subject to bias. For example, low income riders
co..;ld hc:•e 2 cultural preference for riding intercity buses. If that
prefe-enc: di.:. exist, it would not be possible to draw any conclusions
136
concerning the effect of income on ridership.
been identified that would suggest that a
inappropriate.
However, no bias problems have
cross sectional analysis is
A chi square test was perf armed using the four income cl asses used in
the survey and four ridership categories. The ridership categories were O,
1, 2, and 3 or more times in the last year. Ridership levels were
significantly different at a significance level of a = 0.05.
In order to examine the relationship further, the mean number of times
that intercity bus service was used in the last year was calculated for the
four income classes. The resulting means were 1.86, 0.85, 0.30, 0.70 in
order of increasing income.
The preceding analysis suggests that income is an important determinant
of intercity bus ridership. A similar analysis of the statement "I will
always ·dislike the idea of riding intercity buses no matter how good the
service is, 11 indicated that higher income individuals have a greater dislike
for intercity bus service. This is also consistent with the thesis that
income is an important determinant of who will ride intercity buses.
137

X. OTHER CONSIDERATIONS
The study scope included an evauation of the package express business
and the secondary effects of service discontinuance. This section of the
report will discuss these two issues.
Package Express
From the outset of the study there was little interest by operators in
examining package express service. The consensus was that package express
business was 11 doing alright. 11 Visual observation of terminals throughout the
State confirmed that package express was a significant part of the intercity
bus business. In some small terminals, it was obvious that package express
was more significant than passenger business.
Despite the lack of concern, survey forms (See Appendix C) were
distributed at some terminals during the course of the onboard surveys. Two
problems led to the eventual discontinuance of the survey. The survey could
not be distributed in any random or systematic way. Distribution relied on
the cooperation of the local station agent. More important, however, the
response rate from the surveys was so poor that even if they had been
properly distributed, there was insufficient data to draw meaningful
conclusions. The survey was subsequently abandoned.
Other approaches to examining package express business were also
fruitless. The financial data at the railroad commission was too incomplete
for meaningful analysis. The only useful data came from the household
survey.
The household survey included three questions concerning package
express. The first question asked ~Do you know that packages can be shipped
139
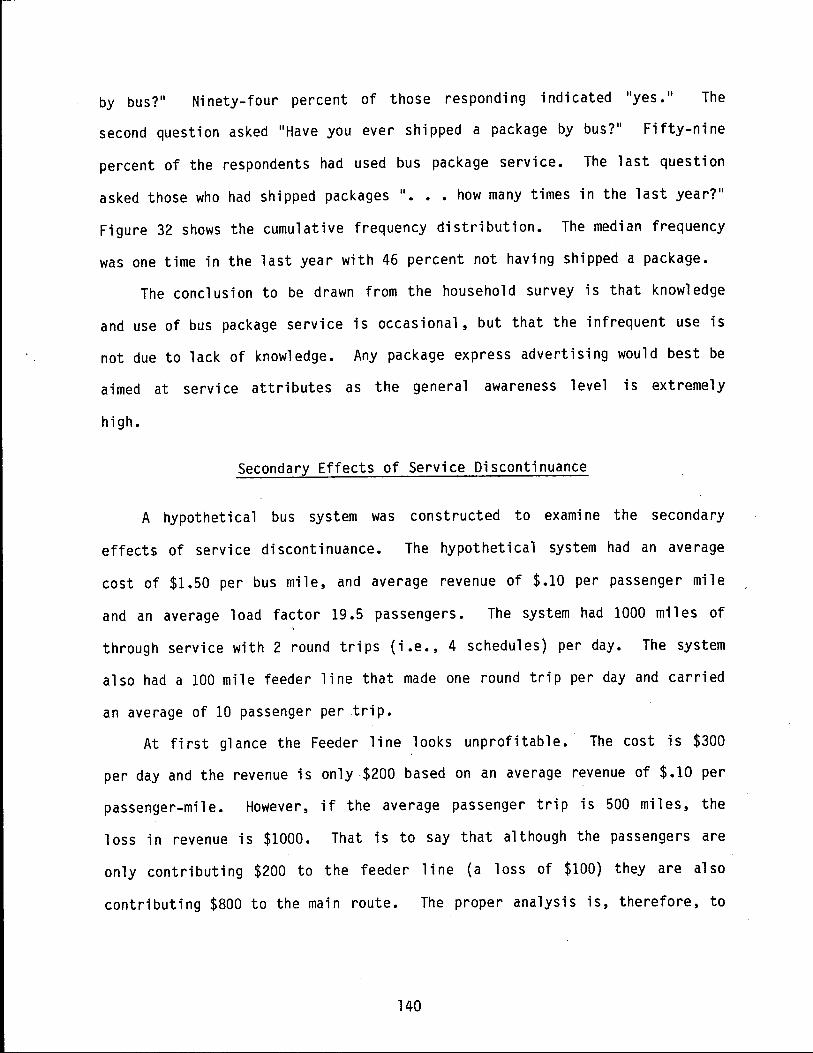
by bus?" Ninety-four percent of those responding indicated "yes. 11 The
second question asked "Have you ever shipped a package by bus?" Fifty-nine
percent of the respondents had used bus package service. The last question
asked those who had shipped packages 11 ••• how many times in the last year?"
Figure 32 shows the cumulative frequency distribution. The median frequency
was one time in the last year with 46 percent not having shipped a package.
The conclusion to be drawn from the household survey is that knowledge
and use of bus package service is occasional, but that the infrequent use is
not due to lack of knowledge. Any package express advertising would best be
aimed at service attributes as the general awareness level is extremely
high.
Secondary Effects of Service Discontinuance
A hypothetical bus system was constructed to examine the secondary
effects of service discontinuance. The hypothetical system had an average
cost of $1.50 per bus mile, and average revenue of $.10 per passenger mile
and an average load factor 19 .5 passengers. The system had 1000 mil es of
through service with 2 round trips (i.e., 4 schedules) per day. The system
also had a 100 mile feeder line that made one round trip per day and carried
an average of 10 passenger per trip.
At first glance the Feeder line looks unprofitable. The cost is $300
per day and the revenue is only ,$200 based on an average revenue of $.10 per
passenger-mile. However, if the average passenger trip is 500 miles, the
loss in revenue is $1000. That is to say that although the passengers are
only contributing $200 to the feeder line (a loss of $100} they are also
contributing $800 to the main route. The proper analysis is, therefore, to
140
100
80
>, u s::: 60 <lJ ::::! O"' <lJ s....
l.l..
Q)
> .,.... .µ
~ 4L) ::::! E ::::! u
20
0
- - - - - - - - -·- - - - - --85th Percentile
---------------50th Percentile
0 20 40 60 80 l 00 Number of Times in the Last Year
Figure 32: Cumulative Frequency Distribution, Number of Times Intercity Bus Service Was Used to Ship Packages in the Past Year
.HU
compare the marginal cost of the feeder line with the total revenue generated
by the passengers.
The principal flaw in the above analysis is that it applies only to a
single company. If, as is often the case, the feeder line is an independent
operator, he would only obtain a prorata share of the revenue. He would not
be able to survive unless he could reduce his cost.
Another potential problem with the preceding analysis is that the
average trip length for feeder routes is shorter than 500 miles. The data
collected suggests that feeder routes may have a 300 mile average trip
length. Assuming a 300 mile trip length for the feeder routes reduces the
total revenue to $600. This is still more than the $200 cost of the
hypothetical feeder route.
The preceding analysis suggests some interesting possibilities. One
possibility is that a large company could afford to pick up a marginal feeder
route if the total revenue exceeded the marginal increase in cost. Another
possibility is that the through route carrier could afford to subsidize the
feeder line carrier to some extent. This could be done by giving him a
larger than proportionate share of the revenue for selling the ticket. This
practice is used in the airline industry with joint fares.
The preceding analysis, while simplistic, does illustrate the point that
secondary effects of service discontinuance on marginal routes can be
significan~. It is, however, only necessary to include all the costs and all
the revenues resulting from a service discontinuance to properly evaluate the
situation.
142
XI. SUMMARY AND CONCLUSIONS
The intercity bus industry grew rapidly during its early existence. It
is apparent that state and federa 1 regulation has had a strong influence on
the structure of the industry and helped foster two dominant national
carriers, Greyhound and Trail ways, which account for more than 60 percent of
industry revenues.
Within the industry, charter and package express have become
increasingly important sources of revenue, whi 1 e regular route profits have
been de cl i ni ng. Although the financial performance of the intercity bus
industry indicates that it may be a declining industry, recent trends have
been encouraging. Furthermore, the Texas industry has been doing
significantly better than the national industry as a whole.
The hi story and development of the Texas intercity bus industry was
reviewed using the limited data available. The growth trends appeared to be
similar to the U. S. as a whole, although the Texas industry appears to be
somewhat healthier. Despite its somewhat healthier state, the Texas industry
appears to have matured in that ridership levels are stable.
Two surveys were conducted to advance the knowledge concerning intercity
bus riders and attitudes of residents towards intercity bus service. The
most notable finding concerning intercity bus riders is that the average trip
length is nearly 500 miles. This is significantly longer than generally
reported elsewhere. The difference appears to be due to the way ridership
data are reported by individual companies.
The most important implications of the study findings relate to the
issue of deregulation. It appears unlikely that deregulation will solve the
143
basic problems of what appears to be a mature industry. Deregulation
is likely to improve the economic efficiency of intercity bus service
by eliminating the current protection afforded existing operators. However,
given the current concern with public expenditures, it is likely that
a limited number of truly needy individuals will be without transportation
under deregulation. Whether results of deregulation is or is not an improve
ment is not strictly a technical question.
Two recommendations are appropriate based on the results of this
research. Major long haul carriers should provide favorable treatment
to small carriers providing interline traffic. Given the relatively long
trip 1 ength, it wou 1 d be in the major carriers' best interest to preserve
feeder routes, even to the extent of providing a bonus for originating
passengers.
Assuming that intercity bus service usage is re 1 ated to income, two
marketing strategies could be considered. One strategy would promote
the low cost of intercity bus service to the low income market that comprises
the majority of current passengers. However, given the captive nature
of that market, an alternative approach appears warranted.
The recommended approach is to target trying to shift attitudes of
non-users. The marketing approach should emphasis service features 1 i kely
to be important to non-users. For example, a marketing program might
emphasize express service between two major cities of modest distance.
Emphasis would be on speed and convenience as well as the cost.
144
REFERENCES
American Automobile Association. "Your Ori vi ng Costs. 11 1980 ed., Falls Church, Virginia, 1980.
American Bus Association. America 1 s Most Fue 1 Efficient Passenger Transportation Service. Washington, D.C., 1980.
American Bus Association. America's Number 1 Passenger Transportation Service. Washington, D.C., 1978.
Bureau of the Census. 1977 Census of Transportation: Nati ona 1 Tr ave 1 Survey. U.S. Department of Commerce: Washington, D.C., March 1978.
Committee on Commerce, Science, and Transportation, United States Senate. Intercity Bus Service in Small Communities. U.S. Government Printing Office: Washington, D.C., 1978.
Crandall, Burton D. The Growth of the Intercity Bus Industry. University, Syracuse, New York, 1954.
Syracuse
Davis, Frank W. et. al. Survey of Intercity Bus Operations in the State of Tennessee. The University of Tennessee, Knox vi 11 e, Tennessee, June 1974.
Fravel, Frederick. North Carolina Intercity Bus Study. Department of City and Regional Planning, University of North Carolina, Chapel Hill, North Carolina, September 1979.
Economic Report of the President, January 1980.
General Accounting Office of the United States. Amtrak's Economic Impace on the Intercity Bus Industry. The Comptroller General Report to Congress, Washington, D.C., January 12, 1979.
Hollander, M. and Wolfe, D. A., Nonparametric Statistical Methods. John Wiley and Sons: New York, New York, 1973.
Interstate Commerce Commission. "Financial Cl ass I Motor Carriers of Passengers. 11
Accounts: Washington, D.C., 1978.
and Operating Statistics for Statement No. 750. Bureau of
Interstate Commerce Commission. "Financial Class I Motor Carriers of Passengers." Accounts: Washington, D.C., 1977.
and Operating Statistics for Statement No. 750. Bureau of
Interstate Commerce Commission. The Intercity Bus Industry: Study. Bureau of Economics: Washington, D.C., May 1978.
Interstate Commerce Commission. "The Motor Bus Act of 1981: Commerce Commission's Proposed Legislative Reform of Regulation." Washington, D.C., December 15, 1980.
145
A Preliminary
The Interstate Intercity Bus
._._. -----~ .. ~--·~------------
MacNeal, Edward. The Semantics of Air Passenger Transportation. Port and Industrial Authority; Norfolk, Virginia, 1981.
Norfolk
Management Analysis Center, Inc. Deregulation of the Intercity Bus Industry. Washington, D. C., 1981.
Meier, Albert C., and Hoschek, John P. Over the Road: A History of Intercity Bus Transportation in the United States. Motor Bus Society, Inc.: Upper Montclair, New Jersey, 1975.
Moore, Dennis H. "The Passenger's Side: A Brief Commentary on Oregon's Intercity Public Transportation Program." Oregon Department of Transportation, Salem, Oregon, May 1979.
National Transportation Policy Study Commission. Intercity Bus Transporta-tion. Special Report No. 7, Washington, D.C., November 1979.
Pinkston, Elizabeth Ann. The Intercity Bus' Transportation Industry: An Industrial Organization Study. Yale University: New Haven, Connect-icut, 1975.
Ramsdell, Edward L. "Assessment of Motor Carriers of Passengers Statistical Data Filed with the Interstate Commerce Comission; 11 Transportation Research Forum Proceedings, Oxford, Indiana, 1978.
Sheldon, George. "Intercity Bus Deregulation in Florida." Conference on Intercity Bus Transportation, Washington, D.C., September 22, 1980.
Transportation Association of America. Transportation Facts and Trends. 15th Edition, Washington, D.C., 1979.
Transportation Association of America. Transportation Facts and Trends. 16th Addition, Washington, D.C., 1980.
Transportation Research Board. The Intercity Bus Industry: Issues and Problems. National Academy of Sciences: Washington, D.C., September.
United States Department of Commerce, Bureau of Economic Analysis. "Survey of Current Business," Volume 61, No. 5, May 1981.
146_
APPEND IX A
ON-BOARD SURVEY FORMS
147

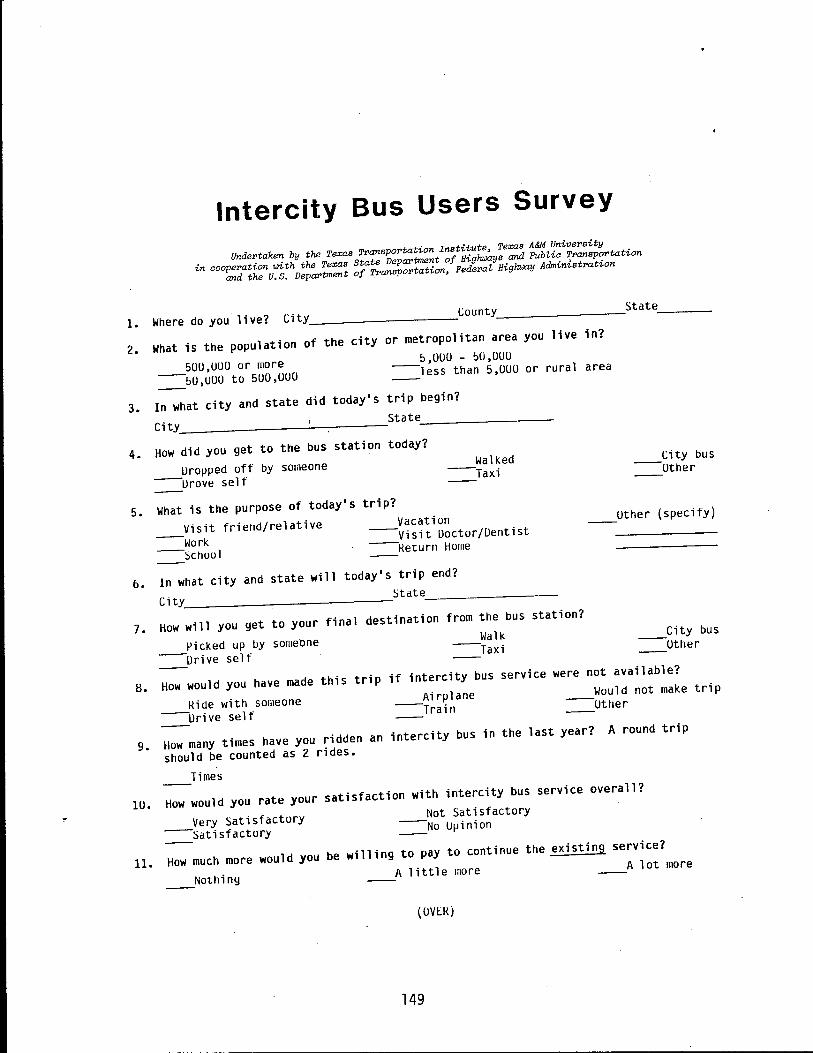
Intercity Bus Users Survey Undertaken by the Texas Transportation Institute, Texas A&M University
in cooperation !Pith the Texas State Department of Higlu.Jays and PubLic Transportation and the U.S. Department of Transportation, FederaL Higlu.Jay Administration
1. Where do you live? City __________ county _________ State ____ _
2. What is the population of the city or metropolitan area you live in?
500,000 or more 5,000 - !'>0,000 50,UOO to 500,000 --less than 5,0UO or rural area
3. In what city and state did today's trip begin? City State ________ _
4. How did you get to the bus station today? Walked
--Taxi Uroµped off by someone -urove self
5. What is the purpose of today's trip? vacation Visit friend/relative
--work --School
--Visit Uoctor/Dentist --Keturn Home
6. In what city and state will today's trip end? City State _________ _
7. How will you get to your final destination from the bus station? Walk
--Taxi Pi eked up by someone -Urive self
City bus --Other
Other (specify)
City bus --Other
8. How would you have made this trip if intercity bus service were not available? Kide with someone Airplane Would not make trip
-urive self --Train --Other
9. How many times have you ridden an intercity bus in the last year? A round trip should be counted as 2 rides.
10.
Times
How would you rate your
Very Satisfactory -satisfactory
satisfaction with intercity bus service overall? Not Satisfactory
=No Uµinion
11. How much more would you be willing to pay to continue the existing service? __ Nothiny A little more A lot more
(OVEK)
149
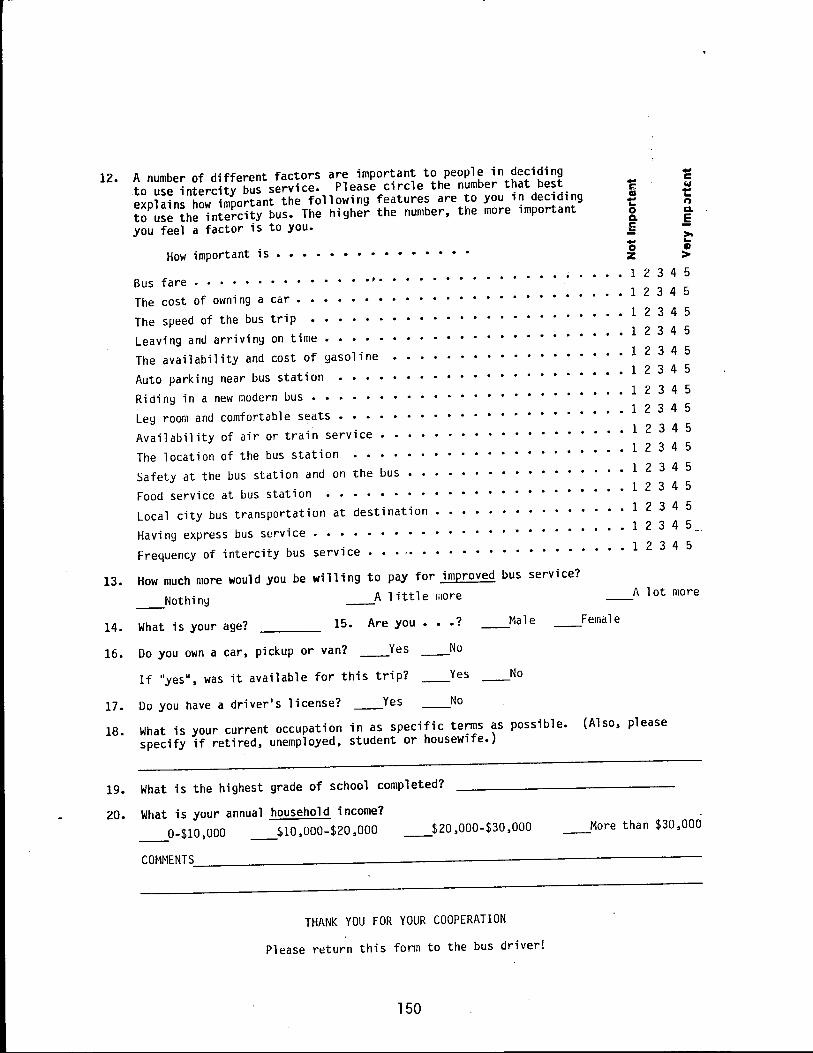
12. A number of different factors are important to people in deciding .to use intercity bus service. Please circle the number that best explains how important the following features are to you in deciding to use the intercity bus. The higher the number, the more important you feel a factor is to you.
How important is •••• . . . . . . . . . . . Bus The
The
fare . . . . . . . . . . . . . ~ . cost of owning a car •
speed of the bus trip
. . . . . . . . . .
Leaving and arriving on time ••
. . . . .
. . . . . . . . .
-c: m t: 0 a. ;§
-c w -... ,, a. s ~ 0 G
z > .12345 .12345
1 2 3 4 5
• • 1 2 3 4 5
.12345 The availability and cost of gasoline
Auto parking near bus station . . . . . . . . . .12345
Riding in a new modern bus ••••• Leg room and comfort ab 1 e seats • • • • • • • • •
Availability of air or train service •• The location of the bus station •••••
Safety at the bus station and on the bus • . . . . . . Food service at bus station . . . . . . . . . . . Local city bus transportation at destination • Having express bus service •••••••••
Frequency of intercity bus service ••
. . . . . .
13. How much more would you be willing to pay for improved bus service?
__ Nothing A little more
• 1 2 3 4 5
1 2 3 4 5
..12345 • 1 2 3 4 5
1 2 3 4 5 1 2 3 4 5
1 2 3 4 5
1 2 3 4 5
1 2 3 4 5
A lot more
14. What is your age? 15. Are you ••• ? Male Female
16. Do you own a car, pickup or van? Yes No
If "yes", was it available for this trip? Yes No
17. Do you have a driver's license? Yes No
18. What is your current occupation in as specific terms as possible. (Also, please specify if retired, unemployed, student or housewife.)
19. What is the highest grade of school completed?
20. What is your annual household income? __ 0-$10 ,000 __ HO ,000-$20 ,000 __ $20 ,000-$30 ,000 __ More than $30 ,000
COMMENTS _____________________________ _
THANK YOU FOR YOUR COOPERATION
Please return this fonn to the bus driver!
150
Encuesta para Pasajeros del Servicio de Autobus Interurbano
(Hecho por El Instituto Oe Transporte de Texas, La Universidad de Texas A&M en cooperaci0r1 con El Uepartamento Estatal de Carreteras y Transportes Puolicos de Texas)
1. l.Uonde vive Ud.? Ciudad ____ _ Condado ____ _ Estado ____ _
l. l.Cual es la poblacion de la ciudad o el area metropolitana en que vive Ud.?
5UU,UUU o mas 5,0UU - 50,UUU -- 50,UUU a 500,UUU --menos de 5,UUU o un area rural
3. l.En cual ciudad y estado comenzo su viaje hoy? Ciudad ____ _
4. .i.Como llego Ud. a la estacion de autobus?
Al gu i en me 11 evo Manejare yo mismo
L 1 egue cami nando --En t:axi
Estado -----
En autobus Utra manera
5. l.IJue es el proposito de su viaje hoy? A visitar amigos o parientes
--Para trabajar
Para ir al medico o dentista --Para regresar a casa --utra razon (especiricarnente)
--Para ir a la escuela Para ir de vacaciones
6. l.En que ciudad y estado va a terminar su viaje hoy? <.:iudad __ _ Estado -----
7. ;,Como llegara Ud. a su destino final desde la estacion del autobus? <.:aminare
--En taxi En el autobus municipal
--utra manera Alguien 111e recogercl Manejare yo misriro
8. l.Como habria viajado Ud. si no hubiera un servicio de autobus?
En cache con alguien Manejare' yo mismo
Por avian Por tren No viajaria
~. l.Cuantas veces ha viajado en autobus durante el ano pasado? Un viaje de ida y vuelta cuenta como dos viajes. __ Viajes
10. lQue'grado de satisfaccion ha recibido Ud. del servicio de autobus interurbano?
__ Muy satisfecho Satisfecho Insatisfecho Sin opinion
11. i,Cuanto dinero pagaria Ud. para continuar el servicio existente?
l'lada mas Un poco mas Mucho mas
(CAMBIE LA PAGINA, POR FAVOR)
151
12. lHay un numero de factores diferentes que son muy importantes para los que usan el servicio de autobus interurbano. Por favor, indique con un circulo el numero que muestre la importancia del servicio. Cuanto mas alto el numero, mas importante el factor.
Que importancia tiene ••••
El precio de pasaje ••••• Los gastos de poseer un coche
El tiempo que toma el viaje •
Salir y llegar a tiempo ••• Costo y disponibilidad de la gasolina • Estacionamiento cerca de la estacion de autobus
Viajar en un autobus nuevo y moderno . . . . . . . . . .
Espacio para las piernas y asientos comodos ••
La disponibilidad del servicio' por avian o tren •
Ubicacion de la estacion de autobus ••••
. . . .
La seguridad en la estacion de autobus y en el autobus
tl servicio de restaurante en la estacion de autobus La disponibilidad del autobus municipal al llegar a su destino
Servicio de autobus expreso • .......... La frecuencia del servicio de autobus interurbano •••
13. lCuanto dinero pagaria Ud. por mejorar el servicio de autobus?
Nada mas Un poco mas
14. lCuantos anos tiene Ud.?
15. lSexo: Hombre __ Mujer
. . . . .
16. lPosee Ud. un vehfrulo de pasajeros o carga? S{ No Si la respuesta es si', teni'a su vehi'culo disponsible para este viaje?
S( No
17. lTiene Ud. una licencia para manejar? s( No
QJ n:s .µ ..... c:: u "' c:: .µ
"' ~
+> 0 ~ 0. 0 E a.. .... c:: ~ ..... Vl :::;:::
1 2 3 4 5
.12345
.12345
.12345
1 2 3 4 5
1 2 3 4 5
1 2 3 4 5
.12345
1 2 3 4 5
1 2 3 4 5
.12345
.12345
.12345
.12345
1 2 3 4 b
Mucha mas
18. lCual es su ocupacion? (Indique si es estudiante, ama de casa, jubilado, o desocupado.)
19. lCual es el iiltimo anode escuelo que ha completado Ud.?
20. lCuai es el ingreso anual de toda la familia? (en dollares) U-$10,0UU __ $10,UOU - $20,UUU __ $20,UUU - !ii3U,UOU
Mas de $30 ,ouu
Muchas gracias por su cooperacion en este estudio.
Por favor devuelva este fornulario al conductor del autobus.
152
APPENDIX B
HOUSEHOLD SURVEY FORM
153

COMMISSION
A. SAM WALDROP, CHAIRMAN
DEWITT C. GREER RAY A. BARNHART
Dear Resident:
STATE DEPARTMENT OF HIGHWAYS AND PUBLIC TRANSPORTATION
AUSTIN, TEXAS 78763
February 25, 1981
INTERCITY BUS SURVEY
ENGINEER-DIRECTOR
M. G. GOODE
IN REPLY REFER TO FILE NO.
We need your help in a survey b~i ng undertaken by the Texas Transportation Institute, Texas A&M University System. The purpose of the survey . is to obtain information about your household's use of intercity bus service.
Since it is not possible to send questionnaires to all households in Texas, we have selected a small number at random. Your completion of the requested information is needed to insure the success of this effort.
We have included two survey forms. If possible, please have two adults _ complete the survey forms.
We are grateful for your parti ci pa ti on in the survey. Pl ease complete the requested infonnation as best you can and return the survey fonns in the enclosed, postage-paid envelope, within one week.
Si nee rely,
~~~ Phillip L. Wilson State Planning Engineer, Trans~ortation
155
, '
COMMISSION --·--
A. SAM WALDROP, CHAIRMAN
DEWITT C. GREER
RAY A. BARNHART
lJear Resident:
STATE DEPARTMENT OF HIGHWAYS AND PUBLIC TRANSPORTATION
AUSTIN, TEXAS 78763
May 15, 1Y81
INTERCITY BUS SURVEY
ENGINEER-DIRECTOR
M.G.GOODE
--·--
IN REPLY REFER TO FILE NO.
We recently asked a small number of Texas residents to participate in a survey being· conducted by the Texas Transportation Institute, Texas A&M University System. The purpose of the survey' is to obtain information about your household's use of intercity bus service.
Since we have included only a small number of households in this survey, your participation is essential to the success of the project. If yciu have already completed the survey, we wish to thank you for your copperation in_ this undertaking. If you did not respond, we would appreciate you completing the attached survey.
We have included two survey forms. If possible, please have two adults complete the survey forms.
' We are grateful for your participation in the survey. Please complete the requested information as best you can and return the survey forms in the enclosed, postage-paid envelope, within one week.
Sincerely,
c?~~~ Phillip L. Wilson State Planning Engineer, Transportation
f
156
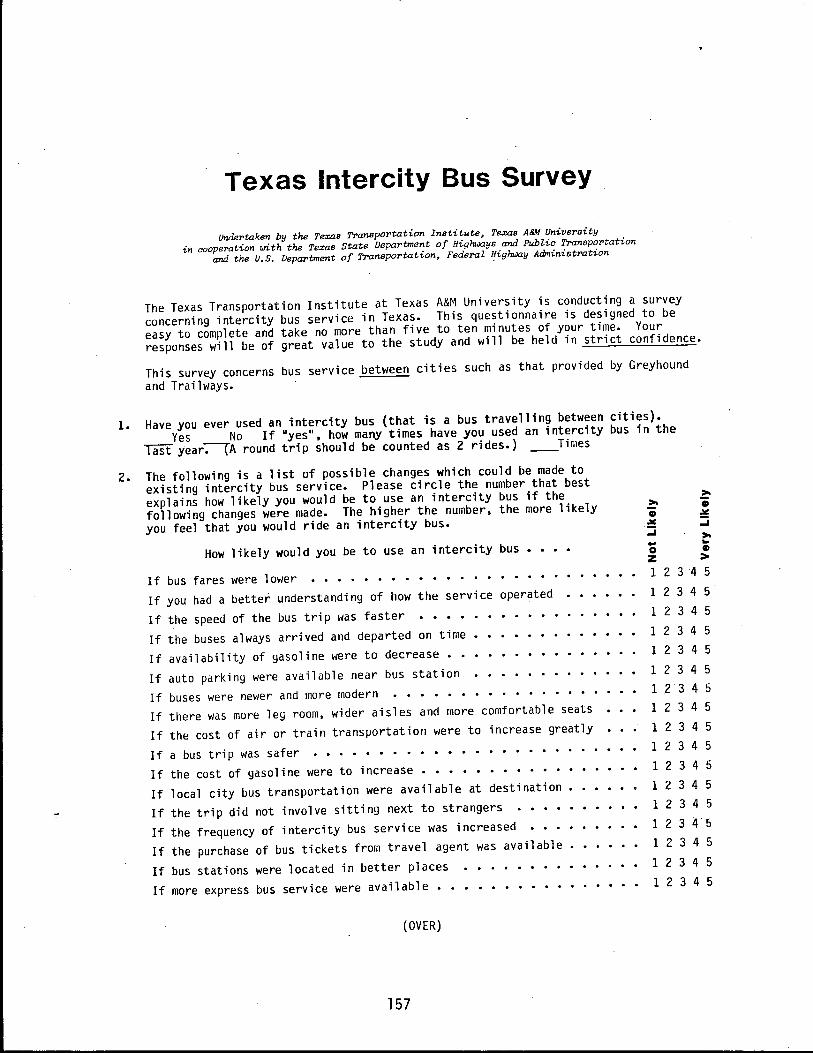
Texas Intercity Bus Survey
Undertaken by the Te:ras Transportation Institute, Te:rae A&M University in cooperation L'ith the Texas State Department of Highixiys and Public Transportation
and the U.S. Department of Transportation, Federal Highi.xiy Administration
The Texas Transportation Institute at Texas A&M University is conducting a survey concerning intercity bus service in Texas. This questionnaire is designed to be easy to complete and take no more than five to ten minutes of your time. Your responses will be of great value to the study and will be held in strict confidence.
This survey concerns bus service between cities such as that provided by Greyhound and Trai lways.
1. Have you ever used an intercity bus (that is a bus travelling between cities). Yes No If "yes", how many times have you used an intercity bus in the
2.
1 ast year-:--\A round trip should be counted as 2 rides.) __ Times
The following is a list of possible changes which could be made to existing intercity bus service. Please circle the number that best explains how likely you would be to use an intercity bus if the following changes were made. The higher the number, the more likely you feel that you would ride an intercity bus.
How likely would you be to use an intercity bus
If bus fares were lower . . . . . . . . If you had a better understanding of how the service operated
If the speed of the bus trip was faster If the buses always arrived and departed on time •• If availability of gasoline were to decrease •••
If auto parking were available near bus station If buses were newer and more modern • • • • If there was more leg room, wider aisles and more comfortable seats If the cost of air or train transportation were to increase greatly
If a bus trip was safer ••••••••••• If the cost of gasoline were to increase •••••••••• If local city bus transportation were available at destination •••
If the trip did not involve sitting next to strangers
If the frequency of intercity bus service was increased If the purchase of bus tickets from travel agent was available •
If bus stations were located in better places
If more express bus service were available •
(OVER}
157
>-.. ... 0 ., z > 1 2 3 4 5
1 2 3 4 5
1 2 3 4 5
1 2 3 4 5 1 2 3 4 5
1 2 3 4 5
1 2 3 4 5 1 2 3 4 5
1 2 3 4 5 1 2 3 4 5
1 2 3 4 5
1 2 3 4 5 1 2 3 4 5
1 2 3 4 5
1 2 3 4 5
1 2 3 4 5
1 2 3 4 5
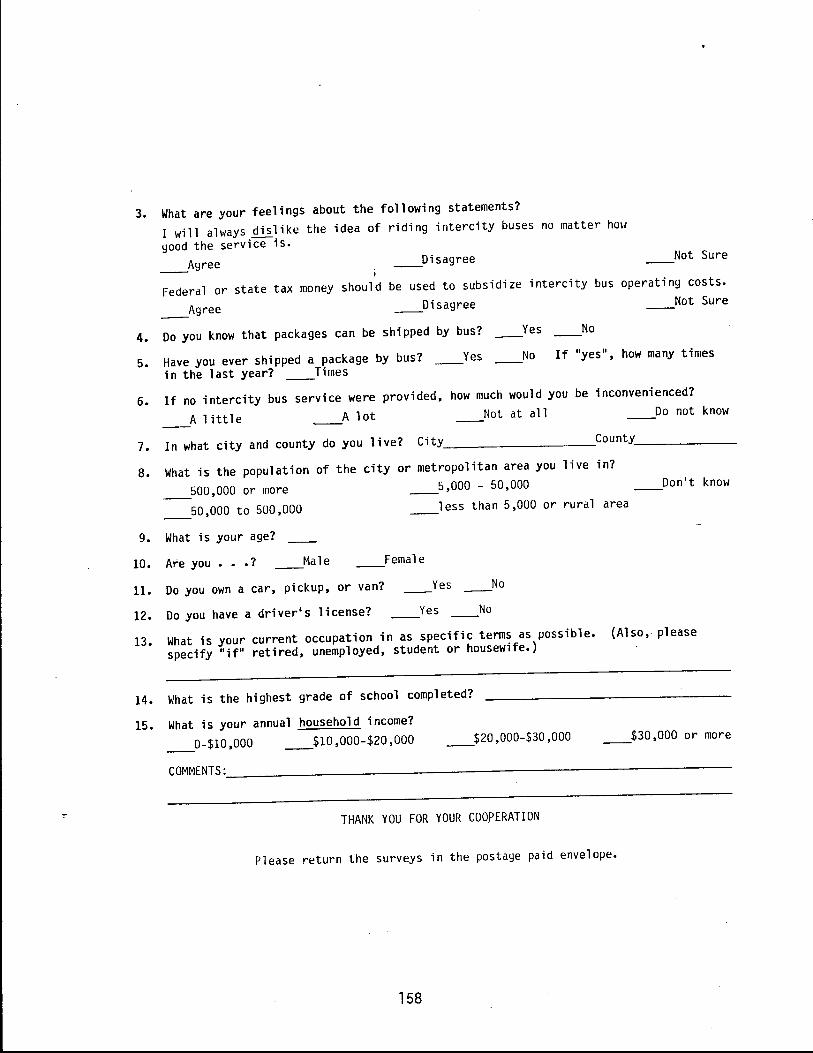
3. What are your feelings about the following statements? I will always dislike the idea of riding intercity buses no matter hoH good the service is. __ Agree __ Disagree Not Sure
Federal or state tax money should be used to subsidize intercity bus operating costs. __ Agree __ Disagree Not Sure
4. Do you know that packages can be shipped by bus? Yes No
5. Have you ever shipped a package by bus? Yes __ No If "yes", how many times in the last year? Times --
6. If no intercity bus service were provided, how much would you be inconvenienced? A little __ A lot __ Not at all Do not know
7. In what city and county do you live? City __________ County ______ _
8. What is the population of the city or metropolitan area you live in? __ 500,000 or more __ 5,000 - 50,000 __ Don't know
__ 50,000 to 500,000 less than 5,000 or rural area
9. What is your age? __
10. Are you ••• ? Male Female
11. Do you own a car, pickup, or van? Yes No
12. Do you have a driver's license? Yes No
13. What is your current occupation in as specific tenns as possible. (Also, please specify "if" retired, unemployed, student or housewife.)
14. What is the highest grade of school completed?
15. What is your annual household income? __ 0-$10 ,000 __ $10 ,000-$20 ,000 __ $20 ,000-$30 ,000 __ $30,000 or more
COMMENTS:_------------------------------
THANK YOU FOR YOUR COOPERATION
Please return the surveys in the postage paid envelope.
158
APPENDIX C
PACKAGE SURVEY FORM
159

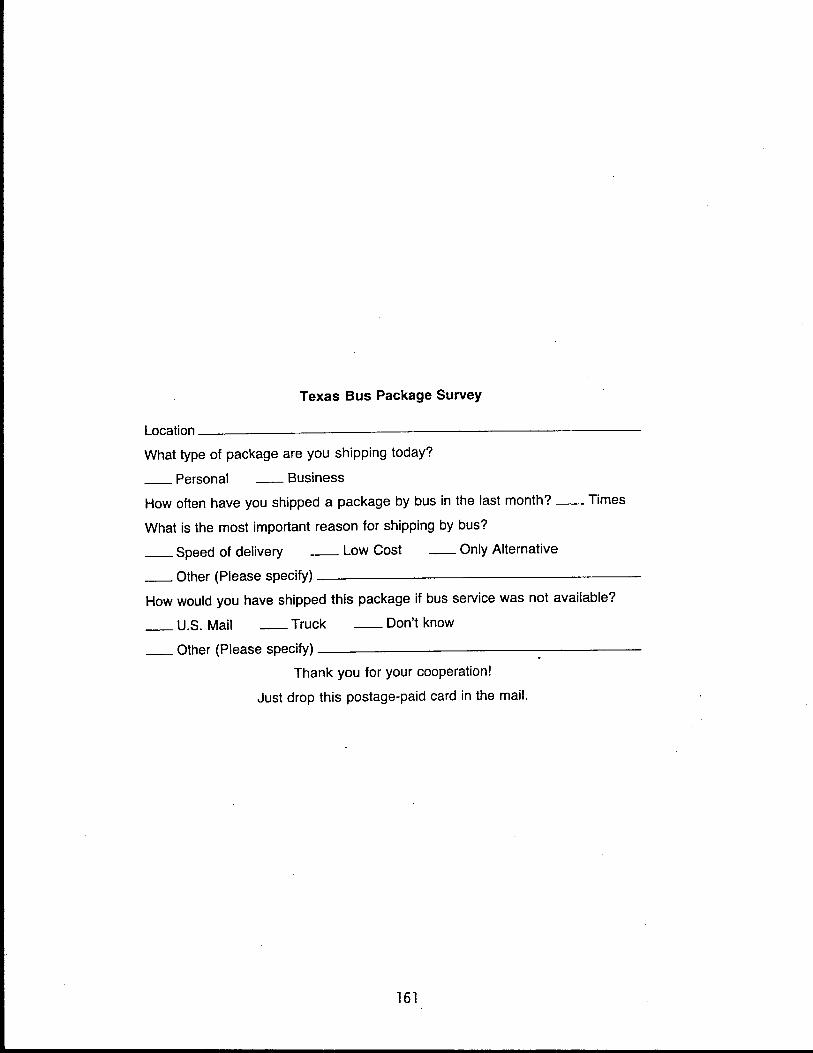
Texas Bus Package Survey
Location _________________________ _
What type of package are you shipping today?
__ Personal __ Business
How often have you shipped a package by bus in the last month? __ Times
What is the most important reason for shipping by bus?
__ Speed of delivery __ Low Cost __ Only Alternative
__ Other (Please specify)-----------------
How would you have shipped this package if bus service was not available?
__ U.S. Mail __ Truck __ Don't know
__ Other (Please specify)-----------------
Thank you for your cooperation!
Just drop this postage-paid card in the mail.
161