Embed Size (px)
DESCRIPTION
Thomas Jefferson Institute 2007 Innovations in Government Conference: Economic Update. December 2007. Overview. Elevated uncertainty with national growth slow through early next year Lack of home price appreciation/sub-prime lending issues = drag on consumer spending - PowerPoint PPT Presentation
Citation preview

December 2007
Thomas Jefferson Institute 2007 Innovations in Government
Conference: Economic Update
2
Overview• Elevated uncertainty with national growth
slow through early next year– Lack of home price appreciation/sub-prime lending
issues = drag on consumer spending– No recession; further Fed ease is unlikely
• Virginia ranked 16th in the nation (job growth)
• Northern Virginia not the fastest growing region but creating the most jobs
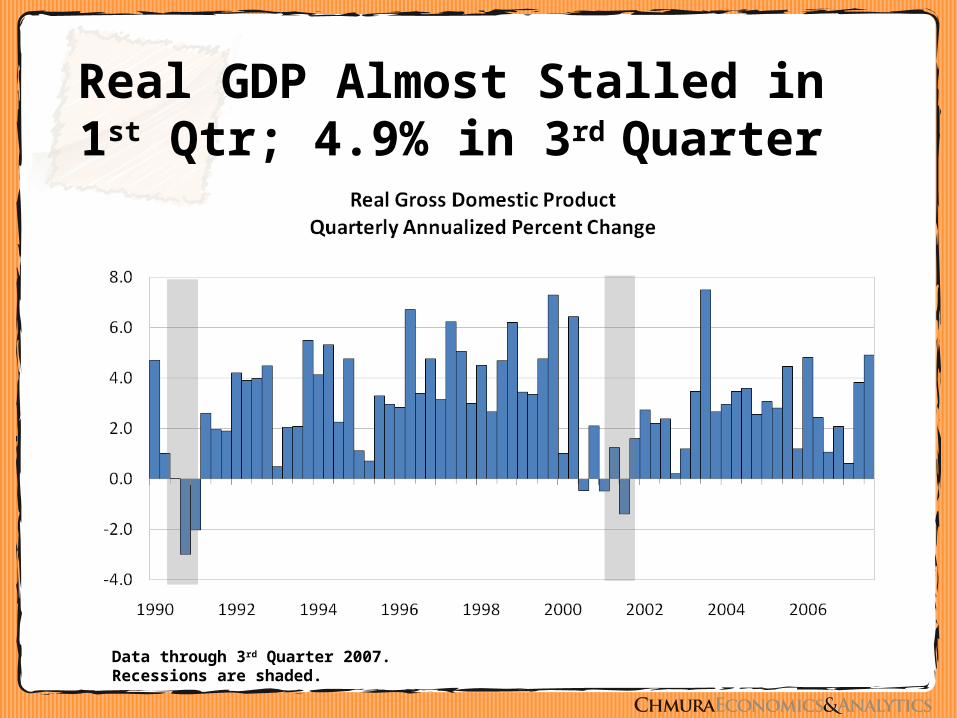
Real GDP Almost Stalled in 1st Qtr; 4.9% in 3rd Quarter
Data through 3rd Quarter 2007.Recessions are shaded.
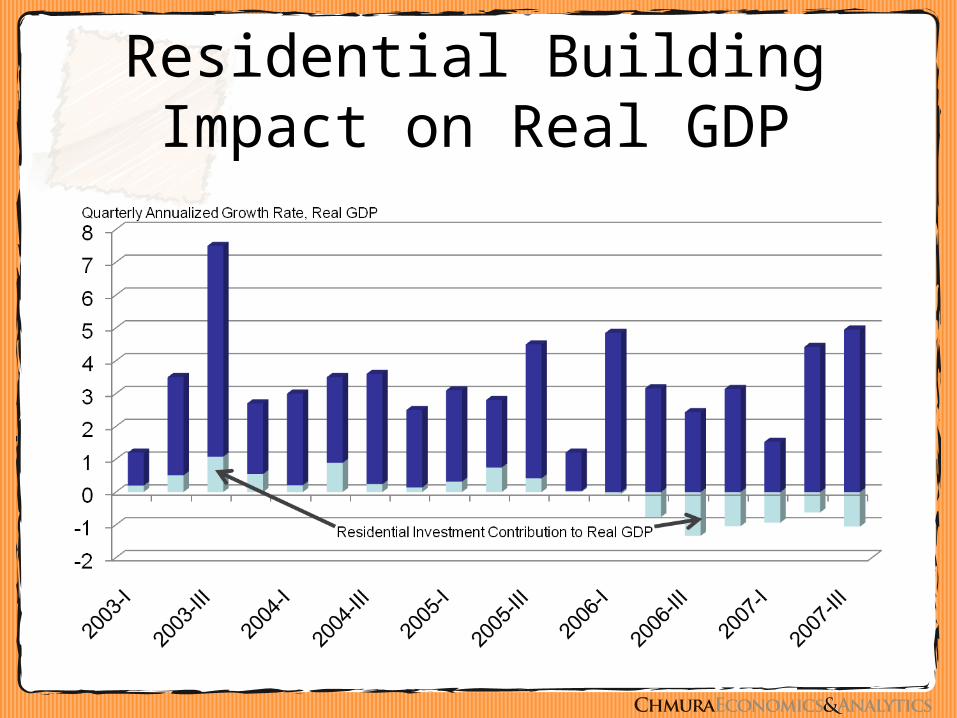
Residential Building Impact on Real GDP
Fed’s Preference? Recession or Accelerating Inflation?
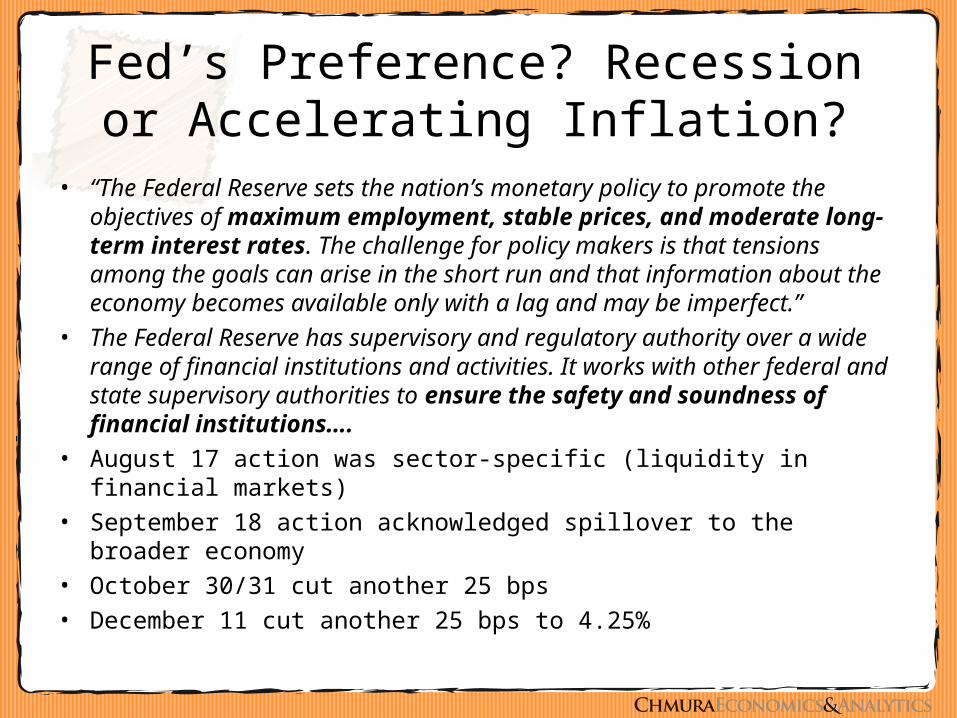
• “The Federal Reserve sets the nation’s monetary policy to promote the objectives of maximum employment, stable prices, and moderate long-term interest rates. The challenge for policy makers is that tensions among the goals can arise in the short run and that information about the economy becomes available only with a lag and may be imperfect.”
• The Federal Reserve has supervisory and regulatory authority over a wide range of financial institutions and activities. It works with other federal and state supervisory authorities to ensure the safety and soundness of financial institutions….
• August 17 action was sector-specific (liquidity in financial markets)
• September 18 action acknowledged spillover to the broader economy• October 30/31 cut another 25 bps• December 11 cut another 25 bps to 4.25%
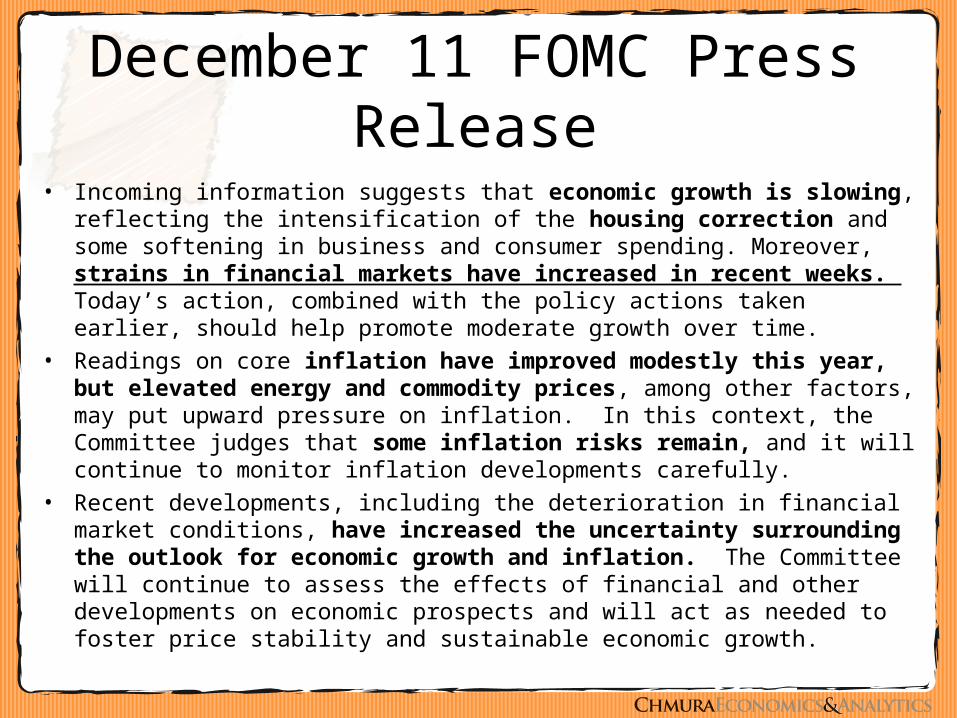
December 11 FOMC Press Release
• Incoming information suggests that economic growth is slowing, reflecting the intensification of the housing correction and some softening in business and consumer spending. Moreover, strains in financial markets have increased in recent weeks. Today’s action, combined with the policy actions taken earlier, should help promote moderate growth over time.
• Readings on core inflation have improved modestly this year, but elevated energy and commodity prices, among other factors, may put upward pressure on inflation. In this context, the Committee judges that some inflation risks remain, and it will continue to monitor inflation developments carefully.
• Recent developments, including the deterioration in financial market conditions, have increased the uncertainty surrounding the outlook for economic growth and inflation. The Committee will continue to assess the effects of financial and other developments on economic prospects and will act as needed to foster price stability and sustainable economic growth.
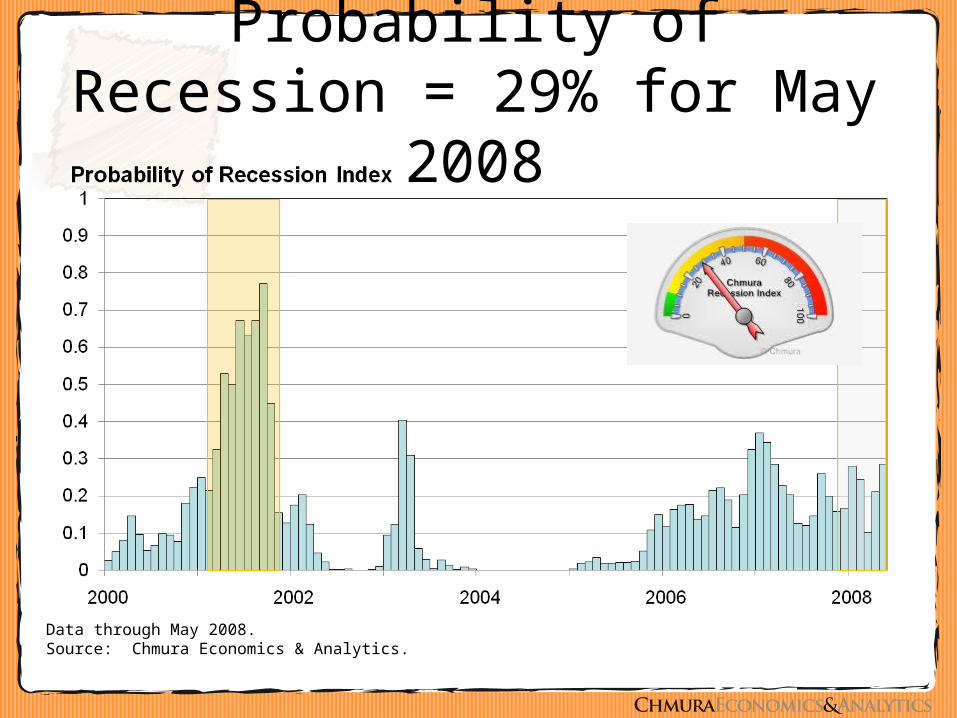
Probability of Recession = 29% for May 2008
Data through May 2008.Source: Chmura Economics & Analytics.
Will the Fed Ease Further?• Inflation is at the top end of the Fed ‘comfort
zone’ (argues against easing) – Weaker dollar causes higher import prices– Oil prices
• Interest rates are accommodative • Outside of residential market, economy
continues to grow
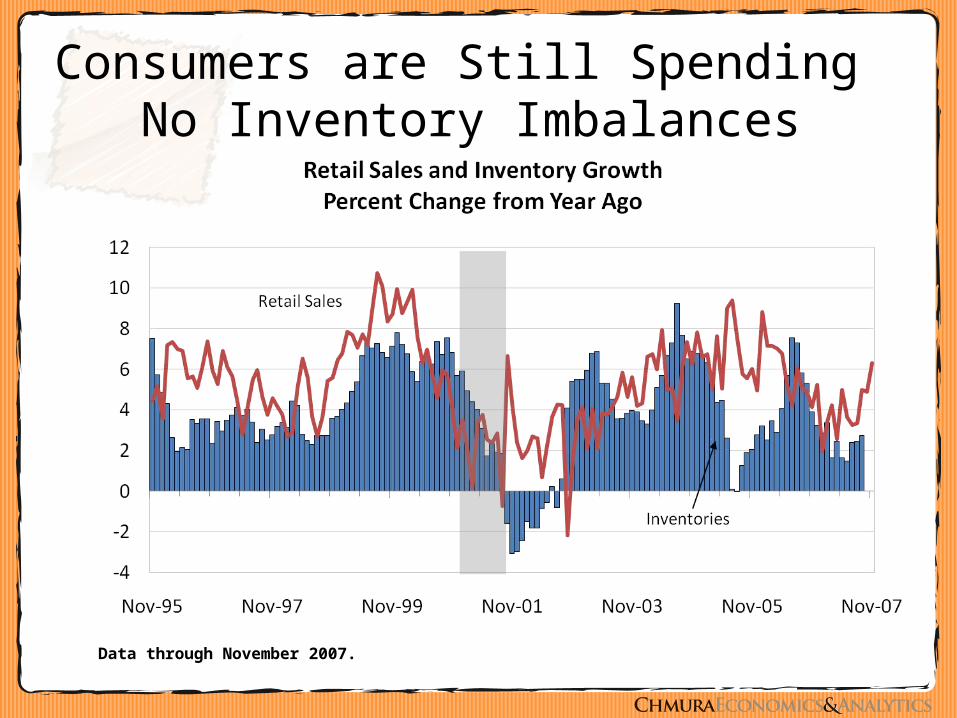
Consumers are Still Spending No Inventory Imbalances
Data through November 2007.
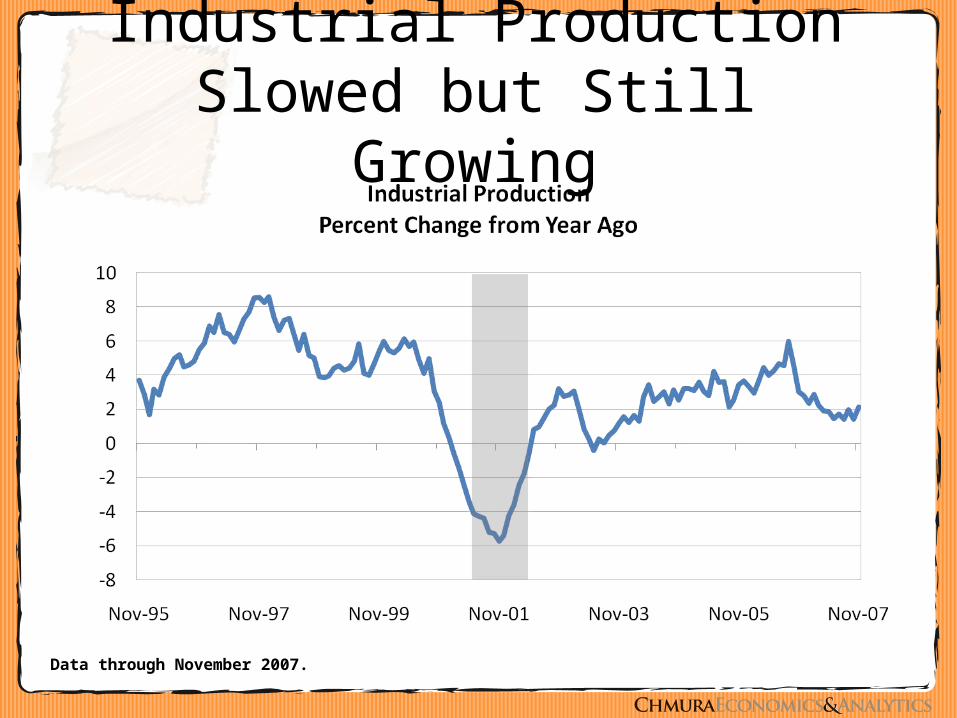
Industrial Production Slowed but Still Growing
Data through November 2007.
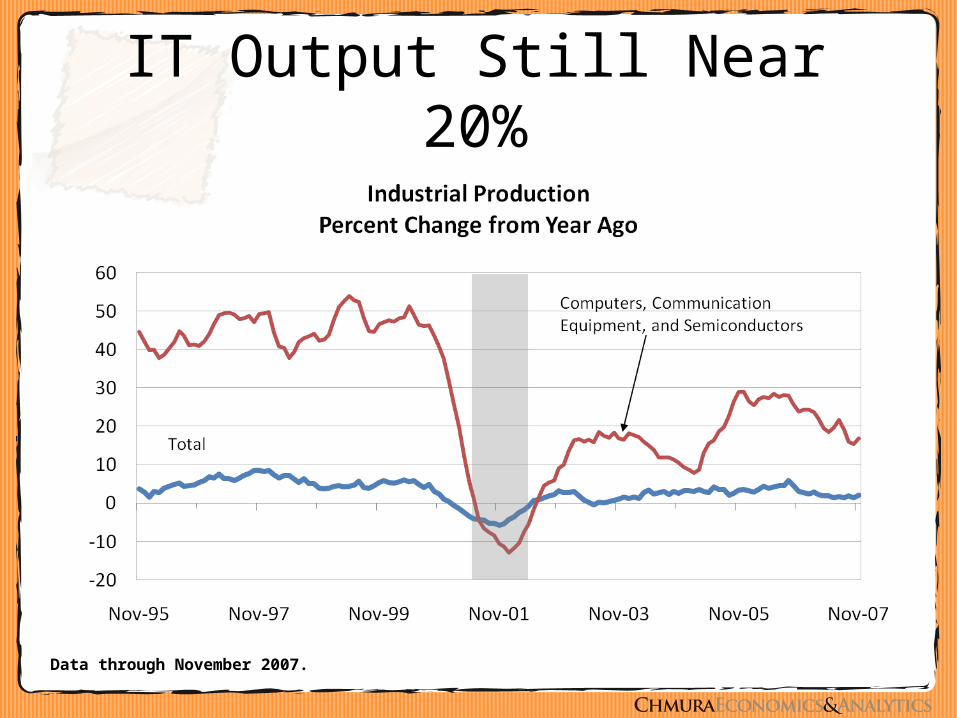
IT Output Still Near 20%
Data through November 2007.
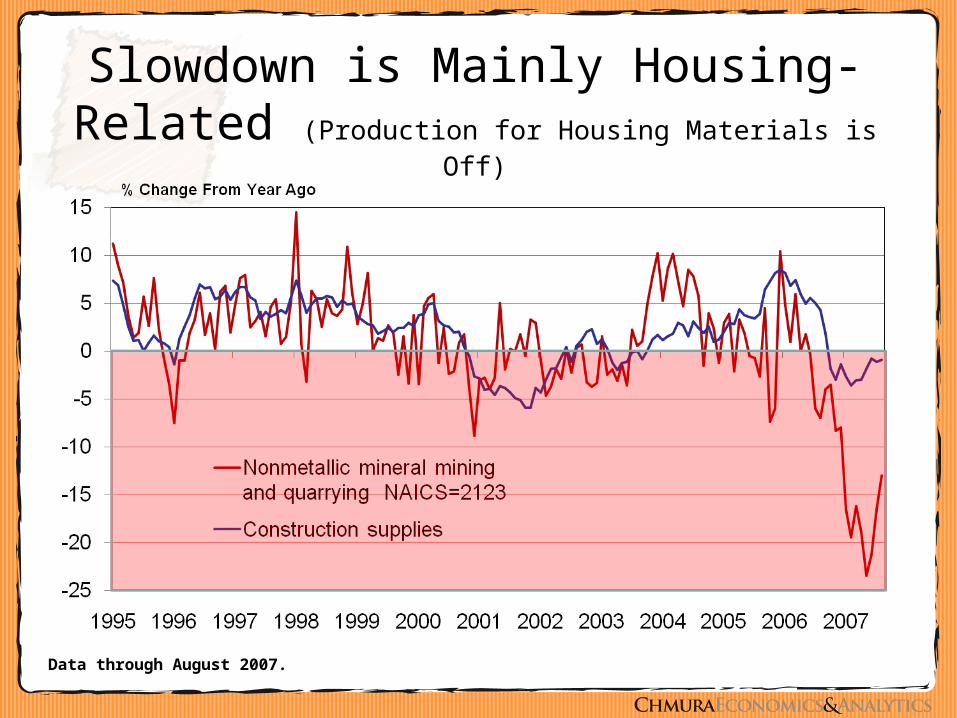
Slowdown is Mainly Housing-Related (Production for Housing Materials is Off)
Data through August 2007.
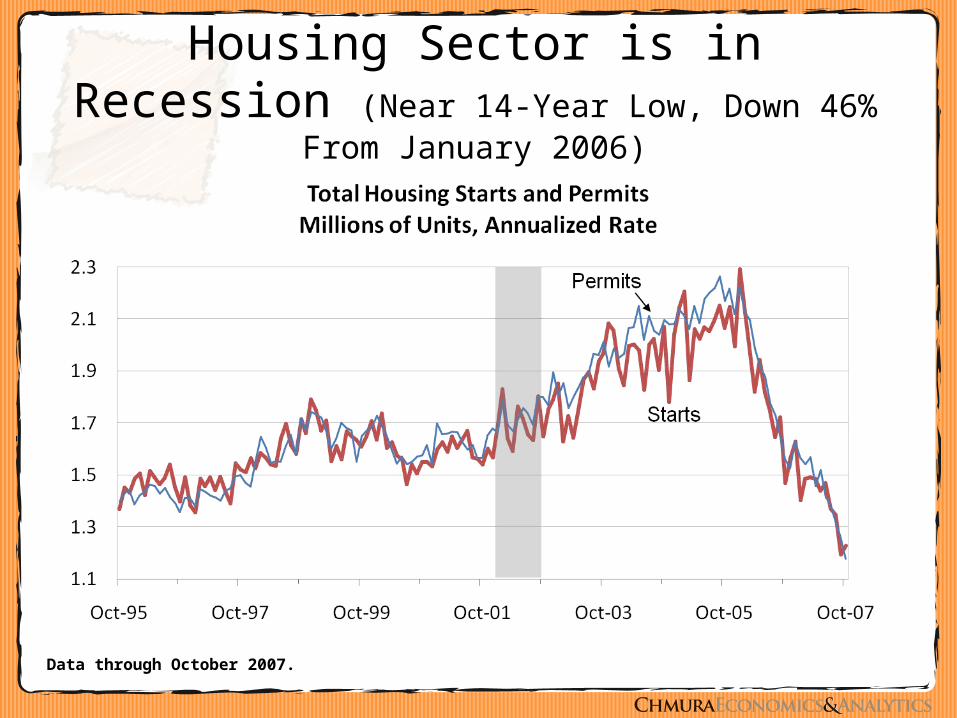
Housing Sector is in Recession (Near 14-Year Low, Down 46% From January 2006)
Data through October 2007.
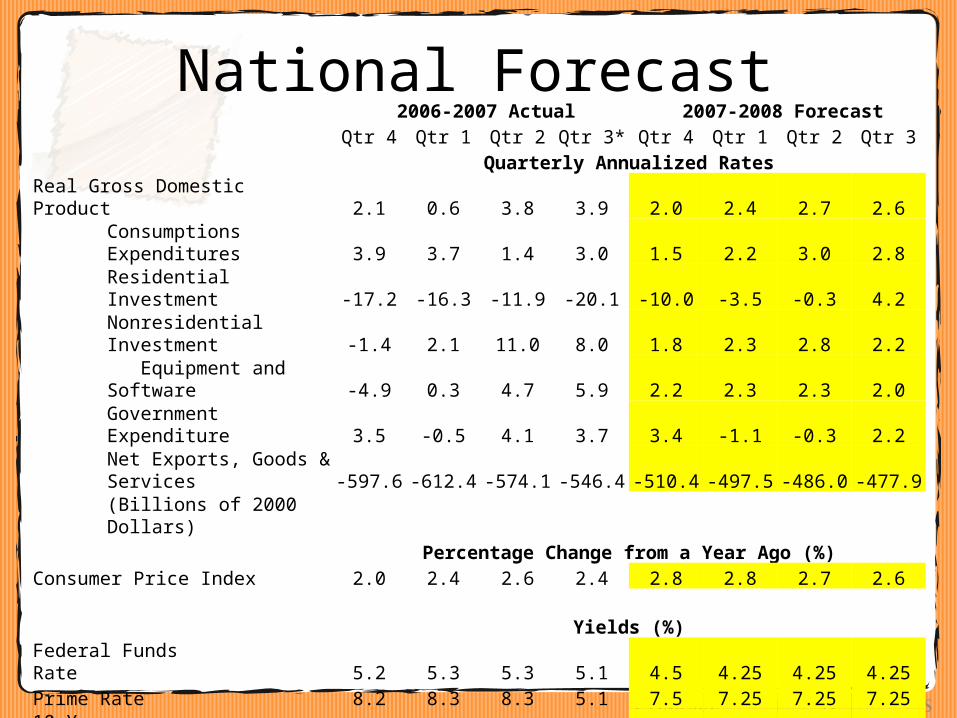
National Forecast 2006-2007 Actual 2007-2008 Forecast
Qtr 4 Qtr 1 Qtr 2 Qtr 3* Qtr 4 Qtr 1 Qtr 2 Qtr 3Quarterly Annualized Rates
Real Gross Domestic Product 2.1 0.6 3.8 3.9 2.0 2.4 2.7 2.6Consumptions Expenditures 3.9 3.7 1.4 3.0 1.5 2.2 3.0 2.8Residential Investment -17.2 -16.3 -11.9 -20.1 -10.0 -3.5 -0.3 4.2Nonresidential Investment -1.4 2.1 11.0 8.0 1.8 2.3 2.8 2.2 Equipment and Software -4.9 0.3 4.7 5.9 2.2 2.3 2.3 2.0Government Expenditure 3.5 -0.5 4.1 3.7 3.4 -1.1 -0.3 2.2Net Exports, Goods & Services -597.6 -612.4 -574.1 -546.4 -510.4 -497.5 -486.0 -477.9(Billions of 2000 Dollars)
Percentage Change from a Year Ago (%)Consumer Price Index 2.0 2.4 2.6 2.4 2.8 2.8 2.7 2.6
Yields (%)Federal Funds Rate 5.2 5.3 5.3 5.1 4.5 4.25 4.25 4.25Prime Rate 8.2 8.3 8.3 5.1 7.5 7.25 7.25 7.2510-Year Treasury 4.6 4.7 4.8 4.7 4.5 4.7 4.7 4.930-Year Conventional Mortgage 6.2 6.2 6.4 6.6 6.3 6.3 6.4 6.6Source: Chmura Economics & Analytics
Note: Yields reported for the average of the quarter
Summary of US Growth
• Housing contribution to GDP turns slightly positive in 3rd quarter but housing starts remain flat through 2008
• No more Fed ease• Overall GDP at 1.9% in 2007 (2.9% in 2006)• Risks:
– Oil rises further– International investors pull out of bond market– Subprime mortgage leads to broader credit crunch
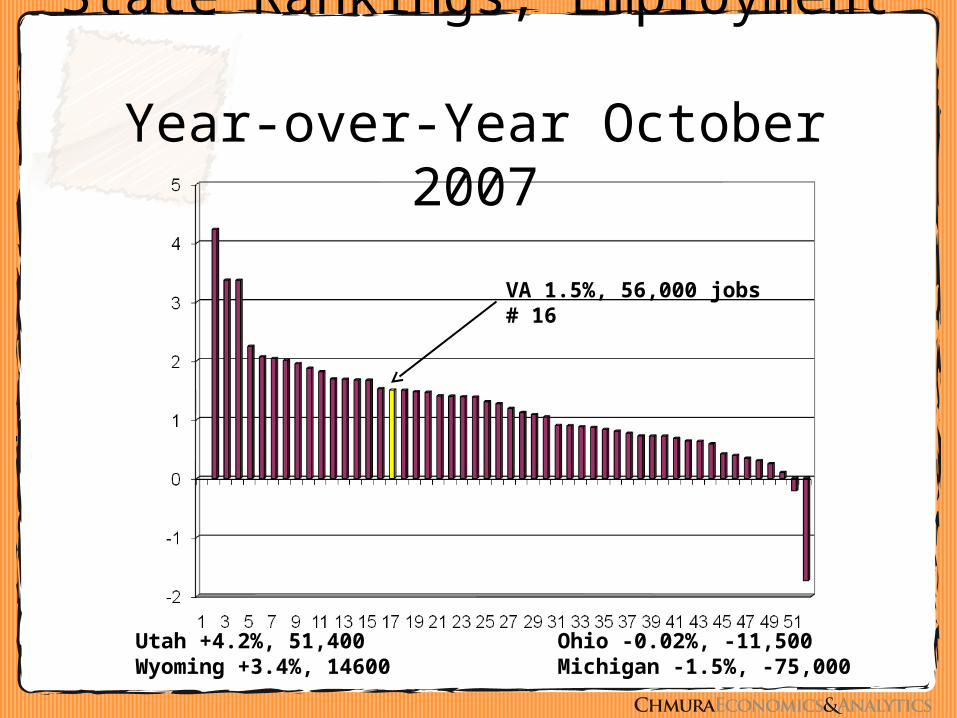
State Rankings, Employment Year-over-Year October 2007
Utah +4.2%, 51,400Wyoming +3.4%, 14600
Ohio -0.02%, -11,500Michigan -1.5%, -75,000
VA 1.5%, 56,000 jobs# 16
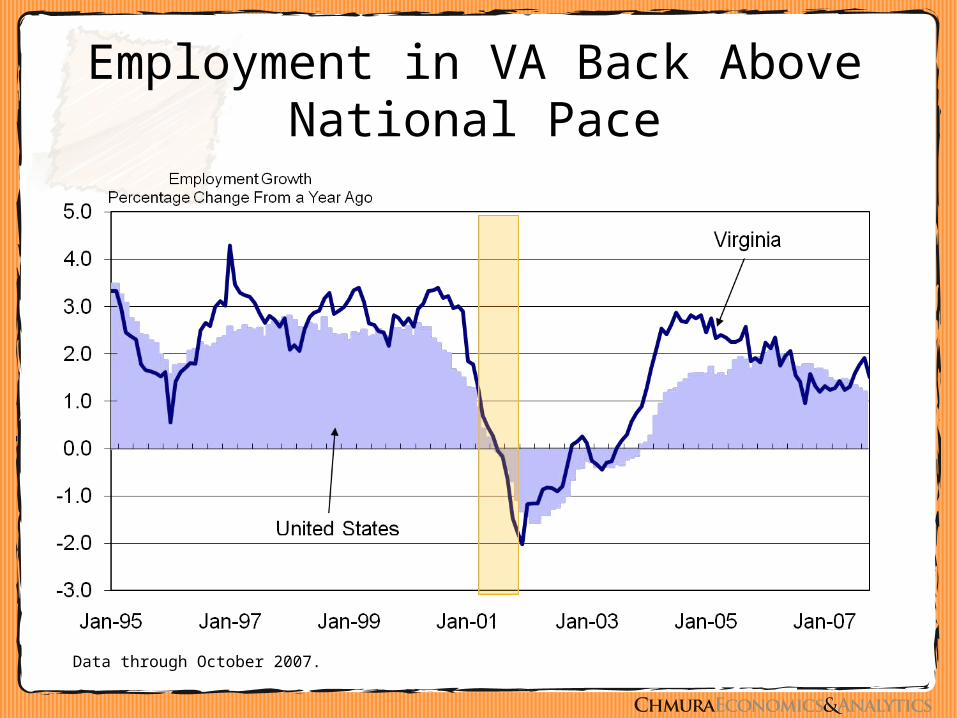
Employment in VA Back Above National Pace
Data through October 2007.
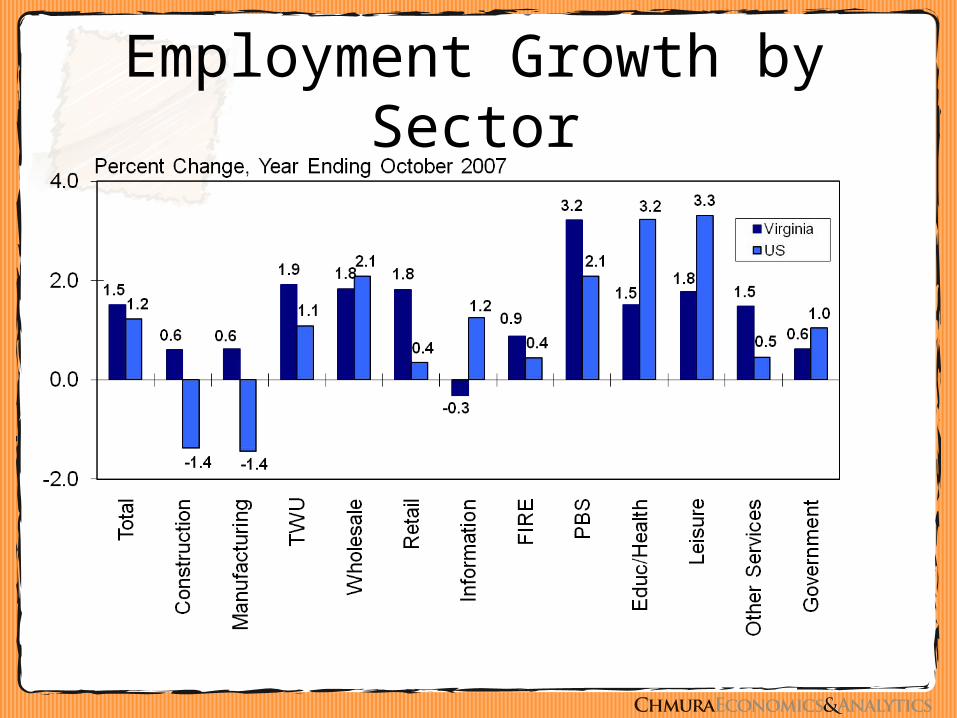
Employment Growth by Sector
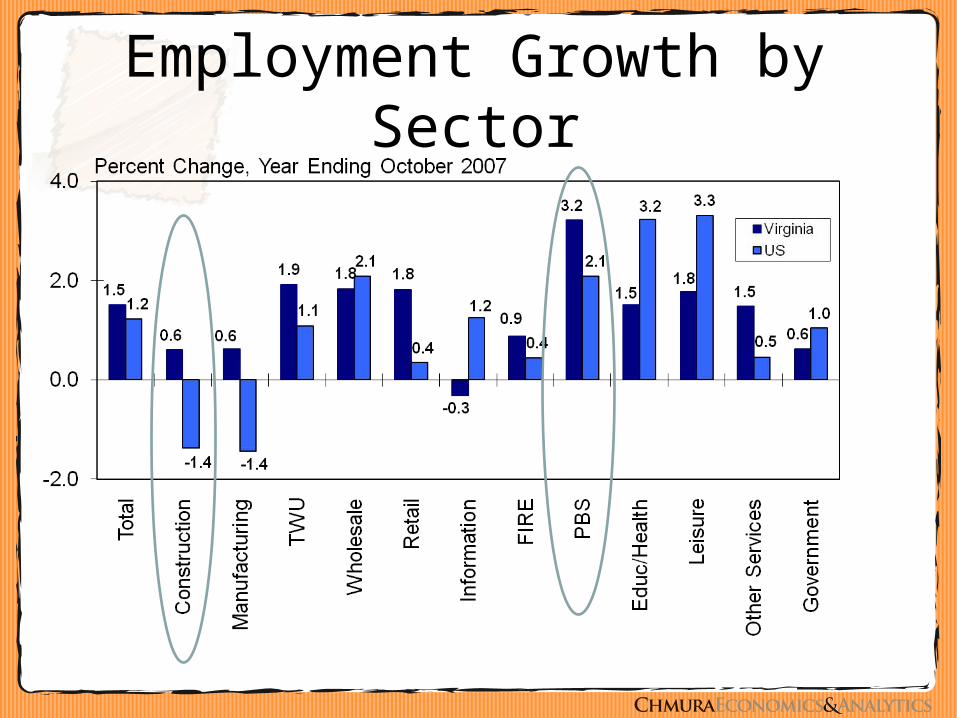
Employment Growth by Sector
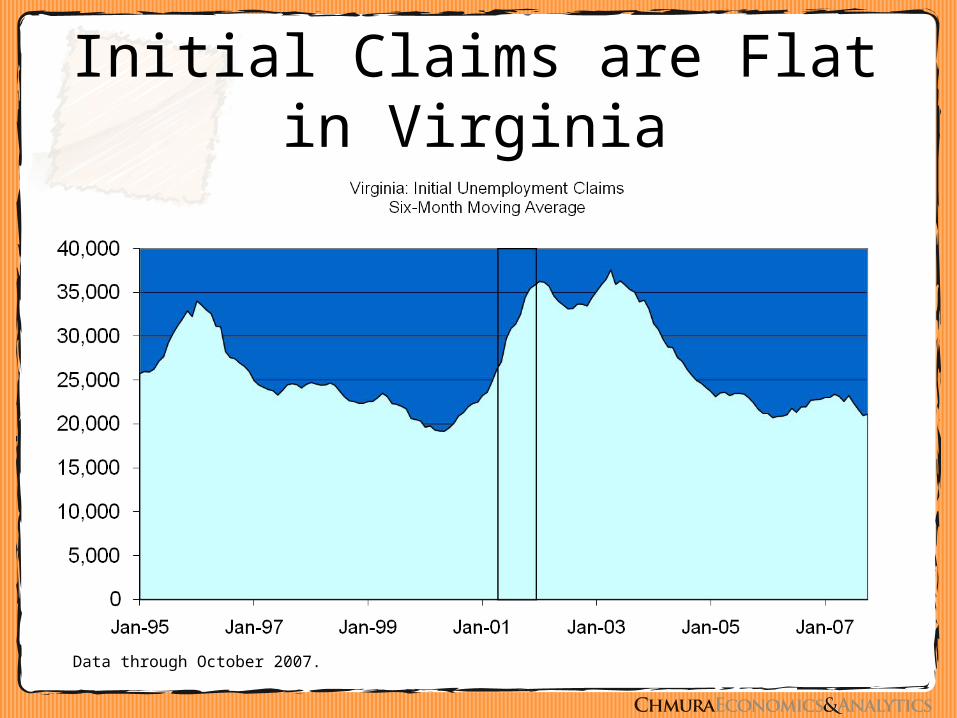
Initial Claims are Flat in Virginia
Data through October 2007.
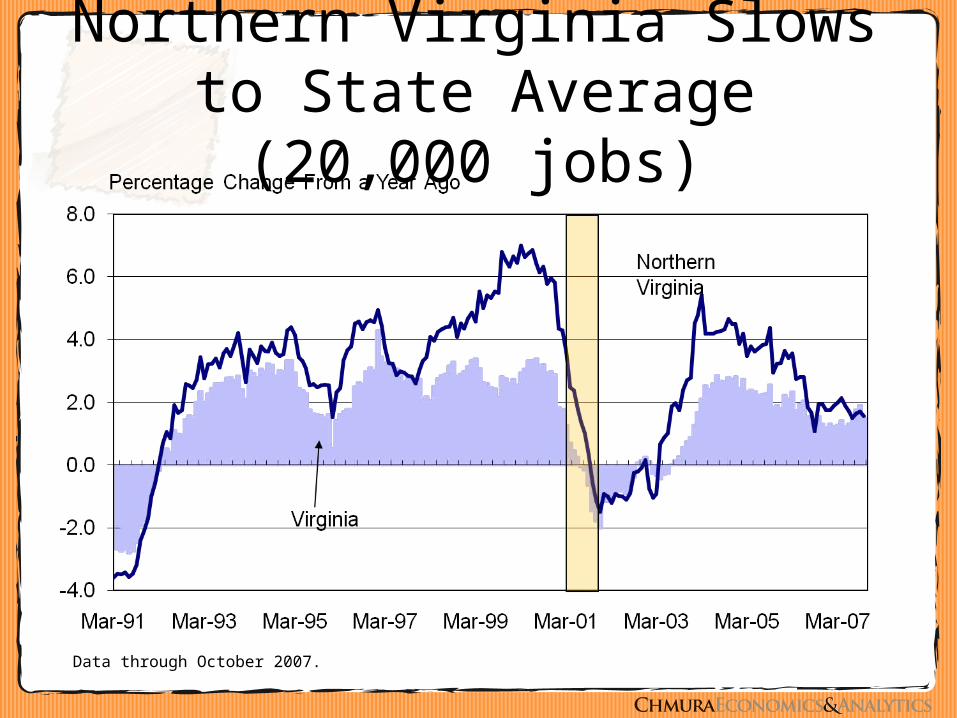
Northern Virginia Slows to State Average (20,000 jobs)
Data through October 2007.
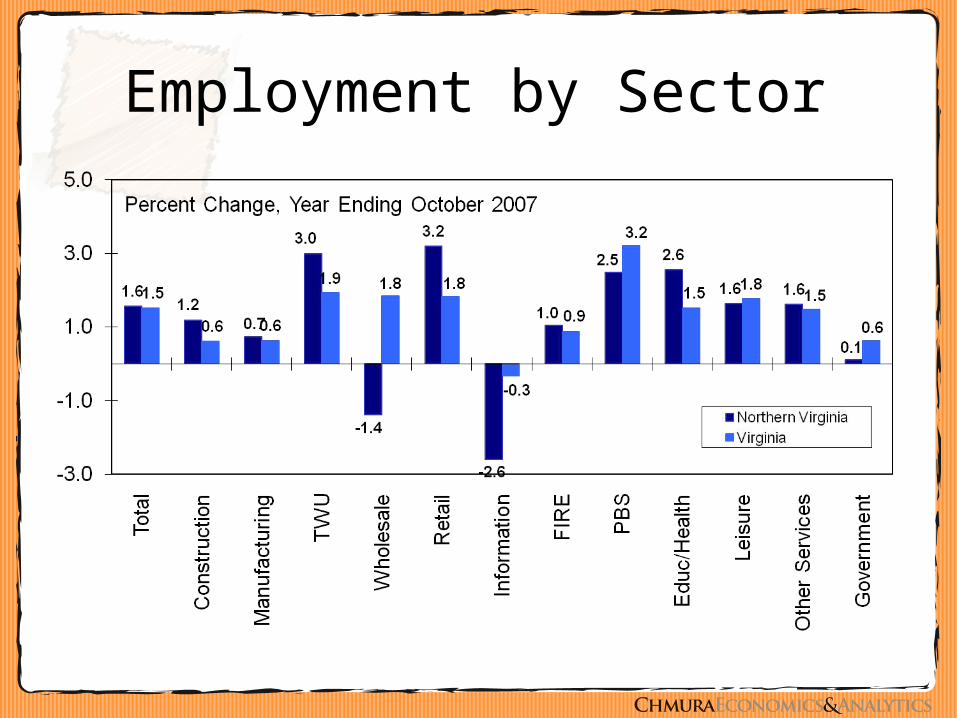
Employment by Sector
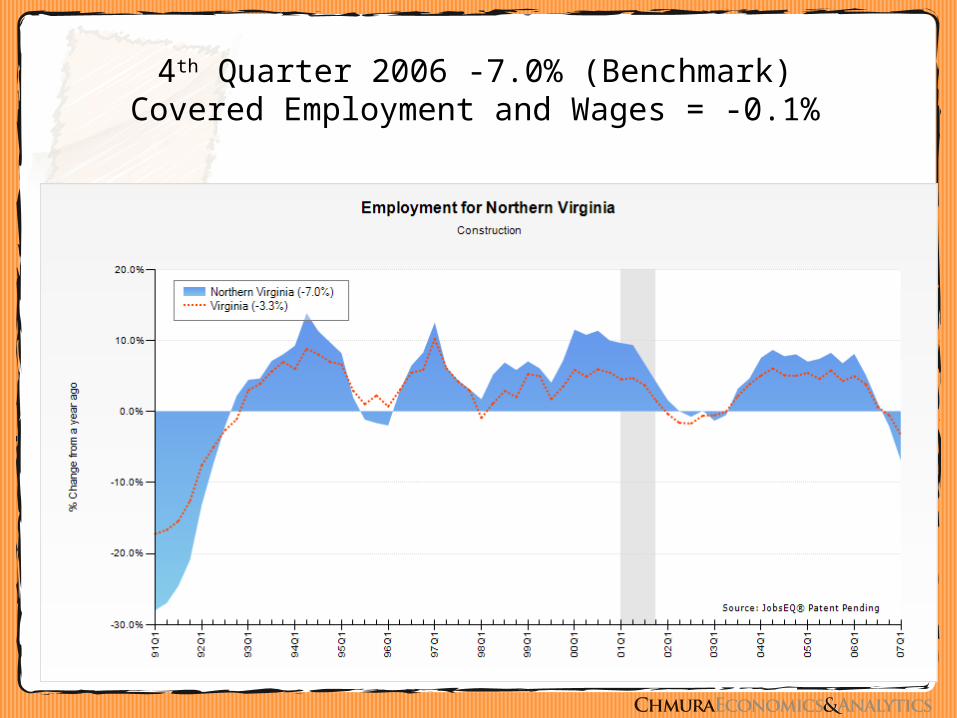
4th Quarter 2006 -7.0% (Benchmark)Covered Employment and Wages = -0.1%
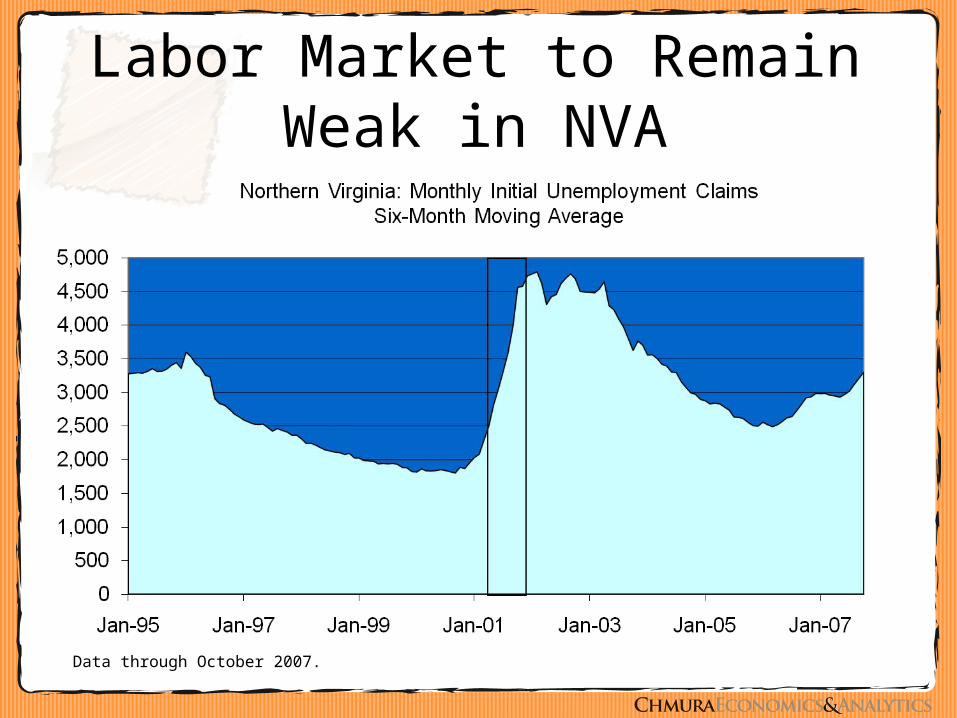
Labor Market to Remain Weak in NVA
Data through October 2007.
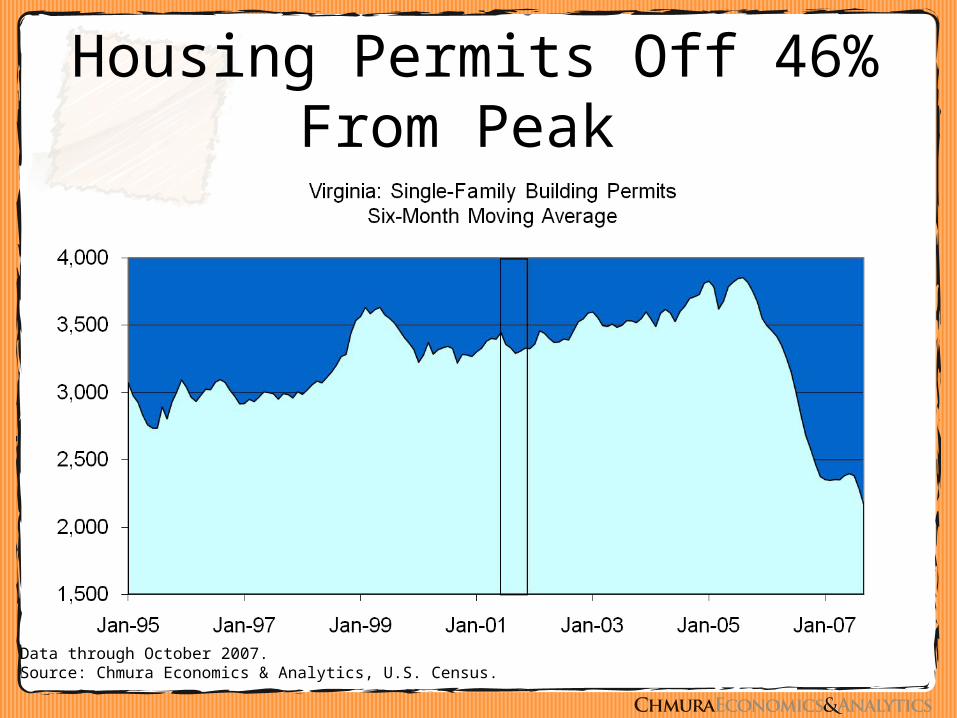
Housing Permits Off 46% From Peak
Data through October 2007.Source: Chmura Economics & Analytics, U.S. Census.
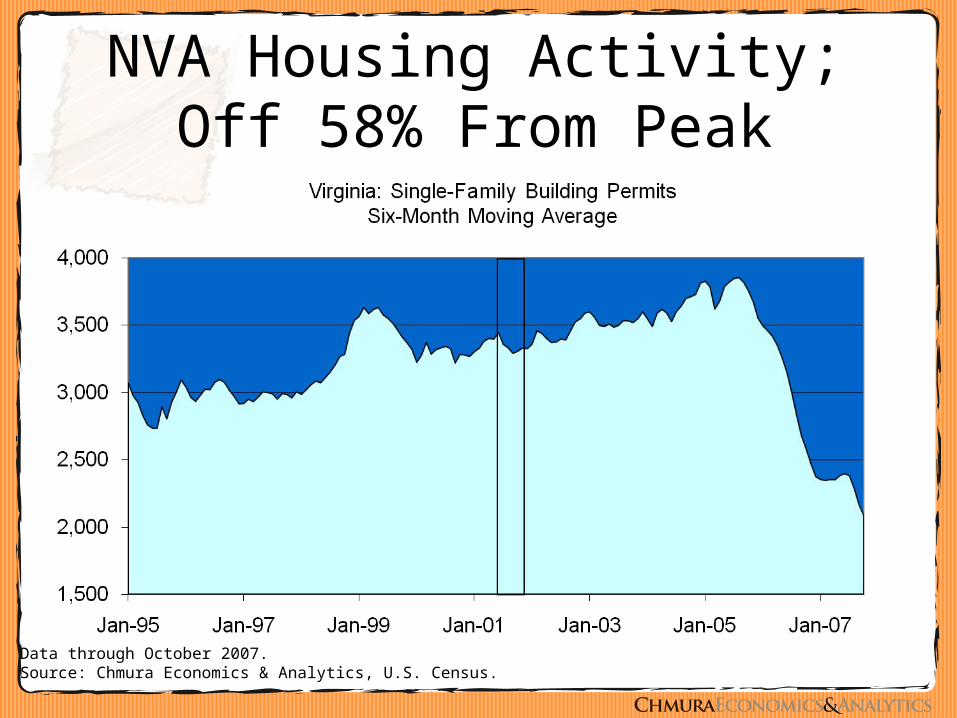
NVA Housing Activity; Off 58% From Peak
Data through October 2007.Source: Chmura Economics & Analytics, U.S. Census.
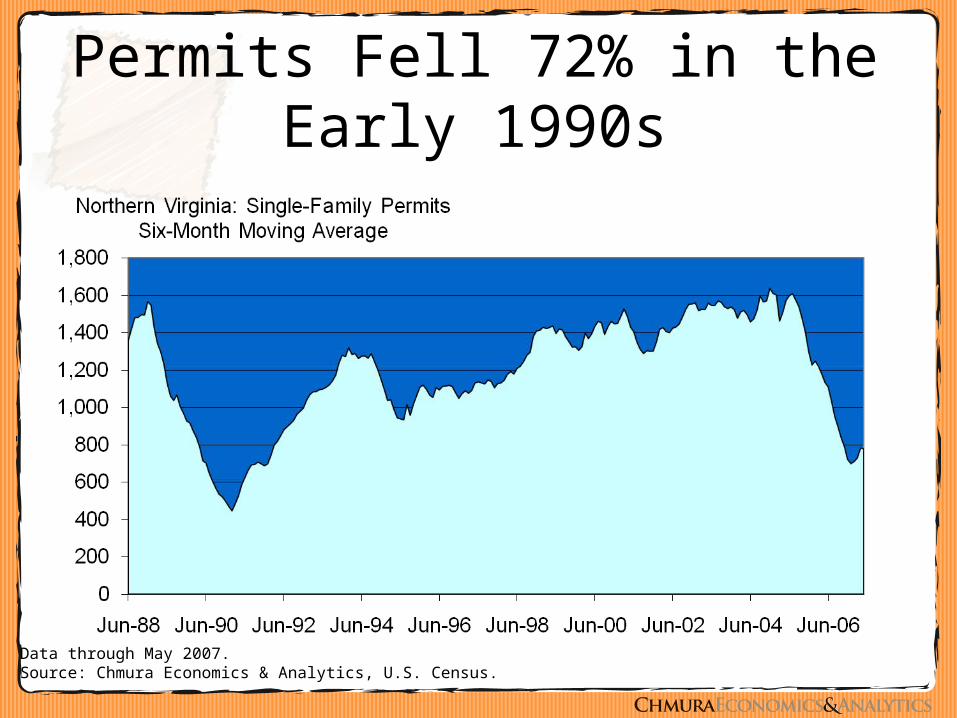
Permits Fell 72% in the Early 1990s
Data through May 2007.Source: Chmura Economics & Analytics, U.S. Census.
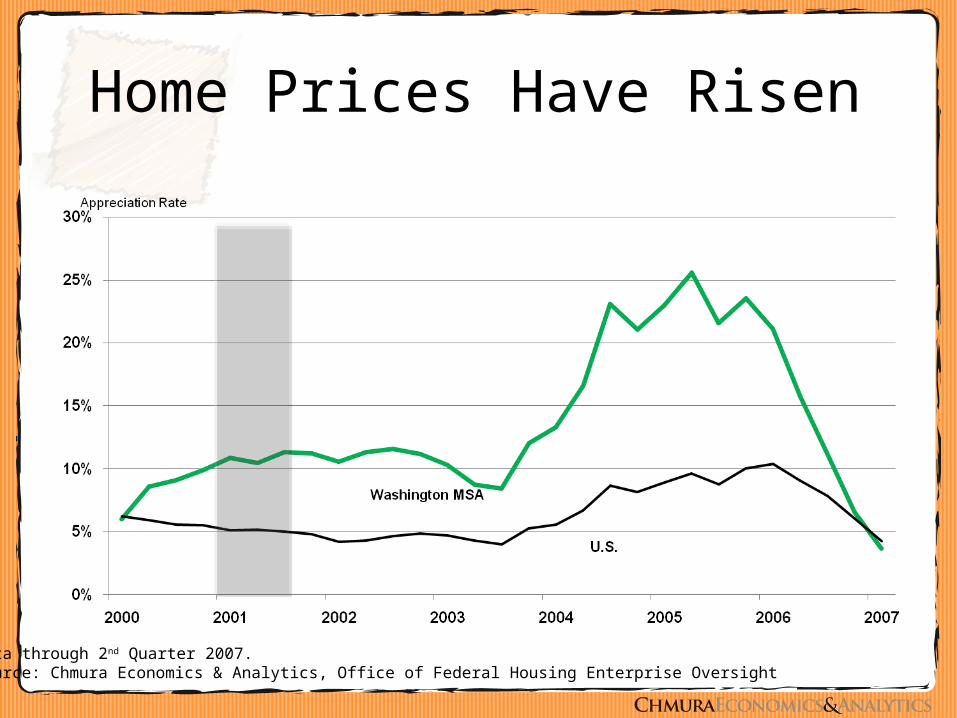
Home Prices Have Risen
Data through 2nd Quarter 2007.Source: Chmura Economics & Analytics, Office of Federal Housing Enterprise Oversight
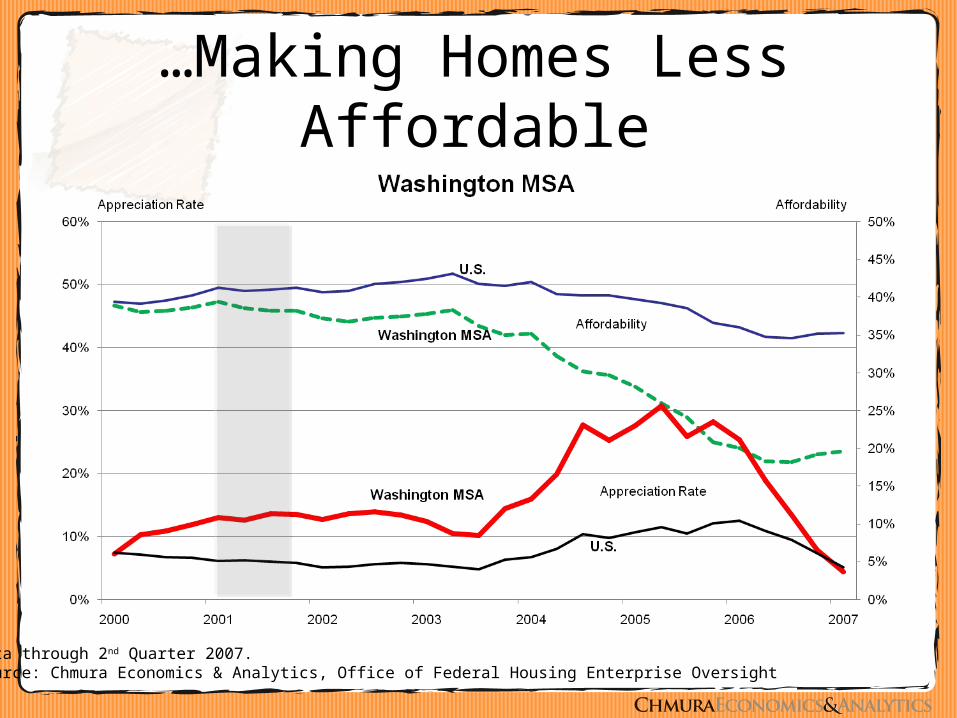
…Making Homes Less Affordable
Data through 2nd Quarter 2007.Source: Chmura Economics & Analytics, Office of Federal Housing Enterprise Oversight
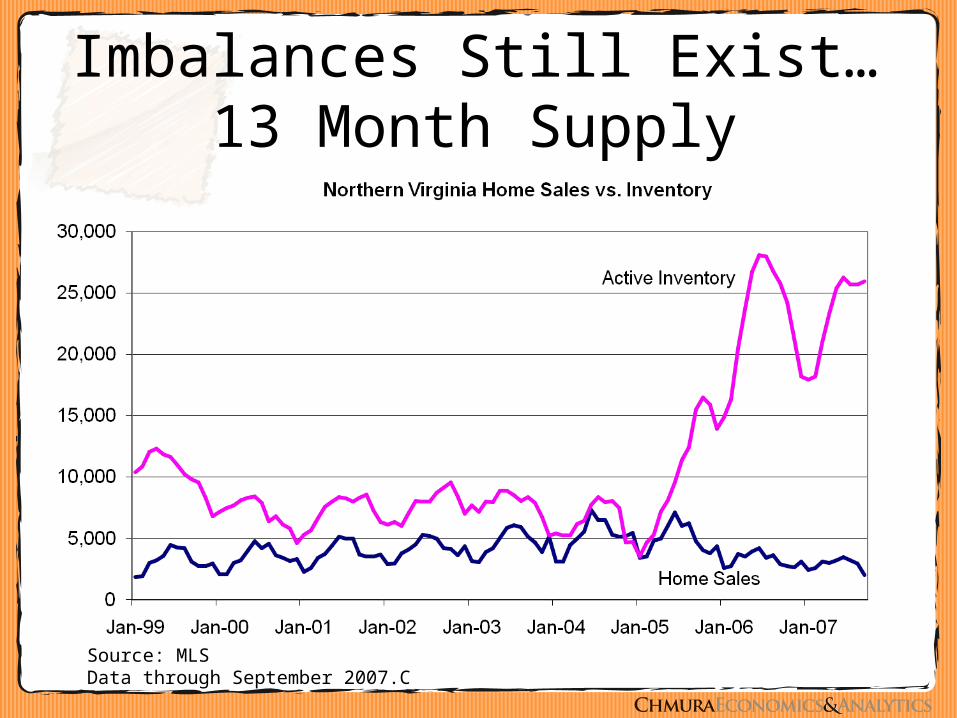
Imbalances Still Exist…13 Month Supply
Source: MLSData through September 2007.C
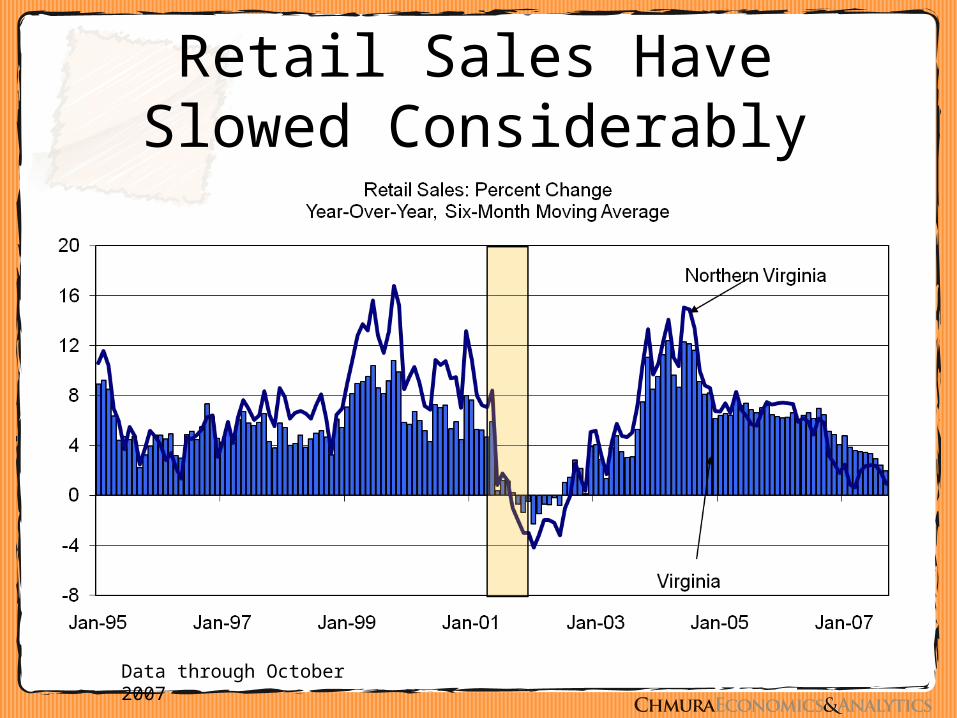
Retail Sales Have Slowed Considerably
Data through October 2007
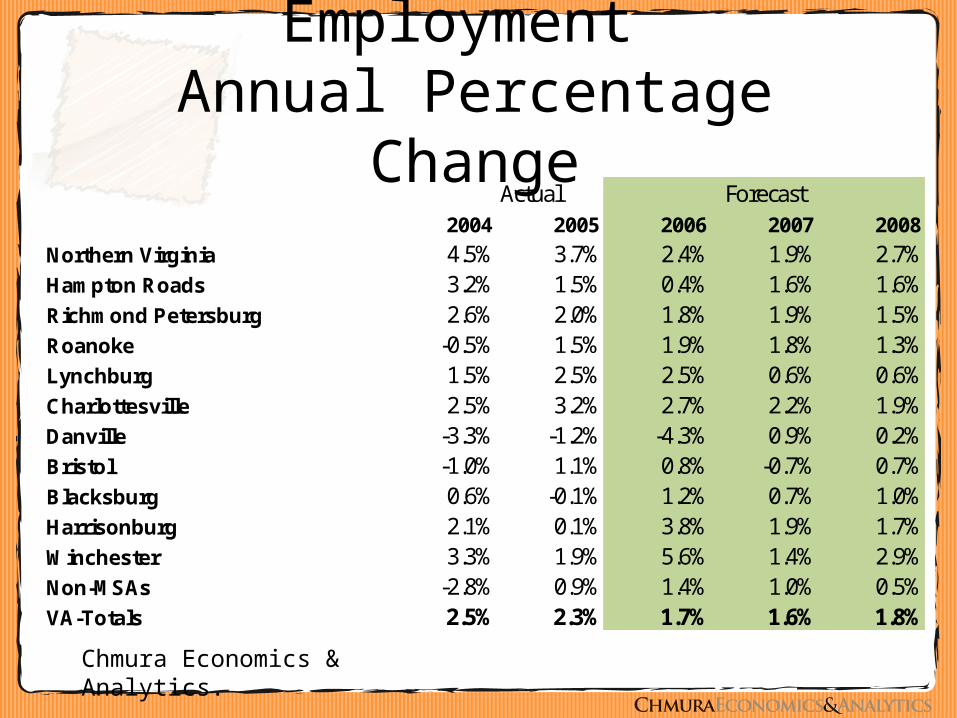
Employment Annual Percentage Change
Actual Forecast2004 2005 2006 2007 2008
Northern Virginia 4.5% 3.7% 2.4% 1.9% 2.7%Hampton Roads 3.2% 1.5% 0.4% 1.6% 1.6%Richmond Petersburg 2.6% 2.0% 1.8% 1.9% 1.5%Roanoke -0.5% 1.5% 1.9% 1.8% 1.3%Lynchburg 1.5% 2.5% 2.5% 0.6% 0.6%Charlottesville 2.5% 3.2% 2.7% 2.2% 1.9%Danville -3.3% -1.2% -4.3% 0.9% 0.2%Bristol -1.0% 1.1% 0.8% -0.7% 0.7%Blacksburg 0.6% -0.1% 1.2% 0.7% 1.0%Harrisonburg 2.1% 0.1% 3.8% 1.9% 1.7%Winchester 3.3% 1.9% 5.6% 1.4% 2.9%Non-MSAs -2.8% 0.9% 1.4% 1.0% 0.5%VA-Totals 2.5% 2.3% 1.7% 1.6% 1.8%
Chmura Economics & Analytics.
40
Take Aways• U.S. growth remains sluggish through first
half of 2008
• No more Fed ease… accelerating inflation is an issue
• Virginia continues at national average
• Construction employment dragging down Northern Virginia employment growth
• Recession not in forecast for early 2008