Embed Size (px)
Citation preview

Thomas G. Dietterich
School of EECS
Oregon State University
Corvallis, Oregon 97331
http://www.eecs.oregonstate.edu/~tgd
Learning and Inference in the Knowledge Plane
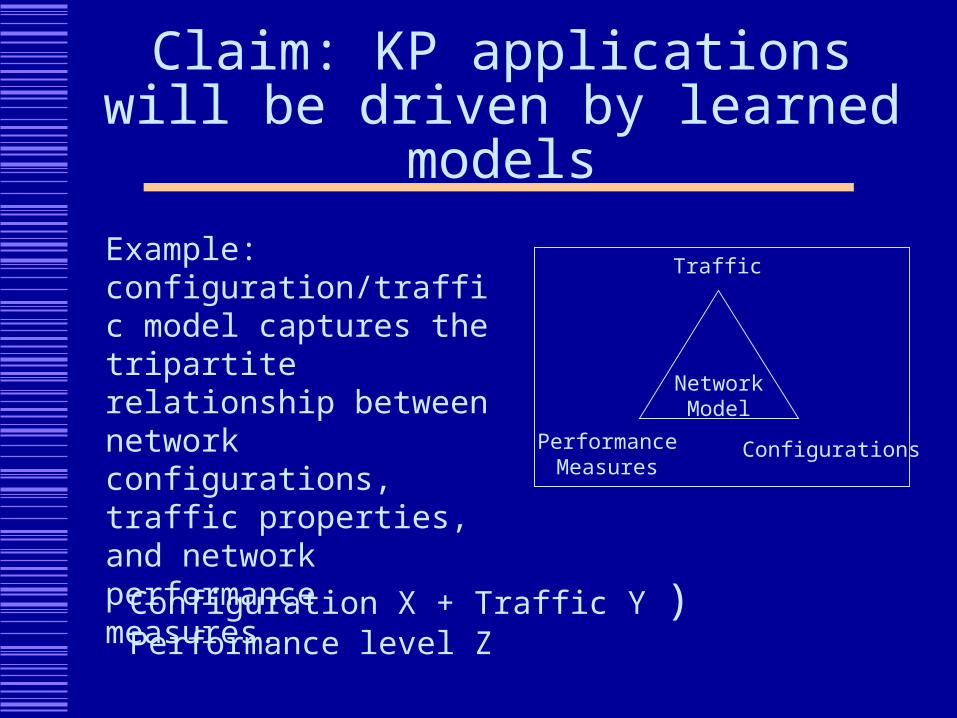
Claim: KP applications will be driven by learned models
NetworkModel
Traffic
ConfigurationsPerformanceMeasures
Example: configuration/traffic model captures the tripartite relationship between network configurations, traffic properties, and network performance measures.
Configuration X + Traffic Y ) Performance level Z
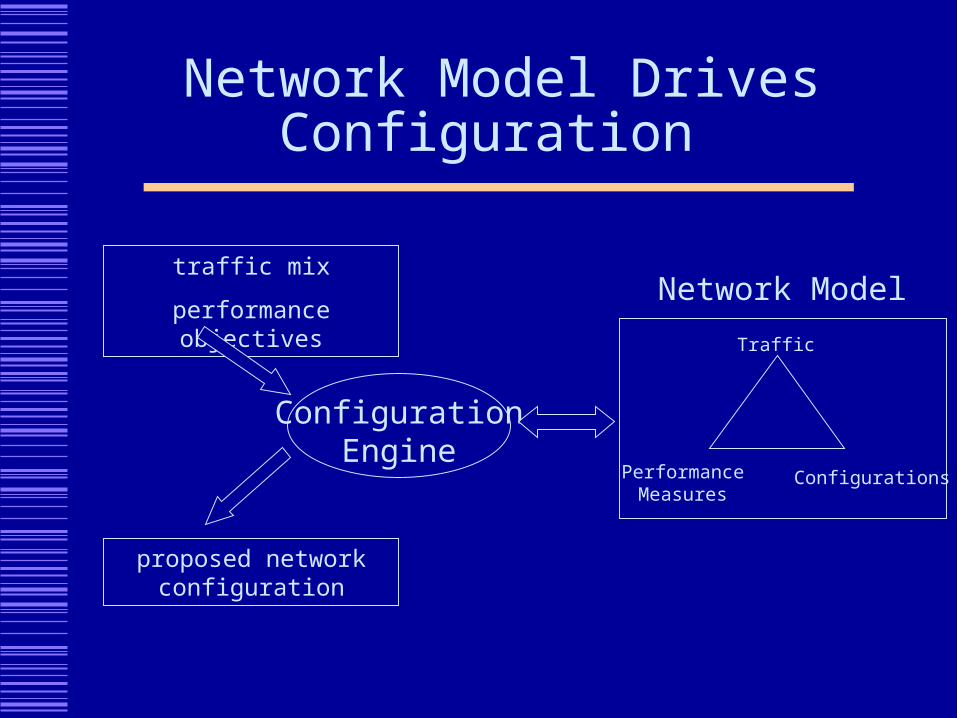
Network Model Drives Configuration
Traffic
ConfigurationsPerformanceMeasures
ConfigurationEngine
traffic mix
performance objectives
proposed network configuration
Network Model
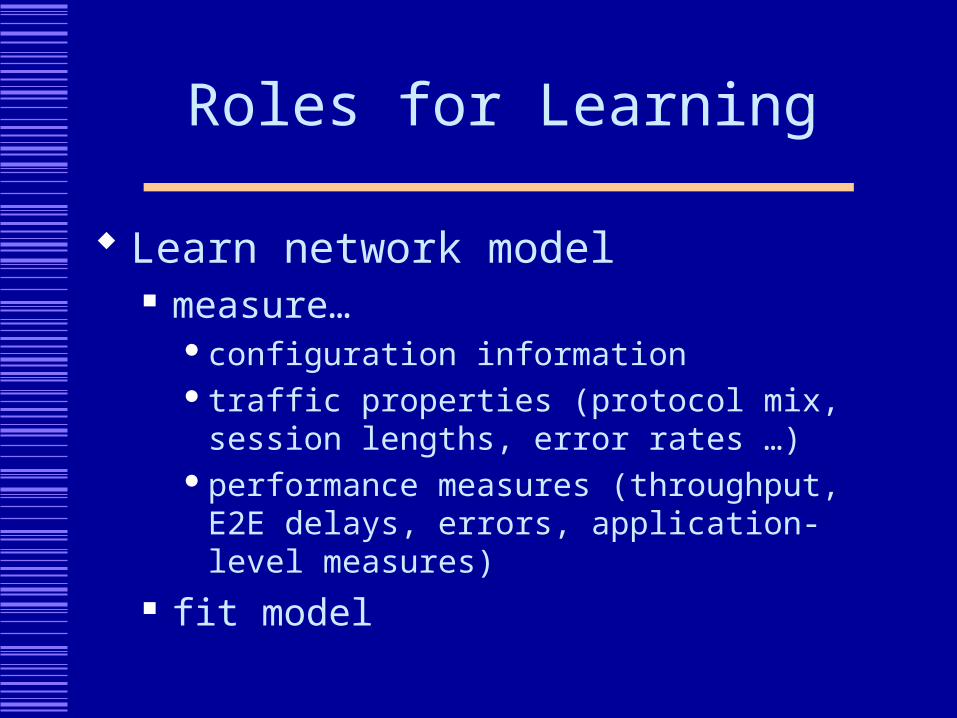
Roles for Learning
Learn network model measure…
configuration information traffic properties (protocol mix, session lengths,
error rates …)performance measures (throughput, E2E delays,
errors, application-level measures) fit model
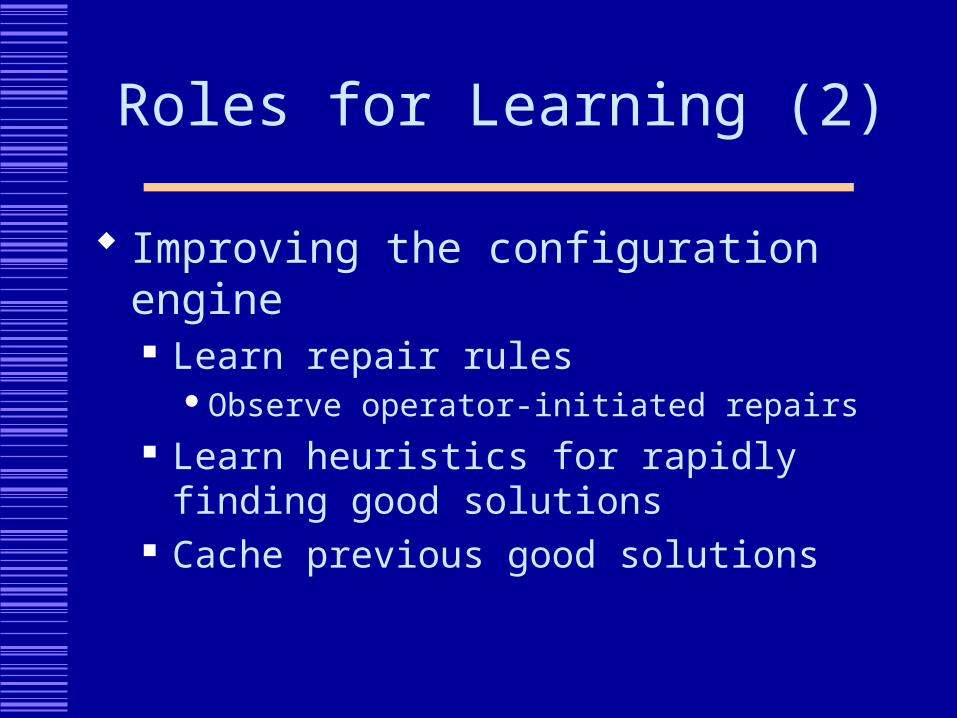
Roles for Learning (2)
Improving the configuration engine Learn repair rules
Observe operator-initiated repairs Learn heuristics for rapidly finding good
solutions Cache previous good solutions
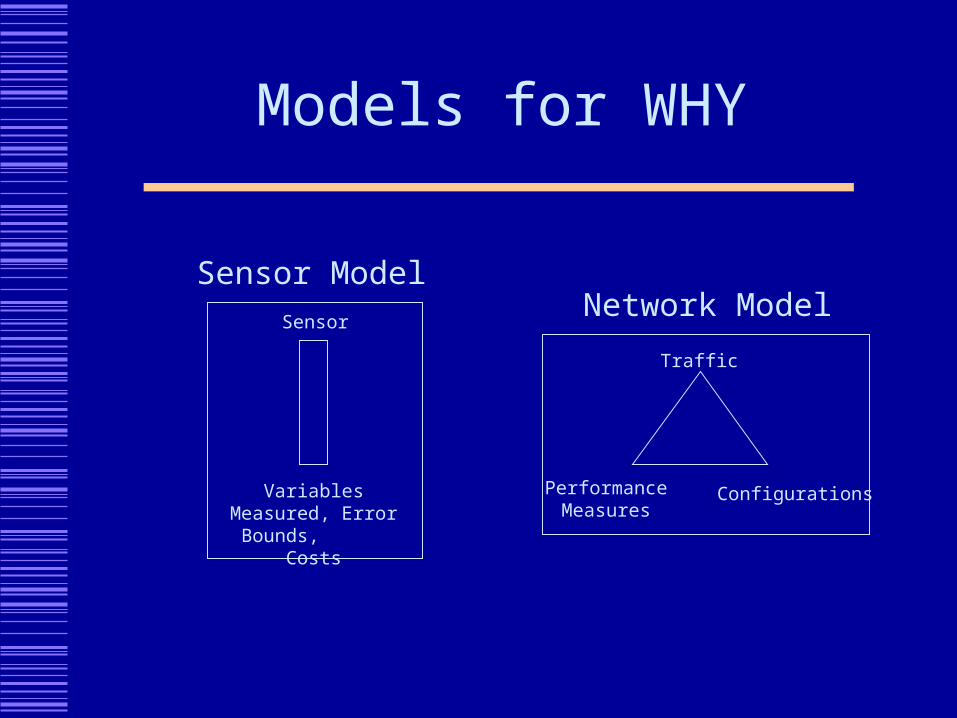
Models for WHY
Traffic
ConfigurationsPerformanceMeasures
Network ModelSensor
Variables Measured, Error Bounds,
Costs
Sensor Model
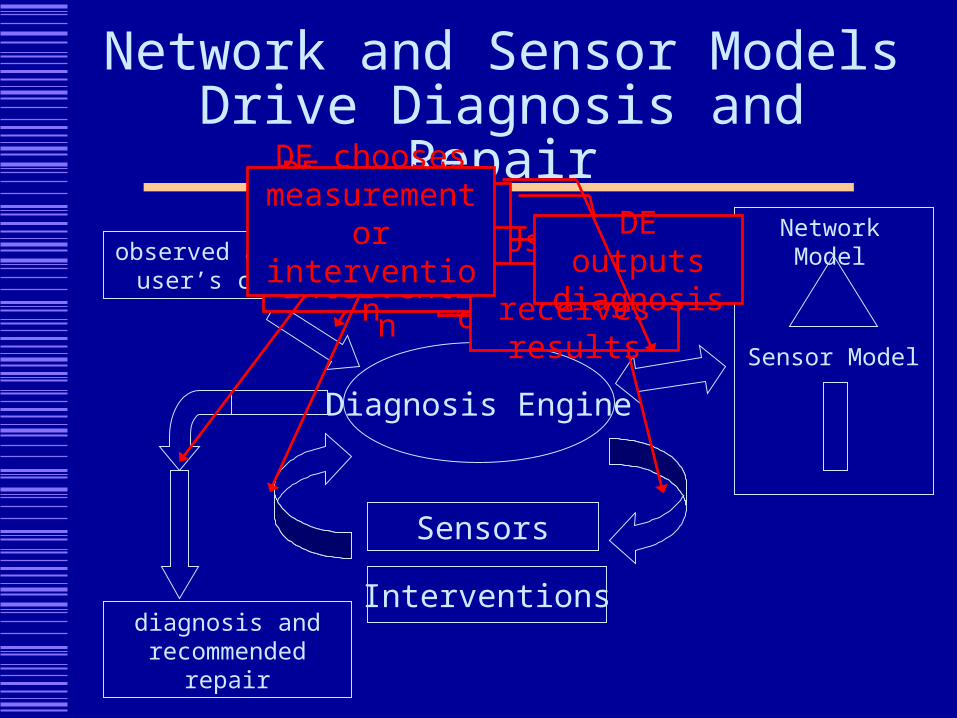
Network and Sensor Models Drive Diagnosis and Repair
Diagnosis Engine
observed anomaly or user’s complaint
Network Model
Sensor Model
Sensors
Interventionsdiagnosis and
recommended repair
User makes complaint
DE executes measurement or interventionDE receives
results
DE outputs diagnosis
DE chooses measurement or intervention
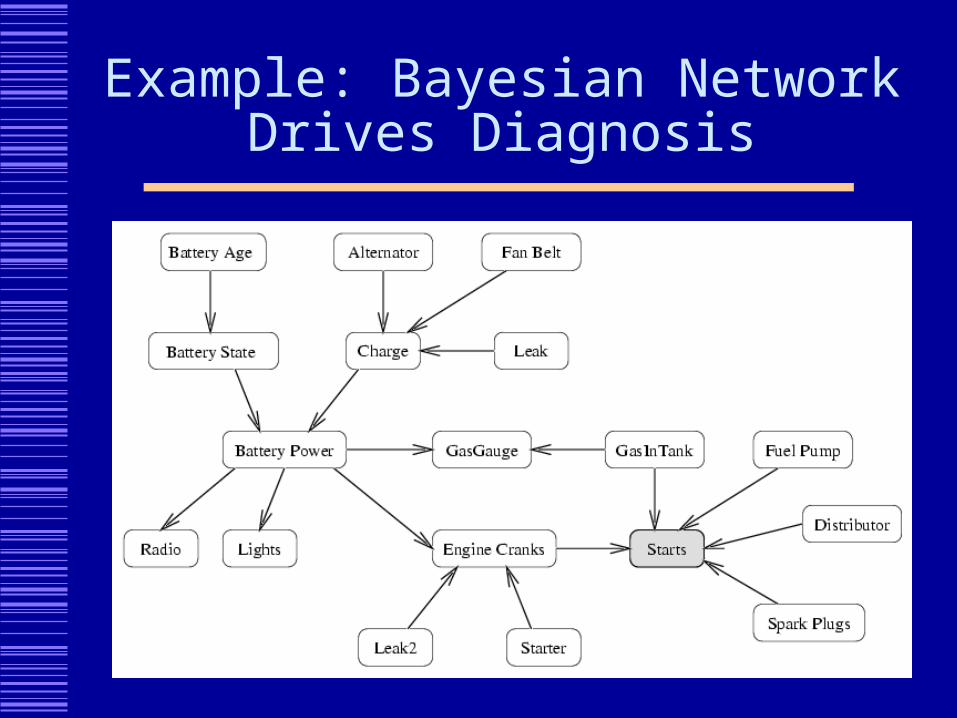
Example: Bayesian Network Drives Diagnosis
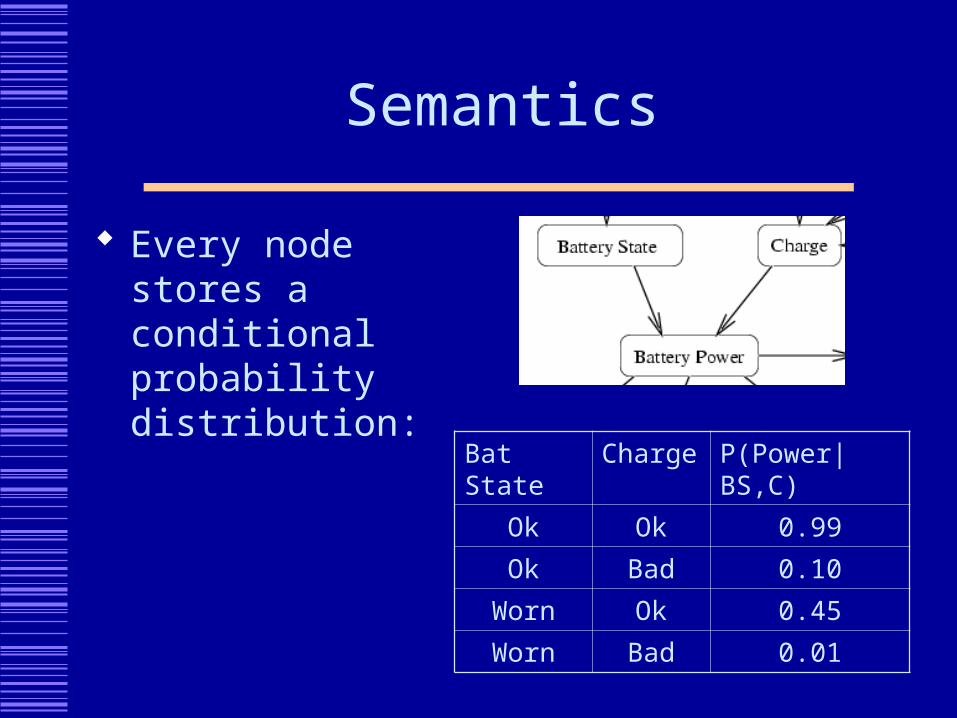
Semantics
Every node stores a conditional probability distribution:
Bat State Charge P(Power|BS,C)
Ok Ok 0.99
Ok Bad 0.10
Worn Ok 0.45
Worn Bad 0.01
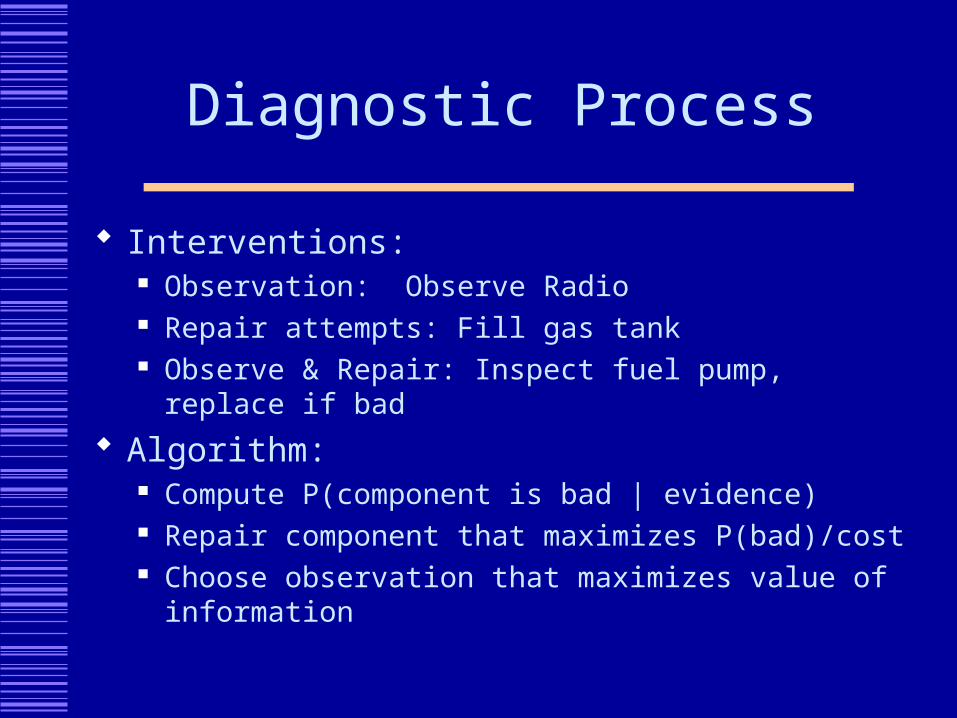
Diagnostic Process
Interventions: Observation: Observe Radio Repair attempts: Fill gas tank Observe & Repair: Inspect fuel pump, replace if bad
Algorithm: Compute P(component is bad | evidence) Repair component that maximizes P(bad)/cost Choose observation that maximizes value of
information
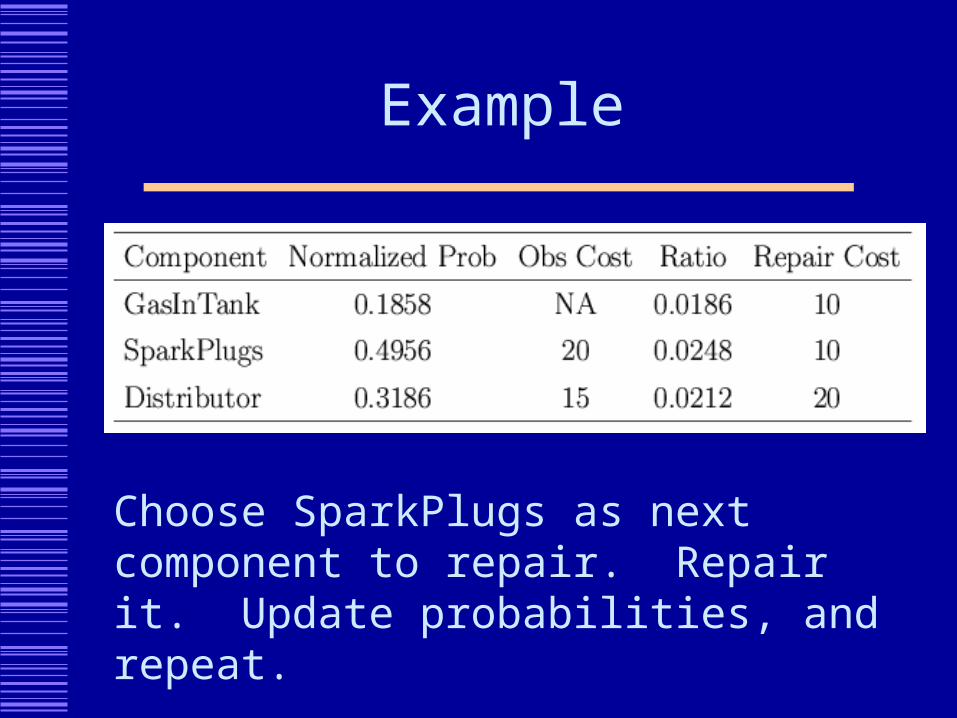
Example
Choose SparkPlugs as next component to repair. Repair it. Update probabilities, and repeat.
Role for Learning
Learn sensor model Basic sensor model is manually engineered Learn error bounds and costs (e.g., time
delay, traffic impact)
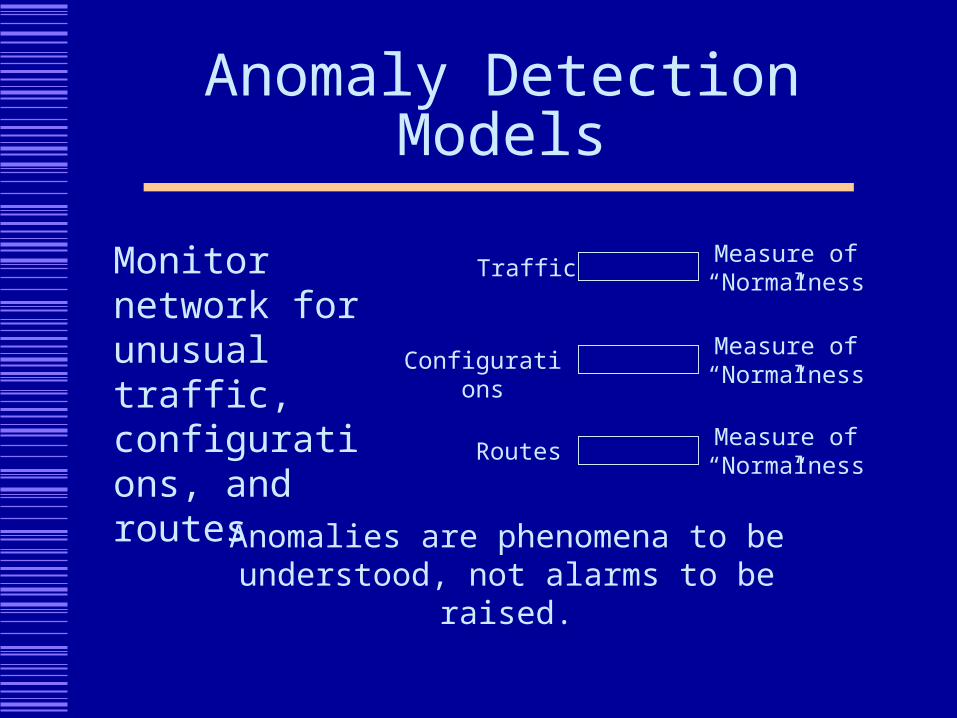
Anomaly Detection Models
TrafficMeasure of
“Normalness”
ConfigurationsMeasure of
“Normalness”
RoutesMeasure of
“Normalness”
Monitor network for unusual traffic, configurations, and routes
Anomalies are phenomena to be understood, not alarms to be raised.
Role for Learning
Learn these models by observing traffic, configurations, routes
Model Properties
Spatially Distributed Replicated/Cached
Hierarchical Multiple levels of abstraction
Constantly Maintained
Available Technology:Configuration Engine
Existing formulations: constraint-satisfaction problems (CSP) with objective function
Systematic and repair-based methods Some ideas for how to incorporate
learning
Available Technology (2):Diagnostic Engine
Special cases where optimal diagnosis is tractable Single fault; all actions are repair attempts Single fault; all actions are pure observations
Widely-used heuristic One-step value of information (greedy approx)
Fully-general approach Partially-observable Markov Decision Process Some approximation algorithms are available
Available Technology (3): Anomaly Detection
Unsupervised Learning Methods Clustering Probability Density Estimation One-class Classification Formulation
Research Gaps (1): Spatially-distributed multi-level
models of traffic What are the right variables to model?
Packet-level statistics (RTT, throughput, jitter, …) Connection-level statistics Routing statistics Application statistics
What levels reveal anomalies? What levels can best be related to
performance goals and configuration settings?
Research Gaps (2): Learning models of configurations
Network components Switches, routers, firewalls, web servers, file
servers, wireless access points, …
LANs and WANs Autonomous Systems What are the right levels of abstraction? Can these things be observed?
Research Gaps (3): Relational learning
Network models are relational (traffic, configuration, performance) network structure is a graph routes are paths with attached properties
Relational modeling is a relatively young area of ML
Research Gaps (4): Distributed learning and reasoning
Distributed model construction Bottom-up summary statistics (easy) Mixed (bottom-up/top-down) information flow
(unexplored) Essential for higher-level modeling Opportunities for data sharing at lower levels
Distributed configuration Distributed diagnosis
Opportunities for inference sharing
Research Gap (5):Openness
Standard AI Models assume a fixed set of classes/categories/faults/components
How do we reason about the possible existence of new classes, new components, new protocols (including intrusions/worms)?
How do we evaluate such systems?
Application/Model Interface
Subscription? Applications subscribe to regular model
updates/summaries Applications specify the models they want
the KP to build/maintain
Query? Applications make queries to models?
Application/KP Interface: Two possibilities
KP provides inference services in addition to model services WHY? client sends end-user complaint to TP where
inference engine operates
Inference is performed on end-user machine? WHY? client does inference, just sends queries to
TPs Some inference about end-user’s machine needs to
happen locally. Maybe view as local TP?
Concluding Remarks
KP Applications will be driven by learned models traffic models sensor models models of “normalness”
Models are acquired by mix of human authoring and machine learning
Main research challenges arise from multiple levels of abstraction and world-wide distribution
KP support for learning models
Example: HP Labs email loop detection system Bronstein, Das, Duro, Friedrich, Kleyner, Mueller,
Singhal, Cohen (2001) Convert mail log data into four “detectors” and
combine using a Bayesian network
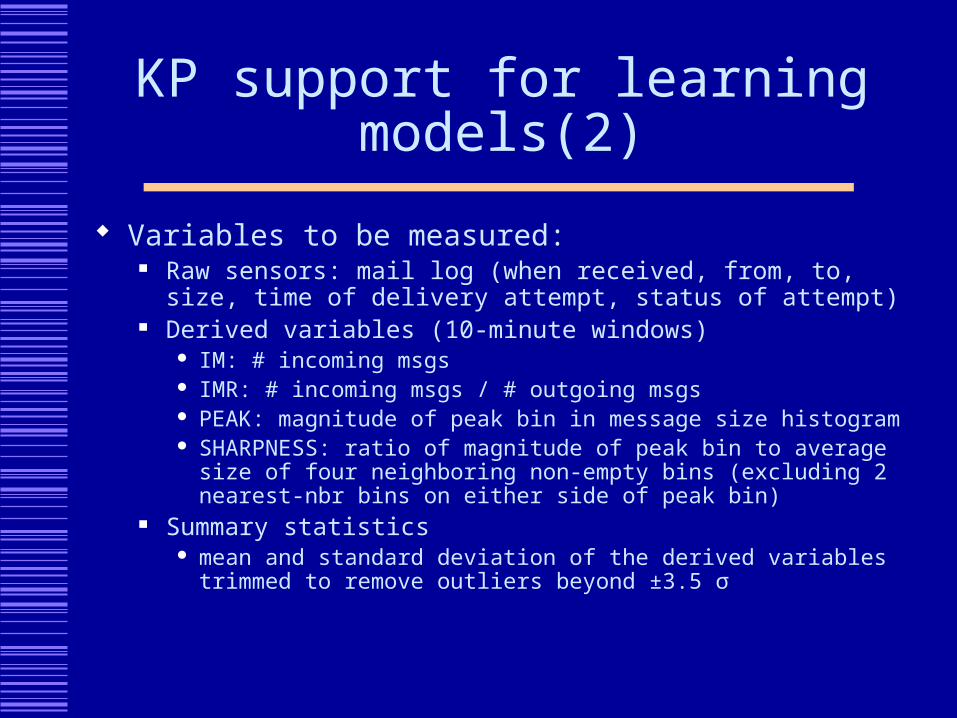
KP support for learning models(2)
Variables to be measured: Raw sensors: mail log (when received, from, to, size, time of
delivery attempt, status of attempt) Derived variables (10-minute windows)
IM: # incoming msgs IMR: # incoming msgs / # outgoing msgs PEAK: magnitude of peak bin in message size histogram SHARPNESS: ratio of magnitude of peak bin to average size of
four neighboring non-empty bins (excluding 2 nearest-nbr bins on either side of peak bin)
Summary statistics mean and standard deviation of the derived variables trimmed to
remove outliers beyond ±3.5 σ
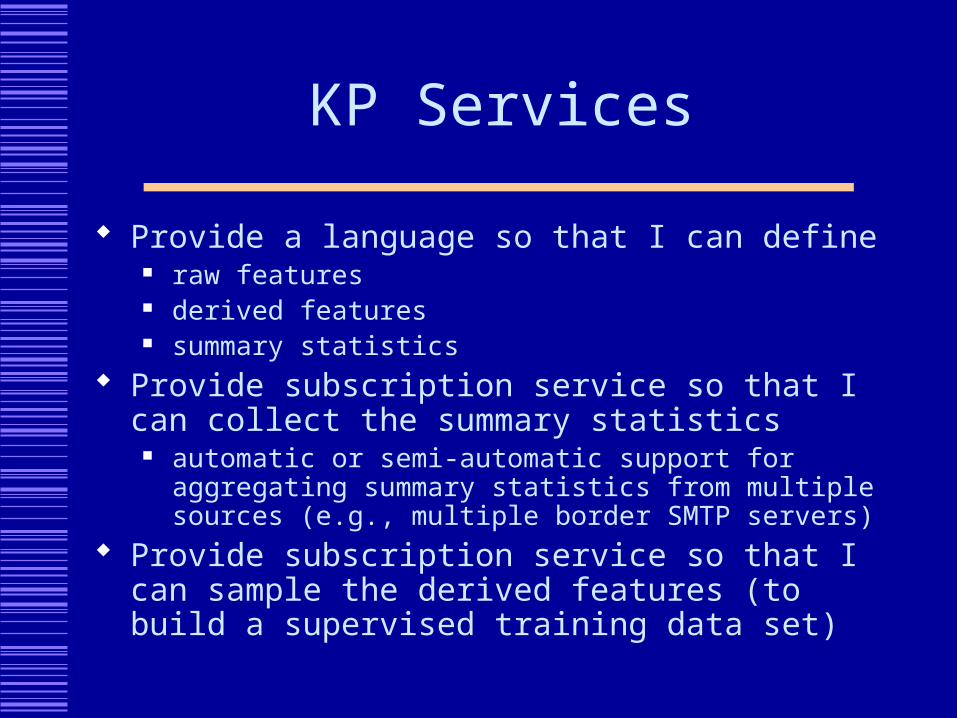
KP Services
Provide a language so that I can define raw features derived features summary statistics
Provide subscription service so that I can collect the summary statistics
automatic or semi-automatic support for aggregating summary statistics from multiple sources (e.g., multiple border SMTP servers)
Provide subscription service so that I can sample the derived features (to build a supervised training data set)
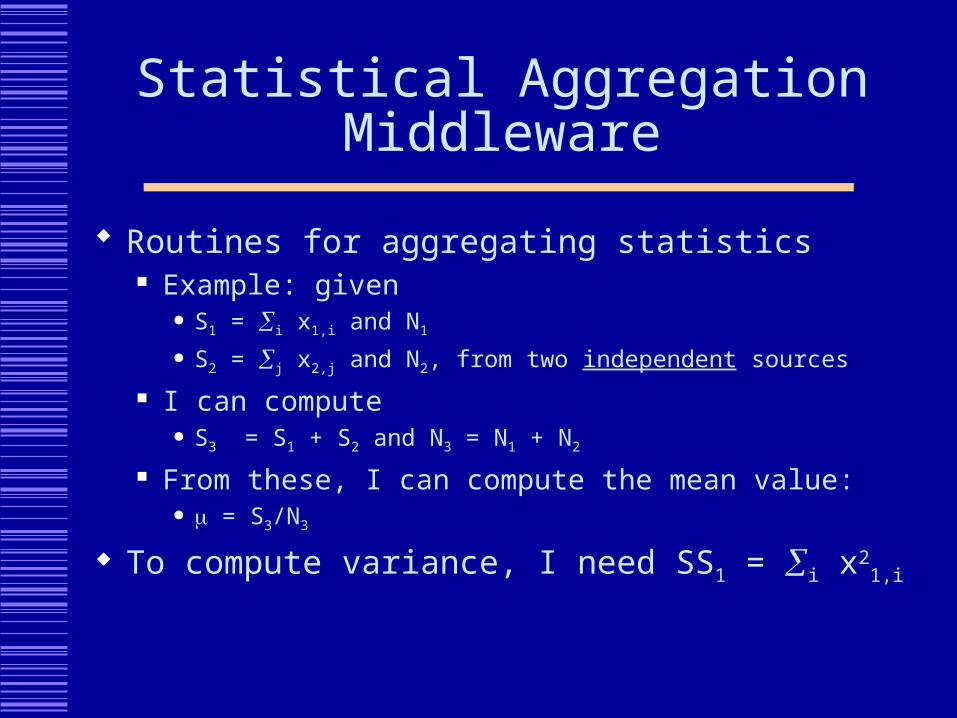
Statistical Aggregation Middleware
Routines for aggregating statistics Example: given
S1 = i x1,i and N1
S2 = j x2,j and N2, from two independent sources
I can compute S3 = S1 + S2 and N3 = N1 + N2
From these, I can compute the mean value: = S3/N3
To compute variance, I need SS1 = i x21,i
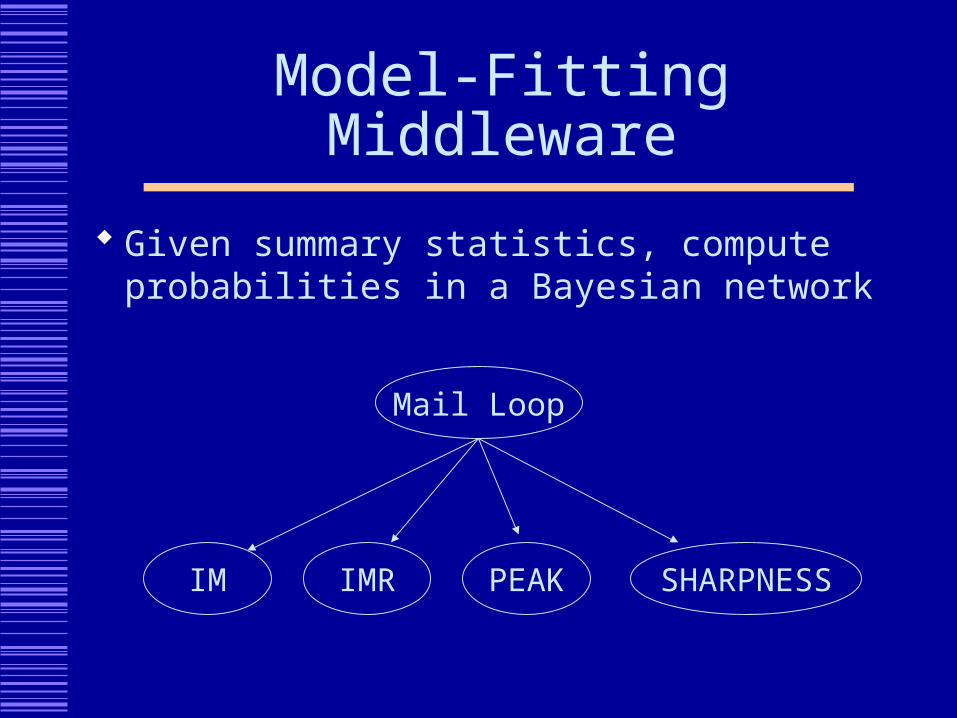
Model-Fitting Middleware
Given summary statistics, compute probabilities in a Bayesian network
Mail Loop
IM IMR PEAK SHARPNESS
Sufficient Statistics
Andrew Moore (CMU): For nearly every learning algorithm, there is a set of statistics sufficient to permit that algorithm to fit its models
There is usually a scalable way of collecting and aggregating these sufficient statistics
One KP Goal
Design the services for defining sensors, defining derived variables, defining sufficient statistics, and defining aggregation methods
Scalable, secure, etc.
Hierarchical Modeling
Abstract (or aggregate) model could treat conclusions/assertions of other models as input variables
“One model’s inference is another model’s raw data” probably requires associated meta-data:
provenance, age of original data major issue: assessing the independence of
multiple data sources (don’t want to double-count evidence): requires knowledge of KP/network topology
Fusing Multiple Subscriptions
Multiple KPs and/or multiple KPapps may register for the same sufficient statistics
Fuse their subscriptions to save computation
Keep meta data on non-independence