Embed Size (px)
Citation preview
Paste 2017, Beijing, China 66
Thixotropic behavior of paste
Aixiang Wu University of Science and Technology Beijing, China
Haiyong Cheng University of Science and Technology Beijing, China
Ying Yang University of Science and Technology Beijing, China
Abstract
Structure fluid can be broken under shear and rebuilt at the static state because of its thixotropy. The
thixotropic behavior of paste slurry in transportation causes a continuous decrease of yield stress and plastic
viscosity with time. There is no generally accepted method to measure the thixotropy of paste materials. In
this paper, the curve of rheological properties was divided into three parts based on the rheological behavior,
and a number of problems were identified using the thixotropy loops measurement to characterize the
thixotropy of cement paste. Stress relaxation was considered and the variation of shear stress with time under
a constant shear rate was also measured, establishing a yield stress prediction model and plastic viscosity
prediction model after considering aspects of paste materials. The total thixotropic time was found to have
no relevance to shear rate. Due to paste thixotropy, shear flow area increased and plunger flow area
decreased over time and eventually stablized. According to the difficulty level, a standard which divides
transportation into different stages was first proposed.
1 Introduction
Fluid thixotropy refers to the phenomenon where shear stress decreases with time under given shear rate
and temperature conditions (Barnes, 1997). Using electron microscopy at high magnification, floc structures
are found in fine particle slurry (Dullaert and Mewis, 2006). Due to their weak connection, structures under
external force are prone to breaking (Liu et al., 2014). However, without the external force, they are also easy
to rebuilt (Roussel, 2006). In a rheological test of unclassified-tailing paste filling material in Jinchuan, Wang
found a significant thixotropic phenomenon (Liu et al., 2012). In the study of the rheological properties of
high concentration red mud, Nguyen found that the viscosity of the slurry decreased with the shear time and
finally stabilized (Usui, 1995). In the study of fine particles of slurry, Han Wenliang found a significant stress
relaxation phenomenon (Wu et al., 2013).
2 Analysis method of thixotropic properties
The thixotropic properties of paste are affected by shear rate and time (Roussel et al., 2012), both of which
are key to accurately evaluating the thixotropic properties of paste (Møller et al., 2006). With no standard
method for thixotropic determination (Abebe and Lohaus, 2017), some researchers used thixotropy loop to
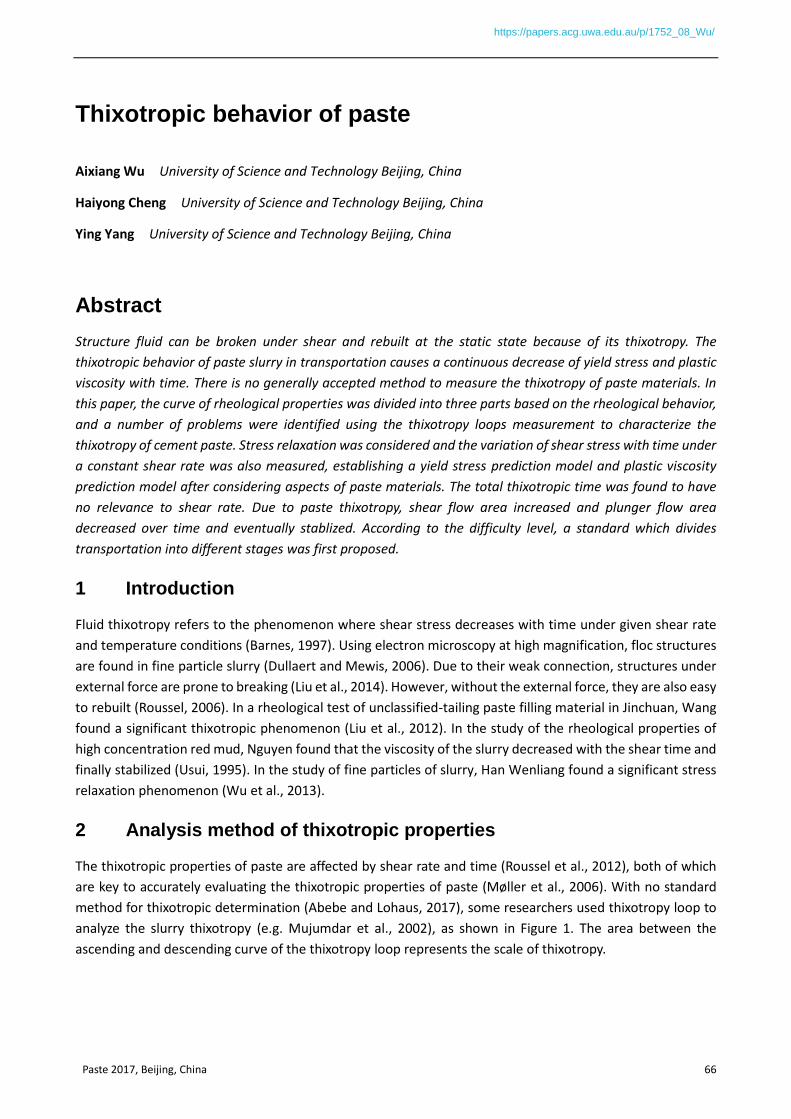
analyze the slurry thixotropy (e.g. Mujumdar et al., 2002), as shown in Figure 1. The area between the
ascending and descending curve of the thixotropy loop represents the scale of thixotropy.
https://papers.acg.uwa.edu.au/p/1752_08_Wu/
67 Paste 2017, Beijing, China
(a)
(b)
Figure 1 Diagram of thixotropy loop experiments; (a) setting program of thixotropy loop; (b) thixotropy loop
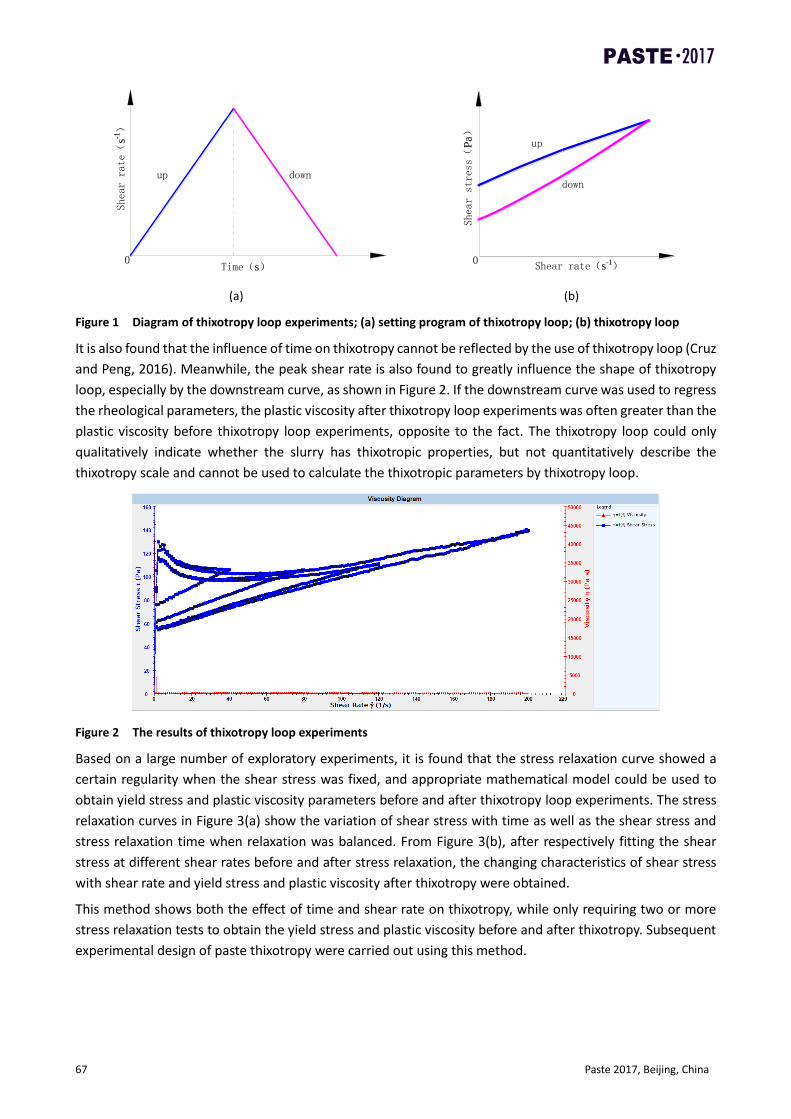
It is also found that the influence of time on thixotropy cannot be reflected by the use of thixotropy loop (Cruz
and Peng, 2016). Meanwhile, the peak shear rate is also found to greatly influence the shape of thixotropy
loop, especially by the downstream curve, as shown in Figure 2. If the downstream curve was used to regress
the rheological parameters, the plastic viscosity after thixotropy loop experiments was often greater than the
plastic viscosity before thixotropy loop experiments, opposite to the fact. The thixotropy loop could only
qualitatively indicate whether the slurry has thixotropic properties, but not quantitatively describe the
thixotropy scale and cannot be used to calculate the thixotropic parameters by thixotropy loop.
Figure 2 The results of thixotropy loop experiments
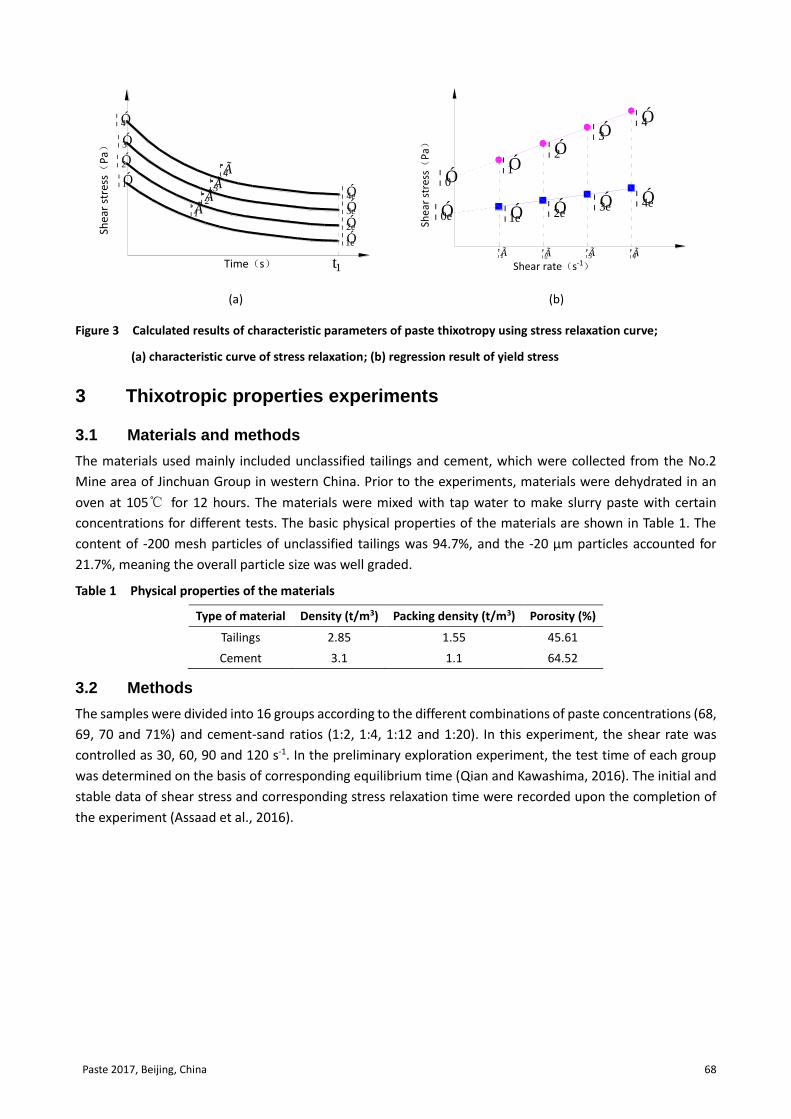
Based on a large number of exploratory experiments, it is found that the stress relaxation curve showed a
certain regularity when the shear stress was fixed, and appropriate mathematical model could be used to
obtain yield stress and plastic viscosity parameters before and after thixotropy loop experiments. The stress
relaxation curves in Figure 3(a) show the variation of shear stress with time as well as the shear stress and
stress relaxation time when relaxation was balanced. From Figure 3(b), after respectively fitting the shear
stress at different shear rates before and after stress relaxation, the changing characteristics of shear stress
with shear rate and yield stress and plastic viscosity after thixotropy were obtained.
This method shows both the effect of time and shear rate on thixotropy, while only requiring two or more
stress relaxation tests to obtain the yield stress and plastic viscosity before and after thixotropy. Subsequent
experimental design of paste thixotropy were carried out using this method.
Time(s)
Shear rate(
s-1)
0
up down
0
up
down
Shear rate(s-1)
Shear stress(
Pa)
Paste 2017, Beijing, China 68
(a)
(b)
Figure 3 Calculated results of characteristic parameters of paste thixotropy using stress relaxation curve;
(a) characteristic curve of stress relaxation; (b) regression result of yield stress
3 Thixotropic properties experiments
3.1 Materials and methods
The materials used mainly included unclassified tailings and cement, which were collected from the No.2
Mine area of Jinchuan Group in western China. Prior to the experiments, materials were dehydrated in an
oven at 105℃ for 12 hours. The materials were mixed with tap water to make slurry paste with certain
concentrations for different tests. The basic physical properties of the materials are shown in Table 1. The
content of -200 mesh particles of unclassified tailings was 94.7%, and the -20 μm particles accounted for
21.7%, meaning the overall particle size was well graded.
Table 1 Physical properties of the materials
Type of material Density (t/m3) Packing density (t/m3) Porosity (%)
Tailings 2.85 1.55 45.61
Cement 3.1 1.1 64.52
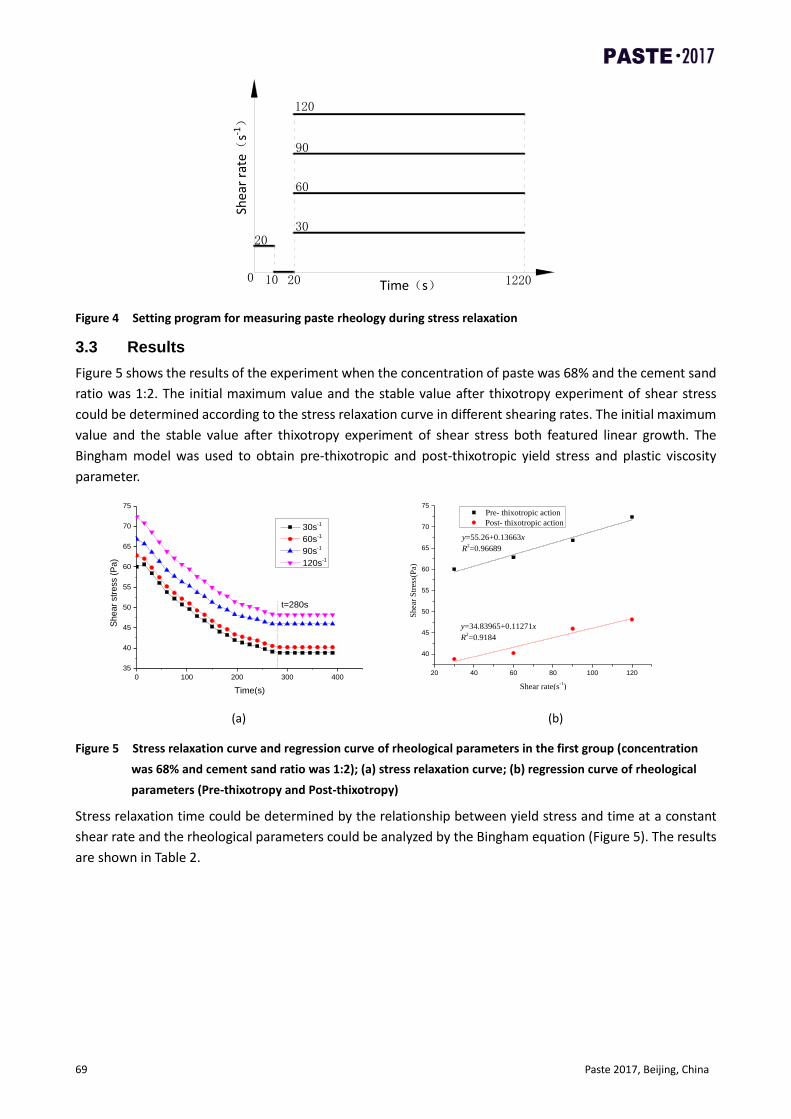
3.2 Methods
The samples were divided into 16 groups according to the different combinations of paste concentrations (68,
69, 70 and 71%) and cement-sand ratios (1:2, 1:4, 1:12 and 1:20). In this experiment, the shear rate was
controlled as 30, 60, 90 and 120 s-1. In the preliminary exploration experiment, the test time of each group
was determined on the basis of corresponding equilibrium time (Qian and Kawashima, 2016). The initial and
stable data of shear stress and corresponding stress relaxation time were recorded upon the completion of
the experiment (Assaad et al., 2016).
Time(s)
Shea
r st
ress(
Pa)
¦Ã4¦Ã3
¦Ã2¦Ã1
¦ Ó4
t1
¦ Ó3
¦ Ó2
¦ Ó1¦ Ó4e
¦ Ó3e
¦ Ó2e
¦ Ó1e
Shear rate(s-1)
Shea
r st
ress(
Pa)
¦ Ó0
¦ Ó0e
¦Ã1 ¦Ã2 ¦Ã3 ¦Ã4
¦ Ó4
¦ Ó4e
¦ Ó3
¦ Ó3e
¦ Ó2
¦ Ó2e
¦ Ó1
¦ Ó1e
69 Paste 2017, Beijing, China
Figure 4 Setting program for measuring paste rheology during stress relaxation
3.3 Results
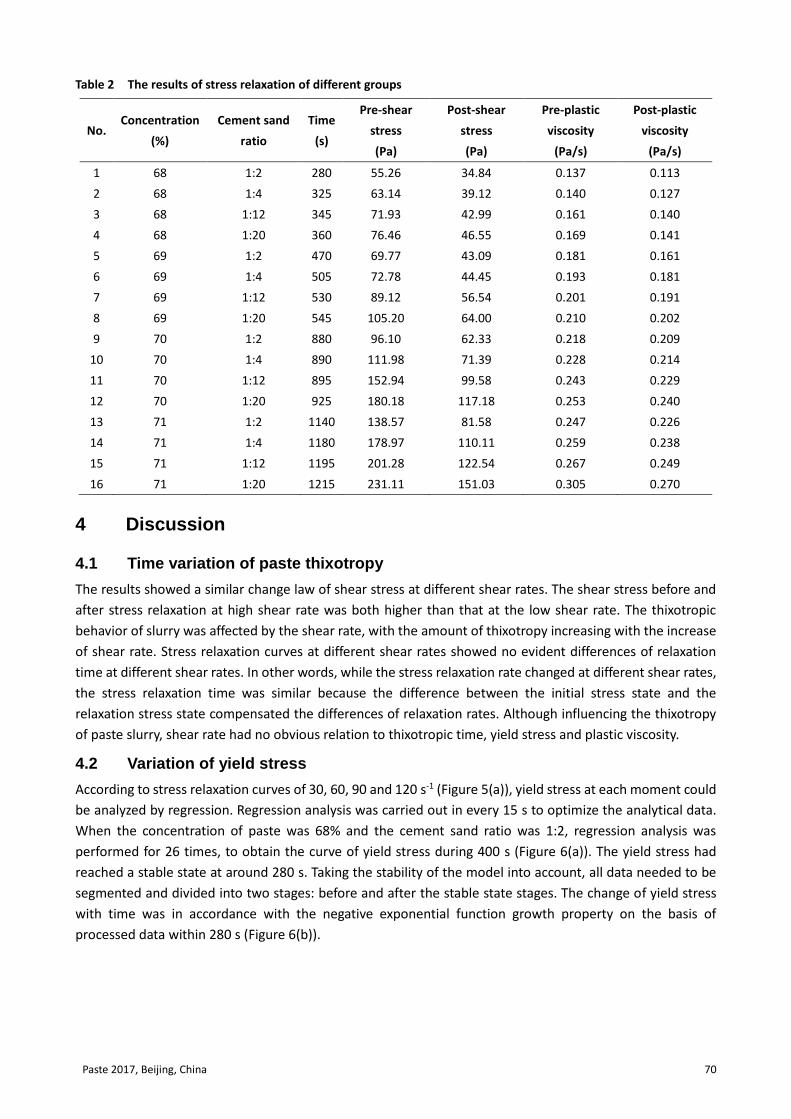
Figure 5 shows the results of the experiment when the concentration of paste was 68% and the cement sand
ratio was 1:2. The initial maximum value and the stable value after thixotropy experiment of shear stress
could be determined according to the stress relaxation curve in different shearing rates. The initial maximum
value and the stable value after thixotropy experiment of shear stress both featured linear growth. The
Bingham model was used to obtain pre-thixotropic and post-thixotropic yield stress and plastic viscosity
parameter.
0 100 200 300 400
35
40
45
50
55
60
65
70
75
Shear
str
ess (
Pa)
Time(s)
30s-1
60s-1
90s-1
120s-1
t=280s
20 40 60 80 100 120
40
45
50
55
60
65
70
75
y=34.83965+0.11271x
R2=0.9184
Shea
r S
tres
s(P
a)
Shear rate(s-1)
Pre- thixotropic action
Post- thixotropic action
y=55.26+0.13663x
R2=0.96689
(a) (b)
Figure 5 Stress relaxation curve and regression curve of rheological parameters in the first group (concentration
was 68% and cement sand ratio was 1:2); (a) stress relaxation curve; (b) regression curve of rheological
parameters (Pre-thixotropy and Post-thixotropy)
Stress relaxation time could be determined by the relationship between yield stress and time at a constant
shear rate and the rheological parameters could be analyzed by the Bingham equation (Figure 5). The results
are shown in Table 2.
Time(s)
Shea
r ra
te(
s-1)
1220200
30
60
90
120
20
10
Paste 2017, Beijing, China 70
Table 2 The results of stress relaxation of different groups
No. Concentration
(%)
Cement sand
ratio
Time
(s)
Pre-shear
stress
Post-shear
stress
Pre-plastic
viscosity
Post-plastic
viscosity
(Pa) (Pa) (Pa/s) (Pa/s)
1 68 1:2 280 55.26 34.84 0.137 0.113
2 68 1:4 325 63.14 39.12 0.140 0.127
3 68 1:12 345 71.93 42.99 0.161 0.140
4 68 1:20 360 76.46 46.55 0.169 0.141
5 69 1:2 470 69.77 43.09 0.181 0.161
6 69 1:4 505 72.78 44.45 0.193 0.181
7 69 1:12 530 89.12 56.54 0.201 0.191
8 69 1:20 545 105.20 64.00 0.210 0.202
9 70 1:2 880 96.10 62.33 0.218 0.209
10 70 1:4 890 111.98 71.39 0.228 0.214
11 70 1:12 895 152.94 99.58 0.243 0.229
12 70 1:20 925 180.18 117.18 0.253 0.240
13 71 1:2 1140 138.57 81.58 0.247 0.226
14 71 1:4 1180 178.97 110.11 0.259 0.238
15 71 1:12 1195 201.28 122.54 0.267 0.249
16 71 1:20 1215 231.11 151.03 0.305 0.270
4 Discussion
4.1 Time variation of paste thixotropy
The results showed a similar change law of shear stress at different shear rates. The shear stress before and
after stress relaxation at high shear rate was both higher than that at the low shear rate. The thixotropic
behavior of slurry was affected by the shear rate, with the amount of thixotropy increasing with the increase
of shear rate. Stress relaxation curves at different shear rates showed no evident differences of relaxation
time at different shear rates. In other words, while the stress relaxation rate changed at different shear rates,
the stress relaxation time was similar because the difference between the initial stress state and the
relaxation stress state compensated the differences of relaxation rates. Although influencing the thixotropy
of paste slurry, shear rate had no obvious relation to thixotropic time, yield stress and plastic viscosity.
4.2 Variation of yield stress
According to stress relaxation curves of 30, 60, 90 and 120 s-1 (Figure 5(a)), yield stress at each moment could
be analyzed by regression. Regression analysis was carried out in every 15 s to optimize the analytical data.
When the concentration of paste was 68% and the cement sand ratio was 1:2, regression analysis was
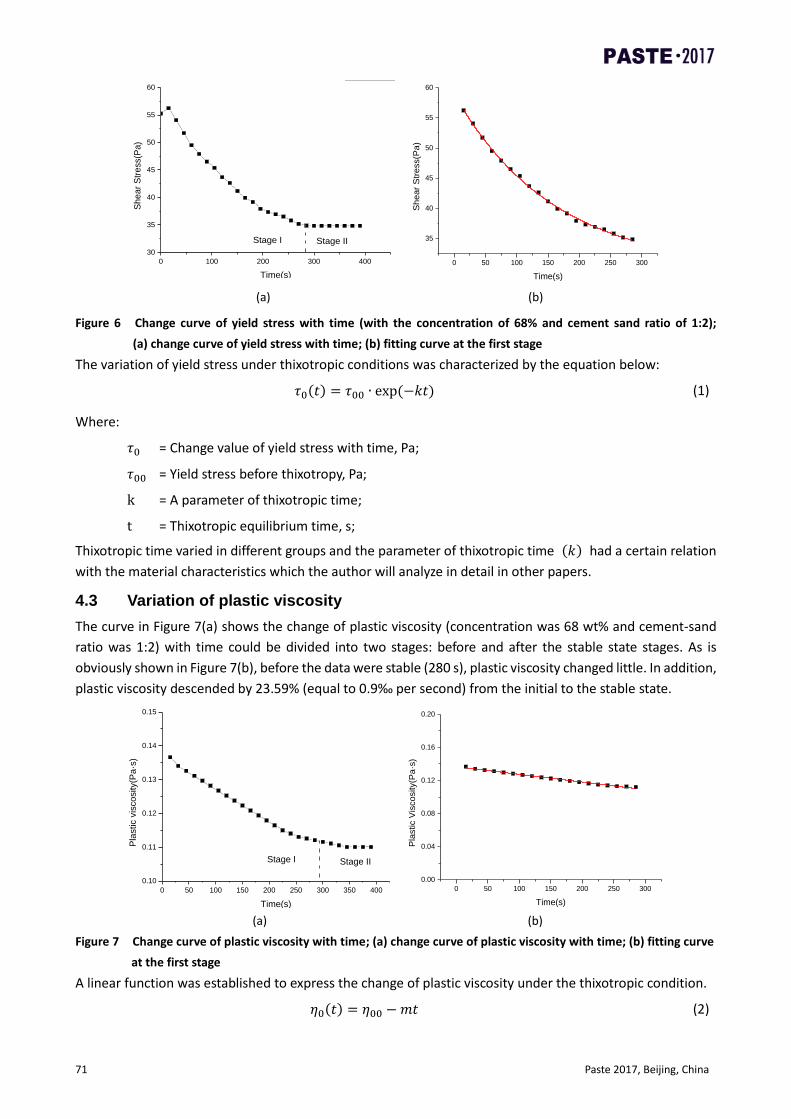
performed for 26 times, to obtain the curve of yield stress during 400 s (Figure 6(a)). The yield stress had
reached a stable state at around 280 s. Taking the stability of the model into account, all data needed to be
segmented and divided into two stages: before and after the stable state stages. The change of yield stress
with time was in accordance with the negative exponential function growth property on the basis of
processed data within 280 s (Figure 6(b)).
71 Paste 2017, Beijing, China
(a) (b)
Figure 6 Change curve of yield stress with time (with the concentration of 68% and cement sand ratio of 1:2);
(a) change curve of yield stress with time; (b) fitting curve at the first stage
The variation of yield stress under thixotropic conditions was characterized by the equation below:
𝜏0(𝑡) = 𝜏00 ∙ exp(−𝑘𝑡) (1)
Where:
𝜏0 = Change value of yield stress with time, Pa;
𝜏00 = Yield stress before thixotropy, Pa;
k = A parameter of thixotropic time;
t = Thixotropic equilibrium time, s;
Thixotropic time varied in different groups and the parameter of thixotropic time (𝑘) had a certain relation
with the material characteristics which the author will analyze in detail in other papers.
4.3 Variation of plastic viscosity
The curve in Figure 7(a) shows the change of plastic viscosity (concentration was 68 wt% and cement-sand
ratio was 1:2) with time could be divided into two stages: before and after the stable state stages. As is
obviously shown in Figure 7(b), before the data were stable (280 s), plastic viscosity changed little. In addition,
plastic viscosity descended by 23.59% (equal to 0.9‰ per second) from the initial to the stable state.
(a) (b)
Figure 7 Change curve of plastic viscosity with time; (a) change curve of plastic viscosity with time; (b) fitting curve
at the first stage
A linear function was established to express the change of plastic viscosity under the thixotropic condition.
𝜂0(𝑡) = 𝜂00 −𝑚𝑡 (2)
0 100 200 300 400
30
35
40
45
50
55
60
Stage IIStage I
Sh
ear
Str
ess(P
a)
Time(s)
Shear Stress
0 50 100 150 200 250 300
35
40
45
50
55
60
Sh
ear
Str
ess(P
a)
Time(s)
0 50 100 150 200 250 300 350 400
0.10
0.11
0.12
0.13
0.14
0.15
Stage II
Pla
stic v
isco
sity(P
a·s
)
Time(s)
Stage I
0 50 100 150 200 250 300
0.00
0.04
0.08
0.12
0.16
0.20
Pla
stic V
isco
sity(P
a·s
)
Time(s)
Paste 2017, Beijing, China 72
Where:
𝜂0 = Change value of plastic viscosity with time, Pa·s;
𝜂00 = Plastic viscosity before thixotropy, Pa·s;
𝑚 = A parameter of thixotropic time;
𝑡 = Thixotropic equilibrium time, s;
The parameter of thixotropic time (𝑚) had a certain relation with the material characteristics which the
author will analyze in detail in other papers.
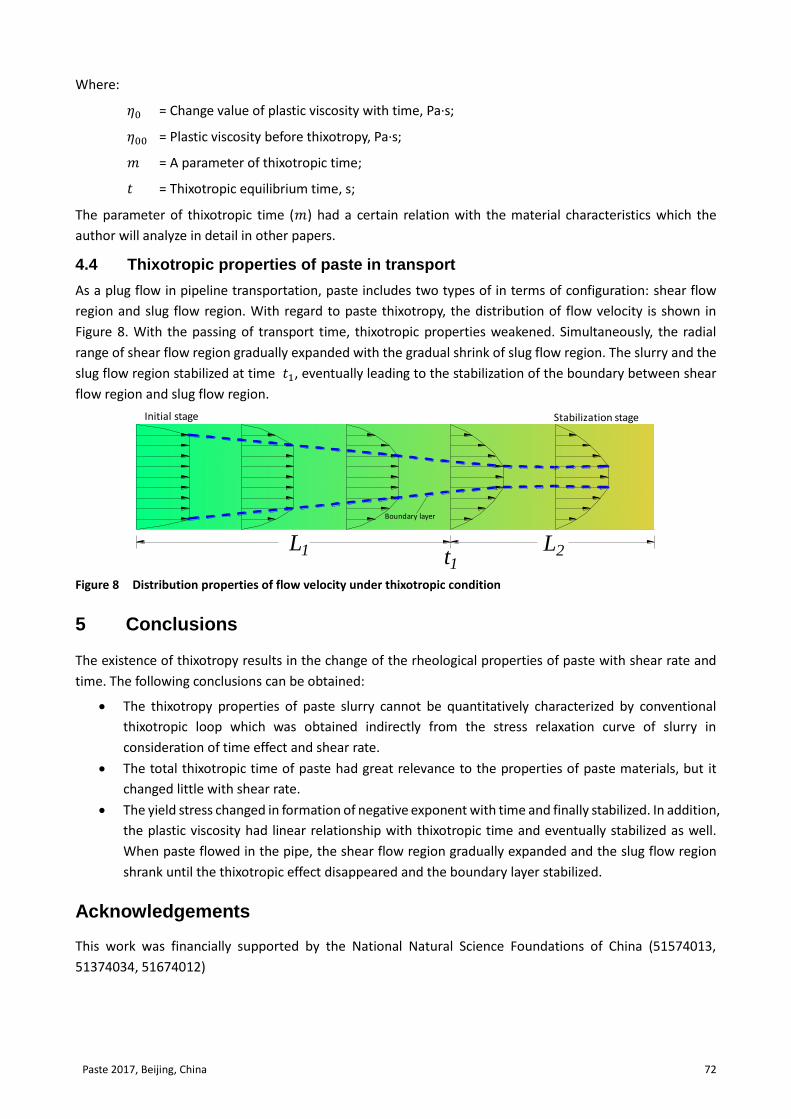
4.4 Thixotropic properties of paste in transport
As a plug flow in pipeline transportation, paste includes two types of in terms of configuration: shear flow
region and slug flow region. With regard to paste thixotropy, the distribution of flow velocity is shown in
Figure 8. With the passing of transport time, thixotropic properties weakened. Simultaneously, the radial
range of shear flow region gradually expanded with the gradual shrink of slug flow region. The slurry and the
slug flow region stabilized at time 𝑡1, eventually leading to the stabilization of the boundary between shear
flow region and slug flow region.
Figure 8 Distribution properties of flow velocity under thixotropic condition
5 Conclusions
The existence of thixotropy results in the change of the rheological properties of paste with shear rate and
time. The following conclusions can be obtained:
The thixotropy properties of paste slurry cannot be quantitatively characterized by conventional
thixotropic loop which was obtained indirectly from the stress relaxation curve of slurry in
consideration of time effect and shear rate.
The total thixotropic time of paste had great relevance to the properties of paste materials, but it
changed little with shear rate.
The yield stress changed in formation of negative exponent with time and finally stabilized. In addition,
the plastic viscosity had linear relationship with thixotropic time and eventually stabilized as well.
When paste flowed in the pipe, the shear flow region gradually expanded and the slug flow region
shrank until the thixotropic effect disappeared and the boundary layer stabilized.
Acknowledgements
This work was financially supported by the National Natural Science Foundations of China (51574013,
51374034, 51674012)
L1
Boundary layer
Stabilization stage
t1L2
Initial stage
73 Paste 2017, Beijing, China
References
Abebe, Y. A., Lohaus, L. 2017, ‘Rheological characterization of the structural breakdown process to analyze the stability of flowable
mortars under vibration’, Construction and Building Materials, vol. 131, pp. 517-525.
Assaad, J.J., Harb, J., Maalouf, Y. 2016, ‘Effect of vane configuration on yield stress measurements of cement pastes’, Journal of Non-
Newtonian Fluid Mechanics, vol. 230, pp. 31-42.
Barnes, H.A., 1997, ‘Thixotropy—a review’, Journal of Non-Newtonian Fluid Mechanics, vol. 70, pp. 1-33.
Cruz, N., Peng, Y. 2016, ‘Rheology measurements for flotation slurries with high clay contents – A critical review’, Minerals Engineering,
vol. 98, pp. 137.
Dullaert, K., Mewis, J. 2006, ‘A structural kinetics model for thixotropy’, Journal of Non-Newtonian Fluid Mechanics, vol. 139, pp. 21-30.
Liu, J.Z., Wang, R.K., Gao, F.Y., Zhou, J.H., Cen, K.F. 2012, ‘Rheology and thixotropic properties of slurry fuel prepared using municipal
wastewater sludge and coal’. Chemical Engineering Science, vol. 76, no. 28, pp. 1-8.
Liu, Q.S., Lu, C.B., Liu, B., Lu, X.L. 2014, ‘Research on rheological behavior for cement grout considering temperature and hydration time
effects’, Chinese Journal of Rock Mechanics and Engineering, vol. 33, pp. 3730‐3740.
Møller, P.C.F., Mewis, J., Bonn, D. 2006, ‘Yield stress and thixotropy: on the difficulty of measuring yield stresses in practice’, Soft Matter,
vol. 2, no. 4, pp. 274-283.
Mujumdar, A., Beris, A.N., Metzner, A.B. 2002, ‘Transient phenomena in thixotropic systems’, Journal of Non-Newtonian Fluid Mechanics,
vol. 102, no. 2, pp. 157-178.
Qian, Y., Kawashima, S. 2016, ‘Flow onset of fresh mortars in rheometers: Contribution of paste deflocculation and sand particle
migration’, Cement and Concrete Research, vol. 90, pp. 97-103.
Roussel, N. 2006, ‘A thixotropy model for fresh fluid concretes: Theory, validation and applications’, Cement and Concrete Research,
vol. 36, no. 10, pp. 1797-1806.
Roussel, N., Ovarlez, G., Garrault, S., Brumaud, C. 2012, ‘The origins of thixotropy of fresh cement pastes’, Cement and Concrete
Research, vol. 42, no. 1, pp. 148–157.
Usui, H., 1995, ‘A thixotropy model for coal-water mixtures’, Journal of Non-Newtonian Fluid Mechanics, vol. 60, pp. 259-275.
Wu, D., Fall, M., Cai, S.J. 2013, ‘Coupling temperature, cement hydration and rheological behaviour of fresh cemented paste backfill’,
Minerals Engineering, vol. 42, pp. 76–87.