Embed Size (px)
Citation preview

This work is scheduled to appear in Synthese
c© 2012 Springer Science+Business Media B.V.
This article may not exactly replicate the final version published in the journal. It is
not the copy of record.
The final publication is available at www.springerlink.com:
http://www.springerlink.com/content/nl1p4250720604q7/.

Running Head: The Rationality of Intuitive Decision Processes
The Rationality of Different Kinds of Intuitive Decision Processes
Marc Jekel1, Andreas Glöckner1, Susann Fiedler1, & Arndt Bröder2
1Max Planck Institute for Research on Collective Goods
2University of Mannheim
Word count: 4,998 (main text, references, tables, and figures)
Keywords: Rationality, Intuitive Decision Processes, Model Comparison
Note. This work was supported by Grant GL 632/3-1 and BR 2130/8-1 to Andreas Glöckner and
Arndt Bröder from the Deutsche Forschungsgemeinschaft (DFG) as part of the priority program “New
Frameworks of Rationality” (SPP 1516). We thank Berenike Waubert de Puiseau, Matthias Lang,
Cilia Witteman, and two anonymous reviewers for helpful comments on an earlier draft.
Correspondence should be addressed to:
Marc Jekel
Max Planck Institute for Research on Collective Goods
Kurt-Schumacher-Str. 10
D-53113 Bonn
Phone: +49-(0)228/91416852
E-mail: [email protected]

The Rationality of Intuitive Decision Processes 2
Abstract
Whereas classic work in judgment and decision making has focused on the deviation of intuition
from rationality, more recent research has focused on the performance of intuition in real-world en-
vironments. Borrowing from both approaches, we investigateto which extent competing models of
intuitive probabilistic decision making overlap with choices according to the axioms of probability
theory and how accurate those models can be expected to perform in real-world environments. Specif-
ically, we assessed to which extent heuristics, models implementing weighted additive information
integration (WADD), and the parallel constraint satisfaction (PCS) network model approximate the
Bayesian solution and how often they lead to correct decisions in a probabilistic decision task. PCS
and WADD outperform simple heuristics on both criteria withan approximation of 88.8% and a
performance of 73.7%. Results are discussed in the light of selection of intuitive processes by rein-
forcement learning.

The Rationality of Intuitive Decision Processes 3
1. Introduction
Classic work in judgment and decision making indicates that intuitive processes can lead to system-
atic deviations from rationality often referred to as biases (for an overview, see Gilovich, Griffin, &
Kahneman, 2002). Biases were thereby used to diagnose the useof certain judgment heuristics which
were assumed to be (partially) based on intuitive processing. The representativeness heuristic posits,
for example, that persons’ probability judgments are influenced by the degree to which a target is seen
as representative for a category. Observations of a conjunction fallacy—as demonstrated in the classic
Linda-is-a-bank-teller vignette—were explained by the representativeness heuristic (e.g., Kahneman
& Frederick, 2002).
This seminal work was crucial to highlight the role of intuition which has often been neglected in
mainstream decision research. The approach, however, alsohad several limitations. First, the exact
processes that produce feelings of representativeness were not specified, and therefore predictions
remained imprecise. Second, intuition research in judgment and decision making was not sufficiently
connected to work in cognitive psychology that aims to specify processes underlying intuition. Third,
since tasks were constructed such that the use of intuitive heuristics leads to deviations from rational-
ity, intuition was per operationalization doomed to lead towrong decisions, which has hindered the
detection of intuition’s merits (Lopes, 1991).
Recent intuition research has aimed to overcome all three limitations. Hogarth (2001), for example,
suggested a model that describes the cognitive processes underlying intuition and opened the view to-
wards situations in which intuition might be successful (Hogarth, 2005). According to his model, the
quality of intuitive decisions crucially depends on the learning environment. Other researchers went
one step further and developed precise computational models for intuitive processes in judgment and
decision making based on general models of memory (Dougherty, Gettys, & Ogden, 1999), percep-
tion (Betsch & Glöckner, 2010; Busemeyer & Townsend, 1993; Glöckner & Betsch, 2008a; Holyoak
& Simon, 1999; Thagard & Millgram, 1995; Usher & McClelland, 2001), or the idea of automatic
serial production rules (Gigerenzer, Todd, & The ABC ResearchGroup, 1999).
Reviewing this multitude of cognitive processes, Glöckner and Witteman (2010) argue that the con-
cept of intuition is often used too broadly as an umbrella term for many kinds of different processes.
There are most likely several qualitatively different kinds of cognitive processes that produce feelings
of how to decide without knowing why (Claxton, 1998) and that unconsciously influence our choices

The Rationality of Intuitive Decision Processes 4
(Bargh & Chartrand, 1999).
In the current paper, we report results from a simulation that investigates how (some of) the sug-
gested mechanisms underlying intuition perform in probabilistic inferences. Specifically, we generate
all possible decision tasks for choices between two alternatives based on six probabilistic binary cues.
The rational solution for this kind of task, i.e., the integration of cues coherent with the axioms of
probability theory, can be calculated according to Bayes’ theorem.1 We were interested in three re-
lated questions: a) how often do the mechanisms lead to choices that are in line with the rational
choice (mimicry), b) how often would mechanisms lead to correct choices (performance), and c)
which factors of the environment influence performance of each mechanism (moderators).
2. Previous Work
One reasonable assumption is that more complex and effortful decision strategies generally lead to
better decisions (Beach & Mitchell, 1978). Some studies, however, show that this assumption does
not hold in all environments. Payne et al. (1988), for example, show that under time constraints
simple lexicographic strategies (LEX; i.e., compare options by most probable outcomes and decide
in favor of one option if one outcome differentiates betweenoptions) can lead to better decisions than
weighted linear models such as weighted additive (WADD; i.e., weight outcomes by probabilities
and add them up). Also, simple heuristics like LEX were shownto perform well with respect to
accuracy in several real-world settings in which an outsidecriterion for assessment was available
(Czerlinski, Gigerenzer, & Goldstein, 1999; Gigerenzer & Brighton, 2009; but see also Hilbig &
Richter, 2011). More systematic investigations of the performance of LEX and other decision rules
in probabilistic inferences show that strategy performance depends on the match between decision
rule and environment (Hogarth & Karelaia, 2007). Hence, certain strategies may be tailored to be
successful in specific environments.
3. Aims of the Current Study
In the current study we extend this previous work. First, we extend the scope of modeling by includ-
ing a network model (PCS) in addition to the standard mechanisms TTB, WADD, and EQW. TTB is a
prominent representative of LEX algorithms and EQW is a simple heuristic that sums up unweighted
1See, however, Cohen (1981) for a discussion on the rationality of Bayesian inference.
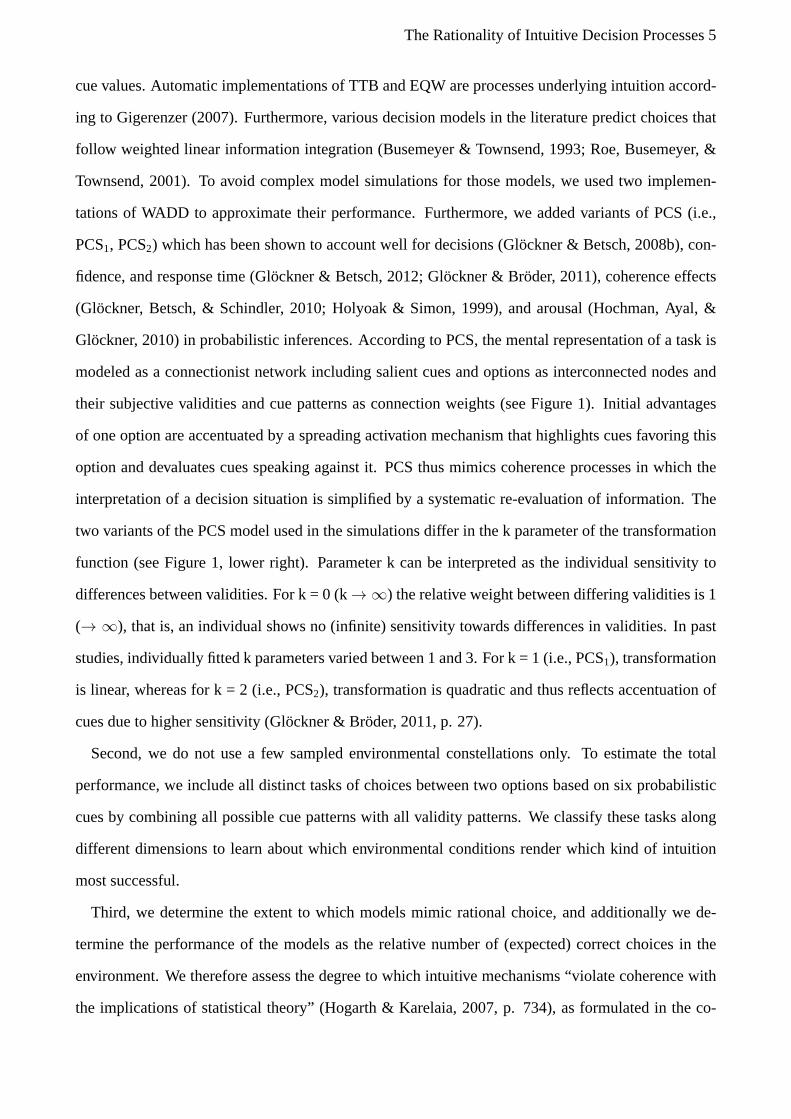
The Rationality of Intuitive Decision Processes 5
cue values. Automatic implementations of TTB and EQW are processes underlying intuition accord-
ing to Gigerenzer (2007). Furthermore, various decision models in the literature predict choices that
follow weighted linear information integration (Busemeyer& Townsend, 1993; Roe, Busemeyer, &
Townsend, 2001). To avoid complex model simulations for those models, we used two implemen-
tations of WADD to approximate their performance. Furthermore, we added variants of PCS (i.e.,
PCS1, PCS2) which has been shown to account well for decisions (Glöckner & Betsch, 2008b), con-
fidence, and response time (Glöckner & Betsch, 2012; Glöckner& Bröder, 2011), coherence effects
(Glöckner, Betsch, & Schindler, 2010; Holyoak & Simon, 1999), and arousal (Hochman, Ayal, &
Glöckner, 2010) in probabilistic inferences. According toPCS, the mental representation of a task is
modeled as a connectionist network including salient cues and options as interconnected nodes and
their subjective validities and cue patterns as connectionweights (see Figure 1). Initial advantages
of one option are accentuated by a spreading activation mechanism that highlights cues favoring this
option and devaluates cues speaking against it. PCS thus mimics coherence processes in which the
interpretation of a decision situation is simplified by a systematic re-evaluation of information. The
two variants of the PCS model used in the simulations differ inthe k parameter of the transformation
function (see Figure 1, lower right). Parameter k can be interpreted as the individual sensitivity to
differences between validities. For k = 0 (k→ ∞) the relative weight between differing validities is 1
(→ ∞), that is, an individual shows no (infinite) sensitivity towards differences in validities. In past
studies, individually fitted k parameters varied between 1 and 3. For k = 1 (i.e., PCS1), transformation
is linear, whereas for k = 2 (i.e., PCS2), transformation is quadratic and thus reflects accentuation of
cues due to higher sensitivity (Glöckner & Bröder, 2011, p. 27).
Second, we do not use a few sampled environmental constellations only. To estimate the total
performance, we include all distinct tasks of choices between two options based on six probabilistic
cues by combining all possible cue patterns with all validity patterns. We classify these tasks along
different dimensions to learn about which environmental conditions render which kind of intuition
most successful.
Third, we determine the extent to which models mimic rational choice, and additionally we de-
termine the performance of the models as the relative numberof (expected) correct choices in the
environment. We therefore assess the degree to which intuitive mechanisms “violate coherence with
the implications of statistical theory” (Hogarth & Karelaia, 2007, p. 734), as formulated in the co-

The Rationality of Intuitive Decision Processes 6
herence criterion of rationality, whereas earlier work often relied on the correspondence criterion of
rationality, that is, the extent to which models correspondwith an outside criterion.
4. Simulation
We assessed mimicry of the rational model and performance for different processes that are assumed
to underlie intuition in probabilistic inferences.
4.1 Environments
We investigated probabilistic decision making between twooptions with six binary cues. We included
all distinct tasks fully crossed with all possible sets of cue validities. From the total set of tasks
resulting from all cue patterns (i.e.,2× 6 cues with binary outcomes:26 × 26 = 4,096), we generated
a reduced set by excluding conceptually identical tasks. Wedropped patterns that a) were option-
reversed, b) differed in the sign of non-discriminating cues only (i.e.,−− vs. ++), and c) did not
differentiate between options at all which resulted in a qualified set of 364 cue patterns. In a second
step, we generated a reduced set of cue validity combinations for the six cues using interval sampling.
That is, we generated all combinations of cue validities ranging from .51 to .99 in steps of .03 for six
cues and ordered each combination from the highest to the lowest cue validity. Note that the order of
validities is negligible as long as all qualified tasks of an environment are sampled. We then deleted
all multiples with identical cue validities and combinations that contained the same cue validity at
least twice to assure that TTB makes unambiguous predictions. This resulted in 12,376 combinations
of validities in total.
4.2 Models for Intuitive Processes
The simulation involved two simple heuristics, TTB (take-the-best) and EQW (equal weight) from
the adaptive toolbox (Gigerenzer, Todd, & The ABC Research Group, 1999); two implementations of
weighted additive models (WADD) representing a whole classof intuition models, and neural network
implementations of intuitive processes according to Parallel Constraint Satisfaction (PCS; Glöckner
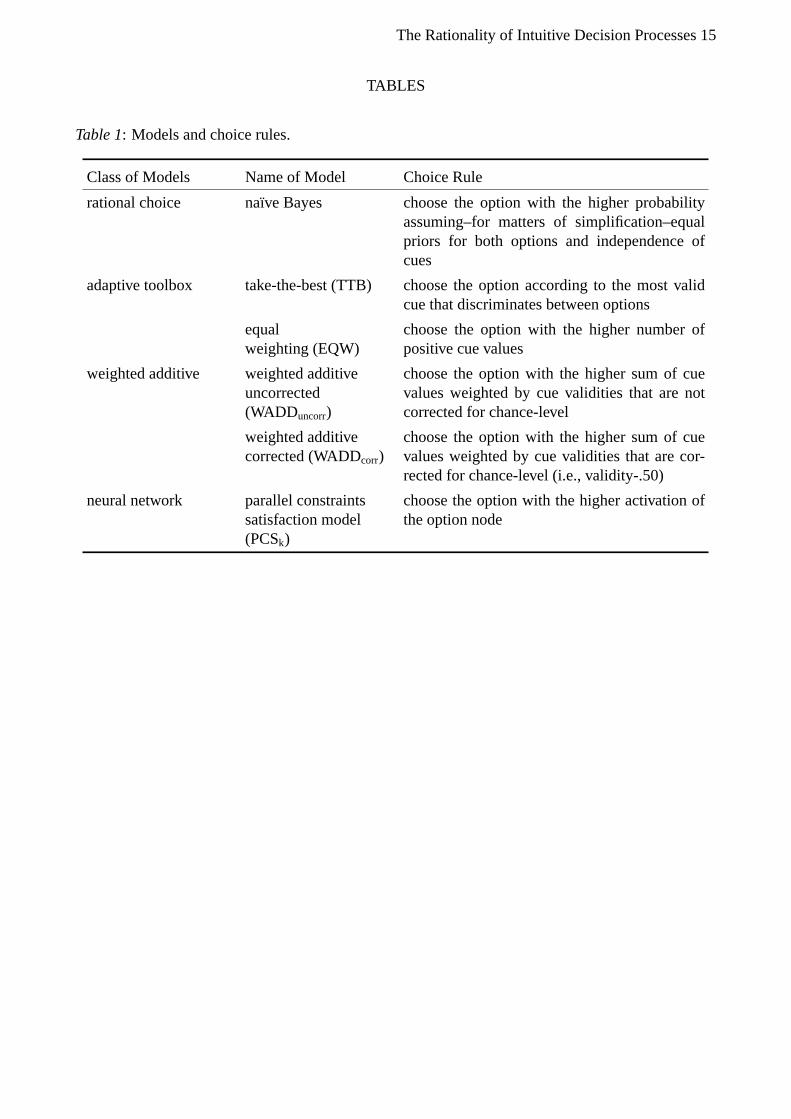
& Betsch, 2008a) differing in the sensitivity parameter k (see above). For each model and the rational
solution, the choice rule is described in Table 1.
The Rationality of Intuitive Decision Processes 7
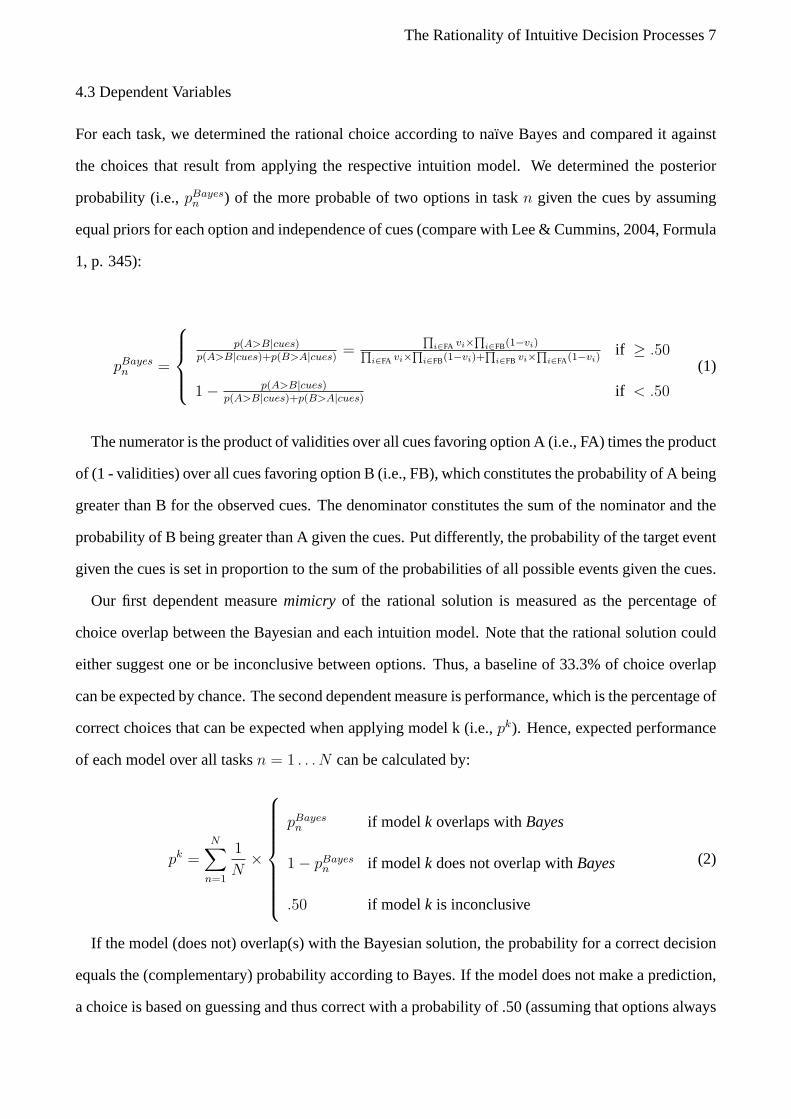
4.3 Dependent Variables
For each task, we determined the rational choice according to naïve Bayes and compared it against
the choices that result from applying the respective intuition model. We determined the posterior
probability (i.e.,pBayesn ) of the more probable of two options in taskn given the cues by assuming
equal priors for each option and independence of cues (compare with Lee & Cummins, 2004, Formula
1, p. 345):
pBayesn =
p(A>B|cues)p(A>B|cues)+p(B>A|cues)
=
∏i∈FA vi×
∏i∈FB(1−vi)∏
i∈FA vi×∏
i∈FB(1−vi)+∏
i∈FB vi×∏
i∈FA(1−vi)if ≥ .50
1−p(A>B|cues)
p(A>B|cues)+p(B>A|cues)if < .50
(1)
The numerator is the product of validities over all cues favoring option A (i.e., FA) times the product
of (1 - validities) over all cues favoring option B (i.e., FB),which constitutes the probability of A being
greater than B for the observed cues. The denominator constitutes the sum of the nominator and the
probability of B being greater than A given the cues. Put differently, the probability of the target event
given the cues is set in proportion to the sum of the probabilities of all possible events given the cues.
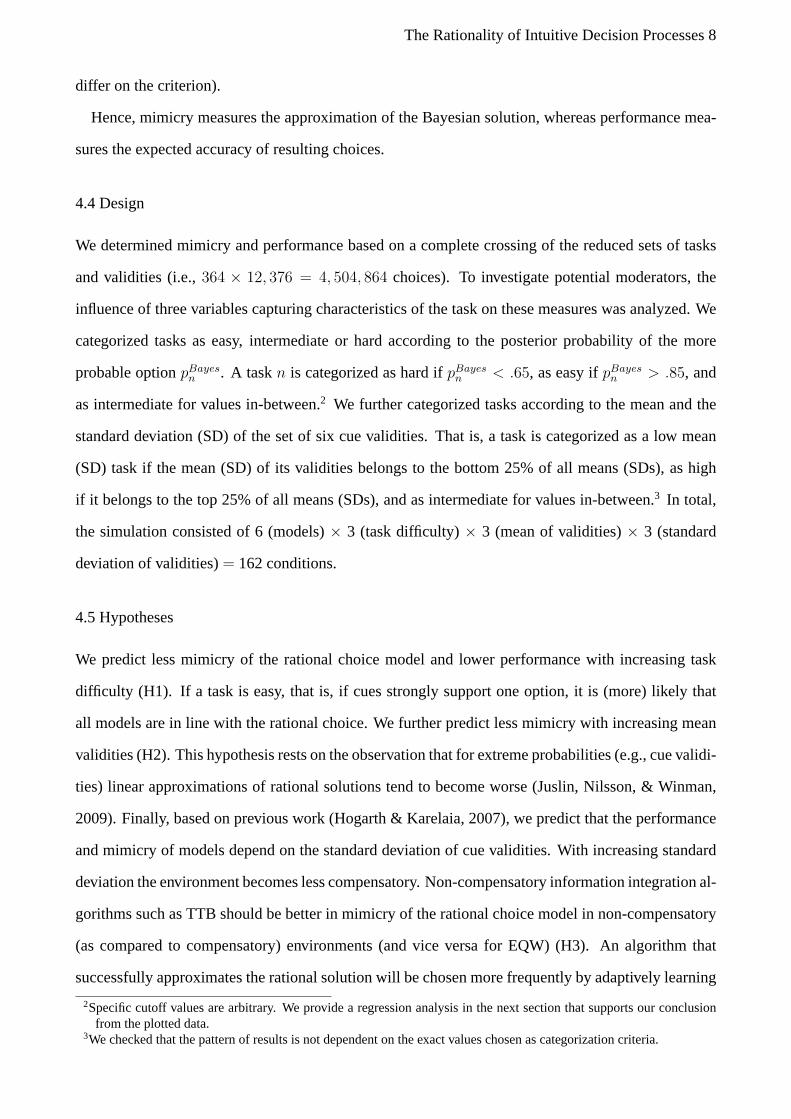
Our first dependent measuremimicry of the rational solution is measured as the percentage of
choice overlap between the Bayesian and each intuition model. Note that the rational solution could
either suggest one or be inconclusive between options. Thus, a baseline of 33.3% of choice overlap
can be expected by chance. The second dependent measure is performance, which is the percentage of
correct choices that can be expected when applying model k (i.e.,pk). Hence, expected performance
of each model over all tasksn = 1 . . . N can be calculated by:
pk =
N∑
n=1
1
N×
pBayesn if model k overlaps withBayes
1− pBayesn if model k does not overlap withBayes
.50 if model k is inconclusive
(2)
If the model (does not) overlap(s) with the Bayesian solution, the probability for a correct decision
equals the (complementary) probability according to Bayes.If the model does not make a prediction,
a choice is based on guessing and thus correct with a probability of .50 (assuming that options always
The Rationality of Intuitive Decision Processes 8
differ on the criterion).
Hence, mimicry measures the approximation of the Bayesian solution, whereas performance mea-
sures the expected accuracy of resulting choices.
4.4 Design
We determined mimicry and performance based on a complete crossing of the reduced sets of tasks
and validities (i.e.,364 × 12, 376 = 4, 504, 864 choices). To investigate potential moderators, the
influence of three variables capturing characteristics of the task on these measures was analyzed. We
categorized tasks as easy, intermediate or hard according to the posterior probability of the more
probable optionpBayesn . A taskn is categorized as hard ifpBayes
n < .65, as easy ifpBayesn > .85, and
as intermediate for values in-between.2 We further categorized tasks according to the mean and the
standard deviation (SD) of the set of six cue validities. That is, a task is categorized as a low mean
(SD) task if the mean (SD) of its validities belongs to the bottom 25% of all means (SDs), as high
if it belongs to the top 25% of all means (SDs), and as intermediate for values in-between.3 In total,
the simulation consisted of 6 (models)× 3 (task difficulty)× 3 (mean of validities)× 3 (standard
deviation of validities)= 162 conditions.
4.5 Hypotheses
We predict less mimicry of the rational choice model and lower performance with increasing task
difficulty (H1). If a task is easy, that is, if cues strongly support one option, it is (more) likely that
all models are in line with the rational choice. We further predict less mimicry with increasing mean
validities (H2). This hypothesis rests on the observation that for extreme probabilities (e.g., cue validi-
ties) linear approximations of rational solutions tend to become worse (Juslin, Nilsson, & Winman,
2009). Finally, based on previous work (Hogarth & Karelaia,2007), we predict that the performance
and mimicry of models depend on the standard deviation of cuevalidities. With increasing standard
deviation the environment becomes less compensatory. Non-compensatory information integration al-
gorithms such as TTB should be better in mimicry of the rational choice model in non-compensatory
(as compared to compensatory) environments (and vice versafor EQW) (H3). An algorithm that
successfully approximates the rational solution will be chosen more frequently by adaptively learning
2Specific cutoff values are arbitrary. We provide a regression analysis in the next section that supports our conclusionfrom the plotted data.
3We checked that the pattern of results is not dependent on theexact values chosen as categorization criteria.

The Rationality of Intuitive Decision Processes 9
individuals over time. Due to the observed prevalence of PCS in probabilistic inferences in past stud-
ies, we therefore predicted that PCS would provide the best approximation in the model comparison
(H4).
5. Results
5.1 Mimicry of Rational Solution
In line with our hypothesis, PCS2 shows the highest overlap (88.8%) with the rational choice model
averaged over all tasks (Figure 2, left panel). The other models–except for EQW–also overlap consid-
erably well with the rational solution (WADDcorr = 86.5%, TTB = 83.3%; EQW = 57.6%). Averaged
over all environments and strategies, the percentage of overlap increases from 63.3% to 94.7% with
decreasing task difficulty (Figure 2, middle left panel), supporting our first hypothesis. Furthermore,
we observe that overlap decreases from 83.8% to 74.0% when the mean of cue validities increases
(middle right panel), which supports our second hypothesis. Without being hypothesized, we also
observe that overlap decreases from 82.1% to 76.2% when the standard deviation of cue validities
increases (right panel).
To explore interactions between models and task characteristics, all conditions are plotted in Figure
3. All models are affected similarly by task difficulty and the mean of cue validities. Choice overlap
is lower for difficult tasks and tasks with a high mean of cue validities. In accordance with H3,
model overlap depends on the standard deviation of cue validities. The mimicry of rationality of
the compensatory models decreases with increasing standard deviation (model average: from 82.4%
to 74.3%). Overlap, however, increases with increasing standard deviation of cue validities for the
non-compensatory model from 80.5% to 86.0%.
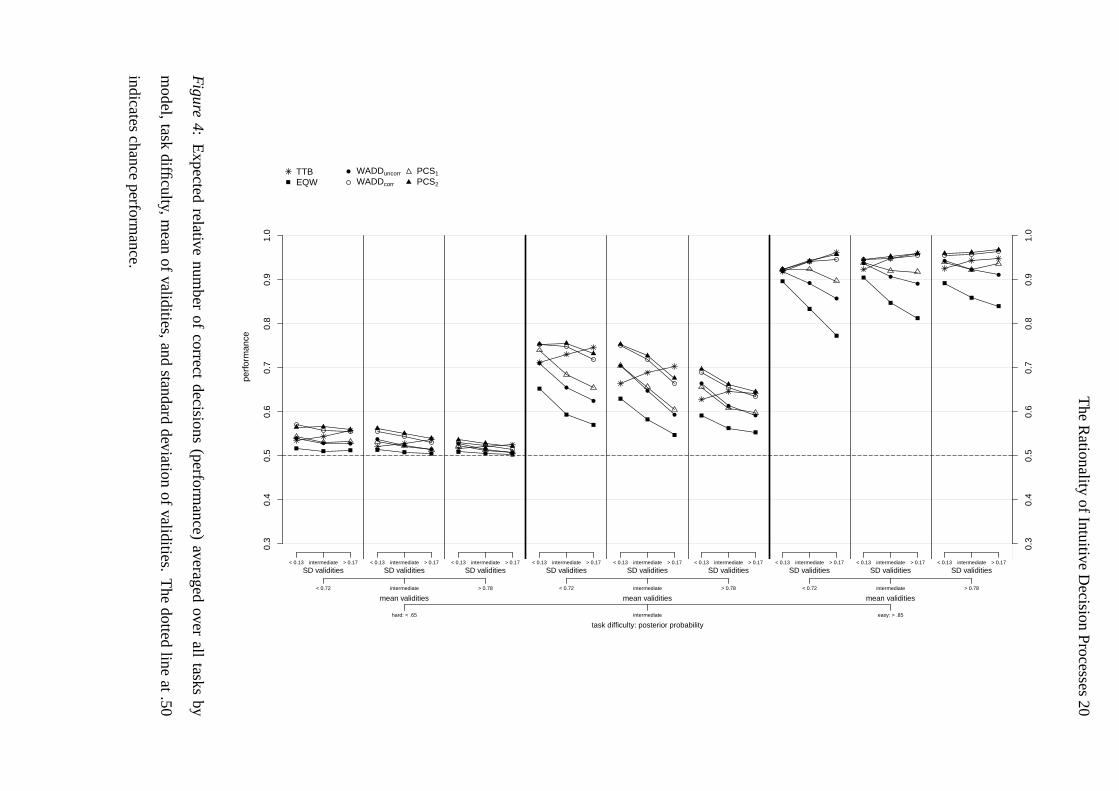
5.2 Performance
As a second dependent variable we analyzed the performance of each model, that is, the expected pro-
portion of correct choices in the environment (i.e.,pk, see Formula 2). Averaged over all conditions,
PCS2 shows the highest performance with 73.7% correct choices, closely followed by WADDcorr with
73.1%, TTB with 71.8%, PCS1 with 70.1%, WADDuncorr with 69.2%, and EQW with 64.9%. For
difficult tasks, all models are close to chance level of .50 (Figure 4, left panel). For easy tasks (right
panel), PCS2, WADDcorr, and TTB are close to 100%. For tasks with intermediate difficulty (middle

The Rationality of Intuitive Decision Processes 10
panel), PCS2 and WADDcorr lead on average to higher performance (71.1% and 70.3%) thanTTB
(68.4%).
Note that there exist few constellations in which TTB outperforms all other strategies. This is the
case if the mean of the cue validities is low to intermediate and the standard deviation of validities is
high (i.e., when the environment is non-compensatory).
5.3 Predicting Mimicry of Rational Solution
To predict the overlap with the rational solution for different environments, we conducted a logistic
regression predicting mimicry of the Bayesian choice by environmental factors and type of model
(Table 2). In line with the results already reported, overlap increases for easier tasks, but decreases
with increasing average and standard deviation of cue validities. The coefficients represent changes
in odds (i.e., p/(1-p)) that result from one unit change in the predictor. Odds above 1 indicate positive
predictors. The odds for an overlap with the rational choicemodel, for example, are twice as high
for PCS2 in comparison to TTB when controlled for task difficulty, mean validities, and the standard
deviation of validities in a logistic regression. Conversely, the odds reduce by factor 0.003 (= 1 /
333.3) when cue mean validities (hypothetically) change by1 point.
We also tested an extended regression model in which all two-way interaction terms of strategies
with standard deviation of validities were included. In line with our interaction hypothesis (H3),
with increasing standard deviation of validities the odds for an overlap with the rational choice model
decrease for all compensatory models in comparison to TTB, although the effect of the additional
interactions is negligible (∆ PseudoR2 = .01) and therefore results are not displayed here.
6. Discussion
In many everyday decisions persons will not have the time and/or the cognitive capacity to calculate
rational solutions deliberately. Persons have to rely on approximations of rationality based on simpli-
fied deliberate rules and/or on automatic-intuitive processes. In the current paper we have investigated
the degree to which different algorithms suggested to describe intuitive processes approximate the ra-
tional solution.
In line with our expectation, we observed that overall a parallel constraint satisfaction model
showed highest mimicry of the rational solution (88.8%) andthus also best performance (73.7%)

The Rationality of Intuitive Decision Processes 11
among all considered models. Assuming that individuals learn to select particularly successful al-
gorithms over time (from an ontogenetic and phylogenetic learning perspective), this converges with
previous findings indicating that PCS processes seem to prevail in probabilistic inferences (see intro-
duction for references).
However, a chance corrected weighted additive algorithm which was used as placeholder for other
complex models of intuition (e.g., Busemeyer & Townsend, 1993) fared only slightly worse concern-
ing performance than PCS. Simple heuristics showed lower performance on average, although there
were a few environmental constellations (high SDs of validities) in which TTB outperformed all other
models. Furthermore, it should be kept in mind that our results on model performance are based on
the simplifying assumption that all distinct choice problems have an equal probability of appearing in
the real world, which might be debatable. Nevertheless, overall mimicry and performance seem to be
generally robust since PCS also performs best for the majority of considered problem subsets.
We were also able to identify environmental moderators of mimicry and performance. As expected,
mimicry and performance is higher for easier tasks and for tasks with low average cue validities. We
also showed that compensatory models have better mimicry for compensatory environments (i.e., low
standard deviation of cue validities), as compared to more non-compensatory environments (i.e., high
standard deviation of cue validities), and vice versa for non-compensatory mechanisms. Considering
the overall dominance of PCS and WADDcorr, it might be questioned from a reinforcement learning
perspective whether the advantage in performance of TTB under few environmental conditions would
be sufficient to make persons choose this algorithm.
Overall, we conclude that implementations of intuitive processes that rely on PCS or chance-
corrected weighted additive cue integration approximate the rational solution very well. Considering
that Bayesian calculations are effortful and connected withhigh opportunity costs, and taking into
account that even small errors in these deliberate calculations can lead to severe mistakes (Hammond,
Hamm, Grassia, & Pearson, 1987), it will often be optimal–even based on rational strategy selection
considerations (Beach & Mitchell, 1978)–to apply quick automatic-intuitive information integration
algorithms such as PCS instead of slow deliberate Bayesian calculation.
The Rationality of Intuitive Decision Processes 12
References
Bargh, J. A., & Chartrand, T. L. (1999). The unbearable automaticity of being. American Psycholo-
gist, 54, 462-479.
Beach, L. R., & Mitchell, T. R. (1978). A contingency model for the selection of decision strategies.
Academy of Management Review, 3, 439-449.
Betsch, T., & Glöckner, A. (2010). Intuition in judgment and decision making: Extensive thinking
without effort.Psychological Inquiry, 21, 279-294.
Busemeyer, J. R., & Townsend, J. T. (1993). Decision field theory: A dynamic-cognitive approach to
decision making in an uncertain environment.Psychological Review, 100, 432-459.
Claxton, G. (1998). Knowing without knowing why.The Psychologist, 11, 217-220.
Cohen, L. J. (1981). Can human irrationality be experimentally demonstrated?The Behavioral and
Brian Sciences, 4, 317-370.
Czerlinski, J., Gigerenzer, G., & Goldstein, D. G. (1999). How good are simple heuristics? In G.
Gigerenzer, P. M. Todd & The ABC Research Group (Eds.),Simple heuristics that make us smart
(pp. 97-118). New York: Oxford University Press.
Dougherty, M. R. P., Gettys, C. F., & Ogden, E. E. (1999). MINERVA-DM: A memory processes
model for judgments of likelihood.Psychological Review, 106, 180-209.
Gigerenzer, G.(2007).Gut feelings: The intelligence of the unconscious. London: Penguin Books.
Gigerenzer, G., & Brighton, H. (2009). Homo heuristicus: Why biased minds make better inferences.
Topics in Cognitive Sciences, 1, 107-143.
Gigerenzer, G., & Todd, P. M., & The ABC Research Group (1999).Simple heuristics that make us
smart. New York: Oxford University Press.
Gilovich, T., Griffin, D., & Kahneman, D. (2002).Heuristics and biases: The psychology of intuitive
judgment. New York: Cambridge University Press.
Glöckner, A., & Betsch, T. (2008a). Modeling option and strategy choices with connectionist net-
works: Towards an integrative model of automatic and deliberate decision making.Judgment and
Decision Making, 3, 215-228.
Glöckner, A., & Betsch, T. (2008b). Multiple-reason decision making based on automatic processing.
Journal of Experimental Psychology: Learning, Memory, and Cognition, 34, 1055-1075.
Glöckner, A., & Betsch, T. (2012). Decisions beyond boundaries: When more information is pro-
The Rationality of Intuitive Decision Processes 13
cessed faster than less.Acta Psychologica, 139, 532-542.
Glöckner, A., Betsch, T., & Schindler, N. (2010). Coherence shifts in probabilistic inference tasks.
Journal of Behavioral Decision Making, 23, 439-462.
Glöckner, A., & Bröder, A. (2011). Processing of recognitioninformation and additional cues: A
model-based analysis of choice, confidence, and response time. Judgment and Decision Making,
6, 23-42.
Glöckner, A., & Witteman, C. L. M. (2010). Beyond dual-processmodels: A categorization of
processes underlying intuitive judgment and decision making. Thinking & Reasoning, 16, 1 - 25.
Hammond, K. R., Hamm, R. M., Grassia, J., & Pearson, T. (1987). Direct comparison of the efficacy
of intuitive and analytical cognition in expert judgment.IEEE Transactions on Systems, Man, and
Cybernetics, 17, 753-770.
Hilbig, B. E., & Richter, T. (2011). Homo heuristicus outnumbered: Comment on Gigerenzer and
Brighton (2009).Topics in Cognitive Science, 3, 187-196.
Hochman, G., Ayal, S., & Glöckner, A. (2010). Physiologicalarousal in processing recognition
information: Ignoring or integrating cognitive cues?Judgment and Decision Making, 5, 285-299.
Hogarth, R. M. (2001).Educating intuition. Chicago, IL: University of Chicago Press.
Hogarth, R. M. (2005). Deciding analytically or trusting your intuition? The advantages and disad-
vantages of analytic and intuitive thought. In T. Betsch & S. Haberstroh (Eds.),The routines of
decision making (pp. 67-82). Mahway, NJ: Erlbaum.
Hogarth, R. M., & Karelaia, N. (2007). Heuristic and linear models of judgment: Matching rules and
environments.Psychological Review, 114, 733-758.
Holyoak, K. J., & Simon, D. (1999). Bidirectional reasoning in decision making by constraint satis-
faction.Journal of Experimental Psychology: General, 128, 3-31.
Juslin, P., Nilsson, H., & Winman, A. (2009). Probability theory, not the very guide of life.Psycho-
logical Review, 116, 856-874.
Kahneman, D., & Frederick, S. (2002). Representativeness revisited: Attribute substitution in in-
tuitive judgment. In T. Gilovich, D. Griffin & D. Kahneman (Eds.), Heuristics and biases: The
psychology of intuitive judgment (pp. 49-81). New York: Cambridge University Press.
Lee, M. D., & Cummins, T. D. R. (2004). Evidence accumulation indecision making: Unifying the
”take the best“ and the ”rational“ models.Psychonomic Bulletin & Review, 11, 343-352.
The Rationality of Intuitive Decision Processes 14
Lopes, L. (1991). The rhetoric of irrationality.Theory & Psychology, 1, 65-82.
Payne, J. W., Bettman, J. R., & Johnson, E. J. (1988). Adaptive strategy selection in decision making.
Journal of Experimental Psychology: Learning, Memory, and Cognition, 14, 534-552.
Roe, R., Busemeyer, J. R., & Townsend, J. (2001). Multiattributedecision field theory: A dynamic,
connectionist model of decision making.Psychological Review, 108, 370-392.
Thagard, P., & Millgram, E. (1995). Inference to the best plan: A coherence theory of decision. In A.
Ram & D. B. Leake (Eds.),Goal-driven learning (pp. 439-454). Cambridge, MA: MIT Press.
Usher, M., & McClelland, J. L. (2001). The time course of perceptual choice: The leaky, competing
accumulator model.Psychological Review, 108, 550-592.
The Rationality of Intuitive Decision Processes 15
TABLES
Table 1: Models and choice rules.
Class of Models Name of Model Choice Rule
rational choice naïve Bayes choose the option with the higherprobabilityassuming–for matters of simplification–equalpriors for both options and independence ofcues
adaptive toolbox take-the-best (TTB) choose the option according to the most validcue that discriminates between options
equalweighting (EQW)
choose the option with the higher number ofpositive cue values
weighted additive weighted additiveuncorrected(WADDuncorr)
choose the option with the higher sum of cuevalues weighted by cue validities that are notcorrected for chance-level
weighted additivecorrected (WADDcorr)
choose the option with the higher sum of cuevalues weighted by cue validities that are cor-rected for chance-level (i.e., validity-.50)
neural network parallel constraintssatisfaction model(PCSk)
choose the option with the higher activation ofthe option node

The Rationality of Intuitive Decision Processes 16
Table 2: Logistic regression predicting mimicry of the rational choice model by type of intuition
model, task difficulty, and mean and standard deviation of validities.
Mimicry
Independent Variables Odds Ratios
Task Difficulty (posterior probability) 1976.041
Mean Validities 0.003
SD Validities 4× 10⁻⁵
Intuition Model (control = TTB)
EQW 0.143
WADDuncorr 0.544
WADDcorr 1.484
PCS1 0.660
PCS2 2.000
Note. Intuition model is dummy-coded; PseudoR2 = .24.

The Rationality of Intuitive Decision Processes 17
FIGURES
cue1 cue2 cue3 cue4 cue5 cue6
option1 option2−0.2
wci−ok = [+.01,−.01]
wvi = (vi − 0.5)k
PCS1: k = 1
PCS2: k = 2GeneralValidity
option1 option2+ −+ −+ −+ −− +− +
cue1cue2cue3cue4cue5cue6
Figure 1: Exemplary task (lower left) represented in the PCS network.Cues and options are bidirec-
tionally interconnected nodes. Cue validitiesvi are transformed into weightswvi according to a trans-
formation function (lower right) and attached to the connections between the General Validity node
and the cues (linewidth indicates size of weights). (Non-)supportive cues (− or +) are transformed
into (inhibitory or excitatory) weightswci−ok (upper right) that are attached to the connections be-
tween the cues and the options (dotted or continuous lines).Activation weighted bywvi spreads from
the General Validity node into the network. Node activations are updated iteratively until changes in
activation are negligible (< 10−3). Maximum and minimum node activations are set to−1 and1,
decay is set to.05; see Glöckner and Betsch (2008a) for details.

The Rationality of Intuitive Decision Processes 18
mim
icry
of r
atio
nal c
hoic
e m
odel
0.50
0.55
0.60
0.65
0.70
0.75
0.80
0.85
0.90
0.95
1.00
TTBEQW
WADD un
corr
WADD co
rr
PCS 1
PCS 2
hard
inter
med
iate
easy
< 0.
72
inter
med
iate
> 0.
78
< 0.
13
inter
med
iate
> 0.
17
0.50
0.55
0.60
0.65
0.70
0.75
0.80
0.85
0.90
0.95
1.00
overall mimicry task difficulty mean validities SD validities
Note. For hard vs. easy tasks posterior probability is < .65 vs. > .85.
Figure 2: Mimicry of the rational choice model by (from left to right panel) intuition model, task
difficulty, mean validities, and standard deviation of validities.

The
Rationality
ofIntuitiveD
ecisionP
rocesses19
mim
icry
of r
atio
nal c
hoic
e m
odel
0.3
0.4
0.5
0.6
0.7
0.8
0.9
1.0
0.3
0.4
0.5
0.6
0.7
0.8
0.9
1.0
< 0.13 intermediate > 0.17 < 0.13 intermediate > 0.17 < 0.13 intermediate > 0.17 < 0.13 intermediate > 0.17 < 0.13 intermediate > 0.17 < 0.13 intermediate > 0.17 < 0.13 intermediate > 0.17 < 0.13 intermediate > 0.17 < 0.13 intermediate > 0.17
SD validities SD validities SD validities SD validities SD validities SD validities SD validities SD validities SD validities
< 0.72 intermediate > 0.78 < 0.72 intermediate > 0.78 < 0.72 intermediate > 0.78
mean validities mean validities mean validities
task difficulty: posterior probabilityhard: < .65 intermediate easy: > .85
TTBEQW
WADDuncorr
WADDcorr
PCS1
PCS2
Figure
3:M
imicry
ofthe
rationalchoicem
odelaveragedover
tasksby
model,
taskdifficulty,
mean
ofvalidities,andstandard
deviationofvalidities.
The
dotted
lineat.33
indicatesm
imicry
bychance.
The
Rationality
ofIntuitiveD
ecisionP
rocesses20
perf
orm
ance
0.3
0.4
0.5
0.6
0.7
0.8
0.9
1.0
0.3
0.4
0.5
0.6
0.7
0.8
0.9
1.0
< 0.13 intermediate > 0.17 < 0.13 intermediate > 0.17 < 0.13 intermediate > 0.17 < 0.13 intermediate > 0.17 < 0.13 intermediate > 0.17 < 0.13 intermediate > 0.17 < 0.13 intermediate > 0.17 < 0.13 intermediate > 0.17 < 0.13 intermediate > 0.17
SD validities SD validities SD validities SD validities SD validities SD validities SD validities SD validities SD validities
< 0.72 intermediate > 0.78 < 0.72 intermediate > 0.78 < 0.72 intermediate > 0.78
mean validities mean validities mean validities
task difficulty: posterior probabilityhard: < .65 intermediate easy: > .85
TTBEQW
WADDuncorr
WADDcorr
PCS1
PCS2
Figure
4:E
xpectedrelative
number
ofcorrect
decisions(perform
ance)
averagedover
alltasks
by
model,
taskdifficulty,
mean
ofvalidities,
andstandard
deviation
ofvalidities.
The
dottedline
at.50
indicateschance
performance.