Embed Size (px)
Citation preview

THIS REPORT CONTAINS ASSESSMENTS OF COMMODITY AND TRADE ISSUES MADE BY
USDA STAFF AND NOT NECESSARILY STATEMENTS OF OFFICIAL U.S. GOVERNMENT
POLICY
Date:
GAIN Report Number:
Approved By:
Prepared By:
Report Highlights:
With per capita income of over $10,500 and a middle and upper class making up 61 percent of the
population, Malaysia shows good potential for growth as a market for high value consumer products.
Best U.S. product prospects include fresh fruits and vegetables, pet foods, dried fruits, nuts, frozen
potatoes and processed juices.
Post:
Kuala Lumpur
Loh Lee Pin
Chris P. Rittgers
Annual 2014
Exporter Guide
Malaysia
MY4023
10/31/2014
Required Report - public distribution

GAIN REPORT: Exporter Guide Annual 2014 Page 2
Table of Contents
SECTION I. MARKET OVERVIEW ........................................................................................ 3
SECTION II. EXPORTER BUSINESS TIPS .............................................................. 3
SECTION III. MARKET SECTOR STRUCTURE AND TRENDS ........................ 7
SECTION IV. BEST HIGH-VALUE PRODUCT PROSPECTS ............................. 11
SECTION V. KEY CONTACTS AND FURTHER INFORMATION ..................... 13

GAIN REPORT: Exporter Guide Annual 2014 Page 3
Executive Summary:
SECTION I. MARKET OVERVIEW
Malaysia is politically and economically stable and open to foreign trade. Transportation,
communications, banking and health services are modern and efficient. With a population of around 29
million, it is one of the most developed nations in Southeast Asia. About 61 percent of its population
falls into the middle to upper income group of consumers; with GDP per capita income of $10,500. Its
economy has a firm foundation that includes strong manufacturing, service and agricultural sectors.
The economy continues to perform well, and is expected to grow 5.4 percent in 2014 and 4.6 percent in
2015. Despite the government’s cut on fuel subsidies in October 2014, inflation remains at a moderate
rate between 3 to 4 percent (note that approximately 30% of goods are price-controlled).
The Malaysian food and beverage market is very developed and sophisticated and is supplied by both
local and imported products. Urban consumers are relatively brand conscious and prefer to shop in
stores, which offer convenience and good product selections. Hypermarkets/large format stores are the
dominant format in urban/metropolitan areas in Malaysia with about 45 to 60 percent of urban
household shoppers using them as the main outlet for the majority of their packaged groceries.
Traditional markets are losing ground, but are still important outlets for fresh fruits and vegetables.
Advantages and Challenges for U.S. Suppliers
Advantages Challenges
Malaysia’s solid economic prospects and growing
consumer purchasing power.
Consumers are generally price sensitive, but
also seek new products.
Supermarkets and hypermarkets are popular, with
new being opened regularly, and are providing
greater access for imported foods.
Neighboring competing suppliers have a
freight advantage.
Malaysia imports about 70 percent of its food needs,
including beef, lamb, dairy products, baking
ingredients, pasta, and temperate fruits and
vegetables.
Muslims comprise 60 percent of the
population, so many foods must be certified
halal (beef, lamb, poultry and dairy
products).
Malaysians are familiar with western foods, with
western menus and U.S. food service franchise
operations prevalent.
Importers and distributors purchase at the
lowest price from any exporter or country.
Local food manufacturers seek to expand exports,
using imports as raw materials.
US exporters face competition from locally
produced raw food materials that are in
sufficient supply (e.g. poultry, and palm oil).
SECTION II. EXPORTER BUSINESS TIPS

GAIN REPORT: Exporter Guide Annual 2014 Page 4
Business Customs
Malaysians are accustomed to doing business with foreigners and readily accommodate foreign business
manners. Younger businessmen are prepared to start new business relationships with foreign companies
without the advantage of a personal meeting. These businessmen also prefer to communicate with
foreign suppliers electronically.
Prior to initiating any export sales to Malaysia, it would be advantageous to conduct a market survey
with particular reference to the competitive environment. It is common for foreign exporters to appoint a
local sales agent/importer to distribute their goods, expedite clearance of goods from ports and draw on
existing networks of wholesalers and retailers. Regular visits by U.S. exporters to the market are also
critical to enhance business relationships.
General Consumer Tastes and Preferences
Malaysia is a multiracial society consisting of three major races. The Malays account for 65 percent of
the population, with Islam as the official religion; slightly more than 25 percent of Malaysians are
Chinese who may be Buddhist or Christian. Indians form 7.3 percent of the population and they are
largely Hindus. There is also a sizeable expatriate population and Malaysia is a popular tourist
destination for Asia, the Middle East and Europe.
Lunch and dinner meals consist mainly of rice together with two or three meats/fish and vegetable
dishes that are prepared according to the styles and traditions of various ethnic communities. The
Malays and Indians prepare their dishes with hot spices while Chinese prefer to stir-fry. Religious
affiliation affects food consumption in Malaysia. Muslims do not eat pork, and only eat meat products
that have been certified halal, and many Buddhists and Hindus do not eat beef. Thus, halal chicken
meat is popular among all consumers and Malaysia has one of the world’s highest per capita
consumption rates at 35 kg.
With rising affluence and education levels, consumers’ shopping and eating lifestyles have changed
drastically over the years. Malaysians, especially in urban and cosmopolitan areas, prefer to shop in
modern retail outlets, which offer them one-stop shopping options. However, traditional stores such as
provision and grocery shops, which are conveniently located in residential areas and workplaces, are
still popular.
Malaysians are adventurous in their eating habits. Eating out is common and is relatively inexpensive.
Open air, street-stall food is popular. Fine dining restaurants and foodservice outlets incorporating
international cuisines are found in Klang Valley and other major cities where spending power and
population concentration are higher. Most consumers frequent this type of restaurants to dine in style
and comfort and to experience the best and most sophisticated culinary standards in the country.
With a Muslim population of 65 percent, the demand for halal foods by Malaysian consumers has
increased over the years. The expectation of halal standard in food products have extended from meat
and meat products to non-meat based products such snacks, confectionery, dairy, bakery, etc. Almost all
GAIN REPORT: Exporter Guide Annual 2014 Page 5
food and ingredients destined for the food service sector must be certified halal. Halal is fast becoming
recognized as a new benchmark for quality, hygiene and safety. Food products and ingredients that have
halal certificates have added marketing value in Malaysia. Hence, most retailers, foodservice operators
and food manufacturers are inclined to ask for halal certificates for non-meat based food products and
ingredients.
Food Standards and Regulations
Malaysian health and food labeling requirements are fairly liberal. The labeling requirements specify
that imported and domestically produced processed food items must be labeled in English or Bahasa
Malaysia. Labels must contain the following information:
(a) An appropriate description of the product;
(b) A list of ingredients in descending order of proportion by weight;
if the item contains any animal product, a statement as to the presence of such animal products
(beef, pork, lard, gelatins, etc.,)
(c) if the item contains any alcohol, a statement as to the presence of alcohol;
(d) the minimum net weight of the product; in the case of a product packed in liquid, the minimum
drained weight of the food;
(e) the name and address of the manufacturer;
(f) the name and address of the importer (this can be affixed at the time of import);
(g) a statement of shelf life or expiry dates.
Certain food additives, preservatives, and artificial colorings approved for use in the United States may
not be permitted in Malaysia. Codex approved items are generally allowed if there are no provisions or
regulations pertaining to the additives and preservatives in the Malaysian Food Regulation. In addition,
products with labels that include phrases such as “Contains No Palm Oil” or “Contains No Tropical
Oils” will not be allowed for import. (Malaysia is a palm oil producing country and is a strong advocate
of this commodity).
In addition to the general labeling requirements above, nutritional labeling is compulsory for the
following foods: prepared cereal foods; various types of bread; variety of milk and powdered milk,
including sweetened condensed milk, evaporated milk and cultured milk; canned meat; canned fish;
canned vegetable, canned fruit and various types of fruit juices, salad dressing and mayonnaise, various
types of soft drink including botanical drink, soya bean milk and soya bean drink.
GM labeling
In July 2014, regulations that require mandatory labeling of food and food ingredients obtained through
modern biotechnology went into effect. The regulations say that no person shall import, prepare or

GAIN REPORT: Exporter Guide Annual 2014 Page 6
advertise for sale or sell any food and food ingredients obtained through modern biotechnology without
the prior written approval of the Director.
Some key elements of the labeling guidelines include the following:
1) If the GE content is not more than three percent, labeling is not required, “provided that this presence
is adventitious or technically unavoidable.”
2) For single ingredient foods, the words “genetically modified (name of the ingredient)” must appear in
the main display panel.
3) For multi-ingredient foods, the words “produced from genetically modified (name of the ingredient)”
should appear in list of ingredients and “contains genetically modified ingredient” must be stated on the
main display panel.
4) Highly refined foods, defined as those where processing has removed all novel DNA and protein,
are exempt from the labeling requirement. (e.g.: vegetable oils, corn syrup, acidic foods, and salty
foods).
5) Meat from animals fed with GE grains do NOT need to be labeled.
6) Only GE crops that have been approved by the National Biosafety Board Malaysia can be used for
foods and food ingredients.
7) Labeling of ‘GMO Free’ and ‘Non-GMO’ is not permitted.
More information on Malaysian’s Food Regulations 1985 is available at the Ministry of Health’s
website: http://fsis2.moh.gov.my/fosimv2/HOM/frmHOMFARSec.aspx?id=21
General Import and Inspection Procedures
All food consignments are subject to random checking and sampling at the 34 entry points around the
country to ensure food items imported into the country are safe and comply with the prescribed
standards and regulations. All meat, poultry and dairy product shipments must be accompanied by
appropriate USDA documentation. International freight forwarders normally handle documentation and
other formalities with authorities at entry points. Provided all necessary documents are in order, no
problems or delays should occur in clearance of goods.
Halal requirement and certification
All beef and poultry products must be certified halal and the products must originate from
slaughterhouses that have been inspected and approved by the Malaysian veterinary and religious
authorities. An Islamic Center approved by the Malaysian Islamic Development Department (JAKIM)
must supervise the slaughter and processing and issue the halal certificate for meat and poultry. The
Islamic Center must be listed by the packing plant on the original JAKIM application form or the
application must be appropriately amended to make use of a new Islamic Center.
U.S. exporters should also be aware that importers might request additional certificates, which are not
required by the authority, either to meet the demand of their own customers or for marketing purposes.
For further processed food (which contains no meat), there is no known requirements for any certificate,
but exporters are encouraged to acquire halal certification from approved Islamic Centers
(http://www.halal.gov.my/v3/index.php/ms/senarai-badan-islam-yang-diiktiraf) to cater to the Muslim
consumer market as Muslims account for more than half of Malaysia’s population and Muslims

GAIN REPORT: Exporter Guide Annual 2014 Page 7
consume foods that are halal. The Halal Certificate should accompany the shipment and the products
should have the approved Islamic Center’s halal logo on their packaging for information and marketing
purposes.
SECTION III. MARKET SECTOR STRUCTURE AND TRENDS
Malaysia continues to be a net importer of food with annual imports of $14 billion.
In 2013, U.S. exports of consumer-oriented and edible fishery products were $587 million, while total
imports of this category were $7 billion. China is the major supplier with imports at $1.2 billion,
representing 17 percent of the market share. India took the second spot with imports worth of $745
million which is about 10% of the market share, followed by New Zealand (10%), Thailand (9.5%) and
Australia (7.5%).
China is the main supplier of vegetables with reported imports at $215 million in 2013. Turnip, cabbage,
carrot, potato and garlic were among the major items. China is also the market leader for mandarin
oranges ($45 million). Since the US and China are both in the northern hemisphere with similar seasons,
US exporters have to compete aggressively with Chinese exporters who can sell their produce at lower
prices. South Africa is the main supplier of apples with $35 million worth of imports, with China
second at $26 million. US Valencia oranges, grapes and apples are popular in the Malaysian market.
Imports for 2013 were at $32 million, $25 million and $15 million respectively. Fresh strawberries,
raspberries, blueberries and cranberries are niche markets and the U.S. is a major supplier with imports
worth over $1 million annually. Competition is less intense with supplies from Australia and South
Africa since they have the opposite seasons.
By tradition, New Zealand is the most favored for dairy products, followed by U.S. and Australia. In
2013, imports of full cream milk powder, skim milk powder, butter and cheeses from New Zealand
were at $516 million, while imports from US and Australia were estimated at $182 million and $131
million respectively. US dairy powder is a growing market.
India is the leading supplier of red meat with total imports of $402 million (118,315 metric tons) in
2013. Indian beef and buffalo meat caters to the mass market. Beef from Australia and New Zealand
caters for foodservice with total imports amounted to $176 million and $69 million respectively in the
same year.
Malaysia is self-sufficient in poultry (broiler/eggs) production. Chicken parts and chicken wings are
imported periodically to meet the demand from the local processing industry. In 2013, China was the
major supplier for chicken parts and chicken wing at $56 million. Imports from Thailand and
Netherlands were at $40 million and $6 million respectively.
Malaysia is a net importer of fish and seafood products with an annual import at $996 million in 2013.
China is the main supplier with $279 million, followed by Indonesia ($187 million) and Thailand ($143
million).
An increasing number of middle to high income consumers in Malaysia demand high quality imported

GAIN REPORT: Exporter Guide Annual 2014 Page 8
exotic fish and seafood, especially live, and the bulk of these will be consumed in middle to high-end
Chinese seafood restaurants. Lobsters (Boston, Rock), abalone, oysters, scallops, clams (Razor, Blood,
Sea, Jacknife), green mussels, crabs (Snow, King, Blue Swimmer, Dungeness), prawns (Mantis),
geoduck, farmed sturgeon, razor fish, turbot, grouper, sea bass, bamboo fish, coral trout and carp are
popular.
High-end western restaurants and high-end hotels have a demand for premium fresh, chilled or frozen
products, such as salmon, cod, Dover sole, halibut as well as oysters, scallops, clams, lobsters, crabs and
alike. Most salmon imports (fresh/chilled, frozen and smoked) are distributed to these types of food
service outlets.
Supermarkets and hypermarkets are good for fresh chilled or frozen lobsters, crabs, large prawns,
mackerel, cod, salmon (included smoked), Hoki, Dori, mackerel, crab meat, mussels, scallops and
clams.
Opportunities exist for US fish and seafood exporters to develop their market presence in Malaysia by
supplying to these major businesses.
Distribution for consumer-ready food products
Private companies are the major entities in the food distribution system. Food importers and
commissioned agents place orders with foreign suppliers and distribute to supermarkets/grocery stores
and hotels in the cities and to sundry shops in the rural areas. Several of the larger supermarket and
hypermarket chains are importing directly from overseas.
Most products from the United States enter through the ports of Klang, Penang and Johor.
Transshipment of food products through Singapore has declined with improvement in shipping facilities
offered by major ports in Malaysia. ‘Westport’ situated in Port Klang and the Port of Tanjung Pelepas
(in Johor) has further enhanced Malaysia as a shipping hub.
Malaysia has seven international airports, including the Kuala Lumpur International Airport (KLIA),
one of the biggest and most modern airports in the region. Malaysia’s modern highway network is the
backbone of the country’s transport system as 90% of passenger and cargo movements are by roads.
Roads link almost every town in Malaysia, and products move efficiently between cities and rural areas.
Food Retail Sector
Malaysia has a large and growing food retail market that is supplied by local and imported products.
The current total retail sales of food and beverages are estimated at US$15 billion. This sector has been
growing at an average rate of 7 percent per annum over the past five years.
Malaysian households spend an average 24 percent of their household income on retail purchase of
foods. Due to rising affluence and higher education level, Malaysian consumers have become more
sophisticated and demand higher quality for the goods that they purchased.

GAIN REPORT: Exporter Guide Annual 2014 Page 9
According to Retail Group Malaysia, the bulk of retail food sales are channeled through the traditional
stores, such as provision stores, grocery stores, specialty food stores and other sundry shops. This sub-
sector commands close to 60 percent of food sales today. Modern stores such as supermarkets,
hypermarkets and department stores with supermarkets only have around 39 percent share of the retail
food market. Convenience stores have remained insignificant, with only about 1 percent share of the
retail food market.
Independent grocery stores and wet markets are found in the residential areas of both urban and rural
towns across Malaysia. Most of the food items sold by grocery stores are canned foods, dried foods,
snack foods, ice cream, and soft drinks. Fresh produces such as fruits and vegetables are seldom sold
and usually do not sell frozen or chilled foods other than ice cream. However, grocery stores known as
mini-markets, which are larger and more modern than the traditional grocery stores, would sell these
food items. However, they are relatively fewer in numbers compared to the traditional grocery stores.
Wet markets include daily wet markets operating in permanent buildings and weekly morning and night
markets operating in non-permanent locations. Food items sold are generally fresh fruits, vegetable,
meat and fish. Imports are usually apples, oranges, grapes, carrots, potatoes, onions, cabbages, and
broccoli.
Supermarkets and hypermarkets are mainly located in the major urban centers and are continuing to
grow in numbers. Foreign-owned retailers operating locally include Tesco, Dairy Farms International
(owns Giant, Cold Storage, Jason and Mercato), and Aeon. United Arab Emirates-based supermarket
chain Lulu Group is investing $200 million to open five halal-only supermarket outlets in Malaysia.
Lulu’s first hypermarket is scheduled to open by the end of 2015. Supermarkets and hypermarkets will
continue to see the fastest growth over the next three years. These retail stores provide good venues for
imported products and access to the middle and high-income sophisticated consumers.
Competition among the retailers, especially hypermarkets, is intense with large international retailers
like Tesco, Giant and Aeon Big frequently engaging in price wars to establish their presence as major
players in the market. Meanwhile, Giant, the largest hypermarket operator in Malaysia, is the low-price
leader status.
Malaysians are shopping more at convenience stores and petrol marts. Increasing competition has
resulted in a need for convenience stores to become more professional. Customers are now expecting
more sophisticated offers like a wider range of better quality ready-to-eat snacks and hot-and-chilled
beverages.
Key Entry Strategies for US Exporters
1. Market, distribute, and promote through the supermarkets and hypermarkets.
2. Promote food products to create consumer awareness and loyalty.
3. Appoint importers or agents that best meets the needs of the exporter.
4. Ensure that processed foods are acceptable to local taste and have appropriate packaging.
5. Acquire halal certification from recognized Islamic institution in the US.

GAIN REPORT: Exporter Guide Annual 2014 Page 10
Food Processing Sector
The Malaysian government has identified the food processing industry as a priority sector for industrial
development and increase exports. There are nearly 5,731 manufacturers involved in the food
manufacturing industry in Malaysia and the industry accounts for nearly 10 percent of Malaysia’s
manufacturing output. Raw materials such as cereals and dairy products continue to be imported for
further processing. Processed foods are exported to more than 200 countries with an annual export
value of $4.4 billion. The main items exported included cocoa and cocoa preparations ($1 billion),
prepared cereal and flour preparations ($563 million), dairy products ($299 million), and sugar & sugar
confectionery ($279 million) and prepared/preserved vegetables & fruits ($181 million). Food
manufacturers operating in Malaysia include both Malaysian and multinational companies such as
Nestle, Unilever, Cerebos, and Campbell Soup. Major exported countries were Singapore, Indonesia,
U.S., Thailand and China.
• Key Entry Strategies for US Exporters
1. Ensure quality of the raw food materials to instill manufacturers’ confidence.
2. Acquire halal certification to cater to the Muslim consumer market.
3. Emphasize on the competitive advantage of the exporter’s products to the food manufacturers.
4. Market and promote to increase awareness among food manufacturers.
5. Establish an efficient distribution network to maximize market penetration.
Food Service Sector
Malaysia has a sizeable and rapidly growing food service market today. The food service market today
is valued between $5 billion to $6 billion today. The food service market is projected to grow at an
average rate of around 7 percent and 10 percent per annum over the next three to five years. This
positive forecast is due to growing sophistication and affluence among consumers. Foodservice
operators are constantly developing products and services to attract consumers.
Hotels and resorts, restaurants, and the institutional sub-sectors represent the best potential for US
exporters. The restaurant sub-sector accounts for 70 percent of the total food service sales. This is
followed by the hotels and resorts (8 percent) and catering services to institutions (5 percent). Other sub-
sectors include food stalls but are not a potential market for US exporters since they mainly serve
relatively cheap local dishes.
Malaysia’s tourism industry has also fueled growth of the food service industry. Currently it is the
second largest foreign exchange earner after manufacturing. The number of tourists visiting Malaysia
reached 26 million in 2013. Total tourism revenue generated was $20 billion. With the current
government’s effort to promote Malaysia as a medical tourism hub, tourists’ arrivals are expected to
grow in the coming years. It is also the only Muslim nation made it to the World’s top 10 in ease of
doing business. The growth in tourism is expected to fuel the growth of restaurants offering
international cuisines such as Middle Eastern and Latin American food.

GAIN REPORT: Exporter Guide Annual 2014 Page 11
High tariffs and excise taxes in alcoholic beverages are deterring the consumption of wine in the
foodservice sector. Coupled with the high mark-ups on the wine by hotel and restaurant operators, the
selling price of the wines is exorbitant and this prohibits further consumption in foodservice outlets.
Key Entry Strategies for US Exporters
1. Conduct promotional activities to create awareness among importers and the food service
establishments.
2. Appoint local importers specialized in the food service industry to import and market the exporter’s
food products to the food service establishments.
3. Target the mid to high-end food service establishments.
4. Acquire halal certification from recognized Islamic institutions in the US.
5. Maintain a product positioning strategy for the food products.
SECTION IV. BEST HIGH-VALUE PRODUCT PROSPECTS
Product
Category
2013
Imports
5Yr.
Avg.
Annual
Import
Growth
Import
Tariff
Rate
Key
Constraints
Over Market
Development
Market
Attractiveness
For USA
Infant
food,
including
dairy
products
344,336
tons
($1.2
billion)
11%
growth
No import duties
are levied on
infant milk/food.
Food cultural
barriers exist.
Malaysian
mothers appear
to prefer cereal
based infant
foods.
Locally
prepared and
packed dairy
products of
Nestlé, Danone
Dumex and
Dutch Baby
have a strong
hold on the
market.
The USA is
already the major
supplier for
bottled infant
food and the
market is
upgrading on the
back of higher
disposable
incomes.
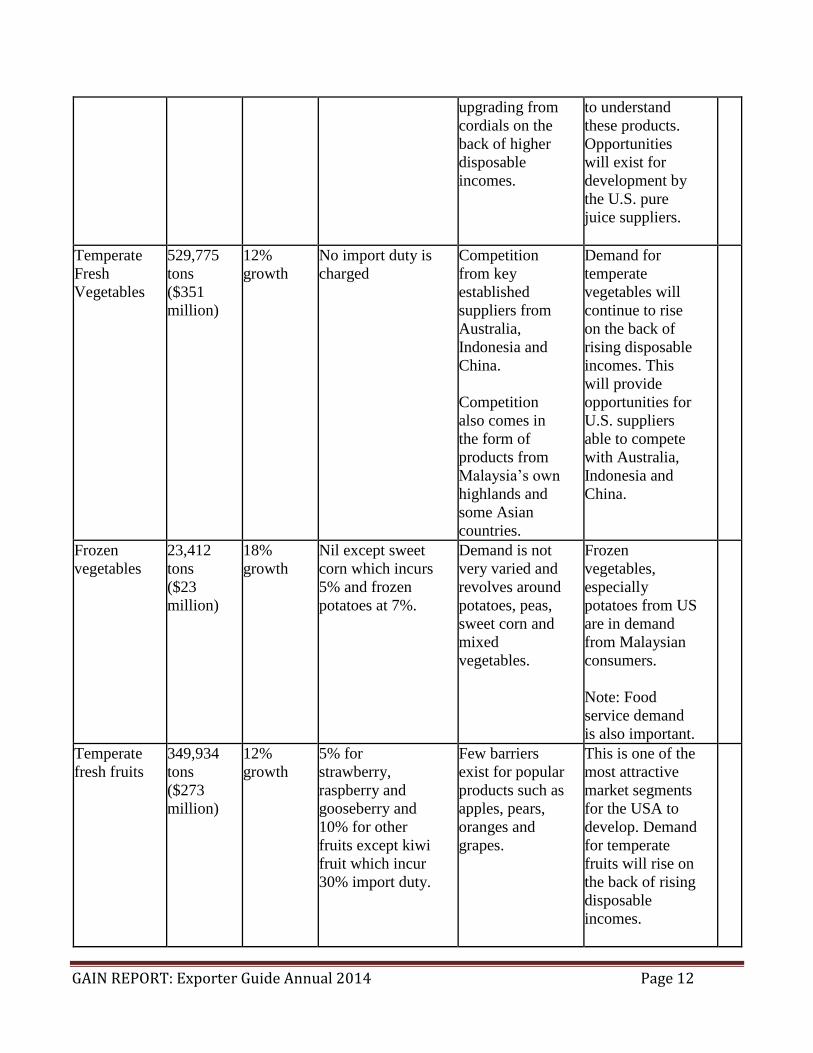
Fruit juices
34,667
tons
($68
million)
10%
growth
20% except for
pineapple juice
which incurs 30%.
The retail
market for fruit
juices is
growing, the
market is
This market is
likely to become
more dynamic in
future as
Malaysians start
GAIN REPORT: Exporter Guide Annual 2014 Page 12
upgrading from
cordials on the
back of higher
disposable
incomes.
to understand
these products.
Opportunities
will exist for
development by
the U.S. pure
juice suppliers.
Temperate
Fresh
Vegetables
529,775
tons
($351
million)
12%
growth
No import duty is
charged
Competition
from key
established
suppliers from
Australia,
Indonesia and
China.
Competition
also comes in
the form of
products from
Malaysia’s own
highlands and
some Asian
countries.
Demand for
temperate
vegetables will
continue to rise
on the back of
rising disposable
incomes. This
will provide
opportunities for
U.S. suppliers
able to compete
with Australia,
Indonesia and
China.
Frozen
vegetables
23,412
tons
($23
million)
18%
growth
Nil except sweet
corn which incurs
5% and frozen
potatoes at 7%.
Demand is not
very varied and
revolves around
potatoes, peas,
sweet corn and
mixed
vegetables.
Frozen
vegetables,
especially
potatoes from US
are in demand
from Malaysian
consumers.
Note: Food
service demand
is also important.
Temperate
fresh fruits
349,934
tons
($273
million)
12%
growth
5% for
strawberry,
raspberry and
gooseberry and
10% for other
fruits except kiwi
fruit which incur
30% import duty.
Few barriers
exist for popular
products such as
apples, pears,
oranges and
grapes.
This is one of the
most attractive
market segments
for the USA to
develop. Demand
for temperate
fruits will rise on
the back of rising
disposable
incomes.

GAIN REPORT: Exporter Guide Annual 2014 Page 13
Dried
fruits
29,781
tons
($27
million)
23%
growth
10% except for
Dates, which
incur no import
duty.
Mature
traditional
demand exists
except for dates
which are
growing rapidly
on the back of
rising
disposable
incomes.
Attractive to U.S.
suppliers with
market driven
approach to
business with
Malaysia.
Edible nuts 87,362
tons
($115.4
million)
19%
growth
Nil, except for
roasted
groundnuts which
incurs 20% import
duty.
Major demand
growth is from
the food
industry.
This market
should not be
ignored. The
USA is already
the major
supplier and the
market is
upgrading on the
back of higher
disposable
incomes.
Dog and
cat food
for retail
sale
58,129
tons
($95
million)
16%
growth
No import duties
are levied on dog
or cat food.
Few constraints/
barriers exist
under
conditions
where
disposable
incomes are
growing.
Attractive for
committed
suppliers wishing
to actively
develop markets
on a long-term
basis.
SECTION V. KEY CONTACTS AND FURTHER INFORMATION
If you have any questions or comments regarding this report or need assistance exporting high value
products to Malaysia, please contact the Office of Agricultural Affairs at the U.S. Embassy in Kuala
Lumpur at the following address:
Office of the Agricultural Affairs
Unit 4210
DPO AP 96535
Tel : (011-60-3) 2168-5082
Fax : (011-60-3) 2168-5023

GAIN REPORT: Exporter Guide Annual 2014 Page 14
E-mail: [email protected]
For more information on exporting U.S. agricultural products to other countries, please visit the Foreign
Agricultural Service homepage: http://www.fas.usda.gov.
Malaysian Regulatory Agencies / Other Trade Contacts
Director
Food Safety and Quality Division
Ministry of Health Malaysia
Level 3, Block E7, Parcel E
Federal Government Administration Center
Putrajaya 62518
Tel: +6-03-8883-3888
Fax: +6-03-8889-4971
http://fsq.moh.gov.my/v4/
Director General of Customs
Royal Customs and Excise Headquarters Malaysia
Ministry of Finance Complex
Precinct 2, Federal Government Administration Center
62596 Putrajaya.
Tel : +(6-03) 8882 2100
Fax : +(6-03) 8889 5899
http://www.customs.gov.my
Director
Veterinary Public Health
Department of Veterinary Services,
Wisma Tani, Podium Block,
Lot 4G1, Prescinct 4, Putrajaya.
Tel: +60-3 8870 2000
Fax: +60-3 8888 6051
Website: www.dvs.gov.my

GAIN REPORT: Exporter Guide Annual 2014 Page 15
APPENDIX 1. STATISTICS
KEY TRADE & DEMOGRAPHIC INFORMATION
Agricultural Imports From All Countries (US$Mil) / U.S. Market Share (%)
17,261/6%
Consumer Food Imports From All Countries (US$Mil) / U.S. Market Share (%)
6,023/9%
Edible Fishery Imports From All Countries (US$Mil) / U.S. Market Share (%)
996/3%
Total Population (Millions) / Annual Growth Rate (%)
29.71/1.8%
Urban Population (Millions) / Annual Growth Rate (%)
20.8/ 2.5%
Number of Major Metropolitan Areas
11
Size of Middle Class (Millions) / Growth Rate (%) (estimate)
17 / 2.5%
Per Capita Gross Domestic Product (US Dollars)
$9,827
Unemployment Rate (%)
3.1%
Per Capita Food Expenditures (U.S. Dollars)
$1,500
Percent of Female Population Employed
52.4%
Exchange rate (US$1 = X.X local currency) (Apr 28, 2014)
US$ = 3.271 RM
GAIN REPORT: Exporter Guide Annual 2014 Page 16
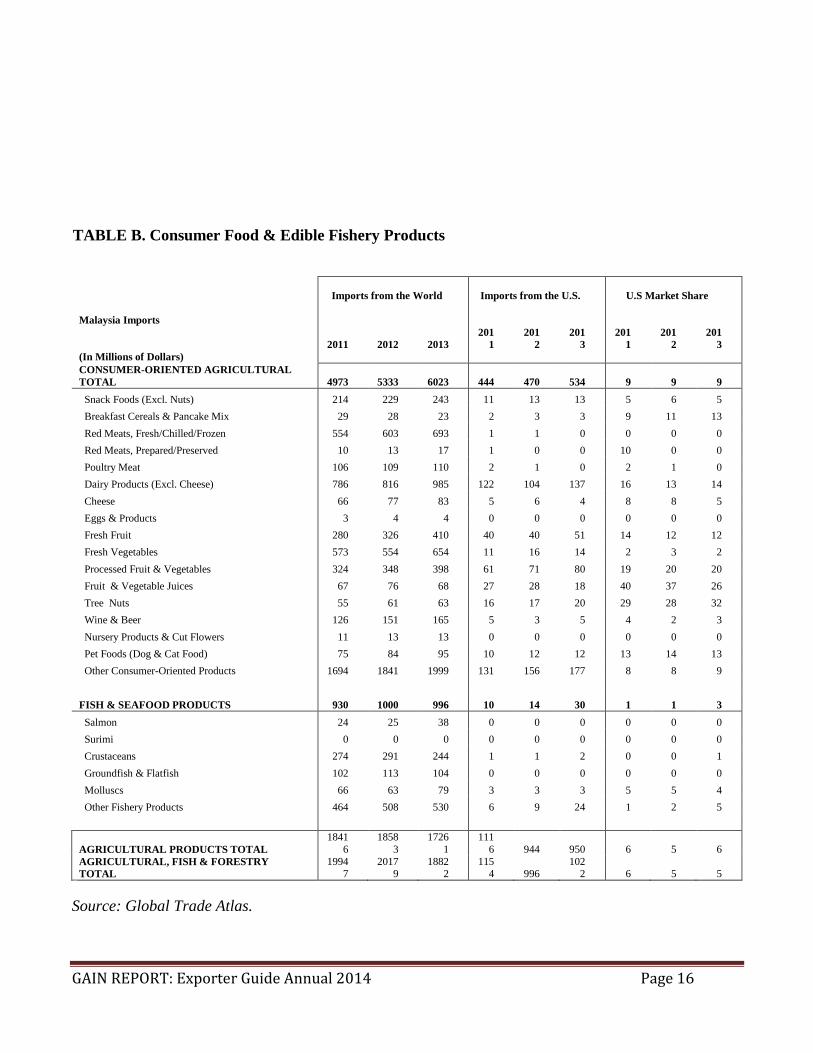
TABLE B. Consumer Food & Edible Fishery Products
Malaysia Imports
Imports from the World
Imports from the U.S.
U.S Market Share
(In Millions of Dollars)
2011
2012
2013
201
1
201
2
201
3
201
1
201
2
201
3
CONSUMER-ORIENTED AGRICULTURAL
TOTAL 4973 5333 6023 444 470 534 9 9 9
Snack Foods (Excl. Nuts) 214 229 243 11 13 13 5 6 5
Breakfast Cereals & Pancake Mix 29 28 23 2 3 3 9 11 13
Red Meats, Fresh/Chilled/Frozen 554 603 693 1 1 0 0 0 0
Red Meats, Prepared/Preserved 10 13 17 1 0 0 10 0 0
Poultry Meat 106 109 110 2 1 0 2 1 0
Dairy Products (Excl. Cheese) 786 816 985 122 104 137 16 13 14
Cheese 66 77 83 5 6 4 8 8 5
Eggs & Products 3 4 4 0 0 0 0 0 0
Fresh Fruit 280 326 410 40 40 51 14 12 12
Fresh Vegetables 573 554 654 11 16 14 2 3 2
Processed Fruit & Vegetables 324 348 398 61 71 80 19 20 20
Fruit & Vegetable Juices 67 76 68 27 28 18 40 37 26
Tree Nuts 55 61 63 16 17 20 29 28 32
Wine & Beer 126 151 165 5 3 5 4 2 3
Nursery Products & Cut Flowers 11 13 13 0 0 0 0 0 0
Pet Foods (Dog & Cat Food) 75 84 95 10 12 12 13 14 13
Other Consumer-Oriented Products 1694 1841 1999 131 156 177 8 8 9
FISH & SEAFOOD PRODUCTS 930 1000 996 10 14 30 1 1 3
Salmon 24 25 38 0 0 0 0 0 0
Surimi 0 0 0 0 0 0 0 0 0
Crustaceans 274 291 244 1 1 2 0 0 1
Groundfish & Flatfish 102 113 104 0 0 0 0 0 0
Molluscs 66 63 79 3 3 3 5 5 4
Other Fishery Products 464 508 530 6 9 24 1 2 5
AGRICULTURAL PRODUCTS TOTAL
1841
6
1858
3
1726
1
111
6 944 950 6 5 6
AGRICULTURAL, FISH & FORESTRY
TOTAL
19947
20179
18822
1154 996
1022 6 5 5
Source: Global Trade Atlas.

GAIN REPORT: Exporter Guide Annual 2014 Page 17
Table C: Top 5 Suppliers of Consumers Foods &
Top 10 Suppliers of Edible Fishery Products
CONSUMER-ORIENTED AGRICULTURAL TOTAL – ($1,000)
RANK IMPORT MARKET 2011 2012 2013
1 CHINA 825,290 797,796 909,833
2 NEW ZEALAND 584,957 607,613 695,588
3 INDIA 609,567 613,579 694,310
4 UNITED STATES 444,260 469,513 533,754
5 THAILAND 391,093 438,039 525,531
OTHERS 2,117,494 2,406,783 2,664,398
TOTAL 4,972,661 5,333,325 6,023,414
FISH & SEAFOOD PRODUCTS – ($1,000)
RANK IMPORT MARKET 2011 2012 2013
1 CHINA 301,987 304,948 279,203
2 INDONESIA 155,303 184,202 187,328
3 THAILAND 146,290 165,883 142,934
4 VIETNAM 50,367 55,084 67,761
5 INDIA 39,736 34,879 50,652
6 MYANMAR 39,405 38,694 38,404
7 NORWAY 18,232 21,570 30,095
8 UNITED STATES 10,101 13,838 29,673
9 JAPAN 16,881 23,048 24,387
10 CHILE 9,682 13,178 20,093
OTHERS 141,898 144,968 125,239
TOTAL 929,881 1,000,291 995,768
Source: Global Trade Atlas.
END OF REPORT

GAIN REPORT: Exporter Guide Annual 2014 Page 18