Embed Size (px)
Citation preview
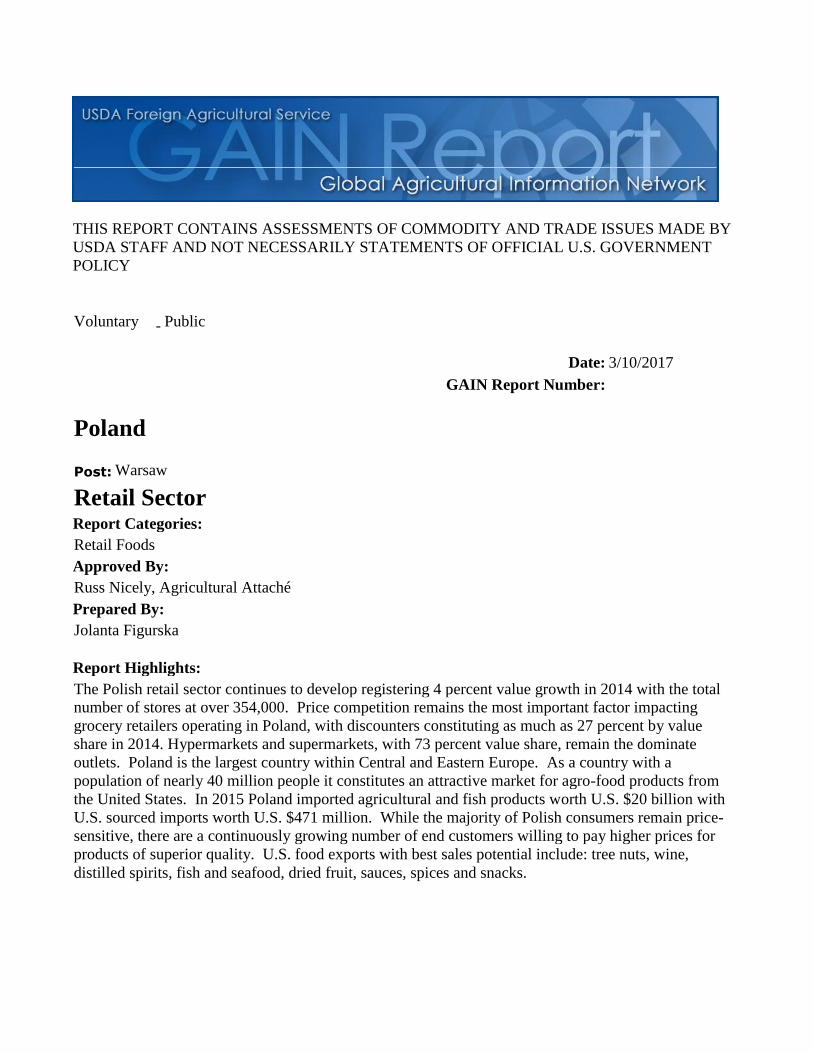
THIS REPORT CONTAINS ASSESSMENTS OF COMMODITY AND TRADE ISSUES MADE BY
USDA STAFF AND NOT NECESSARILY STATEMENTS OF OFFICIAL U.S. GOVERNMENT
POLICY
-
Date:
GAIN Report Number:
Post:
Report Categories:
Approved By:
Prepared By:
Report Highlights:
The Polish retail sector continues to develop registering 4 percent value growth in 2014 with the total
number of stores at over 354,000. Price competition remains the most important factor impacting
grocery retailers operating in Poland, with discounters constituting as much as 27 percent by value
share in 2014. Hypermarkets and supermarkets, with 73 percent value share, remain the dominate
outlets. Poland is the largest country within Central and Eastern Europe. As a country with a
population of nearly 40 million people it constitutes an attractive market for agro-food products from
the United States. In 2015 Poland imported agricultural and fish products worth U.S. $20 billion with
U.S. sourced imports worth U.S. $471 million. While the majority of Polish consumers remain price-
sensitive, there are a continuously growing number of end customers willing to pay higher prices for
products of superior quality. U.S. food exports with best sales potential include: tree nuts, wine,
distilled spirits, fish and seafood, dried fruit, sauces, spices and snacks.
Jolanta Figurska
Russ Nicely, Agricultural Attaché
Retail Foods
Retail Sector
Warsaw
Poland
3/10/2017
Public Voluntary

General Information:
SECTION I. MARKET SUMMARY
During 2015 Poland’s economy recovered from the 2012-13 economic slowdown, growing by 3.9
percent thanks to continuously increasing domestic demand. A slight slowdown in real GDP growth to
2.6 percent is expected for 2016. The forecast slowdown 2016-17 will result from unexpected
deterioration in economic policies, applied by Poland’s new Government, sworn in November 2015, as
it tries to deliver on its costly populist election declarations. Policies of the newly elected government
sworn in November 2015, could lead to decline in economic growth if the ruling party follows through
on promises to provide support for larger families.
Table 1. Basic Economic Indicators
2016a 2017
b 2018b 2019
b
Real GDP growth 2.8 3.2 3.0 3.0
Unemployment rate (av) 9.0 9.2 8.9 8.9
Consumer price inflation (av. National measure) 0.9 1.3 1.5 1.0
Exports of good fob (U.S. $) 196.4 201.7 203.1 209.3
Imports of goods fob (U.S. $) 194.2 205.9 209.1 219.8
Exchange rate Zl:U.S. $ (av) 3.95 4.22 4.14 4.97
Source: Economist Intelligence Unit a
estimates and bforecasts.
In 2015 Poland imported total agricultural and fish products worth U.S. $20 billion, with imports
originating from the United States worth U.S. $471 million, a 2.25 percent share.
In 2015 Polish imports of consumer oriented food products amounted to U.S. $9 billion, with imports
originating from the United States worth U.S. $133 million.
Poland’s import of fish and seafood products also continues to grow and reached U.S. $1.7 billion, with
U.S. $55 million (3.2 percent market share) originating from the United States. The first direct import
of U.S. cod contributed to this positive result in 2015.

Table 2. Poland - Imports of agricultural and fish products 2015,
in billion U.S. $
Agricultural Total, total imports 20
Agricultural Total, imports from U.S.A. 0.4 (2.2%)
Intermediate Agricultural Products, total imports 4.5
Intermediate Agricultural Products, imports from U.S.A. 0.1 (2.5%)
Consumer-Oriented Agricultural Products, total imports 9
Consumer-Oriented Agricultural Products, imports from U.S.A. 0.1 (1.4%)
Fish and Seafood Products, total imports 1.7
Fish and Seafood Products, imports from U.S.A. 0.5 (3.2%)
Source: Global Trade Atlas
Poland views the United States positively and U.S. products are considered to be of high quality.
Product that has been imported into the EU can be transported to Poland without additional tariffs and
without meeting additional regulatory requirements aside from required labeling in Polish language.
Annual disposable income in Poland continues to grow, yet constitutes just over 40 percent of that
recorded in the western countries of the European Union.
Table 3. Consumer expenditures and Annual Disposable income
Poland
2013 2014 2015
Consumer Expenditure (U.S. $ million)
31
8 32
7 33
4
Annual Gross Income (U.S. $ million)
42
8 44
3 45
5
Annual Disposable Income (U.S. $ million)
32
1 33
1 34
0
Source: Euromonitor 2015
Over 61 percent of Poland’s population lives in urban areas. The median age, 38 years, is rising. A
trend towards smaller families is becoming more apparent in Poland’s 13 million households, with an
average household size of 3 people. The typical Polish family eats together at meal times and
households buy food stocks for only a few days at a time. Poland’s GDP at Purchasing Power Parity
per capita increased from U.S. $26,017 in 2015 to U.S. $27,802 in 2016 according to Economist
Intelligence Unit data.
Over the past five years per capita consumption of processed food products remains stable. Products
such as wine, animal fats, sugar, fruit and vegetables noted a slight increase in per capita consumption
in 2014.
Table 4. Poland - Consumption of selected consumer goods per capita

Consumer goods Unit of measure 2013 2014
Grain of 4 cereals
(in terms of processed products) kg 10
8 10
6
Potatoes kg 10
2 10
1
Vegetables kg 10
2 10
4
Fruit kg 46
.0 47
.0
Meat and edible offal kg 67
.5 73
.6
of which meat: kg 63
.8 69
.5
Beef kg 1.
5 1.
6
pork kg 35
.5 39
.1
Poultry kg 26
.5 28
.2
Animal edible fats kg 5.
1 5.
5
Butter kg 4.
1 4.
2
Cow’s milk l 20
6 20
5
Hen eggs units 14
8 15
5
Sugar kg 41
.9 44
.3
Vodkas, liqueurs, other alcoholic beverages in terms of 100% l 3.
6 3.
2
Wine and honey wine l 5.
8 6.
3
Beer from malt l 97
.7 98
.9
Source: Euromonitor
Poland’s 38 million consumers constitute the single largest market for food and beverages within the
Central Eastern Europe region. Based on Euromonitor data in 2014 grocery retailers registered 4
percent current value growth reaching PLN 195 billion (U.S. $52 billion), with total number of stores
remaining at over 354,000. Hypermarkets and supermarkets, with 73 percent value share, remain the
dominating categories; while discounters constituted 27 percent of value share in 2014.
Table 5. Poland – Data on Internal Trade in 2014

Specification 2014
Sales area of shops in thous. m² 34964
of which: Department stores 330
Trade stores 227
Supermarkets 4960
Hypermarkets 3802
Total number of shopsb 354775
of which: Department stores 66
Trade stores 217
Supermarkets 6509
Hypermarkets 593
Petrol stations 8905
Population per 1 shopb 108
Total number of marketplaces 8939
Number of permanent marketplaces 2210
Number of seasonal marketplaces 6729
Source: Poland Internal Market 2014, Report by Polish Statistical Office
The current market share division is expected to continue as traditional grocery retailers are forecast to
lose market share through 2019. Within the 2014-2019 period Modern Grocery Retailers are forecast to
grow some 27 percent, while Traditional Grocery Retailers are forecast to decline by over 8 percent.
Table 6. Poland Forecast Grocery Retailers Outlets by Channel: % Unit Growth 2014-2019
% unit growth 2014/15
2014-19 Compound
Annual Growth Rate 2014/19 Total
Modern Grocery Retailers 3.8 5.0 27.4
- Convenience Stores 4.8 6.4 36.2
- Discounters 4.0 5.2 29.1
- Forecourt Retailers -0.4 -0.2 -1.2
-- Chained Forecourts 1.3 1.5 7.6
-- Independent Forecourts -4.1 -3.7 -17.0
- Hypermarkets 2.2 2.5 13.4
- Supermarkets 3.0 3.7 19.9
Traditional Grocery Retailers 0.8 -1.7 -8.4
- Food/Drink/Tobacco Specialists -2.2 -3.1 -14.7
- Independent Small Grocers 2.0 -1.2 -5.8
- Other Grocery Retailers -2.8 -3.0 -14.2
Grocery Retailers 1.7 0.1 0.7
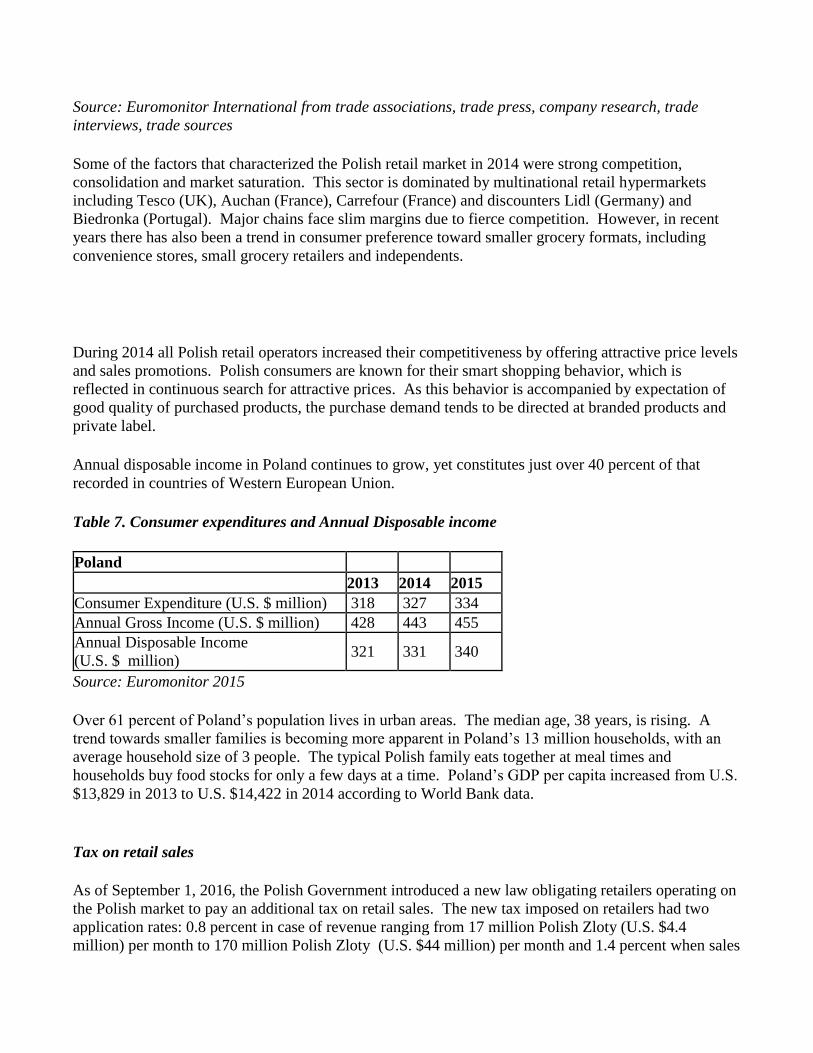
Source: Euromonitor International from trade associations, trade press, company research, trade
interviews, trade sources
Some of the factors that characterized the Polish retail market in 2014 were strong competition,
consolidation and market saturation. This sector is dominated by multinational retail hypermarkets
including Tesco (UK), Auchan (France), Carrefour (France) and discounters Lidl (Germany) and
Biedronka (Portugal). Major chains face slim margins due to fierce competition. However, in recent
years there has also been a trend in consumer preference toward smaller grocery formats, including
convenience stores, small grocery retailers and independents.
During 2014 all Polish retail operators increased their competitiveness by offering attractive price levels
and sales promotions. Polish consumers are known for their smart shopping behavior, which is
reflected in continuous search for attractive prices. As this behavior is accompanied by expectation of
good quality of purchased products, the purchase demand tends to be directed at branded products and
private label.
Annual disposable income in Poland continues to grow, yet constitutes just over 40 percent of that
recorded in countries of Western European Union.
Table 7. Consumer expenditures and Annual Disposable income
Poland
2013 2014 2015
Consumer Expenditure (U.S. $ million) 318 327 334
Annual Gross Income (U.S. $ million) 428 443 455
Annual Disposable Income (U.S. $ million)
321 331 340
Source: Euromonitor 2015
Over 61 percent of Poland’s population lives in urban areas. The median age, 38 years, is rising. A
trend towards smaller families is becoming more apparent in Poland’s 13 million households, with an
average household size of 3 people. The typical Polish family eats together at meal times and
households buy food stocks for only a few days at a time. Poland’s GDP per capita increased from U.S.
$13,829 in 2013 to U.S. $14,422 in 2014 according to World Bank data.
Tax on retail sales
As of September 1, 2016, the Polish Government introduced a new law obligating retailers operating on
the Polish market to pay an additional tax on retail sales. The new tax imposed on retailers had two
application rates: 0.8 percent in case of revenue ranging from 17 million Polish Zloty (U.S. $4.4
million) per month to 170 million Polish Zloty (U.S. $44 million) per month and 1.4 percent when sales

exceed 170 million Polish Zloty (U.S. $ 44 million) per month. Sales under 17 million Polish Zloty
(U.S. $4.4 million) per month were tax-free. Revenue taken into account when calculating the new tax
excluded Value Added Tax and sales between businesses.
On September 19, 2016, the European Commission opened an in-depth investigation into Poland's tax
on the retail sector requiring Poland to suspend the application of the tax until the Commission
concludes its assessment. In reply Poland’s Government suspended the implementation of the tax on
September 20, 2016 and vowed to press on with some form of a new tax against big supermarkets. On
October 14, 2016 Polish Ministry of Finance spokesman announced that the next attempts to introduce
retail tax in Poland are postponed till January 1, 2018.
Retail operations to be closed on Sundays
After a recent attempt to introduce a new retail tax failed, the Polish retail sector is likely to see further
changes as the desire to prohibit retail operations on Sunday’s gains more and more supporters.
Over 500,000 Poles signed a petition supporting such a change and the new law is under discussion by
the Polish Parliament. The proposed new law was submitted by a Legislative Initiative Committee
consisting of labor union “Solidarnosc” (Solidarity) and other social organizations, Catholic
organizations, workers and employers’ organizations. Describing the basis for the petition, the
committee members stress the need for individuals working within Poland’s retail sector on Sundays to
have time for family life one day in the week. In addition to the submitted proposal, representatives of
all major parties within the Poland’s Parliament also contributed to the draft law text. As the proposed
new law appears to be supported by a majority within the Polish Parliament, it is likely that it will be
successfully adopted before the end of 2016.
The current proposal includes numerous exceptions allowing for some trade on Sundays. Sales may be
permitted at gas stations, bakeries, convenience stores located at railway stations and airports or at
newsstands. Small shops will be permitted to operate provided that sales will be conducted by their
owners. The effort envisages establishment of so-called ”Trading Sundays” during the year on seven
occasions. Additionally, stores are also to be open on the Sundays preceding Christmas and Easter.
The exact economic effect of this change is difficult to determine as many different alternative versions
of applications of this law are under consideration. One such proposal envisages stores being closed
only on the first Sunday of the month or on the last three Sundays of the month – allowing the
Government to evaluate scale of economic costs of full implementation of the proposal.
Trends in food retailing
The following changes are expected in Polish retail trade:
Increased importance of large-area trade outlets in the structure and revenue of the retail trade;
with continued mergers and buy-outs among large chains;
Increased importance of companies owning chains of stores, with continued integration among

small and medium companies;
A decreasing number of specialized shops which represent just over 5 percent of the total
number of shops. These shops will close, or will enlarge their product lines with new items;
Corner and Mom & Pop Shops located in large cities will continue to close, because of
increasing competition from super/hypermarkets and service sectors (e.g. Banks, which present
higher rent offers);
An increasing number of small shops continue to be opened in rural areas. Those small shops
are bound to face competition from foreign chains introducing smaller shop formats e.g.
Carrefour Express outside of central urban areas;
Increasing importance of private label goods;
Polish consumers will increasingly expect high quality food products, at the same time
remaining very price sensitive;
Increase of preference for convenience, health (incl. organic as well as “free from …” products),
as well as high end products, among emerging Polish upper class consumers (10 percent of 38
million population) is likely to impact future of food retailing in Poland;
Polish consumers, following the European Union tendency, are becoming interested in various
ratings and tests conducted by consumer organizations and individual bloggers involved in
investigating and comparing goods and services in an unbiased way. Opinions expressed by
consumer organizations and bloggers are likely to influence purchasing decisions in Poland.
Advantages and Challenges of the Polish Retail Market for U.S. Exporters
Advantages Challenges
Central Europe’s most populous country with a
domestic consumer market of nearly 40 million
people.
U.S. products face high transportation
costs as compared to many European
competitors.
A strategic location within a dense, major international
market offering re-export potential. Complicated system of product
registration in some cases delaying or even
preventing products from entering the
Polish market that are new to the EU.
Economic growth has been rising, and with major
international food processors having established
factories in Poland; this market offers great potential
for ingredients from the U.S. e.g. at Cash&Carry
stores.
Poland’s EU Membership puts United
States products at a competitive
disadvantage versus EU-28 duty-free
internally traded products.
Poles travel extensively and bring back home openes
to new tastes and knowledge of internationaly
promoted United States products.
Retailers operating on the Polish market in
most cases do not conduct direct import;
extending distribution chain to include an
obligatory importer.
Products from the United States enjoy good reputation
on the polish market. Listing fees required by retailers and
funding needed for creation of brand
awareness hamper the introduction of new
brands from the United States.
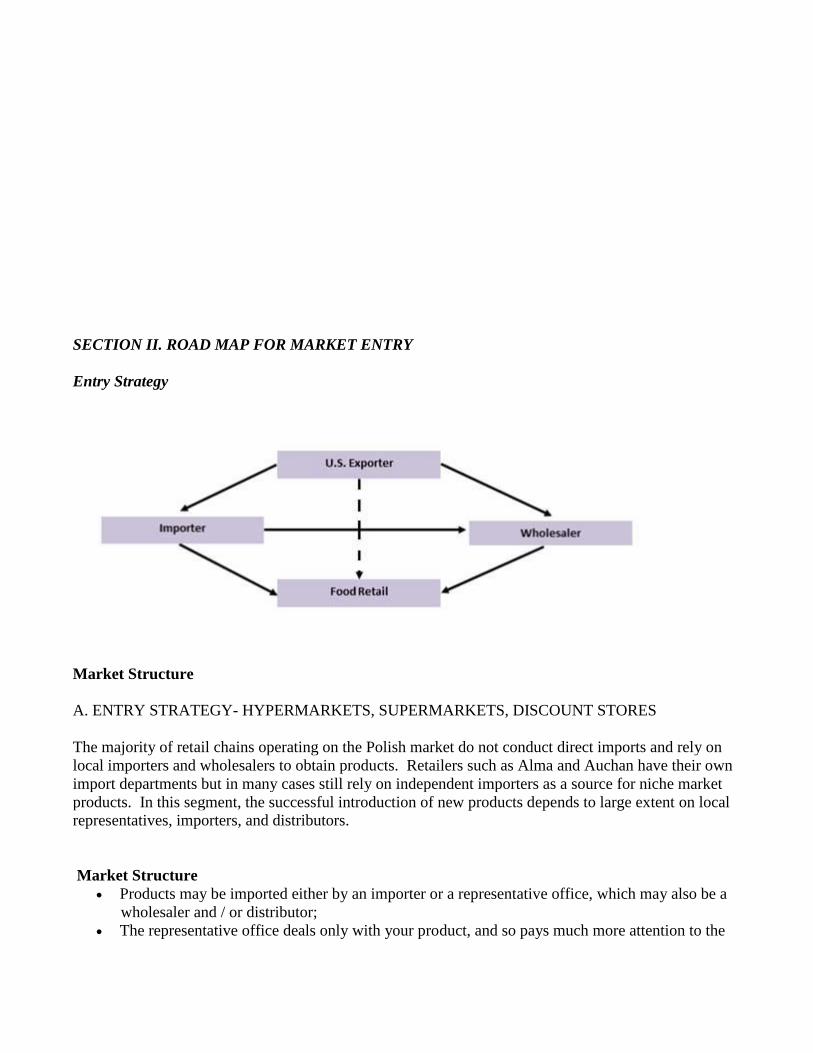
SECTION II. ROAD MAP FOR MARKET ENTRY
Entry Strategy
Market Structure
A. ENTRY STRATEGY- HYPERMARKETS, SUPERMARKETS, DISCOUNT STORES
The majority of retail chains operating on the Polish market do not conduct direct imports and rely on
local importers and wholesalers to obtain products. Retailers such as Alma and Auchan have their own
import departments but in many cases still rely on independent importers as a source for niche market
products. In this segment, the successful introduction of new products depends to large extent on local
representatives, importers, and distributors.
Market Structure
Products may be imported either by an importer or a representative office, which may also be a
wholesaler and / or distributor;
The representative office deals only with your product, and so pays much more attention to the

promotion, advertising, and marketing activities than an importer who buys many, sometimes
even competitive, products;
Some hypermarkets/supermarkets are direct importers (e.g. Auchan, Alma Delicatessen Chain);
Importers are distinctly separated into dry goods, refrigerated items, fruits and vegetables,
alcohol, etc.;
Importers or representative offices may use nation-wide logistic organizations for the storage and
distribution of imported products;
Importers also have their own distribution networks.
Typical conditions for a supplier when entering retail chains operating on the Polish market:
Entry fees (amounting to tens of thousands of Polish zlotys), which are not paid back if the
agreement is canceled;
30-60 day terms of payment;
Considerable price discount - about 10 percent of regular price;
Obligatory participation in promotional activities, which are held 3-5 times a year and last for 1-
3 weeks.
Obligatory participation in covering the cost of advertising of promoted products;
Slotting fees (U.S. $250-5,000) for placing each type of product on the shelf;
Fees for the “display area”;
No opportunity to influence the “shelf price” level;
Very strict delivery terms (exact date and time frame e.g. March 2, 2016 12:00-14:00).
Supplier contracts may vary from one to another and all clauses depend on negotiations of the interested
parties.
Company Profiles
This sector is dominated by multinational retail hypermarkets incl. Tesco (UK), Auchan (France),
Carrefour (France) and discounters Lidl (Germany) and Biedronka (Portugal). Major chains face slim
margins due to fierce competition.
During 2016 one of the leading Polish retail chains MarcPol (60 stores located nationwide) went out of
business. Key store locations of MarcPol stores were in most cases taken over by neighborhood stores
operators including chains such as: Leviatan, Spolem and Carrefour Express.
Leading high end food product chain Alma experienced major financial difficulties during 2016; and
while the company is currently undergoing a restructuring effort, sector experts are of opinion that it
may be forced to close its remaining stores in 2017.
Key high end food market player is a Polish retail chain “Piotr i Pawel” with 143 stores located
throughout Poland.
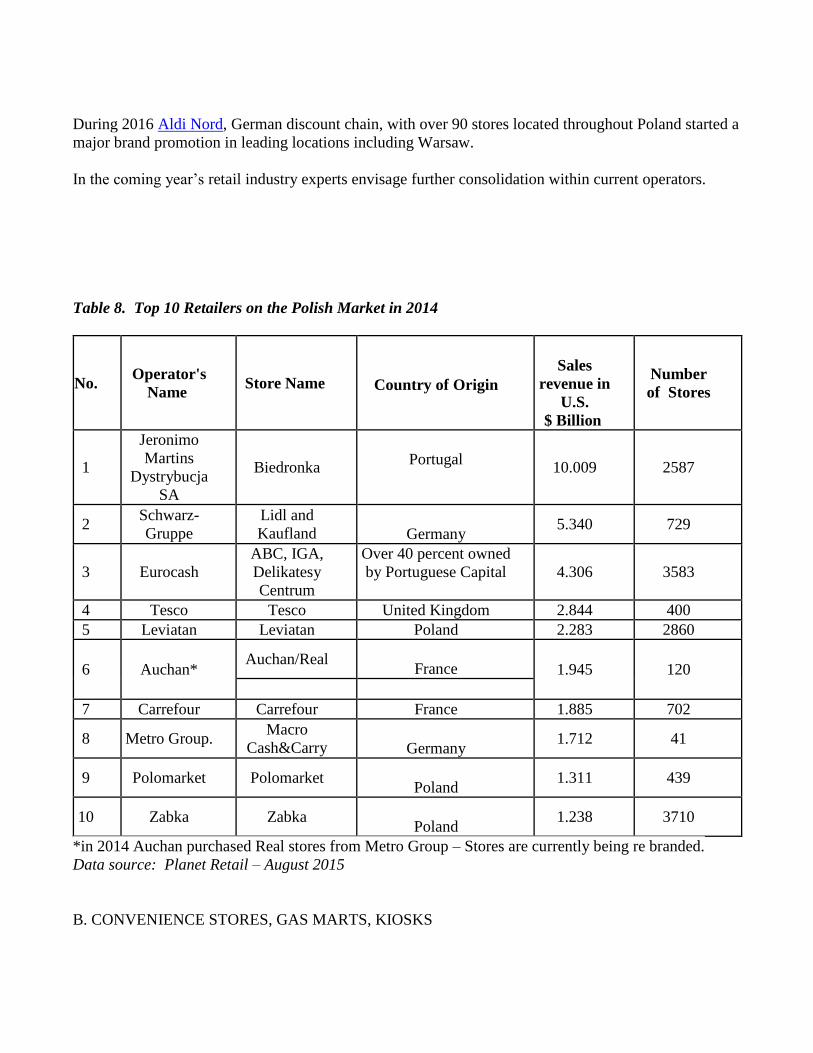
During 2016 Aldi Nord, German discount chain, with over 90 stores located throughout Poland started a
major brand promotion in leading locations including Warsaw.
In the coming year’s retail industry experts envisage further consolidation within current operators.
Table 8. Top 10 Retailers on the Polish Market in 2014
No. Operator's
Name Store Name
Country of Origin
Sales
revenue in U.S.
$ Billion
Number
of Stores
1
Jeronimo
Martins Dystrybucja
SA
Biedronka
Portugal
10.009 2587
2 Schwarz-
Gruppe Lidl and
Kaufland
Germany 5.340 729
3 Eurocash ABC, IGA,
Delikatesy
Centrum
Over 40 percent owned
by Portuguese Capital 4.306 3583
4 Tesco Tesco United Kingdom 2.844 400
5 Leviatan Leviatan Poland 2.283 2860
6 Auchan* Auchan/Real
France 1.945 120
7 Carrefour Carrefour France 1.885 702
8 Metro Group. Macro
Cash&Carry
Germany 1.712 41
9 Polomarket Polomarket
Poland 1.311 439
10 Zabka Zabka
Poland 1.238 3710
*in 2014 Auchan purchased Real stores from Metro Group – Stores are currently being re branded.
Data source: Planet Retail – August 2015
B. CONVENIENCE STORES, GAS MARTS, KIOSKS
There are two ways to place new products on shelves depending on the type of product. Either an
exporter should use an importer or representative for direct personal contact with the shops, or shop
managers supply themselves from the wholesalers who may import the products. In this case goods
should be available in several regional wholesale units, where smaller wholesalers and retailers collect
them.
Company Profiles
Convenience stores, gas station marts, and kiosks are very fragmented sectors, with each retail outlet
often having a different owner even within one chain or a brand due to franchising and licenses. Over
the last ten years the traditional kiosk operator Ruch (currently owned by private equity company)
gained strong competition in form of over 400 Inmedio and 1 Minute kiosks (Eurocash Company holds
over 51 percent of shares). Kiosks/small convenience stores mostly carry newspapers and magazines,
snacks, drinks and other convenience products that take up increasingly greater shelf space. This sector
consists of small units employing up to 5 people. Since Polish law does not obligate entities employing
fewer than 5 people to deliver statistical information, it is difficult to illustrate in detail the market
situation.
There are about 6,750 petrol stations in Poland. A majority of these stations also offer gas marts.
Polish refinery Orlen is the market leader, holding over 55 percent of the market share. The remainder
of the gas station market is controlled by the Polish Refinery Lotos and foreign companies including
BP, Shell, Statoil and Lukoil.
Convenience stores in Poland are increasingly popular. Leading players in convenience store and small
grocery store sectors include: Żabka , Spar Polska, Chata Polska, Eko Holding , Chorten, LD Holding,
Małpka, Polska Grupa Supermarketów, PSH Nasz Sklep, PHU Topaz.
The flagship of the sector, Zabka, has been on the market for over 15 years and now has over 4500
stores operating on a franchising base, with other companies also investing in convenience stores.
Carrefour, a hyper and supermarket chain also noticed the trend and opened smaller format stores
Carrefour Express for fast shopping of most basic products integrated into their hypermarkets.
C. TRADITIONAL MARKETS – “MOM and POP”, SMALL INDEPENDENT GROCERY STORES
AND WET MARKETS
There are two ways to place new products on shelves depending on the type of product. Either an
exporter should use an importer or representative for direct personal contact with the shops, or shop
managers supply themselves from the wholesalers who may import the products. In this case goods
should be available in several regional wholesale units, where smaller wholesalers and retailers collect
them.
Sub-Sector Profiles
“Mom and Pop” shops are very common in Poland. They are currently facing growing competition
from supermarkets, which are opening in smaller cities and towns. “Mom and Pop” shops are present
throughout the county, and are not limited to small towns and villages, being very popular in large
Polish cities. Little independent stores often lose the competition with big foreign supermarkets and
hypermarkets chains. A Polish Parliament regulation (from August 24th
, 2007) protects these small
independent shops, because only stores run by the owner may work on 13 Polish official holidays,
during which time hypermarkets and all larger stores are closed.
Traditional Markets vary significantly in size and facilities. In 2014 there were 2,210 registered regular
traditional markets. Additionally there were 6,729 seasonal traditional markets. Usually they consist of
open air and/or kiosk facilities in an area of 200-400m2 (2,150 – 4,305 square feet).
SECTION III. COMPETITION
Domestic producers and exporters from the European Union (mainly Germany, France, Italy, Great
Britain, Spain, Finland, and the Netherlands, which make up 50 percent of total Polish food imports) are
the main competitors for American food exporters. Dynamic development, of Polish producers and
foreign investors in the Polish food industry resulted in an increased variety of high quality product
being produced locally. Even classic American products like chewing gum, Coca-Cola or Pepsi are
produced in Poland. It should also be noted that Polish customers prefer Polish products over imported
ones, influencing shoppers to purchase products made in Poland. Many chains advertise the fact that
they offer Polish vegetables or other products to increase sales.
In 2015 Polish imports of consumer oriented food products amounted to U.S. $9 billion with imports
worth U.S. $133 million originating from the United States. The decrease in U.S. imports is attributed
to high unfavorable exchange rate of U.S.$ to Polish Zloty noted throughout 2015.
Table 9. Poland Import of consumer oriented food products (U.S. $ Millions)
Partner Country Millions United States Dollars % Share
2013 2014 2015 2013 2014 2015 World 9969 10438 9364 100.00 100.00 100.00 United States 128 136 133 1.28 1.30 1.43
Source: Global Trade Atlas
Domestic producers and exporters from the European Union (mainly Germany, France, Italy, Great
Britain, Spain, Finland, and the Netherlands, which make up 50 percent of total Polish food imports) are
the main competitors for American food exporters. Dynamic development of Polish producers and
foreign investors in the Polish food industry resulted in an increased variety of high quality product
being produced locally. Even classic American products like chewing gum, Coca-Cola or Pepsi are
produced in Poland. It should also be noted that Polish customers prefer Polish products over imported
ones, influencing shoppers to purchase products made in Poland. Many chains advertise the fact that
they offer Polish vegetables or other products to increase sales.
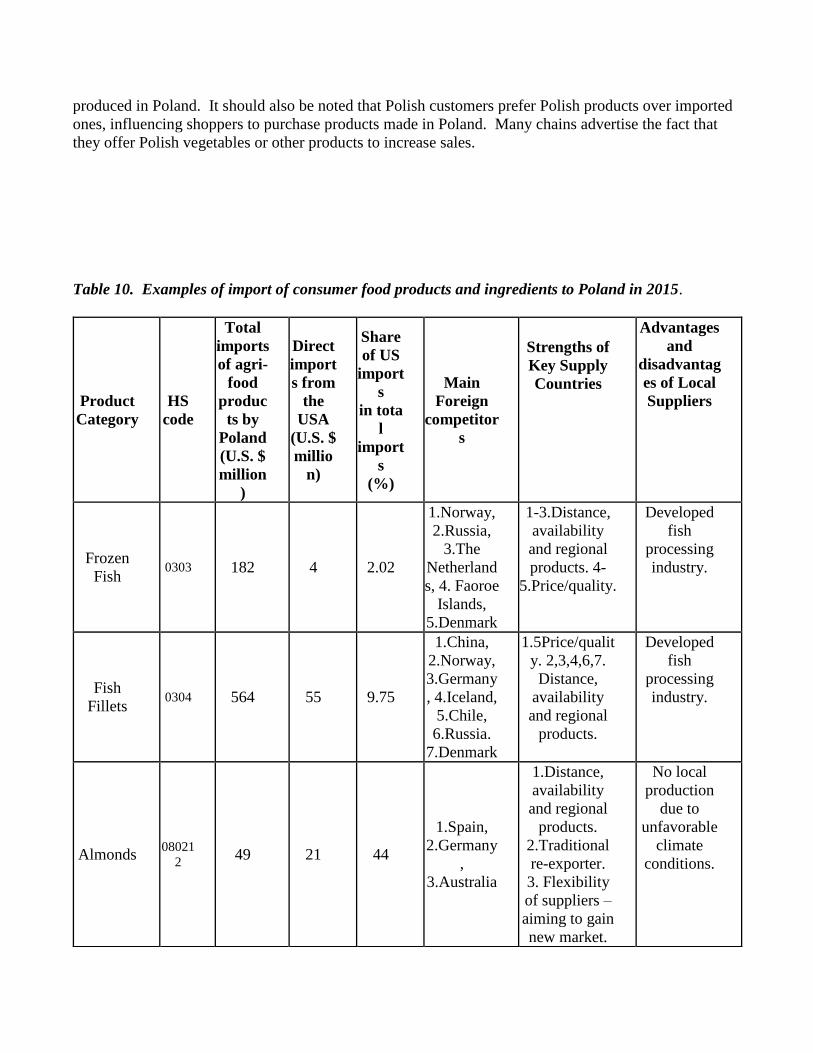
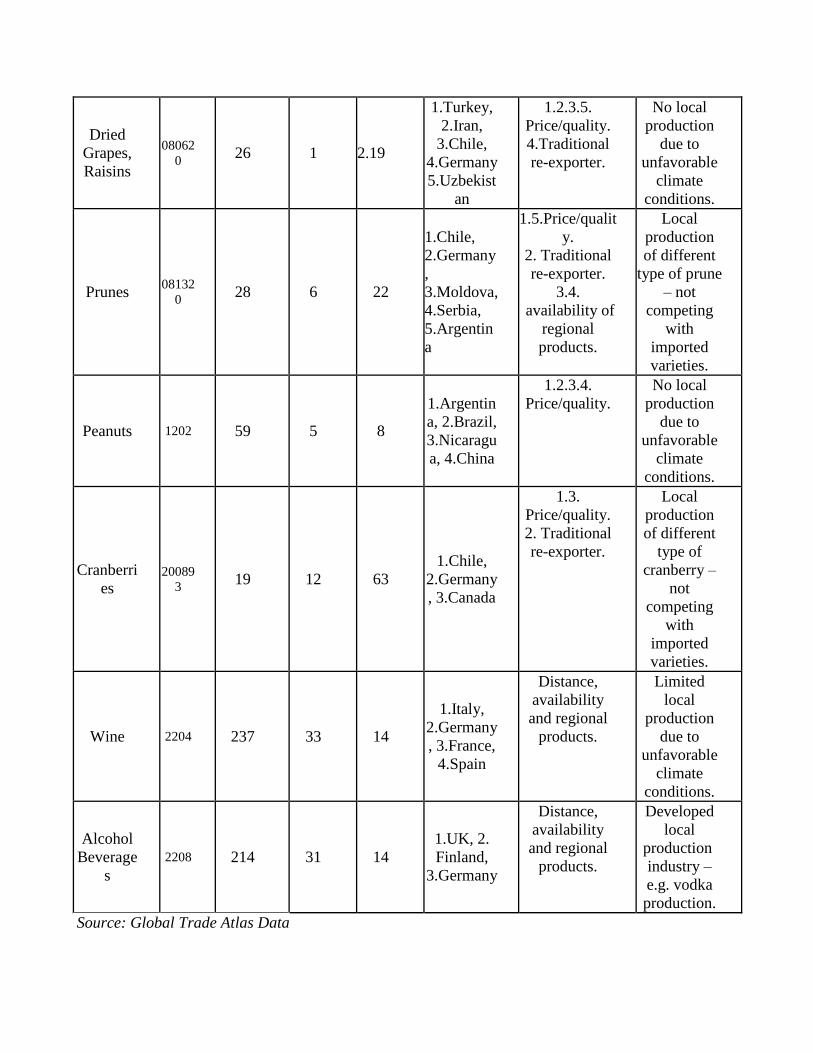
Table 10. Examples of import of consumer food products and ingredients to Poland in 2015.
Product
Category HS
code
Total
imports
of agri-
food
produc
ts by
Poland
(U.S. $
million
)
Direct
import
s from
the
USA
(U.S. $
millio
n)
Share
of US
import
s
in tota
l
import
s
(%)
Main
Foreign competitor
s
Strengths of
Key Supply
Countries
Advantages
and
disadvantag
es of Local
Suppliers
Frozen
Fish 0303 182 4 2.02
1.Norway,
2.Russia,
3.The
Netherland
s, 4. Faoroe
Islands, 5.Denmark
1-3.Distance,
availability
and regional
products. 4-
5.Price/quality.
Developed
fish
processing
industry.
Fish
Fillets 0304 564 55 9.75
1.China,
2.Norway,
3.Germany
, 4.Iceland,
5.Chile,
6.Russia.
7.Denmark
1.5Price/qualit
y. 2,3,4,6,7.
Distance,
availability
and regional
products.
Developed
fish
processing
industry.
Almonds 08021
2 49 21 44
1.Spain,
2.Germany
,
3.Australia
1.Distance,
availability
and regional
products.
2.Traditional
re-exporter. 3. Flexibility
of suppliers –
aiming to gain
new market.
No local
production
due to
unfavorable
climate
conditions.
Dried
Grapes,
Raisins
08062
0 26 1 2.19
1.Turkey,
2.Iran,
3.Chile,
4.Germany
5.Uzbekist
an
1.2.3.5.
Price/quality.
4.Traditional
re-exporter.
No local
production
due to
unfavorable
climate
conditions.
Prunes 08132
0 28 6 22
1.Chile,
2.Germany
,
3.Moldova,
4.Serbia,
5.Argentin
a
1.5.Price/qualit
y. 2. Traditional
re-exporter. 3.4.
availability of
regional
products.
Local
production
of different
type of prune
– not
competing
with
imported
varieties.
Peanuts 1202 59 5 8
1.Argentin
a, 2.Brazil,
3.Nicaragu
a, 4.China
1.2.3.4.
Price/quality. No local
production
due to
unfavorable
climate
conditions.
Cranberri
es 20089
3 19 12 63 1.Chile,
2.Germany
, 3.Canada
1.3.
Price/quality. 2. Traditional
re-exporter.
Local
production
of different
type of
cranberry –
not
competing
with
imported
varieties.
Wine 2204 237 33 14
1.Italy,
2.Germany
, 3.France, 4.Spain
Distance,
availability
and regional
products.
Limited
local
production
due to
unfavorable
climate
conditions.
Alcohol
Beverage
s 2208 214 31 14
1.UK, 2.
Finland,
3.Germany
Distance,
availability
and regional
products.
Developed
local
production
industry –
e.g. vodka
production.
Source: Global Trade Atlas Data

SECTION IV. BEST PRODUCT PROSPECTS
Category A: Products Present in the Market That Have Good Sales Potential
· Tree nuts
· Wine
· Alcoholic beverages
· Dried fruit
· Snack foods
· Cranberries and cranberry products
Category B: Products Not Present In Significant Quantities but Which Have Good Sales Potential
· High quality beef (hormone free)
· Health food, organic food
· Seafood and seafood products
· Innovative sauces, condiments and confectionary products
Category C: Products Not Present Because They Face Significant Barriers
· Poultry (non-tariff barrier)
· Processed food with GMO ingredients (non-tariff barrier)
SECTION V. POST CONTACT AND FURTHER INFORMATION
One of the goals of the Foreign Agricultural Service (FAS) office in Warsaw is to assist in market
development and promotion of U.S. food and agricultural products in Poland. There are a wide variety
of ways in which to approach this market and many key contacts such as importers, distributors and
retailers. Suppliers of U.S. food products and ingredients can contact FAS Warsaw if additional
information regarding selling U.S. food and beverage products to Poland is required.
There are several U.S. commodity groups, called cooperators/regional groups, who partner with FAS to
promote U.S. agricultural products in Poland. Those cooperators who are particularly active in Poland
include: Wine Institute (California), Cranberry Marketing Committee, California Prune Board,
California Walnut Commision and Food Export USA Northeast. The California Wine Institute,
Cranberry Marketing Committee, California Walnut Commission and California Prune Board have
representatives based in Warsaw.
For additional information regarding the Polish market please contact:
American Embassy
Foreign Agricultural Service
Al. Ujazdowskie 29/31

00-540 Warsaw, Poland
Phone number: +48 22 504 23 36
E-mail: [email protected]
Website: http://polish.poland.usembassy.gov/Poland-pl/agric.html
Please also visit the Foreign Agricultural Service home page (www.fas.usda.gov – Data and Analysis
link – GAIN Reports Category) for more information about exporting U.S. food products to Poland,
including “The Exporter Guide”, “The HRI Food Service Sector Report”, “Food Processing Sector
Report”, product briefs on the market potential for the U.S. wine, dried fruit, nuts and other agricultural
products. For information on exporting U.S agricultural products to other countries please visit the
Foreign Agricultural Service home page: http://www.fas.usda.gov – Countries and regions link.
End of the Report.