Embed Size (px)
Citation preview

This public document was published at a total cost of $2,642.76. Two-hundred and fifty (250) copies of this public document were published in the first printing at a cost of $2,642.76. The total cost of all printings of this document, including reprints was $2,642.76. This document was published for the Division of Administration, Office of Statewide Reporting and Accounting Policy, P.O. Box 94095, Baton Rouge, LA. 70804-9095 by the Division of Administration, Office of State Printing to report the financial condition of the State for the fiscal year ended June 30, 2015 under authority of LRS 39:92. This material was printed in accordance with the standards for printing by state agencies established pursuant to LRS 43:31.
State of LouisianaComprehensive Annual Financial Report
for the Year Ended June 30, 2015
BOBBY JINDALGovernor
Prepared ByDIVISION OF ADMINISTRATIONSTAFFORD OLIVIA PALMIERI
Commissioner
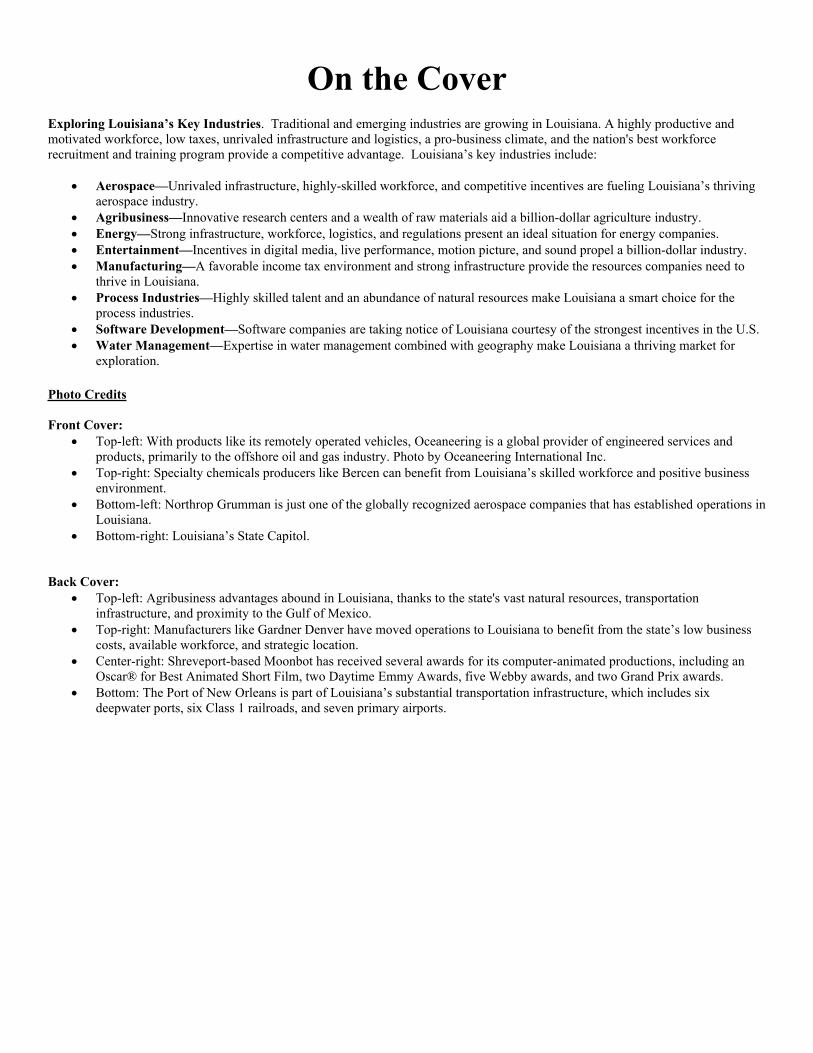
On the CoverExploring Louisiana’s Key Industries. Traditional and emerging industries are growing in Louisiana. A highly productive and motivated workforce, low taxes, unrivaled infrastructure and logistics, a pro-business climate, and the nation's best workforce recruitment and training program provide a competitive advantage. Louisiana’s key industries include:
Aerospace—Unrivaled infrastructure, highly-skilled workforce, and competitive incentives are fueling Louisiana’s thriving aerospace industry.
Agribusiness—Innovative research centers and a wealth of raw materials aid a billion-dollar agriculture industry. Energy—Strong infrastructure, workforce, logistics, and regulations present an ideal situation for energy companies. Entertainment—Incentives in digital media, live performance, motion picture, and sound propel a billion-dollar industry. Manufacturing—A favorable income tax environment and strong infrastructure provide the resources companies need to
thrive in Louisiana. Process Industries—Highly skilled talent and an abundance of natural resources make Louisiana a smart choice for the
process industries. Software Development—Software companies are taking notice of Louisiana courtesy of the strongest incentives in the U.S. Water Management—Expertise in water management combined with geography make Louisiana a thriving market for
exploration.
Photo Credits
Front Cover: Top-left: With products like its remotely operated vehicles, Oceaneering is a global provider of engineered services and
products, primarily to the offshore oil and gas industry. Photo by Oceaneering International Inc. Top-right: Specialty chemicals producers like Bercen can benefit from Louisiana’s skilled workforce and positive business
environment. Bottom-left: Northrop Grumman is just one of the globally recognized aerospace companies that has established operations in
Louisiana. Bottom-right: Louisiana’s State Capitol.
Back Cover: Top-left: Agribusiness advantages abound in Louisiana, thanks to the state's vast natural resources, transportation
infrastructure, and proximity to the Gulf of Mexico. Top-right: Manufacturers like Gardner Denver have moved operations to Louisiana to benefit from the state’s low business
costs, available workforce, and strategic location. Center-right: Shreveport-based Moonbot has received several awards for its computer-animated productions, including an
Oscar® for Best Animated Short Film, two Daytime Emmy Awards, five Webby awards, and two Grand Prix awards. Bottom: The Port of New Orleans is part of Louisiana’s substantial transportation infrastructure, which includes six
deepwater ports, six Class 1 railroads, and seven primary airports.
Bobby Jindal
Governor
State of Louisiana

State of Louisiana
- v -
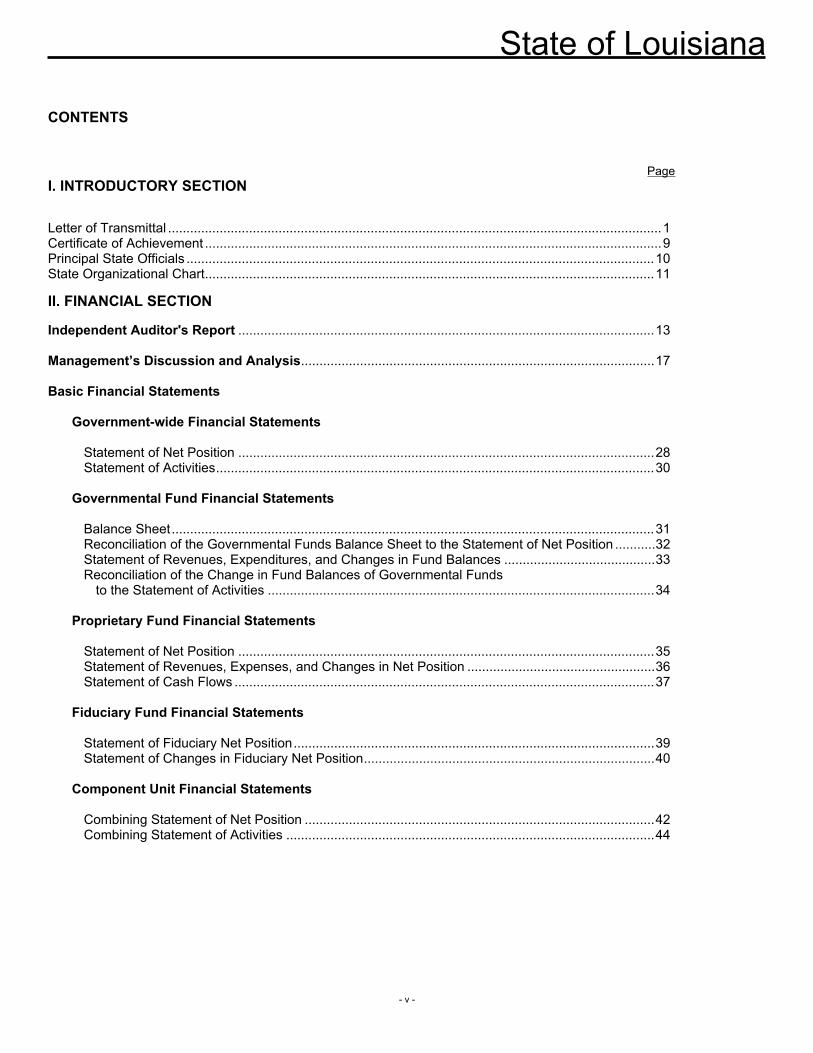
CONTENTS
PageI. INTRODUCTORY SECTION
Letter of Transmittal ......................................................................................................................................1Certificate of Achievement ............................................................................................................................9Principal State Officials ...............................................................................................................................10State Organizational Chart..........................................................................................................................11
II. FINANCIAL SECTION
Independent Auditor's Report .................................................................................................................13
Management’s Discussion and Analysis................................................................................................17
Basic Financial Statements
Government-wide Financial Statements
Statement of Net Position .................................................................................................................28Statement of Activities.......................................................................................................................30
Governmental Fund Financial Statements
Balance Sheet...................................................................................................................................31Reconciliation of the Governmental Funds Balance Sheet to the Statement of Net Position ...........32Statement of Revenues, Expenditures, and Changes in Fund Balances .........................................33Reconciliation of the Change in Fund Balances of Governmental Funds
to the Statement of Activities .........................................................................................................34
Proprietary Fund Financial Statements
Statement of Net Position .................................................................................................................35Statement of Revenues, Expenses, and Changes in Net Position ...................................................36Statement of Cash Flows ..................................................................................................................37
Fiduciary Fund Financial Statements
Statement of Fiduciary Net Position..................................................................................................39Statement of Changes in Fiduciary Net Position...............................................................................40
Component Unit Financial Statements
Combining Statement of Net Position ...............................................................................................42Combining Statement of Activities ....................................................................................................44
State of Louisiana
- vi -
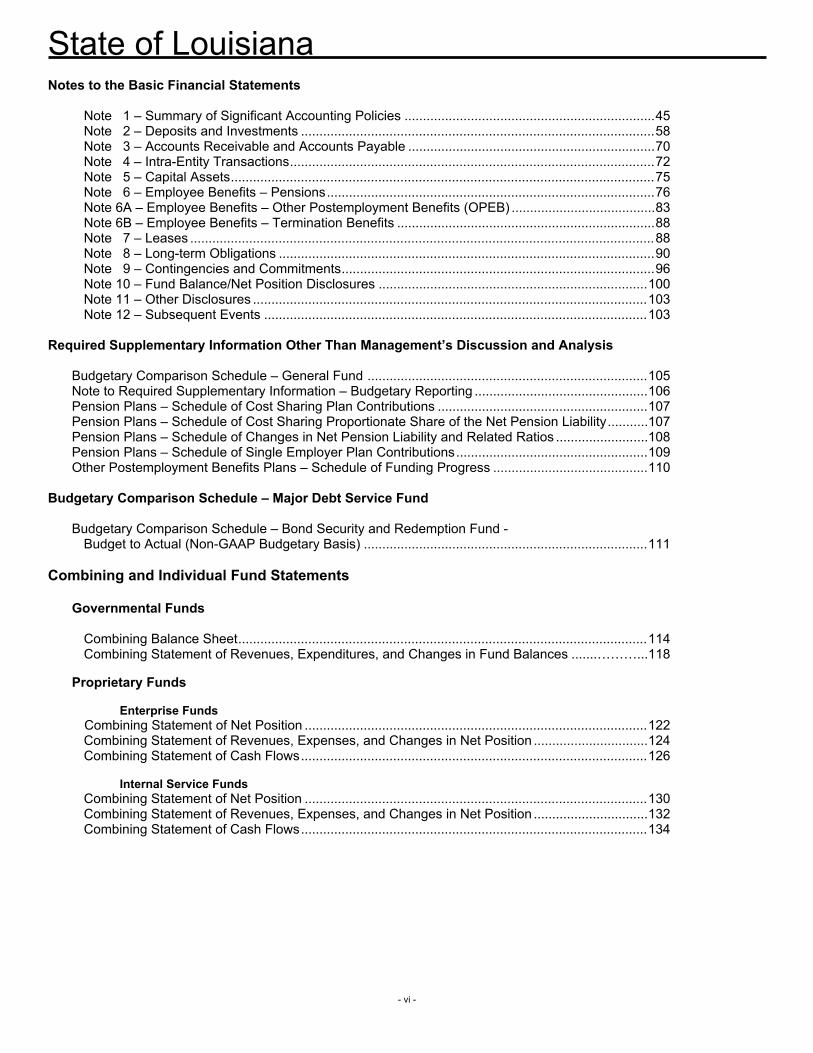
Notes to the Basic Financial Statements
Note 1 – Summary of Significant Accounting Policies ....................................................................45Note 2 – Deposits and Investments ................................................................................................58Note 3 – Accounts Receivable and Accounts Payable ...................................................................70Note 4 – Intra-Entity Transactions...................................................................................................72Note 5 – Capital Assets...................................................................................................................75Note 6 – Employee Benefits – Pensions.........................................................................................76Note 6A – Employee Benefits – Other Postemployment Benefits (OPEB) .......................................83Note 6B – Employee Benefits – Termination Benefits ......................................................................88Note 7 – Leases ..............................................................................................................................88Note 8 – Long-term Obligations ......................................................................................................90Note 9 – Contingencies and Commitments.....................................................................................96Note 10 – Fund Balance/Net Position Disclosures .........................................................................100Note 11 – Other Disclosures ...........................................................................................................103Note 12 – Subsequent Events ........................................................................................................103
Required Supplementary Information Other Than Management’s Discussion and Analysis
Budgetary Comparison Schedule – General Fund ............................................................................105Note to Required Supplementary Information – Budgetary Reporting ...............................................106Pension Plans – Schedule of Cost Sharing Plan Contributions .........................................................107Pension Plans – Schedule of Cost Sharing Proportionate Share of the Net Pension Liability...........107Pension Plans – Schedule of Changes in Net Pension Liability and Related Ratios .........................108Pension Plans – Schedule of Single Employer Plan Contributions....................................................109Other Postemployment Benefits Plans – Schedule of Funding Progress ..........................................110
Budgetary Comparison Schedule – Major Debt Service Fund
Budgetary Comparison Schedule – Bond Security and Redemption Fund - Budget to Actual (Non-GAAP Budgetary Basis) .............................................................................111
Combining and Individual Fund Statements
Governmental Funds
Combining Balance Sheet...............................................................................................................114Combining Statement of Revenues, Expenditures, and Changes in Fund Balances .......………...118
Proprietary Funds
Enterprise FundsCombining Statement of Net Position .............................................................................................122Combining Statement of Revenues, Expenses, and Changes in Net Position ...............................124Combining Statement of Cash Flows..............................................................................................126
Internal Service FundsCombining Statement of Net Position .............................................................................................130Combining Statement of Revenues, Expenses, and Changes in Net Position ...............................132Combining Statement of Cash Flows..............................................................................................134
State of Louisiana
- vii -
Fiduciary Funds
Combining Statement of Fiduciary Net Position – Pension Trust Funds ........................................136Combining Statement of Changes in Fiduciary Net Position – Pension Trust Funds .....................137Combining Statement of Fiduciary Net Position – Investment Trust Funds....................................138Combining Statement of Changes in Fiduciary Net Position – Investment Trust Funds.................139Combining Statement of Fiduciary Assets and Liabilities – Agency Funds ....................................140Combining Statement of Changes in Assets and Liabilities – Agency Funds.................................141
Component Units
Combining Statement of Net Position .............................................................................................144Combining Statement of Activities ..................................................................................................147
III. STATISTICAL SECTION
Statistical Section Index............................................................................................................................149Net Position by Component, Last Ten Fiscal Years .................................................................................150Changes in Net Position, Last Ten Fiscal Years.......................................................................................152Fund Balances, Governmental Funds, Last Ten Fiscal Years..................................................................156Changes in Fund Balances, Governmental Funds, Last Ten Fiscal Years ..............................................158Individual Income Tax, Last Nine Fiscal Years .........................................................................................160Personal Income - Earnings by Major Industry, Last Ten Calendar Years ...............................................163Tax Rate by Major Sources of Revenue...................................................................................................164Ratios of Outstanding Debt by Type, Last Ten Fiscal Years ....................................................................166Legal Debt Margin and Debt Limitations, Last Ten Fiscal Years ..............................................................168Revenue Bond Coverage, Last Ten Fiscal Years.....................................................................................170Demographic and Economic Statistics, Last Ten Calendar Years ...........................................................172Principal Employers, Current Year and Nine Years Ago ..........................................................................173Louisiana State Employees by Function/Program, Last Ten Fiscal Years ...............................................174Operating Indicators by Function/Program, Last Ten Years.....................................................................176Capital Assets Statistics by Function/Program, Last Ten Fiscal Years ....................................................178Acknowledgments.....................................................................................................................................179

- viii -

I . INTRODUCTORY SECTION
2014-2015 Comprehensive Annual Financial Report

- 1 -
December 22, 2015 To: The Honorable Bobby Jindal, Governor,
Members of the Legislature, and the People of the State of Louisiana
It is my privilege to present the State of Louisiana’s Comprehensive Annual Financial
Report (CAFR) for the fiscal year ended June 30, 2015. State law requires that the CAFR be prepared for the State within six months after the close of each fiscal year. The report was prepared in conformity with Generally Accepted Accounting Principles (GAAP) as prescribed by the Governmental Accounting Standards Board (GASB).
The Division of Administration is responsible for the accuracy, completeness, and fair
presentation of the data, representations, and disclosures presented in the CAFR. To the best of our knowledge and belief, the data presented are accurate in all material respects, reported in a manner designed to fairly present the financial position and results of operations, and provide disclosures necessary to enable the reader to gain an understanding of the financial activities and condition of the State.
The Division of Administration and fiscal management at each entity included in the CAFR
is responsible for establishing and maintaining internal controls designed to ensure that assets are protected from loss, theft, or misuse and that accurate and complete accounting data are compiled to provide for the preparation of financial statements in conformity with GAAP. Internal controls are designed to provide reasonable, but not absolute, assurance that these objectives are met. The concept of reasonable assurance recognizes that the cost of a control should not exceed the benefits likely to be derived, and the valuation of costs and benefits requires estimates and judgments by management. All internal control evaluations occur within this framework. We believe that the internal accounting controls of the State adequately safeguard assets and provide reasonable assurance of proper recording and reporting of financial transactions.
The State of Louisiana’s basic financial statements have been audited by the Louisiana
Legislative Auditor and he has issued an unmodified (“clean”) opinion on the State of Louisiana’s financial statements for the year ended June 30, 2015. This audit report is located at the front of the “Financial Section” of this report.
The independent audit of the basic financial statements of the State of Louisiana was part
of a broader, federally mandated “Single Audit” designed to meet the special needs of federal grantor agencies. The standards governing Single Audit engagements require the independent auditor to report not only on the fair presentation of the basic financial statements, but also on the internal controls of the government and compliance with legal requirements, with special emphasis on internal controls and legal requirements involving the administration of federal awards. These reports are available in the separately issued Single Audit Report for the State of Louisiana.
BOBBY JINDAL STAFFORD OLIVIA PALMIERI
GOVERNOR COMMISSIONER OF ADMINISTRATION
State of Louisiana Division of Administration
Office of the Commissioner
The Honorable Bobby Jindal, et al. December 22, 2015 Page - 2 -
- 2 -
Management’s Discussion and Analysis (MD&A) immediately follows the independent auditor’s report and provides a narrative introduction, overview, and analysis of the basic financial statements. MD&A complements the letter of transmittal and should be read in conjunction with it. PROFILE OF THE GOVERNMENT Located on the Gulf of Mexico and bordered by Arkansas, Texas, and Mississippi, Louisiana serves a population of 4,650,000. The powers of government of the state are divided into three separate branches: legislative, executive, and judicial. Except as otherwise provided by the Louisiana Constitution, no one of these branches, nor any person holding office in one of them, shall exercise power belonging to either of the others.
The State provides a variety of services to citizens including education, health care, public safety, road and highway development and maintenance, and recreation. These services are financed primarily through taxes, fees, mineral royalties, and federal revenues, which are accounted for by various funds (general fund, special revenue funds, capital project funds, etc.).
The State financial reporting entity includes 57 active component units, which are reported
discretely in the financial statements. These component units include colleges and universities, boards and commissions, ports, levee districts, and other special purpose authorities.
Final financial control is exercised through the budgetary system. Financial statements
are presented in conformity with GAAP and are also presented on a non-GAAP budgetary basis to demonstrate legal compliance. Variances between the GAAP and non-GAAP budgetary presentations are caused by differences in reporting entity, accounting basis, and perspective. The budgetary process is further described in Note 1 of the basic financial statements and the reconciliation between GAAP and non-GAAP budgetary basis fund balances is presented as required supplementary information.
ECONOMIC CONDITIONS AND OUTLOOK Louisiana is a major energy producing state. In fact, Louisiana is ranked second in production of both oil and natural gas if the Gulf waters are included. When energy prices are strong, the state prospers. When oil prices are declining, the economy weakens – especially for certain areas of the State. The continued decline in oil through much of 2014 and 2015 has resulted in a weaker short-term economic outlook compared to recent years. However, forecasted growth in other sectors will offset the economic effects of low oil prices. These sectors include construction, healthcare, technology, and manufacturing. In total, the State is projected to add 15,400 jobs in 2016 (up 0.8%) and 19,600 jobs in 2017 (up 1%). The following factors will drive the economy in the near future:
Slowed by rapid increases in regulations and higher tax rates, the U.S. economy will continue its pace of expansion with RGDP averaging 2.6% growth annually.
Inflation is anticipated to remain in the modest 2.1% range, and minor increases in interest rates can be expected.
The Honorable Bobby Jindal, et al. December 22, 2015 Page - 3 -
- 3 -
A rebound in oil prices to $55 in 2016 and $60 in 2017 is projected, though enormous uncertainty requires a $30 to $90 a barrel range around those forecasts.
An increase in industrial demand combined with a reduction in supply due to much reduced rig counts, should put upward pressure on natural gas prices, with the price per mmbtu going to $3.50 in 2016 and $3.90 in 2017.
About half of the $125.1 billion in announced projects are under construction and about half are at the FEED and permitting stage. Viability of the FEED group is threaten by the EPA (1) lowering ozone standards in the U.S. and (2) imposing the Clean Power Plan that will radically raise industrial utility rates.
With the addition of the Hammond MSA, Louisiana is now home to nine metropolitan statistical areas, each with unique demographic and economic profiles. Essentially, the State is split into three regions: (1) the rapidly expanding Baton Rouge and Lake Charles regions; (2) the northern tier of the state; and (3) an oil patch region that is projected to decline through 2016. The economic outlook for each region is forecasted as follows:
Louisiana’s largest MSA, New Orleans, is projected to show growth of 0.5% (+2,900 jobs) in 2016 and 0.8% (+5,100 jobs) in 2017. Despite layoffs in the MSA’s oil sector and declining spending by the Army Corps, growth is expected due to (1) the opening of two new, large hospitals, (2) $1.1 billion in industrial expansions underway, (3) expansion of the airport, (4) a condo building boom, and (5) a number of new firms coming to the region. New Orleans’ record could be much better in both years if some $23.5 billion in projects at the FEED and permitting level actually go “vertical”.
After cracking the 400,000 employment level for the first time, the 9-parish Baton Rouge region is poised to enjoy two good years of growth, adding 8,900 jobs (+2.2%) in 2016 and 6,200 (+1.5%) in 2017. This MSA has about $8 billion in industrial projects under construction. The slightly slower growth rate in 2017 is due to several of those winding down and few firms at the FEED stage in this MSA. Several high tech firms are entering this market---led by IBM---and the remarkable 125% growth in tonnage at the Port will be repeated as the pellet exports evolve. The loss of two significant headquarters and threats from the EPA may stifle growth here.
The economy for the Shreveport-Bossier MSA is projected to slow in 2016 by a declining extraction sector (-800 jobs) but a modest rebound should occur in 2017 (+800 jobs) led by the Benteler Steel expansion at the Caddo-Bossier Port and additions at the Computer Sciences Corporation.
Persistent layoffs in the energy sector will drive employment lower in the Lafayette MSA for a second straight year in 2016 (-2,600 jobs), but if oil prices are near the forecast, 2017 should be a recovery year (+2,000 jobs). The opening of the new Bell Helicopters plant and the addition of four new technology firms will help this region.
The economy of the Houma MSA is sensitive to changes in energy prices. Edison Chouest and Gulf Island Fabricators alone have cut 3,000 jobs. The energy sector is expected to be a drag into 2016 (-2,000 jobs) before recovering about 1,000 jobs in 2017 as oil prices rebound and stabilize. Some of this slow-down, however, will be offset by the infusion of substantial coastal restoration monies from the BP Deepwater Horizon settlement.
The Honorable Bobby Jindal, et al. December 22, 2015 Page - 4 -
- 4 -
The Lake Charles MSA has a remarkable 39.6 billion in industrial projects under construction and an equally remarkable $45 billion at the FEED and permitting stage. A huge boom in industrial construction workers will drive this region up by 7,400 jobs (+7.1%) in 2016 and another 2,000 jobs (+1.8%) in 2017. This latter year’s growth rate could become much larger if the projects at the FEED stage move to construction. Other good news for this region came when the Golden Nugget Casino opened and actually grew the gaming market without cannibalizing business away from the other two casinos.
The Monroe MSA’s employment is expected to be flat in 2016 and expand by a modest 200 jobs in 2017. In 2015, the area’s largest employer--- CenturyLink--- announced plans to lay off employees. Fortunately, only 55 jobs were targeted in this MSA.
The forecast for the Alexandria MSA is a continuation of the modest growth the region has experienced for the last two years---adding 500 jobs a year. This projection could turn out to be radically conservative if American Specialty Alloys follows through with their proposed new $2.4 billion, 1,400-person plant.
Louisiana’s newest, and smallest MSA is Hammond. Composed of only Tangipahoa Parish, this university town is enjoying a very good 2015 due to enrollment and budget boosts at SLU and from an energetic healthcare sector. These same factors should enable the region to add an expected 700 jobs a year over 2016-17.
The information for the economic discussion is from The Louisiana Economic Outlook: 2016 and 2017, by Loren C. Scott, James A. Richardson, and Judy S. Collins, published in October 2015. Major Fiscal Initiatives During the 2014 legislative session we made it a priority to pass a responsible and balanced budget that protected important services provided by the State while at the same time concentrating on better management of State funds. Critical to our fiscal year 2015 budget was protecting funding in K-12 and higher education. We were able to increase funding for both through efficiencies and innovative technology improvements. Today, we have a booming economy and more people are working in Louisiana than ever before. We will continue to make government work harder for our people at a lower cost to ensure Louisiana remains an environment where companies want to invest and where people want to live and raise a family. Some of these efforts include:
The Office of State Purchasing and the Office of Contractual Review merged into a single Office of State Procurement in the Division of Administration, centralizing procurement of services as well as reducing the potential for fraud. Centralizing operations makes the contracting and purchasing process more efficient, less costly, and more user-friendly.
The Department of Children and Family Services established regional training hubs in major cities across the State in order to generate efficiencies and savings. DCFS was also able to save millions in TANF funds that were able to be re-directed to the LA4 pre-Kindergarten program in the Department of Education to support the education of Louisiana's four-year-old children.
The Honorable Bobby Jindal, et al. December 22, 2015 Page - 5 -
- 5 -
The Division of Administration reduced nearly half of a billion dollars of the State's UAL state retirement system debt by utilizing public-private partnerships to operate the State’s public hospitals, which are reducing costs and providing more access to quality health care services across the state.
This is a component of our overall reduction in state Full-Time Equivalent (FTE) employee footprint by nearly 32,000 or 34% since 2008, which has reduced the state’s UAL debt by a net $182.6 million, despite increases in risk factors such as the number of retirees, disability benefit costs, salary increases, and deaths. No individual employee saw a reduction in benefits, but the state reduced its liability for future costs, which ensures taxpayers are not left with unmanageable debts on the state’s balance sheets.
Fiscal year 2015 also saw many reforms put in place to improve the State's prison system and reduce recidivism rates which in turn have saved the State money in prison funding. The reforms in FY 2015 are part of an ongoing effort to reduce the state prison population. As of December that population number was 38,378 prisoners, which is 5,335 or 13% fewer prisoners than where the population was projected to be by December 2014. Louisiana is currently one of only six states projected to see a continued decline in prison population through the year 2018.
During the 2014 session, the state also reformed how Cost of Living Adjustments (COLAs) are allocated to ensure the systems’ long term financial stability. Now, systems may grant a partial benefit increase, regardless of funded ratio or achieved rate of return, only if certain criteria are met. Future COLAs will be tied to the funded ratio of the respective retirement system and that any additional dollars left in each system’s respective experience account after a COLA is granted will be used to pay down the system’s Unfunded Accrued Liability (UAL) to ensure sustainability and pay off system debts sooner.
The state also passed legislation during the 2014 legislative session that constitutionally protected the Rainy Day Fund by ensuring annual deposits into the fund. The bill provided that 45% of Deep Water Horizon economic damages proceeds and at least $25 million (or 25%) of nonrecurring revenue will be deposited into the Rainy Day Fund each year until the fund reaches its statutorily mandated amount.
Relevant Financial Policies Louisiana’s Constitution requires the State to pass a balanced operating budget. The Constitution also provides for an annual expenditure limit to control the rate of spending. The expenditure limit is determined each fiscal year and is established during the first quarter of the calendar year for the next fiscal year. The limit is equal to the expenditure limit from the previous fiscal year multiplied by a positive growth factor. The growth factor is the average annual percentage rate of change of personal income for Louisiana as defined and reported by the United States Department of Commerce for the three calendar years prior to the fiscal year for which the limit is calculated.
The State has restrictions on how revenues designated as “non-recurring” can be spent since these revenues cannot be relied on in future budget periods. Constitutionally established percentages of non-recurring revenues are required to be deposited in the Budget Stabilization

- 7 -

- 8 -
CERTIFICATE OFACHIEVEMENT
- 9 -
State of Louisiana
- 10 -
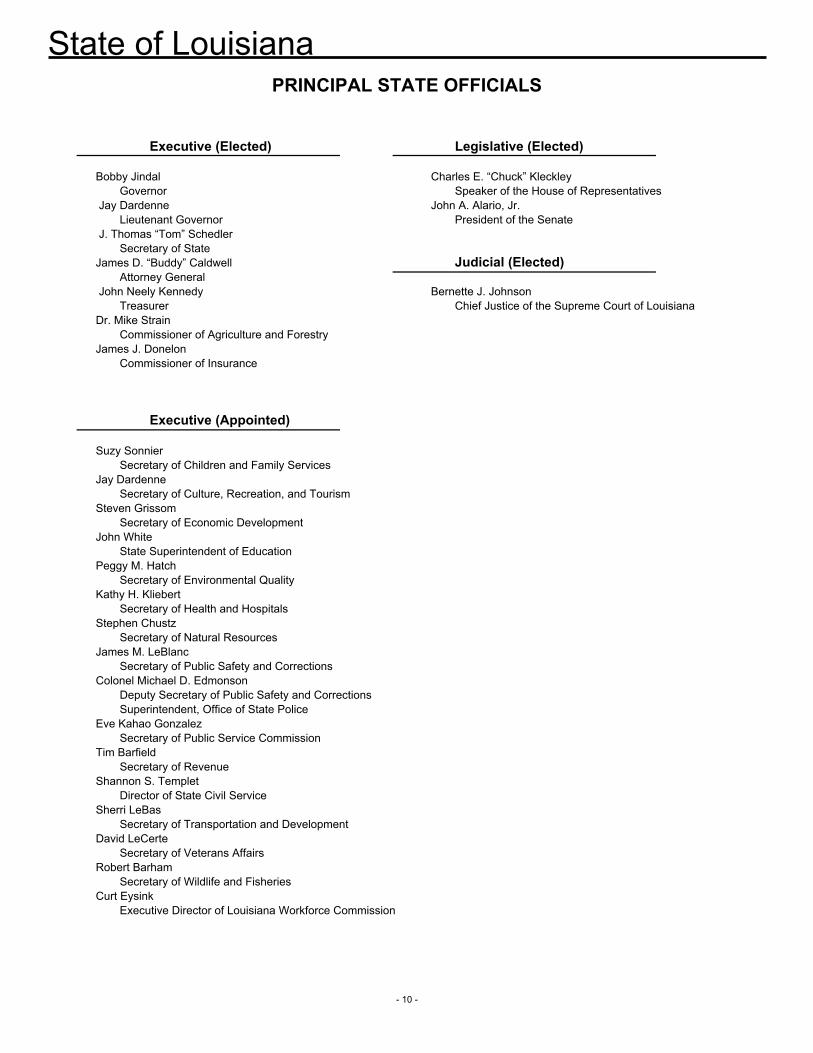
PRINCIPAL STATE OFFICIALS
Executive (Elected) Legislative (Elected)
Bobby Jindal Charles E. “Chuck” KleckleyGovernor Speaker of the House of Representatives
Jay Dardenne John A. Alario, Jr. Lieutenant Governor President of the Senate
J. Thomas “Tom” SchedlerSecretary of State
James D. “Buddy” Caldwell Judicial (Elected)Attorney General
John Neely Kennedy Bernette J. JohnsonTreasurer Chief Justice of the Supreme Court of Louisiana
Dr. Mike StrainCommissioner of Agriculture and Forestry
James J. Donelon Commissioner of Insurance
Executive (Appointed)
Suzy SonnierSecretary of Children and Family Services
Jay DardenneSecretary of Culture, Recreation, and Tourism
Steven GrissomSecretary of Economic Development
John WhiteState Superintendent of Education
Peggy M. HatchSecretary of Environmental Quality
Kathy H. KliebertSecretary of Health and Hospitals
Stephen ChustzSecretary of Natural Resources
James M. LeBlancSecretary of Public Safety and Corrections
Colonel Michael D. EdmonsonDeputy Secretary of Public Safety and CorrectionsSuperintendent, Office of State Police
Eve Kahao GonzalezSecretary of Public Service Commission
Tim BarfieldSecretary of Revenue
Shannon S. TempletDirector of State Civil Service
Sherri LeBasSecretary of Transportation and Development
David LeCerteSecretary of Veterans Affairs
Robert BarhamSecretary of Wildlife and Fisheries
Curt EysinkExecutive Director of Louisiana Workforce Commission
State of Louisiana
- 11 -
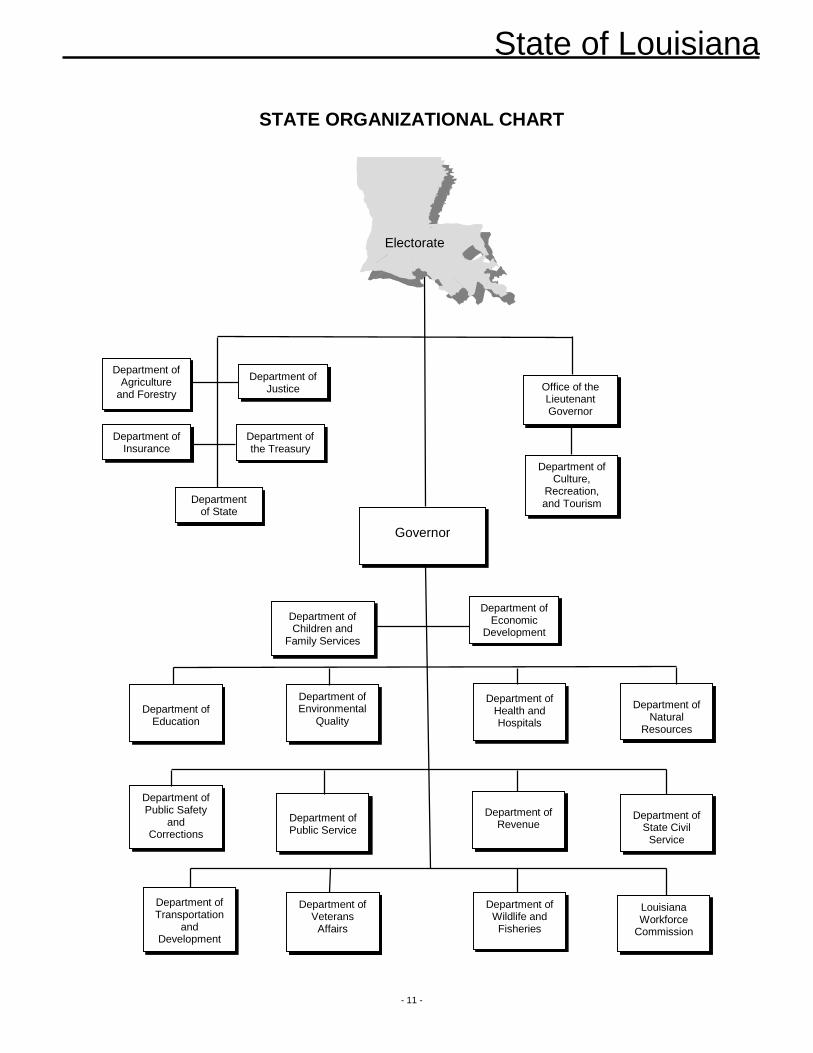
STATE ORGANIZATIONAL CHART
Department of Economic
Development
Department of Insurance
Department of State
Department of Agriculture
and Forestry
Department of Veterans
Affairs
Department of Justice
Department of the Treasury
Office of the Lieutenant Governor
Department of Culture,
Recreation, and Tourism
Governor
Department of Education
Department of Environmental
Quality
Department of Health and Hospitals
Department of Natural
Resources
Department of State Civil
Service
Department of Public Safety
and Corrections
Department of Transportation
and Development
Department of Public Service
Department of Wildlife and Fisheries
Department of Revenue
Louisiana Workforce
Commission
Department of Children and
Family Services
Electorate Electorate Electorate

- 12 -

I I . FINANCIAL SECTION
2014-2015 Comprehensive Annual Financial Report

LOUISIANA LEGISLATIVE AUDITOR
DARYL G. PURPERA, CPA
1600 NORTH THIRD STREET • POST OFFICE BOX 94397 • BATON ROUGE, LOUISIANA 70804-9397
WWW.LLA.LA.GOV • PHONE: 225-339-3800 • FAX: 225-339-3870
- 13 -
December 22, 2015
Independent Auditor's Report
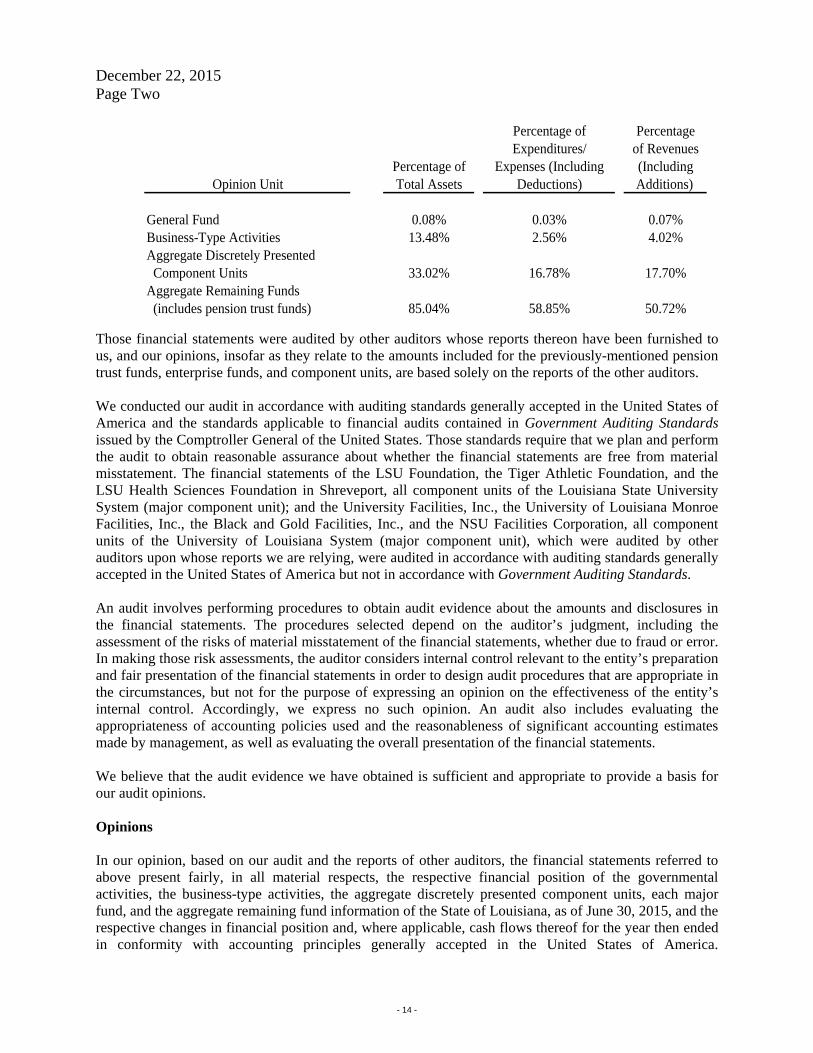
Honorable Bobby Jindal, Governor Honorable John A. Alario, Jr., President, and Members of the Senate Honorable Charles E. “Chuck” Kleckley, Speaker, and Members of the House of Representatives State of Louisiana Report on the Financial Statements We have audited the accompanying financial statements of the governmental activities, the business-type activities, the aggregate discretely presented component units, each major fund, and the aggregate remaining fund information of the State of Louisiana, as of and for the year ended June 30, 2015, and the related notes to the financial statements, which collectively comprise the state’s basic financial statements as listed in the Table of Contents. Management’s Responsibility for the Financial Statements Management is responsible for the preparation and fair presentation of these financial statements in accordance with accounting principles generally accepted in the United States of America; this includes the design, implementation, and maintenance of internal control relevant to the preparation and fair presentation of financial statements that are free from material misstatement, whether due to fraud or error. Auditor’s Responsibility Our responsibility is to express opinions on these financial statements based on our audit. We did not audit the financial statements of certain pension trust funds, enterprise funds, and component units of government included within the basic financial statements of the State of Louisiana, which represent the following percentages of their related opinion units:
December 22, 2015 Page Two
- 14 -
Percentage of PercentageExpenditures/ of Revenues
Percentage of Expenses (Including (IncludingOpinion Unit Total Assets Deductions) Additions)
General Fund 0.08% 0.03% 0.07%Business-Type Activities 13.48% 2.56% 4.02%Aggregate Discretely Presented Component Units 33.02% 16.78% 17.70%Aggregate Remaining Funds (includes pension trust funds) 85.04% 58.85% 50.72%
Those financial statements were audited by other auditors whose reports thereon have been furnished to us, and our opinions, insofar as they relate to the amounts included for the previously-mentioned pension trust funds, enterprise funds, and component units, are based solely on the reports of the other auditors. We conducted our audit in accordance with auditing standards generally accepted in the United States of America and the standards applicable to financial audits contained in Government Auditing Standards issued by the Comptroller General of the United States. Those standards require that we plan and perform the audit to obtain reasonable assurance about whether the financial statements are free from material misstatement. The financial statements of the LSU Foundation, the Tiger Athletic Foundation, and the LSU Health Sciences Foundation in Shreveport, all component units of the Louisiana State University System (major component unit); and the University Facilities, Inc., the University of Louisiana Monroe Facilities, Inc., the Black and Gold Facilities, Inc., and the NSU Facilities Corporation, all component units of the University of Louisiana System (major component unit), which were audited by other auditors upon whose reports we are relying, were audited in accordance with auditing standards generally accepted in the United States of America but not in accordance with Government Auditing Standards. An audit involves performing procedures to obtain audit evidence about the amounts and disclosures in the financial statements. The procedures selected depend on the auditor’s judgment, including the assessment of the risks of material misstatement of the financial statements, whether due to fraud or error. In making those risk assessments, the auditor considers internal control relevant to the entity’s preparation and fair presentation of the financial statements in order to design audit procedures that are appropriate in the circumstances, but not for the purpose of expressing an opinion on the effectiveness of the entity’s internal control. Accordingly, we express no such opinion. An audit also includes evaluating the appropriateness of accounting policies used and the reasonableness of significant accounting estimates made by management, as well as evaluating the overall presentation of the financial statements. We believe that the audit evidence we have obtained is sufficient and appropriate to provide a basis for our audit opinions. Opinions In our opinion, based on our audit and the reports of other auditors, the financial statements referred to above present fairly, in all material respects, the respective financial position of the governmental activities, the business-type activities, the aggregate discretely presented component units, each major fund, and the aggregate remaining fund information of the State of Louisiana, as of June 30, 2015, and the respective changes in financial position and, where applicable, cash flows thereof for the year then ended in conformity with accounting principles generally accepted in the United States of America.
December 22, 2015 Page Three
- 15 -
Emphasis of Matters As disclosed in note 6 to the financial statements, the total net pension liability for governmental and business-type activities was approximately $5.6 billion at June 30, 2015, as determined by certain state and statewide pension systems. The related actuarial valuations were performed by the pension systems’ actuaries using various assumptions. Because actual experience may differ from the assumptions used, there is a risk that this amount at June 30, 2015, could be under or overstated. As discussed in notes 11-B and 10-C to the financial statements, the state implemented Governmental Accounting Standards Board (GASB) Statement No. 68, Accounting and Financial Reporting for Pensions – an amendment of GASB Statement No. 27, and GASB Statement No. 71, Pension Transition for Contributions Made Subsequent to the Measurement Date – an amendment of GASB Statement No. 68, for the year ended June 30, 2015. The adoption of these standards required the state to record its proportionate share of pension amounts related to its participation in defined benefit pension plans, restating the previous year. The state’s beginning net position for governmental activities and business-type activities decreased by approximately $5.3 billion, primarily as a result of the implementation. As presented on the government-wide and fund-level financial statements, the state reclassified certain financial statement categories and included more detail. Most significantly, additional categories were added to the Statement of Activities and Statement of Revenues, Expenditures, and Changes in Fund Balances, and current expenditures were reclassified to intergovernmental functional categories for amounts paid to local governments. Our opinions are not modified with respect to the matters emphasized above. Other Matters Required Supplementary Information Accounting principles generally accepted in the United States of America require that Management’s Discussion and Analysis and the Required Supplementary Information Other Than Management’s Discussion and Analysis presented on pages 17 through 25 and 105 through 110, respectively, be presented to supplement the basic financial statements. Such information, although not a part of the basic financial statements, is required by GASB, who considers it to be an essential part of financial reporting for placing the basic financial statements in an appropriate operational, economic, or historical context. We and other auditors have applied certain limited procedures to the required supplementary information in accordance with auditing standards generally accepted in the United States of America, which consisted of inquiries of management about the methods of preparing the information and comparing the information for consistency with management’s responses to our inquiries, the basic financial statements, and other knowledge we obtained during our audit of the basic financial statements. We do not express an opinion or provide any assurance on the information because the limited procedures do not provide us with sufficient evidence to express an opinion or provide any assurance.
December 22, 2015 Page Four
- 16 -
Supplementary and Other Information Our audit was conducted for the purpose of forming opinions on the financial statements that collectively comprise the State of Louisiana’s basic financial statements. The accompanying Introductory Section (pages 1 through 12), the Budgetary Comparison Schedule - Budget to Actual - Bond Security and Redemption Fund (page 111), the Combining and Individual Fund Statements and Schedule - Nonmajor Funds (pages 114 through 147), and the Statistical Section (pages 149 through 179) listed in the Table of Contents are presented for purposes of additional analysis and are not a required part of the basic financial statements. The Budgetary Comparison Schedule - Budget to Actual - Bond Security and Redemption Fund and the Combining and Individual Fund Statements and Schedule - Nonmajor Funds are the responsibility of management and were derived from and relate directly to the underlying accounting and other records used to prepare the basic financial statements. Such information has been subjected to the auditing procedures applied in the audit of the basic financial statements and certain additional procedures, including comparing and reconciling such information directly to the underlying accounting and other records used to prepare the basic financial statements or to the basic financial statements themselves, and other additional procedures in accordance with auditing standards generally accepted in the United States of America by us and other auditors. In our opinion, based on our audit, the procedures performed as described above, and the reports of other auditors, this information is fairly stated, in all material respects, in relation to the basic financial statements as a whole. The Introductory Section and the Statistical Section have not been subjected to the auditing procedures applied in the audit of the basic financial statements, and, accordingly, we do not express an opinion or provide any assurance on them. Other Reporting Required by Government Auditing Standards In accordance with Government Auditing Standards, a report on our consideration of the state’s internal control over financial reporting and our tests of its compliance with certain provisions of laws, regulations, contracts, and grant agreements and other matters will be issued under separate cover in the State of Louisiana Single Audit Report. The purpose of that report is to describe the scope of our testing of internal control over financial reporting and compliance and the results of that testing, and not to provide an opinion on internal control over financial reporting or on compliance. That report, upon its issuance, is an integral part of an audit performed in accordance with Government Auditing Standards in considering the state’s internal control over financial reporting and compliance.
Respectfully submitted, Daryl G. Purpera, CPA, CFE Legislative Auditor
BDC:EFS:ch CAFR2015

M A N A G E M E N T ’ S D I S C U S S I O N A N D A N A L Y S I S
2014-2015 Comprehensive Annual Financial Report

State of Louisiana
- 17 -
MANAGEMENT’S DISCUSSION AND ANALYSIS
Management’s Discussion and Analysis (MD&A) of the financial performance of the State of Louisiana presents a narrative overview and analysis of the financial activities of the State for the year ended June 30, 2015. This document focuses on the current year’s activities, resulting changes, and currently known facts. Please read this document in conjunction with the additional information contained in the transmittal letter presented on pages 1-6 and the financial statements of the State, which begin on page 28.
FINANCIAL HIGHLIGHTS
The State’s assets and deferred outflows of resources exceeded its liabilities and deferred inflows of resources at the close of the fiscal year by $5.8 billion, a decrease of 21.0% from the prior fiscal year.
The decrease in net position was attributable to the State’s governmental activities, which experienced a $1.7 billion decrease in net position, while its business-type activities experienced a $128.2 million increase in net position.
Actual budgetary basis expenditures of General Fund taxes, licenses and fees exceeded actual revenues by $117.1 million. This shortfall is required to be resolved before the end of fiscal year 2016.
The State’s outstanding bonds increased by $462.5 million mainly due to the issuance of general obligation bonds to fund capital projects of the State and other entities.
OVERVIEW OF THE FINANCIAL STATEMENTS
This discussion and analysis is an introduction to the Basic Financial Statements of the State of Louisiana, which are comprised of the following:
Government-wide financial statements Fund financial statements Notes to the basic financial statements
This report also contains Required Supplementary Information and Other Information in addition to the Basic Financial Statements.
Reporting the State as a Whole
Government-wide Financial Statements
The government-wide financial statements are designed to provide readers with a broad overview of the finances of the State of Louisiana as a whole, and are prepared in a manner similar to a private sector business. The statements provide both short-term and long-term information about the net position of the State which helps in assessing the economic condition of the State at the end of the fiscal year. These reports are prepared using the flow of economic resources measurement focus and the accrual basis of accounting by taking into account all revenues earned and expenses incurred in the fiscal year regardless of when cash is received or paid.
Two financial statements are presented beginning on page 28 to assist the reader in assessing the State’s financial position as a whole. The first, the Statement of Net Position, presents the State’s financial position – called net position – as of the fiscal year-end. The second, the Statement of Activities, details whether net position has improved or deteriorated since the prior year-end.
The government-wide financial statements report three types of activities:
Governmental Activities – The activities reported here are primarily supported by taxes and federal grants. Most of the State’s activities fall into this category and include general government; culture, recreation, and tourism; transportation and development; public safety; health and welfare; corrections; youth services; conservation and environment; and education.
State of Louisiana
- 18 -
Business-type Activities – These activities normally are intended to recover all or a significant portion of their costs through user fees and charges to external users of goods and services. The business-type activities operated by the State include the Unemployment Trust Fund, the Louisiana Community and Technical College System (LCTCS), the Louisiana Agricultural Finance Authority (LAFA), and the Clean Water State Revolving Fund, among others.
Component Units – Component units are legally separate organizations for which the elected officials of the government are financially accountable or have significant influence in governing board appointments. Among the component units included are public colleges and universities, the Louisiana Lottery Corporation, and others. For a list of the component units included in the government-wide statements, see Note 1 (page 45) of the notes to the basic financial statements.
Reporting the State’s Most Significant Funds
Fund Financial Statements
The fund financial statements begin on page 31 and provide more detailed information than the government-wide statements by providing information about the most significant funds of the State – not the State as a whole. The three categories into which the funds of the State can be classified are governmental funds, proprietary funds, and fiduciary funds.
Governmental funds account for most of the functions reported as governmental activities in the government-wide financial statements. Governmental fund financial statements focus on short-term inflows and outflows of current financial resources and the balances of these resources available at fiscal year-end. Governmental funds are reported using the modified accrual basis of accounting and the current resources measurement focus, which assists in determining whether there are more or fewer financial resources that can be spent in the near future to finance the State’s governmental programs.
Proprietary funds encompass enterprise funds and internal service funds. When the State charges customers for the services it provides, whether to outside customers (enterprise funds) or to other state agencies (internal service funds), the services are generally reported in the proprietary funds. Enterprise funds are used to report the same functions presented as business-type activities in the government-wide financial statements. Proprietary funds apply the accrual basis of accounting utilized by private sector businesses. Internal service funds are used to accumulate and allocate costs internally among the various functions of the State. Because the internal service funds mainly benefit governmental rather than business-type functions, they are included in the governmental activities in the government-wide financial statements.
Fiduciary funds are used to account for resources held for the benefit of parties outside the government. Fiduciary funds are not reflected in the government-wide financial statements because the resources of those funds are not available to support State programs. The State is responsible for ensuring that the assets reported in these funds are used for their intended purposes. The fiduciary fund category includes pension trust funds, investment trust funds, private-purpose trust funds, and agency funds.
Notes to the Financial Statements
The notes provide additional information that is essential to a full understanding of the data provided in the government-wide and fund financial statements. The notes to the financial statements can be found on pages 45 – 104 of this report.
Required Supplementary Information (RSI)
In addition to the basic financial statements and accompanying notes, this report also presents budgetary comparison schedules for the General Fund, which can be found on page 105 of this report.
Other Information
The CAFR also includes other information that is not part of the basic financial statements or required by the GASB. This information is included for additional analysis and is comprised of the Fund Combining Statements (pages 114 – 147), the budgetary comparison schedule for the Bond Security and Redemption Fund (page 111), and the Statistical Section.
State of Louisiana
- 19 -
THE STATE AS A WHOLE
Government-wide Financial Analysis
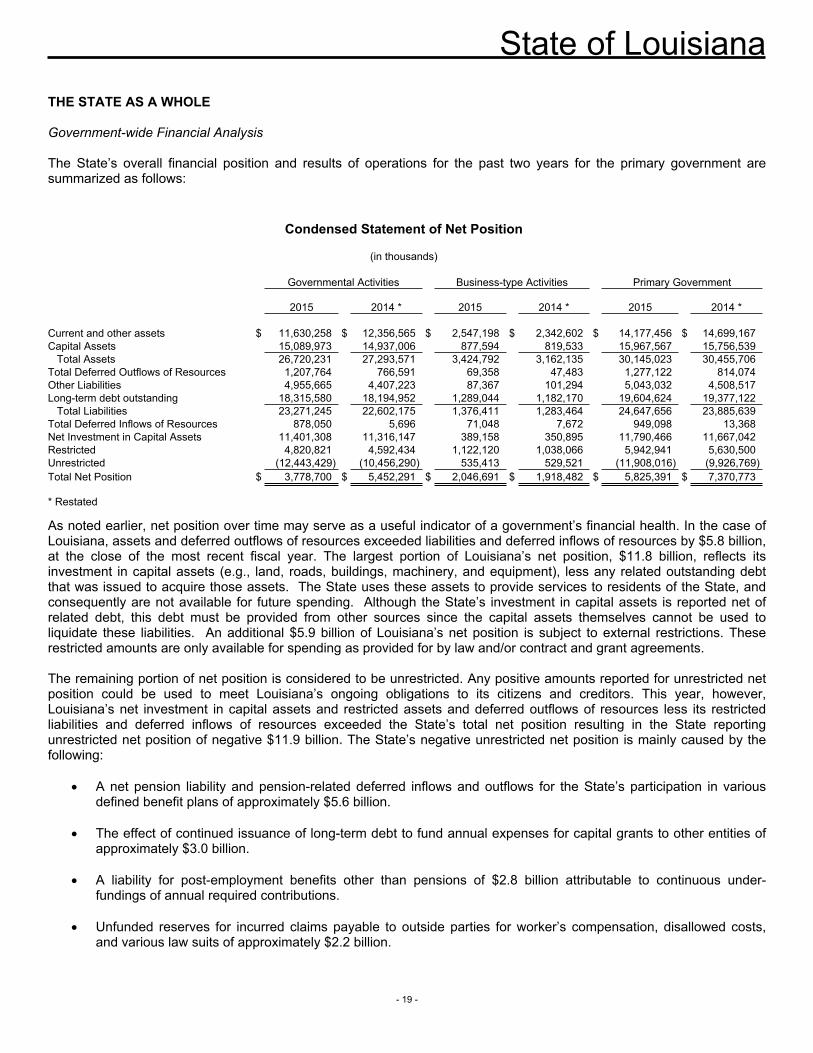
The State’s overall financial position and results of operations for the past two years for the primary government are summarized as follows:
Condensed Statement of Net Position
(in thousands) Governmental Activities Business-type Activities Primary Government 2015 2014 * 2015 2014 * 2015 2014 * Current and other assets $ 11,630,258 $ 12,356,565 $ 2,547,198 $ 2,342,602 $ 14,177,456 $ 14,699,167Capital Assets 15,089,973 14,937,006 877,594 819,533 15,967,567 15,756,539
Total Assets 26,720,231 27,293,571 3,424,792 3,162,135 30,145,023 30,455,706Total Deferred Outflows of Resources 1,207,764 766,591 69,358 47,483 1,277,122 814,074Other Liabilities 4,955,665 4,407,223 87,367 101,294 5,043,032 4,508,517Long-term debt outstanding 18,315,580 18,194,952 1,289,044 1,182,170 19,604,624 19,377,122
Total Liabilities 23,271,245 22,602,175 1,376,411 1,283,464 24,647,656 23,885,639Total Deferred Inflows of Resources 878,050 5,696 71,048 7,672 949,098 13,368Net Investment in Capital Assets 11,401,308 11,316,147 389,158 350,895 11,790,466 11,667,042Restricted 4,820,821 4,592,434 1,122,120 1,038,066 5,942,941 5,630,500Unrestricted (12,443,429) (10,456,290) 535,413 529,521 (11,908,016) (9,926,769)Total Net Position $ 3,778,700 $ 5,452,291 $ 2,046,691 $ 1,918,482 $ 5,825,391 $ 7,370,773 * Restated
As noted earlier, net position over time may serve as a useful indicator of a government’s financial health. In the case of Louisiana, assets and deferred outflows of resources exceeded liabilities and deferred inflows of resources by $5.8 billion, at the close of the most recent fiscal year. The largest portion of Louisiana’s net position, $11.8 billion, reflects its investment in capital assets (e.g., land, roads, buildings, machinery, and equipment), less any related outstanding debt that was issued to acquire those assets. The State uses these assets to provide services to residents of the State, and consequently are not available for future spending. Although the State’s investment in capital assets is reported net of related debt, this debt must be provided from other sources since the capital assets themselves cannot be used to liquidate these liabilities. An additional $5.9 billion of Louisiana’s net position is subject to external restrictions. These restricted amounts are only available for spending as provided for by law and/or contract and grant agreements.
The remaining portion of net position is considered to be unrestricted. Any positive amounts reported for unrestricted net position could be used to meet Louisiana’s ongoing obligations to its citizens and creditors. This year, however, Louisiana’s net investment in capital assets and restricted assets and deferred outflows of resources less its restricted liabilities and deferred inflows of resources exceeded the State’s total net position resulting in the State reporting unrestricted net position of negative $11.9 billion. The State’s negative unrestricted net position is mainly caused by the following:
A net pension liability and pension-related deferred inflows and outflows for the State’s participation in various defined benefit plans of approximately $5.6 billion.
The effect of continued issuance of long-term debt to fund annual expenses for capital grants to other entities of approximately $3.0 billion.
A liability for post-employment benefits other than pensions of $2.8 billion attributable to continuous under-fundings of annual required contributions.
Unfunded reserves for incurred claims payable to outside parties for worker’s compensation, disallowed costs, and various law suits of approximately $2.2 billion.
State of Louisiana
- 20 -
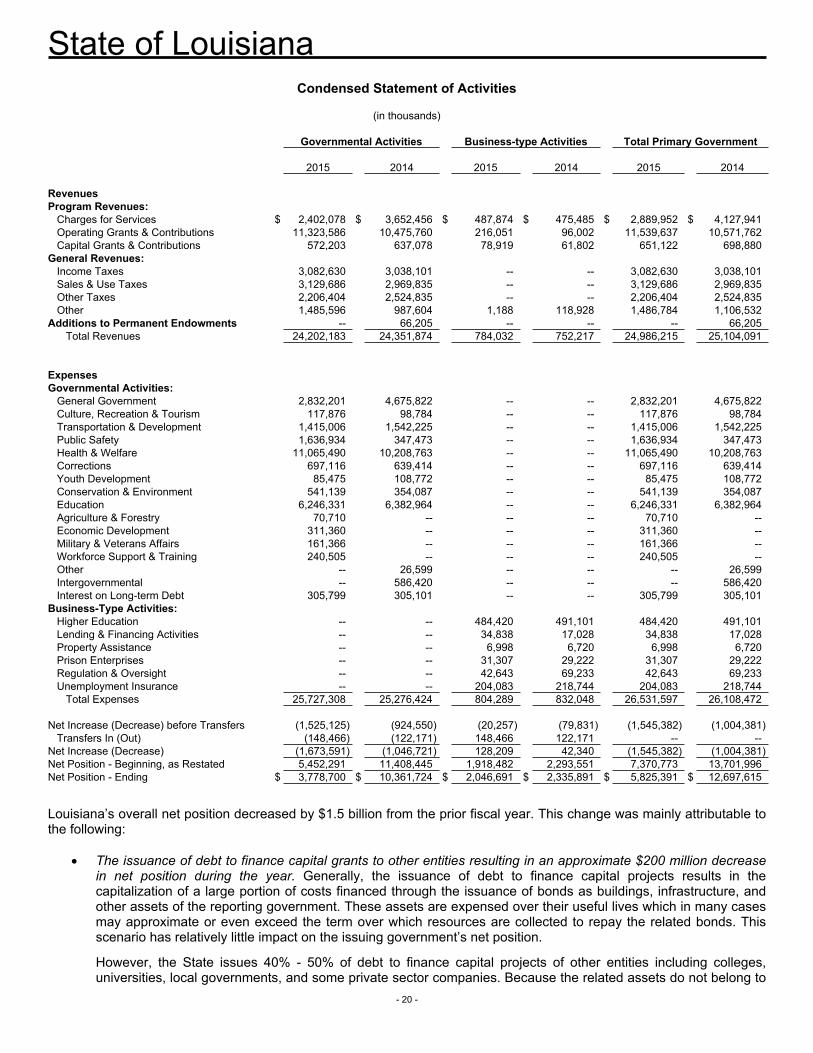
Condensed Statement of Activities
(in thousands) Governmental Activities Business-type Activities Total Primary Government 2015 2014 2015 2014 2015 2014 Revenues Program Revenues:
Charges for Services $ 2,402,078 $ 3,652,456 $ 487,874 $ 475,485 $ 2,889,952 $ 4,127,941Operating Grants & Contributions 11,323,586 10,475,760 216,051 96,002 11,539,637 10,571,762Capital Grants & Contributions 572,203 637,078 78,919 61,802 651,122 698,880
General Revenues: Income Taxes 3,082,630 3,038,101 -- -- 3,082,630 3,038,101Sales & Use Taxes 3,129,686 2,969,835 -- -- 3,129,686 2,969,835Other Taxes 2,206,404 2,524,835 -- -- 2,206,404 2,524,835Other 1,485,596 987,604 1,188 118,928 1,486,784 1,106,532
Additions to Permanent Endowments -- 66,205 -- -- -- 66,205Total Revenues 24,202,183 24,351,874 784,032 752,217 24,986,215 25,104,091
Expenses Governmental Activities:
General Government 2,832,201 4,675,822 -- -- 2,832,201 4,675,822Culture, Recreation & Tourism 117,876 98,784 -- -- 117,876 98,784Transportation & Development 1,415,006 1,542,225 -- -- 1,415,006 1,542,225Public Safety 1,636,934 347,473 -- -- 1,636,934 347,473Health & Welfare 11,065,490 10,208,763 -- -- 11,065,490 10,208,763Corrections 697,116 639,414 -- -- 697,116 639,414Youth Development 85,475 108,772 -- -- 85,475 108,772Conservation & Environment 541,139 354,087 -- -- 541,139 354,087Education 6,246,331 6,382,964 -- -- 6,246,331 6,382,964Agriculture & Forestry 70,710 -- -- -- 70,710 --Economic Development 311,360 -- -- -- 311,360 --Military & Veterans Affairs 161,366 -- -- -- 161,366 --Workforce Support & Training 240,505 -- -- -- 240,505 --Other -- 26,599 -- -- -- 26,599Intergovernmental -- 586,420 -- -- -- 586,420Interest on Long-term Debt 305,799 305,101 -- -- 305,799 305,101
Business-Type Activities: Higher Education -- -- 484,420 491,101 484,420 491,101Lending & Financing Activities -- -- 34,838 17,028 34,838 17,028Property Assistance -- -- 6,998 6,720 6,998 6,720Prison Enterprises -- -- 31,307 29,222 31,307 29,222Regulation & Oversight -- -- 42,643 69,233 42,643 69,233Unemployment Insurance -- -- 204,083 218,744 204,083 218,744
Total Expenses 25,727,308 25,276,424 804,289 832,048 26,531,597 26,108,472 Net Increase (Decrease) before Transfers (1,525,125) (924,550) (20,257) (79,831) (1,545,382) (1,004,381)
Transfers In (Out) (148,466) (122,171) 148,466 122,171 -- --Net Increase (Decrease) (1,673,591) (1,046,721) 128,209 42,340 (1,545,382) (1,004,381)Net Position - Beginning, as Restated 5,452,291 11,408,445 1,918,482 2,293,551 7,370,773 13,701,996Net Position - Ending $ 3,778,700 $ 10,361,724 $ 2,046,691 $ 2,335,891 $ 5,825,391 $ 12,697,615
Louisiana’s overall net position decreased by $1.5 billion from the prior fiscal year. This change was mainly attributable to the following:
The issuance of debt to finance capital grants to other entities resulting in an approximate $200 million decrease in net position during the year. Generally, the issuance of debt to finance capital projects results in the capitalization of a large portion of costs financed through the issuance of bonds as buildings, infrastructure, and other assets of the reporting government. These assets are expensed over their useful lives which in many cases may approximate or even exceed the term over which resources are collected to repay the related bonds. This scenario has relatively little impact on the issuing government’s net position.
However, the State issues 40% - 50% of debt to finance capital projects of other entities including colleges, universities, local governments, and some private sector companies. Because the related assets do not belong to
State of Louisiana
- 21 -
the State, the State cannot capitalize and depreciate these costs. Rather, the bond proceeds are expensed as capital grants and consequently reduce net position. Only when revenues are recognized over the term of the bonds (which has a positive effect on net position) will the negative effects be reversed. Because the spending of bond proceeds occurs within one to three years of issuance and bonds commonly have maturities of 30 or more years, the State carries the resulting deflated net position for years after the expenses have been incurred.
The spend-down of prior year revenues of approximately $498.3 million to fund current year operations for the Medicaid program.
The recognition of approximately $325.9 million in expense for new claims liabilities incurred during the year. These claims are largely comprised of the disallowance by the Centers for Medicare and Medicaid Services (CMS) of $190 million in funds used as state matching for the Medicaid program; the disallowance by FEMA of expenditures made under the Public Assistance program; and other additional claims.
The funding of post-employment benefits other than pensions (OPEB) on a pay-as-you-go basis. Under this funding methodology, no contributions are made to fund future OPEB payments that have been earned by employees. Rather, OPEB are paid as they become due. The State records annual OPEB cost equal to under-fundings of the annual required contributions (ARC). The ARC is an actuarially determined amount that is equal to the discounted present value of the future OPEB earned by active employees during the year plus an amount to amortize prior under-fundings. The State’s OPEB cost is a direct reduction to the State’s net position. During fiscal year 2015 the State’s annual OPEB cost was $138.0 million.
THE STATE’S FUNDS
As discussed earlier, funds provide additional detail on the amounts presented in the government-wide financial statements. Governmental fund information provides additional detail on the State’s governmental activities while enterprise fund information provides additional detail on the State’s business-type activities. An analysis of balances and individual transactions of the State’s governmental and enterprise funds is provided below:
Governmental Funds
Even though governmental funds and the governmental activities report the same operations, changes in fund balance in the governmental fund financial statements may differ significantly from changes net position in the government-wide financial statements. This is because governmental funds use the current resources measurement focus and modified accrual basis of accounting while governmental activities uses the economic resources measurement focus and the accrual basis of accounting. Examples of items reported in governmental activities but not in governmental funds include capital assets and long-term liabilities not expected to be liquidated with current financial resources such as bonds, the net pension liability and the net obligation for other post-employment benefits. Despite these differences in perspective and basis of accounting, the information presented in the governmental funds financial statements largely reinforced the financial results reported in the government-wide financial statements this year. This was due to the use of prior year cash balances that were accounted for as expenditures and expenses at the governmental fund and government-wide level, respectively.
The General Fund experienced a decrease in fund balance of $1.1 billion due to the following:
The expenditure of $209.9 million in beginning fund balance to service general obligation debt. The expenditure of $167.1 million in State Highway Improvement bond proceeds issued in prior years for the
construction and improvement of state roads that are not part of the federal highway system and approximately $49.4 million in Unclaimed Property Leverage bond proceeds for the I-49 project.
Spend down of approximately $498.3 million in beginning fund balance to fund State match for the Medicaid program.
Spend down of approximately $60.1 million in beginning fund balance to fund coastal protection and restoration projects.
Spend down of $157.4 million in prior years’ Office of Group Benefits cash collections due to a 6.1% increase in claims expenditures accompanied by increase in revenues of only 4.6%.
Receipts of BP settlement monies and other resources available for natural resource restoration that remained largely unspent at the end of the year.
State of Louisiana
- 22 -
Fund balance in the Capital Outlay Escrow Fund decreased by $96.4 million as expenditures for highway and road construction and maintenance exceeded transfers from the General Fund and the Transportation Trust Fund and proceeds from general obligation bonds issued during the year. Fund balance for nonmajor governmental funds decreased by $59.9 million. The decrease was driven largely by activity in two funds. Payments for principal, interest, bond issuance costs and deposits to advance refund outstanding debt exceeded gasoline tax revenues during the year by $26.2 million in the TIMED fund. Further, prior year fund balance in the TIMED fund was spent down by $19.8 million in the form of transfers to the Capital Outlay Escrow Fund of bond proceeds issued in prior years. In addition, fund balance in the Transportation Trust Fund decreased by $48.9 million due to transfers made in response to a projected deficit in the General Fund.
Enterprise Funds
Enterprise funds provide additional detail for the amounts presented as business-type activities in the government-wide financial statements. Enterprise funds use the same measurement focus and basis of accounting as business-type activities. Some of the larger factors that resulted in the change in net position of enterprise funds are as follows:
The Louisiana Community and Technical Colleges System (LCTCS) experienced an increase in net position of $59.6 million due mainly to an increase in federal grant revenues.
Net position for the Unemployment Insurance Trust Fund increased by $55.5 million due mainly to a decrease in unemployment claims.
Net position for aggregate remaining nonmajor enterprise funds increased by $13.1 million due to increases in federal capital contributions to the Clean Water and Drinking Water State Revolving Loan Funds offset with decreases to net position in the Louisiana Gulf Opportunity Loan Fund from the transfer of loan proceeds to the Bond Security and Redemption Fund and interest and depreciation expenses that exceeded revenues for the Louisiana Transportation Authority.
GENERAL FUND BUDGETARY HIGHLIGHTS
Most of the State’s operating expenditures are reported in the General Fund. These expenditures are funded by a variety of sources including federal revenues and transfers of interagency receipts; agency self-generated revenues; and taxes, licenses, and fees from the Bond Security and Redemption Fund and other statutorily dedicated funds. Budgeted expenditures are constrained by annual revenue projections forecasted by the Revenue Estimating Conference (REC). Actual expenditures financed with federal receipts and General Fund taxes, licenses, and fees are limited to current budget. Actual expenditures of all other revenues are limited to the lesser of budget or actual collections. Over the course of the year, agencies may request budget adjustments based on actual need.
Despite several factors the final budget for the General Fund was $430.7 million greater than the budgeted expenditures originally appropriated by the Legislature. First, the original budget was adopted with an approximate $75 million negative imbalance. Verbiage in the appropriations act required the imbalance to be resolved by the end of the year including expenditure reductions from the Government Efficiencies Management Support (GEMS) initiatives. Second, taxes, licenses and fees forecasted by the REC declined by $146.3 million due mainly to declines in severance taxes and mineral royalties driven by falling oil prices. Third, Executive Order BJ 2014-01 and BJ 2014-16 implemented a hiring freeze and an expenditure freeze, respectively, to limit non-essential spending. These factors caused budgeted expenditures funded with forecasted taxes, licenses and fees to be reduced; however, expenditures funded with other General Fund revenue sources such as federal, other fees and self-generated, interagency transfers and transfers from statutorily dedicated funds increased by a greater amount. The major drivers of these budgeted expenditure increases by function are as follows:
Health & Welfare budget authority increased by $65.6 million related to the Medicaid program.
Conservation and Environment and Public Safety budget authorities increased by a total of $178.9 million to facilitate the spending of BP settlement funds received during the year.
Education budget authority increased from original budget by approximately $77.0 million due mainly to authorization of the Recovery School District to receive transfers of FEMA Public Assistance dollars to capital projects at various schools and an increase in expenditures funded from taxes, licenses and fees necessary to
State of Louisiana
- 23 -
fully fund public school support provided through the Minimum Foundation Program in accordance with the constitutionally established formula.
Economic Development budgeted expenditures funded with federal receipts and transfers from statutorily dedicated funds increased by $67.3 million to allow for additional grant expenditures to Louisiana businesses under the State’s economic development programs and the federal State Small Business Credit Initiatives Program.
Military & Veterans Affairs budgeted expenditures funded with federal receipts increased by approximately $37.5 million to provide authority to receive and expend federal funds for the disposal of explosive materials located at Camp Minden.
Actual budgetary basis General Fund expenditures were $2.1 billion lower than final budgeted amounts. This variance is mainly because forecasts for budgeted expenditures of federal receipts are largely based on remaining grant balances. Since the entire remaining allocations of grants are rarely spent within one year, budgeted amounts are inflated relative to actuals. In other instances, funds were received in accordance with the budget; however, delays in expenditures occurred due to various factors. Most notably, BP settlement funds were received and budget authority to expend the funds was granted; however, delays in several key projects resulted in the actual expenditures that were lower than final budgeted amounts. In these cases, the cash and budget authority were carried forward to fiscal year 2016. Carry-forwards of federal receipts, agency self-generated revenues, and interagency transfers totaled $306.0 million. These amounts were offset with a shortfall in actual General Fund taxes, licenses and fees of $117.1 million to produce a total budget basis General Fund surplus of $188.9 million. The shortfall was mainly attributable to lower than forecasted corporate income tax revenues caused by an acceleration in tax credit filings prompted by legislative changes that reduced corporate tax credits effective July 1, 2015. The $117.1 million shortfall in General Fund taxes, licenses and fees is required to be resolved during fiscal year 2016. The $306.0 million in surplus funds were restricted, committed or assigned for other purposes and are consequently not available to resolve the $117.1 million shortfall.
CAPITAL ASSET AND DEBT ADMINISTRATION
Capital Assets
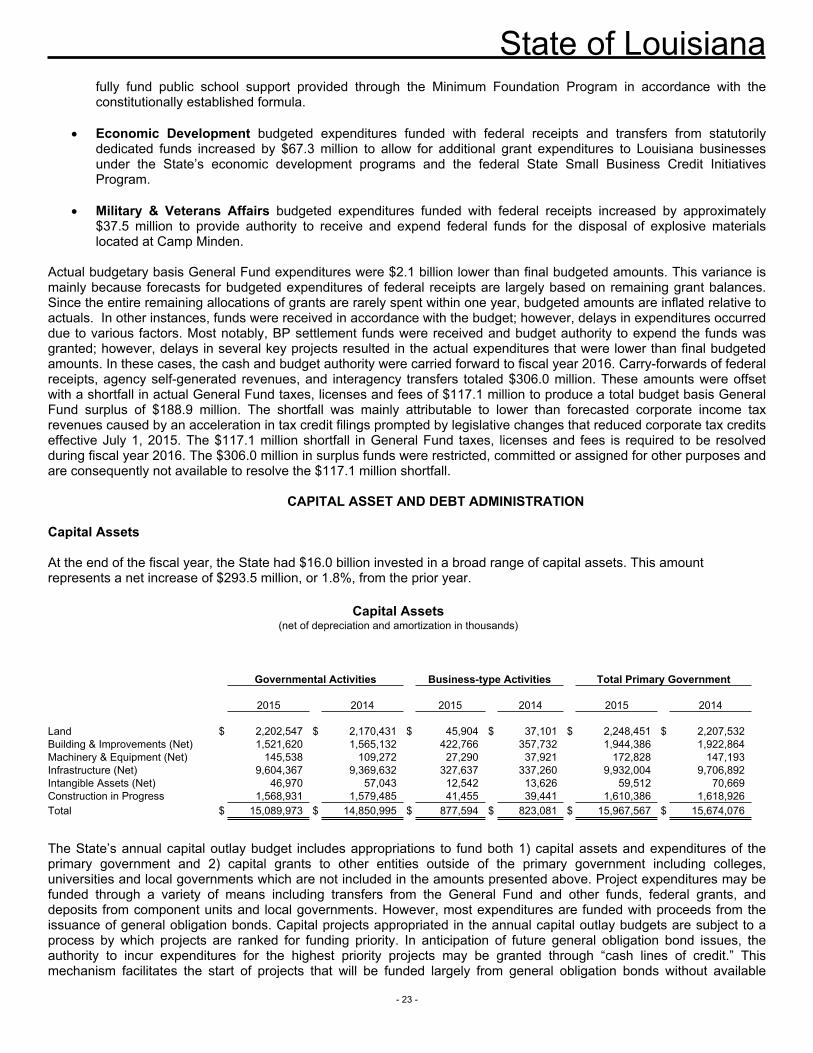
At the end of the fiscal year, the State had $16.0 billion invested in a broad range of capital assets. This amount represents a net increase of $293.5 million, or 1.8%, from the prior year.
Capital Assets(net of depreciation and amortization in thousands)
Governmental Activities Business-type Activities Total Primary Government 2015 2014 2015 2014 2015 2014 Land $ 2,202,547 $ 2,170,431 $ 45,904 $ 37,101 $ 2,248,451 $ 2,207,532Building & Improvements (Net) 1,521,620 1,565,132 422,766 357,732 1,944,386 1,922,864Machinery & Equipment (Net) 145,538 109,272 27,290 37,921 172,828 147,193Infrastructure (Net) 9,604,367 9,369,632 327,637 337,260 9,932,004 9,706,892Intangible Assets (Net) 46,970 57,043 12,542 13,626 59,512 70,669Construction in Progress 1,568,931 1,579,485 41,455 39,441 1,610,386 1,618,926Total $ 15,089,973 $ 14,850,995 $ 877,594 $ 823,081 $ 15,967,567 $ 15,674,076
The State’s annual capital outlay budget includes appropriations to fund both 1) capital assets and expenditures of the primary government and 2) capital grants to other entities outside of the primary government including colleges, universities and local governments which are not included in the amounts presented above. Project expenditures may be funded through a variety of means including transfers from the General Fund and other funds, federal grants, and deposits from component units and local governments. However, most expenditures are funded with proceeds from the issuance of general obligation bonds. Capital projects appropriated in the annual capital outlay budgets are subject to a process by which projects are ranked for funding priority. In anticipation of future general obligation bond issues, the authority to incur expenditures for the highest priority projects may be granted through “cash lines of credit.” This mechanism facilitates the start of projects that will be funded largely from general obligation bonds without available
State of Louisiana
- 24 -
general obligation bonds and provides an indication of outstanding capital commitments. At June 30, 2015 outstanding lines of credit were $1.1 billion.
Refer to Note 5 – “Capital Assets” on page 75 for more details of the changes in capital assets.
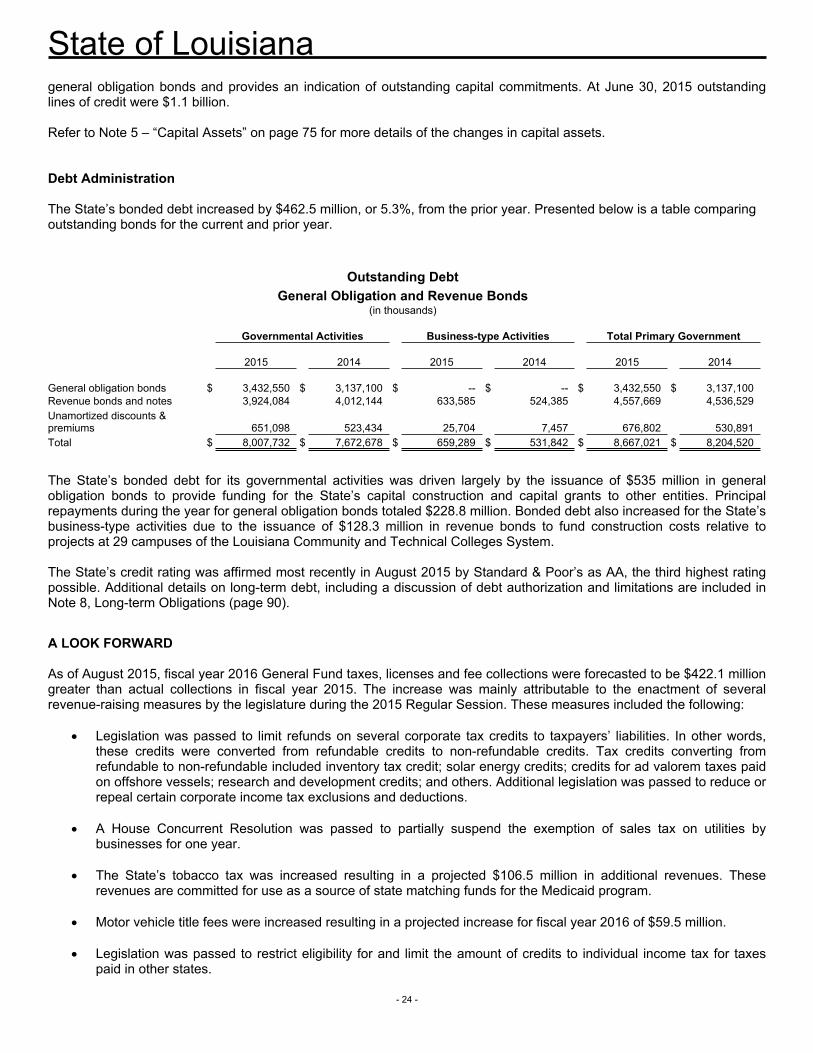
Debt Administration
The State’s bonded debt increased by $462.5 million, or 5.3%, from the prior year. Presented below is a table comparing outstanding bonds for the current and prior year.
Outstanding DebtGeneral Obligation and Revenue Bonds
(in thousands) Governmental Activities Business-type Activities Total Primary Government 2015 2014 2015 2014 2015 2014 General obligation bonds $ 3,432,550 $ 3,137,100 $ -- $ -- $ 3,432,550 $ 3,137,100Revenue bonds and notes 3,924,084 4,012,144 633,585 524,385 4,557,669 4,536,529Unamortized discounts & premiums 651,098 523,434 25,704 7,457 676,802 530,891Total $ 8,007,732 $ 7,672,678 $ 659,289 $ 531,842 $ 8,667,021 $ 8,204,520
The State’s bonded debt for its governmental activities was driven largely by the issuance of $535 million in general obligation bonds to provide funding for the State’s capital construction and capital grants to other entities. Principal repayments during the year for general obligation bonds totaled $228.8 million. Bonded debt also increased for the State’s business-type activities due to the issuance of $128.3 million in revenue bonds to fund construction costs relative to projects at 29 campuses of the Louisiana Community and Technical Colleges System.
The State’s credit rating was affirmed most recently in August 2015 by Standard & Poor’s as AA, the third highest rating possible. Additional details on long-term debt, including a discussion of debt authorization and limitations are included in Note 8, Long-term Obligations (page 90).
A LOOK FORWARD
As of August 2015, fiscal year 2016 General Fund taxes, licenses and fee collections were forecasted to be $422.1 million greater than actual collections in fiscal year 2015. The increase was mainly attributable to the enactment of several revenue-raising measures by the legislature during the 2015 Regular Session. These measures included the following:
Legislation was passed to limit refunds on several corporate tax credits to taxpayers’ liabilities. In other words, these credits were converted from refundable credits to non-refundable credits. Tax credits converting from refundable to non-refundable included inventory tax credit; solar energy credits; credits for ad valorem taxes paid on offshore vessels; research and development credits; and others. Additional legislation was passed to reduce or repeal certain corporate income tax exclusions and deductions.
A House Concurrent Resolution was passed to partially suspend the exemption of sales tax on utilities by businesses for one year.
The State’s tobacco tax was increased resulting in a projected $106.5 million in additional revenues. These revenues are committed for use as a source of state matching funds for the Medicaid program.
Motor vehicle title fees were increased resulting in a projected increase for fiscal year 2016 of $59.5 million.
Legislation was passed to restrict eligibility for and limit the amount of credits to individual income tax for taxes paid in other states.
State of Louisiana
- 25 -
On November 16, 2015 the Revenue Estimating Conference adopted a $370.2 reduction in the forecast of General Fund taxes, licenses and fees for fiscal year 2016. The reductions mainly occurred in corporate income taxes, sales taxes, severance taxes, and mineral royalties. As previously mentioned, a budgetary basis deficit of $117.1 million in fiscal year 2015 General Fund taxes, licenses, and fees was presented at the October 2015 meeting of the Joint Legislative Committee on the Budget (JLCB). The State is constitutionally required to resolve this deficit by the end of the fiscal year 2016.
At the November meeting of the JLCB, the Division of Administration proposed a plan to resolve both the fiscal year 2015 deficit and the fiscal year 2016 projected deficit in General Fund taxes, licenses and fees. The plan included approximately $352.7 million in reductions to appropriations, $89.1 million in transfers in from other funds, $17.4 million in additional revenues, and the spend-down of approximately $28.2 million in beginning fund balance restricted for budget stabilization. All elements of the plan were approved.
Other currently known factors that will affect the State’s net position for fiscal year 2016 include the following:
An expected $204.1 million in economic damage payments from the BP Oil Spill settlement agreement. Forty-five percent or approximately $91.8 million is required to be set aside for budget stabilization which will have a positive effect on the State’s net position.
Based on actuarial valuations dated June 30, 2015, the State’s net position will decrease during fiscal year 2016 due to an increase in the net pension liability relative to the State’s participation in the Louisiana State Employees’ Retirement System.
The State continues to fund other post-employment benefits on a pay-as-you-go basis. The State’s net position will decrease to the extent that fiscal year 2016 other post-employment benefit payments fall short of the actuarially required contributions.
As of August 2015 all available bond proceeds in the Capital Outlay Escrow Fund had been spent. However, expenditures are continuing to be made as if bond proceeds are available under cash lines of credit which will necessitate another bond issuance later in fiscal year 2016. Net position will decrease during fiscal year 2016 to the extent that the grant expenses fund from newly issued bonds exceed retirement of bond principal.
Requests for Information
This financial report is designed to provide a general overview of the State’s finances for interested parties. Questions concerning any of the information provided in this report or requests for additional financial information may be obtained by writing to the Office of Statewide Reporting and Accounting Policy, P.O. Box 94095, Baton Rouge, LA 70804-9095 or by telephoning (225) 342-0708. The component units of the State issue their own audited financial reports. Telephone numbers for these entities can also be obtained from the Office of Statewide Reporting and Accounting Policy. This report is available on our website at http://www.doa.louisiana.gov/osrap/cafr-2.htm.

- 26 -
B A S I C F I N A N C I A L S T A T E M E N T S
2014-2015 Comprehensive Annual Financial Report
G O V E R N M E N T - W I D E F I N A N C I A L S T A T E M E N T S
2014-2015 Comprehensive Annual Financial Report

- 27 -
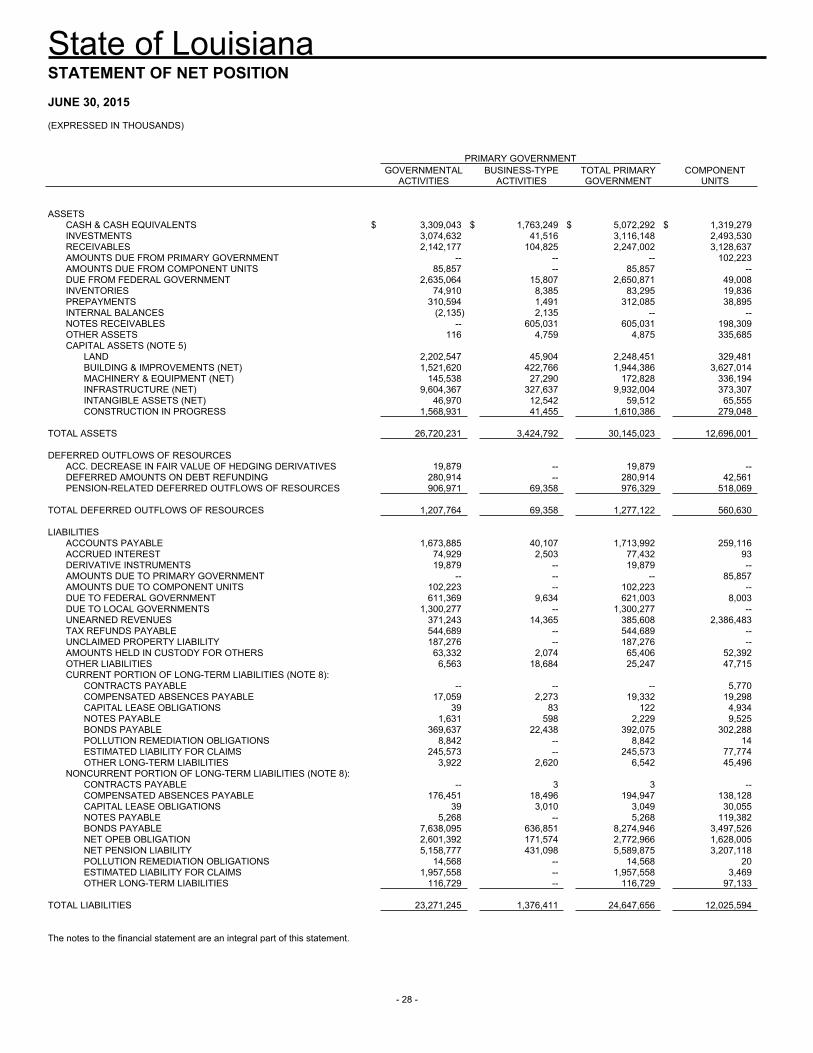
State of Louisiana
- 28 -
STATEMENT OF NET POSITION JUNE 30, 2015 (EXPRESSED IN THOUSANDS) PRIMARY GOVERNMENT
GOVERNMENTAL
ACTIVITIES BUSINESS-TYPE
ACTIVITIES TOTAL PRIMARY GOVERNMENT
COMPONENT UNITS
ASSETS
CASH & CASH EQUIVALENTS $ 3,309,043 $ 1,763,249 $ 5,072,292 $ 1,319,279INVESTMENTS 3,074,632 41,516 3,116,148 2,493,530RECEIVABLES 2,142,177 104,825 2,247,002 3,128,637AMOUNTS DUE FROM PRIMARY GOVERNMENT -- -- -- 102,223AMOUNTS DUE FROM COMPONENT UNITS 85,857 -- 85,857 --DUE FROM FEDERAL GOVERNMENT 2,635,064 15,807 2,650,871 49,008INVENTORIES 74,910 8,385 83,295 19,836PREPAYMENTS 310,594 1,491 312,085 38,895INTERNAL BALANCES (2,135) 2,135 -- --NOTES RECEIVABLES -- 605,031 605,031 198,309OTHER ASSETS 116 4,759 4,875 335,685CAPITAL ASSETS (NOTE 5)
LAND 2,202,547 45,904 2,248,451 329,481BUILDING & IMPROVEMENTS (NET) 1,521,620 422,766 1,944,386 3,627,014MACHINERY & EQUIPMENT (NET) 145,538 27,290 172,828 336,194INFRASTRUCTURE (NET) 9,604,367 327,637 9,932,004 373,307INTANGIBLE ASSETS (NET) 46,970 12,542 59,512 65,555CONSTRUCTION IN PROGRESS 1,568,931 41,455 1,610,386 279,048
TOTAL ASSETS 26,720,231 3,424,792 30,145,023 12,696,001 DEFERRED OUTFLOWS OF RESOURCES
ACC. DECREASE IN FAIR VALUE OF HEDGING DERIVATIVES 19,879 -- 19,879 --DEFERRED AMOUNTS ON DEBT REFUNDING 280,914 -- 280,914 42,561PENSION-RELATED DEFERRED OUTFLOWS OF RESOURCES 906,971 69,358 976,329 518,069
TOTAL DEFERRED OUTFLOWS OF RESOURCES 1,207,764 69,358 1,277,122 560,630 LIABILITIES
ACCOUNTS PAYABLE 1,673,885 40,107 1,713,992 259,116ACCRUED INTEREST 74,929 2,503 77,432 93DERIVATIVE INSTRUMENTS 19,879 -- 19,879 --AMOUNTS DUE TO PRIMARY GOVERNMENT -- -- -- 85,857AMOUNTS DUE TO COMPONENT UNITS 102,223 -- 102,223 --DUE TO FEDERAL GOVERNMENT 611,369 9,634 621,003 8,003DUE TO LOCAL GOVERNMENTS 1,300,277 -- 1,300,277 --UNEARNED REVENUES 371,243 14,365 385,608 2,386,483TAX REFUNDS PAYABLE 544,689 -- 544,689 --UNCLAIMED PROPERTY LIABILITY 187,276 -- 187,276 --AMOUNTS HELD IN CUSTODY FOR OTHERS 63,332 2,074 65,406 52,392OTHER LIABILITIES 6,563 18,684 25,247 47,715CURRENT PORTION OF LONG-TERM LIABILITIES (NOTE 8):
CONTRACTS PAYABLE -- -- -- 5,770COMPENSATED ABSENCES PAYABLE 17,059 2,273 19,332 19,298CAPITAL LEASE OBLIGATIONS 39 83 122 4,934NOTES PAYABLE 1,631 598 2,229 9,525BONDS PAYABLE 369,637 22,438 392,075 302,288POLLUTION REMEDIATION OBLIGATIONS 8,842 -- 8,842 14ESTIMATED LIABILITY FOR CLAIMS 245,573 -- 245,573 77,774OTHER LONG-TERM LIABILITIES 3,922 2,620 6,542 45,496
NONCURRENT PORTION OF LONG-TERM LIABILITIES (NOTE 8): CONTRACTS PAYABLE -- 3 3 --COMPENSATED ABSENCES PAYABLE 176,451 18,496 194,947 138,128CAPITAL LEASE OBLIGATIONS 39 3,010 3,049 30,055NOTES PAYABLE 5,268 -- 5,268 119,382BONDS PAYABLE 7,638,095 636,851 8,274,946 3,497,526NET OPEB OBLIGATION 2,601,392 171,574 2,772,966 1,628,005NET PENSION LIABILITY 5,158,777 431,098 5,589,875 3,207,118POLLUTION REMEDIATION OBLIGATIONS 14,568 -- 14,568 20ESTIMATED LIABILITY FOR CLAIMS 1,957,558 -- 1,957,558 3,469OTHER LONG-TERM LIABILITIES 116,729 -- 116,729 97,133
TOTAL LIABILITIES 23,271,245 1,376,411 24,647,656 12,025,594
The notes to the financial statement are an integral part of this statement.
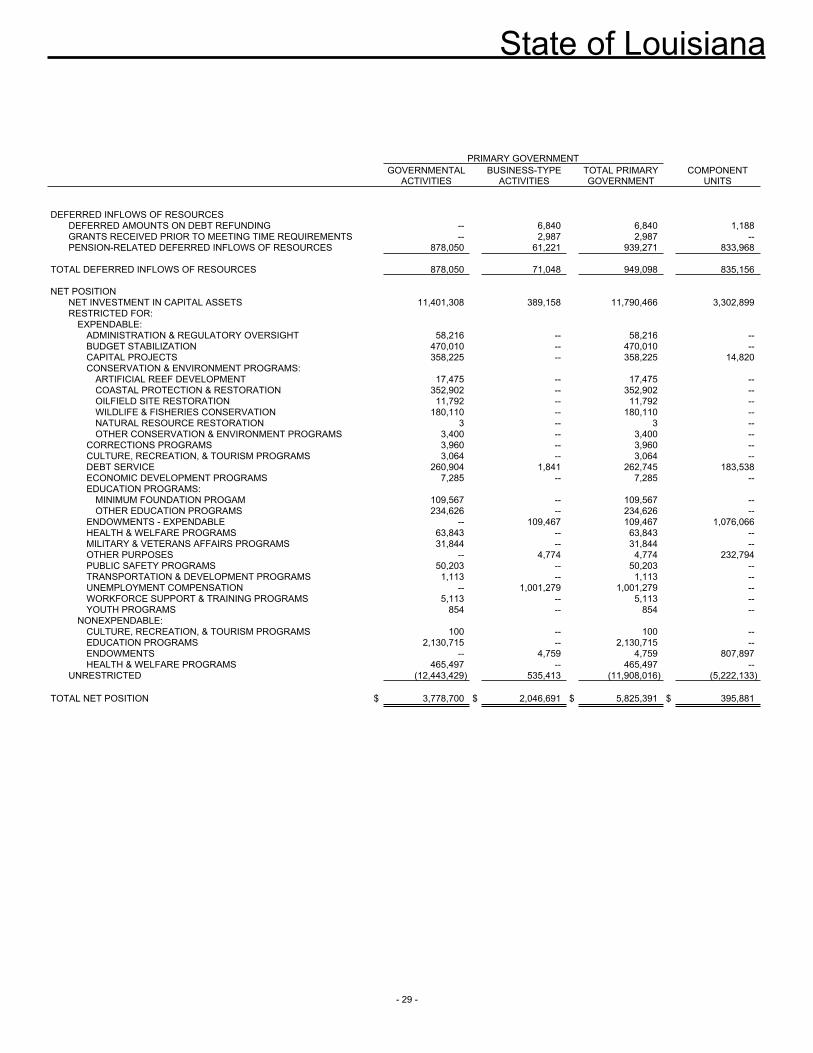
State of Louisiana
- 29 -
PRIMARY GOVERNMENT
GOVERNMENTAL
ACTIVITIES BUSINESS-TYPE
ACTIVITIES TOTAL PRIMARY GOVERNMENT
COMPONENT UNITS
DEFERRED INFLOWS OF RESOURCES DEFERRED AMOUNTS ON DEBT REFUNDING -- 6,840 6,840 1,188GRANTS RECEIVED PRIOR TO MEETING TIME REQUIREMENTS -- 2,987 2,987 --PENSION-RELATED DEFERRED INFLOWS OF RESOURCES 878,050 61,221 939,271 833,968
TOTAL DEFERRED INFLOWS OF RESOURCES 878,050 71,048 949,098 835,156 NET POSITION
NET INVESTMENT IN CAPITAL ASSETS 11,401,308 389,158 11,790,466 3,302,899RESTRICTED FOR:
EXPENDABLE: ADMINISTRATION & REGULATORY OVERSIGHT 58,216 -- 58,216 --BUDGET STABILIZATION 470,010 -- 470,010 --CAPITAL PROJECTS 358,225 -- 358,225 14,820CONSERVATION & ENVIRONMENT PROGRAMS:
ARTIFICIAL REEF DEVELOPMENT 17,475 -- 17,475 --COASTAL PROTECTION & RESTORATION 352,902 -- 352,902 --OILFIELD SITE RESTORATION 11,792 -- 11,792 --WILDLIFE & FISHERIES CONSERVATION 180,110 -- 180,110 --NATURAL RESOURCE RESTORATION 3 -- 3 --OTHER CONSERVATION & ENVIRONMENT PROGRAMS 3,400 -- 3,400 --
CORRECTIONS PROGRAMS 3,960 -- 3,960 --CULTURE, RECREATION, & TOURISM PROGRAMS 3,064 -- 3,064 --DEBT SERVICE 260,904 1,841 262,745 183,538ECONOMIC DEVELOPMENT PROGRAMS 7,285 -- 7,285 --EDUCATION PROGRAMS:
MINIMUM FOUNDATION PROGAM 109,567 -- 109,567 --OTHER EDUCATION PROGRAMS 234,626 -- 234,626 --
ENDOWMENTS - EXPENDABLE -- 109,467 109,467 1,076,066HEALTH & WELFARE PROGRAMS 63,843 -- 63,843 --MILITARY & VETERANS AFFAIRS PROGRAMS 31,844 -- 31,844 --OTHER PURPOSES -- 4,774 4,774 232,794PUBLIC SAFETY PROGRAMS 50,203 -- 50,203 --TRANSPORTATION & DEVELOPMENT PROGRAMS 1,113 -- 1,113 --UNEMPLOYMENT COMPENSATION -- 1,001,279 1,001,279 --WORKFORCE SUPPORT & TRAINING PROGRAMS 5,113 -- 5,113 --YOUTH PROGRAMS 854 -- 854 --
NONEXPENDABLE: CULTURE, RECREATION, & TOURISM PROGRAMS 100 -- 100 --EDUCATION PROGRAMS 2,130,715 -- 2,130,715 --ENDOWMENTS -- 4,759 4,759 807,897HEALTH & WELFARE PROGRAMS 465,497 -- 465,497 --
UNRESTRICTED (12,443,429) 535,413 (11,908,016) (5,222,133)
TOTAL NET POSITION $ 3,778,700 $ 2,046,691 $ 5,825,391 $ 395,881
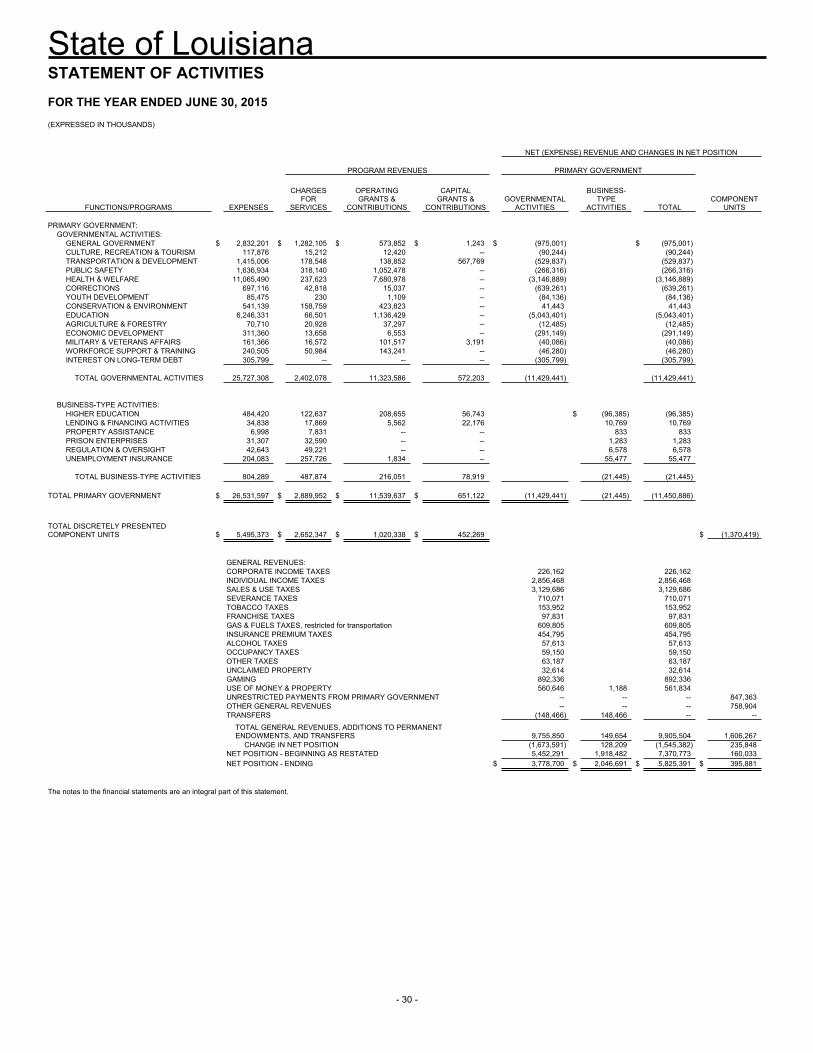
State of Louisiana
- 30 -
STATEMENT OF ACTIVITIES FOR THE YEAR ENDED JUNE 30, 2015 (EXPRESSED IN THOUSANDS) NET (EXPENSE) REVENUE AND CHANGES IN NET POSITION PROGRAM REVENUES PRIMARY GOVERNMENT
FUNCTIONS/PROGRAMS EXPENSES
CHARGES FOR
SERVICES
OPERATING GRANTS &
CONTRIBUTIONS
CAPITAL GRANTS &
CONTRIBUTIONS GOVERNMENTAL
ACTIVITIES
BUSINESS-TYPE
ACTIVITIES TOTAL COMPONENT
UNITS PRIMARY GOVERNMENT:
GOVERNMENTAL ACTIVITIES: GENERAL GOVERNMENT $ 2,832,201 $ 1,282,105 $ 573,852 $ 1,243 $ (975,001) $ (975,001) CULTURE, RECREATION & TOURISM 117,876 15,212 12,420 -- (90,244) (90,244) TRANSPORTATION & DEVELOPMENT 1,415,006 178,548 138,852 567,769 (529,837) (529,837) PUBLIC SAFETY 1,636,934 318,140 1,052,478 -- (266,316) (266,316) HEALTH & WELFARE 11,065,490 237,623 7,680,978 -- (3,146,889) (3,146,889) CORRECTIONS 697,116 42,818 15,037 -- (639,261) (639,261) YOUTH DEVELOPMENT 85,475 230 1,109 -- (84,136) (84,136) CONSERVATION & ENVIRONMENT 541,139 158,759 423,823 -- 41,443 41,443 EDUCATION 6,246,331 66,501 1,136,429 -- (5,043,401) (5,043,401) AGRICULTURE & FORESTRY 70,710 20,928 37,297 -- (12,485) (12,485) ECONOMIC DEVELOPMENT 311,360 13,658 6,553 -- (291,149) (291,149) MILITARY & VETERANS AFFAIRS 161,366 16,572 101,517 3,191 (40,086) (40,086) WORKFORCE SUPPORT & TRAINING 240,505 50,984 143,241 -- (46,280) (46,280) INTEREST ON LONG-TERM DEBT 305,799 -- -- -- (305,799) (305,799)
TOTAL GOVERNMENTAL ACTIVITIES 25,727,308 2,402,078 11,323,586 572,203 (11,429,441) (11,429,441)
BUSINESS-TYPE ACTIVITIES: HIGHER EDUCATION 484,420 122,637 208,655 56,743 $ (96,385) (96,385) LENDING & FINANCING ACTIVITIES 34,838 17,869 5,562 22,176 10,769 10,769 PROPERTY ASSISTANCE 6,998 7,831 -- -- 833 833 PRISON ENTERPRISES 31,307 32,590 -- -- 1,283 1,283 REGULATION & OVERSIGHT 42,643 49,221 -- -- 6,578 6,578 UNEMPLOYMENT INSURANCE 204,083 257,726 1,834 -- 55,477 55,477
TOTAL BUSINESS-TYPE ACTIVITIES 804,289 487,874 216,051 78,919 (21,445) (21,445)
TOTAL PRIMARY GOVERNMENT $ 26,531,597 $ 2,889,952 $ 11,539,637 $ 651,122 (11,429,441) (21,445) (11,450,886) TOTAL DISCRETELY PRESENTED COMPONENT UNITS $ 5,495,373 $ 2,652,347 $ 1,020,338 $ 452,269 $ (1,370,419) GENERAL REVENUES: CORPORATE INCOME TAXES 226,162 226,162 INDIVIDUAL INCOME TAXES 2,856,468 2,856,468 SALES & USE TAXES 3,129,686 3,129,686 SEVERANCE TAXES 710,071 710,071 TOBACCO TAXES 153,952 153,952 FRANCHISE TAXES 97,831 97,831 GAS & FUELS TAXES, restricted for transportation 609,805 609,805 INSURANCE PREMIUM TAXES 454,795 454,795 ALCOHOL TAXES 57,613 57,613 OCCUPANCY TAXES 59,150 59,150 OTHER TAXES 63,187 63,187 UNCLAIMED PROPERTY 32,614 32,614 GAMING 892,336 892,336 USE OF MONEY & PROPERTY 560,646 1,188 561,834 UNRESTRICTED PAYMENTS FROM PRIMARY GOVERNMENT -- -- -- 847,363 OTHER GENERAL REVENUES -- -- -- 758,904 TRANSFERS (148,466) 148,466 -- --
TOTAL GENERAL REVENUES, ADDITIONS TO PERMANENT ENDOWMENTS, AND TRANSFERS 9,755,850 149,654 9,905,504 1,606,267
CHANGE IN NET POSITION (1,673,591) 128,209 (1,545,382) 235,848 NET POSITION - BEGINNING AS RESTATED 5,452,291 1,918,482 7,370,773 160,033 NET POSITION - ENDING $ 3,778,700 $ 2,046,691 $ 5,825,391 $ 395,881 The notes to the financial statements are an integral part of this statement.
G O V E R N M E N T A L F U N D F I N A N C I A L S T A T E M E N T S
2014-2015 Comprehensive Annual Financial Report
GOVERNMENTAL FUND FINANCIAL STATEMENTS
Major Funds
GENERAL FUND
The General Fund, the principal operating fund of the State, was established administratively to provide for the distribution of funds appropriated by the State Legislature for the ordinary expenses of state government. Transactions related to resources that are not accounted for in other funds are accounted for in the General Fund. Revenues are provided from the direct deposit of federal grants and the transfer of state revenues from the Bond Security and Redemption Fund after debt service requirements have been met.
BOND SECURITY AND REDEMPTION FUND
This fund is used to provide for the collection of all money deposited into the State Treasury except federal funds, donations or other forms of assistance when the terms and conditions of the related agreements require otherwise.
Each fiscal year, an amount is allocated from this fund sufficient to pay all obligations secured by the full faith and credit of the state, due and payable, within the current fiscal year, including principal, interest, premiums, and sinking or reserve funds. Except as other wise provided by law, money remaining in the fund is credited to the General Fund.
LOUISIANA EDUCATION QUALITY TRUST FUND
Once requirements of the Bond Security and Redemption Fund have been met, certain funds received from the federal government attributable to mineral production or leases on the outer continental shelf are deposited by the Treasurer in this fund. The funds are held in a trustee capacity and interest earned is used for various educational purposes.
CAPITAL OUTLAY ESCROW FUND
The Capital Outlay Escrow Fund was created to provide for the capital outlay expenditures of the State as appropriated in the annual capital outlay appropriations act. The fund accounts for a large volume of ongoing and new construction, routine maintenance and repairs, as well as repairs and renovations related to the damage caused by hurricanes. The fund is financed by bond issues, federal funds, self-generated revenues, statutory dedications, and appropriations by the Louisiana Legislature.
2014-2015 Comprehensive Annual Financial Report
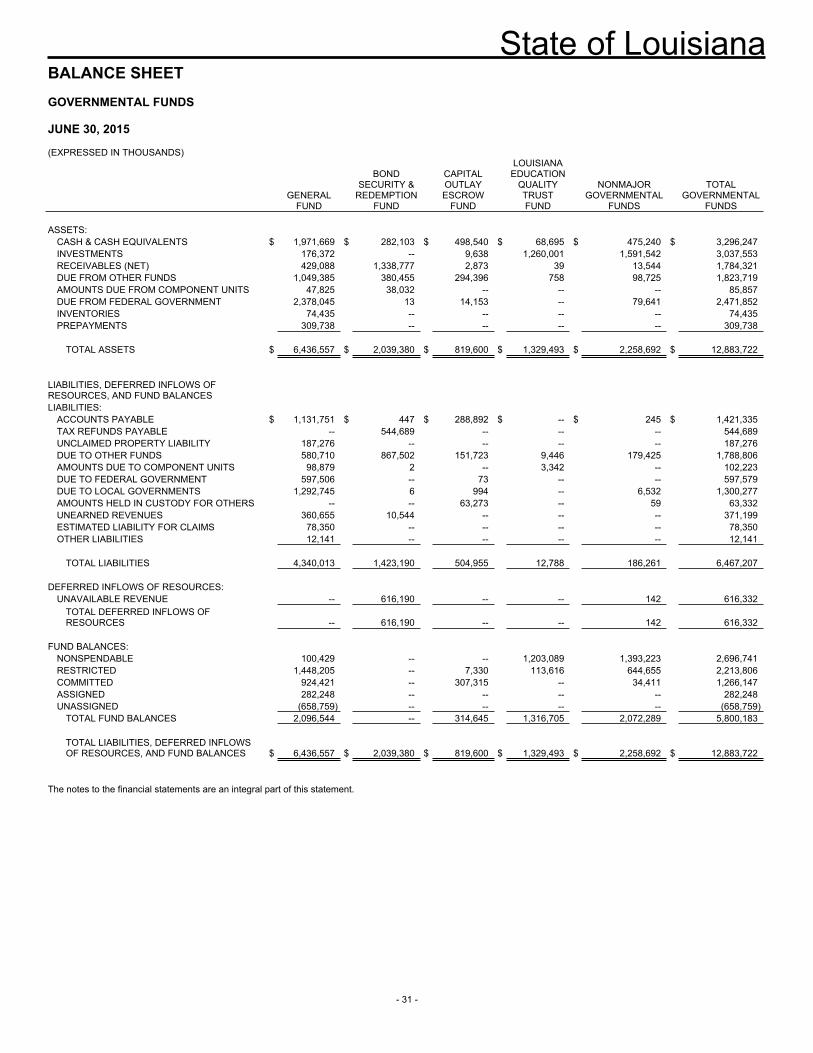
State of Louisiana
- 31 -
BALANCE SHEET GOVERNMENTAL FUNDS JUNE 30, 2015 (EXPRESSED IN THOUSANDS)
GENERAL
FUND
BOND SECURITY &
REDEMPTION FUND
CAPITAL OUTLAY ESCROW
FUND
LOUISIANA EDUCATION
QUALITY TRUST FUND
NONMAJOR GOVERNMENTAL
FUNDS
TOTAL GOVERNMENTAL
FUNDS ASSETS:
CASH & CASH EQUIVALENTS $ 1,971,669 $ 282,103 $ 498,540 $ 68,695 $ 475,240 $ 3,296,247INVESTMENTS 176,372 -- 9,638 1,260,001 1,591,542 3,037,553RECEIVABLES (NET) 429,088 1,338,777 2,873 39 13,544 1,784,321DUE FROM OTHER FUNDS 1,049,385 380,455 294,396 758 98,725 1,823,719AMOUNTS DUE FROM COMPONENT UNITS 47,825 38,032 -- -- -- 85,857DUE FROM FEDERAL GOVERNMENT 2,378,045 13 14,153 -- 79,641 2,471,852INVENTORIES 74,435 -- -- -- -- 74,435PREPAYMENTS 309,738 -- -- -- -- 309,738
TOTAL ASSETS $ 6,436,557 $ 2,039,380 $ 819,600 $ 1,329,493 $ 2,258,692 $ 12,883,722
LIABILITIES, DEFERRED INFLOWS OF RESOURCES, AND FUND BALANCES LIABILITIES:
ACCOUNTS PAYABLE $ 1,131,751 $ 447 $ 288,892 $ -- $ 245 $ 1,421,335TAX REFUNDS PAYABLE -- 544,689 -- -- -- 544,689UNCLAIMED PROPERTY LIABILITY 187,276 -- -- -- -- 187,276DUE TO OTHER FUNDS 580,710 867,502 151,723 9,446 179,425 1,788,806AMOUNTS DUE TO COMPONENT UNITS 98,879 2 -- 3,342 -- 102,223DUE TO FEDERAL GOVERNMENT 597,506 -- 73 -- -- 597,579DUE TO LOCAL GOVERNMENTS 1,292,745 6 994 -- 6,532 1,300,277AMOUNTS HELD IN CUSTODY FOR OTHERS -- -- 63,273 -- 59 63,332UNEARNED REVENUES 360,655 10,544 -- -- -- 371,199ESTIMATED LIABILITY FOR CLAIMS 78,350 -- -- -- -- 78,350OTHER LIABILITIES 12,141 -- -- -- -- 12,141
TOTAL LIABILITIES 4,340,013 1,423,190 504,955 12,788 186,261 6,467,207
DEFERRED INFLOWS OF RESOURCES:
UNAVAILABLE REVENUE -- 616,190 -- -- 142 616,332TOTAL DEFERRED INFLOWS OF RESOURCES -- 616,190 -- -- 142 616,332
FUND BALANCES:
NONSPENDABLE 100,429 -- -- 1,203,089 1,393,223 2,696,741RESTRICTED 1,448,205 -- 7,330 113,616 644,655 2,213,806COMMITTED 924,421 -- 307,315 -- 34,411 1,266,147ASSIGNED 282,248 -- -- -- -- 282,248UNASSIGNED (658,759) -- -- -- -- (658,759)
TOTAL FUND BALANCES 2,096,544 -- 314,645 1,316,705 2,072,289 5,800,183
TOTAL LIABILITIES, DEFERRED INFLOWS OF RESOURCES, AND FUND BALANCES $ 6,436,557 $ 2,039,380 $ 819,600 $ 1,329,493 $ 2,258,692 $ 12,883,722
The notes to the financial statements are an integral part of this statement.
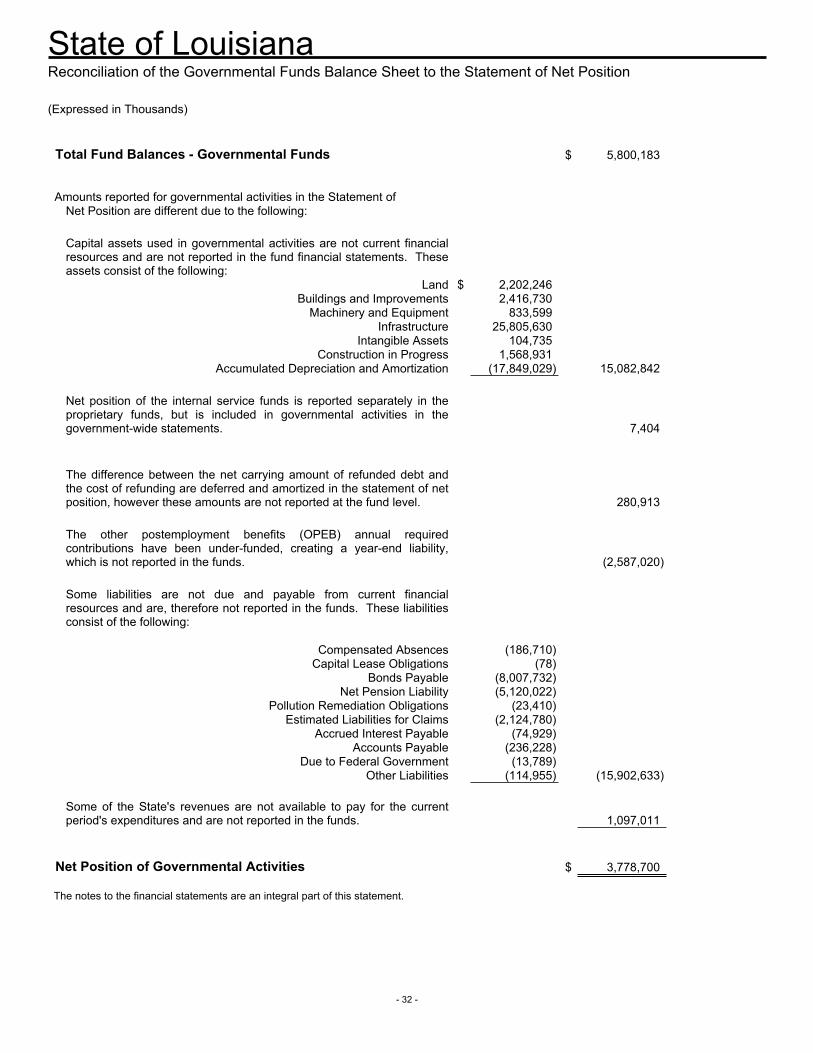
State of Louisiana
- 32 -
Reconciliation of the Governmental Funds Balance Sheet to the Statement of Net Position (Expressed in Thousands) Total Fund Balances - Governmental Funds $ 5,800,183 Amounts reported for governmental activities in the Statement of Net Position are different due to the following:
Capital assets used in governmental activities are not current financial resources and are not reported in the fund financial statements. These assets consist of the following:
Land $ 2,202,246 Buildings and Improvements 2,416,730 Machinery and Equipment 833,599 Infrastructure 25,805,630 Intangible Assets 104,735 Construction in Progress 1,568,931 Accumulated Depreciation and Amortization (17,849,029) 15,082,842
Net position of the internal service funds is reported separately in the proprietary funds, but is included in governmental activities in the government-wide statements. 7,404
The difference between the net carrying amount of refunded debt and the cost of refunding are deferred and amortized in the statement of net position, however these amounts are not reported at the fund level. 280,913
The other postemployment benefits (OPEB) annual required contributions have been under-funded, creating a year-end liability, which is not reported in the funds. (2,587,020)
Some liabilities are not due and payable from current financial resources and are, therefore not reported in the funds. These liabilities consist of the following:
Compensated Absences (186,710) Capital Lease Obligations (78) Bonds Payable (8,007,732) Net Pension Liability (5,120,022) Pollution Remediation Obligations (23,410) Estimated Liabilities for Claims (2,124,780) Accrued Interest Payable (74,929) Accounts Payable (236,228) Due to Federal Government (13,789) Other Liabilities (114,955) (15,902,633)
Some of the State's revenues are not available to pay for the current period's expenditures and are not reported in the funds. 1,097,011
Net Position of Governmental Activities $ 3,778,700 The notes to the financial statements are an integral part of this statement.
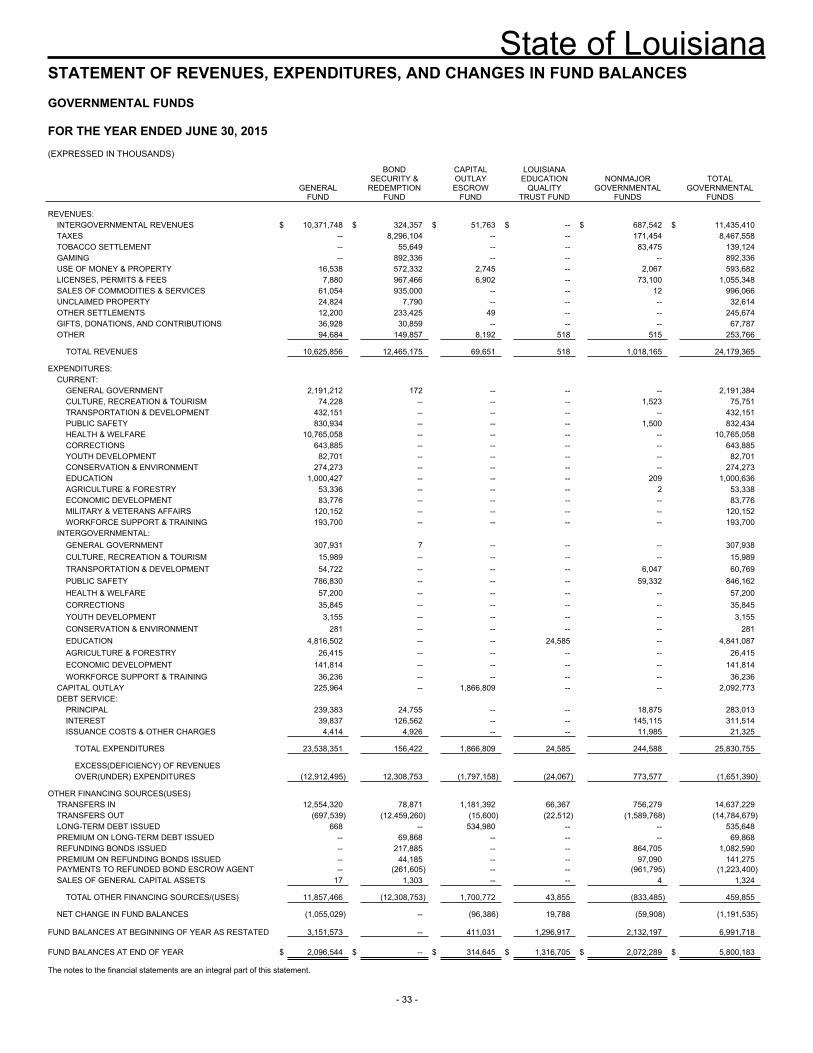
State of Louisiana
- 33 -
STATEMENT OF REVENUES, EXPENDITURES, AND CHANGES IN FUND BALANCES GOVERNMENTAL FUNDS FOR THE YEAR ENDED JUNE 30, 2015 (EXPRESSED IN THOUSANDS)
GENERAL
FUND
BOND SECURITY &
REDEMPTION FUND
CAPITAL OUTLAY ESCROW
FUND
LOUISIANA EDUCATION
QUALITY TRUST FUND
NONMAJOR GOVERNMENTAL
FUNDS
TOTAL GOVERNMENTAL
FUNDS REVENUES:
INTERGOVERNMENTAL REVENUES $ 10,371,748 $ 324,357 $ 51,763 $ -- $ 687,542 $ 11,435,410TAXES -- 8,296,104 -- -- 171,454 8,467,558TOBACCO SETTLEMENT -- 55,649 -- -- 83,475 139,124GAMING -- 892,336 -- -- -- 892,336USE OF MONEY & PROPERTY 16,538 572,332 2,745 -- 2,067 593,682LICENSES, PERMITS & FEES 7,880 967,466 6,902 -- 73,100 1,055,348SALES OF COMMODITIES & SERVICES 61,054 935,000 -- -- 12 996,066UNCLAIMED PROPERTY 24,824 7,790 -- -- -- 32,614OTHER SETTLEMENTS 12,200 233,425 49 -- -- 245,674GIFTS, DONATIONS, AND CONTRIBUTIONS 36,928 30,859 -- -- -- 67,787OTHER 94,684 149,857 8,192 518 515 253,766
TOTAL REVENUES 10,625,856 12,465,175 69,651 518 1,018,165 24,179,365
EXPENDITURES:
CURRENT: GENERAL GOVERNMENT 2,191,212 172 -- -- -- 2,191,384CULTURE, RECREATION & TOURISM 74,228 -- -- -- 1,523 75,751TRANSPORTATION & DEVELOPMENT 432,151 -- -- -- -- 432,151PUBLIC SAFETY 830,934 -- -- -- 1,500 832,434HEALTH & WELFARE 10,765,058 -- -- -- -- 10,765,058CORRECTIONS 643,885 -- -- -- -- 643,885YOUTH DEVELOPMENT 82,701 -- -- -- -- 82,701CONSERVATION & ENVIRONMENT 274,273 -- -- -- -- 274,273EDUCATION 1,000,427 -- -- -- 209 1,000,636AGRICULTURE & FORESTRY 53,336 -- -- -- 2 53,338ECONOMIC DEVELOPMENT 83,776 -- -- -- -- 83,776MILITARY & VETERANS AFFAIRS 120,152 -- -- -- -- 120,152WORKFORCE SUPPORT & TRAINING 193,700 -- -- -- -- 193,700
INTERGOVERNMENTAL: GENERAL GOVERNMENT 307,931 7 -- -- -- 307,938CULTURE, RECREATION & TOURISM 15,989 -- -- -- -- 15,989TRANSPORTATION & DEVELOPMENT 54,722 -- -- -- 6,047 60,769PUBLIC SAFETY 786,830 -- -- -- 59,332 846,162HEALTH & WELFARE 57,200 -- -- -- -- 57,200CORRECTIONS 35,845 -- -- -- -- 35,845YOUTH DEVELOPMENT 3,155 -- -- -- -- 3,155CONSERVATION & ENVIRONMENT 281 -- -- -- -- 281EDUCATION 4,816,502 -- -- 24,585 -- 4,841,087AGRICULTURE & FORESTRY 26,415 -- -- -- -- 26,415ECONOMIC DEVELOPMENT 141,814 -- -- -- -- 141,814WORKFORCE SUPPORT & TRAINING 36,236 -- -- -- -- 36,236
CAPITAL OUTLAY 225,964 -- 1,866,809 -- -- 2,092,773DEBT SERVICE:
PRINCIPAL 239,383 24,755 -- -- 18,875 283,013INTEREST 39,837 126,562 -- -- 145,115 311,514ISSUANCE COSTS & OTHER CHARGES 4,414 4,926 -- -- 11,985 21,325
TOTAL EXPENDITURES 23,538,351 156,422 1,866,809 24,585 244,588 25,830,755
EXCESS(DEFICIENCY) OF REVENUES OVER(UNDER) EXPENDITURES (12,912,495) 12,308,753 (1,797,158) (24,067) 773,577 (1,651,390)
OTHER FINANCING SOURCES(USES)
TRANSFERS IN 12,554,320 78,871 1,181,392 66,367 756,279 14,637,229TRANSFERS OUT (697,539) (12,459,260) (15,600) (22,512) (1,589,768) (14,784,679)LONG-TERM DEBT ISSUED 668 -- 534,980 -- -- 535,648PREMIUM ON LONG-TERM DEBT ISSUED -- 69,868 -- -- -- 69,868REFUNDING BONDS ISSUED -- 217,885 -- -- 864,705 1,082,590PREMIUM ON REFUNDING BONDS ISSUED -- 44,185 -- -- 97,090 141,275PAYMENTS TO REFUNDED BOND ESCROW AGENT -- (261,605) -- -- (961,795) (1,223,400)SALES OF GENERAL CAPITAL ASSETS 17 1,303 -- -- 4 1,324
TOTAL OTHER FINANCING SOURCES/(USES) 11,857,466 (12,308,753) 1,700,772 43,855 (833,485) 459,855
NET CHANGE IN FUND BALANCES (1,055,029) -- (96,386) 19,788 (59,908) (1,191,535)
FUND BALANCES AT BEGINNING OF YEAR AS RESTATED 3,151,573 -- 411,031 1,296,917 2,132,197 6,991,718 FUND BALANCES AT END OF YEAR $ 2,096,544 $ -- $ 314,645 $ 1,316,705 $ 2,072,289 $ 5,800,183 The notes to the financial statements are an integral part of this statement.
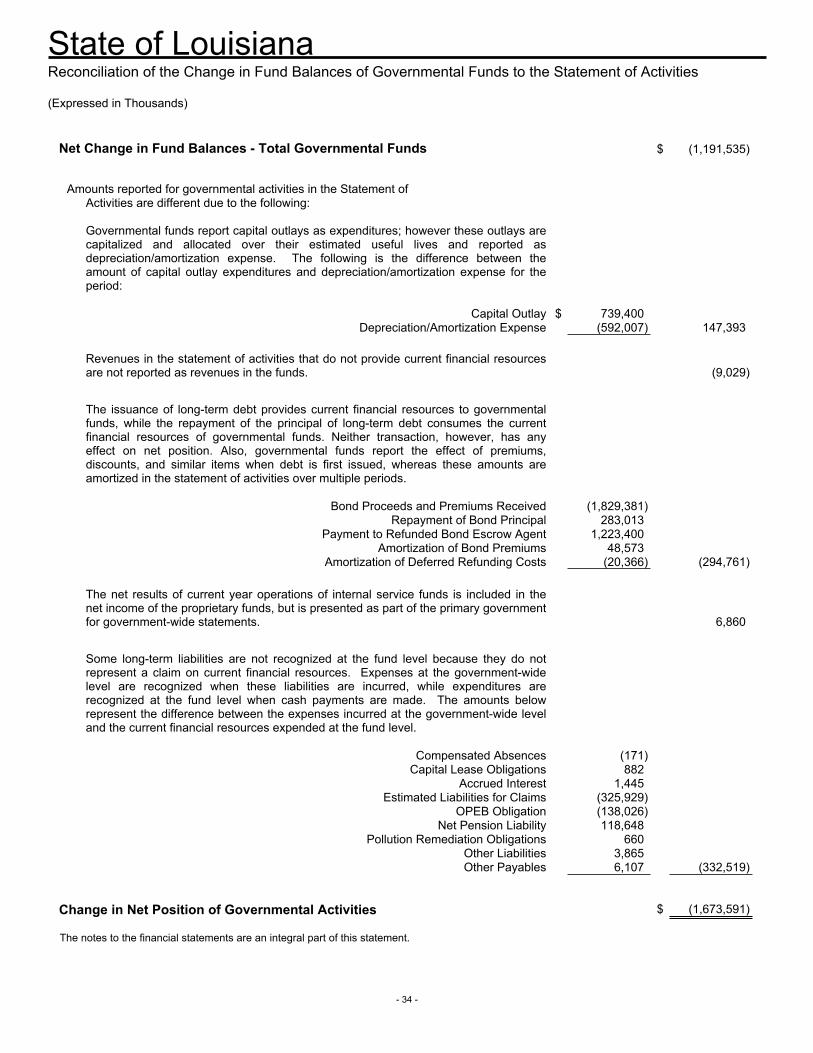
State of Louisiana
- 34 -
Reconciliation of the Change in Fund Balances of Governmental Funds to the Statement of Activities (Expressed in Thousands) Net Change in Fund Balances - Total Governmental Funds $ (1,191,535) Amounts reported for governmental activities in the Statement of Activities are different due to the following:
Governmental funds report capital outlays as expenditures; however these outlays are capitalized and allocated over their estimated useful lives and reported as depreciation/amortization expense. The following is the difference between the amount of capital outlay expenditures and depreciation/amortization expense for the period:
Capital Outlay $ 739,400 Depreciation/Amortization Expense (592,007) 147,393
Revenues in the statement of activities that do not provide current financial resources are not reported as revenues in the funds. (9,029)
The issuance of long-term debt provides current financial resources to governmental funds, while the repayment of the principal of long-term debt consumes the current financial resources of governmental funds. Neither transaction, however, has any effect on net position. Also, governmental funds report the effect of premiums, discounts, and similar items when debt is first issued, whereas these amounts are amortized in the statement of activities over multiple periods.
Bond Proceeds and Premiums Received (1,829,381) Repayment of Bond Principal 283,013 Payment to Refunded Bond Escrow Agent 1,223,400 Amortization of Bond Premiums 48,573 Amortization of Deferred Refunding Costs (20,366) (294,761)
The net results of current year operations of internal service funds is included in the net income of the proprietary funds, but is presented as part of the primary government for government-wide statements. 6,860
Some long-term liabilities are not recognized at the fund level because they do not represent a claim on current financial resources. Expenses at the government-wide level are recognized when these liabilities are incurred, while expenditures are recognized at the fund level when cash payments are made. The amounts below represent the difference between the expenses incurred at the government-wide level and the current financial resources expended at the fund level.
Compensated Absences (171) Capital Lease Obligations 882 Accrued Interest 1,445 Estimated Liabilities for Claims (325,929) OPEB Obligation (138,026) Net Pension Liability 118,648 Pollution Remediation Obligations 660 Other Liabilities 3,865 Other Payables 6,107 (332,519) Change in Net Position of Governmental Activities $ (1,673,591) The notes to the financial statements are an integral part of this statement.
P R O P R I E T A R Y F U N D F I N A N C I A L S T A T E M E N T S
2014-2015 Comprehensive Annual Financial Report
PROPRIETARY FUND FINANCIAL STATEMENTS
Major Funds
UNEMPLOYMENT TRUST FUND
The Unemployment Trust Fund accounts for the unemployment insurance contributions from employers and for the payment of unemployment benefits to eligible claimants.
LOUISIANA COMMUNITY AND TECHNICAL COLLEGE SYSTEM
The Louisiana Community and Technical College System provide strategic management and support for seven community colleges, four technical community colleges, and two technical colleges. LCTCS has forty-nine campuses. The colleges award associates degrees, technical diplomas, and industry-based certificates in programs that are aligned with business and industry and local economies.
2014-2015 Comprehensive Annual Financial Report
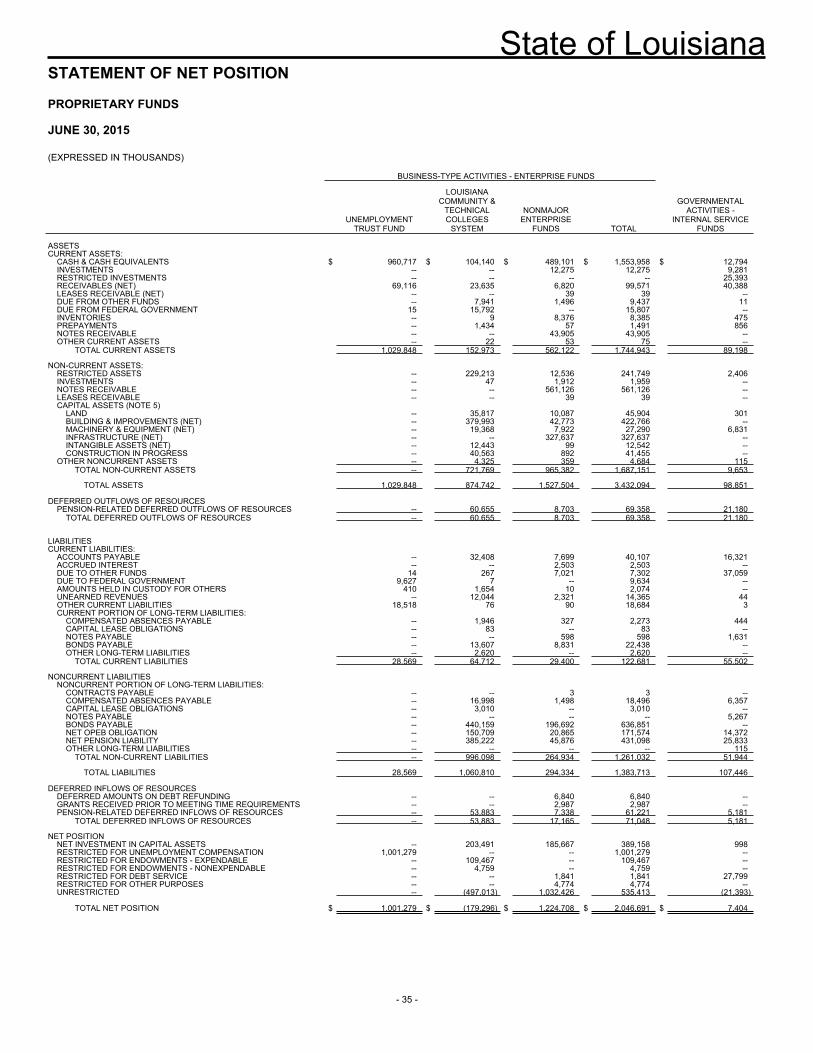
State of Louisiana
- 35 -
STATEMENT OF NET POSITION
PROPRIETARY FUNDS
JUNE 30, 2015
(EXPRESSED IN THOUSANDS) BUSINESS-TYPE ACTIVITIES - ENTERPRISE FUNDS
UNEMPLOYMENT
TRUST FUND
LOUISIANA COMMUNITY &
TECHNICAL COLLEGES
SYSTEM
NONMAJOR ENTERPRISE
FUNDS TOTAL
GOVERNMENTAL ACTIVITIES -
INTERNAL SERVICE FUNDS
ASSETS CURRENT ASSETS:
CASH & CASH EQUIVALENTS $ 960,717 $ 104,140 $ 489,101 $ 1,553,958 $ 12,794INVESTMENTS -- -- 12,275 12,275 9,281RESTRICTED INVESTMENTS -- -- -- -- 25,393RECEIVABLES (NET) 69,116 23,635 6,820 99,571 40,388LEASES RECEIVABLE (NET) -- -- 39 39 --DUE FROM OTHER FUNDS -- 7,941 1,496 9,437 11DUE FROM FEDERAL GOVERNMENT 15 15,792 -- 15,807 --INVENTORIES -- 9 8,376 8,385 475PREPAYMENTS -- 1,434 57 1,491 856NOTES RECEIVABLE -- -- 43,905 43,905 --OTHER CURRENT ASSETS -- 22 53 75 --
TOTAL CURRENT ASSETS 1,029,848 152,973 562,122 1,744,943 89,198 NON-CURRENT ASSETS:
RESTRICTED ASSETS -- 229,213 12,536 241,749 2,406INVESTMENTS -- 47 1,912 1,959 --NOTES RECEIVABLE -- -- 561,126 561,126 --LEASES RECEIVABLE -- -- 39 39 --CAPITAL ASSETS (NOTE 5)
LAND -- 35,817 10,087 45,904 301BUILDING & IMPROVEMENTS (NET) -- 379,993 42,773 422,766 --MACHINERY & EQUIPMENT (NET) -- 19,368 7,922 27,290 6,831INFRASTRUCTURE (NET) -- -- 327,637 327,637 --INTANGIBLE ASSETS (NET) -- 12,443 99 12,542 --CONSTRUCTION IN PROGRESS -- 40,563 892 41,455 --
OTHER NONCURRENT ASSETS -- 4,325 359 4,684 115TOTAL NON-CURRENT ASSETS -- 721,769 965,382 1,687,151 9,653
TOTAL ASSETS 1,029,848 874,742 1,527,504 3,432,094 98,851
DEFERRED OUTFLOWS OF RESOURCES
PENSION-RELATED DEFERRED OUTFLOWS OF RESOURCES -- 60,655 8,703 69,358 21,180TOTAL DEFERRED OUTFLOWS OF RESOURCES -- 60,655 8,703 69,358 21,180
LIABILITIES CURRENT LIABILITIES:
ACCOUNTS PAYABLE -- 32,408 7,699 40,107 16,321ACCRUED INTEREST -- -- 2,503 2,503 --DUE TO OTHER FUNDS 14 267 7,021 7,302 37,059DUE TO FEDERAL GOVERNMENT 9,627 7 -- 9,634 --AMOUNTS HELD IN CUSTODY FOR OTHERS 410 1,654 10 2,074 --UNEARNED REVENUES -- 12,044 2,321 14,365 44OTHER CURRENT LIABILITIES 18,518 76 90 18,684 3CURRENT PORTION OF LONG-TERM LIABILITIES:
COMPENSATED ABSENCES PAYABLE -- 1,946 327 2,273 444CAPITAL LEASE OBLIGATIONS -- 83 -- 83 --NOTES PAYABLE -- -- 598 598 1,631BONDS PAYABLE -- 13,607 8,831 22,438 --OTHER LONG-TERM LIABILITIES -- 2,620 -- 2,620 --
TOTAL CURRENT LIABILITIES 28,569 64,712 29,400 122,681 55,502
NONCURRENT LIABILITIES NONCURRENT PORTION OF LONG-TERM LIABILITIES:
CONTRACTS PAYABLE -- -- 3 3 --COMPENSATED ABSENCES PAYABLE -- 16,998 1,498 18,496 6,357CAPITAL LEASE OBLIGATIONS -- 3,010 -- 3,010 --NOTES PAYABLE -- -- -- -- 5,267BONDS PAYABLE -- 440,159 196,692 636,851 --NET OPEB OBLIGATION -- 150,709 20,865 171,574 14,372NET PENSION LIABILITY -- 385,222 45,876 431,098 25,833OTHER LONG-TERM LIABILITIES -- -- -- -- 115
TOTAL NON-CURRENT LIABILITIES -- 996,098 264,934 1,261,032 51,944 TOTAL LIABILITIES 28,569 1,060,810 294,334 1,383,713 107,446
DEFERRED INFLOWS OF RESOURCES
DEFERRED AMOUNTS ON DEBT REFUNDING -- -- 6,840 6,840 --GRANTS RECEIVED PRIOR TO MEETING TIME REQUIREMENTS -- -- 2,987 2,987 --PENSION-RELATED DEFERRED INFLOWS OF RESOURCES -- 53,883 7,338 61,221 5,181
TOTAL DEFERRED INFLOWS OF RESOURCES -- 53,883 17,165 71,048 5,181 NET POSITION
NET INVESTMENT IN CAPITAL ASSETS -- 203,491 185,667 389,158 998RESTRICTED FOR UNEMPLOYMENT COMPENSATION 1,001,279 -- -- 1,001,279 --RESTRICTED FOR ENDOWMENTS - EXPENDABLE -- 109,467 -- 109,467 --RESTRICTED FOR ENDOWMENTS - NONEXPENDABLE -- 4,759 -- 4,759 --RESTRICTED FOR DEBT SERVICE -- -- 1,841 1,841 27,799RESTRICTED FOR OTHER PURPOSES -- -- 4,774 4,774 --UNRESTRICTED -- (497,013) 1,032,426 535,413 (21,393)
TOTAL NET POSITION $ 1,001,279 $ (179,296) $ 1,224,708 $ 2,046,691 $ 7,404
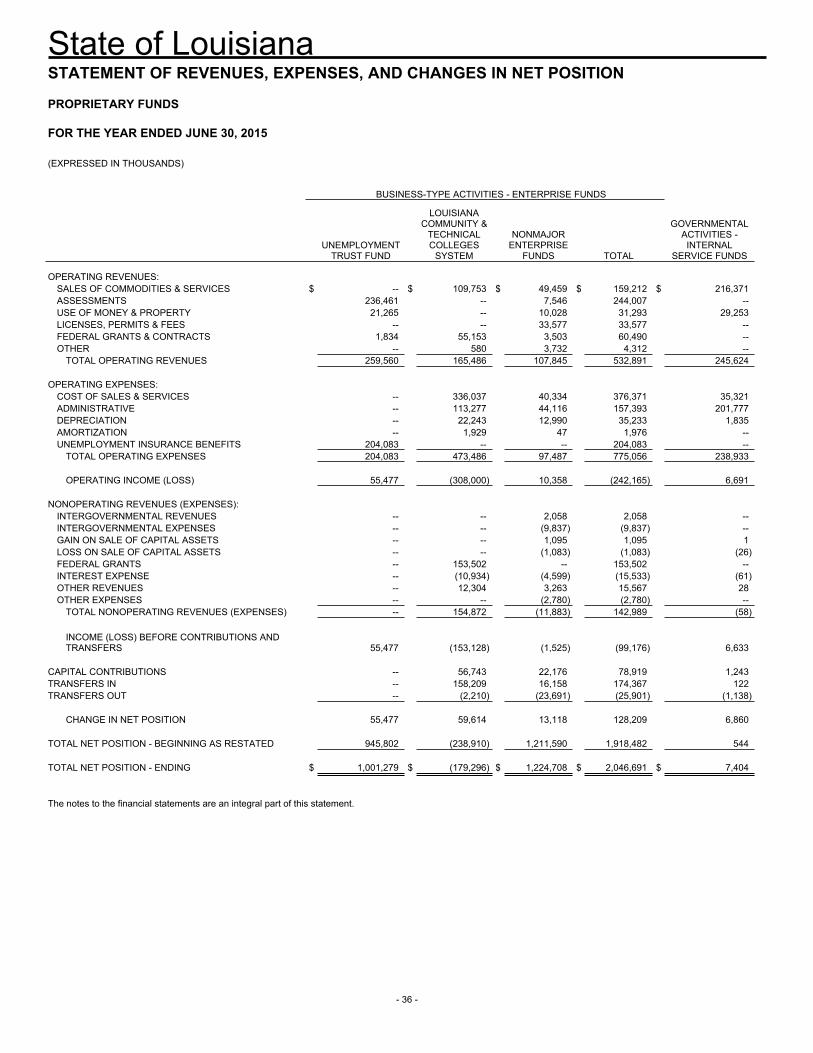
State of Louisiana
- 36 -
STATEMENT OF REVENUES, EXPENSES, AND CHANGES IN NET POSITION
PROPRIETARY FUNDS
FOR THE YEAR ENDED JUNE 30, 2015
(EXPRESSED IN THOUSANDS) BUSINESS-TYPE ACTIVITIES - ENTERPRISE FUNDS
UNEMPLOYMENT
TRUST FUND
LOUISIANA COMMUNITY &
TECHNICAL COLLEGES
SYSTEM
NONMAJOR ENTERPRISE
FUNDS TOTAL
GOVERNMENTAL ACTIVITIES -
INTERNAL SERVICE FUNDS
OPERATING REVENUES: SALES OF COMMODITIES & SERVICES $ -- $ 109,753 $ 49,459 $ 159,212 $ 216,371ASSESSMENTS 236,461 -- 7,546 244,007 --USE OF MONEY & PROPERTY 21,265 -- 10,028 31,293 29,253LICENSES, PERMITS & FEES -- -- 33,577 33,577 --FEDERAL GRANTS & CONTRACTS 1,834 55,153 3,503 60,490 --OTHER -- 580 3,732 4,312 --
TOTAL OPERATING REVENUES 259,560 165,486 107,845 532,891 245,624 OPERATING EXPENSES:
COST OF SALES & SERVICES -- 336,037 40,334 376,371 35,321ADMINISTRATIVE -- 113,277 44,116 157,393 201,777DEPRECIATION -- 22,243 12,990 35,233 1,835AMORTIZATION -- 1,929 47 1,976 --UNEMPLOYMENT INSURANCE BENEFITS 204,083 -- -- 204,083 --
TOTAL OPERATING EXPENSES 204,083 473,486 97,487 775,056 238,933
OPERATING INCOME (LOSS) 55,477 (308,000) 10,358 (242,165) 6,691 NONOPERATING REVENUES (EXPENSES):
INTERGOVERNMENTAL REVENUES -- -- 2,058 2,058 --INTERGOVERNMENTAL EXPENSES -- -- (9,837) (9,837) --GAIN ON SALE OF CAPITAL ASSETS -- -- 1,095 1,095 1LOSS ON SALE OF CAPITAL ASSETS -- -- (1,083) (1,083) (26)FEDERAL GRANTS -- 153,502 -- 153,502 --INTEREST EXPENSE -- (10,934) (4,599) (15,533) (61)OTHER REVENUES -- 12,304 3,263 15,567 28OTHER EXPENSES -- -- (2,780) (2,780) --
TOTAL NONOPERATING REVENUES (EXPENSES) -- 154,872 (11,883) 142,989 (58)
INCOME (LOSS) BEFORE CONTRIBUTIONS AND TRANSFERS 55,477 (153,128) (1,525) (99,176) 6,633
CAPITAL CONTRIBUTIONS -- 56,743 22,176 78,919 1,243TRANSFERS IN -- 158,209 16,158 174,367 122TRANSFERS OUT -- (2,210) (23,691) (25,901) (1,138)
CHANGE IN NET POSITION 55,477 59,614 13,118 128,209 6,860 TOTAL NET POSITION - BEGINNING AS RESTATED 945,802 (238,910) 1,211,590 1,918,482 544 TOTAL NET POSITION - ENDING $ 1,001,279 $ (179,296) $ 1,224,708 $ 2,046,691 $ 7,404 The notes to the financial statements are an integral part of this statement.
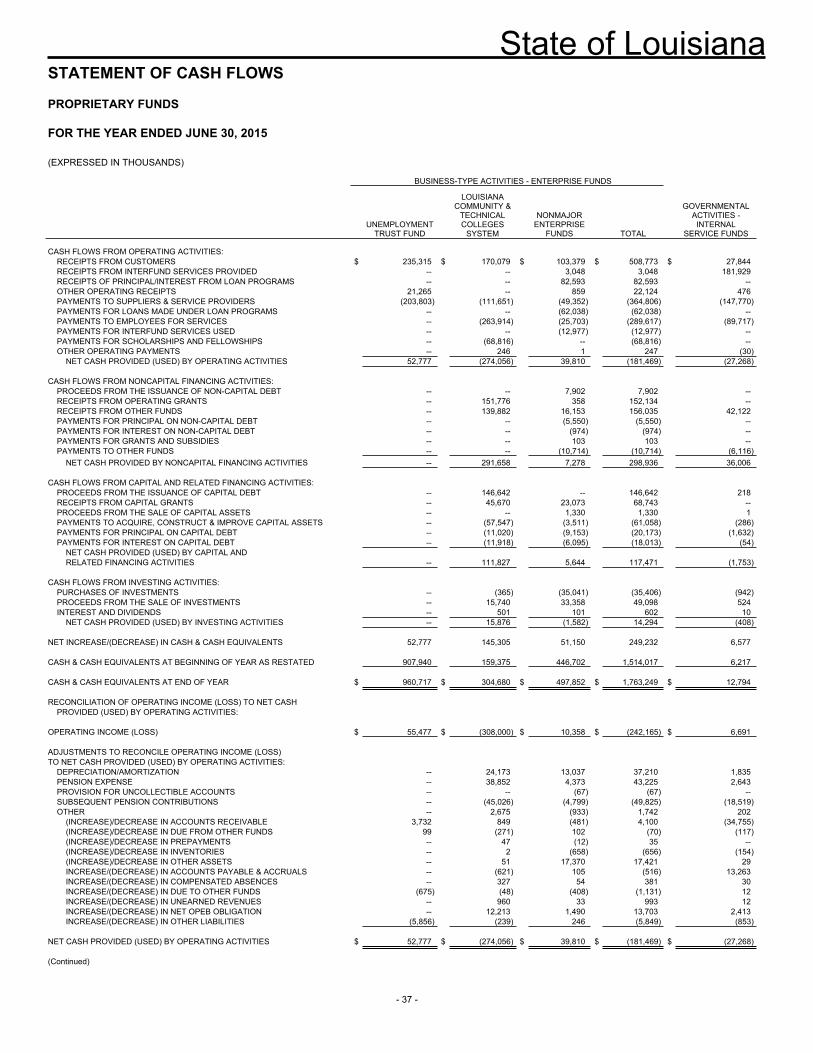
State of Louisiana
- 37 -
STATEMENT OF CASH FLOWS
PROPRIETARY FUNDS
FOR THE YEAR ENDED JUNE 30, 2015
(EXPRESSED IN THOUSANDS) BUSINESS-TYPE ACTIVITIES - ENTERPRISE FUNDS
UNEMPLOYMENT
TRUST FUND
LOUISIANA COMMUNITY &
TECHNICAL COLLEGES
SYSTEM
NONMAJOR ENTERPRISE
FUNDS TOTAL
GOVERNMENTAL ACTIVITIES -
INTERNAL SERVICE FUNDS
CASH FLOWS FROM OPERATING ACTIVITIES: RECEIPTS FROM CUSTOMERS $ 235,315 $ 170,079 $ 103,379 $ 508,773 $ 27,844RECEIPTS FROM INTERFUND SERVICES PROVIDED -- -- 3,048 3,048 181,929RECEIPTS OF PRINCIPAL/INTEREST FROM LOAN PROGRAMS -- -- 82,593 82,593 --OTHER OPERATING RECEIPTS 21,265 -- 859 22,124 476PAYMENTS TO SUPPLIERS & SERVICE PROVIDERS (203,803) (111,651) (49,352) (364,806) (147,770)PAYMENTS FOR LOANS MADE UNDER LOAN PROGRAMS -- -- (62,038) (62,038) --PAYMENTS TO EMPLOYEES FOR SERVICES -- (263,914) (25,703) (289,617) (89,717)PAYMENTS FOR INTERFUND SERVICES USED -- -- (12,977) (12,977) --PAYMENTS FOR SCHOLARSHIPS AND FELLOWSHIPS -- (68,816) -- (68,816) --OTHER OPERATING PAYMENTS -- 246 1 247 (30)
NET CASH PROVIDED (USED) BY OPERATING ACTIVITIES 52,777 (274,056) 39,810 (181,469) (27,268) CASH FLOWS FROM NONCAPITAL FINANCING ACTIVITIES:
PROCEEDS FROM THE ISSUANCE OF NON-CAPITAL DEBT -- -- 7,902 7,902 --RECEIPTS FROM OPERATING GRANTS -- 151,776 358 152,134 --RECEIPTS FROM OTHER FUNDS -- 139,882 16,153 156,035 42,122PAYMENTS FOR PRINCIPAL ON NON-CAPITAL DEBT -- -- (5,550) (5,550) --PAYMENTS FOR INTEREST ON NON-CAPITAL DEBT -- -- (974) (974) --PAYMENTS FOR GRANTS AND SUBSIDIES -- -- 103 103 --PAYMENTS TO OTHER FUNDS -- -- (10,714) (10,714) (6,116)
NET CASH PROVIDED BY NONCAPITAL FINANCING ACTIVITIES -- 291,658 7,278 298,936 36,006 CASH FLOWS FROM CAPITAL AND RELATED FINANCING ACTIVITIES:
PROCEEDS FROM THE ISSUANCE OF CAPITAL DEBT -- 146,642 -- 146,642 218RECEIPTS FROM CAPITAL GRANTS -- 45,670 23,073 68,743 --PROCEEDS FROM THE SALE OF CAPITAL ASSETS -- -- 1,330 1,330 1PAYMENTS TO ACQUIRE, CONSTRUCT & IMPROVE CAPITAL ASSETS -- (57,547) (3,511) (61,058) (286)PAYMENTS FOR PRINCIPAL ON CAPITAL DEBT -- (11,020) (9,153) (20,173) (1,632)PAYMENTS FOR INTEREST ON CAPITAL DEBT -- (11,918) (6,095) (18,013) (54)
NET CASH PROVIDED (USED) BY CAPITAL AND RELATED FINANCING ACTIVITIES -- 111,827 5,644 117,471 (1,753)
CASH FLOWS FROM INVESTING ACTIVITIES:
PURCHASES OF INVESTMENTS -- (365) (35,041) (35,406) (942)PROCEEDS FROM THE SALE OF INVESTMENTS -- 15,740 33,358 49,098 524INTEREST AND DIVIDENDS -- 501 101 602 10
NET CASH PROVIDED (USED) BY INVESTING ACTIVITIES -- 15,876 (1,582) 14,294 (408) NET INCREASE/(DECREASE) IN CASH & CASH EQUIVALENTS 52,777 145,305 51,150 249,232 6,577 CASH & CASH EQUIVALENTS AT BEGINNING OF YEAR AS RESTATED 907,940 159,375 446,702 1,514,017 6,217 CASH & CASH EQUIVALENTS AT END OF YEAR $ 960,717 $ 304,680 $ 497,852 $ 1,763,249 $ 12,794 RECONCILIATION OF OPERATING INCOME (LOSS) TO NET CASH
PROVIDED (USED) BY OPERATING ACTIVITIES: OPERATING INCOME (LOSS) $ 55,477 $ (308,000) $ 10,358 $ (242,165) $ 6,691 ADJUSTMENTS TO RECONCILE OPERATING INCOME (LOSS) TO NET CASH PROVIDED (USED) BY OPERATING ACTIVITIES:
DEPRECIATION/AMORTIZATION -- 24,173 13,037 37,210 1,835PENSION EXPENSE -- 38,852 4,373 43,225 2,643PROVISION FOR UNCOLLECTIBLE ACCOUNTS -- -- (67) (67) --SUBSEQUENT PENSION CONTRIBUTIONS -- (45,026) (4,799) (49,825) (18,519)OTHER -- 2,675 (933) 1,742 202
(INCREASE)/DECREASE IN ACCOUNTS RECEIVABLE 3,732 849 (481) 4,100 (34,755)(INCREASE)/DECREASE IN DUE FROM OTHER FUNDS 99 (271) 102 (70) (117)(INCREASE)/DECREASE IN PREPAYMENTS -- 47 (12) 35 --(INCREASE)/DECREASE IN INVENTORIES -- 2 (658) (656) (154)(INCREASE)/DECREASE IN OTHER ASSETS -- 51 17,370 17,421 29INCREASE/(DECREASE) IN ACCOUNTS PAYABLE & ACCRUALS -- (621) 105 (516) 13,263INCREASE/(DECREASE) IN COMPENSATED ABSENCES -- 327 54 381 30INCREASE/(DECREASE) IN DUE TO OTHER FUNDS (675) (48) (408) (1,131) 12INCREASE/(DECREASE) IN UNEARNED REVENUES -- 960 33 993 12INCREASE/(DECREASE) IN NET OPEB OBLIGATION -- 12,213 1,490 13,703 2,413INCREASE/(DECREASE) IN OTHER LIABILITIES (5,856) (239) 246 (5,849) (853)
NET CASH PROVIDED (USED) BY OPERATING ACTIVITIES $ 52,777 $ (274,056) $ 39,810 $ (181,469) $ (27,268) (Continued)
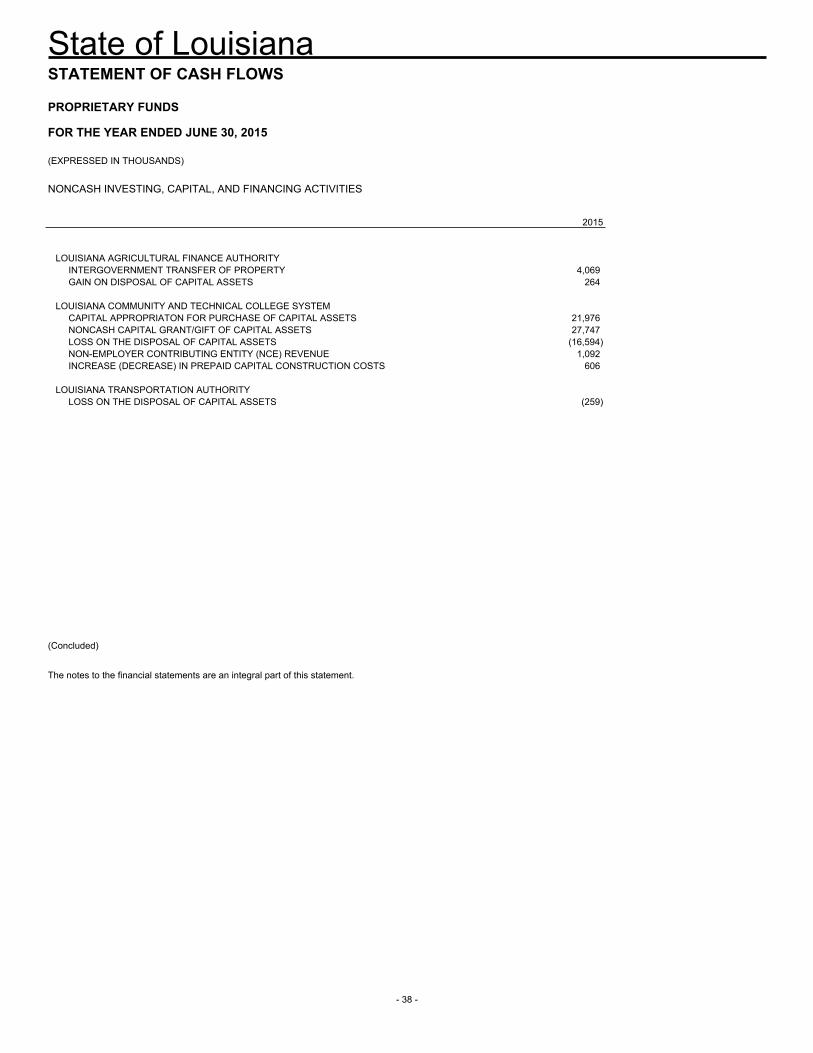
State of Louisiana
- 38 -
STATEMENT OF CASH FLOWS
PROPRIETARY FUNDS
FOR THE YEAR ENDED JUNE 30, 2015
(EXPRESSED IN THOUSANDS)
NONCASH INVESTING, CAPITAL, AND FINANCING ACTIVITIES
2015
LOUISIANA AGRICULTURAL FINANCE AUTHORITY INTERGOVERNMENT TRANSFER OF PROPERTY 4,069 GAIN ON DISPOSAL OF CAPITAL ASSETS 264
LOUISIANA COMMUNITY AND TECHNICAL COLLEGE SYSTEM CAPITAL APPROPRIATON FOR PURCHASE OF CAPITAL ASSETS 21,976 NONCASH CAPITAL GRANT/GIFT OF CAPITAL ASSETS 27,747 LOSS ON THE DISPOSAL OF CAPITAL ASSETS (16,594) NON-EMPLOYER CONTRIBUTING ENTITY (NCE) REVENUE 1,092 INCREASE (DECREASE) IN PREPAID CAPITAL CONSTRUCTION COSTS 606
LOUISIANA TRANSPORTATION AUTHORITY LOSS ON THE DISPOSAL OF CAPITAL ASSETS (259)
(Concluded)
The notes to the financial statements are an integral part of this statement.
F I D U C I A R Y F U N DF I N A N C I A L S T A T E M E N T S
2014-2015 Comprehensive Annual Financial Report
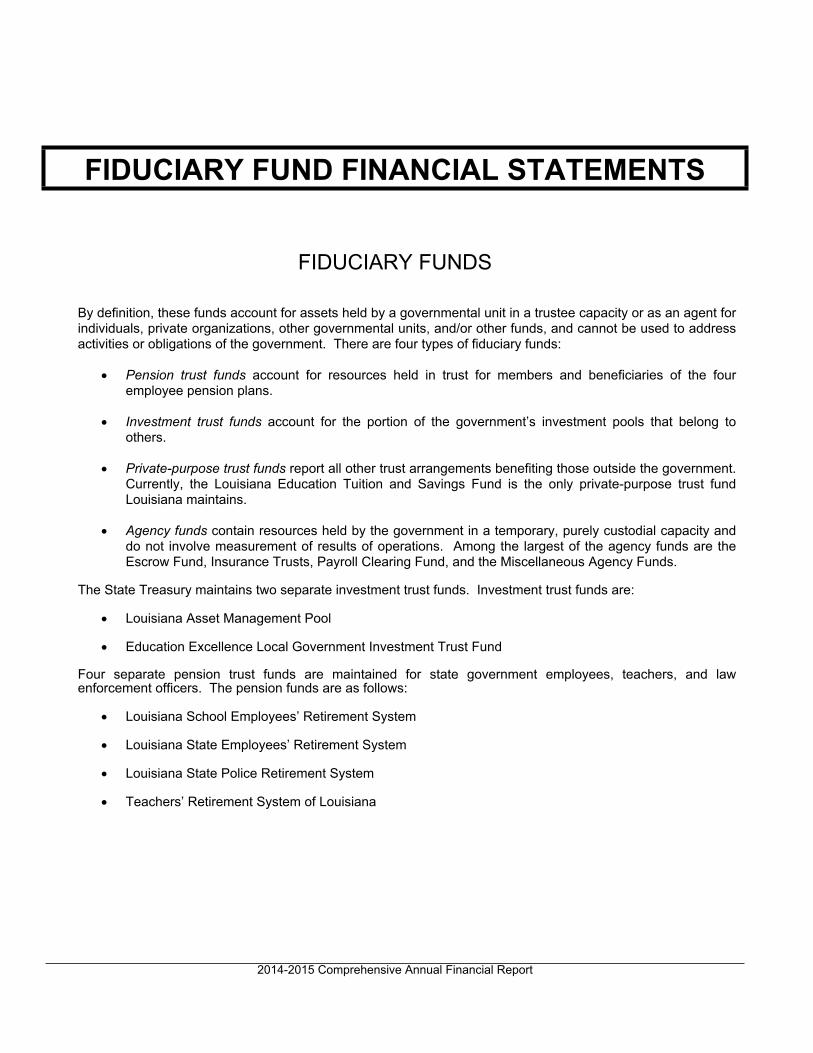
FIDUCIARY FUND FINANCIAL STATEMENTS
FIDUCIARY FUNDS
By definition, these funds account for assets held by a governmental unit in a trustee capacity or as an agent for individuals, private organizations, other governmental units, and/or other funds, and cannot be used to address activities or obligations of the government. There are four types of fiduciary funds:
Pension trust funds account for resources held in trust for members and beneficiaries of the four employee pension plans.
Investment trust funds account for the portion of the government’s investment pools that belong to others.
Private-purpose trust funds report all other trust arrangements benefiting those outside the government. Currently, the Louisiana Education Tuition and Savings Fund is the only private-purpose trust fund Louisiana maintains.
Agency funds contain resources held by the government in a temporary, purely custodial capacity and do not involve measurement of results of operations. Among the largest of the agency funds are the Escrow Fund, Insurance Trusts, Payroll Clearing Fund, and the Miscellaneous Agency Funds.
The State Treasury maintains two separate investment trust funds. Investment trust funds are:
Louisiana Asset Management Pool
Education Excellence Local Government Investment Trust Fund
Four separate pension trust funds are maintained for state government employees, teachers, and law enforcement officers. The pension funds are as follows:
Louisiana School Employees’ Retirement System
Louisiana State Employees’ Retirement System
Louisiana State Police Retirement System
Teachers’ Retirement System of Louisiana
2014-2015 Comprehensive Annual Financial Report
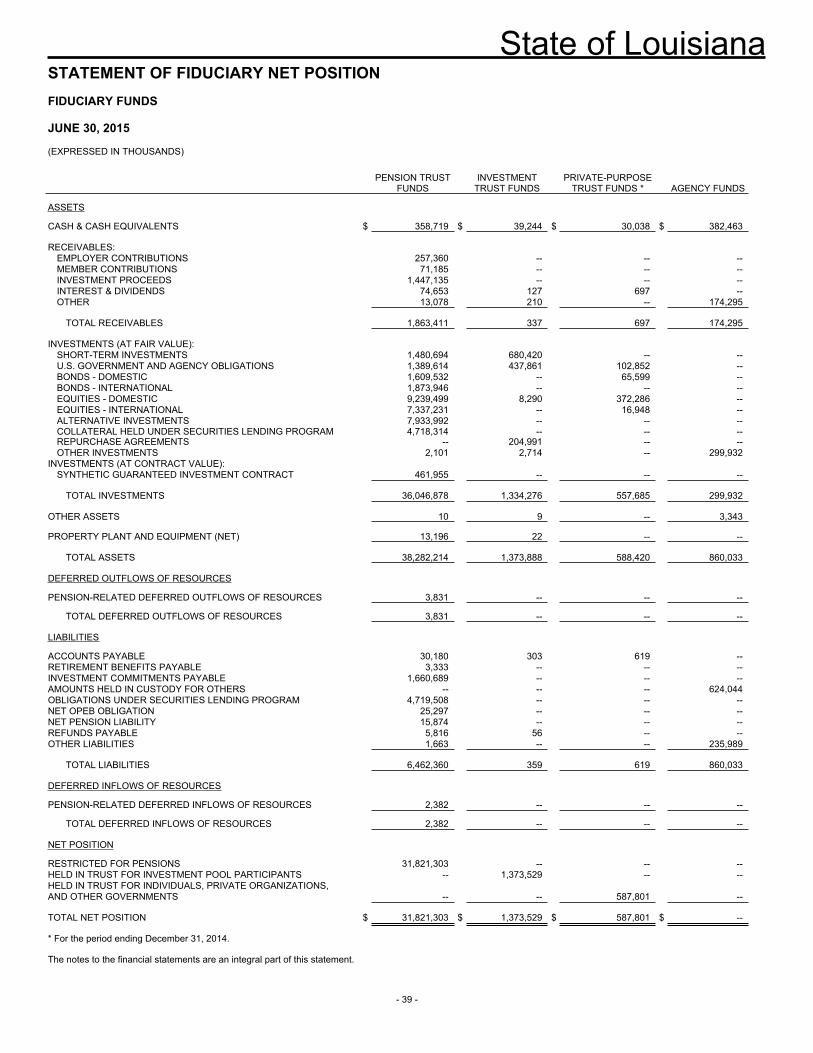
State of Louisiana
- 39 -
STATEMENT OF FIDUCIARY NET POSITION FIDUCIARY FUNDS JUNE 30, 2015 (EXPRESSED IN THOUSANDS)
PENSION TRUST
FUNDS INVESTMENT
TRUST FUNDS PRIVATE-PURPOSE
TRUST FUNDS * AGENCY FUNDS ASSETS CASH & CASH EQUIVALENTS $ 358,719 $ 39,244 $ 30,038 $ 382,463 RECEIVABLES:
EMPLOYER CONTRIBUTIONS 257,360 -- -- --MEMBER CONTRIBUTIONS 71,185 -- -- --INVESTMENT PROCEEDS 1,447,135 -- -- --INTEREST & DIVIDENDS 74,653 127 697 --OTHER 13,078 210 -- 174,295
TOTAL RECEIVABLES 1,863,411 337 697 174,295
INVESTMENTS (AT FAIR VALUE):
SHORT-TERM INVESTMENTS 1,480,694 680,420 -- --U.S. GOVERNMENT AND AGENCY OBLIGATIONS 1,389,614 437,861 102,852 --BONDS - DOMESTIC 1,609,532 -- 65,599 --BONDS - INTERNATIONAL 1,873,946 -- -- --EQUITIES - DOMESTIC 9,239,499 8,290 372,286 --EQUITIES - INTERNATIONAL 7,337,231 -- 16,948 --ALTERNATIVE INVESTMENTS 7,933,992 -- -- --COLLATERAL HELD UNDER SECURITIES LENDING PROGRAM 4,718,314 -- -- --REPURCHASE AGREEMENTS -- 204,991 -- --OTHER INVESTMENTS 2,101 2,714 -- 299,932
INVESTMENTS (AT CONTRACT VALUE): SYNTHETIC GUARANTEED INVESTMENT CONTRACT 461,955 -- -- --
TOTAL INVESTMENTS 36,046,878 1,334,276 557,685 299,932
OTHER ASSETS 10 9 -- 3,343 PROPERTY PLANT AND EQUIPMENT (NET) 13,196 22 -- --
TOTAL ASSETS 38,282,214 1,373,888 588,420 860,033 DEFERRED OUTFLOWS OF RESOURCES PENSION-RELATED DEFERRED OUTFLOWS OF RESOURCES 3,831 -- -- --
TOTAL DEFERRED OUTFLOWS OF RESOURCES 3,831 -- -- -- LIABILITIES ACCOUNTS PAYABLE 30,180 303 619 --RETIREMENT BENEFITS PAYABLE 3,333 -- -- --INVESTMENT COMMITMENTS PAYABLE 1,660,689 -- -- --AMOUNTS HELD IN CUSTODY FOR OTHERS -- -- -- 624,044OBLIGATIONS UNDER SECURITIES LENDING PROGRAM 4,719,508 -- -- --NET OPEB OBLIGATION 25,297 -- -- --NET PENSION LIABILITY 15,874 -- -- --REFUNDS PAYABLE 5,816 56 -- --OTHER LIABILITIES 1,663 -- -- 235,989
TOTAL LIABILITIES 6,462,360 359 619 860,033 DEFERRED INFLOWS OF RESOURCES PENSION-RELATED DEFERRED INFLOWS OF RESOURCES 2,382 -- -- --
TOTAL DEFERRED INFLOWS OF RESOURCES 2,382 -- -- -- NET POSITION RESTRICTED FOR PENSIONS 31,821,303 -- -- --HELD IN TRUST FOR INVESTMENT POOL PARTICIPANTS -- 1,373,529 -- --HELD IN TRUST FOR INDIVIDUALS, PRIVATE ORGANIZATIONS, AND OTHER GOVERNMENTS -- -- 587,801 -- TOTAL NET POSITION $ 31,821,303 $ 1,373,529 $ 587,801 $ -- * For the period ending December 31, 2014. The notes to the financial statements are an integral part of this statement.
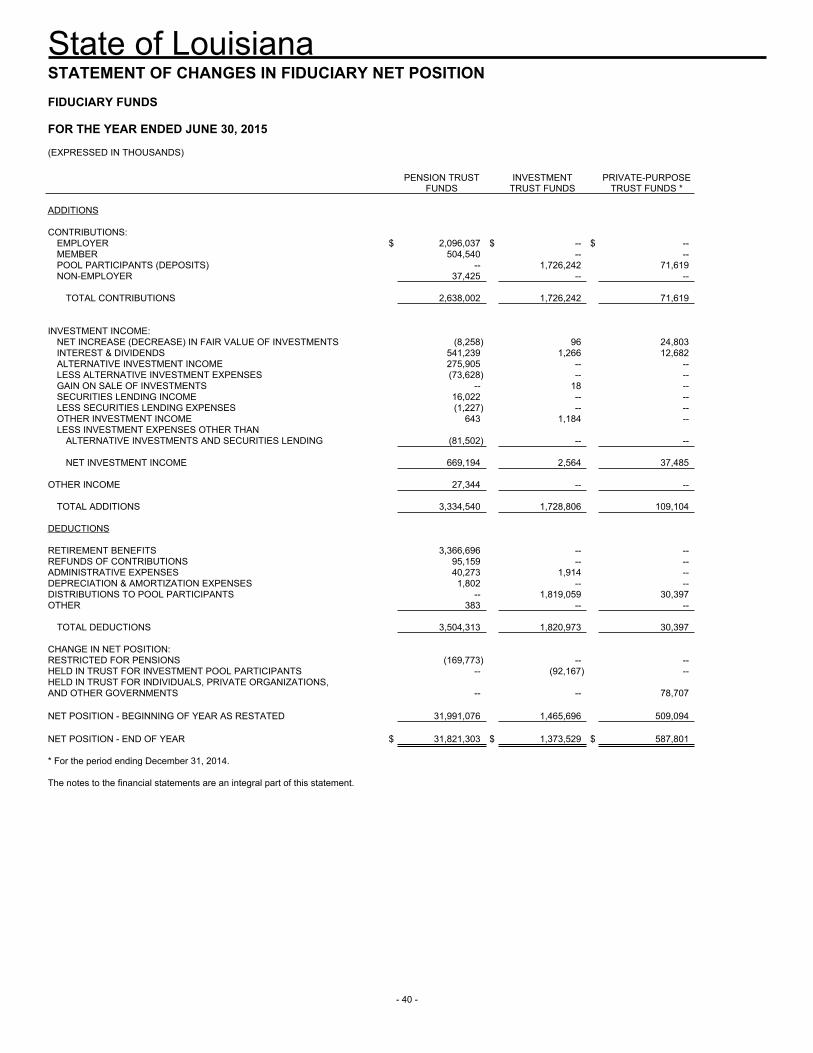
State of Louisiana
- 40 -
STATEMENT OF CHANGES IN FIDUCIARY NET POSITION FIDUCIARY FUNDS FOR THE YEAR ENDED JUNE 30, 2015 (EXPRESSED IN THOUSANDS)
PENSION TRUST
FUNDS INVESTMENT
TRUST FUNDS PRIVATE-PURPOSE
TRUST FUNDS * ADDITIONS CONTRIBUTIONS:
EMPLOYER $ 2,096,037 $ -- $ --MEMBER 504,540 -- --POOL PARTICIPANTS (DEPOSITS) -- 1,726,242 71,619NON-EMPLOYER 37,425 -- --
TOTAL CONTRIBUTIONS 2,638,002 1,726,242 71,619
INVESTMENT INCOME: NET INCREASE (DECREASE) IN FAIR VALUE OF INVESTMENTS (8,258) 96 24,803INTEREST & DIVIDENDS 541,239 1,266 12,682ALTERNATIVE INVESTMENT INCOME 275,905 -- --LESS ALTERNATIVE INVESTMENT EXPENSES (73,628) -- --GAIN ON SALE OF INVESTMENTS -- 18 --SECURITIES LENDING INCOME 16,022 -- --LESS SECURITIES LENDING EXPENSES (1,227) -- --OTHER INVESTMENT INCOME 643 1,184 --LESS INVESTMENT EXPENSES OTHER THAN
ALTERNATIVE INVESTMENTS AND SECURITIES LENDING (81,502) -- --
NET INVESTMENT INCOME 669,194 2,564 37,485 OTHER INCOME 27,344 -- --
TOTAL ADDITIONS 3,334,540 1,728,806 109,104 DEDUCTIONS RETIREMENT BENEFITS 3,366,696 -- --REFUNDS OF CONTRIBUTIONS 95,159 -- --ADMINISTRATIVE EXPENSES 40,273 1,914 --DEPRECIATION & AMORTIZATION EXPENSES 1,802 -- --DISTRIBUTIONS TO POOL PARTICIPANTS -- 1,819,059 30,397OTHER 383 -- --
TOTAL DEDUCTIONS 3,504,313 1,820,973 30,397 CHANGE IN NET POSITION: RESTRICTED FOR PENSIONS (169,773) -- --HELD IN TRUST FOR INVESTMENT POOL PARTICIPANTS -- (92,167) --HELD IN TRUST FOR INDIVIDUALS, PRIVATE ORGANIZATIONS, AND OTHER GOVERNMENTS -- -- 78,707 NET POSITION - BEGINNING OF YEAR AS RESTATED 31,991,076 1,465,696 509,094 NET POSITION - END OF YEAR $ 31,821,303 $ 1,373,529 $ 587,801 * For the period ending December 31, 2014. The notes to the financial statements are an integral part of this statement.
C O M P O N E N T U N I TF I N A N C I A L S T A T E M E N T S
2014-2015 Comprehensive Annual Financial Report
COMPONENT UNIT FINANCIAL STATEMENTSMajor Component Units
COLLEGES AND UNIVERSITIES
The college and university funds are used to account for the transactions relating to public institutions of higher education. The university systems are listed below. Louisiana Community and Technical College System is listed with the enterprise funds.
Louisiana State University System includes Louisiana State University and A&M College and Louisiana State University Agricultural Center at Baton Rouge, Louisiana State University at Alexandria, Louisiana State University at Eunice, Louisiana State University Medical Center at New Orleans, Louisiana State University Medical Center at Shreveport, Paul M. Hebert Law Center at Baton Rouge, and Pennington Biomedical Research Center at Baton Rouge. Louisiana State University’s Board of Supervisors also operates the general medical facilities in the state.
Southern University System includes Southern University and A&M College and Southern University Agricultural Research and Extension Center at Baton Rouge, Southern University at New Orleans, Southern University at Shreveport, and Southern University Law Center at Baton Rouge.
University of Louisiana System includes Grambling State University at Grambling, Louisiana Tech University at Ruston, McNeese State University at Lake Charles, Nicholls State University at Thibodaux, Southeastern Louisiana University at Hammond, Northwestern State University at Natchitoches, University of Louisiana at Monroe, University of Louisiana at Lafayette, and University of New Orleans at New Orleans.
Board of Regents is the policy making board for each of the university systems listed above and each System’s Board of Supervisors.
LOUISIANA STADIUM AND EXPOSITION DISTRICT
The purpose of the district is to plan, finance, construct, develop, maintain, and operate facilities, including an enclosed and covered stadium within the district for various sporting events, exhibitions, and public meetings. The District is responsible for servicing and retiring the principal and interest on all bonds issued.
LOUISIANA LOTTERY CORPORATION
The Louisiana Lottery Corporation was created to conduct and administer lottery games in the state. Quarterly, the corporation transfers net revenues determined to be surplus to its needs, but not less than 35% of gross revenues each year to the Lottery Proceeds Fund.
2014-2015 Comprehensive Annual Financial Report

- 41 -
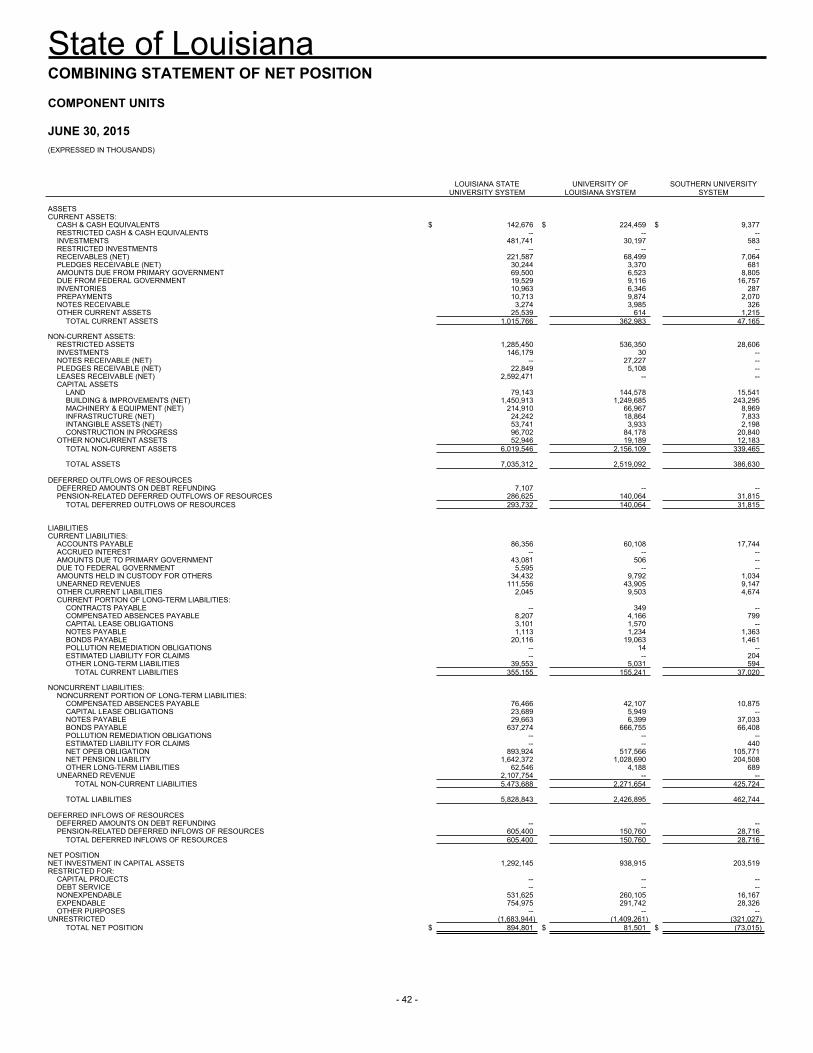
State of Louisiana
- 42 -
COMBINING STATEMENT OF NET POSITION
COMPONENT UNITS JUNE 30, 2015 (EXPRESSED IN THOUSANDS)
LOUISIANA STATE
UNIVERSITY SYSTEM UNIVERSITY OF
LOUISIANA SYSTEM SOUTHERN UNIVERSITY
SYSTEM ASSETS CURRENT ASSETS:
CASH & CASH EQUIVALENTS $ 142,676 $ 224,459 $ 9,377RESTRICTED CASH & CASH EQUIVALENTS -- -- --INVESTMENTS 481,741 30,197 583RESTRICTED INVESTMENTS -- -- --RECEIVABLES (NET) 221,587 68,499 7,064PLEDGES RECEIVABLE (NET) 30,244 3,370 681AMOUNTS DUE FROM PRIMARY GOVERNMENT 69,500 6,523 8,805DUE FROM FEDERAL GOVERNMENT 19,529 9,116 16,757INVENTORIES 10,963 6,346 287PREPAYMENTS 10,713 9,874 2,070NOTES RECEIVABLE 3,274 3,985 326OTHER CURRENT ASSETS 25,539 614 1,215
TOTAL CURRENT ASSETS 1,015,766 362,983 47,165 NON-CURRENT ASSETS:
RESTRICTED ASSETS 1,285,450 536,350 28,606INVESTMENTS 146,179 30 --NOTES RECEIVABLE (NET) -- 27,227 --PLEDGES RECEIVABLE (NET) 22,849 5,108 --LEASES RECEIVABLE (NET) 2,592,471 -- --CAPITAL ASSETS
LAND 79,143 144,578 15,541BUILDING & IMPROVEMENTS (NET) 1,450,913 1,249,685 243,295MACHINERY & EQUIPMENT (NET) 214,910 66,967 8,969INFRASTRUCTURE (NET) 24,242 18,864 7,833INTANGIBLE ASSETS (NET) 53,741 3,933 2,198CONSTRUCTION IN PROGRESS 96,702 84,178 20,840
OTHER NONCURRENT ASSETS 52,946 19,189 12,183TOTAL NON-CURRENT ASSETS 6,019,546 2,156,109 339,465
TOTAL ASSETS 7,035,312 2,519,092 386,630
DEFERRED OUTFLOWS OF RESOURCES
DEFERRED AMOUNTS ON DEBT REFUNDING 7,107 -- --PENSION-RELATED DEFERRED OUTFLOWS OF RESOURCES 286,625 140,064 31,815
TOTAL DEFERRED OUTFLOWS OF RESOURCES 293,732 140,064 31,815 LIABILITIES CURRENT LIABILITIES:
ACCOUNTS PAYABLE 86,356 60,108 17,744ACCRUED INTEREST -- -- --AMOUNTS DUE TO PRIMARY GOVERNMENT 43,081 506 --DUE TO FEDERAL GOVERNMENT 5,595 -- --AMOUNTS HELD IN CUSTODY FOR OTHERS 34,432 9,792 1,034UNEARNED REVENUES 111,556 43,905 9,147OTHER CURRENT LIABILITIES 2,045 9,503 4,674CURRENT PORTION OF LONG-TERM LIABILITIES:
CONTRACTS PAYABLE -- 349 --COMPENSATED ABSENCES PAYABLE 8,207 4,166 799CAPITAL LEASE OBLIGATIONS 3,101 1,570 --NOTES PAYABLE 1,113 1,234 1,363BONDS PAYABLE 20,116 19,063 1,461POLLUTION REMEDIATION OBLIGATIONS -- 14 --ESTIMATED LIABILITY FOR CLAIMS -- -- 204OTHER LONG-TERM LIABILITIES 39,553 5,031 594
TOTAL CURRENT LIABILITIES 355,155 155,241 37,020
NONCURRENT LIABILITIES: NONCURRENT PORTION OF LONG-TERM LIABILITIES:
COMPENSATED ABSENCES PAYABLE 76,466 42,107 10,875CAPITAL LEASE OBLIGATIONS 23,689 5,949 --NOTES PAYABLE 29,663 6,399 37,033BONDS PAYABLE 637,274 666,755 66,408POLLUTION REMEDIATION OBLIGATIONS -- -- --ESTIMATED LIABILITY FOR CLAIMS -- -- 440NET OPEB OBLIGATION 893,924 517,566 105,771NET PENSION LIABILITY 1,642,372 1,028,690 204,508OTHER LONG-TERM LIABILITIES 62,546 4,188 689
UNEARNED REVENUE 2,107,754 -- --TOTAL NON-CURRENT LIABILITIES 5,473,688 2,271,654 425,724
TOTAL LIABILITIES 5,828,843 2,426,895 462,744
DEFERRED INFLOWS OF RESOURCES
DEFERRED AMOUNTS ON DEBT REFUNDING -- -- --PENSION-RELATED DEFERRED INFLOWS OF RESOURCES 605,400 150,760 28,716
TOTAL DEFERRED INFLOWS OF RESOURCES 605,400 150,760 28,716 NET POSITION NET INVESTMENT IN CAPITAL ASSETS 1,292,145 938,915 203,519RESTRICTED FOR:
CAPITAL PROJECTS -- -- --DEBT SERVICE -- -- --NONEXPENDABLE 531,625 260,105 16,167EXPENDABLE 754,975 291,742 28,326OTHER PURPOSES -- -- --
UNRESTRICTED (1,683,944) (1,409,261) (321,027)TOTAL NET POSITION $ 894,801 $ 81,501 $ (73,015)
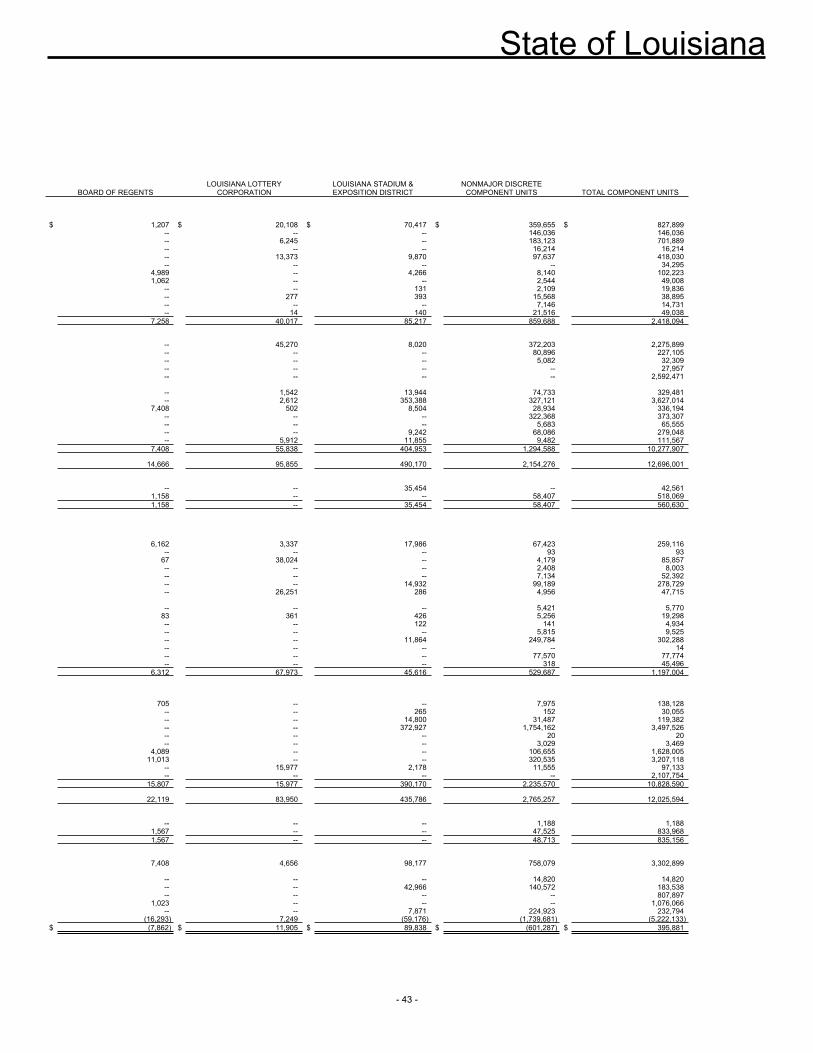
State of Louisiana
- 43 -
BOARD OF REGENTS LOUISIANA LOTTERY
CORPORATION LOUISIANA STADIUM & EXPOSITION DISTRICT
NONMAJOR DISCRETE COMPONENT UNITS TOTAL COMPONENT UNITS
$ 1,207 $ 20,108 $ 70,417 $ 359,655 $ 827,899 -- -- -- 146,036 146,036 -- 6,245 -- 183,123 701,889 -- -- -- 16,214 16,214 -- 13,373 9,870 97,637 418,030 -- -- -- -- 34,295 4,989 -- 4,266 8,140 102,223 1,062 -- -- 2,544 49,008 -- -- 131 2,109 19,836 -- 277 393 15,568 38,895 -- -- -- 7,146 14,731 -- 14 140 21,516 49,038 7,258 40,017 85,217 859,688 2,418,094 -- 45,270 8,020 372,203 2,275,899 -- -- -- 80,896 227,105 -- -- -- 5,082 32,309 -- -- -- -- 27,957 -- -- -- -- 2,592,471 -- 1,542 13,944 74,733 329,481 -- 2,612 353,388 327,121 3,627,014 7,408 502 8,504 28,934 336,194 -- -- -- 322,368 373,307 -- -- -- 5,683 65,555 -- -- 9,242 68,086 279,048 -- 5,912 11,855 9,482 111,567 7,408 55,838 404,953 1,294,588 10,277,907 14,666 95,855 490,170 2,154,276 12,696,001 -- -- 35,454 -- 42,561 1,158 -- -- 58,407 518,069 1,158 -- 35,454 58,407 560,630 6,162 3,337 17,986 67,423 259,116 -- -- -- 93 93 67 38,024 -- 4,179 85,857 -- -- -- 2,408 8,003 -- -- -- 7,134 52,392 -- -- 14,932 99,189 278,729 -- 26,251 286 4,956 47,715 -- -- -- 5,421 5,770 83 361 426 5,256 19,298 -- -- 122 141 4,934 -- -- -- 5,815 9,525 -- -- 11,864 249,784 302,288 -- -- -- -- 14 -- -- -- 77,570 77,774 -- -- -- 318 45,496 6,312 67,973 45,616 529,687 1,197,004 705 -- -- 7,975 138,128 -- -- 265 152 30,055 -- -- 14,800 31,487 119,382 -- -- 372,927 1,754,162 3,497,526 -- -- -- 20 20 -- -- -- 3,029 3,469 4,089 -- -- 106,655 1,628,005 11,013 -- -- 320,535 3,207,118 -- 15,977 2,178 11,555 97,133 -- -- -- -- 2,107,754 15,807 15,977 390,170 2,235,570 10,828,590
22,119 83,950 435,786 2,765,257 12,025,594 -- -- -- 1,188 1,188 1,567 -- -- 47,525 833,968 1,567 -- -- 48,713 835,156 7,408 4,656 98,177 758,079 3,302,899 -- -- -- 14,820 14,820 -- -- 42,966 140,572 183,538 -- -- -- -- 807,897 1,023 -- -- -- 1,076,066 -- -- 7,871 224,923 232,794 (16,293) 7,249 (59,176) (1,739,681) (5,222,133)
$ (7,862) $ 11,905 $ 89,838 $ (601,287) $ 395,881
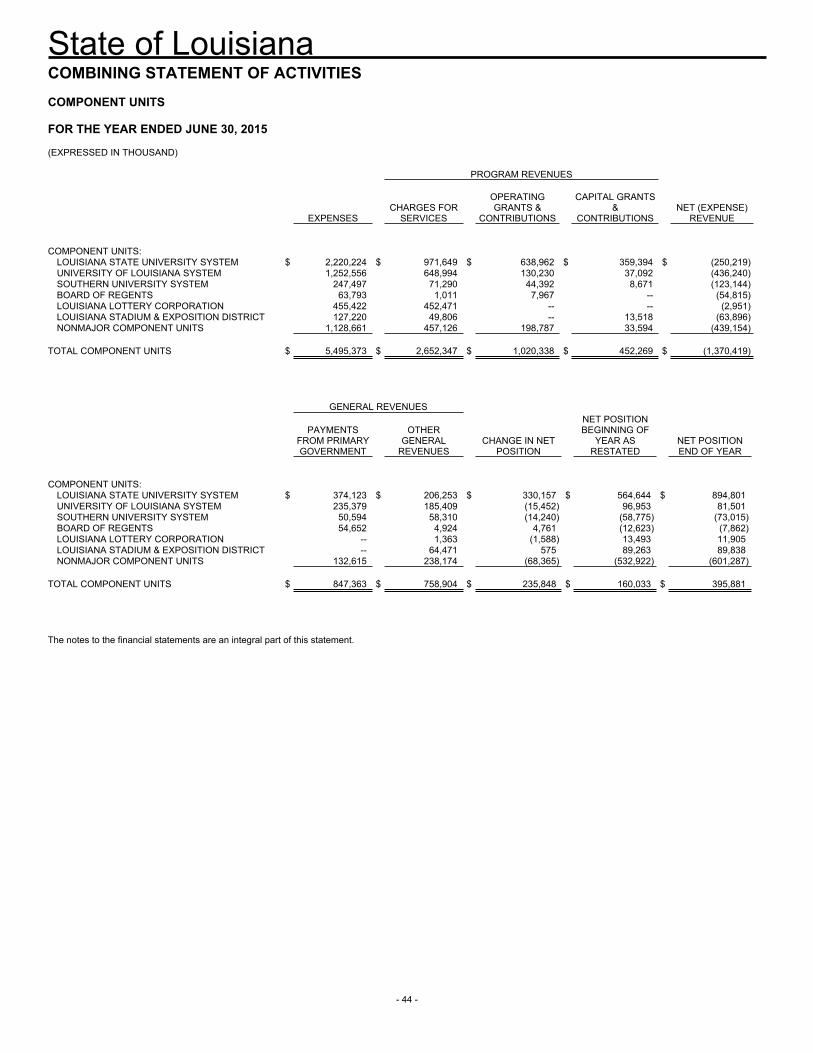
State of Louisiana
- 44 -
COMBINING STATEMENT OF ACTIVITIES COMPONENT UNITS FOR THE YEAR ENDED JUNE 30, 2015 (EXPRESSED IN THOUSAND) PROGRAM REVENUES
EXPENSES CHARGES FOR
SERVICES
OPERATING GRANTS &
CONTRIBUTIONS
CAPITAL GRANTS &
CONTRIBUTIONS NET (EXPENSE)
REVENUE COMPONENT UNITS:
LOUISIANA STATE UNIVERSITY SYSTEM $ 2,220,224 $ 971,649 $ 638,962 $ 359,394 $ (250,219) UNIVERSITY OF LOUISIANA SYSTEM 1,252,556 648,994 130,230 37,092 (436,240) SOUTHERN UNIVERSITY SYSTEM 247,497 71,290 44,392 8,671 (123,144) BOARD OF REGENTS 63,793 1,011 7,967 -- (54,815) LOUISIANA LOTTERY CORPORATION 455,422 452,471 -- -- (2,951) LOUISIANA STADIUM & EXPOSITION DISTRICT 127,220 49,806 -- 13,518 (63,896) NONMAJOR COMPONENT UNITS 1,128,661 457,126 198,787 33,594 (439,154)
TOTAL COMPONENT UNITS $ 5,495,373 $ 2,652,347 $ 1,020,338 $ 452,269 $ (1,370,419) GENERAL REVENUES
PAYMENTS FROM PRIMARY GOVERNMENT
OTHER GENERAL
REVENUES CHANGE IN NET
POSITION
NET POSITION BEGINNING OF
YEAR AS RESTATED
NET POSITION END OF YEAR
COMPONENT UNITS:
LOUISIANA STATE UNIVERSITY SYSTEM $ 374,123 $ 206,253 $ 330,157 $ 564,644 $ 894,801UNIVERSITY OF LOUISIANA SYSTEM 235,379 185,409 (15,452) 96,953 81,501SOUTHERN UNIVERSITY SYSTEM 50,594 58,310 (14,240) (58,775) (73,015)BOARD OF REGENTS 54,652 4,924 4,761 (12,623) (7,862)LOUISIANA LOTTERY CORPORATION -- 1,363 (1,588) 13,493 11,905LOUISIANA STADIUM & EXPOSITION DISTRICT -- 64,471 575 89,263 89,838NONMAJOR COMPONENT UNITS 132,615 238,174 (68,365) (532,922) (601,287)
TOTAL COMPONENT UNITS $ 847,363 $ 758,904 $ 235,848 $ 160,033 $ 395,881 The notes to the financial statements are an integral part of this statement.
N O T E S T O T H E B A S I CF I N A N C I A L S T A T E M E N T S
2014-2015 Comprehensive Annual Financial Report
Note 1 Summary of Significant Accounting Policies
Note 2 Deposits and Investments
Note 3 Accounts Receivable and Accounts Payable
Note 4 Intra-Entity Transactions
Note 5 Capital Assets
Note 6 Employee Benefits – Pensions
Note 6A Employee Benefits – Other Postemployment Benefits (OPEB)
Note 6B Employee Benefits – Termination Benefits
Note 7 Leases
Note 8 Long-Term Obligations
Note 9 Contingencies and Commitments
Note 10 Fund Balance/Net Position Disclosures
Note 11 Other Disclosures
Note 12 Subsequent Events
2014-2015 Comprehensive Annual Financial Report
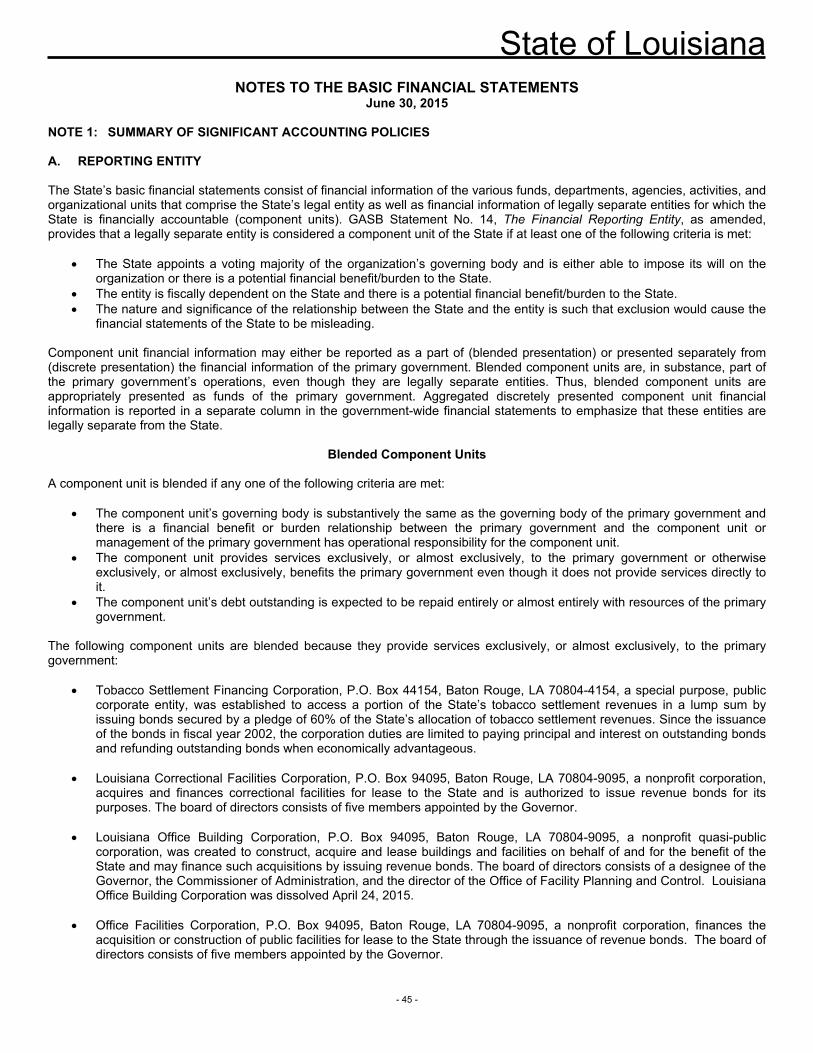
State of Louisiana
- 45 -
NOTES TO THE BASIC FINANCIAL STATEMENTSJune 30, 2015
NOTE 1: SUMMARY OF SIGNIFICANT ACCOUNTING POLICIES
A. REPORTING ENTITY
The State’s basic financial statements consist of financial information of the various funds, departments, agencies, activities, and organizational units that comprise the State’s legal entity as well as financial information of legally separate entities for which the State is financially accountable (component units). GASB Statement No. 14, The Financial Reporting Entity, as amended, provides that a legally separate entity is considered a component unit of the State if at least one of the following criteria is met:
The State appoints a voting majority of the organization’s governing body and is either able to impose its will on the organization or there is a potential financial benefit/burden to the State.
The entity is fiscally dependent on the State and there is a potential financial benefit/burden to the State. The nature and significance of the relationship between the State and the entity is such that exclusion would cause the
financial statements of the State to be misleading.
Component unit financial information may either be reported as a part of (blended presentation) or presented separately from (discrete presentation) the financial information of the primary government. Blended component units are, in substance, part of the primary government’s operations, even though they are legally separate entities. Thus, blended component units are appropriately presented as funds of the primary government. Aggregated discretely presented component unit financial information is reported in a separate column in the government-wide financial statements to emphasize that these entities are legally separate from the State.
Blended Component Units
A component unit is blended if any one of the following criteria are met:
The component unit’s governing body is substantively the same as the governing body of the primary government and there is a financial benefit or burden relationship between the primary government and the component unit or management of the primary government has operational responsibility for the component unit.
The component unit provides services exclusively, or almost exclusively, to the primary government or otherwise exclusively, or almost exclusively, benefits the primary government even though it does not provide services directly to it.
The component unit’s debt outstanding is expected to be repaid entirely or almost entirely with resources of the primary government.
The following component units are blended because they provide services exclusively, or almost exclusively, to the primary government:
Tobacco Settlement Financing Corporation, P.O. Box 44154, Baton Rouge, LA 70804-4154, a special purpose, public corporate entity, was established to access a portion of the State’s tobacco settlement revenues in a lump sum by issuing bonds secured by a pledge of 60% of the State’s allocation of tobacco settlement revenues. Since the issuance of the bonds in fiscal year 2002, the corporation duties are limited to paying principal and interest on outstanding bonds and refunding outstanding bonds when economically advantageous.
Louisiana Correctional Facilities Corporation, P.O. Box 94095, Baton Rouge, LA 70804-9095, a nonprofit corporation, acquires and finances correctional facilities for lease to the State and is authorized to issue revenue bonds for its purposes. The board of directors consists of five members appointed by the Governor.
Louisiana Office Building Corporation, P.O. Box 94095, Baton Rouge, LA 70804-9095, a nonprofit quasi-public corporation, was created to construct, acquire and lease buildings and facilities on behalf of and for the benefit of the State and may finance such acquisitions by issuing revenue bonds. The board of directors consists of a designee of the Governor, the Commissioner of Administration, and the director of the Office of Facility Planning and Control. Louisiana Office Building Corporation was dissolved April 24, 2015.
Office Facilities Corporation, P.O. Box 94095, Baton Rouge, LA 70804-9095, a nonprofit corporation, finances the acquisition or construction of public facilities for lease to the State through the issuance of revenue bonds. The board of directors consists of five members appointed by the Governor.
State of Louisiana
- 46 -
Louisiana Transportation Authority, P.O. Box 94245, Baton Rouge, LA 70804-9245, is a nonprofit corporation established in 2001 to promote, plan, finance, construct, operate, and maintain specific tollways or transitways constructed within Louisiana. The board of directors consists of nine members, including the Governor, the Department of Transportation and the Department of Economic Development secretaries, President of the Senate and Speaker of the House of Representatives, or their designees.
Louisiana State Police Retirement System, 9224 Jefferson Highway, Baton Rouge, LA 70809, was established in 1938 for the benefit of commissioned law enforcement officers as well as the secretary and deputy secretary of the Department of Public Safety.
The following component units are blended because their outstanding debt is expected to be repaid entirely or almost entirely with resources of the State.
Board of Supervisors of the Louisiana Community and Technical College System (LCTCS), 265 S. Foster Drive, Baton Rouge, LA 70806, is the managing and supervising board of seven community colleges, four technical community colleges, and two technical colleges. LCTCS has 51 campuses.
Louisiana Agricultural Finance Authority, P.O. Box 3334, Baton Rouge, LA 70821-3334, was created to alleviate the severe shortage of capital and credit available for investment in agriculture in the State and to promote agriculture and forestry in Louisiana.
Discretely Presented Component Units
As previously mentioned, aggregate discretely presented component units are reported in a separate column to emphasize that they are legally separate from the State. The voting majority of the following discretely presented component units’ board members are appointed by the State and State funds are appropriated for operating support to these entities, creating a financial benefit/burden relationship.
Board of Regents, 1201 North Third Street, Suite 6-200, Baton Rouge, LA 70802, is the policy-making board for the four higher education systems of the State.
Board of Supervisors of the Louisiana State University System, 3810 West Lakeshore Drive Rm 107, Baton Rouge, LA 70808, is the managing and supervising board for the Louisiana State University System (LSU), which includes the following campuses:
o LSU and A&M College at Baton Rougeo LSU Agricultural Center at Baton Rougeo LSU at Alexandriao LSU at Euniceo LSU Health Sciences Center at New Orleanso LSU Health Sciences Center at Shreveporto LSU at Shreveporto Paul M. Hebert Law Center at Baton Rougeo Pennington Biomedical Research Center at Baton Rouge
The Board of Supervisors of the LSU System also operates the Lallie Kemp Regional Medical Center in Independence, Louisiana.
Board of Supervisors of the University of Louisiana System, 1201 North Third Street, Suite 7-300, Baton Rouge, LA 70802, is the managing and supervising board for the following regional universities:
o Grambling State University at Gramblingo Louisiana Tech University at Rustono McNeese State University at Lake Charleso Nicholls State University at Thibodauxo Northwestern State University at Natchitocheso Southeastern Louisiana University at Hammondo University of Louisiana at Lafayetteo University of Louisiana at Monroeo University of New Orleans
State of Louisiana
- 47 -
Board of Supervisors of the Southern University System, P.O. Box 10878, Baton Rouge, LA 70813, is the managing and supervising board of the Southern University System, which includes the following campuses:
o Southern University and A&M College at Baton Rougeo Southern University at New Orleanso Southern University at Shreveport o Southern University Law Center at Baton Rougeo Southern University Agricultural Research and Extension Center at Baton Rouge
Included in the balances and operating results of the university systems is financial activity for major foundations that contribute to the universities.
The voting majority of the following discretely presented component unit’s board members are appointed by the State and the State is able to impose its will on the organization by its ability to modify or approve the budget of the entity.
Greater New Orleans Expressway Commission, P.O. Box 7656, Metairie, LA 70010, was created to construct, operate, and maintain the Greater New Orleans Expressway. The fiscal year end of the commission is October 31.
The voting majority of the following discretely presented component units’ board members are appointed by the State and the State is able to impose its will on the organizations by its ability to remove board members at will.
Louisiana Board of Cosmetology, 11622 Sunbelt Court, Baton Rouge, LA 70809, regulates and licenses members of the Cosmetology industry to maintain public health and welfare standards set by the State of Louisiana.
Louisiana Motor Vehicle Commission, 3519 12th Street, Metairie, LA 70002-3427, regulates all areas of the new car industry, including motor vehicle sales finance companies in Louisiana.
Louisiana State Board of Private Security Examiners, 15703 Old Hammond Hwy., Baton Rouge, LA 70816, regulates the contract security guard industry.
Louisiana Stadium and Exposition District, 1500 Girod Street, New Orleans, LA 70113, is responsible for financing and operating an enclosed covered stadium, as well as other related facilities and structures for holding sporting events, athletic contests, exhibitions, and other events of public interest.
Road Home Corporation, doing business as Louisiana Land Trust, P.O. Box 4609, Baton Rouge, LA 70821, was created for the acquisition, disposition, purchase, renovation, leasing, or expansion of housing stock to help Louisiana residents displaced by the hurricanes to get back into a home or apartment as quickly and fairly as possible.
Sabine River Authority of Louisiana, 15091 Texas Highway, Many, LA 71449-5718, is charged with the development of Toledo Bend resources within the State.
Ascension-St. James Airport and Transportation Authority, 6255 Airport Industrial Blvd., Gonzales, LA 70737, was established for the purpose of acquiring, constructing, maintaining and operating Louisiana Regional Airport.
Levee Districts provide services necessary to ensure adequate drainage control and to protect lands within their respective districts from damage by flood. They include the following:
o Atchafalaya Basin Levee District, P.O. Box 170, Port Allen, LA 70767o Bossier Levee District, P.O. Box 8279, Bossier City, LA 71113o Bunches Bend Protection District, 318 Morgan Street, Lake Providence, LA 71254; the district has a December 31
fiscal year end. o Caddo Levee District, P.O. Box 78282, Shreveport, LA 71137-8282o Fifth Louisiana Levee District, 102 Burnside Drive, Tallulah, LA 71282o Grand Isle Independent Levee District, P.O. Box 757, Grand Isle, LA 70358o Lafitte Area Independent Levee District, 2654 Jean Lafitte Blvd., Lafitte, LA 70067o Lafourche Basin Levee District, P.O. Box 670, Vacherie, LA 70090; the district has a December 31 fiscal year end.o Natchitoches Levee and Drainage District, P.O. Box 1036, Natchitoches, LA 71458o Nineteenth Louisiana Levee District, P.O. Box 267, Colfax, LA 71417o North Lafourche Conservation, Levee and Drainage District, P.O. Box 309, Thibodaux, LA 70302. The district has a
December 31 fiscal year end.o Pontchartrain Levee District, P.O. Box 426, Lutcher, LA 70071o Red River, Atchafalaya, and Bayou Boeuf Levee District, P.O. Box 8235, Alexandria, LA 71306-1235
State of Louisiana
- 48 -
o Red River Levee and Drainage District, P.O. Box 433, Coushatta, LA 71019o South Lafourche Levee District, P.O. Box 426, Galliano, LA 70354o Tensas Basin Levee District, P.O. Box 68, Rayville, LA 71269
The voting majority of the following discretely presented component units’ board members are appointed by the State and the State is able to impose its will on the organizations by its ability to modify or approve rate or fee changes affecting the component units’ revenue.
Louisiana Utilities Restoration Corporation, P.O. Box 91154, Baton Rouge, LA 70802-9154, serves to finance utility system restoration costs.
State Plumbing Board of Louisiana, 12497 Airline Highway, Baton Rouge, LA 70817, regulates the plumbing industry within the State.
The voting majority of the following discretely presented component units’ board members are appointed by the State and the State is able to impose its will on the organizations by veto, overruling or modifying decisions of the organizations’ governing board.
Bayou D’Arbonne Lake Watershed District, P.O. Box 696, Farmerville, LA 71241. The district has a December 31 fiscal year end.
Louisiana International Deep Water Gulf Transfer Terminal Authority, P.O. Box 44296, Baton Rouge, LA 70804.
The voting majority of the following discretely presented component units’ board members are appointed by the State and the State is able to impose its will on the organizations by its ability to appoint, hire, or dismiss employees or management of the component unit:
Louisiana Egg Commission, P.O. Box 1951, Baton Rouge, LA 70821, strives to educate consumers of all ages on the nutritional value of egg and egg products. The Commission also approves and issues licenses to entities engaged in egg production and wholesale.
Louisiana Lottery Corporation, 555 Laurel Street, Baton Rouge, LA 70801, a nonprofit corporation, conducts and administers the State lottery to ensure the integrity of the lottery and maintain the dignity of the State and the general welfare of its people. The board of directors consists of nine members appointed by the Governor.
Three public employee retirement systems meet the criteria for inclusion as discretely presented component units. Although, the primary government does not appoint a voting majority of the entities’ boards, the entities are fiscally dependent and impose a financial burden on the primary government. These entities are fiscally dependent on the primary government because the primary government has the ability to establish and modify the criteria for determining participating employer and employee contributions rates through legislative action. In addition, these entities impose a significant financial benefit burden on the primary government because the primary government is required by Article X, Section 29(B) of the Louisiana Constitution of 1974 to guarantee benefits payable to retirees of these entities:
Louisiana School Employees’ Retirement System, P.O. Box 44516, Baton Rouge, LA 70804-4516, was established in 1947 for the benefit of non-instructional personnel of the Louisiana public school system.
Louisiana State Employees’ Retirement System, P.O. Box 44213, Baton Rouge, LA 70804-4213, was established in 1947 to benefit all State employees with certain statutory exclusions.
Teachers’ Retirement System of Louisiana, P.O. Box 94123, Baton Rouge, LA 70804-9123, was established in 1936 for the benefit of public school teachers.
Although the State does not appoint a voting majority of the board for the entities listed below, the entities are fiscally dependent on the State since the State approves their budgets. Also, a financial benefit/burden exists between the State and the component units since the State is legally entitled to or can otherwise access the entities’ resources.
Louisiana Economic Development Corporation, 1051 North Third Street, Baton Rouge, LA 70802, was established to serve as the single review board and administrator of the Department of Economic Development’s financial assistance programs, such as loan guarantees and venture capital for small and medium-sized businesses.
State of Louisiana
- 49 -
Natchitoches Historic District Development Commission, 781 Front Street, Natchitoches, LA 71457, created for the purpose of the planning and development of the Natchitoches Historic District, a national landmark.
The voting majority of the following discretely presented component unit’s board members are appointed by the State and the State is obligated in some manner for the debt of the component unit.
Greater Baton Rouge Port Commission, P.O. Box 380, Port Allen, LA 70767-0380, regulates commerce and traffic within the port area. The fiscal year end of the port commission is December 31.
The voting majority of the following discretely presented component units’ board members are appointed by the State and the State is legally entitled to or can otherwise access the component units’ resources.
The Louisiana Housing Corporation (LHC) is a discretely presented component unit whose board members are appointed by the State and the State has a financial benefit/burden relationship with the corporation. LHC, 2415 Quail Drive, Baton Rouge, LA 70808, is responsible for managing the State’s housing programs, most of which focus on providing affordable housing for persons with low and moderate incomes.
Louisiana Public Facilities Authority, 2237 S. Acadian Thruway, Suite 650, Baton Rouge, LA 70808, is a public trust authorized to issue obligations and provide funds to finance projects and programs in the best interest of the citizens of Louisiana. The authority has a December 31 fiscal year end.
Louisiana State Board of Private Investigator Examiners, 2051 Silverside Dr., Suite 190, Baton Rouge, LA 70808, regulates and licenses persons and businesses providing private investigative services.
Due to the nature and significance of the relationship between the following entities and the State, the financial statements would be misleading if they were excluded.
Acadiana Area Human Services District, 302 Dulles Drive, Lafayette, LA 70506 was established to direct the operation and management of community-based programs and services relative to mental health, developmental disabilities, and addictive disorder services for the parishes of Acadia, Evangeline, Iberia, Lafayette, St. Landry, St. Martin, and Vermillion parishes.
Capital Area Human Services District, 4615 Government Street, Building 2, Baton Rouge, LA 70806, was established to direct the operation of community-based programs and services relative to public health, mental health, developmental disabilities, and addictive disorder services for the parishes of Ascension, East Baton Rouge, East Feliciana, Iberville, Pointe Coupee, West Baton Rouge, and West Feliciana.
Central Louisiana Human Services District, P.O. Box 219, Evergreen, LA 71333, was created with local accountability and management of behavioral health and developmental disabilities services as well as any public health or other services contracted to the district by the Department of Health and Hospitals.
Florida Parishes Human Services Authority, 835 Pride Drive, Ste. B, Hammond, LA 70401, was established to direct the operation and management of mental health, developmental disabilities, and addictive disorders services for the residents of Livingston, St. Helena, St. Tammany, Tangipahoa, and Washington parishes.
Foundation for Excellence in Louisiana Public Broadcasting, 7733 Perkins Road, Baton Rouge, LA 70810 was established to support the Louisiana Educational Television Authority, the state agency charged with promoting public and educational television in Louisiana. The Foundation provides an endowment to support public television in Louisiana and may serve as a “repository” for funds to be utilized for the promotion, development, enhancement and assistance of public television in Louisiana.
Imperial Calcasieu Human Services Authority, 3505 5th Avenue, Ste. B, Lake Charles, LA 70607, was created with local accountability and management to provide behavioral health and developmental disabilities services to the parishes of Allen, Beauregard, Calcasieu, Cameron, and Jefferson Davis.
Jefferson Parish Human Services Authority, 3616 S. I-10 Service Road, Metairie, LA 70001, was established to provide administration, management, and operation of mental health, developmental disabilities, and addictive disorders services for the residents of Jefferson Parish.
Louisiana Beef Industry Council, 4921 I-10 Frontage Road, Port Allen, Louisiana 70767, was established to coordinate the fulfillment of the economic, political and social needs of the Louisiana cattle producers.
State of Louisiana
- 50 -
Louisiana Cancer Research Center, 1700 Tulane Avenue, Suite 1000, New Orleans, LA 70112, conducts research and promotes education in the diagnosis, detection, and treatment of cancer.
Louisiana Citizens Property Insurance Corporation, 1 Galleria Blvd., Suite 720, Metairie, LA 70001, is a nonprofit organization created to provide insurance plans to residential and commercial property applicants who are unable to procure insurance through the voluntary market. Louisiana Citizens Property Insurance has a December 31 fiscal year end.
Metropolitan Human Services District, 1010 Common Street, Suite 600, New Orleans, LA 70112, was established to direct the operation and management of mental health, developmental disabilities, and addictive disorders services for the residents of Orleans, St. Bernard, and Plaquemines parishes.
Northeast Delta Human Services Authority, 2513, Ferrand Street, Monroe, LA 71201, was established to direct the operation and management of community-based programs and services relative to mental health, developmental disabilities, and addictive disorder services for the parishes of Caldwell, East Carroll, Franklin, Jackson, Lincoln, Madison, Morehouse, Ouachita, Richland, Tensas, Union, and West Carroll.
Northwest Louisiana Human Services District, 2924 Knight Street, Ste 350, Shreveport LA 71105, was established to direct the operation and management of mental health, developmental disabilities, and addictive disorders services for the parishes of Bienville, Bossier, Caddo, Claiborne, DeSoto, Natchitoches, Sabine, Red River, and Webster.
South Central Louisiana Human Services Authority, 521 Legion Avenue, Houma, LA 70364, was established to direct the operation and management of community-based programs and services relative to mental health, developmental disabilities, and substance abuse services for the residents of Assumption, Lafourche, St. Charles, St. James, St. John the Baptist, St. Mary, and Terrebonne parishes.
Southeast Louisiana Flood Protection Authority-East, 2045 Lakeshore Drive, Suite 422, New Orleans, LA 70122, and Southeast Louisiana Flood Protection Authority-West, 7001 River Road, Marrero, LA 70072, were created to provide regional coordination of flood protection. These two authorities are reported together as the Southeast Louisiana Flood Protection Authority-East and West (SLFPA-East and West). Entities under SLFPA-East and West for fiscal year 2015 include the Board of Commissioners-SLFPA-East, Board of Commissioners-SLFPA-West, Algiers Levee District, East Jefferson Levee District, Lake Borgne Basin Levee District, Orleans Levee District, and West Jefferson Levee District.
Relay Administration Board, P.O. Box 91154, Baton Rouge, LA 70821-9154, is charged with oversight of telephone relay services for the State, insuring equal access to telecommunications services for all hearing and speech impaired citizens. The board has a December 31 fiscal year end.
Related Organizations
Related organizations are those entities for which a primary government’s accountability does not extend beyond appointing a voting majority of the board. The State is not financially accountable for the following related organizations, and they are not reported in the accompanying basic financial statements.
Allen Parish Reservoir District Ambulance Service District Commission Amite River Basin Drainage Water and Conservation District Associated Branch Pilots of the Port of Lake Charles Associated Branch Pilots of the Port of New Orleans Bayou Desiard Restoration Commission Bayou Lafourche Fresh Water District Black River Lake Recreation and Water Conservation District Capital Area Groundwater Conservation District Castor Creek Reservoir District Crescent River Port Pilots’ Association Foundation for Louisiana Fourteenth and Sixteenth Wards Neighborhood Development District Gentilly Taxing District Glen Oaks Crime Prevention and Improvement District Greater Ouachita Port Commission John K. Kelly Grand Bayou Reservoir District
State of Louisiana
- 51 -
Kenner Naval Museum Commission Lake Vista Crime Prevention District Louisiana Naval War Memorial Commission Louisiana Used Motor Vehicle Commission New Orleans and Baton Rouge Steamship Pilots’ Association New Orleans Regional Business Park North Lafayette Redevelopment Authority Parish Hospital Service Districts Patient’s Compensation Fund Oversight Board Poverty Point Reservoir District River Region Cancer Screening and Early Detection District Seventh Ward Neighborhood Development District South Tangipahoa Parish Port Commission Southwest Acadiana Parishes Public Housing Rehabilitation District St. Mary Levee District Tangipahoa Parish Juvenile Justice District Terrebonne Levee and Conservation District Twelfth and Thirteenth Wards Neighborhood Development District West Ouachita Parish Reservoir Commission
Joint Ventures
A joint venture is a legal entity or other organization that results from a contractual arrangement and is owned, operated, or governed by two or more participants as a separate and specific activity subject to joint control, in which the participants retain (1) an ongoing financial interest or (2) an ongoing financial responsibility. The purposes of a joint venture are to pool resources and share the costs, risks, and rewards of providing goods or services to venture participants directly, or for the benefit of the general public or specific service recipients.
The Sabine River Authority of Louisiana, 15091 Texas Highway, Many, LA 71449-5718, participates equally with the Sabine River Authority of Texas in the Sabine River Compact Administration (Compact) and through the Sabine River Authority, with the Sabine River Authority of Texas, 450 Spur 135, Burkeville, TX 75932, in the Toledo Bend Joint Operation (Joint Operation). Separate financial statements are prepared for the operations of both the Compact and the Joint Operation and may be obtained by contacting the entities at the addresses above. The Compact was created under authority granted by an act of the Congress of the United States to provide equitable apportionment of the waters of the Sabine River and its tributaries. A five-member board composed of two members appointed by the governors of each state and one non-voting, ex-officio member appointed by the President of the United States administer the Compact. The Joint Operation was established by joint resolution of the Sabine River Authorities of Texas and Louisiana for the construction and operation of the Toledo Bend Dam and Reservoir project administered by a board composed of three members appointed by the Texas Authority and three members appointed by the Louisiana Authority. Costs of the Compact not paid by the federal government are to be paid equally by the two States, which share equally in the costs of the Joint Operation. Each State owns an undivided one-half share of all lands acquired for the project, and each State owns and is entitled to 50% of the water produced and 50% of the power generated by the Joint Operation and may sell, use, or otherwise dispose of its share without consent and permission of the other Authority.
The Sabine River Authority of Louisiana’s share of the joint ventures is reported as a discrete component unit in the accompanying basic financial statements. For fiscal year 2015, the Sabine River Authority of Louisiana reported an increase in net position of $4,765,701 from fiscal year 2014.
The Pest Control Compact Insurance Fund Governing Board, P.O. Box 3481, Baton Rouge, LA 70821-3481, participates equally in the multistate Pest Control Compact and through the Interstate Pest Control Compact, 845 Sutherland Drive, Saint Albans, WV 25177. The Insurance Fund must annually submit to the governor of each party state a report covering its activities for the preceding year. Louisiana’s participation in the Compact was confirmed by the Louisiana Legislature to alleviate financial losses from the depredations of pests and to protect fully against those pests that present serious dangers. The governing board of the Insurance Fund is made up of one representative from each party state that shall be entitled to one vote on such board; if provisions are made, the United States may be represented on the board not to exceed three representatives with non-voting powers. The budget of each party state shall contain a specific recommendation of the amount or amounts to be appropriated by each party state, which is one-tenth of the total budget in equal shares and the remainder in proportion to the value of agriculture and forest crops and products. The party states may request expenditures from the Insurance Fund.
State of Louisiana
- 52 -
Jointly Governed Organizations
A jointly governed organization is one governed by representatives from each of the governments creating it and one in which the participants do not retain an ongoing financial interest or financial burden; therefore, they are not reported in the accompanying basic financial statements. These organizations include the Gulf States Marine Fisheries Commission, Southern Rail Commission, Interstate Commission for Adult Offender Supervision, Interstate Insurance Product Regulation Compact and Commission, Interstate Commission for Juveniles, and Interstate Commission on Educational Opportunity for Military Children.
B. BASIS OF PRESENTATION, MEASUREMENT FOCUS AND BASIS OF ACCOUNTING
The basic financial statements include the government-wide financial statements, fund financial statements, and notes to the basic financial statements. The government-wide financial statements consist of a governmental activities column and a business-type activities column. Together these two columns comprise the financial information of the primary government. As previously mentioned, aggregate discretely presented component unit information is presented separately to emphasize that these entities are legally separate from the primary government. Fund financial statements are presented to provide additional detail supporting the information presented in the government-wide financial statements. The fund financial statements consist of financial statements for governmental funds, proprietary funds (enterprise and internal service funds), and fiduciary funds, even though the latter are excluded in the government-wide financial statements.
Government-wide Financial Statements
While separate government-wide and fund financial statements are presented, they are interrelated. The governmental activities column incorporates data from governmental funds and internal service funds, while business-type activities incorporate data from the State’s enterprise funds. The government-wide financial statements are presented using the economic resources and the accrual basis of accounting, similar to a private company. This measurement focus and basis of accounting assists users in assessing the mid- and long-term effect of decisions on the State’s financial position and financial condition.
The government-wide financial statements consist of a statement of net position and a statement of activities. The statement of net position presents all economic resources, such as State-owned capital assets that facilitate the delivery of government services, as well as claims on economic resources in the future, such as long-term debt and liabilities for pensions.
The statement of activities details the changes in net position from the prior year. Revenues are recognized when earned and expenses are recognized when liabilities are incurred, regardless of the timing of the related cash flows. The statement of activities reports revenues and expenses in a format that allows the user to focus on the extent to which each function is able to generate program revenues, such as charges for services and grants, to cover expenses. In other words, the statement of activities provides information to users on how self-sustaining each governmental function is and the extent to which each function must rely on general revenues such as taxes to cover expenses.
Fund Financial Statements
The fund financial statements provide information about the State’s funds, including its fiduciary funds and blended component units. Separate statements for each fund category— governmental, proprietary, and fiduciary—are presented. The emphasis of fund financial statements is on major governmental and enterprise funds, which are each displayed in a separate column. All remaining governmental and enterprise funds are aggregated and reported as nonmajor funds. Major funds are those governmental and enterprise funds with revenues, expenditures/expenses, assets plus deferred outflows of resources, or liabilities plus deferred inflows of resources that are at least 10 percent of the total for their fund type (governmental or enterprise) and at least five percent of the corresponding element total for all governmental and enterprise funds combined.
The governmental fund financial statements are presented using the current financial resources measurement focus and the modified accrual basis of accounting. This measurement focus and basis of accounting assists users in assessing the short-term effect of decisions on the State’s financial position and financial condition.
The governmental fund financial statements consist of a balance sheet and a statement of revenues, expenditures, and changes in fund balances. The balance only includes current financial resources and claims on those resources. Therefore, the economic resources and claims on those resources presented on the government-wide statement of net positon are absent from the governmental fund balance sheet. On the statement of revenues, expenditures, and changes in fund balances, revenues are recognized in the accounting period in which they become both measurable and available to finance expenditures of the current period, generally considered 45 days after the end of the fiscal year, except for federal grants, which generally are considered available for 12 months after the end of the fiscal year. Expenditures are recognized in the accounting period in which the fund liability is incurred, if measurable.
State of Louisiana
- 53 -
The governmental fund balance sheet includes a reconciliation of the government-wide statements to the governmental fund financial statements. This reconciliation is necessary to bring the financial statements from the current financial resources measurement focus and modified accrual basis of accounting to the economic resources measurement focus and full accrual basis of accounting. Major items included in the reconciliation are capital assets, inventories and prepayments, long-term debt, accrued interest, net position of internal service funds, and deferred inflows/outflows of resources, which are shown on the government-wide but not the governmental fund statements.
The proprietary fund statements include a statement of net position; a statement of revenues, expenses, and changes in net position; and a statement of cash flows. The proprietary fund statements are prepared using the economic resources measurement focus and the accrual basis of accounting, similar to private companies. The proprietary fund financial statements have a column for each major enterprise fund, one that combines all the nonmajor enterprise funds, and one column that reports all internal service funds. The fiduciary fund statements include a statement of net position and a statement of changes in net position, with one column for each of the four types of fiduciary funds. The statements are prepared using the economic resources measurement focus and the accrual basis of accounting, except for agency fund statements which use the accrual basis but do not have a measurement focus, as they report only assets and liabilities.
Governmental Funds
Governmental funds are used to account for activities primarily supported by taxes, grants and similar revenues. The major governmental funds of the State are the General Fund, the Bond Security and Redemption Fund, Capital Outlay Escrow Fund, and the Louisiana Education Quality Trust Fund.
General Fund - The General Fund is the principal operating fund of the State, and was established administratively to provide for the distribution of funds appropriated by the state legislature for the ordinary expenses of state government. Transactions related to resources that are not accounted for in other funds are recorded in the General Fund. Revenues include the direct deposit of federal grants and the transfer of state revenues from the Bond Security and Redemption Fund after debt requirements and obligations to other funds are met.
Bond Security and Redemption Fund - This fund is used to provide for the collection of all money deposited into the State Treasury except federal funds, donations, or other forms of assistance when the terms and conditions of the related agreements require otherwise. Each fiscal year, an amount is allocated from this fund sufficient to pay all obligations secured by the full faith and credit of the State that are due and payable within the current fiscal year, including debt principal, interest, premiums, and sinking or reserve funds. Except as otherwise provided by law, money remaining in the fund is credited to the General Fund at year-end.
Louisiana Education Quality Trust Fund - Once requirements of the Bond Security and Redemption Fund have been met, certain funds received from the federal government attributable to mineral production or leases on the outer continental shelf are deposited by the State Treasurer into this fund. The fund consists of nonspendable invested trust principal and an expendable portion to be used for various educational purposes.
Capital Outlay Escrow Fund - This fund provides for the capital outlay expenditures of state government, state institutions, and other public entities as appropriated by the legislature. Sources of funding include federal revenues, transfers from the General Fund and Transportation Trust Fund, interest earnings, and contributions from other sources.
Proprietary Funds
Proprietary funds are used to account for activities that receive significant support from fees and user charges. The State has two types of proprietary funds:
Internal service funds account for the provision of services, primarily given by one department to another, on a cost reimbursement basis. The activities accounted for in internal service funds include copy and mail services, aircraft services, telecommunications, and financing and acquiring public facilities for lease to the State.
Enterprise funds account for the activities for which fees are charged to external users for goods or services.
The State’s major enterprise funds are the Unemployment Trust Fund and the Louisiana Community and Technical College System.
Unemployment Trust Fund - This fund accounts primarily for the unemployment tax payments from employers to be used for the payment of unemployment benefits to eligible claimants.
State of Louisiana
- 54 -
Board of Supervisors of the Louisiana Community and Technical College System - This entity provides strategic management and support for Louisiana’s 13 comprehensive community and technical colleges.
Fiduciary Funds
Fiduciary funds are used to account for assets held by the State in a trustee capacity or as an agent for individuals, private organizations, other governmental units, and/or other funds, and cannot be used to address activities or obligations of the government. These funds are presented in the fund financial statements, but are not incorporated into the government-wide statements. Fiduciary Funds are not subject to the major/nonmajor fund classification. There are four types of fiduciary funds:
Pension trust funds account for resources held in trust for members and beneficiaries of employee pension plans.
Investment trust funds account for the portion of the government’s investment pools that belong to others.
Private-purpose trust funds report all other trust arrangements benefiting those outside the government.
Agency funds contain resources held by the government in a temporary, purely custodial capacity for others (excluding agencies of the State) and do not involve measurement of results of operations.
C. ASSETS, LIABILITIES, DEFERRED INFLOWS, DEFERRED OUTFLOWS, AND NET POSITION OR FUND BALANCES
Cash and Investments
The State Treasurer pools those cash resources for which he is responsible and invests them accordingly. For purposes of the financial statements, including the Statement of Cash Flows, the State considers all highly liquid investments (including restricted assets) with a maturity of three months or less when purchased to be cash equivalents.
Investments are reported at fair value in accordance with GASB Statement No. 31, Accounting and Financial Reporting for Certain Investments and for External Investment Pools. Cash and investment earnings are recorded in the General Fund unless statutorily dedicated to specific funds. Cash and investment limitations are discussed in Note 2 (Deposits and Investments).
The investments of the pension trust funds are reported at fair value. Short-term investments are reported at cost which approximates fair value. Securities traded on a national or international exchange are valued at the last reported sales price at current exchange rates. The fair value of real estate investments is based on independent appraisals. Investments that do not have an established market value are reported at estimated fair value.
Internal Balances
Any residual balances outstanding between the governmental activities and business-type activities are reported in the government-wide financial statements as “internal balances.” All internal balances are eliminated in the total primary government column.
Inventories and Prepaid Items
Inventories consisting predominately of materials and supplies held for consumption, merchandise and livestock held for resale, and expendable medical supplies are valued primarily using the average cost method. The consumption method is used for financial reporting. Certain payments to vendors reflect costs applicable to future accounting periods and are recorded as prepaid items in both government-wide and fund financial statements.
Restricted Assets
Restricted assets represent primarily cash, investments, and receivables held separately and restricted according to applicable bond indenture agreements.
Capital Assets
Capital assets, which include property, plant, equipment, and infrastructure assets, are reported in the applicable governmental or business-type activities columns in the government-wide financial statements at historical cost. Infrastructure is reported retroactively to 1960. Capital assets are recorded as expenditures generally in the Capital Outlay Escrow Fund at the fund level and capitalized at the government-wide level; capital assets of enterprise and internal service funds are reported in the respective funds. The costs of normal maintenance and repairs that do not add to the value of the assets or materially extend the life of the assets are not capitalized. For reporting purposes, the State has defined capital assets as follows:
State of Louisiana
- 55 -
Land is an inexhaustible asset with no capitalization threshold and an unlimited useful life; therefore, it is not depreciated.
Movable property consists of assets that are not fixed or stationary in nature with an initial, individual cost of at least $5,000. The straight-line method of depreciation is used, which divides the historical cost by the estimated useful life of the asset, generally 5 to 10 years.
Buildings are permanent structures erected above ground, while improvements are major repairs, renovations, or additions that increase the future service potential of the asset. Leasehold improvements are improvements made by the lessee to leased property. The capitalization threshold for buildings and improvements is $100,000. They are depreciated principally using the straight-line method with an estimated useful life typically of 40 years for structures and improvements and 20 years for depreciable land improvements. Leasehold improvements are depreciated using the straight-line method with an estimated useful life depending on the term of the lease. Construction-in-progress is not depreciated.
Infrastructure assets are roads, bridges, tunnels, drainage systems, water and sewer systems, dams, and lighting systems. Infrastructure has a capitalization threshold of $3,000,000, and is depreciated using the straight-line method with an estimated useful life of 40 years.
Purchased computer software has a capitalization threshold of $1,000,000 and is depreciated using the straight-line method over an estimated useful life of 3 years.
Internally generated software has a capitalization threshold of $1,000,000, and is depreciated using the straight-line method over an estimated useful life determined by its value. Internally generated software valued at $10,000,000 or less is depreciated over 7 years and internally generated software valued over $10,000,000 is depreciated over 10 years.
Historical treasures and works of art are items held for public exhibition, educational purposes, or research in enhancement of public service instead of financial gain, and therefore are not capitalized or depreciated.
Donated capital assets are valued at their estimated fair market value at the time of donation.
Hospitals and medical units within Louisiana State University Health Sciences Center are subject to federal cost reporting requirements and use capitalization and depreciation policies of the Centers for Medicare and Medicaid Services (CMS) to ensure compliance with federal regulations. These capitalization policies include a threshold of $5,000 for all assets, depreciable lives greater than 40 years on some assets, and recognition of a half year of depreciation in the year of acquisition and final year of useful life.
Compensated Absences
Classified and unclassified state employees earn annual leave and sick leave at various rates depending on the number of years of service. The amount of annual and sick leave that may be accrued by each employee is unlimited. An employee is compensated for up to 300 hours of unused annual leave at the employee's hourly rate of pay at the time of termination. For employees under the supervision of the Board of Elementary and Secondary Education or other boards of control of publicly supported educational institutions, Louisiana Revised Statutes (LRS) 17:425 provides for payment of up to 25 days of unused sick leave at the time of retirement, or death if prior to retirement.
Upon a member’s retirement, annual leave balances in excess of 300 hours and the number of hours of unused sick leave are converted into years or fractions of years and added to the number of years of service earned by the retiree. Unused annual and sick leave is applied to the number of years of service only for computing the rate of pay due to the retiree and does not count toward the number of years necessary for retirement. Act 343 of 1993 allows members retiring after August 15, 1993, to elect to receive an actuarially determined lump-sum payment for unused leave that would have been converted for retirement credit.
An employee who is required to work overtime may, at the option of the appointing authority, be credited with compensatory leave for the hours required to work. Certain employees earn this leave at time and one-half, whereas others earn on an hour-for-hour basis. Generally, employees in positions at or below a certain pay level may be paid upon separation or transfer, based on the employee’s final regular rate of pay. Compensatory leave for all other employees is canceled upon separation or transfers from the department in which it was earned.
State of Louisiana
- 56 -
Revenues and Expenses
The government-wide statement of activities distinguishes between revenues that are generated by each function (program revenues) and those that are a result of the State’s general revenue-collecting authority (general revenues). Program revenues include amounts charged to users of state services as well as operating and capital grants that are restricted to specific functions and programs. Operating grants include operating-specific and discretionary (either operating or capital) grants, while capital grants include only capital-specific grants. General revenues include taxes, gaming, and investment revenues.
Proprietary funds distinguish between operating and nonoperating revenues and expenses. Operating revenues result from the fees charged to users of the fund’s principal operation, such as the provision of goods or services. All other revenues are considered nonoperating revenues, even if the resources received were used to fund the fund’s principal operation. Operating expenses arise from the provision of the fund’s principal operation. All other expenses are classified as nonoperating expenses.
Deferred Outflows/Inflows of Resources
Deferred outflows of resources represent a consumption of net position that applies to a future period and so will not be recognized as an outflow of resources (expense or expenditure) until then. Deferred inflows of resources represent an acquisition of net position that applies to a future period and so will not be recognized as an inflow of resources (revenue) until that time. The State has the following items that are reported as deferred inflows or outflows of resources: the accumulated increase/decrease in the fair value of hedging derivatives, fines and penalties received in advance of meeting time requirements, deferred amounts on debt refunding, deferred inflows/outflows of resources related to pensions, and unavailable revenue. Unavailable revenue arises only under a modified accrual basis of accounting, so it is reported only in the governmental funds balance sheet.
Fund Balance Classifications and Net Position
Fund balances are reported under the following fund balance classifications:
Nonspendable – includes amounts that cannot be spent because they are not in spendable form (e.g., inventories) or are legally or contractually required to be maintained intact (e.g., corpus of a permanent fund).
Restricted – includes amounts that have constraints placed on the use of the resources either by an external party or by imposition of law through constitutional provisions or enabling legislation.
Committed – includes amounts that can only be used for specific purposes pursuant to constraints imposed by formal action of the State Legislature, the State’s highest level of decision making authority. Those committed amounts cannot be used for any other purpose unless the state legislature removes or changes the specified use by taking the same type of action employed to commit those amounts such as the passage of a new law.
Assigned – includes amounts that are constrained by the state’s intent to be used for specific purposes, but are neither restricted nor committed. Through acts of the State Legislature, the Joint Legislative Committee on the Budget and the Office of Planning and Budget, under the authority of the Commissioner of Administration, have been delegated the authority to assign amounts to be used for specific purposes.
Unassigned – includes amounts that have not been assigned to other funds and that have not been restricted, committed, or assigned to specific purposes within the General Fund.
The State has a general policy to first use restricted resources for expenditures incurred for which both restricted and unrestricted (committed, assigned, and unassigned) resources are available. When expenditures are incurred for which only unrestricted resources are available, the general policy of the State is to use committed resources first, followed by assigned, and then unassigned.
Net position is equal to assets, plus deferred outflows of resources, less liabilities, less deferred inflows of resources. Net position is segregated into three categories on the government-wide statement of net position: net invested in capital assets; restricted; and unrestricted. Net invested in capital assets consists of capital assets (net of accumulated depreciation) reduced by the outstanding balances of bonds, mortgages, notes, or other debt attributable to the acquisition, construction, or improvement of such assets. Restricted net position represents the portion of net position that consists of restricted assets reduced by liabilities and deferred inflows related to those assets. The State first uses restricted assets for expenses incurred when both restricted and unrestricted net position is available for use.
State of Louisiana
- 57 -
D. BUDGETS AND BUDGETARY ACCOUNTING
LRS 39:33 requires that on or before November 15, the head of each spending agency submit to the Governor, the Joint Legislative Committee on the Budget, and the Legislative Fiscal Office an estimate of the financial requirements and receipts of the budget unit for the upcoming fiscal year. The Governor is required to prepare an executive budget and transmit a copy to each member of the Legislature on the first day of the regular session (LRS 39:37). The budget is enacted into law by the Legislature and sent to the Governor for signature. Article VII, Section 10 of the Louisiana Constitution of 1974 prohibits the passage of an unbalanced budget. The Governor may veto any line item appropriation, subject to legislative override.
LRS 39:73 authorizes the transfer of funds between programs within a budget unit. The Commissioner of Administration may approve such a transfer when in aggregate the transfers are not more than 1% of the total appropriation to the budget unit and sufficient evidence is presented. The Commissioner, with the approval of the Joint Legislative Committee on the Budget, may approve the transfer of funds between programs within the budget unit when in aggregate the transfers do not exceed 25% of the total appropriation to the budget unit and sufficient evidence is presented. These and other requests for transfers are to be submitted by the budget unit to the Legislative Fiscal Office.
According to LRS 39:111, the Governor is required to submit to the Legislature, no later than the eighth day of the regular session, a proposed five-year capital outlay program. The Legislature enacts into law a bill incorporating the first year of the five-year capital outlay program. The Legislature adopts a concurrent resolution for the remaining four years of the five-year capital outlay program, itemizing the capital projects and the amount and source of funding for each of the subsequent four years.
According to LRS 39:77, in no event shall any budget unit commit to an expenditure in excess of the unencumbered balance of the allotment to which the resulting expenditure would be charged, without prior approval of the Interim Emergency Board and two-thirds of the Legislature. The Revenue Estimating Conference has been established to provide an official estimate of anticipated state revenues for each fiscal year. Appropriations by the Legislature from the state General Fund and dedicated funds for any fiscal year shall not exceed the official forecast in effect at the time the appropriations are made. The Governor may direct the Commissioner of Administration to reduce or disapprove warrants in order to prevent a budgetary deficit.
In accordance with LRS 39:82(A), agencies are allowed 45 days for closing out prior year activities. This statute limits the use of appropriation balances after the June 30 close to true liabilities, delineates those items eligible for roll forward treatment, and establishes a 45-day period to request such carry-forwards. After that time, all appropriations lapse except permanent capital outlay appropriations that remain active until the projects are complete. Additionally, upon approval by the Commissioner of Administration, any federal funds and any state funds appropriated during a fiscal year specifically for matching federal grants may be carried forward into the upcoming year's appropriation. Re-established appropriations for enterprise and internal service funds are allowed to retain any surplus resulting from prior year operations. These and all monies from self-generated revenues are available for expenditure in the amounts appropriated. The Commissioner of Administration may approve increases from self-generated revenues, not exceeding in aggregate 5% of appropriated self-generated revenues. Only with the approval of the Division of Administration and the Joint Legislative Committee on the Budget will any larger increase in self-generated revenue over the amount appropriated be available to agencies for expenditure.
Annual operating appropriations of the State are adopted on a non-GAAP basis by individual budget unit, rather than by fund. As previously mentioned, expenditure levels are constrained based on budgetary basis revenue forecasts by the State’s Revenue Estimating Conference. Budgetary basis revenues are cash collections during the fiscal year and collections attributable to the fiscal year within 45 days after the end of the fiscal year. The budgetary basis differs from GAAP most significantly in regards to accounting for non-exchange transactions such as federal grants and derived tax revenues.
Governments are required to present the original, final, and actual budgetary basis of the General Fund and each individual major special revenue fund that has a legally adopted annual budget. The accompanying Required Supplementary Information includes notes and a schedule making this comparison for the General Fund. For fiscal year 2015, there are no major special revenue funds. Legally adopted budgets are not adopted for any fund. However, since most revenues that finance General Fund expenditures as well as the State’s general obligation debt service payments are accounted for in the Bond Security & Redemption Fund, a budgetary comparison schedule will be prepared and included as Supplementary Information.
E. USE OF ESTIMATES
The preparation of financial statements in conformity with accounting principles generally accepted in the United States of America requires management to make estimates and assumptions that affect the reported amounts of assets and liabilities and disclosure of contingent assets and liabilities at the date of the financial statements and the reported amounts of revenues and expenses during the reporting period. Actual results could differ from those estimates.
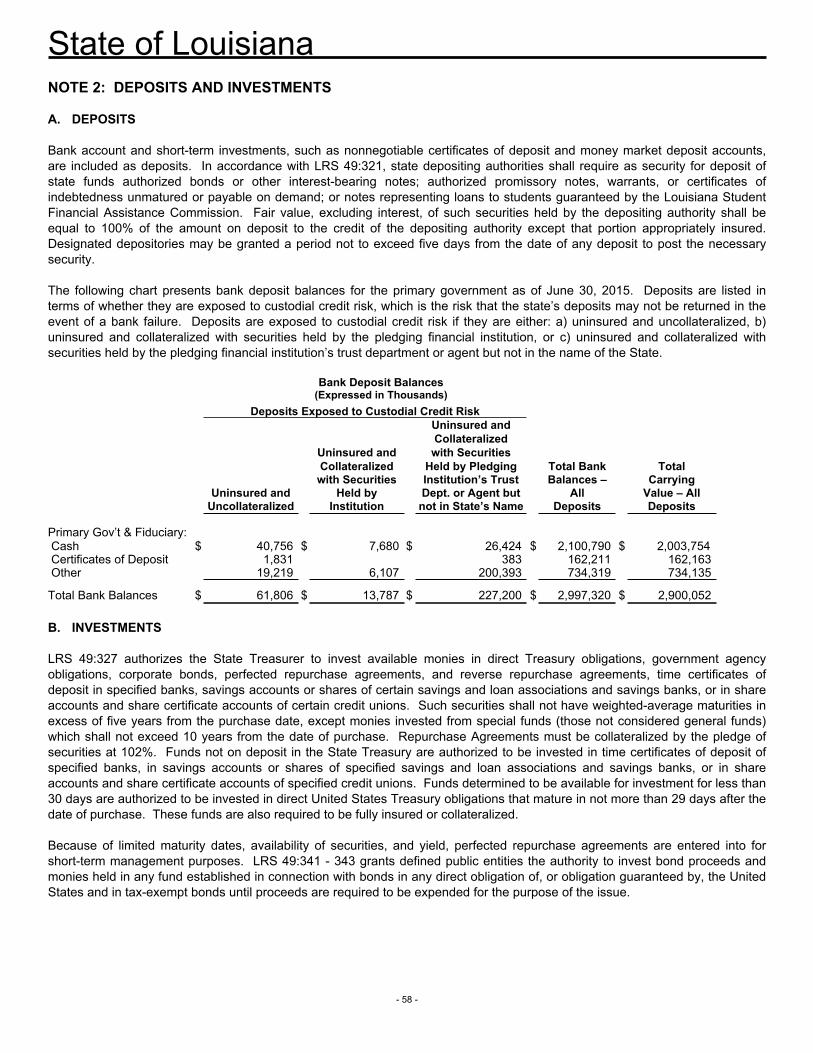
State of Louisiana
- 58 -
NOTE 2: DEPOSITS AND INVESTMENTS
A. DEPOSITS
Bank account and short-term investments, such as nonnegotiable certificates of deposit and money market deposit accounts, are included as deposits. In accordance with LRS 49:321, state depositing authorities shall require as security for deposit of state funds authorized bonds or other interest-bearing notes; authorized promissory notes, warrants, or certificates of indebtedness unmatured or payable on demand; or notes representing loans to students guaranteed by the Louisiana Student Financial Assistance Commission. Fair value, excluding interest, of such securities held by the depositing authority shall be equal to 100% of the amount on deposit to the credit of the depositing authority except that portion appropriately insured. Designated depositories may be granted a period not to exceed five days from the date of any deposit to post the necessary security.
The following chart presents bank deposit balances for the primary government as of June 30, 2015. Deposits are listed in terms of whether they are exposed to custodial credit risk, which is the risk that the state’s deposits may not be returned in the event of a bank failure. Deposits are exposed to custodial credit risk if they are either: a) uninsured and uncollateralized, b) uninsured and collateralized with securities held by the pledging financial institution, or c) uninsured and collateralized with securities held by the pledging financial institution’s trust department or agent but not in the name of the State.
Bank Deposit Balances (Expressed in Thousands)
Deposits Exposed to Custodial Credit RiskUninsured andCollateralized
Uninsured and with SecuritiesCollateralized Held by Pledging Total Bank Total
with Securities Institution’s Trust Balances –
CarryingUninsured and Held by
PledgingDept. or Agent but All Value – All
Uncollateralized Institution not in State’s Name Deposits Deposits Categories
Primary Gov’t & Fiduciary: Cash $ 40,756 $ 7,680 $ 26,424 $ 2,100,790 $ 2,003,754 Certificates of Deposit 1,831 383 162,211 162,163 Other 19,219 6,107 200,393 734,319 734,135
Total Bank Balances $ 61,806 $ 13,787 $ 227,200 $ 2,997,320 $ 2,900,052
B. INVESTMENTS
LRS 49:327 authorizes the State Treasurer to invest available monies in direct Treasury obligations, government agency obligations, corporate bonds, perfected repurchase agreements, and reverse repurchase agreements, time certificates of deposit in specified banks, savings accounts or shares of certain savings and loan associations and savings banks, or in share accounts and share certificate accounts of certain credit unions. Such securities shall not have weighted-average maturities in excess of five years from the purchase date, except monies invested from special funds (those not considered general funds) which shall not exceed 10 years from the date of purchase. Repurchase Agreements must be collateralized by the pledge of securities at 102%. Funds not on deposit in the State Treasury are authorized to be invested in time certificates of deposit of specified banks, in savings accounts or shares of specified savings and loan associations and savings banks, or in share accounts and share certificate accounts of specified credit unions. Funds determined to be available for investment for less than 30 days are authorized to be invested in direct United States Treasury obligations that mature in not more than 29 days after the date of purchase. These funds are also required to be fully insured or collateralized.
Because of limited maturity dates, availability of securities, and yield, perfected repurchase agreements are entered into for short-term management purposes. LRS 49:341 - 343 grants defined public entities the authority to invest bond proceeds and monies held in any fund established in connection with bonds in any direct obligation of, or obligation guaranteed by, the United States and in tax-exempt bonds until proceeds are required to be expended for the purpose of the issue.
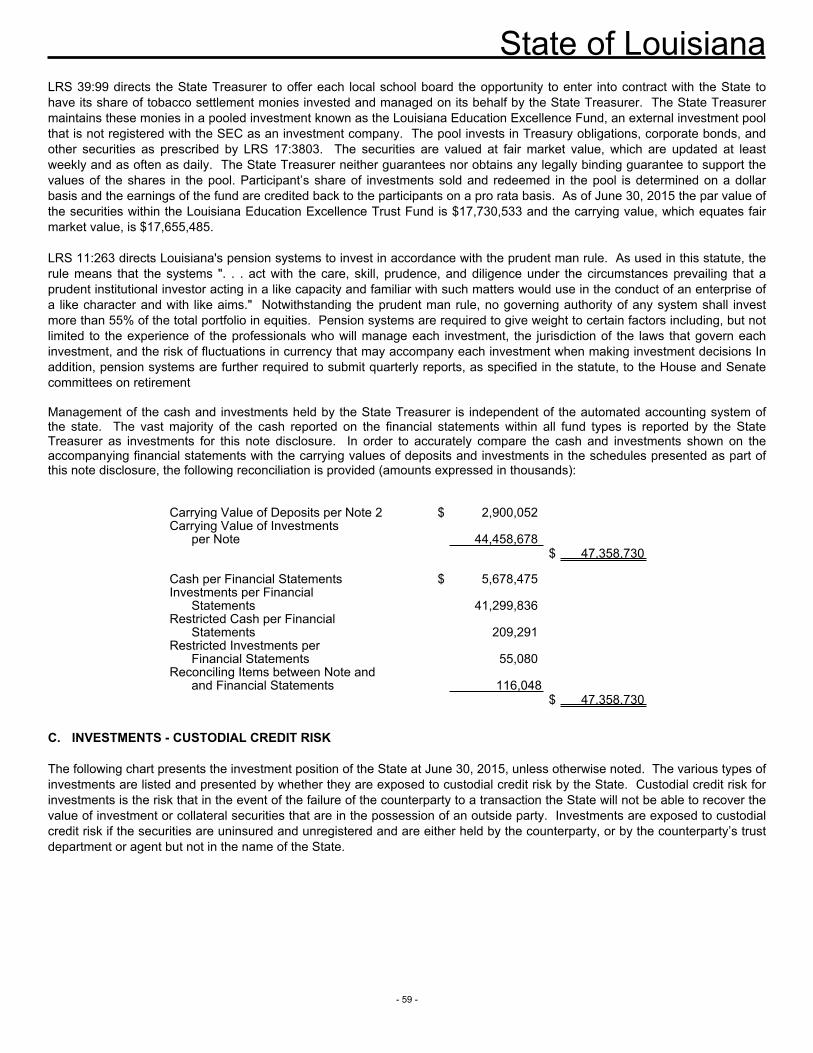
State of Louisiana
- 59 -
LRS 39:99 directs the State Treasurer to offer each local school board the opportunity to enter into contract with the State to have its share of tobacco settlement monies invested and managed on its behalf by the State Treasurer. The State Treasurer maintains these monies in a pooled investment known as the Louisiana Education Excellence Fund, an external investment pool that is not registered with the SEC as an investment company. The pool invests in Treasury obligations, corporate bonds, and other securities as prescribed by LRS 17:3803. The securities are valued at fair market value, which are updated at least weekly and as often as daily. The State Treasurer neither guarantees nor obtains any legally binding guarantee to support the values of the shares in the pool. Participant’s share of investments sold and redeemed in the pool is determined on a dollar basis and the earnings of the fund are credited back to the participants on a pro rata basis. As of June 30, 2015 the par value of the securities within the Louisiana Education Excellence Trust Fund is $17,730,533 and the carrying value, which equates fair market value, is $17,655,485.
LRS 11:263 directs Louisiana's pension systems to invest in accordance with the prudent man rule. As used in this statute, the rule means that the systems ". . . act with the care, skill, prudence, and diligence under the circumstances prevailing that a prudent institutional investor acting in a like capacity and familiar with such matters would use in the conduct of an enterprise of a like character and with like aims." Notwithstanding the prudent man rule, no governing authority of any system shall invest more than 55% of the total portfolio in equities. Pension systems are required to give weight to certain factors including, but not limited to the experience of the professionals who will manage each investment, the jurisdiction of the laws that govern each investment, and the risk of fluctuations in currency that may accompany each investment when making investment decisions In addition, pension systems are further required to submit quarterly reports, as specified in the statute, to the House and Senate committees on retirement
Management of the cash and investments held by the State Treasurer is independent of the automated accounting system of the state. The vast majority of the cash reported on the financial statements within all fund types is reported by the State Treasurer as investments for this note disclosure. In order to accurately compare the cash and investments shown on the accompanying financial statements with the carrying values of deposits and investments in the schedules presented as part of this note disclosure, the following reconciliation is provided (amounts expressed in thousands):
Carrying Value of Deposits per Note 2 $ 2,900,052Carrying Value of Investments
per Note 44,458,678$ 47,358,730
Cash per Financial Statements $ 5,678,475Investments per Financial
Statements 41,299,836Restricted Cash per Financial
Statements 209,291Restricted Investments per
Financial Statements 55,080Reconciling Items between Note and
and Financial Statements 116,048$ 47,358,730
C. INVESTMENTS - CUSTODIAL CREDIT RISK
The following chart presents the investment position of the State at June 30, 2015, unless otherwise noted. The various types of investments are listed and presented by whether they are exposed to custodial credit risk by the State. Custodial credit risk for investments is the risk that in the event of the failure of the counterparty to a transaction the State will not be able to recover the value of investment or collateral securities that are in the possession of an outside party. Investments are exposed to custodial credit risk if the securities are uninsured and unregistered and are either held by the counterparty, or by the counterparty’s trust department or agent but not in the name of the State.
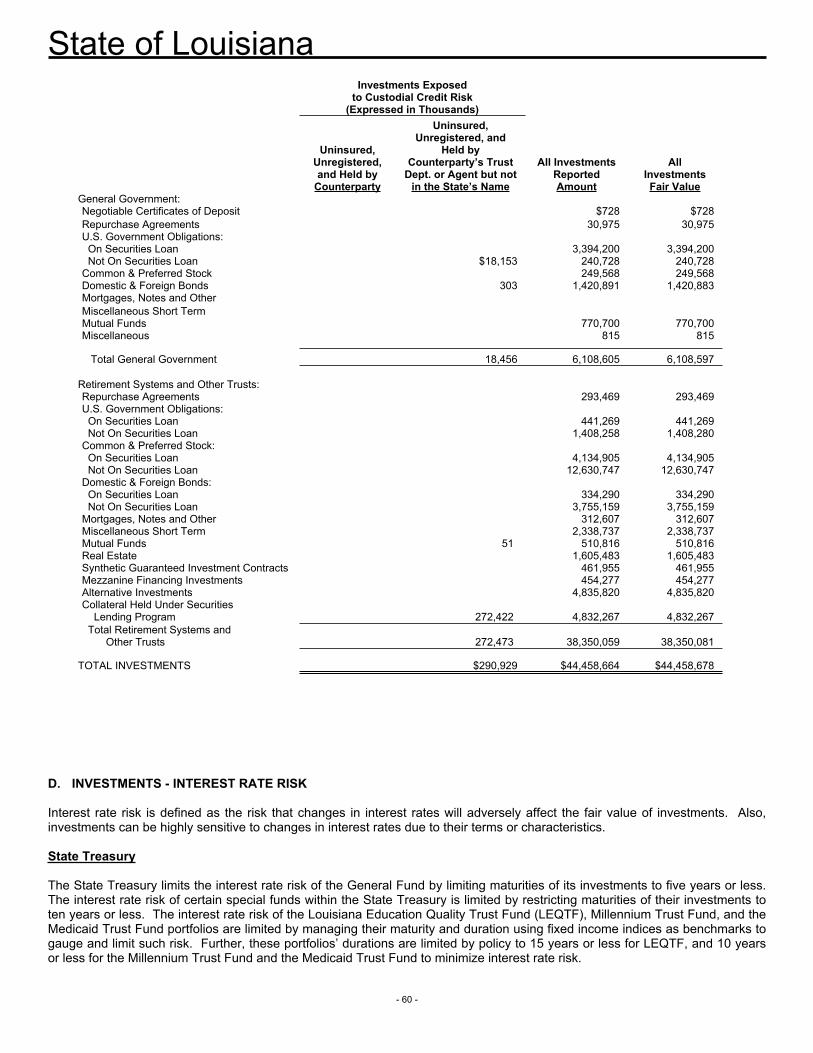
State of Louisiana
- 60 -
Investments Exposedto Custodial Credit Risk
(Expressed in Thousands)
Uninsured, Unregistered, and Held by
Counterparty
Uninsured, Unregistered, and
Held by Counterparty’s Trust
Dept. or Agent but not in the State’s Name
All Investments ReportedAmount
All Investments Fair Value
General Government:Negotiable Certificates of Deposit $728 $728Repurchase Agreements 30,975 30,975U.S. Government Obligations:
On Securities Loan 3,394,200 3,394,200Not On Securities Loan $18,153 240,728 240,728
Common & Preferred Stock 249,568 249,568Domestic & Foreign Bonds 303 1,420,891 1,420,883Mortgages, Notes and OtherMiscellaneous Short TermMutual Funds 770,700 770,700Miscellaneous 815 815
Total General Government 18,456 6,108,605 6,108,597
Retirement Systems and Other Trusts:Repurchase Agreements 293,469 293,469U.S. Government Obligations:
On Securities Loan 441,269 441,269Not On Securities Loan 1,408,258 1,408,280
Common & Preferred Stock:On Securities Loan 4,134,905 4,134,905Not On Securities Loan 12,630,747 12,630,747
Domestic & Foreign Bonds:On Securities Loan 334,290 334,290Not On Securities Loan 3,755,159 3,755,159
Mortgages, Notes and Other 312,607 312,607Miscellaneous Short Term 2,338,737 2,338,737Mutual Funds 51 510,816 510,816Real Estate 1,605,483 1,605,483Synthetic Guaranteed Investment Contracts 461,955 461,955Mezzanine Financing Investments 454,277 454,277Alternative Investments 4,835,820 4,835,820Collateral Held Under Securities
Lending Program 272,422 4,832,267 4,832,267Total Retirement Systems and
Other Trusts 272,473 38,350,059 38,350,081
TOTAL INVESTMENTS $290,929 $44,458,664 $44,458,678
D. INVESTMENTS - INTEREST RATE RISK
Interest rate risk is defined as the risk that changes in interest rates will adversely affect the fair value of investments. Also, investments can be highly sensitive to changes in interest rates due to their terms or characteristics.
State Treasury
The State Treasury limits the interest rate risk of the General Fund by limiting maturities of its investments to five years or less. The interest rate risk of certain special funds within the State Treasury is limited by restricting maturities of their investments to ten years or less. The interest rate risk of the Louisiana Education Quality Trust Fund (LEQTF), Millennium Trust Fund, and the Medicaid Trust Fund portfolios are limited by managing their maturity and duration using fixed income indices as benchmarks to gauge and limit such risk. Further, these portfolios’ durations are limited by policy to 15 years or less for LEQTF, and 10 years or less for the Millennium Trust Fund and the Medicaid Trust Fund to minimize interest rate risk.
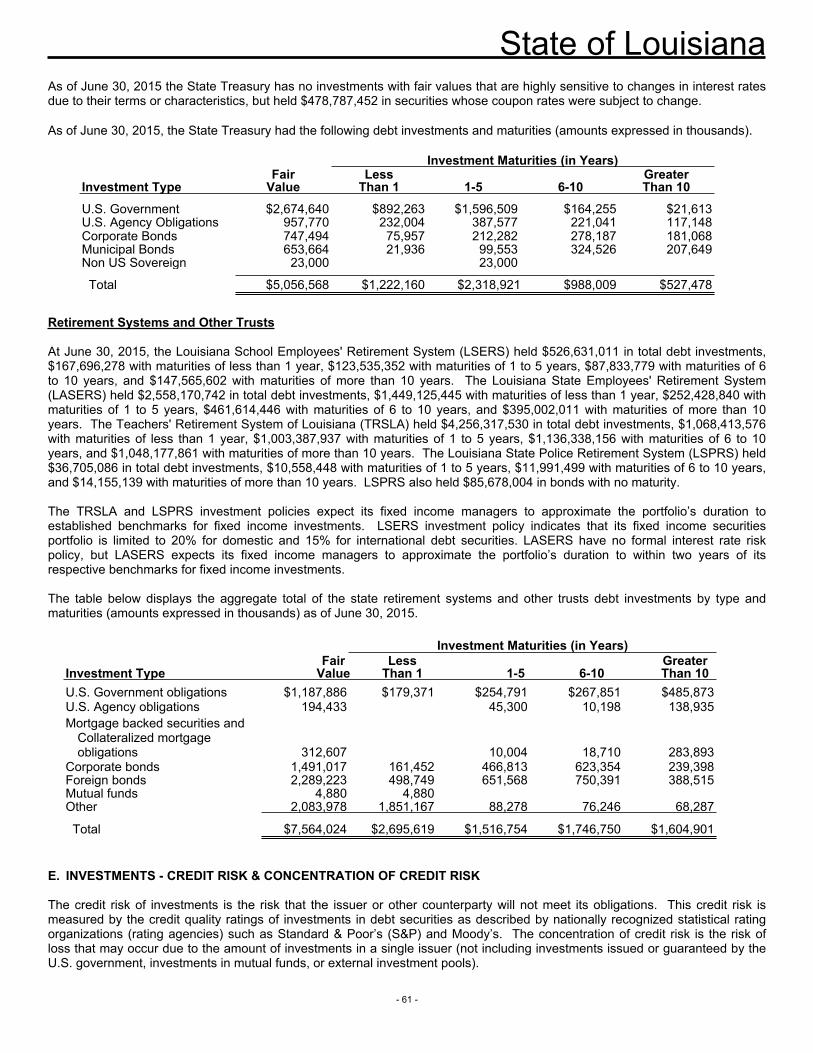
State of Louisiana
- 61 -
As of June 30, 2015 the State Treasury has no investments with fair values that are highly sensitive to changes in interest rates due to their terms or characteristics, but held $478,787,452 in securities whose coupon rates were subject to change.
As of June 30, 2015, the State Treasury had the following debt investments and maturities (amounts expressed in thousands).
Investment Maturities (in Years)Fair Less Greater
Investment Type Value Than 1 1-5 6-10 Than 10U.S. Government Obligations
$2,674,640 $892,263 $1,596,509 $164,255 $21,613U.S. Agency Obligations 957,770 232,004 387,577 221,041 117,148Corporate Bonds 747,494 75,957 212,282 278,187 181,068Municipal Bonds 653,664 21,936 99,553 324,526 207,649Non US Sovereign Securities
23,000 23,000
Total $5,056,568 $1,222,160 $2,318,921 $988,009 $527,478
Retirement Systems and Other Trusts
At June 30, 2015, the Louisiana School Employees' Retirement System (LSERS) held $526,631,011 in total debt investments, $167,696,278 with maturities of less than 1 year, $123,535,352 with maturities of 1 to 5 years, $87,833,779 with maturities of 6 to 10 years, and $147,565,602 with maturities of more than 10 years. The Louisiana State Employees' Retirement System (LASERS) held $2,558,170,742 in total debt investments, $1,449,125,445 with maturities of less than 1 year, $252,428,840 with maturities of 1 to 5 years, $461,614,446 with maturities of 6 to 10 years, and $395,002,011 with maturities of more than 10 years. The Teachers' Retirement System of Louisiana (TRSLA) held $4,256,317,530 in total debt investments, $1,068,413,576 with maturities of less than 1 year, $1,003,387,937 with maturities of 1 to 5 years, $1,136,338,156 with maturities of 6 to 10 years, and $1,048,177,861 with maturities of more than 10 years. The Louisiana State Police Retirement System (LSPRS) held $36,705,086 in total debt investments, $10,558,448 with maturities of 1 to 5 years, $11,991,499 with maturities of 6 to 10 years, and $14,155,139 with maturities of more than 10 years. LSPRS also held $85,678,004 in bonds with no maturity.
The TRSLA and LSPRS investment policies expect its fixed income managers to approximate the portfolio’s duration to established benchmarks for fixed income investments. LSERS investment policy indicates that its fixed income securities portfolio is limited to 20% for domestic and 15% for international debt securities. LASERS have no formal interest rate risk policy, but LASERS expects its fixed income managers to approximate the portfolio’s duration to within two years of its respective benchmarks for fixed income investments.
The table below displays the aggregate total of the state retirement systems and other trusts debt investments by type and maturities (amounts expressed in thousands) as of June 30, 2015.
Investment Maturities (in Years)Fair Less Greater
Investment Type Value Than 1 1-5 6-10 Than 10U.S. Government obligations $1,187,886 $179,371 $254,791 $267,851 $485,873U.S. Agency obligations 194,433 45,300 10,198 138,935Mortgage backed securities and
Collateralized mortgage obligations 312,607 10,004 18,710 283,893
Corporate bonds 1,491,017 161,452 466,813 623,354 239,398Foreign bonds 2,289,223 498,749 651,568 750,391 388,515Mutual funds 4,880 4,880Other 2,083,978 1,851,167 88,278 76,246 68,287
Total $7,564,024 $2,695,619 $1,516,754 $1,746,750 $1,604,901
E. INVESTMENTS - CREDIT RISK & CONCENTRATION OF CREDIT RISK
The credit risk of investments is the risk that the issuer or other counterparty will not meet its obligations. This credit risk is measured by the credit quality ratings of investments in debt securities as described by nationally recognized statistical rating organizations (rating agencies) such as Standard & Poor’s (S&P) and Moody’s. The concentration of credit risk is the risk of loss that may occur due to the amount of investments in a single issuer (not including investments issued or guaranteed by the U.S. government, investments in mutual funds, or external investment pools).
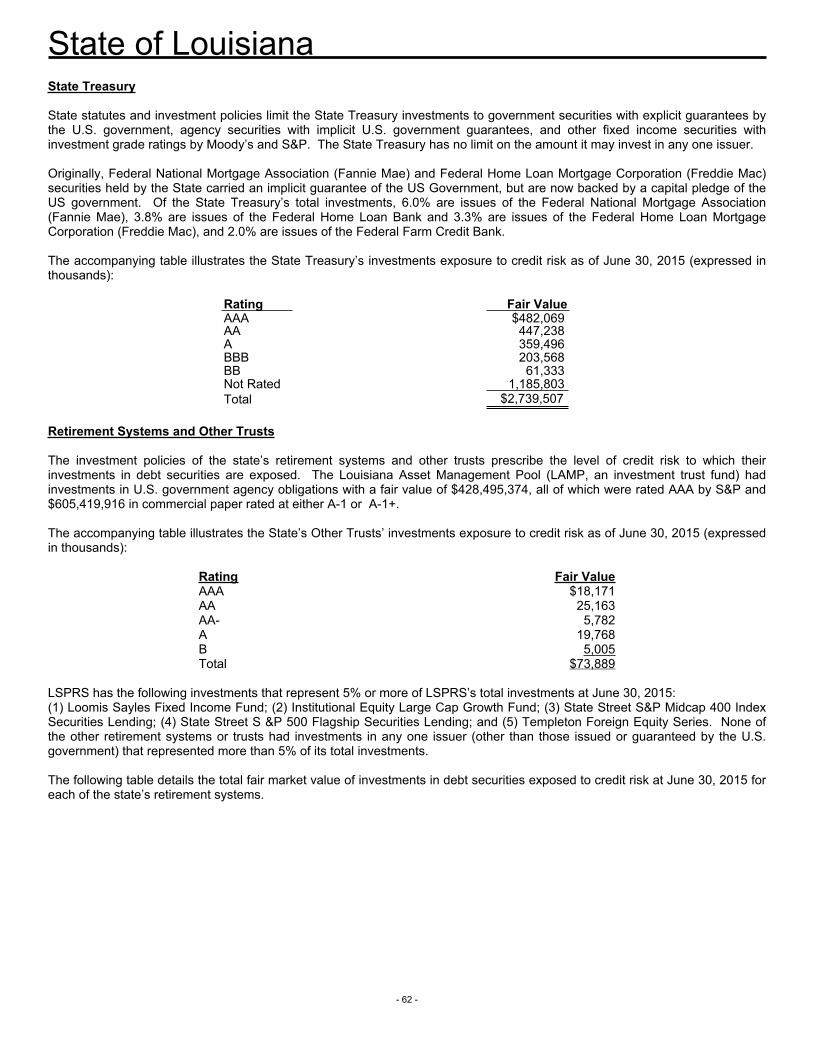
State of Louisiana
- 62 -
State Treasury
State statutes and investment policies limit the State Treasury investments to government securities with explicit guarantees by the U.S. government, agency securities with implicit U.S. government guarantees, and other fixed income securities with investment grade ratings by Moody’s and S&P. The State Treasury has no limit on the amount it may invest in any one issuer.
Originally, Federal National Mortgage Association (Fannie Mae) and Federal Home Loan Mortgage Corporation (Freddie Mac) securities held by the State carried an implicit guarantee of the US Government, but are now backed by a capital pledge of the US government. Of the State Treasury’s total investments, 6.0% are issues of the Federal National Mortgage Association (Fannie Mae), 3.8% are issues of the Federal Home Loan Bank and 3.3% are issues of the Federal Home Loan Mortgage Corporation (Freddie Mac), and 2.0% are issues of the Federal Farm Credit Bank.
The accompanying table illustrates the State Treasury’s investments exposure to credit risk as of June 30, 2015 (expressed in thousands):
Rating Fair ValueAAA $482,069
AA 447,238A 359,496BBB 203,568BB 61,333Not Rated 1,185,803Total $2,739,507
Retirement Systems and Other Trusts
The investment policies of the state’s retirement systems and other trusts prescribe the level of credit risk to which their investments in debt securities are exposed. The Louisiana Asset Management Pool (LAMP, an investment trust fund) had investments in U.S. government agency obligations with a fair value of $428,495,374, all of which were rated AAA by S&P and $605,419,916 in commercial paper rated at either A-1 or A-1+.
The accompanying table illustrates the State’s Other Trusts’ investments exposure to credit risk as of June 30, 2015 (expressed in thousands):
Rating Fair ValueAAA $18,171AA 25,163AA- 5,782A 19,768B 5,005Total $73,889
LSPRS has the following investments that represent 5% or more of LSPRS’s total investments at June 30, 2015:(1) Loomis Sayles Fixed Income Fund; (2) Institutional Equity Large Cap Growth Fund; (3) State Street S&P Midcap 400 Index Securities Lending; (4) State Street S &P 500 Flagship Securities Lending; and (5) Templeton Foreign Equity Series. None of the other retirement systems or trusts had investments in any one issuer (other than those issued or guaranteed by the U.S. government) that represented more than 5% of its total investments.
The following table details the total fair market value of investments in debt securities exposed to credit risk at June 30, 2015 for each of the state’s retirement systems.
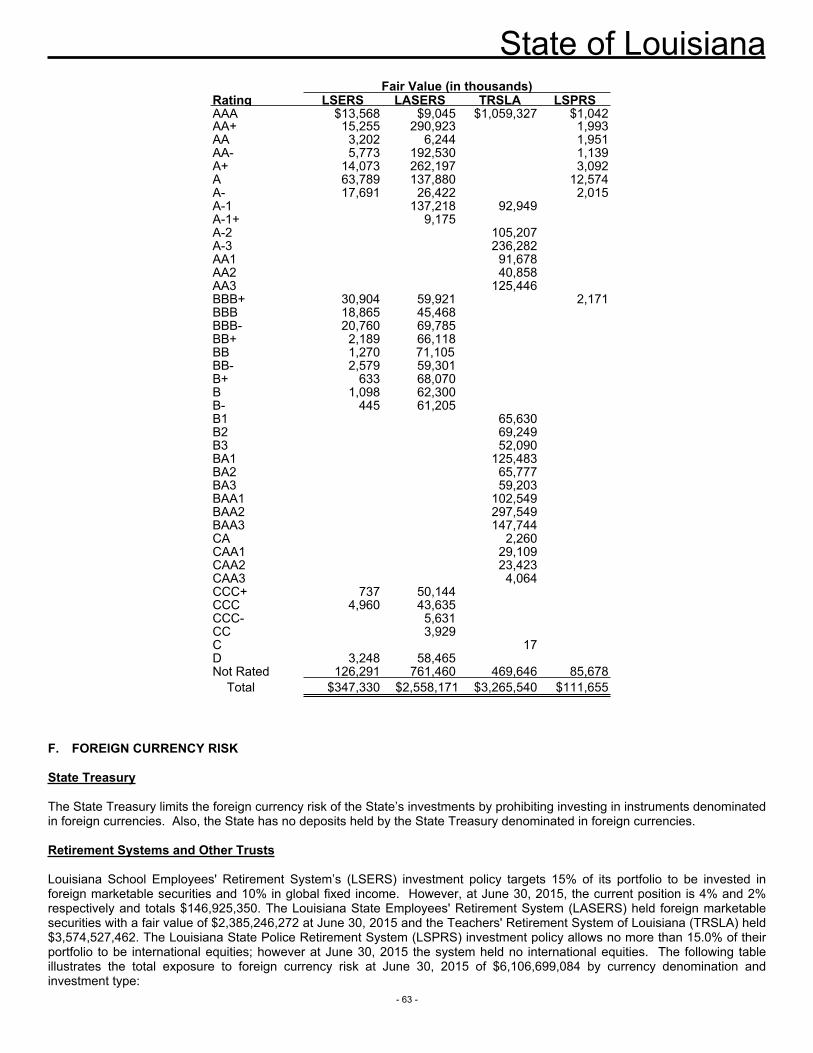
State of Louisiana
- 63 -
Fair Value (in thousands)Rating LSERS LASERS TRSLA LSPRSAAA $13,568
27,309$9,045 $1,059,327 $1,042
AA+ 15,255 290,923 1,993AA 3,202 6,244 1,951
AA- 5,773 192,530 1,139A+ 14,073 262,197 3,092A 63,789 137,880 12,574A- 17,691 26,422 2,015A-1 137,218 92,949A-1+ 9,175A-2 105,207A-3 236,282AA1 91,678AA2 40,858AA3 125,446BBB+ 30,904 59,921 2,171BBB 18,865 45,468BBB- 20,760 69,785BB+ 2,189 66,118BB 1,270 71,105 BB- 2,579 59,301B+ 633 68,070B 1,098 62,300B- 445 61,205B1 65,630B2 69,249B3 52,090BA1 125,483BA2 65,777BA3 59,203BAA1 102,549BAA2 297,549BAA3 147,744CA 2,260CAA1 29,109CAA2 23,423CAA3 4,064CCC+ 737 50,144CCC 4,960 43,635CCC- 5,631CC 3,929C 17D 3,248 58,465Not Rated 126,291 761,460 469,646 85,678
Total $347,330 $2,558,171 $3,265,540 $111,655
F. FOREIGN CURRENCY RISK
State Treasury
The State Treasury limits the foreign currency risk of the State’s investments by prohibiting investing in instruments denominated in foreign currencies. Also, the State has no deposits held by the State Treasury denominated in foreign currencies.
Retirement Systems and Other Trusts
Louisiana School Employees' Retirement System’s (LSERS) investment policy targets 15% of its portfolio to be invested in foreign marketable securities and 10% in global fixed income. However, at June 30, 2015, the current position is 4% and 2% respectively and totals $146,925,350. The Louisiana State Employees' Retirement System (LASERS) held foreign marketable securities with a fair value of $2,385,246,272 at June 30, 2015 and the Teachers' Retirement System of Louisiana (TRSLA) held $3,574,527,462. The Louisiana State Police Retirement System (LSPRS) investment policy allows no more than 15.0% of their portfolio to be international equities; however at June 30, 2015 the system held no international equities. The following table illustrates the total exposure to foreign currency risk at June 30, 2015 of $6,106,699,084 by currency denomination and investment type:
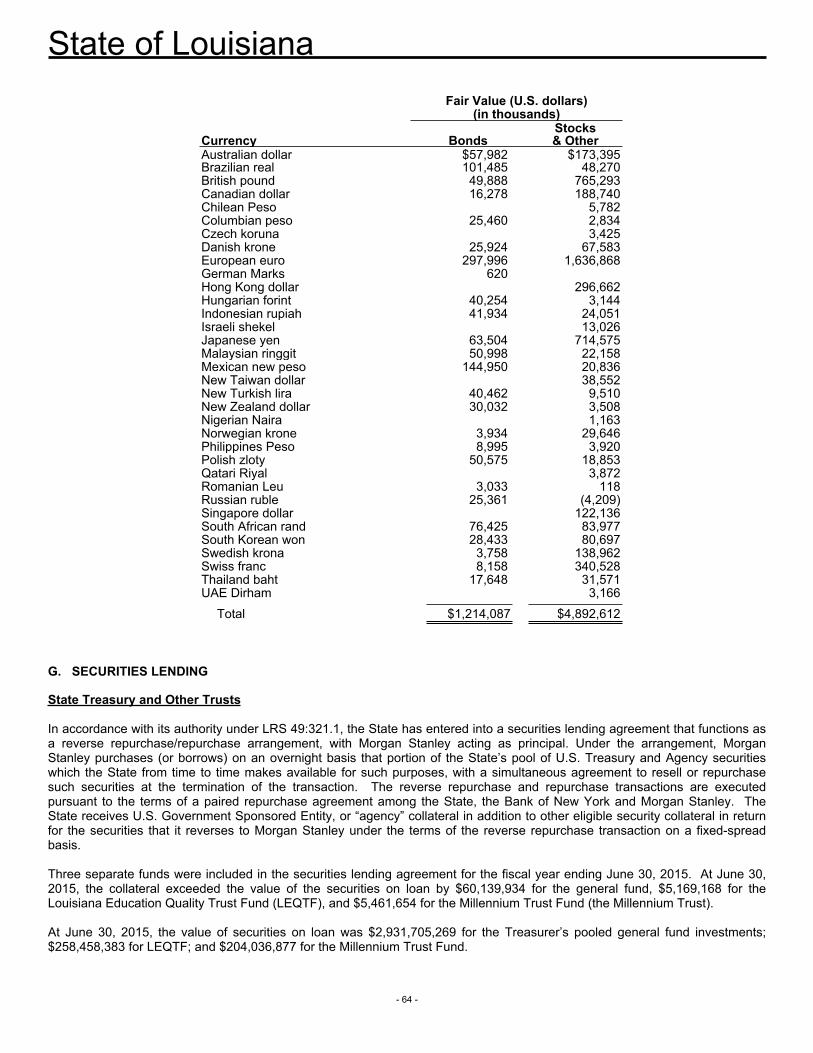
State of Louisiana
- 64 -
Fair Value (U.S. dollars)(in thousands)
) StocksCurrency Bonds & OtherAustralian dollar $57,982 $173,395 Brazilian real 101,485 48,270British pound 49,888 765,293Canadian dollar 16,278 188,740Chilean Peso 5,782
Columbian peso 25,460 2,834Czech koruna 3,425Danish krone 25,924 67,583European euro 297,996 1,636,868German Marks 620Hong Kong dollar 296,662Hungarian forint 40,254 3,144Indonesian rupiah 41,934 24,051Israeli shekel 13,026Japanese yen 63,504 714,575Malaysian ringgit 50,998 22,158Mexican new peso 144,950 20,836New Taiwan dollar 38,552New Turkish lira 40,462 9,510New Zealand dollar 30,032 3,508Nigerian Naira 1,163Norwegian krone 3,934 29,646Philippines Peso 8,995 3,920Polish zloty 50,575 18,853Qatari Riyal 3,872
Romanian Leu 3,033 118Russian ruble 25,361 (4,209)Singapore dollar 122,136South African rand 76,425 83,977South Korean won 28,433 80,697Swedish krona 3,758 138,962Swiss franc 8,158 340,528Thailand baht 17,648 31,571UAE Dirham 3,166
Total $1,214,087 $4,892,612
G. SECURITIES LENDING
State Treasury and Other Trusts
In accordance with its authority under LRS 49:321.1, the State has entered into a securities lending agreement that functions as a reverse repurchase/repurchase arrangement, with Morgan Stanley acting as principal. Under the arrangement, Morgan Stanley purchases (or borrows) on an overnight basis that portion of the State’s pool of U.S. Treasury and Agency securities which the State from time to time makes available for such purposes, with a simultaneous agreement to resell or repurchase such securities at the termination of the transaction. The reverse repurchase and repurchase transactions are executed pursuant to the terms of a paired repurchase agreement among the State, the Bank of New York and Morgan Stanley. The State receives U.S. Government Sponsored Entity, or “agency” collateral in addition to other eligible security collateral in return for the securities that it reverses to Morgan Stanley under the terms of the reverse repurchase transaction on a fixed-spread basis.
Three separate funds were included in the securities lending agreement for the fiscal year ending June 30, 2015. At June 30, 2015, the collateral exceeded the value of the securities on loan by $60,139,934 for the general fund, $5,169,168 for the Louisiana Education Quality Trust Fund (LEQTF), and $5,461,654 for the Millennium Trust Fund (the Millennium Trust).
At June 30, 2015, the value of securities on loan was $2,931,705,269 for the Treasurer’s pooled general fund investments; $258,458,383 for LEQTF; and $204,036,877 for the Millennium Trust Fund.
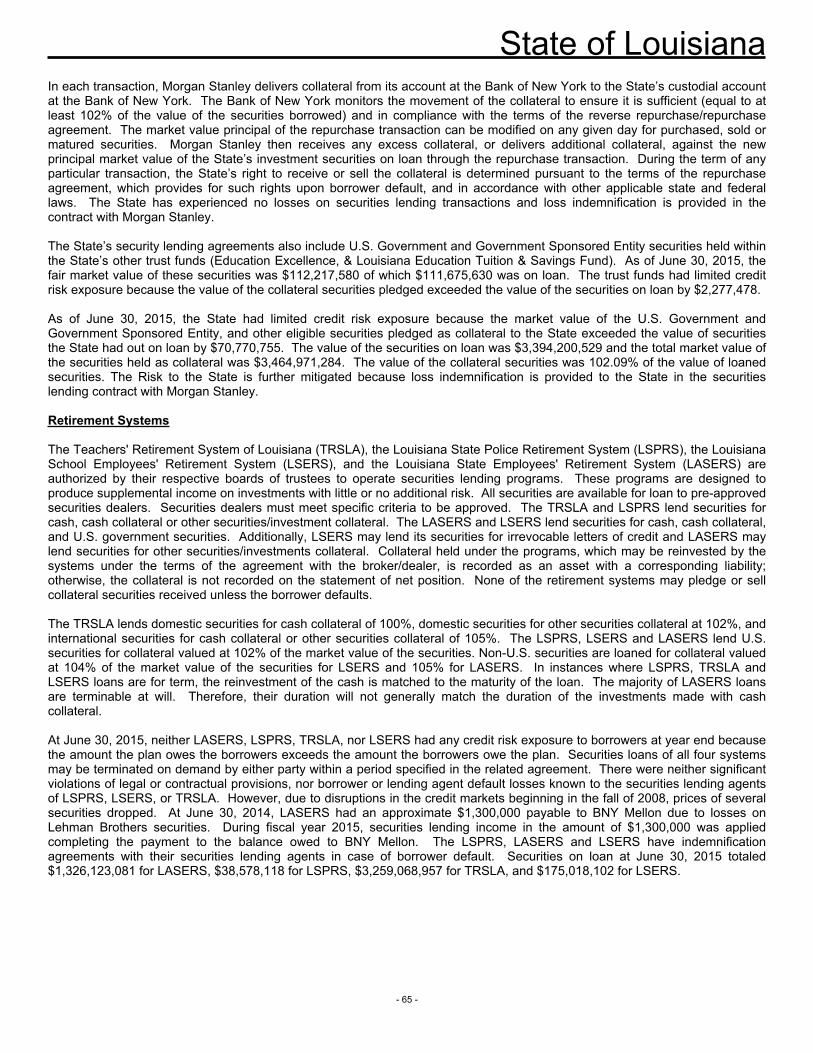
State of Louisiana
- 65 -
In each transaction, Morgan Stanley delivers collateral from its account at the Bank of New York to the State’s custodial account at the Bank of New York. The Bank of New York monitors the movement of the collateral to ensure it is sufficient (equal to at least 102% of the value of the securities borrowed) and in compliance with the terms of the reverse repurchase/repurchase agreement. The market value principal of the repurchase transaction can be modified on any given day for purchased, sold or matured securities. Morgan Stanley then receives any excess collateral, or delivers additional collateral, against the new principal market value of the State’s investment securities on loan through the repurchase transaction. During the term of any particular transaction, the State’s right to receive or sell the collateral is determined pursuant to the terms of the repurchase agreement, which provides for such rights upon borrower default, and in accordance with other applicable state and federal laws. The State has experienced no losses on securities lending transactions and loss indemnification is provided in the contract with Morgan Stanley.
The State’s security lending agreements also include U.S. Government and Government Sponsored Entity securities held within the State’s other trust funds (Education Excellence, & Louisiana Education Tuition & Savings Fund). As of June 30, 2015, the fair market value of these securities was $112,217,580 of which $111,675,630 was on loan. The trust funds had limited credit risk exposure because the value of the collateral securities pledged exceeded the value of the securities on loan by $2,277,478.
As of June 30, 2015, the State had limited credit risk exposure because the market value of the U.S. Government and Government Sponsored Entity, and other eligible securities pledged as collateral to the State exceeded the value of securities the State had out on loan by $70,770,755. The value of the securities on loan was $3,394,200,529 and the total market value of the securities held as collateral was $3,464,971,284. The value of the collateral securities was 102.09% of the value of loaned securities. The Risk to the State is further mitigated because loss indemnification is provided to the State in the securities lending contract with Morgan Stanley.
Retirement Systems
The Teachers' Retirement System of Louisiana (TRSLA), the Louisiana State Police Retirement System (LSPRS), the Louisiana School Employees' Retirement System (LSERS), and the Louisiana State Employees' Retirement System (LASERS) are authorized by their respective boards of trustees to operate securities lending programs. These programs are designed to produce supplemental income on investments with little or no additional risk. All securities are available for loan to pre-approved securities dealers. Securities dealers must meet specific criteria to be approved. The TRSLA and LSPRS lend securities for cash, cash collateral or other securities/investment collateral. The LASERS and LSERS lend securities for cash, cash collateral, and U.S. government securities. Additionally, LSERS may lend its securities for irrevocable letters of credit and LASERS may lend securities for other securities/investments collateral. Collateral held under the programs, which may be reinvested by the systems under the terms of the agreement with the broker/dealer, is recorded as an asset with a corresponding liability; otherwise, the collateral is not recorded on the statement of net position. None of the retirement systems may pledge or sell collateral securities received unless the borrower defaults.
The TRSLA lends domestic securities for cash collateral of 100%, domestic securities for other securities collateral at 102%, and international securities for cash collateral or other securities collateral of 105%. The LSPRS, LSERS and LASERS lend U.S. securities for collateral valued at 102% of the market value of the securities. Non-U.S. securities are loaned for collateral valued at 104% of the market value of the securities for LSERS and 105% for LASERS. In instances where LSPRS, TRSLA and LSERS loans are for term, the reinvestment of the cash is matched to the maturity of the loan. The majority of LASERS loans are terminable at will. Therefore, their duration will not generally match the duration of the investments made with cash collateral.
At June 30, 2015, neither LASERS, LSPRS, TRSLA, nor LSERS had any credit risk exposure to borrowers at year end because the amount the plan owes the borrowers exceeds the amount the borrowers owe the plan. Securities loans of all four systems may be terminated on demand by either party within a period specified in the related agreement. There were neither significant violations of legal or contractual provisions, nor borrower or lending agent default losses known to the securities lending agents of LSPRS, LSERS, or TRSLA. However, due to disruptions in the credit markets beginning in the fall of 2008, prices of several securities dropped. At June 30, 2014, LASERS had an approximate $1,300,000 payable to BNY Mellon due to losses on Lehman Brothers securities. During fiscal year 2015, securities lending income in the amount of $1,300,000 was applied completing the payment to the balance owed to BNY Mellon. The LSPRS, LASERS and LSERS have indemnification agreements with their securities lending agents in case of borrower default. Securities on loan at June 30, 2015 totaled $1,326,123,081 for LASERS, $38,578,118 for LSPRS, $3,259,068,957 for TRSLA, and $175,018,102 for LSERS.
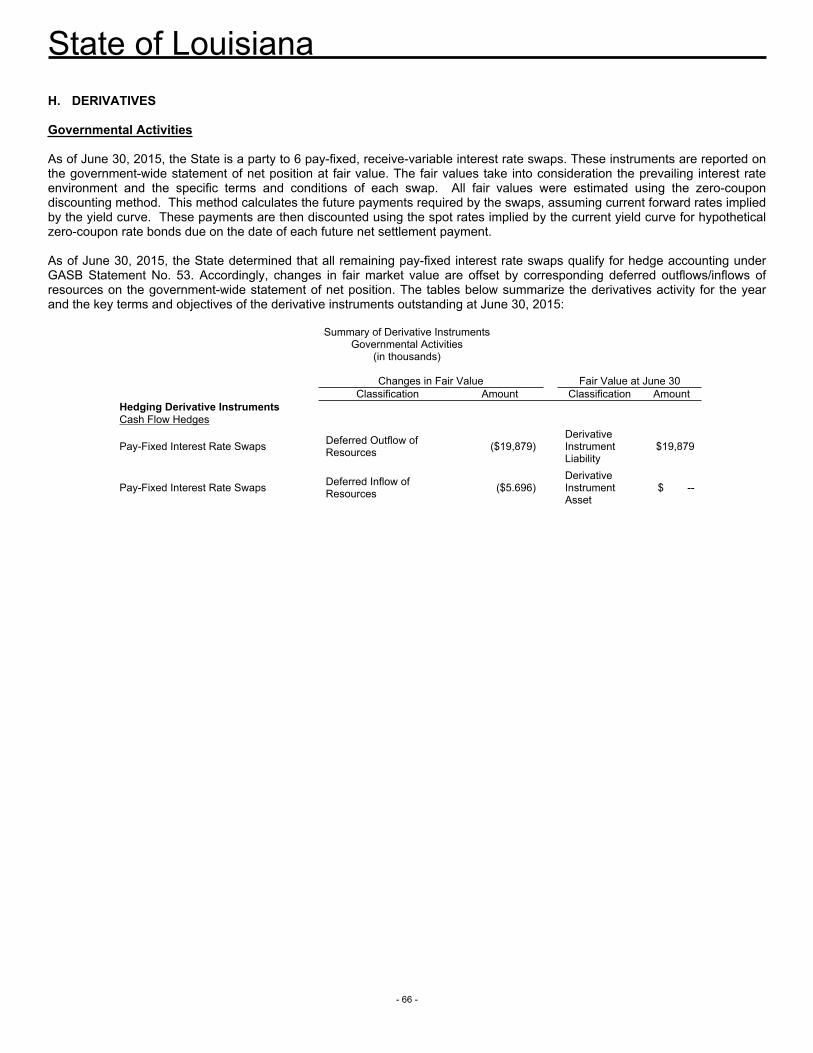
State of Louisiana
- 66 -
H. DERIVATIVES
Governmental Activities
As of June 30, 2015, the State is a party to 6 pay-fixed, receive-variable interest rate swaps. These instruments are reported on the government-wide statement of net position at fair value. The fair values take into consideration the prevailing interest rate environment and the specific terms and conditions of each swap. All fair values were estimated using the zero-coupon discounting method. This method calculates the future payments required by the swaps, assuming current forward rates implied by the yield curve. These payments are then discounted using the spot rates implied by the current yield curve for hypothetical zero-coupon rate bonds due on the date of each future net settlement payment.
As of June 30, 2015, the State determined that all remaining pay-fixed interest rate swaps qualify for hedge accounting under GASB Statement No. 53. Accordingly, changes in fair market value are offset by corresponding deferred outflows/inflows of resources on the government-wide statement of net position. The tables below summarize the derivatives activity for the year and the key terms and objectives of the derivative instruments outstanding at June 30, 2015:
Summary of Derivative InstrumentsGovernmental Activities
(in thousands)
Changes in Fair Value Fair Value at June 30Classification Amount Classification Amount
Hedging Derivative InstrumentsCash Flow Hedges
Pay-Fixed Interest Rate Swaps Deferred Outflow of Resources ($19,879)
Derivative Instrument Liability
$19,879
Pay-Fixed Interest Rate Swaps Deferred Inflow of Resources ($5.696)
Derivative Instrument Asset
$ --
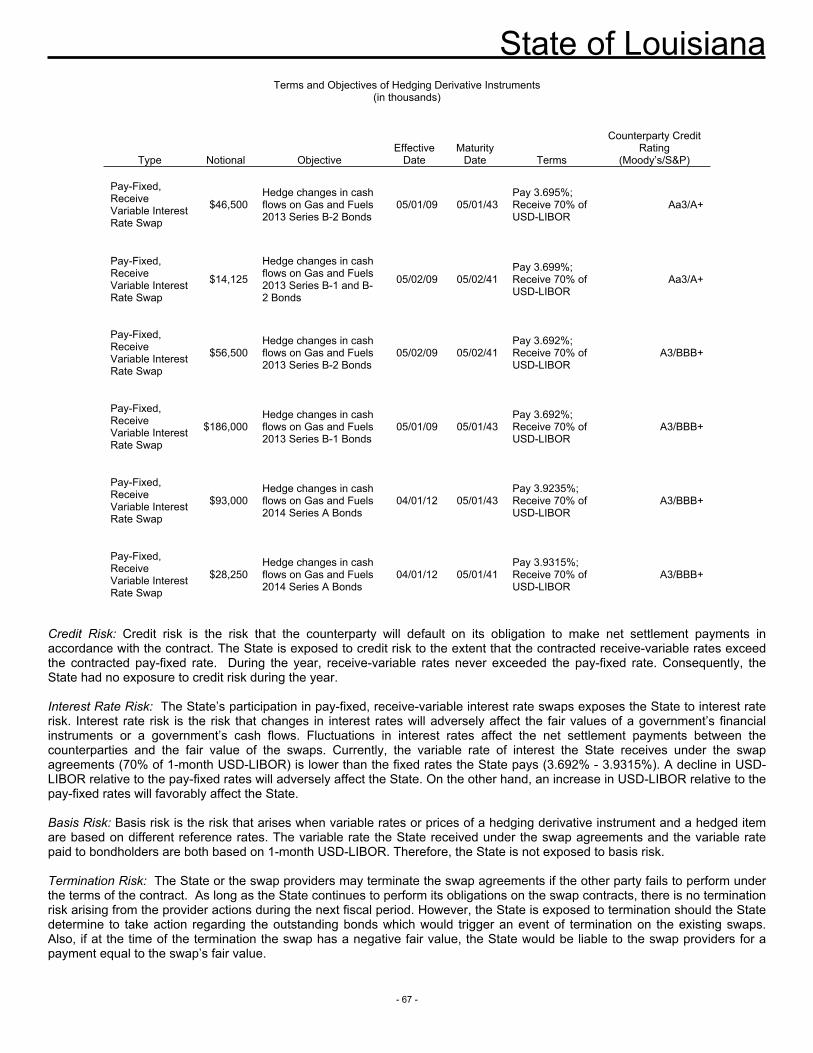
State of Louisiana
- 67 -
Terms and Objectives of Hedging Derivative Instruments(in thousands)
Type Notional ObjectiveEffective
DateMaturity
Date Terms
Counterparty Credit Rating
(Moody’s/S&P)
Pay-Fixed, Receive Variable Interest Rate Swap
$46,500Hedge changes in cash flows on Gas and Fuels 2013 Series B-2 Bonds
05/01/09 05/01/43Pay 3.695%; Receive 70% of USD-LIBOR
Aa3/A+
Pay-Fixed, Receive Variable Interest Rate Swap
$14,125
Hedge changes in cash flows on Gas and Fuels 2013 Series B-1 and B-2 Bonds
05/02/09 05/02/41Pay 3.699%; Receive 70% of USD-LIBOR
Aa3/A+
Pay-Fixed, Receive Variable Interest Rate Swap
$56,500Hedge changes in cash flows on Gas and Fuels 2013 Series B-2 Bonds
05/02/09 05/02/41Pay 3.692%; Receive 70% of USD-LIBOR
A3/BBB+
Pay-Fixed, Receive Variable Interest Rate Swap
$186,000Hedge changes in cash flows on Gas and Fuels 2013 Series B-1 Bonds
05/01/09 05/01/43Pay 3.692%; Receive 70% of USD-LIBOR
A3/BBB+
Pay-Fixed, Receive Variable Interest Rate Swap
$93,000Hedge changes in cash flows on Gas and Fuels 2014 Series A Bonds
04/01/12 05/01/43Pay 3.9235%; Receive 70% of USD-LIBOR
A3/BBB+
Pay-Fixed, Receive Variable Interest Rate Swap
$28,250Hedge changes in cash flows on Gas and Fuels 2014 Series A Bonds
04/01/12 05/01/41Pay 3.9315%; Receive 70% of USD-LIBOR
A3/BBB+
Credit Risk: Credit risk is the risk that the counterparty will default on its obligation to make net settlement payments in accordance with the contract. The State is exposed to credit risk to the extent that the contracted receive-variable rates exceed the contracted pay-fixed rate. During the year, receive-variable rates never exceeded the pay-fixed rate. Consequently, the State had no exposure to credit risk during the year.
Interest Rate Risk: The State’s participation in pay-fixed, receive-variable interest rate swaps exposes the State to interest rate risk. Interest rate risk is the risk that changes in interest rates will adversely affect the fair values of a government’s financial instruments or a government’s cash flows. Fluctuations in interest rates affect the net settlement payments between the counterparties and the fair value of the swaps. Currently, the variable rate of interest the State receives under the swap agreements (70% of 1-month USD-LIBOR) is lower than the fixed rates the State pays (3.692% - 3.9315%). A decline in USD-LIBOR relative to the pay-fixed rates will adversely affect the State. On the other hand, an increase in USD-LIBOR relative to the pay-fixed rates will favorably affect the State.
Basis Risk: Basis risk is the risk that arises when variable rates or prices of a hedging derivative instrument and a hedged item are based on different reference rates. The variable rate the State received under the swap agreements and the variable rate paid to bondholders are both based on 1-month USD-LIBOR. Therefore, the State is not exposed to basis risk.
Termination Risk: The State or the swap providers may terminate the swap agreements if the other party fails to perform under the terms of the contract. As long as the State continues to perform its obligations on the swap contracts, there is no termination risk arising from the provider actions during the next fiscal period. However, the State is exposed to termination should the State determine to take action regarding the outstanding bonds which would trigger an event of termination on the existing swaps. Also, if at the time of the termination the swap has a negative fair value, the State would be liable to the swap providers for a payment equal to the swap’s fair value.
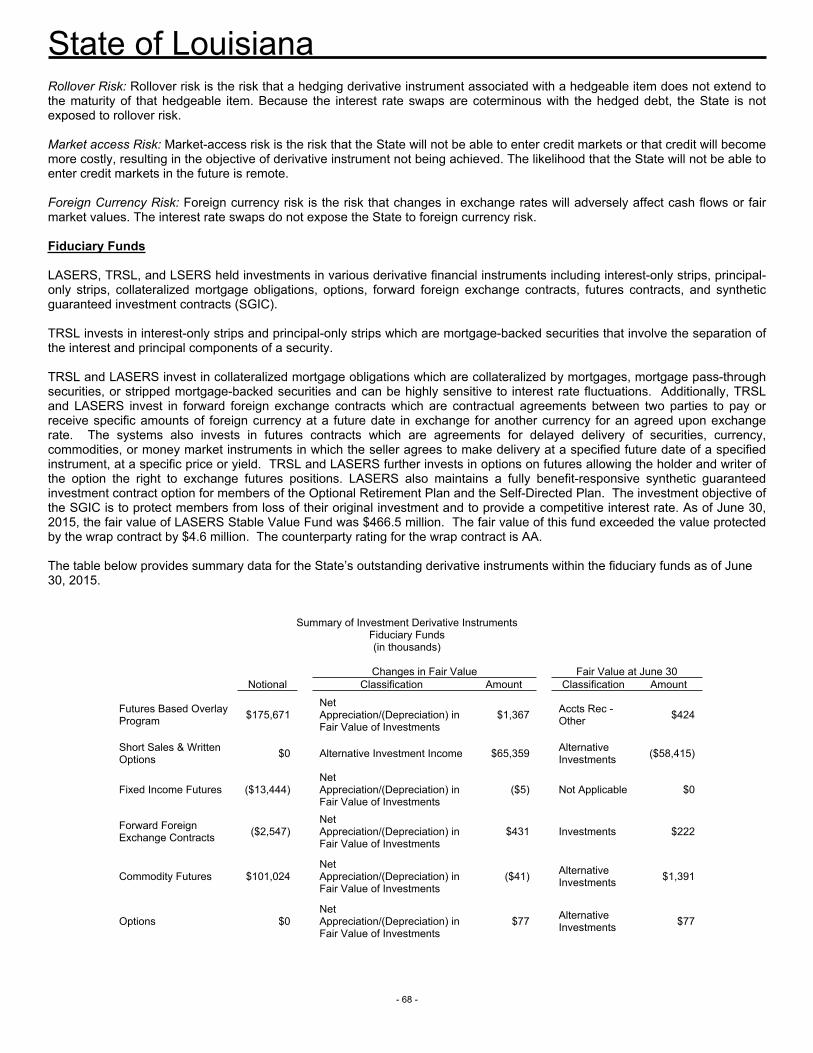
State of Louisiana
- 68 -
Rollover Risk: Rollover risk is the risk that a hedging derivative instrument associated with a hedgeable item does not extend to the maturity of that hedgeable item. Because the interest rate swaps are coterminous with the hedged debt, the State is not exposed to rollover risk.
Market access Risk: Market-access risk is the risk that the State will not be able to enter credit markets or that credit will become more costly, resulting in the objective of derivative instrument not being achieved. The likelihood that the State will not be able to enter credit markets in the future is remote.
Foreign Currency Risk: Foreign currency risk is the risk that changes in exchange rates will adversely affect cash flows or fair market values. The interest rate swaps do not expose the State to foreign currency risk.
Fiduciary Funds
LASERS, TRSL, and LSERS held investments in various derivative financial instruments including interest-only strips, principal-only strips, collateralized mortgage obligations, options, forward foreign exchange contracts, futures contracts, and synthetic guaranteed investment contracts (SGIC).
TRSL invests in interest-only strips and principal-only strips which are mortgage-backed securities that involve the separation of the interest and principal components of a security.
TRSL and LASERS invest in collateralized mortgage obligations which are collateralized by mortgages, mortgage pass-through securities, or stripped mortgage-backed securities and can be highly sensitive to interest rate fluctuations. Additionally, TRSL and LASERS invest in forward foreign exchange contracts which are contractual agreements between two parties to pay or receive specific amounts of foreign currency at a future date in exchange for another currency for an agreed upon exchange rate. The systems also invests in futures contracts which are agreements for delayed delivery of securities, currency, commodities, or money market instruments in which the seller agrees to make delivery at a specified future date of a specified instrument, at a specific price or yield. TRSL and LASERS further invests in options on futures allowing the holder and writer of the option the right to exchange futures positions. LASERS also maintains a fully benefit-responsive synthetic guaranteed investment contract option for members of the Optional Retirement Plan and the Self-Directed Plan. The investment objective of the SGIC is to protect members from loss of their original investment and to provide a competitive interest rate. As of June 30, 2015, the fair value of LASERS Stable Value Fund was $466.5 million. The fair value of this fund exceeded the value protected by the wrap contract by $4.6 million. The counterparty rating for the wrap contract is AA.
The table below provides summary data for the State’s outstanding derivative instruments within the fiduciary funds as of June 30, 2015.
Summary of Investment Derivative InstrumentsFiduciary Funds(in thousands)
Changes in Fair Value Fair Value at June 30Notional Classification Amount Classification Amount
Futures Based Overlay Program $175,671
Net Appreciation/(Depreciation) in Fair Value of Investments
$1,367 Accts Rec - Other $424
Short Sales & Written Options $0 Alternative Investment Income $65,359 Alternative
Investments ($58,415)
Fixed Income Futures ($13,444)Net Appreciation/(Depreciation) in Fair Value of Investments
($5) Not Applicable $0
Forward Foreign Exchange Contracts ($2,547)
Net Appreciation/(Depreciation) in Fair Value of Investments
$431 Investments $222
Commodity Futures $101,024Net Appreciation/(Depreciation) in Fair Value of Investments
($41) Alternative Investments $1,391
Options $0Net Appreciation/(Depreciation) in Fair Value of Investments
$77 Alternative Investments $77
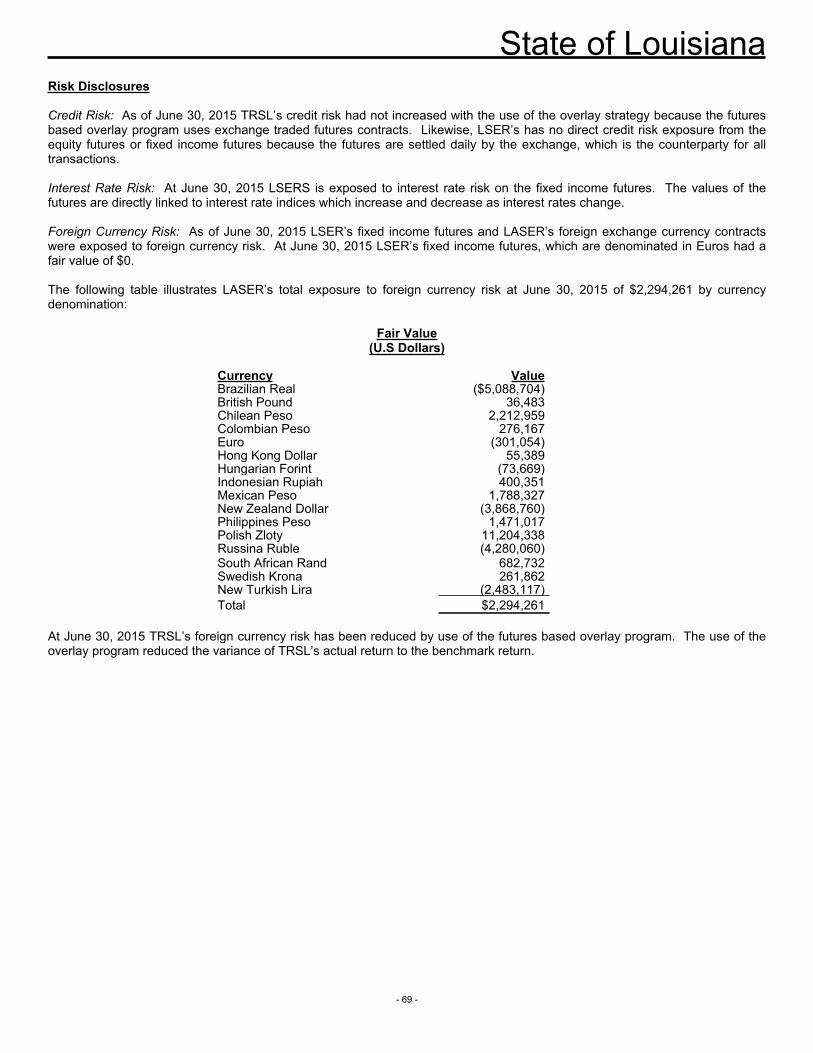
State of Louisiana
- 69 -
Risk Disclosures
Credit Risk: As of June 30, 2015 TRSL’s credit risk had not increased with the use of the overlay strategy because the futures based overlay program uses exchange traded futures contracts. Likewise, LSER’s has no direct credit risk exposure from the equity futures or fixed income futures because the futures are settled daily by the exchange, which is the counterparty for all transactions.
Interest Rate Risk: At June 30, 2015 LSERS is exposed to interest rate risk on the fixed income futures. The values of the futures are directly linked to interest rate indices which increase and decrease as interest rates change.
Foreign Currency Risk: As of June 30, 2015 LSER’s fixed income futures and LASER’s foreign exchange currency contracts were exposed to foreign currency risk. At June 30, 2015 LSER’s fixed income futures, which are denominated in Euros had a fair value of $0.
The following table illustrates LASER’s total exposure to foreign currency risk at June 30, 2015 of $2,294,261 by currency denomination:
Fair Value (U.S Dollars)
Currency ValueBrazilian Real ($5,088,704)British Pound 36,483Chilean Peso 2,212,959Colombian Peso 276,167Euro (301,054)Hong Kong Dollar 55,389Hungarian Forint (73,669)Indonesian Rupiah 400,351Mexican Peso 1,788,327New Zealand Dollar (3,868,760)Philippines Peso 1,471,017Polish Zloty 11,204,338Russina Ruble (4,280,060)South African Rand 682,732Swedish Krona 261,862New Turkish Lira (2,483,117)Total $2,294,261
At June 30, 2015 TRSL’s foreign currency risk has been reduced by use of the futures based overlay program. The use of the overlay program reduced the variance of TRSL’s actual return to the benchmark return.
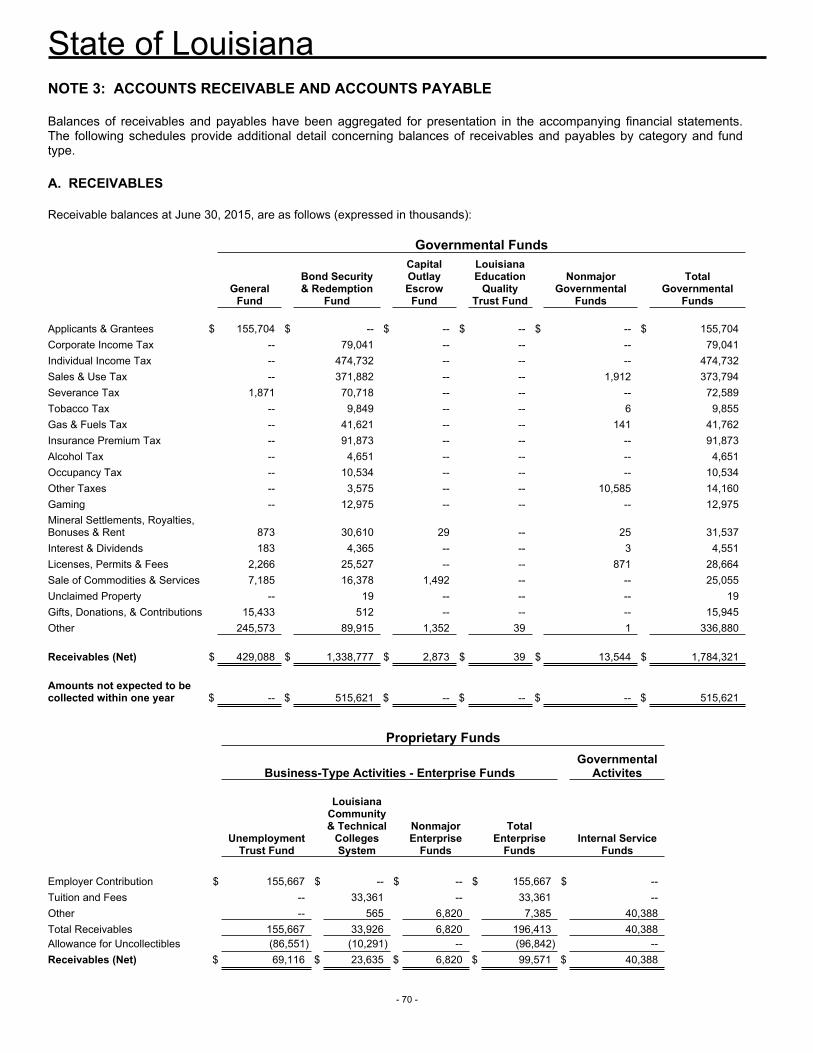
State of Louisiana
- 70 -
NOTE 3: ACCOUNTS RECEIVABLE AND ACCOUNTS PAYABLE
Balances of receivables and payables have been aggregated for presentation in the accompanying financial statements. The following schedules provide additional detail concerning balances of receivables and payables by category and fund type.
A. RECEIVABLES
Receivable balances at June 30, 2015, are as follows (expressed in thousands):
Governmental Funds
General
Fund
Bond Security & Redemption
Fund
Capital Outlay Escrow
Fund
Louisiana Education
Quality Trust Fund
Nonmajor Governmental
Funds
Total Governmental
Funds Applicants & Grantees $ 155,704 $ -- $ -- $ -- $ -- $ 155,704Corporate Income Tax -- 79,041 -- -- -- 79,041Individual Income Tax -- 474,732 -- -- -- 474,732Sales & Use Tax -- 371,882 -- -- 1,912 373,794Severance Tax 1,871 70,718 -- -- -- 72,589Tobacco Tax -- 9,849 -- -- 6 9,855Gas & Fuels Tax -- 41,621 -- -- 141 41,762Insurance Premium Tax -- 91,873 -- -- -- 91,873Alcohol Tax -- 4,651 -- -- -- 4,651Occupancy Tax -- 10,534 -- -- -- 10,534Other Taxes -- 3,575 -- -- 10,585 14,160Gaming -- 12,975 -- -- -- 12,975Mineral Settlements, Royalties, Bonuses & Rent 873 30,610 29 -- 25 31,537Interest & Dividends 183 4,365 -- -- 3 4,551Licenses, Permits & Fees 2,266 25,527 -- -- 871 28,664Sale of Commodities & Services 7,185 16,378 1,492 -- -- 25,055Unclaimed Property -- 19 -- -- -- 19Gifts, Donations, & Contributions 15,433 512 -- -- -- 15,945Other 245,573 89,915 1,352 39 1 336,880 Receivables (Net) $ 429,088 $ 1,338,777 $ 2,873 $ 39 $ 13,544 $ 1,784,321 Amounts not expected to be collected within one year $ -- $ 515,621 $ -- $ -- $ -- $ 515,621
Proprietary Funds
Business-Type Activities - Enterprise Funds
Governmental Activites
Unemployment
Trust Fund
Louisiana Community & Technical
Colleges System
Nonmajor Enterprise
Funds
Total Enterprise
Funds Internal Service
Funds Employer Contribution $ 155,667 $ -- $ -- $ 155,667 $ --Tuition and Fees -- 33,361 -- 33,361 --Other -- 565 6,820 7,385 40,388Total Receivables 155,667 33,926 6,820 196,413 40,388Allowance for Uncollectibles (86,551) (10,291) -- (96,842) --Receivables (Net) $ 69,116 $ 23,635 $ 6,820 $ 99,571 $ 40,388
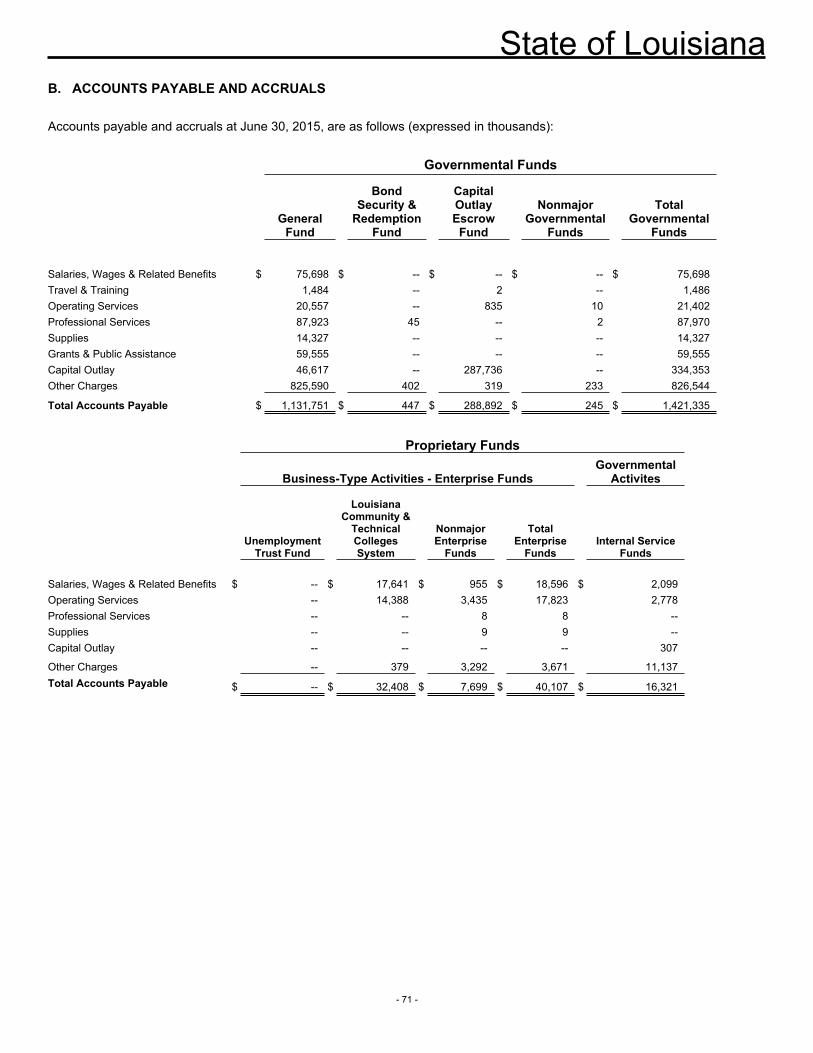
State of Louisiana
- 71 -
B. ACCOUNTS PAYABLE AND ACCRUALS
Accounts payable and accruals at June 30, 2015, are as follows (expressed in thousands):
Governmental Funds
General
Fund
Bond
Security & Redemption
Fund
Capital Outlay Escrow
Fund
Nonmajor Governmental
Funds
Total Governmental
Funds
Salaries, Wages & Related Benefits $ 75,698 $ -- $ -- $ -- $ 75,698Travel & Training 1,484 -- 2 -- 1,486Operating Services 20,557 -- 835 10 21,402Professional Services 87,923 45 -- 2 87,970Supplies 14,327 -- -- -- 14,327Grants & Public Assistance 59,555 -- -- -- 59,555Capital Outlay 46,617 -- 287,736 -- 334,353Other Charges 825,590 402 319 233 826,544
Total Accounts Payable $ 1,131,751 $ 447 $ 288,892 $ 245 $ 1,421,335
Proprietary Funds
Business-Type Activities - Enterprise Funds
Governmental Activites
Unemployment
Trust Fund
Louisiana Community &
Technical Colleges System
Nonmajor Enterprise
Funds
Total Enterprise
Funds
Internal Service
Funds Salaries, Wages & Related Benefits $ -- $ 17,641 $ 955 $ 18,596 $ 2,099Operating Services -- 14,388 3,435 17,823 2,778Professional Services -- -- 8 8 --Supplies -- -- 9 9 --Capital Outlay -- -- -- -- 307
Other Charges -- 379 3,292 3,671 11,137Total Accounts Payable $ -- $ 32,408 $ 7,699 $ 40,107 $ 16,321
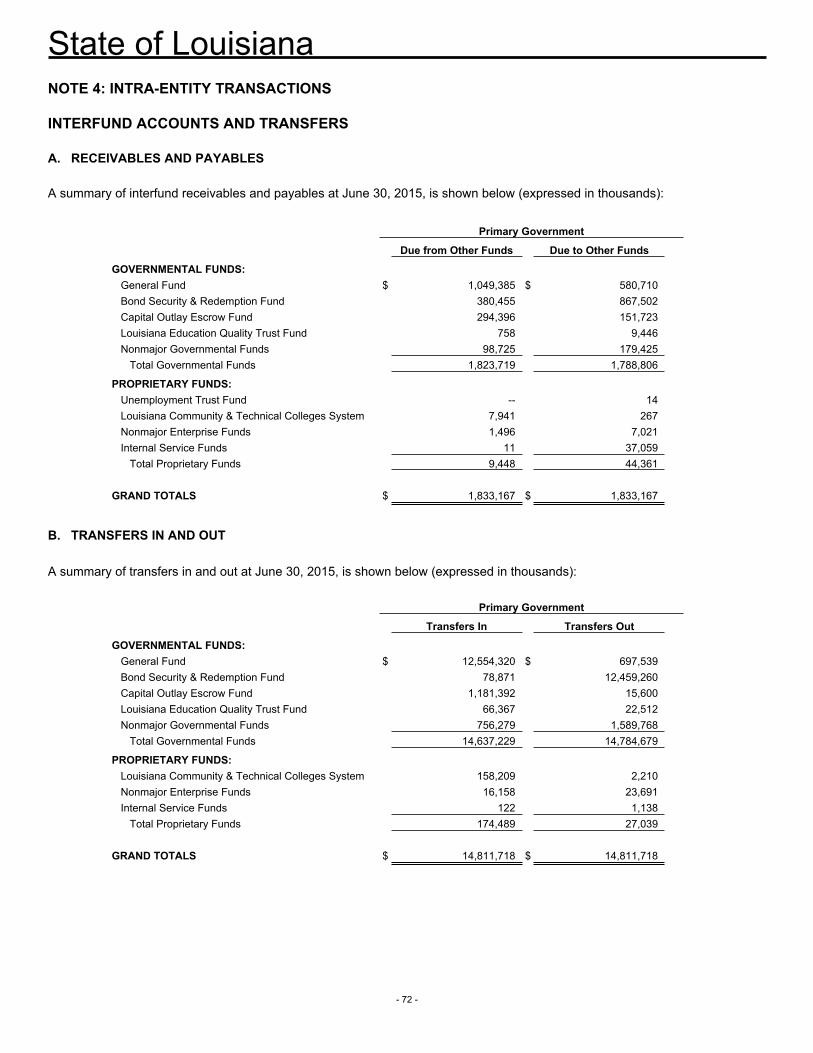
State of Louisiana
- 72 -
NOTE 4: INTRA-ENTITY TRANSACTIONS
INTERFUND ACCOUNTS AND TRANSFERS
A. RECEIVABLES AND PAYABLES
A summary of interfund receivables and payables at June 30, 2015, is shown below (expressed in thousands):
Primary Government
Due from Other Funds Due to Other Funds
GOVERNMENTAL FUNDS: General Fund $ 1,049,385 $ 580,710 Bond Security & Redemption Fund 380,455 867,502 Capital Outlay Escrow Fund 294,396 151,723 Louisiana Education Quality Trust Fund 758 9,446 Nonmajor Governmental Funds 98,725 179,425
Total Governmental Funds 1,823,719 1,788,806
PROPRIETARY FUNDS: Unemployment Trust Fund -- 14 Louisiana Community & Technical Colleges System 7,941 267 Nonmajor Enterprise Funds 1,496 7,021 Internal Service Funds 11 37,059
Total Proprietary Funds 9,448 44,361 GRAND TOTALS $ 1,833,167 $ 1,833,167
B. TRANSFERS IN AND OUT
A summary of transfers in and out at June 30, 2015, is shown below (expressed in thousands):
Primary Government
Transfers In Transfers Out
GOVERNMENTAL FUNDS: General Fund $ 12,554,320 $ 697,539 Bond Security & Redemption Fund 78,871 12,459,260 Capital Outlay Escrow Fund 1,181,392 15,600 Louisiana Education Quality Trust Fund 66,367 22,512 Nonmajor Governmental Funds 756,279 1,589,768
Total Governmental Funds 14,637,229 14,784,679
PROPRIETARY FUNDS: Louisiana Community & Technical Colleges System 158,209 2,210 Nonmajor Enterprise Funds 16,158 23,691 Internal Service Funds 122 1,138
Total Proprietary Funds 174,489 27,039 GRAND TOTALS $ 14,811,718 $ 14,811,718
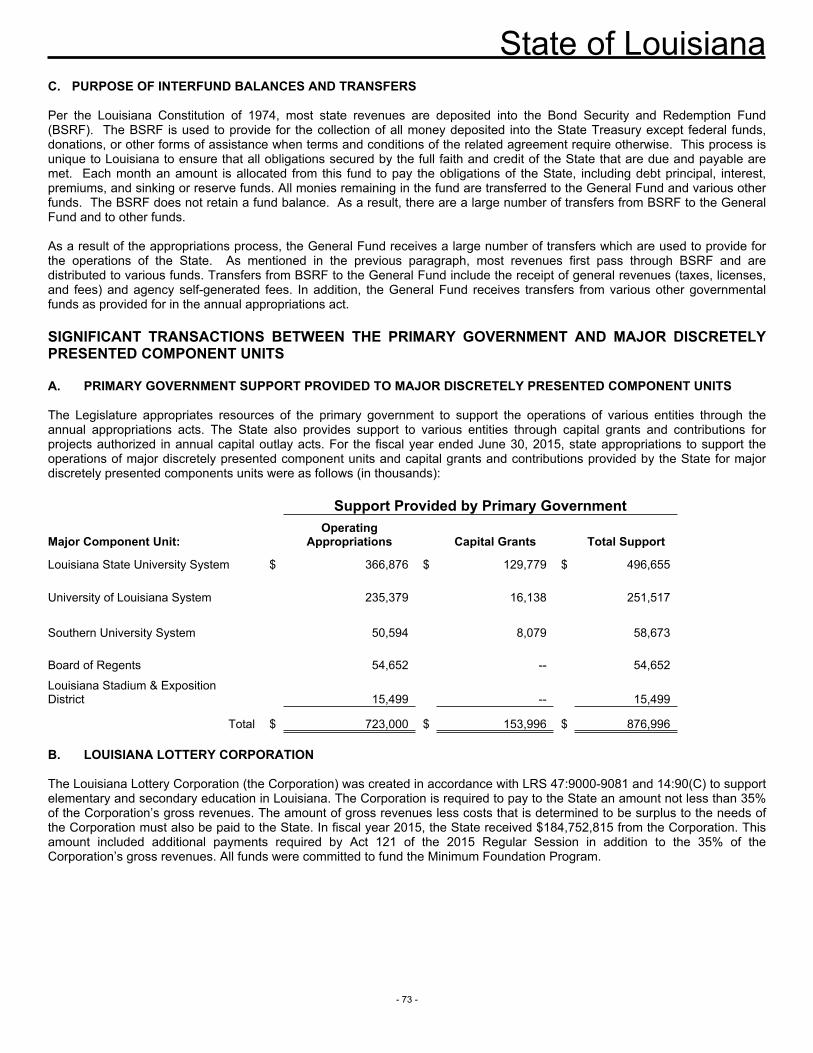
State of Louisiana
- 73 -
C. PURPOSE OF INTERFUND BALANCES AND TRANSFERS
Per the Louisiana Constitution of 1974, most state revenues are deposited into the Bond Security and Redemption Fund (BSRF). The BSRF is used to provide for the collection of all money deposited into the State Treasury except federal funds, donations, or other forms of assistance when terms and conditions of the related agreement require otherwise. This process is unique to Louisiana to ensure that all obligations secured by the full faith and credit of the State that are due and payable are met. Each month an amount is allocated from this fund to pay the obligations of the State, including debt principal, interest, premiums, and sinking or reserve funds. All monies remaining in the fund are transferred to the General Fund and various other funds. The BSRF does not retain a fund balance. As a result, there are a large number of transfers from BSRF to the General Fund and to other funds.
As a result of the appropriations process, the General Fund receives a large number of transfers which are used to provide for the operations of the State. As mentioned in the previous paragraph, most revenues first pass through BSRF and are distributed to various funds. Transfers from BSRF to the General Fund include the receipt of general revenues (taxes, licenses, and fees) and agency self-generated fees. In addition, the General Fund receives transfers from various other governmental funds as provided for in the annual appropriations act.
SIGNIFICANT TRANSACTIONS BETWEEN THE PRIMARY GOVERNMENT AND MAJOR DISCRETELY PRESENTED COMPONENT UNITS
A. PRIMARY GOVERNMENT SUPPORT PROVIDED TO MAJOR DISCRETELY PRESENTED COMPONENT UNITS
The Legislature appropriates resources of the primary government to support the operations of various entities through the annual appropriations acts. The State also provides support to various entities through capital grants and contributions for projects authorized in annual capital outlay acts. For the fiscal year ended June 30, 2015, state appropriations to support the operations of major discretely presented component units and capital grants and contributions provided by the State for major discretely presented components units were as follows (in thousands):
Support Provided by Primary Government
Major Component Unit:Operating
Appropriations Capital Grants Total Support
Louisiana State University System $ 366,876 $ 129,779 $ 496,655
University of Louisiana System 235,379 16,138 251,517
Southern University System 50,594 8,079 58,673
Board of Regents 54,652 -- 54,652
Louisiana Stadium & Exposition District 15,499 -- 15,499
Total $ 723,000 $ 153,996 $ 876,996
B. LOUISIANA LOTTERY CORPORATION
The Louisiana Lottery Corporation (the Corporation) was created in accordance with LRS 47:9000-9081 and 14:90(C) to support elementary and secondary education in Louisiana. The Corporation is required to pay to the State an amount not less than 35% of the Corporation’s gross revenues. The amount of gross revenues less costs that is determined to be surplus to the needs of the Corporation must also be paid to the State. In fiscal year 2015, the State received $184,752,815 from the Corporation. This amount included additional payments required by Act 121 of the 2015 Regular Session in addition to the 35% of the Corporation’s gross revenues. All funds were committed to fund the Minimum Foundation Program.
State of Louisiana
- 74 -
C. PUBLIC HOSPITAL LEASES
Act 3 of the 1997 Regular Session charged the LSU System with the responsibility of operating 10 public hospitals. These hospitals are the primary source of health care services for the indigent population of the State and account for over one million in-patient and out-patient visits each year. In addition, these hospitals are utilized by the LSU Health Sciences Center as teaching hospitals wherein the medical and dental faculty and medical education students provide the necessary medical care to patients. In fiscal years 2013 and 2014, public-private partnerships were executed to remove operational responsibility for these hospitals from the LSU System.
In consideration for allowing the private partners to operate the hospitals, the LSU System will receive lease payments over the life of the agreements. Act 420 of the 2013 Regular Session mandated that all collections of lease payments be deposited with the State Treasury. During fiscal year 2015, LSU deposited $135,560,763 in hospital lease payments with the State Treasury.
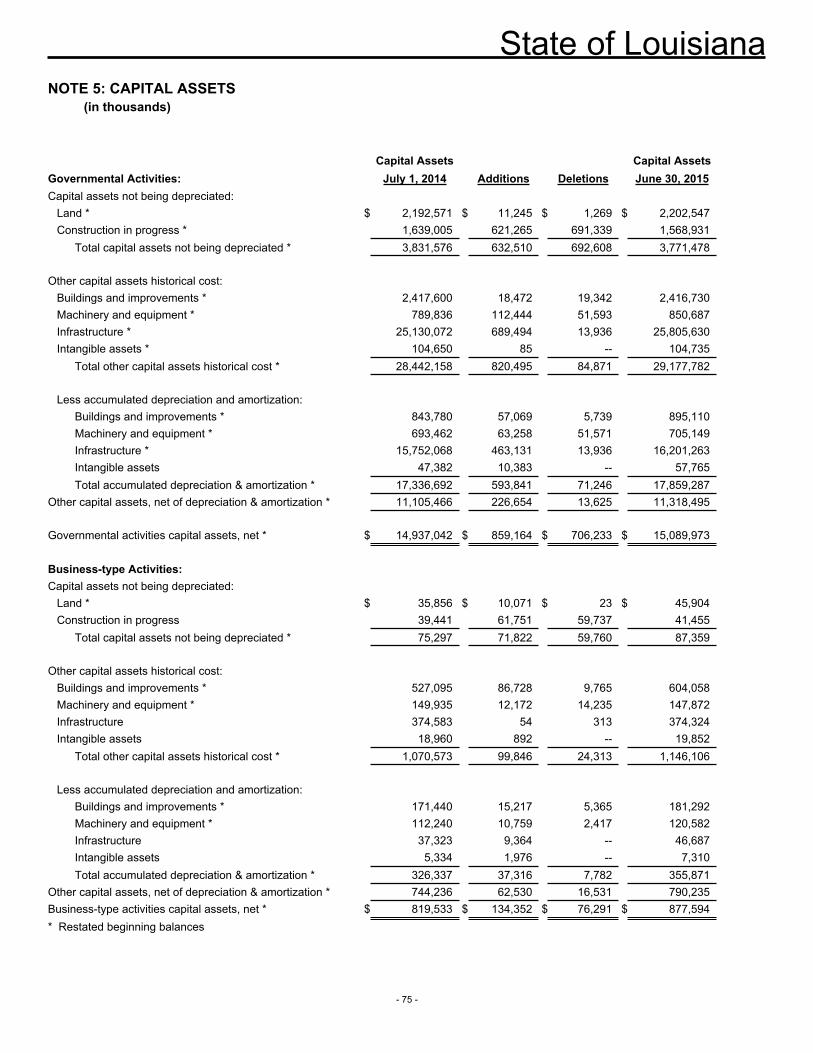
State of Louisiana
- 75 -
NOTE 5: CAPITAL ASSETS(in thousands)
Capital Assets Capital AssetsGovernmental Activities: July 1, 2014 Additions Deletions June 30, 2015Capital assets not being depreciated:
Land * $ 2,192,571 $ 11,245 $ 1,269 $ 2,202,547Construction in progress * 1,639,005 621,265 691,339 1,568,931
Total capital assets not being depreciated * 3,831,576 632,510 692,608 3,771,478
Other capital assets historical cost:Buildings and improvements * 2,417,600 18,472 19,342 2,416,730Machinery and equipment * 789,836 112,444 51,593 850,687Infrastructure * 25,130,072 689,494 13,936 25,805,630Intangible assets * 104,650 85 -- 104,735
Total other capital assets historical cost * 28,442,158 820,495 84,871 29,177,782
Less accumulated depreciation and amortization:Buildings and improvements * 843,780 57,069 5,739 895,110Machinery and equipment * 693,462 63,258 51,571 705,149Infrastructure * 15,752,068 463,131 13,936 16,201,263Intangible assets 47,382 10,383 -- 57,765Total accumulated depreciation & amortization * 17,336,692 593,841 71,246 17,859,287
Other capital assets, net of depreciation & amortization * 11,105,466 226,654 13,625 11,318,495
Governmental activities capital assets, net * $ 14,937,042 $ 859,164 $ 706,233 $ 15,089,973
Business-type Activities:Capital assets not being depreciated:
Land * $ 35,856 $ 10,071 $ 23 $ 45,904Construction in progress 39,441 61,751 59,737 41,455
Total capital assets not being depreciated * 75,297 71,822 59,760 87,359
Other capital assets historical cost:Buildings and improvements * 527,095 86,728 9,765 604,058Machinery and equipment * 149,935 12,172 14,235 147,872Infrastructure 374,583 54 313 374,324Intangible assets 18,960 892 -- 19,852
Total other capital assets historical cost * 1,070,573 99,846 24,313 1,146,106
Less accumulated depreciation and amortization:Buildings and improvements * 171,440 15,217 5,365 181,292Machinery and equipment * 112,240 10,759 2,417 120,582Infrastructure 37,323 9,364 -- 46,687Intangible assets 5,334 1,976 -- 7,310Total accumulated depreciation & amortization * 326,337 37,316 7,782 355,871
Other capital assets, net of depreciation & amortization * 744,236 62,530 16,531 790,235Business-type activities capital assets, net * $ 819,533 $ 134,352 $ 76,291 $ 877,594* Restated beginning balances
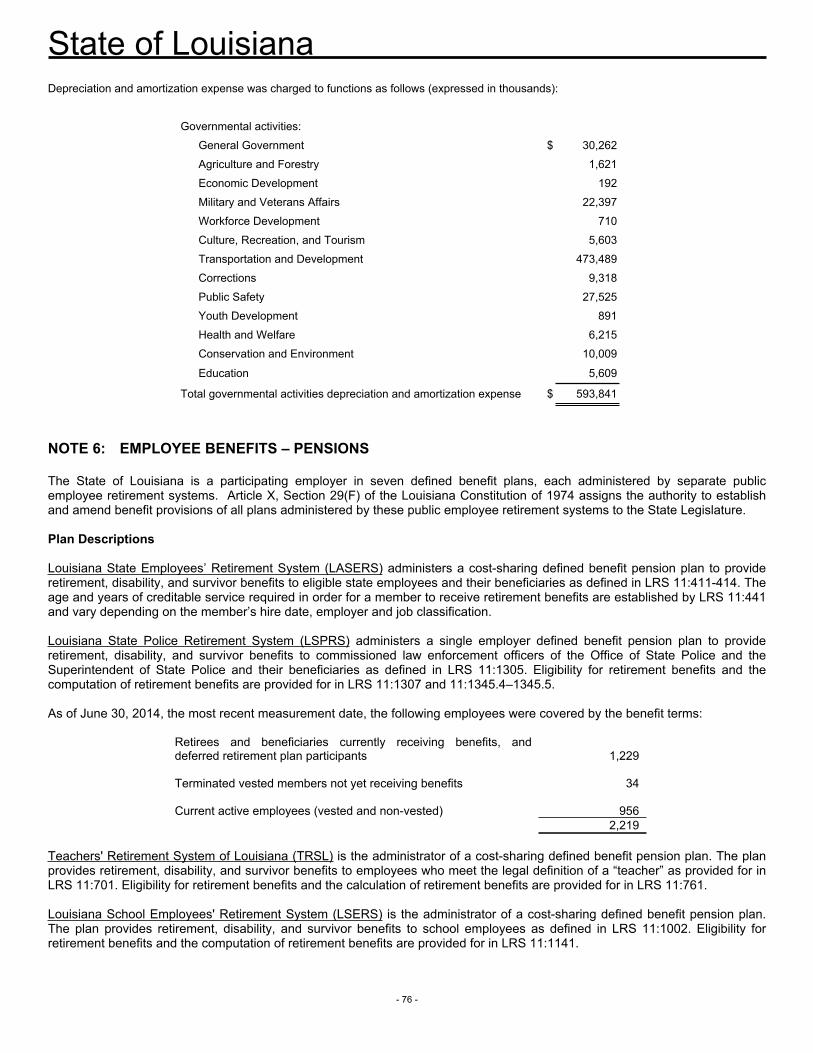
State of Louisiana
- 76 -
Depreciation and amortization expense was charged to functions as follows (expressed in thousands):
Governmental activities:
General Government $ 30,262
Agriculture and Forestry 1,621
Economic Development 192
Military and Veterans Affairs 22,397
Workforce Development 710
Culture, Recreation, and Tourism 5,603
Transportation and Development 473,489
Corrections 9,318
Public Safety 27,525
Youth Development 891
Health and Welfare 6,215
Conservation and Environment 10,009
Education 5,609
Total governmental activities depreciation and amortization expense $ 593,841
NOTE 6: EMPLOYEE BENEFITS – PENSIONS
The State of Louisiana is a participating employer in seven defined benefit plans, each administered by separate public employee retirement systems. Article X, Section 29(F) of the Louisiana Constitution of 1974 assigns the authority to establish and amend benefit provisions of all plans administered by these public employee retirement systems to the State Legislature.
Plan Descriptions
Louisiana State Employees’ Retirement System (LASERS) administers a cost-sharing defined benefit pension plan to provide retirement, disability, and survivor benefits to eligible state employees and their beneficiaries as defined in LRS 11:411-414. The age and years of creditable service required in order for a member to receive retirement benefits are established by LRS 11:441 and vary depending on the member’s hire date, employer and job classification.
Louisiana State Police Retirement System (LSPRS) administers a single employer defined benefit pension plan to provide retirement, disability, and survivor benefits to commissioned law enforcement officers of the Office of State Police and the Superintendent of State Police and their beneficiaries as defined in LRS 11:1305. Eligibility for retirement benefits and the computation of retirement benefits are provided for in LRS 11:1307 and 11:1345.4–1345.5.
As of June 30, 2014, the most recent measurement date, the following employees were covered by the benefit terms:
Retirees and beneficiaries currently receiving benefits, and deferred retirement plan participants 1,229
Terminated vested members not yet receiving benefits 34
Current active employees (vested and non-vested) 9562,219
Teachers' Retirement System of Louisiana (TRSL) is the administrator of a cost-sharing defined benefit pension plan. The plan provides retirement, disability, and survivor benefits to employees who meet the legal definition of a “teacher” as provided for in LRS 11:701. Eligibility for retirement benefits and the calculation of retirement benefits are provided for in LRS 11:761.
Louisiana School Employees' Retirement System (LSERS) is the administrator of a cost-sharing defined benefit pension plan. The plan provides retirement, disability, and survivor benefits to school employees as defined in LRS 11:1002. Eligibility for retirement benefits and the computation of retirement benefits are provided for in LRS 11:1141.
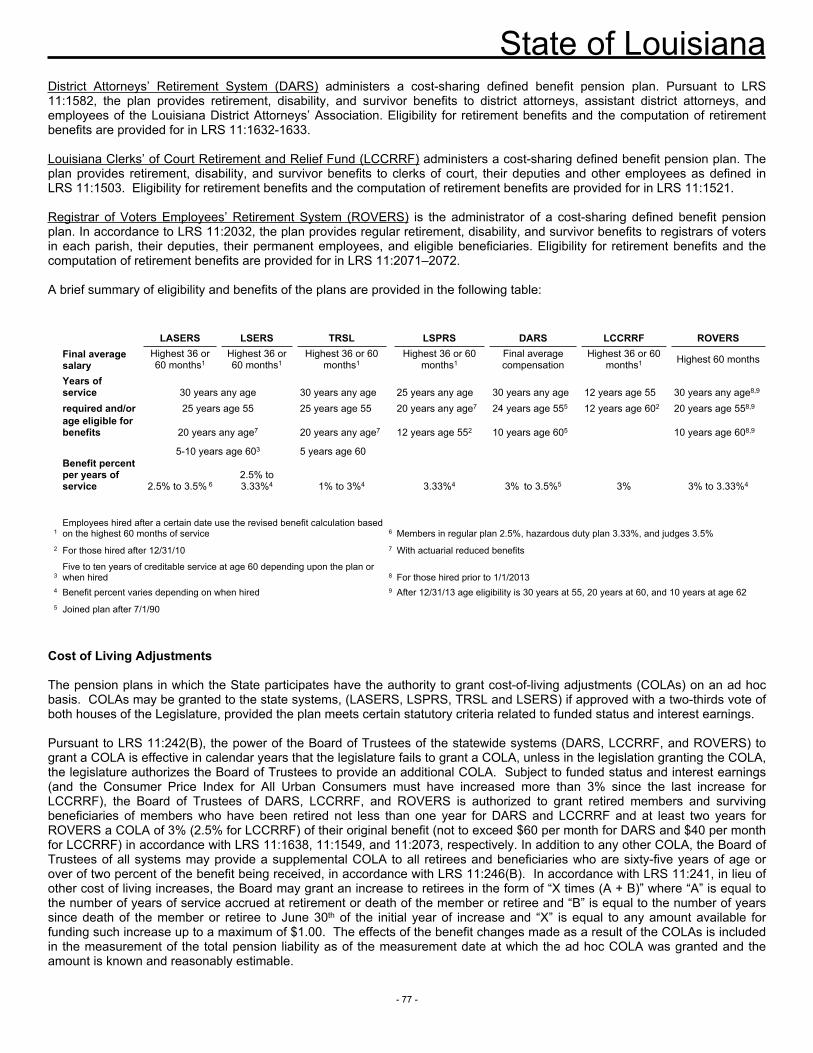
State of Louisiana
- 77 -
District Attorneys’ Retirement System (DARS) administers a cost-sharing defined benefit pension plan. Pursuant to LRS 11:1582, the plan provides retirement, disability, and survivor benefits to district attorneys, assistant district attorneys, and employees of the Louisiana District Attorneys’ Association. Eligibility for retirement benefits and the computation of retirement benefits are provided for in LRS 11:1632-1633.
Louisiana Clerks’ of Court Retirement and Relief Fund (LCCRRF) administers a cost-sharing defined benefit pension plan. The plan provides retirement, disability, and survivor benefits to clerks of court, their deputies and other employees as defined in LRS 11:1503. Eligibility for retirement benefits and the computation of retirement benefits are provided for in LRS 11:1521.
Registrar of Voters Employees’ Retirement System (ROVERS) is the administrator of a cost-sharing defined benefit pension plan. In accordance to LRS 11:2032, the plan provides regular retirement, disability, and survivor benefits to registrars of voters in each parish, their deputies, their permanent employees, and eligible beneficiaries. Eligibility for retirement benefits and the computation of retirement benefits are provided for in LRS 11:2071–2072.
A brief summary of eligibility and benefits of the plans are provided in the following table:
LASERS LSERS TRSL LSPRS DARS LCCRRF ROVERSFinal average salary
Highest 36 or 60 months1
Highest 36 or 60 months1
Highest 36 or 60 months1
Highest 36 or 60 months1
Final average compensation
Highest 36 or 60 months1 Highest 60 months
Years of service 30 years any age 30 years any age 25 years any age 30 years any age 12 years age 55 30 years any age8,9
required and/or 25 years age 55 25 years age 55 20 years any age7 24 years age 555 12 years age 602 20 years age 558,9
age eligible for benefits 20 years any age7 20 years any age7 12 years age 552 10 years age 605 10 years age 608,9
5-10 years age 603 5 years age 60Benefit percent per years of service 2.5% to 3.5% 6
2.5% to 3.33%4 1% to 3%4 3.33%4 3% to 3.5%5 3% 3% to 3.33%4
1Employees hired after a certain date use the revised benefit calculation based on the highest 60 months of service 6 Members in regular plan 2.5%, hazardous duty plan 3.33%, and judges 3.5%
2 For those hired after 12/31/10 7 With actuarial reduced benefits
3Five to ten years of creditable service at age 60 depending upon the plan or when hired 8 For those hired prior to 1/1/2013
4 Benefit percent varies depending on when hired 9 After 12/31/13 age eligibility is 30 years at 55, 20 years at 60, and 10 years at age 625 Joined plan after 7/1/90
Cost of Living Adjustments
The pension plans in which the State participates have the authority to grant cost-of-living adjustments (COLAs) on an ad hoc basis. COLAs may be granted to the state systems, (LASERS, LSPRS, TRSL and LSERS) if approved with a two-thirds vote of both houses of the Legislature, provided the plan meets certain statutory criteria related to funded status and interest earnings.
Pursuant to LRS 11:242(B), the power of the Board of Trustees of the statewide systems (DARS, LCCRRF, and ROVERS) to grant a COLA is effective in calendar years that the legislature fails to grant a COLA, unless in the legislation granting the COLA, the legislature authorizes the Board of Trustees to provide an additional COLA. Subject to funded status and interest earnings (and the Consumer Price Index for All Urban Consumers must have increased more than 3% since the last increase for LCCRRF), the Board of Trustees of DARS, LCCRRF, and ROVERS is authorized to grant retired members and surviving beneficiaries of members who have been retired not less than one year for DARS and LCCRRF and at least two years for ROVERS a COLA of 3% (2.5% for LCCRRF) of their original benefit (not to exceed $60 per month for DARS and $40 per month for LCCRRF) in accordance with LRS 11:1638, 11:1549, and 11:2073, respectively. In addition to any other COLA, the Board of Trustees of all systems may provide a supplemental COLA to all retirees and beneficiaries who are sixty-five years of age or over of two percent of the benefit being received, in accordance with LRS 11:246(B). In accordance with LRS 11:241, in lieu of other cost of living increases, the Board may grant an increase to retirees in the form of “X times (A + B)” where “A” is equal to the number of years of service accrued at retirement or death of the member or retiree and “B” is equal to the number of years since death of the member or retiree to June 30th of the initial year of increase and “X” is equal to any amount available for funding such increase up to a maximum of $1.00. The effects of the benefit changes made as a result of the COLAs is included in the measurement of the total pension liability as of the measurement date at which the ad hoc COLA was granted and the amount is known and reasonably estimable.
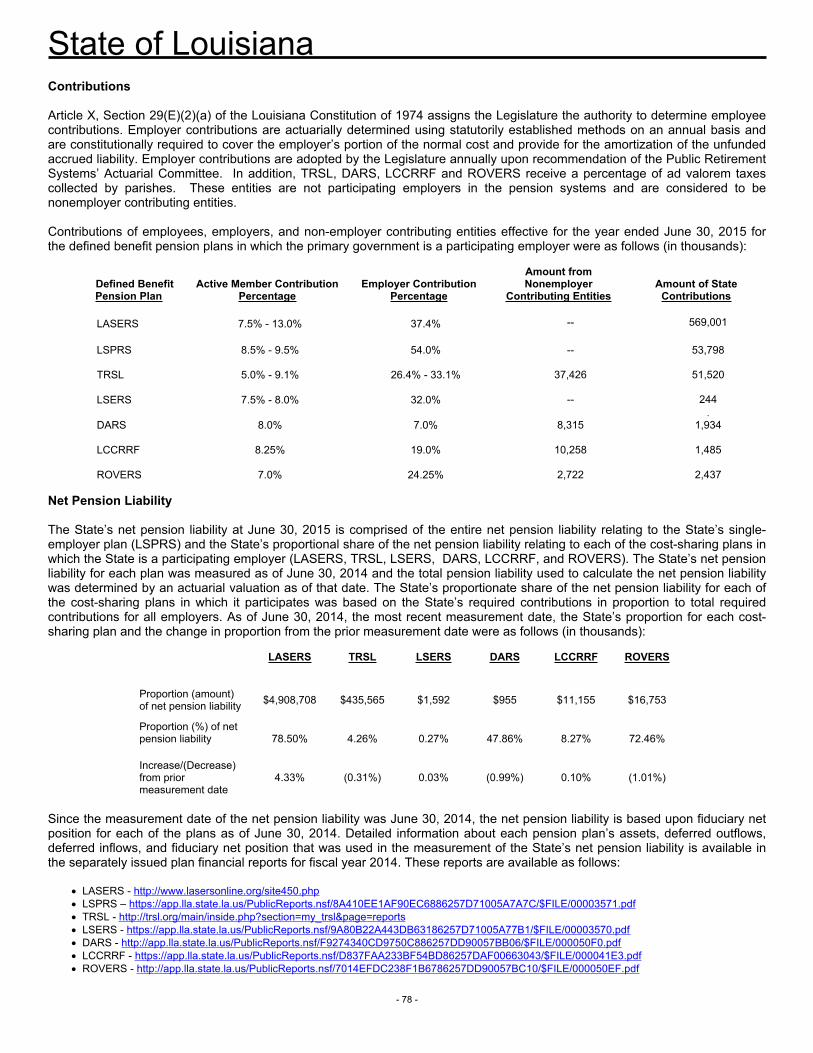
State of Louisiana
- 78 -
Contributions
Article X, Section 29(E)(2)(a) of the Louisiana Constitution of 1974 assigns the Legislature the authority to determine employee contributions. Employer contributions are actuarially determined using statutorily established methods on an annual basis and are constitutionally required to cover the employer’s portion of the normal cost and provide for the amortization of the unfunded accrued liability. Employer contributions are adopted by the Legislature annually upon recommendation of the Public Retirement Systems’ Actuarial Committee. In addition, TRSL, DARS, LCCRRF and ROVERS receive a percentage of ad valorem taxes collected by parishes. These entities are not participating employers in the pension systems and are considered to be nonemployer contributing entities.
Contributions of employees, employers, and non-employer contributing entities effective for the year ended June 30, 2015 for the defined benefit pension plans in which the primary government is a participating employer were as follows (in thousands):
Defined Benefit Pension Plan
Active Member Contribution Percentage
Employer Contribution Percentage
Amount from Nonemployer
Contributing EntitiesAmount of State
Contributions
LASERS 7.5% - 13.0% 37.4% -- 569,001
LSPRS 8.5% - 9.5% 54.0% -- 53,798
TRSL 5.0% - 9.1% 26.4% - 33.1% 37,426 51,520
LSERS 7.5% - 8.0% 32.0% -- 244.
DARS 8.0% 7.0% 8,315 1,934
LCCRRF 8.25% 19.0% 10,258 1,485
ROVERS 7.0% 24.25% 2,722 2,437
Net Pension Liability
The State’s net pension liability at June 30, 2015 is comprised of the entire net pension liability relating to the State’s single-employer plan (LSPRS) and the State’s proportional share of the net pension liability relating to each of the cost-sharing plans in which the State is a participating employer (LASERS, TRSL, LSERS, DARS, LCCRRF, and ROVERS). The State’s net pension liability for each plan was measured as of June 30, 2014 and the total pension liability used to calculate the net pension liability was determined by an actuarial valuation as of that date. The State’s proportionate share of the net pension liability for each of the cost-sharing plans in which it participates was based on the State’s required contributions in proportion to total required contributions for all employers. As of June 30, 2014, the most recent measurement date, the State’s proportion for each cost-sharing plan and the change in proportion from the prior measurement date were as follows (in thousands):
LASERS TRSL LSERS DARS LCCRRF ROVERS
Proportion (amount) of net pension liability $4,908,708 $435,565 $1,592 $955 $11,155 $16,753
Proportion (%) of net pension liability 78.50% 4.26% 0.27% 47.86% 8.27% 72.46%
Increase/(Decrease) from prior measurement date
4.33% (0.31%) 0.03% (0.99%) 0.10% (1.01%)
Since the measurement date of the net pension liability was June 30, 2014, the net pension liability is based upon fiduciary net position for each of the plans as of June 30, 2014. Detailed information about each pension plan’s assets, deferred outflows, deferred inflows, and fiduciary net position that was used in the measurement of the State’s net pension liability is available in the separately issued plan financial reports for fiscal year 2014. These reports are available as follows:
LASERS - http://www.lasersonline.org/site450.php LSPRS – https://app.lla.state.la.us/PublicReports.nsf/8A410EE1AF90EC6886257D71005A7A7C/$FILE/00003571.pdf TRSL - http://trsl.org/main/inside.php?section=my_trsl&page=reports LSERS - https://app.lla.state.la.us/PublicReports.nsf/9A80B22A443DB63186257D71005A77B1/$FILE/00003570.pdf DARS - http://app.lla.state.la.us/PublicReports.nsf/F9274340CD9750C886257DD90057BB06/$FILE/000050F0.pdf LCCRRF - https://app.lla.state.la.us/PublicReports.nsf/D837FAA233BF54BD86257DAF00663043/$FILE/000041E3.pdf ROVERS - http://app.lla.state.la.us/PublicReports.nsf/7014EFDC238F1B6786257DD90057BC10/$FILE/000050EF.pdf
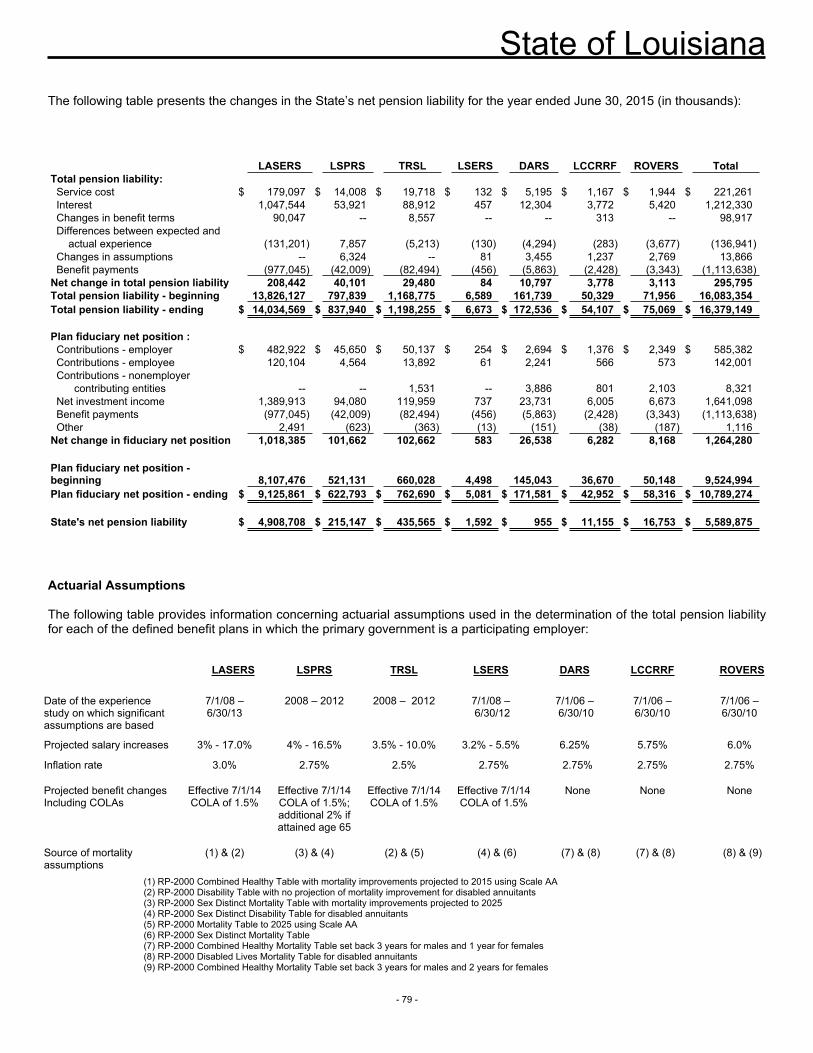
State of Louisiana
- 79 -
The following table presents the changes in the State’s net pension liability for the year ended June 30, 2015 (in thousands):
LASERS LSPRS TRSL LSERS DARS LCCRRF ROVERS TotalTotal pension liability: Service cost $ 179,097 $ 14,008 $ 19,718 $ 132 $ 5,195 $ 1,167 $ 1,944 $ 221,261 Interest 1,047,544 53,921 88,912 457 12,304 3,772 5,420 1,212,330 Changes in benefit terms 90,047 -- 8,557 -- -- 313 -- 98,917 Differences between expected and
actual experience (131,201) 7,857 (5,213) (130) (4,294) (283) (3,677) (136,941) Changes in assumptions -- 6,324 -- 81 3,455 1,237 2,769 13,866 Benefit payments (977,045) (42,009) (82,494) (456) (5,863) (2,428) (3,343) (1,113,638)Net change in total pension liability 208,442 40,101 29,480 84 10,797 3,778 3,113 295,795Total pension liability - beginning 13,826,127 797,839 1,168,775 6,589 161,739 50,329 71,956 16,083,354Total pension liability - ending $ 14,034,569 $ 837,940 $ 1,198,255 $ 6,673 $ 172,536 $ 54,107 $ 75,069 $ 16,379,149
Plan fiduciary net position : Contributions - employer $ 482,922 $ 45,650 $ 50,137 $ 254 $ 2,694 $ 1,376 $ 2,349 $ 585,382 Contributions - employee 120,104 4,564 13,892 61 2,241 566 573 142,001 Contributions - nonemployer contributing entities -- -- 1,531 -- 3,886 801 2,103 8,321 Net investment income 1,389,913 94,080 119,959 737 23,731 6,005 6,673 1,641,098 Benefit payments (977,045) (42,009) (82,494) (456) (5,863) (2,428) (3,343) (1,113,638) Other 2,491 (623) (363) (13) (151) (38) (187) 1,116Net change in fiduciary net position 1,018,385 101,662 102,662 583 26,538 6,282 8,168 1,264,280
Plan fiduciary net position - beginning 8,107,476 521,131 660,028 4,498 145,043 36,670 50,148 9,524,994Plan fiduciary net position - ending $ 9,125,861 $ 622,793 $ 762,690 $ 5,081 $ 171,581 $ 42,952 $ 58,316 $ 10,789,274
State's net pension liability $ 4,908,708 $ 215,147 $ 435,565 $ 1,592 $ 955 $ 11,155 $ 16,753 $ 5,589,875
Actuarial Assumptions
The following table provides information concerning actuarial assumptions used in the determination of the total pension liability for each of the defined benefit plans in which the primary government is a participating employer:
LASERS LSPRS TRSL LSERS DARS LCCRRF ROVERS
Date of the experience study on which significant assumptions are based
7/1/08 – 6/30/13
2008 – 2012 2008 – 2012 7/1/08 – 6/30/12
7/1/06 – 6/30/10
7/1/06 – 6/30/10
7/1/06 –6/30/10
Projected salary increases 3% - 17.0% 4% - 16.5% 3.5% - 10.0% 3.2% - 5.5% 6.25% 5.75% 6.0%
Inflation rate 3.0% 2.75% 2.5% 2.75%
2.75% 2.75% 2.75%
Projected benefit changes Including COLAs
Effective 7/1/14 COLA of 1.5%
Effective 7/1/14 COLA of 1.5%; additional 2% if attained age 65
Effective 7/1/14 COLA of 1.5%
Effective 7/1/14 COLA of 1.5%
None None None
Source of mortality assumptions
(1) & (2) (3) & (4) (2) & (5) (4) & (6) (7) & (8) (7) & (8) (8) & (9)
(1) RP-2000 Combined Healthy Table with mortality improvements projected to 2015 using Scale AA(2) RP-2000 Disability Table with no projection of mortality improvement for disabled annuitants(3) RP-2000 Sex Distinct Mortality Table with mortality improvements projected to 2025(4) RP-2000 Sex Distinct Disability Table for disabled annuitants(5) RP-2000 Mortality Table to 2025 using Scale AA(6) RP-2000 Sex Distinct Mortality Table(7) RP-2000 Combined Healthy Mortality Table set back 3 years for males and 1 year for females(8) RP-2000 Disabled Lives Mortality Table for disabled annuitants(9) RP-2000 Combined Healthy Mortality Table set back 3 years for males and 2 years for females
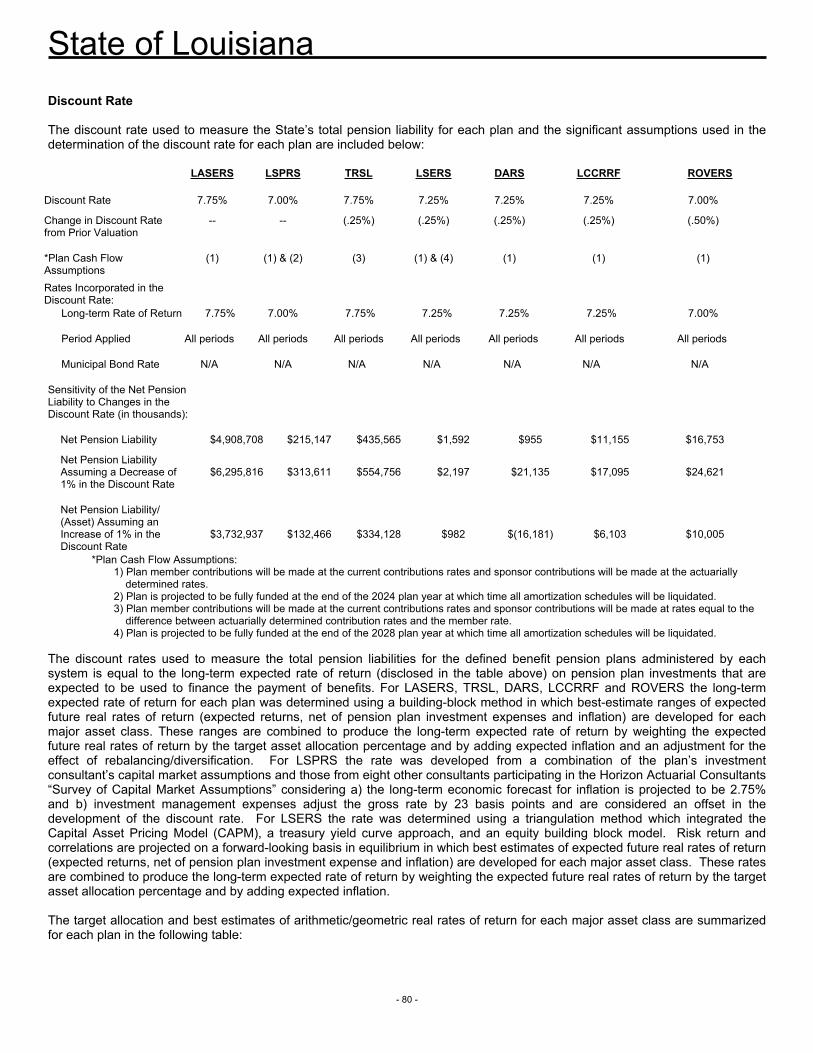
State of Louisiana
- 80 -
Discount Rate
The discount rate used to measure the State’s total pension liability for each plan and the significant assumptions used in the determination of the discount rate for each plan are included below:
LASERS LSPRS TRSL LSERS DARS LCCRRF ROVERS
Discount Rate 7.75% 7.00% 7.75% 7.25% 7.25% 7.25% 7.00%
Change in Discount Rate from Prior Valuation
--
-- (.25%) (.25%) (.25%) (.25%) (.50%)
*Plan Cash Flow Assumptions
(1) (1) & (2) (3) (1) & (4) (1) (1) (1)
Rates Incorporated in the Discount Rate:
Long-term Rate of Return 7.75% 7.00% 7.75% 7.25% 7.25% 7.25% 7.00%
Period Applied All periods All periods All periods All periods All periods All periods All periods
Municipal Bond Rate N/A N/A N/A N/A N/A N/A N/A
Sensitivity of the Net Pension Liability to Changes in the Discount Rate (in thousands):
Net Pension Liability $4,908,708 $215,147 $435,565 $1,592 $955 $11,155 $16,753
Net Pension Liability Assuming a Decrease of 1% in the Discount Rate
$6,295,816 $313,611 $554,756 $2,197 $21,135 $17,095 $24,621
Net Pension Liability/ (Asset) Assuming an Increase of 1% in the Discount Rate
$3,732,937 $132,466 $334,128 $982 $(16,181) $6,103 $10,005
*Plan Cash Flow Assumptions:1) Plan member contributions will be made at the current contributions rates and sponsor contributions will be made at the actuarially determined rates.2) Plan is projected to be fully funded at the end of the 2024 plan year at which time all amortization schedules will be liquidated.3) Plan member contributions will be made at the current contributions rates and sponsor contributions will be made at rates equal to the difference between actuarially determined contribution rates and the member rate.4) Plan is projected to be fully funded at the end of the 2028 plan year at which time all amortization schedules will be liquidated.
The discount rates used to measure the total pension liabilities for the defined benefit pension plans administered by each system is equal to the long-term expected rate of return (disclosed in the table above) on pension plan investments that are expected to be used to finance the payment of benefits. For LASERS, TRSL, DARS, LCCRRF and ROVERS the long-term expected rate of return for each plan was determined using a building-block method in which best-estimate ranges of expected future real rates of return (expected returns, net of pension plan investment expenses and inflation) are developed for each major asset class. These ranges are combined to produce the long-term expected rate of return by weighting the expected future real rates of return by the target asset allocation percentage and by adding expected inflation and an adjustment for the effect of rebalancing/diversification. For LSPRS the rate was developed from a combination of the plan’s investment consultant’s capital market assumptions and those from eight other consultants participating in the Horizon Actuarial Consultants “Survey of Capital Market Assumptions” considering a) the long-term economic forecast for inflation is projected to be 2.75% and b) investment management expenses adjust the gross rate by 23 basis points and are considered an offset in the development of the discount rate. For LSERS the rate was determined using a triangulation method which integrated the Capital Asset Pricing Model (CAPM), a treasury yield curve approach, and an equity building block model. Risk return and correlations are projected on a forward-looking basis in equilibrium in which best estimates of expected future real rates of return (expected returns, net of pension plan investment expense and inflation) are developed for each major asset class. These rates are combined to produce the long-term expected rate of return by weighting the expected future real rates of return by the target asset allocation percentage and by adding expected inflation.
The target allocation and best estimates of arithmetic/geometric real rates of return for each major asset class are summarized for each plan in the following table:
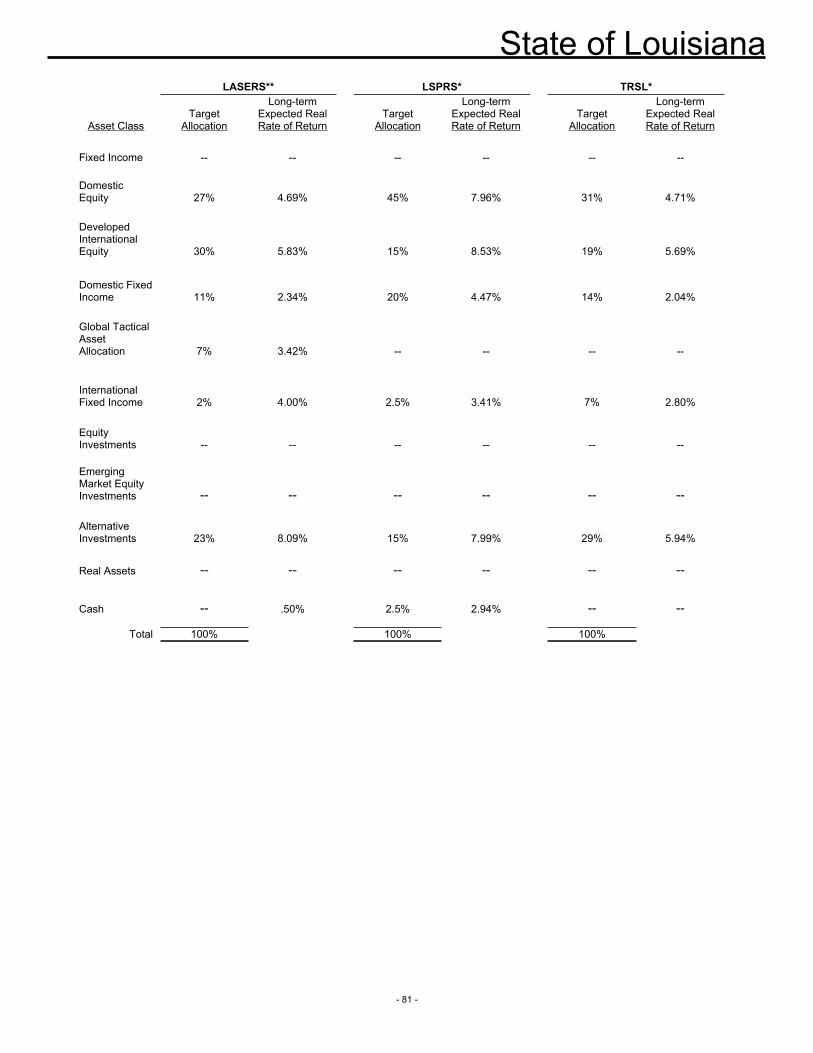
State of Louisiana
- 81 -
LASERS** LSPRS* TRSL*
Asset ClassTarget
Allocation
Long-term Expected Real Rate of Return
Target Allocation
Long-term Expected Real Rate of Return
Target Allocation
Long-term Expected Real Rate of Return
Fixed Income -- -- -- -- -- --
Domestic Equity 27% 4.69% 45% 7.96% 31% 4.71%
Developed International Equity 30% 5.83% 15% 8.53% 19% 5.69%
Domestic Fixed Income 11% 2.34% 20% 4.47% 14% 2.04%
Global Tactical Asset Allocation 7% 3.42% -- -- -- --
International Fixed Income 2% 4.00% 2.5% 3.41% 7% 2.80%
Equity Investments -- -- -- -- -- --
Emerging Market Equity Investments -- -- -- -- -- --
Alternative Investments 23% 8.09% 15% 7.99% 29% 5.94%
Real Assets -- -- -- -- -- --
Cash -- .50% 2.5% 2.94% -- --
Total 100% 100% 100%
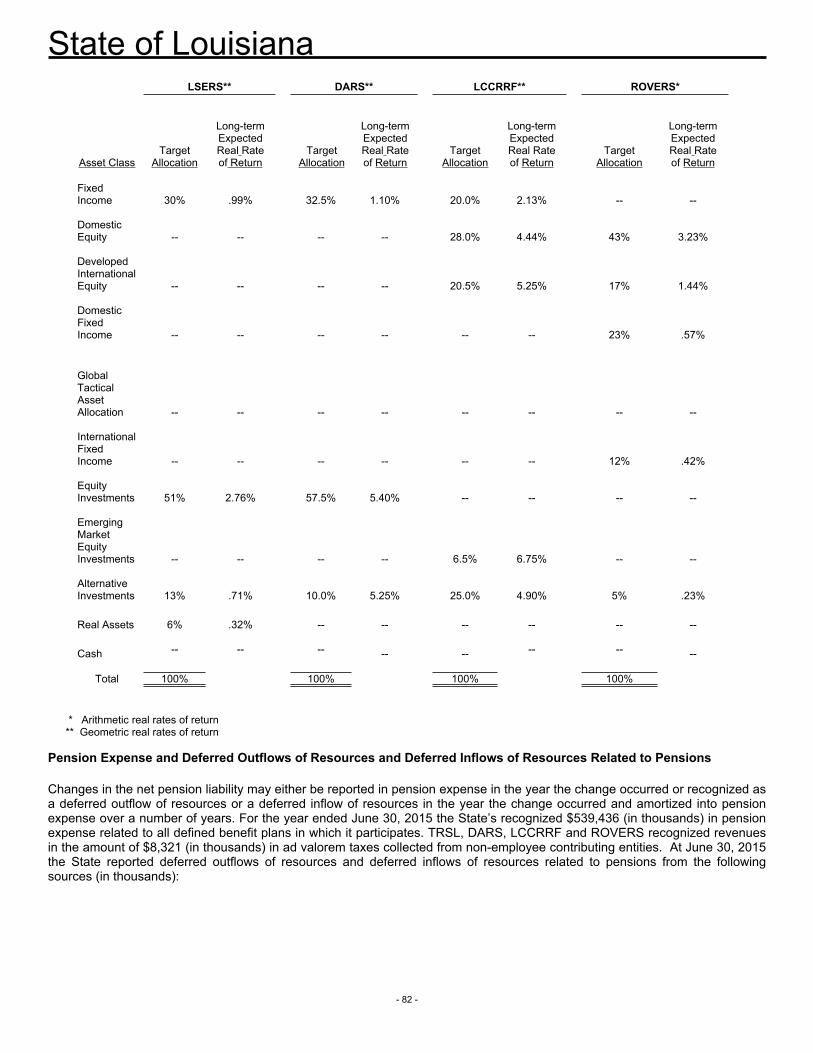
State of Louisiana
- 82 -
LSERS** DARS** LCCRRF** ROVERS*
Asset ClassTarget
Allocation
Long-term Expected Real Rate of Return
Target Allocation
Long-term Expected Real Rate of Return
TargetAllocation
Long-term Expected Real Rate of Return
Target Allocation
Long-term Expected Real Rate of Return
Fixed Income 30% .99% 32.5% 1.10% 20.0% 2.13% -- --
Domestic Equity -- -- -- -- 28.0% 4.44% 43% 3.23%
Developed International Equity -- -- -- -- 20.5% 5.25% 17% 1.44%
Domestic Fixed Income -- -- -- -- -- -- 23% .57%
Global Tactical Asset Allocation -- -- -- -- -- -- -- --
International Fixed Income -- -- -- -- -- -- 12% .42%
Equity Investments 51% 2.76% 57.5% 5.40% -- -- -- --
Emerging Market Equity Investments -- -- -- -- 6.5% 6.75% -- --
Alternative Investments 13% .71% 10.0% 5.25% 25.0% 4.90% 5% .23%
Real Assets 6% .32% -- -- -- -- -- --
Cash -- -- -- -- -- -- -- --
Total 100% 100% 100% 100%
* Arithmetic real rates of return ** Geometric real rates of return
Pension Expense and Deferred Outflows of Resources and Deferred Inflows of Resources Related to Pensions
Changes in the net pension liability may either be reported in pension expense in the year the change occurred or recognized as a deferred outflow of resources or a deferred inflow of resources in the year the change occurred and amortized into pension expense over a number of years. For the year ended June 30, 2015 the State’s recognized $539,436 (in thousands) in pension expense related to all defined benefit plans in which it participates. TRSL, DARS, LCCRRF and ROVERS recognized revenues in the amount of $8,321 (in thousands) in ad valorem taxes collected from non-employee contributing entities. At June 30, 2015 the State reported deferred outflows of resources and deferred inflows of resources related to pensions from the following sources (in thousands):
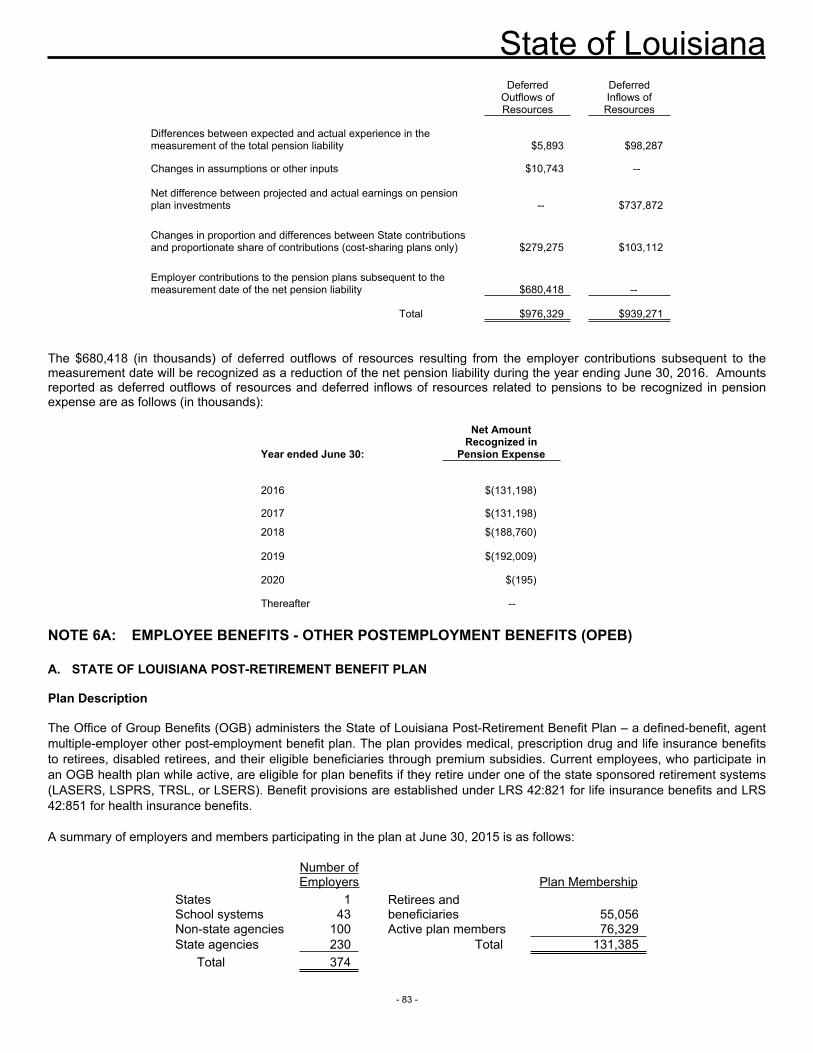
State of Louisiana
- 83 -
Deferred Outflows of Resources
Deferred Inflows of
Resources
Differences between expected and actual experience in the measurement of the total pension liability $5,893 $98,287
Changes in assumptions or other inputs $10,743 --
Net difference between projected and actual earnings on pension plan investments -- $737,872
Changes in proportion and differences between State contributions and proportionate share of contributions (cost-sharing plans only) $279,275 $103,112
Employer contributions to the pension plans subsequent to the measurement date of the net pension liability $680,418 --
Total $976,329 $939,271
The $680,418 (in thousands) of deferred outflows of resources resulting from the employer contributions subsequent to the measurement date will be recognized as a reduction of the net pension liability during the year ending June 30, 2016. Amounts reported as deferred outflows of resources and deferred inflows of resources related to pensions to be recognized in pension expense are as follows (in thousands):
Year ended June 30:
Net Amount Recognized in
Pension Expense
2016 $(131,198)
2017 $(131,198)
2018 $(188,760)
2019 $(192,009)
2020 $(195)
Thereafter --
NOTE 6A: EMPLOYEE BENEFITS - OTHER POSTEMPLOYMENT BENEFITS (OPEB)
A. STATE OF LOUISIANA POST-RETIREMENT BENEFIT PLAN
Plan Description
The Office of Group Benefits (OGB) administers the State of Louisiana Post-Retirement Benefit Plan – a defined-benefit, agent multiple-employer other post-employment benefit plan. The plan provides medical, prescription drug and life insurance benefits to retirees, disabled retirees, and their eligible beneficiaries through premium subsidies. Current employees, who participate in an OGB health plan while active, are eligible for plan benefits if they retire under one of the state sponsored retirement systems (LASERS, LSPRS, TRSL, or LSERS). Benefit provisions are established under LRS 42:821 for life insurance benefits and LRS 42:851 for health insurance benefits.
A summary of employers and members participating in the plan at June 30, 2015 is as follows:
Number of Employers Plan Membership
States 1School systems 43
Retirees and beneficiaries 55,056
Non-state agencies 100 Active plan members 76,329State agencies 230 Total 131,385
Total 374
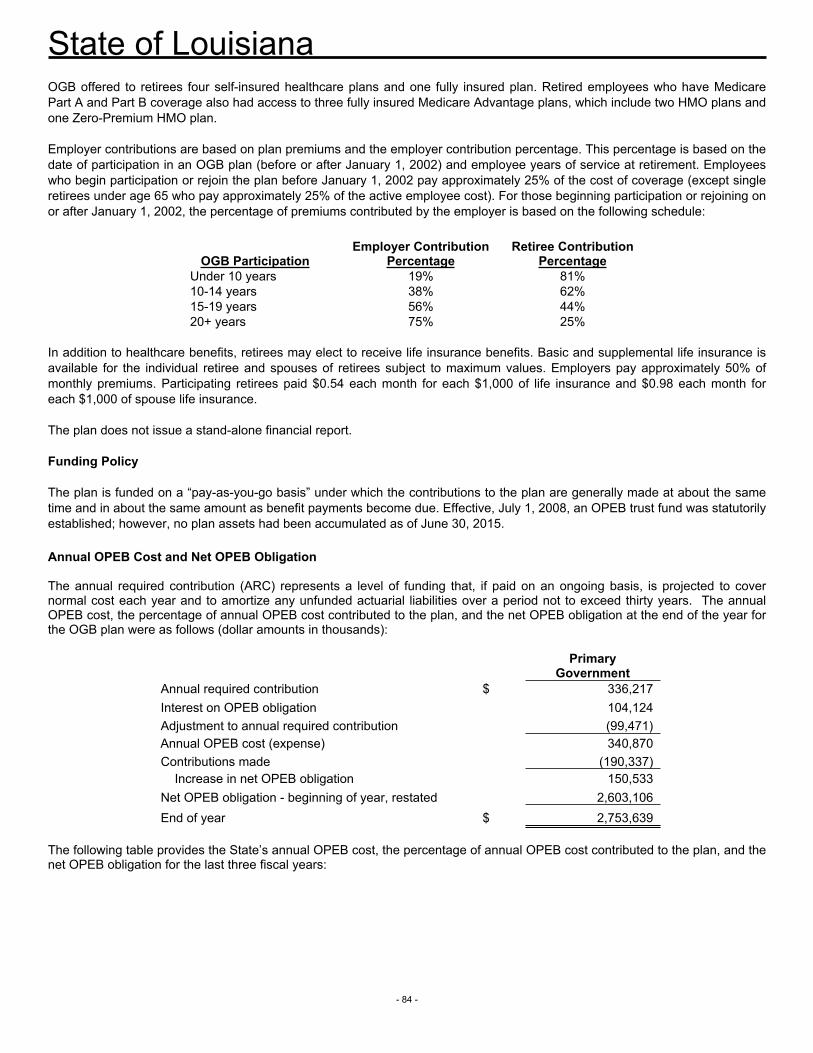
State of Louisiana
- 84 -
OGB offered to retirees four self-insured healthcare plans and one fully insured plan. Retired employees who have Medicare Part A and Part B coverage also had access to three fully insured Medicare Advantage plans, which include two HMO plans and one Zero-Premium HMO plan.
Employer contributions are based on plan premiums and the employer contribution percentage. This percentage is based on the date of participation in an OGB plan (before or after January 1, 2002) and employee years of service at retirement. Employees who begin participation or rejoin the plan before January 1, 2002 pay approximately 25% of the cost of coverage (except single retirees under age 65 who pay approximately 25% of the active employee cost). For those beginning participation or rejoining on or after January 1, 2002, the percentage of premiums contributed by the employer is based on the following schedule:
OGB ParticipationEmployer Contribution
PercentageRetiree Contribution
PercentageUnder 10 years 19% 81%10-14 years 38% 62%15-19 years 56% 44%20+ years 75% 25%
In addition to healthcare benefits, retirees may elect to receive life insurance benefits. Basic and supplemental life insurance is available for the individual retiree and spouses of retirees subject to maximum values. Employers pay approximately 50% of monthly premiums. Participating retirees paid $0.54 each month for each $1,000 of life insurance and $0.98 each month for each $1,000 of spouse life insurance.
The plan does not issue a stand-alone financial report.
Funding Policy
The plan is funded on a “pay-as-you-go basis” under which the contributions to the plan are generally made at about the same time and in about the same amount as benefit payments become due. Effective, July 1, 2008, an OPEB trust fund was statutorily established; however, no plan assets had been accumulated as of June 30, 2015.
Annual OPEB Cost and Net OPEB Obligation
The annual required contribution (ARC) represents a level of funding that, if paid on an ongoing basis, is projected to cover normal cost each year and to amortize any unfunded actuarial liabilities over a period not to exceed thirty years. The annual OPEB cost, the percentage of annual OPEB cost contributed to the plan, and the net OPEB obligation at the end of the year for the OGB plan were as follows (dollar amounts in thousands):
PrimaryGovernment
Annual required contribution $ 336,217Interest on OPEB obligation 104,124Adjustment to annual required contribution (99,471)Annual OPEB cost (expense) 340,870Contributions made (190,337) Increase in net OPEB obligation 150,533Net OPEB obligation - beginning of year, restated 2,603,106End of year $ 2,753,639
The following table provides the State’s annual OPEB cost, the percentage of annual OPEB cost contributed to the plan, and the net OPEB obligation for the last three fiscal years:
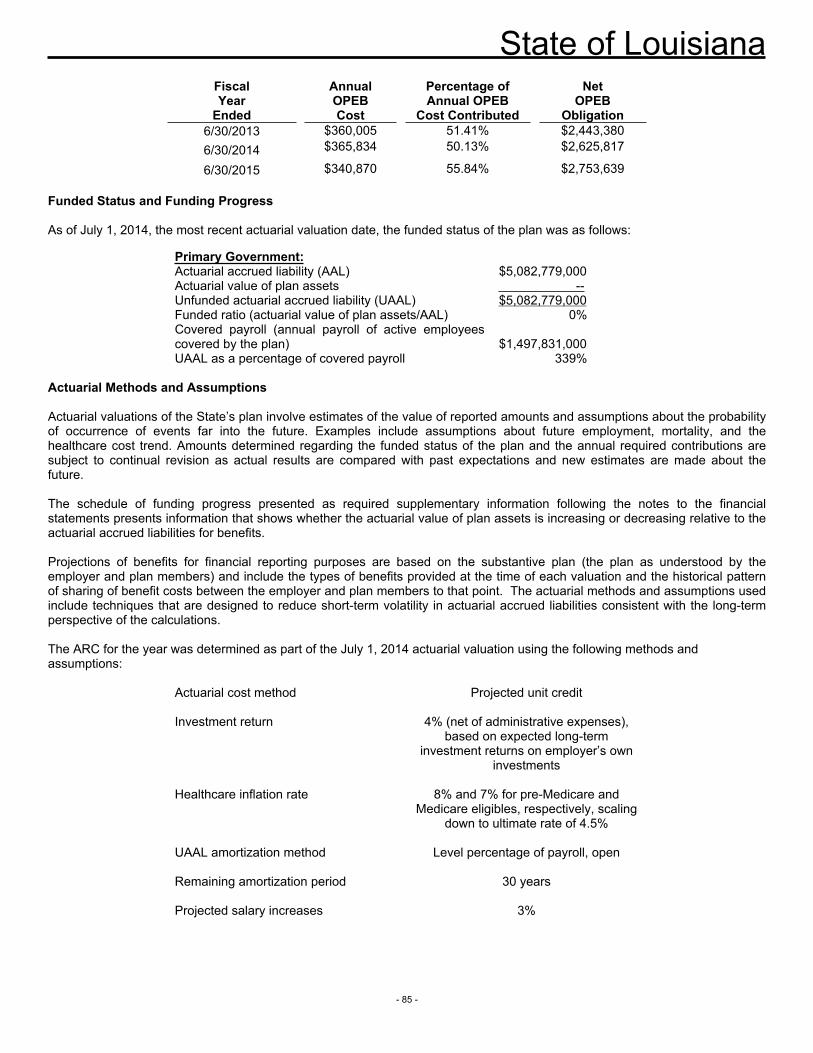
State of Louisiana
- 85 -
Fiscal Annual Percentage of NetYear OPEB Annual OPEB OPEB
Ended Cost Cost Contributed Obligation6/30/2013 $360,005 51.41% $2,443,3806/30/2014 $365,834 50.13% $2,625,817
6/30/2015 $340,870 55.84% $2,753,639
Funded Status and Funding Progress
As of July 1, 2014, the most recent actuarial valuation date, the funded status of the plan was as follows:government:Primary Government: Actuarial accrued liability (AAL) $5,082,779,000Actuarial value of plan assets --Unfunded actuarial accrued liability (UAAL) $5,082,779,000Funded ratio (actuarial value of plan assets/AAL) 0%Covered payroll (annual payroll of active employees covered by the plan) $1,497,831,000UAAL as a percentage of covered payroll 339%
Actuarial Methods and Assumptions
Actuarial valuations of the State’s plan involve estimates of the value of reported amounts and assumptions about the probability of occurrence of events far into the future. Examples include assumptions about future employment, mortality, and the healthcare cost trend. Amounts determined regarding the funded status of the plan and the annual required contributions are subject to continual revision as actual results are compared with past expectations and new estimates are made about the future.
The schedule of funding progress presented as required supplementary information following the notes to the financial statements presents information that shows whether the actuarial value of plan assets is increasing or decreasing relative to the actuarial accrued liabilities for benefits.
Projections of benefits for financial reporting purposes are based on the substantive plan (the plan as understood by the employer and plan members) and include the types of benefits provided at the time of each valuation and the historical pattern of sharing of benefit costs between the employer and plan members to that point. The actuarial methods and assumptions used include techniques that are designed to reduce short-term volatility in actuarial accrued liabilities consistent with the long-term perspective of the calculations.
The ARC for the year was determined as part of the July 1, 2014 actuarial valuation using the following methods and assumptions:
Actuarial cost method Projected unit credit
Investment return 4% (net of administrative expenses), based on expected long-term
investment returns on employer’s own investments
Healthcare inflation rate 8% and 7% for pre-Medicare and Medicare eligibles, respectively, scaling
down to ultimate rate of 4.5%
UAAL amortization method Level percentage of payroll, open
Remaining amortization period 30 years
Projected salary increases 3%
State of Louisiana
- 86 -
Costs used in the determination of the actuarial accrued liability for the self-insured plans were developed from reported incurred medical and prescription drug claims experience and administrative costs during the period from March 1, 2013 through February 28, 2015 less retiree premiums. Costs for the fully insured plans were developed from the employer share of monthly premiums without adjustment for age.
B. LSU HEALTH PLAN
Plan Description
The Louisiana State University System (LSU System), a discretely presented component unit of the State, offers its eligible employees, retirees, and their beneficiaries the opportunity to participate in one of two OPEB plans affording healthcare and life insurance. One offering is the State of Louisiana Post-Retirement Benefit Plan, which has already been discussed in this note, and the other is the LSU Health Plan (the Plan). The Plan is also offered to members of the State House of Representatives and the State Senate, its officers and staff, and the Legislative Budgetary Control Council which are primary government entities. Therefore, some participants of the Plan are currently employees of the primary government. Since participation in the Plan by primary government employees is limited and not material, the plan is identified as a single-employer defined benefit healthcare plan.
Benefit provisions are established or may be amended under the authority of LRS 42:851.
Employer contributions are based on plan premiums and the employer contribution percentage. This percentage is based on the date of participation in an OGB plan (before or after January 1, 2002) and employee years of service at retirement. Employees who begin participation or rejoin the plan before January 1, 2002 pay approximately 25% of the cost of coverage (except single retirees under age 65 who pay approximately 25% of the active employee cost). For those beginning participation or rejoining on or after January 1, 2002, the percentage of premiums contributed by the employer is based on the following schedule:
Health Plan Participation
Employer Contribution Percentage
Retiree Contribution Percentage
Under 10 years 19% 81%10-14 years 38% 62%15-19 years 56% 44%20+ years 75% 25%
The Plan does not issue a stand-alone financial report.
Funding Policy
The plan is financed on a pay-as-you-go basis under which the contributions to the plan are generally made at about the same time and in about the same amount as benefit payments become due. The pay-as-you-go expense is the net expected cost of providing retiree benefits. This expense includes all expected claims and related expenses and is offset by retiree contributions.
Annual OPEB Cost and Net OPEB Obligation
The annual required contribution (ARC) represents a level of funding that, if paid on an ongoing basis, is projected to cover normal cost each year and to amortize any unfunded actuarial liabilities over a period not to exceed thirty years. The annual OPEB cost, the percentage of annual OPEB cost contributed to the plan, and the net OPEB obligation at the end of the year were as follows (dollar amounts in thousands):
State of Louisiana
- 87 -
Primary Government
Annual required contribution $ 4,282
Interest on OPEB obligation 634Adjustment to annual required contribution (606)Annual OPEB costs (expense) 4,310 Contributions made (1,015) Increase in net OPEB obligation 3,295Net OPEB obligation beginning of year 16,032Net OPEB obligation end of year $ 19,327
The following table provides the State’s annual OPEB cost, the percentage of annual OPEB cost contributed to the plan, and the net OPEB obligation for the last three fiscal years:
FiscalYear
Ended
AnnualOPEBCost
Percentageof Annual
OPEB CostContributed
NetOPEB
Obligation6/30/2013 $5,817 12.19% $13,6966/30/2014 $3,103 24.72% $16,0326/30/2015 $4,310 23.54% $19,327
Funded Status and Funding Progress
As of July 1, 2014, the most recent actuarial valuation date, the funded status of the plan was as follows:
Primary government:Primary Government:Actuarial accrued liability (AAL) $ 45,415,660Actuarial value of plan assets --Unfunded actuarial accrued liability (UAAL) $ 45,415,660Funded ratio (actuarial value of plan assets/AAL) 0%Covered payroll (annual payroll of active employees covered by the plan) $ 28,351,669UAAL as a percentage of covered payroll 160%
Actuarial Methods and Assumptions
Actuarial valuations of the LSU Health Plan involve estimates of the value of reported amounts and assumptions about the probability of occurrence of events far into the future. Actuarial determined amounts are subject to continual revision as actual results are compared with past expectations and new estimates are made about the future.
The schedule of funding progress presented as required supplementary information following the notes to the financial statements presents information that shows whether the actuarial value of plan assets is increasing or decreasing relative to the actuarial accrued liabilities for benefits.
Projections of benefits for financial reporting purposes are based on the substantive plan (the plan as understood by the employer and plan members) and include the types of benefits provided at the time of each valuation and the historical pattern of sharing of benefit costs between the employer and plan members to that point. The actuarial methods and assumptions used include techniques that are designed to reduce short-term volatility in actuarial accrued liabilities consistent with the long-term perspective of the calculations.
State of Louisiana
- 88 -
The ARC for the year was determined as part of the July 1, 2014 actuarial valuation using the following methods and assumptions:
Actuarial cost method Projected unit credit
Investment return 4.00% (net of administrative expenses), based on long-term investment returns
on employer’s own investments
Healthcare inflation rate 8.5%, ultimate rate of 4.5%
UAAL amortization method Level percentage of payroll, open
Remaining amortization period 30 years
Projected salary increases 3%
NOTE 6B: EMPLOYEE BENEFITS - TERMINATION BENEFITS
A. Background
Termination benefits are provided by the State for purposes other than salary and wages, such as cash payments for severance benefits or an employee’s continued access to healthcare. The termination benefits are provided as settlement for:
1) involuntary terminations initiated by management in accordance with an authorized plan that contains specific criteria for identifying affected employees (for example, a reduction in force plan) or
2) voluntary terminations initiated by employees in response to an early retirement incentive plan offered by the state in exchange for an employee’s continued employment.
B. Description of Termination Benefits
In fiscal year 2015 some state agencies adopted lay off avoidance plans to provide a mechanism to manage budget deficits while delaying or avoiding layoffs. These layoff avoidance plans included early retirement incentives, which resulted in the payment of termination benefits. The retirement incentives consisted of up to 50% of the employees’ annual salary that would be saved in a fiscal or calendar year calculated on the employees’ actual salary for the year without the need for future discounting. Each layoff avoidance plan was approved by the Department of Civil Service in accordance with Civil Service Rules 17.2 and 17.9. The incentives were offered to employees who were eligible for regular retirement in accordance with the employees’ applicable state retirement system regulations. Employees who were eligible for early retirement were excluded.
C. Termination Benefits Reported
During the year ended June 30, 2015, there were 38 primary government terminations that met the termination criteria described above. The governmental fund and government-wide statements both include $892,933 of expenditures/expenses and no related liabilities.
NOTE 7: LEASES
A. LEASE AGREEMENTS
The State of Louisiana has entered into numerous operating and capital lease agreements for equipment, land, and buildings. Most leases contain non-appropriation exculpatory clauses that allow lease cancellation if the Louisiana Legislature does not make an appropriation for its continuation during any future fiscal period. Because legislative appropriation is reasonably assured, all leases contracted by the state are included in the schedules below.
State of Louisiana
- 89 -
B. OPERATING LEASES
Operating lease payments are recorded as expenses in the accompanying financial statements. Operating lease expenses for the primary government totaled (expressed in thousands) $69,067 for the fiscal year ended June 30, 2015. Commitments of the primary government under operating lease agreements for equipment, land, and buildings provide for future annual rental payments as follows (expressed in thousands):
Fiscal Year Office Space Equipment Land Other Total2016 $ 43,572 $ 2,513 $ 57 $ 6,154 $ 52,2962017 26,293 622 56 4,768 31,7392018 20,640 606 56 4,436 25,7382019 14,819 554 56 3,786 19,2152020 9,971 556 54 3,738 14,319
2021-2025 20,703 1,885 71 4,003 26,6622026-2030 43,883 1,927 1 3,777 49,588
Total $ 179,881 $ 8,663 $ 351 $ 30,662 $ 219,557
C. CAPITAL LEASES AND INSTALLMENT PURCHASE AGREEMENTS
Capital lease obligations are payable from resources of the governmental and proprietary funds. The following is a schedule of future minimum payments remaining under contracts in existence at June 30, 2015 (expressed in thousands):
The gross amount of the leased assets at June 30, 2015 (expressed in thousands) for governmental activities is $1,767 for other; business-type activities is $4,395 for office space.
Total capital leases by asset classes include the following (expressed in thousands):
Governmental Activities
Business-Type Activities
Buildings $ -- $ --Office Space -- 4,149Equipment -- --Land -- --Other 78 --
Total Capital Leases $ 78 $ 4,149
D. LESSOR LEASES
Various property and facilities are leased to outside parties including port authorities, levee districts, universities, and various other entities. The lease revenues (expressed in thousands) were $1,845 for the primary government and $3,835 for business-type activities for the fiscal year ending June 30, 2015.
Governmental Business-TypeFiscal Year Activities Activities
2016 $ 39 $ 2002017 39 2882018 -- 2872019 -- 2822020 -- 281
2021-2025 -- 1,4122026-2030 -- 1,400
Subtotal 78 4,150Less interest and executory costs -- (1,057)Present value of minimum lease Payments $ 78 $ 3,093
State of Louisiana
- 90 -
The value of the property carried on the financial reports for the entities included below (expressed in thousands) is $206 for land, $20,922 for buildings and $1,053 for equipment. Accumulated depreciation on the buildings and equipment totaled $9,363.
OPERATING LEASES
The following is a schedule by years of minimum future rentals on operating leases as of June 30, 2015 (expressed in thousands):
The contingent rental revenue received from the lessor operating leases above as of June 30, 2015 (expressed in thousands) is $200 for office rentals.
NOTE 8: LONG-TERM OBLIGATIONS
A. DEBT AUTHORIZATION AND LIMITATIONS
The Louisiana Constitution of 1974 provides that the State shall have no power, directly or indirectly, through any board, agency, commission, or otherwise, to incur debt or issue bonds except by law enacted by two-thirds of the elected members of each house of the Legislature. LRS 39:1365(25) limits the legislative authorization of general obligation bonds and other general obligations secured by the full faith and credit of the State by prohibiting total authorized bonds from exceeding an amount equal to two times the average annual revenues of the Bond Security and Redemption Fund for the last three fiscal years prior to such authorization. The bond authorization limitation is $25,110,650,000. The total general obligation bonds authorized are $3,129,840,000 at June 30, 2015, or 12.46% of the bond authorization limit.
LRS 39:1402(D) limits issuance by the Louisiana State Bond Commission of general obligation bonds or other general obligations secured by the full faith and credit of the State. The highest annual debt service requirement for the current or any subsequent fiscal years for general obligation debt, including the debt service on any bonds or other obligations that are proposed to be sold by the Louisiana State Bond Commission, may not exceed 10% of the average annual revenues of the Bond Security and Redemption Fund for the last three fiscal years completed prior to the issuance being proposed. The general obligation debt issuance limitation is $1,255,533,000. At June 30, 2015, the highest current or future annual general obligation debt service requirement is $360,575,000, which represents 28.72% of the debt issuance limitation.
LRS 39:1367, enacted pursuant to a constitutional amendment, prohibits the issuance of net state tax-supported debt if the amount which is to be expended for servicing such outstanding debt exceeds 6% of the estimate of money to be received by the state general fund and dedicated funds for each respective fiscal year as contained in the official forecast adopted by the Revenue Estimating Conference at its first meeting after the beginning of each fiscal year.
Debt service included in the net state tax-supported debt limitation provided in LRS 39:1367 differs from the debt service expenditures reported in the accompanying financial statements. These differences are as follows:
Governmental Business-TypeFiscal Year Activities Activities
2016 $ 1,429 $ 3,2212017 2 2,7352018 2 1,6242019 2 1,4692020 2 395
2021-2025 11 1,4502026-2030 11 --2031-2035 11 --
Total $ 1,470 $ 10,894
State of Louisiana
- 91 -
The State has entered into various cooperative endeavor agreements with various issuing governments whereby the State requests the Legislature to appropriate funds sufficient to pay the annual debt service requirements of the issuers’ bonds. The Legislature is not obligated to appropriate these funds and there is no recourse to the State in the event of non-appropriation. Since the State is not the issuer of the bonds and has the discretion to avoid the expenditure of State resources through non-appropriation, these bonds are not reported as liabilities in the accompanying financial statements. Payments for principal and interest made pursuant to the annual appropriations act for these bonds are reported as grant expenditures rather than debt service expenditures in the accompanying financial statements. Total payments on these bonds during fiscal year 2015 totaled $40,228,855.
On July 12, 2006, in response to the need to assist local political subdivisions as the result of Hurricanes Katrina and Rita, the State Bond Commission, on behalf of the State of Louisiana, issued General Obligation Gulf Tax Credit Bonds, Series 2006A and General Obligation Match Bonds, Series 2006B in the amounts of $200 million and $194.475 million, respectively, for the purpose of providing loans to assist in the payment of debt service on certain bonds, notes, certificates of indebtedness or other written obligations of local political subdivisions of the State and to pay debt service on general obligation bonds of the State, under a debt payment assistance program authorized by the Gulf Opportunity Zone Act of 2005 and by Act 41 of the 2006 First Extraordinary Session of the Legislature. The bonds have been subsequently refunded several times. The debt service on these bonds are excluded from the net state tax-supported debt calculation. Debt service expenditures during fiscal year 2015 for these bonds were $27,787,971.
In fiscal year 2001 the State, through the Tobacco Settlement Financing Corporation, issued bonds to access future tobacco settlement revenues received pursuant to the Master Settlement Agreement. While the bonds and related debt service expenditures are included in the accompanying financial statements, the bonds are not considered net state tax-supported debt. Debt service expenditures during fiscal year 2015 for these bonds were $34,061,113.
The maximum amount of net State tax-supported debt allowed by statute for fiscal year 2014-2015 was $631,404,000. During the fiscal year 2014-2015, the total net State tax-supported debt paid was $607,317,760 or 5.77% of the estimated General Fund and dedicated funds’ revenues established by the Revenue Estimating Conference.
B. AUTHORIZED BUT UNISSUED DEBT
The Omnibus Bond Authorization Act of 2015 provides for the repeal of all acts authorizing the issuance of general obligation bonds, except for any act authorizing issuance of refunding bonds and Act 41 of the 2006 First Extraordinary Session. Act 41 authorized the sale of bonds to provide relief to political subdivisions of the state affected by natural catastrophes. The Omnibus Bond Authorization Act requires the legislature to annually repeal the issuance of general obligation bond authorizations for projects that are no longer found feasible or desirable, to reauthorize general obligation bonds for projects deemed to be essential, and to authorize new projects. As a result, there were no authorized but unissued general obligation bonds outstanding at June 30, 2015.
C. PURPOSE AND RETIREMENT OF GENERAL OBLIGATION BONDS
General obligation bonds are authorized and issued primarily to provide funds for constructing and improving various facilities including ports, university facilities, public schools, parks, bridges, roads, and charity hospitals. General obligation bonds are backed by the full faith, credit, and taxing power of the State.
In order to facilitate the funding of capital improvements by certain governmental units and political subdivisions of the State, general obligation bonds proceeds may be provided to various entities contingent upon executing a reimbursement contract with the State Bond Commission. The entity repays or reimburses the State at the same interest rate and the same maturity dates as the bond issue. Entities utilize reimbursement contracts to attempt to obtain a better interest rate.
Reimbursement contracts include miscellaneous contracts in the amount of $20,000. Applicable interest to maturity is $1,588. In the accompanying financial statements, reimbursement contracts are shown as accounts receivable and the debt shown is not reduced for these items.
State of Louisiana
- 92 -
D. LONG-TERM OBLIGATIONS OUTSTANDING AT JUNE 30, 2015
Long-term obligations outstanding at June 30, 2015, principal only, are as follows (expressed in thousands):
Long-Term Obligations Beginning Balance Additions Deletions Ending
BalanceDue Within One Year
Interest Rates
GOVERNMENTAL ACTIVITIES:General obligation bonds payable $ 3,137,100 $ 752,865 $ 457,415 $ 3,432,550 $ 241,515 0.43 - 5.00%
Other bonds payable by Agency:Health Education Authority of Louisiana 6,530 -- 225 6,305 235 5.70 - 8.30%Louisiana Correctional Facilities Corporation 13,110 668 1,945 11,833 2,025 2.88 - 5.00%Department of Corrections 27,969 -- 1,608 26,361 1,664 4.62 - 4.87%Office Facilities Corporation 164,575 -- 20,335 144,240 21,220 2.50 - 5.00%Public Safety LPFA 39,110 -- 4,930 34,180 5,185 5.00%Tobacco Settlement Financing 659,745 -- -- 659,745 12,800 5.00 - 5.50%State Highway Improvement 281,585 -- 6,225 275,360 9,320 4.00 - 5.00%Unclaimed Property Special Revenue 111,675 -- -- 111,675 3,825 2.00 - 5.00%Transportation Infrastructure Model for Economic Development 2,707,845 864,705 918,165 2,654,385 21,450 variable
Total other bonds payable $ 4,012,144 $ 865,373 $ 953,433 $ 3,924,084 $ 77,724
Add/Subtract unamortized amounts: Discounts $ -- $ -- $ -- $ -- $ --Premiums* 518,533 211,143 78,578 651,098 50,398
Net Unamortized Amounts* 518,533 211,143 78,578 651,098 50,398Total bonded debt* $ 7,667,777 $ 1,829,381 $ 1,489,426 $ 8,007,732 $ 369,637
Other liabilities:Compensated absences* $ 187,348 $ 89,440 $ 83,278 $ 193,510 $ 17,059Capital lease obligations 973 -- 895 78 39Notes payable 1,029 7,495 1,625 6,899 1,631Net OPEB Obligation* 2,460,951 321,249 180,808 2,601,392 --Pollution remediation liabilities* 27,852 9,268 13,710 23,410 8,842Other long-term obligations 124,545 -- 3,894 120,651 3,922
Total Other Liabilities* $ 2,802,698 $ 427,452 $ 284,210 $ 2,945,940 $ 31,493*restated
BUSINESS-TYPE ACTIVITIES:Bonds payable: Revenue bonds $ 524,385 $ 128,330 $ 19,130 $ 633,585 $ 22,585 1.89 - 5.50% Unamortized Discounts and Premiums 7,457 18,505 258 25,704 (147)Total Bonds payable $ 531,842 $ 146,835 $ 19,388 $ 659,289 $ 22,438
Other liabilities: Compensated absences $ 20,409 $ 6,153 $ 5,793 $ 20,769 $ 2,273 Capital lease obligations 3,258 -- 165 3,093 83 Notes payable 1,476 -- 878 598 598 Contracts payable 52 8 57 3 -- Net OPEB Obligation* 158,184 23,932 10,542 171,574 -- Other long-term liabilities 3,077 -- 457 2,620 2,620Total Other Liabilities* $ 186,456 $ 30,093 $ 17,892 $ 198,657 $ 5,574*restated
Note: Information about changes in the net pension liability and the estimated liability for claims is contained in Notes 6 and 9, respectively.
State of Louisiana
- 93 -
E. DEBT SERVICE REQUIREMENTS AT JUNE 30, 2015
Interest requirements for variable-rate debt are calculated using the rate in effect at the financial statement date. Annual principal and interest for bonds and notes are as follows (expressed in thousands):
Governmental ActivitiesBonds Payable Notes Payable Totals
Year: Principal Interest
Net Effect of
Derivatives Principal InterestTotal
Principal
Total Interest
Cost2016 $ 319,239 $ 315,523 $ 15,445 $ 1,631 $ 62 $ 320,870 $ 331,030
2017 334,530 301,747 15,403 1,644 46 336,174 317,196
2018 343,116 288,138 15,403 1,584 30 344,700 303,571
2019 348,719 273,994 15,403 1,511 14 350,230 289,411
2020 350,506 258,742 15,445 513 2 351,019 274,189
2021-25 1,564,665 1,065,832 77,040 16 -- 1,564,681 1,142,872
2026-30 1,387,293 716,148 76,194 -- -- 1,387,293 792,342
2031-35 1,286,319 409,037 73,019 -- -- 1,286,319 482,056
2036-40 739,306 188,765 66,654 -- -- 739,306 255,419
2041-45 682,941 45,479 28,134 -- -- 682,941 73,613
Total $ 7,356,634 $ 3,863,405 $ 398,140 $ 6,899 $ 154 $ 7,363,533 $ 4,261,699
Business-Type ActivitiesRevenue Bonds Notes Payable Total
Year: Principal Interest Principal Interest Principal Interest
2016 $ 22,585 $ 23,007 $ 598 $ 12 $ 23,183 $ 23,019
2017 25,355 23,748 -- -- 25,355 23,748
2018 26,700 22,997 -- -- 26,700 22,997
2019 20,205 22,383 -- -- 20,205 22,383
2020 21,195 21,939 -- -- 21,195 21,939
2021-25 125,115 97,727 -- -- 125,115 97,727
2026-30 125,125 66,206 -- -- 125,125 66,206
2031-35 87,505 45,729 -- -- 87,505 45,729
2036-40 119,950 23,175 -- -- 119,950 23,175
2041-45 41,665 4,445 -- -- 41,665 4,445
2046-50 18,185 344 -- -- 18,185 344
Total $ 633,585 $ 351,700 $ 598 $ 12 $ 634,183 $ 351,712
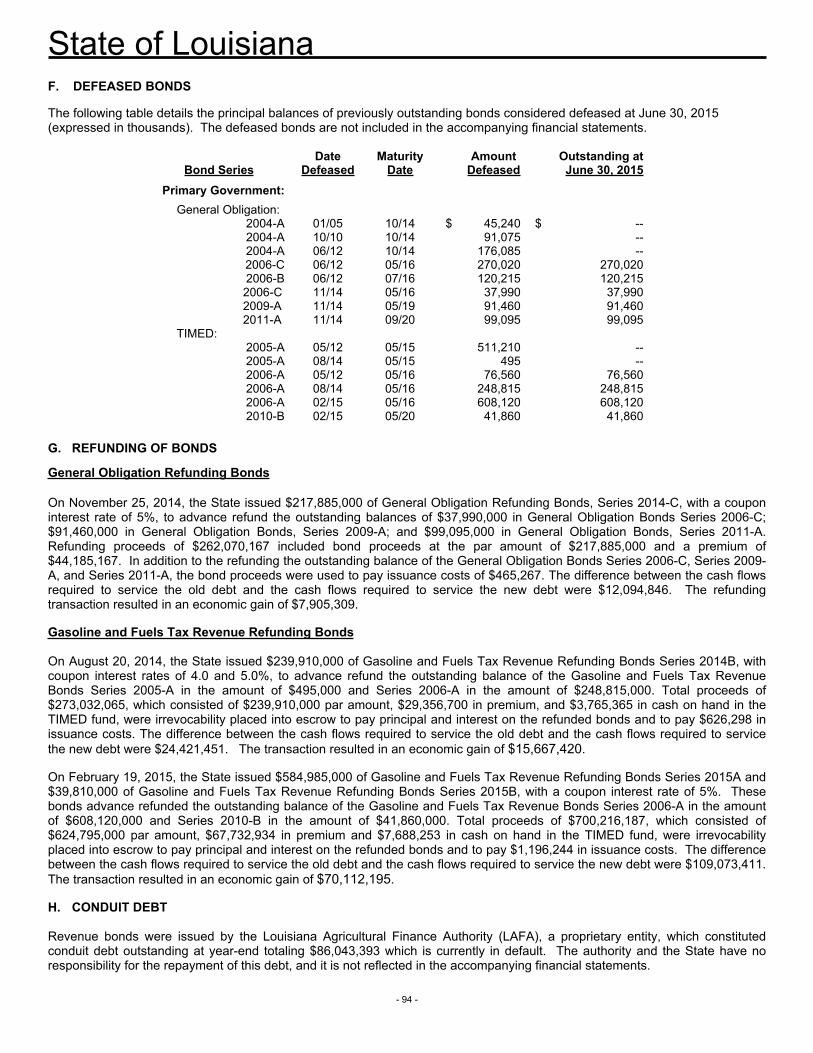
State of Louisiana
- 94 -
F. DEFEASED BONDS
The following table details the principal balances of previously outstanding bonds considered defeased at June 30, 2015 (expressed in thousands). The defeased bonds are not included in the accompanying financial statements.
Bond SeriesDate
DefeasedMaturity
DateAmount
DefeasedOutstanding at June 30, 2015
Primary Government: General Obligation:
2004-A 01/05 10/14 $ 45,240 $ --2004-A 10/10 10/14 91,075 --2004-A 06/12 10/14 176,085 --2006-C 06/12 05/16 270,020 270,020 2006-B 06/12 07/16 120,215 120,215
2006-C 11/14 05/16 37,990 37,990 2009-A 11/14 05/19 91,460 91,460 2011-A 11/14 09/20 99,095 99,095 TIMED:
2005-A 05/12 05/15 511,210 --2005-A 08/14 05/15 495 --2006-A 05/12 05/16 76,560 76,5602006-A 08/14 05/16 248,815 248,8152006-A 02/15 05/16 608,120 608,1202010-B 02/15 05/20 41,860 41,860
G. REFUNDING OF BONDS
General Obligation Refunding Bonds
On November 25, 2014, the State issued $217,885,000 of General Obligation Refunding Bonds, Series 2014-C, with a coupon interest rate of 5%, to advance refund the outstanding balances of $37,990,000 in General Obligation Bonds Series 2006-C; $91,460,000 in General Obligation Bonds, Series 2009-A; and $99,095,000 in General Obligation Bonds, Series 2011-A. Refunding proceeds of $262,070,167 included bond proceeds at the par amount of $217,885,000 and a premium of $44,185,167. In addition to the refunding the outstanding balance of the General Obligation Bonds Series 2006-C, Series 2009-A, and Series 2011-A, the bond proceeds were used to pay issuance costs of $465,267. The difference between the cash flows required to service the old debt and the cash flows required to service the new debt were $12,094,846. The refunding transaction resulted in an economic gain of $7,905,309.
Gasoline and Fuels Tax Revenue Refunding Bonds
On August 20, 2014, the State issued $239,910,000 of Gasoline and Fuels Tax Revenue Refunding Bonds Series 2014B, with coupon interest rates of 4.0 and 5.0%, to advance refund the outstanding balance of the Gasoline and Fuels Tax Revenue Bonds Series 2005-A in the amount of $495,000 and Series 2006-A in the amount of $248,815,000. Total proceeds of $273,032,065, which consisted of $239,910,000 par amount, $29,356,700 in premium, and $3,765,365 in cash on hand in the TIMED fund, were irrevocability placed into escrow to pay principal and interest on the refunded bonds and to pay $626,298 in issuance costs. The difference between the cash flows required to service the old debt and the cash flows required to service the new debt were $24,421,451. The transaction resulted in an economic gain of $15,667,420.
On February 19, 2015, the State issued $584,985,000 of Gasoline and Fuels Tax Revenue Refunding Bonds Series 2015A and $39,810,000 of Gasoline and Fuels Tax Revenue Refunding Bonds Series 2015B, with a coupon interest rate of 5%. These bonds advance refunded the outstanding balance of the Gasoline and Fuels Tax Revenue Bonds Series 2006-A in the amount of $608,120,000 and Series 2010-B in the amount of $41,860,000. Total proceeds of $700,216,187, which consisted of $624,795,000 par amount, $67,732,934 in premium and $7,688,253 in cash on hand in the TIMED fund, were irrevocability placed into escrow to pay principal and interest on the refunded bonds and to pay $1,196,244 in issuance costs. The difference between the cash flows required to service the old debt and the cash flows required to service the new debt were $109,073,411. The transaction resulted in an economic gain of $70,112,195.
H. CONDUIT DEBT
Revenue bonds were issued by the Louisiana Agricultural Finance Authority (LAFA), a proprietary entity, which constituted conduit debt outstanding at year-end totaling $86,043,393 which is currently in default. The authority and the State have no responsibility for the repayment of this debt, and it is not reflected in the accompanying financial statements.
State of Louisiana
- 95 -
I. OTHER GENERAL LONG-TERM OBLIGATIONS
The liability for compensated absences is described in detail in Note 1, Section C; the liability for capital leases is described in more detail in Note 7, Section C; the liability for claims and litigation is described in more detail in Note 9, Section B; the liability for OPEB is described in more detail in Note 6A; and the liability for pollution remediation is described in more detail in Note 9, Section F.
J. PLEDGED REVENUES
Governmental Activities
Motor Vehicle Registration and License Fees
In March 2013, the State issued State Highway Improvement Revenue Bonds Series 2013A maturing in 2033 in the amount of $85,400,000 and in February 2014, the state issued State Highway Improvement Revenue Bonds Series 2014A maturing in 2034 in the amount of $198,135,000. As of June 30, 2015, the outstanding maturities extend to 2034. The bonds are secured by and payable from annual motor vehicles registration and license fees or taxes for the registration and licensing of all vehicles and motor vehicles which are collected by the Department of Public Safety. Total motor vehicle registration and license fees available in fiscal year 2015 were $53,069,931. The principal and interest paid for the current year was $6,225,000 and $16,770,945. The total principal and interest remaining on the bonds is $275,360,000 and $154,679,250, respectively.
Contract Parking Agreement – Tulane University
Health Education Authority of Louisiana (HEAL) is a body corporate created to operate a multi-institutional facility that included public and private institutions dedicated to health related services (the Medical Complex). HEAL issued taxable revenue bonds of $9,350,000 in December 1998 to finance the acquisition, construction and installation of an additional 516 parking spaces to an existing multilevel parking garage and build a skywalk to another facility. The garage was for Tulane Medical Center employees and students, visitors to the Medical Complex and the public. The bonds are payable solely from the income and revenues derived by the Authority from the parking garage, including payments received from Tulane University pursuant to a contract parking agreement and lease agreement through 2031. The Authority has agreed to pay the principal and interest requirements as they become due and payable until the bonds are fully paid in 2031. The principal and interest paid for the current year was $225,000 and $421,920. The total principal and interest remaining on the bonds is $6,305,000 and $4,015,205, respectively.
Office of Motor Vehicle Handling Fees
In October 2007 the Louisiana Public Facilities Authority (LPFA) issued $62,895,000 of revenue refunding bonds on behalf of the Department of Public Safety and Corrections to advance refund the 1999 and 2001 outstanding revenue bonds. The refunded bonds were issued to acquire, construct, and equip a new Department of Public Safety Services complex and a new Joint Emergency Services Training Center complex. The refunding bonds are secured by an irrevocable pledge and dedication of the handling fees collected by the Office of Motor Vehicles through August 2021. The Department collected $15,099,081 during fiscal year ended June 30, 2015. The principal and interest paid for the current year was $4,930,000 and $1,832,250, respectively. The total principal and interest remaining on the bonds is $34,180,000 and $5,384,000.
Tobacco Settlement Revenues
The Tobacco Settlement Financing Corporation, a blended component unit, issued $659,745,000 of tobacco settlement asset-backed bonds on July 2, 2013. The revenue bonds were issued to provide up-front cash for a portion of the State’s allocation of tobacco settlement revenues (TSRs) to be received in perpetuity from participating cigarette manufacturers (PMs) pursuant to the Master Settlement Agreement (MSA). Security for the bonds consist of 60% of TSRs required to be paid to the State. The Corporation received pledged revenues of $83,474,412 for fiscal year 2015. The interest paid for the current year was $34,061,113 with no principal payment due. The bonds, payable through 2035, have total principal and interest outstanding of $659,745,000 and $405,348,300, respectively.
Gasoline and Motor Fuels Taxes and Special Fuels Taxes
The State has pledged gasoline and fuel taxes to service debt on outstanding gas and fuels tax revenue bonds. As of June 30, 2015, the outstanding maturities extend to 2045. Bond proceeds are to be used for financing the construction of highway and bridge projects. Revenues available in fiscal year 2015 for funding debt service due were $606,410,312. Principal and interest paid for the current year were $18,875,000 and $138,856,385, respectively. The total principal and interest remaining on the bonds is $2,654,385,000 and $2,354,605,185, respectively.
State of Louisiana
- 96 -
Unclaimed Property Special Revenue Bonds
In December 2013 the State issued $111,675,000 in Unclaimed Property Special Revenue Bonds, Series 2013, consisting of $90,595,000 for the I-49 North Project and $21,080,000 for the I-49 South Project. The purpose of this bond is to match federal funds to be used by the Department of Transportation and Development for the costs of and associated with the construction of Interstate 49. Security for the bonds, which are payable through fiscal year 2034, consist of annual unclaimed property revenues that escheat to the General Fund. Unclaimed property cash receipts for the year were $52,373,233. The interest paid in the current year was $5,358,369. The total principal and interest remaining on the bonds is $111,675,000 and $60,077,515, respectively.
Business-Type Activities
Syrup Mill and Slot Machine Revenues
Louisiana Agricultural Finance Authority issued revenue bonds in 2004 in the amount of $45,000,000 to acquire, construct and equip a syrup mill and other facilities related to the use of sugar cane in Lacassine, Louisiana. The bonds are secured by the pledge of net revenues from the operation of the mill and the avails of net slot machine proceeds as described in LRS 27:392(B)(4). The statute provides $12 million annually to the Authority to fund or secure revenue bonds for agricultural, agronomic, horticultural, etc. and other economic development programs. The Authority is obligated to cover the principal and interest requirements each year until the bonds are fully paid and discharged in 2015. The final principal and interest payment for the current year was $1,625,000 and $35,133, respectively.
Lease Agreement
Louisiana Agricultural Finance Authority issued revenue bonds of $37,000,000 in 2007 to (i) renovate an office building, (ii) purchase new trucks, bulldozers, and other equipment for firefighting and other agricultural purposes, (iii) acquire, construct, and equip buildings and related facilities, and (iv) acquire emergency generators for the Department of Agriculture and Forestry. In December 2012, the authority issued refunding bonds Series 2012 (maturing in 2022) in the amount of $6,705,000 for the purpose of refunding a portion of the 2007 revenue bonds. The bonds are secured solely from income and revenues, and receipts derived or to be derived from payments made or collections obtained in a lease agreement and are payable through 2023. The lease requires the Department to pay from legally available funds, subject to annual appropriation by the Louisiana Legislature, all the amounts necessary to pay the annual debt service and administrative expenses. The principal and interest paid for the current year was $6,480,000 and $1,590,848, respectively. The total principal and interest remaining on the bonds is $30,825,000 and $2,630,880, respectively.
Highway 1 Tolls
Louisiana Transportation Authority, a public corporation within the Department of Transportation and Development (DOTD), issued several series of toll revenue bonds in 2005 to finance a highway project in the lower portion of Lafourche Parish. The project creates elevated highways that run parallel to Highway 1, with a bridge over Bayou Lafourche. The 2005 series bonds were refunded in November 2013. The bonds are now backed by, in addition to toll revenues, a cooperative endeavor agreement that requires that appropriations sufficient to fund the annual debt service be included in the Executive Budget request. The monies were appropriated in fiscal year 2015 sufficient to pay the debt service; however, $6,135,309 was collected in toll revenues and used to reimburse the General Fund. Principal and interest paid during the current year was $170,000 and $6,034,717. The total principal and interest remaining on the bonds are $173,360,000 and $101,873,916, respectively. The bonds are payable through fiscal year 2046.
NOTE 9: CONTINGENCIES AND COMMITMENTS
RISK FINANCING AND INSURANCE – RELATED ACTIVITIES
The State is exposed to various risks of loss related to torts and other litigation, damage and loss of property, business interruption and injuries to employees. The State is also exposed to risks related to the provision of health and life insurance to its employees. Exposure to these risks are largely self-funded due to the prohibitive costs of obtaining commercial insurance. In addition, the State provides insurance coverage to outside parties through the Workers Compensation Second Injury Program and the Motor Fuels Underground Storage Tank Program.
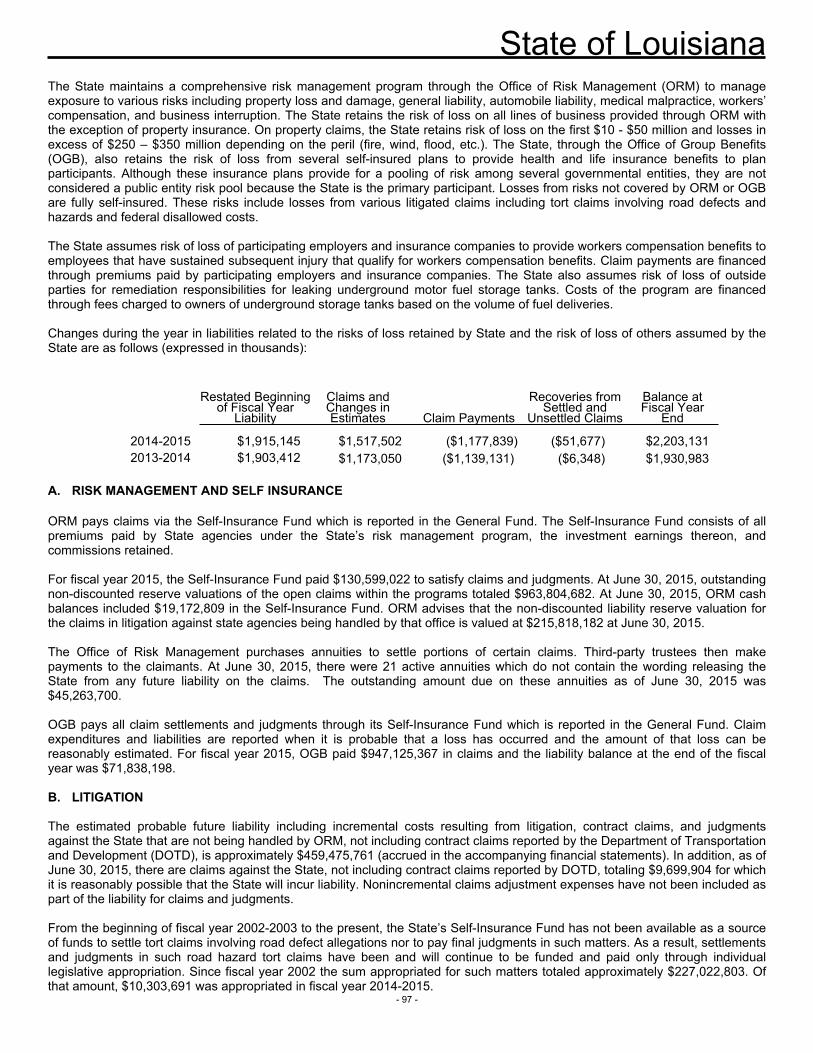
State of Louisiana
- 97 -
The State maintains a comprehensive risk management program through the Office of Risk Management (ORM) to manage exposure to various risks including property loss and damage, general liability, automobile liability, medical malpractice, workers’ compensation, and business interruption. The State retains the risk of loss on all lines of business provided through ORM with the exception of property insurance. On property claims, the State retains risk of loss on the first $10 - $50 million and losses in excess of $250 – $350 million depending on the peril (fire, wind, flood, etc.). The State, through the Office of Group Benefits (OGB), also retains the risk of loss from several self-insured plans to provide health and life insurance benefits to plan participants. Although these insurance plans provide for a pooling of risk among several governmental entities, they are not considered a public entity risk pool because the State is the primary participant. Losses from risks not covered by ORM or OGB are fully self-insured. These risks include losses from various litigated claims including tort claims involving road defects and hazards and federal disallowed costs.
The State assumes risk of loss of participating employers and insurance companies to provide workers compensation benefits to employees that have sustained subsequent injury that qualify for workers compensation benefits. Claim payments are financed through premiums paid by participating employers and insurance companies. The State also assumes risk of loss of outside parties for remediation responsibilities for leaking underground motor fuel storage tanks. Costs of the program are financed through fees charged to owners of underground storage tanks based on the volume of fuel deliveries.
Changes during the year in liabilities related to the risks of loss retained by State and the risk of loss of others assumed by the State are as follows (expressed in thousands):
Restated Beginning of Fiscal Year
Liability
Claims and Changes in Estimates Claim Payments
Recoveries from Settled and
Unsettled Claims
Balance at Fiscal Year
End
2014-2015 $1,915,145 $1,517,502 ($1,177,839) ($51,677) $2,203,1312013-2014 $1,903,412 $1,173,050 ($1,139,131) ($6,348) $1,930,983
A. RISK MANAGEMENT AND SELF INSURANCE
ORM pays claims via the Self-Insurance Fund which is reported in the General Fund. The Self-Insurance Fund consists of all premiums paid by State agencies under the State’s risk management program, the investment earnings thereon, and commissions retained.
For fiscal year 2015, the Self-Insurance Fund paid $130,599,022 to satisfy claims and judgments. At June 30, 2015, outstanding non-discounted reserve valuations of the open claims within the programs totaled $963,804,682. At June 30, 2015, ORM cash balances included $19,172,809 in the Self-Insurance Fund. ORM advises that the non-discounted liability reserve valuation for the claims in litigation against state agencies being handled by that office is valued at $215,818,182 at June 30, 2015.
The Office of Risk Management purchases annuities to settle portions of certain claims. Third-party trustees then make payments to the claimants. At June 30, 2015, there were 21 active annuities which do not contain the wording releasing the State from any future liability on the claims. The outstanding amount due on these annuities as of June 30, 2015 was $45,263,700.
OGB pays all claim settlements and judgments through its Self-Insurance Fund which is reported in the General Fund. Claim expenditures and liabilities are reported when it is probable that a loss has occurred and the amount of that loss can be reasonably estimated. For fiscal year 2015, OGB paid $947,125,367 in claims and the liability balance at the end of the fiscal year was $71,838,198.
B. LITIGATION
The estimated probable future liability including incremental costs resulting from litigation, contract claims, and judgments against the State that are not being handled by ORM, not including contract claims reported by the Department of Transportation and Development (DOTD), is approximately $459,475,761 (accrued in the accompanying financial statements). In addition, as of June 30, 2015, there are claims against the State, not including contract claims reported by DOTD, totaling $9,699,904 for which it is reasonably possible that the State will incur liability. Nonincremental claims adjustment expenses have not been included as part of the liability for claims and judgments.
From the beginning of fiscal year 2002-2003 to the present, the State’s Self-Insurance Fund has not been available as a source of funds to settle tort claims involving road defect allegations nor to pay final judgments in such matters. As a result, settlements and judgments in such road hazard tort claims have been and will continue to be funded and paid only through individual legislative appropriation. Since fiscal year 2002 the sum appropriated for such matters totaled approximately $227,022,803. Of that amount, $10,303,691 was appropriated in fiscal year 2014-2015.
State of Louisiana
- 98 -
As of June 30, 2015, the Department of Transportation and Development (DOTD) advises that there are 675 expropriation cases pending with a total demand of $72,158,878. As payment of its estimate of just compensation upon filing of these suits, DOTD deposited $35,449,396 into the registry of the court. A reasonable possibility exists that DOTD will incur expropriation-related costs of $15,047,114 in excess of the just compensation on deposit with the courts. As of June 30, 2015, there were 36 outstanding inverse condemnation suits with an estimated demand of $11,155,320. DOTD has determined that it is reasonably possible that the actual settlements will total approximately $6,748,799. Estimated exposure amounts for contract and miscellaneous suits may require additional appropriations from the State. DOTD’s estimate of the exposure to these additional claims is $800,000.
The Department of Revenue (DOR) has advised that the total amount of pending litigation affecting the DOR’s right to tax, where there is a probable likelihood that an asset has been impaired or a liability has been incurred as of fiscal year ended June 30, 2015, is $28,228,541 (accrued in the accompanying financial statements). The DOR has also advised that the total dollar amount of pending litigation affecting the DOR’s right to tax, where it is reasonably possible that an asset has been impaired or a liability has been incurred as of fiscal year ended June 30, 2015, is $121,133,767.
C. FEDERAL DISALLOWED COSTS
A significant amount of federal grant dollars is received by the State subject to financial and compliance audits mandated by the grantors. Questioned costs resulting from these audits may be disallowed by the Federal grantor and may become a liability of the State. Liabilities from disallowances and settlement agreements with the federal government are estimated to be $362,498,534 (accrued in the accompanying financial statements). In addition, as of June 30, 2015, there are disallowed costs of $3,002,903 for which it is reasonably possible that the State will incur liability.
D. WORKERS COMPENSATION
The Injured Worker Reemployment Program encourages employers to hire physically handicapped employees who have a permanent partial disability, by reimbursing the employer or, if insured, his or her insurance carrier for part of the workers’ compensation costs for on-the-job injuries. The estimated total future payments to be made for claims outstanding at June 30, 2015 were $225,781,064, which is included in the accompanying financial statements. Funds to make these payments will come from an annual assessment made against all insurance companies writing workers’ compensation insurance in the State and all employers that are self-insured.
E. UNDERGROUND STORAGE TANKS
The 504 Underground Storage Tanks (UST) sites are remediated under The Resource Conservation and Recovery Act (RCRA) Subtitle I and may be eligible for funding through the State’s Motor Fuels Underground Storage Tank Trust Fund or the U.S. EPA’s Leaking Underground Storage Tank (LUST) Trust Fund. The Underground Storage Tank Trust Fund is established by statute to collect fees from underground storage tank owners; fund assets are then used to finance remediation and/or removal of leaking storage tanks. Louisiana spent $10,529,227 assessing and remediating USTs in fiscal year ending June 30, 2015. The ending liability of $74,244,826 will be funded by the Motor Fuels Underground Storage Tank Trust Fund.
F. POLLUTION REMEDIATION
Louisiana is involved in various types of pollution and contamination remediation activities across the state. These activities include site assessments, site investigations, clean-up activities, and post-remediation monitoring. Remediation costs are usually funded by the Capital Outlay Escrow Fund through the Office of Facility Planning and Control or through the Department of Environmental Quality, which may obtain federal grants and state General Fund appropriations for such projects.
The current value of a remediation obligation liability is based on assumptions or expectations about future events that affect the measurement of the liability under the expected cash flow technique. However, the expectations are subject to change over time due to changes in technology, changes in applicable federal, state, and local laws or regulations, price increases or decreases, or changes in the remediation plan. In addition, the state seeks insurance recovery or the identification of potentially responsible parties to recover remediation costs. These recoveries may reduce costs of remediation when the recovery becomes recognizable or probable. Under specific circumstances, costs of remediation may be capitalized as part of a capital asset.
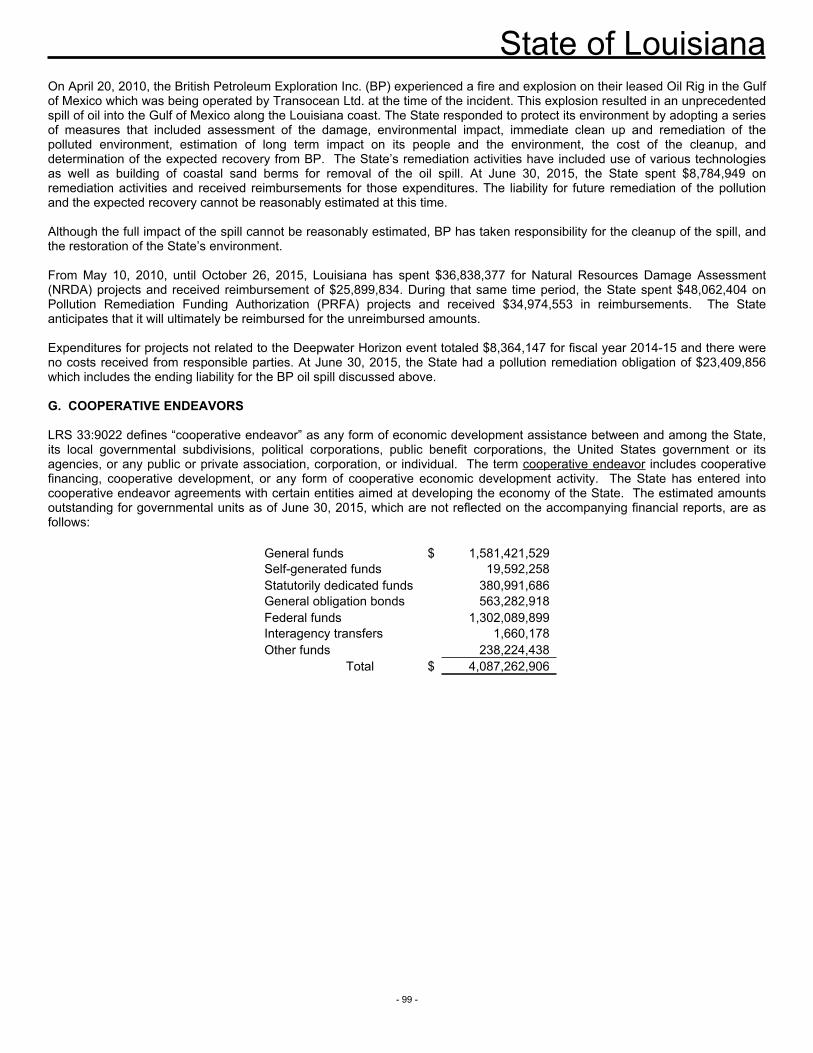
State of Louisiana
- 99 -
On April 20, 2010, the British Petroleum Exploration Inc. (BP) experienced a fire and explosion on their leased Oil Rig in the Gulf of Mexico which was being operated by Transocean Ltd. at the time of the incident. This explosion resulted in an unprecedented spill of oil into the Gulf of Mexico along the Louisiana coast. The State responded to protect its environment by adopting a series of measures that included assessment of the damage, environmental impact, immediate clean up and remediation of the polluted environment, estimation of long term impact on its people and the environment, the cost of the cleanup, and determination of the expected recovery from BP. The State’s remediation activities have included use of various technologies as well as building of coastal sand berms for removal of the oil spill. At June 30, 2015, the State spent $8,784,949 on remediation activities and received reimbursements for those expenditures. The liability for future remediation of the pollution and the expected recovery cannot be reasonably estimated at this time.
Although the full impact of the spill cannot be reasonably estimated, BP has taken responsibility for the cleanup of the spill, and the restoration of the State’s environment.
From May 10, 2010, until October 26, 2015, Louisiana has spent $36,838,377 for Natural Resources Damage Assessment (NRDA) projects and received reimbursement of $25,899,834. During that same time period, the State spent $48,062,404 on Pollution Remediation Funding Authorization (PRFA) projects and received $34,974,553 in reimbursements. The State anticipates that it will ultimately be reimbursed for the unreimbursed amounts.
Expenditures for projects not related to the Deepwater Horizon event totaled $8,364,147 for fiscal year 2014-15 and there were no costs received from responsible parties. At June 30, 2015, the State had a pollution remediation obligation of $23,409,856 which includes the ending liability for the BP oil spill discussed above.
G. COOPERATIVE ENDEAVORS
LRS 33:9022 defines “cooperative endeavor” as any form of economic development assistance between and among the State, its local governmental subdivisions, political corporations, public benefit corporations, the United States government or its agencies, or any public or private association, corporation, or individual. The term cooperative endeavor includes cooperative financing, cooperative development, or any form of cooperative economic development activity. The State has entered into cooperative endeavor agreements with certain entities aimed at developing the economy of the State. The estimated amounts outstanding for governmental units as of June 30, 2015, which are not reflected on the accompanying financial reports, are as follows:
General funds $ 1,581,421,529Self-generated funds 19,592,258Statutorily dedicated funds 380,991,686General obligation bonds 563,282,918Federal funds 1,302,089,899Interagency transfers 1,660,178Other funds 238,224,438
Total $ 4,087,262,906
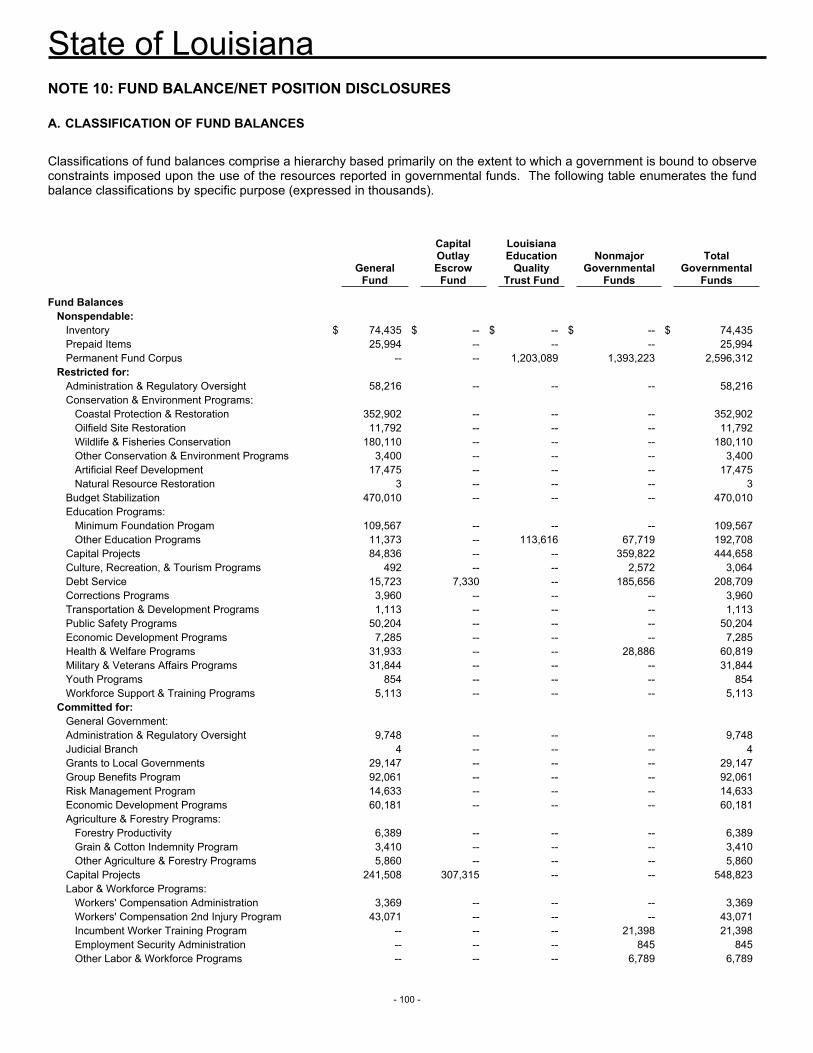
State of Louisiana
- 100 -
NOTE 10: FUND BALANCE/NET POSITION DISCLOSURES
A. CLASSIFICATION OF FUND BALANCES
Classifications of fund balances comprise a hierarchy based primarily on the extent to which a government is bound to observe constraints imposed upon the use of the resources reported in governmental funds. The following table enumerates the fund balance classifications by specific purpose (expressed in thousands).
General
Fund
Capital Outlay Escrow
Fund
Louisiana Education
Quality Trust Fund
Nonmajor Governmental
Funds
Total Governmental
Funds Fund Balances
Nonspendable: Inventory $ 74,435 $ -- $ -- $ -- $ 74,435Prepaid Items 25,994 -- -- -- 25,994Permanent Fund Corpus -- -- 1,203,089 1,393,223 2,596,312
Restricted for: Administration & Regulatory Oversight 58,216 -- -- -- 58,216Conservation & Environment Programs:
Coastal Protection & Restoration 352,902 -- -- -- 352,902Oilfield Site Restoration 11,792 -- -- -- 11,792Wildlife & Fisheries Conservation 180,110 -- -- -- 180,110Other Conservation & Environment Programs 3,400 -- -- -- 3,400Artificial Reef Development 17,475 -- -- -- 17,475Natural Resource Restoration 3 -- -- -- 3
Budget Stabilization 470,010 -- -- -- 470,010Education Programs:
Minimum Foundation Progam 109,567 -- -- -- 109,567Other Education Programs 11,373 -- 113,616 67,719 192,708
Capital Projects 84,836 -- -- 359,822 444,658Culture, Recreation, & Tourism Programs 492 -- -- 2,572 3,064Debt Service 15,723 7,330 -- 185,656 208,709Corrections Programs 3,960 -- -- -- 3,960Transportation & Development Programs 1,113 -- -- -- 1,113Public Safety Programs 50,204 -- -- -- 50,204Economic Development Programs 7,285 -- -- -- 7,285Health & Welfare Programs 31,933 -- -- 28,886 60,819Military & Veterans Affairs Programs 31,844 -- -- -- 31,844Youth Programs 854 -- -- -- 854Workforce Support & Training Programs 5,113 -- -- -- 5,113
Committed for: General Government: Administration & Regulatory Oversight 9,748 -- -- -- 9,748Judicial Branch 4 -- -- -- 4Grants to Local Governments 29,147 -- -- -- 29,147Group Benefits Program 92,061 -- -- -- 92,061Risk Management Program 14,633 -- -- -- 14,633Economic Development Programs 60,181 -- -- -- 60,181Agriculture & Forestry Programs:
Forestry Productivity 6,389 -- -- -- 6,389Grain & Cotton Indemnity Program 3,410 -- -- -- 3,410Other Agriculture & Forestry Programs 5,860 -- -- -- 5,860
Capital Projects 241,508 307,315 -- -- 548,823Labor & Workforce Programs:
Workers' Compensation Administration 3,369 -- -- -- 3,369Workers' Compensation 2nd Injury Program 43,071 -- -- -- 43,071Incumbent Worker Training Program -- -- -- 21,398 21,398Employment Security Administration -- -- -- 845 845Other Labor & Workforce Programs -- -- -- 6,789 6,789
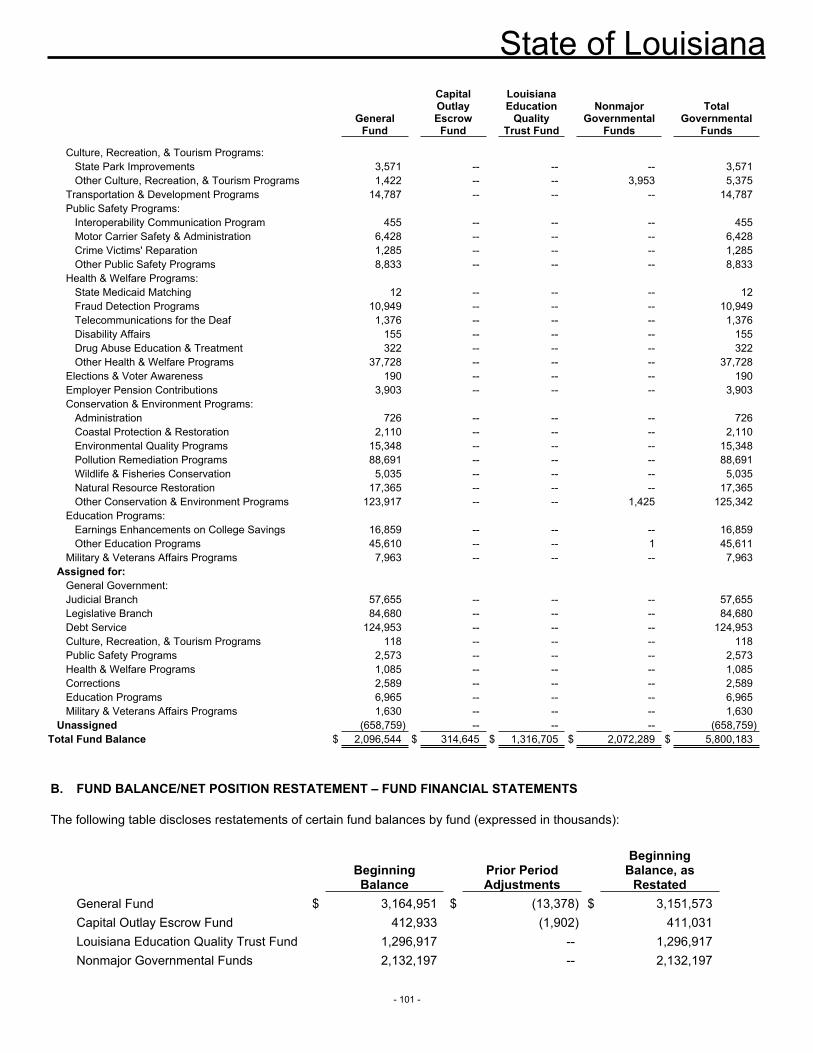
State of Louisiana
- 101 -
General
Fund
Capital Outlay Escrow
Fund
Louisiana Education
Quality Trust Fund
Nonmajor Governmental
Funds
Total Governmental
Funds
Culture, Recreation, & Tourism Programs: State Park Improvements 3,571 -- -- -- 3,571Other Culture, Recreation, & Tourism Programs 1,422 -- -- 3,953 5,375
Transportation & Development Programs 14,787 -- -- -- 14,787Public Safety Programs:
Interoperability Communication Program 455 -- -- -- 455Motor Carrier Safety & Administration 6,428 -- -- -- 6,428Crime Victims' Reparation 1,285 -- -- -- 1,285Other Public Safety Programs 8,833 -- -- -- 8,833
Health & Welfare Programs: State Medicaid Matching 12 -- -- -- 12Fraud Detection Programs 10,949 -- -- -- 10,949Telecommunications for the Deaf 1,376 -- -- -- 1,376Disability Affairs 155 -- -- -- 155Drug Abuse Education & Treatment 322 -- -- -- 322Other Health & Welfare Programs 37,728 -- -- -- 37,728
Elections & Voter Awareness 190 -- -- -- 190Employer Pension Contributions 3,903 -- -- -- 3,903Conservation & Environment Programs:
Administration 726 -- -- -- 726Coastal Protection & Restoration 2,110 -- -- -- 2,110Environmental Quality Programs 15,348 -- -- -- 15,348Pollution Remediation Programs 88,691 -- -- -- 88,691Wildlife & Fisheries Conservation 5,035 -- -- -- 5,035Natural Resource Restoration 17,365 -- -- -- 17,365Other Conservation & Environment Programs 123,917 -- -- 1,425 125,342
Education Programs: Earnings Enhancements on College Savings 16,859 -- -- -- 16,859Other Education Programs 45,610 -- -- 1 45,611
Military & Veterans Affairs Programs 7,963 -- -- -- 7,963Assigned for:
General Government: Judicial Branch 57,655 -- -- -- 57,655Legislative Branch 84,680 -- -- -- 84,680Debt Service 124,953 -- -- -- 124,953Culture, Recreation, & Tourism Programs 118 -- -- -- 118Public Safety Programs 2,573 -- -- -- 2,573Health & Welfare Programs 1,085 -- -- -- 1,085Corrections 2,589 -- -- -- 2,589Education Programs 6,965 -- -- -- 6,965Military & Veterans Affairs Programs 1,630 -- -- -- 1,630
Unassigned (658,759) -- -- -- (658,759)Total Fund Balance $ 2,096,544 $ 314,645 $ 1,316,705 $ 2,072,289 $ 5,800,183
B. FUND BALANCE/NET POSITION RESTATEMENT – FUND FINANCIAL STATEMENTS
The following table discloses restatements of certain fund balances by fund (expressed in thousands):
Beginning Balance
Prior Period Adjustments
Beginning Balance, as
RestatedGeneral Fund $ 3,164,951 $ (13,378) $ 3,151,573Capital Outlay Escrow Fund 412,933 (1,902) 411,031Louisiana Education Quality Trust Fund 1,296,917 -- 1,296,917Nonmajor Governmental Funds 2,132,197 -- 2,132,197
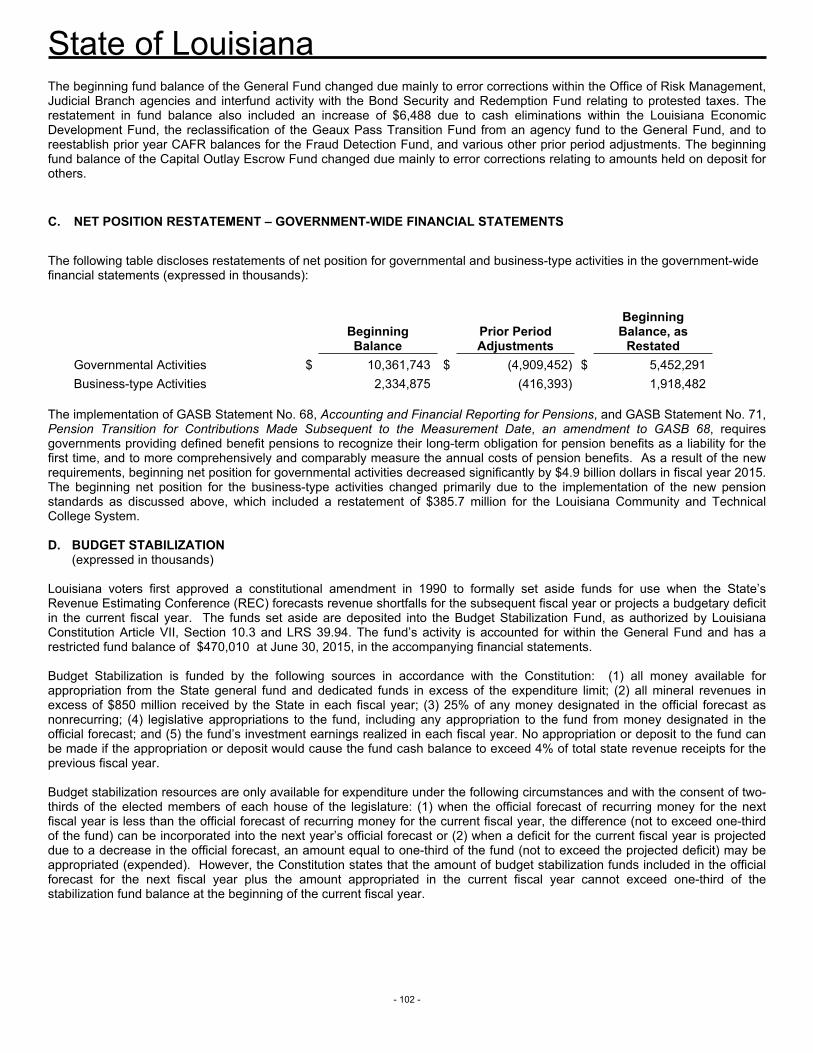
State of Louisiana
- 102 -
The beginning fund balance of the General Fund changed due mainly to error corrections within the Office of Risk Management, Judicial Branch agencies and interfund activity with the Bond Security and Redemption Fund relating to protested taxes. The restatement in fund balance also included an increase of $6,488 due to cash eliminations within the Louisiana Economic Development Fund, the reclassification of the Geaux Pass Transition Fund from an agency fund to the General Fund, and to reestablish prior year CAFR balances for the Fraud Detection Fund, and various other prior period adjustments. The beginning fund balance of the Capital Outlay Escrow Fund changed due mainly to error corrections relating to amounts held on deposit for others.
C. NET POSITION RESTATEMENT – GOVERNMENT-WIDE FINANCIAL STATEMENTS
The following table discloses restatements of net position for governmental and business-type activities in the government-wide financial statements (expressed in thousands):
Beginning Balance
Prior Period Adjustments
Beginning Balance, as
RestatedGovernmental Activities $ 10,361,743 $ (4,909,452) $ 5,452,291Business-type Activities 2,334,875 (416,393) 1,918,482
The implementation of GASB Statement No. 68, Accounting and Financial Reporting for Pensions, and GASB Statement No. 71, Pension Transition for Contributions Made Subsequent to the Measurement Date, an amendment to GASB 68, requires governments providing defined benefit pensions to recognize their long-term obligation for pension benefits as a liability for the first time, and to more comprehensively and comparably measure the annual costs of pension benefits. As a result of the new requirements, beginning net position for governmental activities decreased significantly by $4.9 billion dollars in fiscal year 2015. The beginning net position for the business-type activities changed primarily due to the implementation of the new pension standards as discussed above, which included a restatement of $385.7 million for the Louisiana Community and Technical College System.
D. BUDGET STABILIZATION(expressed in thousands)
Louisiana voters first approved a constitutional amendment in 1990 to formally set aside funds for use when the State’s Revenue Estimating Conference (REC) forecasts revenue shortfalls for the subsequent fiscal year or projects a budgetary deficit in the current fiscal year. The funds set aside are deposited into the Budget Stabilization Fund, as authorized by Louisiana Constitution Article VII, Section 10.3 and LRS 39.94. The fund’s activity is accounted for within the General Fund and has a restricted fund balance of $470,010 at June 30, 2015, in the accompanying financial statements.
Budget Stabilization is funded by the following sources in accordance with the Constitution: (1) all money available for appropriation from the State general fund and dedicated funds in excess of the expenditure limit; (2) all mineral revenues in excess of $850 million received by the State in each fiscal year; (3) 25% of any money designated in the official forecast as nonrecurring; (4) legislative appropriations to the fund, including any appropriation to the fund from money designated in the official forecast; and (5) the fund’s investment earnings realized in each fiscal year. No appropriation or deposit to the fund can be made if the appropriation or deposit would cause the fund cash balance to exceed 4% of total state revenue receipts for the previous fiscal year.
Budget stabilization resources are only available for expenditure under the following circumstances and with the consent of two-thirds of the elected members of each house of the legislature: (1) when the official forecast of recurring money for the next fiscal year is less than the official forecast of recurring money for the current fiscal year, the difference (not to exceed one-third of the fund) can be incorporated into the next year’s official forecast or (2) when a deficit for the current fiscal year is projected due to a decrease in the official forecast, an amount equal to one-third of the fund (not to exceed the projected deficit) may be appropriated (expended). However, the Constitution states that the amount of budget stabilization funds included in the official forecast for the next fiscal year plus the amount appropriated in the current fiscal year cannot exceed one-third of the stabilization fund balance at the beginning of the current fiscal year.
State of Louisiana
- 103 -
NOTE 11: OTHER DISCLOSURES
A. RELATED PARTY TRANSACTIONS
The State Board of Elementary and Secondary Education (SBESE) serves as the governing board for the Department of Education. The State Superintendent of Education is appointed by the SBESE and is responsible for the daily administration of the department and submits educational policy and funding issues and awards to the SBESE for implementation authority.
The SBESE consists of eleven members representing eight geographic regions of the State (SBESE districts). Eight members are elected by citizens in the representative SBESE districts and three members at large are appointed by the governor. Elected and appointed members serve a term of four years concurrent with the term of the governor.
The Department of Education presents funding awards and/or allocations to the Finance Committee of the SBESE for recommendation to the full board. A majority of the board constitutes department authority to award funds to sub-recipients.
The elected SBESE member for the third SBESE district is currently the Superintendent of the St. Martin Parish School Board and a sub-recipient of funds authorized by SBESE. For the fiscal year ended June 30, 2015, St. Martin Parish School Board received amounts totaling $54,025,371 in funding authorized by SBESE and released by the Department of Education.
The elected SBESE member for the second SBESE district is currently the Executive Director of Teach for America for Greater New Orleans Delta and a sub-recipient of funds authorized by SBESE. For the fiscal year ended June 30, 2015, Teach for America for Greater New Orleans Delta received amounts totaling $919,813 in funding authorized by SBESE and released by the Department of Education.
The Motor Fuels Underground Storage Tank Trust Advisory Board advises the Secretary of the Department of Environmental Quality regarding the Tank Trust Fund transactions. Two board members have ownership in companies that received Trust Fund disbursements of $4,074,274.
The Louisiana Agricultural Finance Authority, an enterprise fund, administers the Louisiana Farm and Agribusiness Recovery Loan and Grant Program. Under the program, the Authority has made loans and grants totaling $1,275,154 to 33 individuals currently employed by the Department of Agriculture and Forestry (LDAF) or serve in a capacity within LDAF, who (for reporting purposes) are considered related parties. These individuals, whose loans are allowable under LRS 42:1113(D)(1)(c)(iii) and under the cooperative endeavor agreement between the Authority and the Division of Administration’s Office of Community Development, qualified for the loans based on pre-established criteria applied to all loan applicants. The balance of these loans at June 30, 2015, is $105,301.
One of the recipients of the loans is Strain Cattle, which is a company owned by the LDAF Commissioner’s family members. Strain Cattle participated in the Louisiana Farm and Agribusiness Recovery Loan and Grant Program with an award of $36,535. The loan balance was paid in full during the year ended June 30, 2014.
B. ADOPTION OF NEW ACCOUNTING STANDARDS
For the year ended June 30, 2015, the State of Louisiana implemented GASB Statement No. 68, Accounting and Financial Reporting for Pensions; GASB Statement No. 69, Government Combinations and Disposals of Government Operations; and GASB Statement No. 71, Pension Transition for Contributions Made Subsequent to the Measurement Date, an amendment to GASB 68. NOTE 12: SUBSEQUENT EVENTS
A. FISCAL YEAR 2015 AND PROJECTED FISCAL YEAR 2016 BUDGETARY BASIS DEFICITS IN GENERAL FUND TAXES, LICENSES, AND FEES
On October 30, 2015, the Division of Administration announced at a meeting of the Joint Legislative Committee on the Budget (JLCB) a $117.1 million budgetary basis deficit in General Fund taxes, licenses, and fees for fiscal year 2015. Pursuant to the Louisiana Constitution of 1974, this deficit is required to be resolved by the end of fiscal year 2016. In addition, on November 16, 2015, the State’s Revenue Estimating Committee adopted a $370.2 million reduction in fiscal year 2016 forecasted General Fund taxes, licenses and fees. The reduction was driven in large part by lower than expected collections of corporate income and sales taxes. At the November meeting of the JLCB, the Division of Administration proposed a plan to resolve both the fiscal year 2015 deficit and the projected fiscal year 2016 revenue shortfall. The plan included reductions in appropriations from General Fund taxes, licenses, and fees; the capture of additional revenues that were not anticipated in the original budget; and use of fund balance restricted for budget stabilization. Many of the reductions were made within the Governor’s statutory authority through executive order, while approximately $167.5 million in reductions required approval from the JLCB. The use of
State of Louisiana
- 104 -
the fund balance restricted for budget stabilization required a two-thirds vote from the Legislature. The JLCB approved all proposed reductions and the Legislature approved the use of the fund balance restricted for budget stabilization.
B. DEBT ISSUANCES
On September 1, 2015 the State issued $73,820,000 in Unclaimed Property Special Revenue Bonds, Series 2015 (I-49 South Project). The bonds were issued to (a) provide funds to match federal funds used by the Department of Transportation and Development for the costs of and association with the construction of Interstate 49 South from Interstate 10 in the City of Lafayette to the Westbank Expressway in the City of New Orleans; (b) funding a deposit to the Debt Service Reserve Account of the Debt Service Fund; and (c) paying the costs of issuance of the Series 2015 bonds.
The bonds are secured by monies deposited or to be deposited in the I-49 South Account of the Unclaimed Property Leverage Fund created and established pursuant to LRS 9:165. The bonds are further secured by a Cooperative Endeavor Agreement dated December 1, 2013 and amended on September 1, 2015 in which the State, subject to appropriation, agreed to replenish the Debt Service Reserve Account of the Debt Service Fund in the event amounts on deposit are less than the debt service reserve requirements established under the I-49 South Bond Resolution. The bonds have various maturities extending through September 1, 2035 with principal payments due annual on September 1st and interest payments (1% - 5.25%) due annually on September 1st and March 1st.
C. CONSTITUTIONAL AMENDMENTS
Four amendments to the Louisiana Constitution of 1974 were voted on in a general statewide election on October 24, 2015. Two of the amendments passed and are summarized below.
Amendment two passed, which retains the present constitution and authorizes the investment of public funds for a state infrastructure bank to be used/utilized solely for transportation projects.
Amendment four passed, which changes the prior constitution by specifying the ad valorem property tax exemption does not apply to land or property owned by another state or by a political subdivision of another state.
D. BRITISH PETROLEUM DEEPWATER HORIZON OIL SPILL SETTLEMENT
On July 2, 2015, a settlement agreement in principle in the amount of $18.7 billion was reached between British Petroleum (BP), the federal government, and gulf coast states of Alabama, Florida, Louisiana, Mississippi, and Texas. Louisiana’s total portion of approximately $6.787 billion to be received over the next 18 years is comprised of $5.0 billion of restricted for natural resources damage projects, $787 million of restricted Clean Water Act penalties, and $1.0 billion in economic damages. Act 646 of 2014 requires economic damages payments to be used as follows: 45% for budget stabilization subject to constitutional maximums; 45% for Medicaid up to certain limitations; and 10% for various health programs. Any interest on economic damages not distributed for these specific purposes will be distributed to public institutions of higher education in the State.
R E Q U I R E D S U P P L E M E N T A R Y I N F O R M A T I O N O T H E R T H A N
M A N A G E M E N T ’ S D I S C U S S I O N A N D A N A L Y S I S
2014-2015 Comprehensive Annual Financial Report

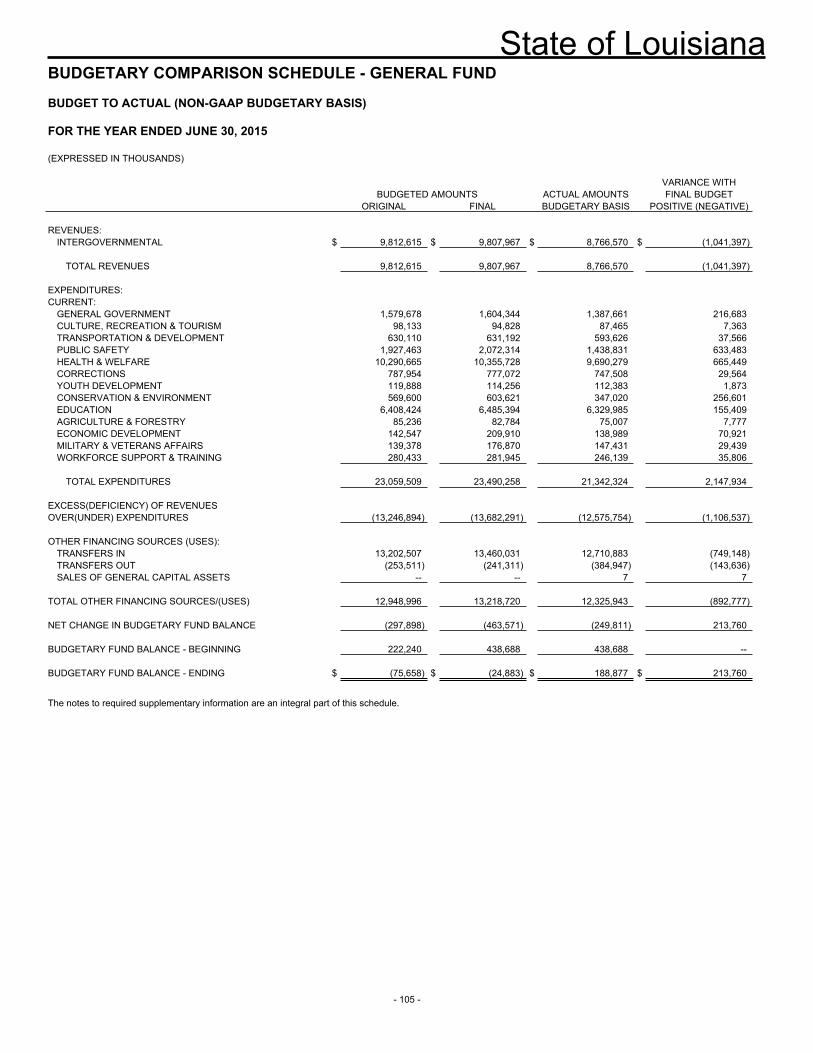
State of Louisiana
- 105 -
BUDGETARY COMPARISON SCHEDULE - GENERAL FUND
BUDGET TO ACTUAL (NON-GAAP BUDGETARY BASIS)
FOR THE YEAR ENDED JUNE 30, 2015 (EXPRESSED IN THOUSANDS) VARIANCE WITH BUDGETED AMOUNTS ACTUAL AMOUNTS FINAL BUDGET ORIGINAL FINAL BUDGETARY BASIS POSITIVE (NEGATIVE) REVENUES:
INTERGOVERNMENTAL $ 9,812,615 $ 9,807,967 $ 8,766,570 $ (1,041,397)
TOTAL REVENUES 9,812,615 9,807,967 8,766,570 (1,041,397) EXPENDITURES: CURRENT:
GENERAL GOVERNMENT 1,579,678 1,604,344 1,387,661 216,683CULTURE, RECREATION & TOURISM 98,133 94,828 87,465 7,363TRANSPORTATION & DEVELOPMENT 630,110 631,192 593,626 37,566PUBLIC SAFETY 1,927,463 2,072,314 1,438,831 633,483HEALTH & WELFARE 10,290,665 10,355,728 9,690,279 665,449CORRECTIONS 787,954 777,072 747,508 29,564YOUTH DEVELOPMENT 119,888 114,256 112,383 1,873CONSERVATION & ENVIRONMENT 569,600 603,621 347,020 256,601EDUCATION 6,408,424 6,485,394 6,329,985 155,409AGRICULTURE & FORESTRY 85,236 82,784 75,007 7,777ECONOMIC DEVELOPMENT 142,547 209,910 138,989 70,921MILITARY & VETERANS AFFAIRS 139,378 176,870 147,431 29,439WORKFORCE SUPPORT & TRAINING 280,433 281,945 246,139 35,806
TOTAL EXPENDITURES 23,059,509 23,490,258 21,342,324 2,147,934
EXCESS(DEFICIENCY) OF REVENUES OVER(UNDER) EXPENDITURES (13,246,894) (13,682,291) (12,575,754) (1,106,537) OTHER FINANCING SOURCES (USES):
TRANSFERS IN 13,202,507 13,460,031 12,710,883 (749,148)TRANSFERS OUT (253,511) (241,311) (384,947) (143,636)SALES OF GENERAL CAPITAL ASSETS -- -- 7 7
TOTAL OTHER FINANCING SOURCES/(USES) 12,948,996 13,218,720 12,325,943 (892,777) NET CHANGE IN BUDGETARY FUND BALANCE (297,898) (463,571) (249,811) 213,760 BUDGETARY FUND BALANCE - BEGINNING 222,240 438,688 438,688 -- BUDGETARY FUND BALANCE - ENDING $ (75,658) $ (24,883) $ 188,877 $ 213,760
The notes to required supplementary information are an integral part of this schedule.
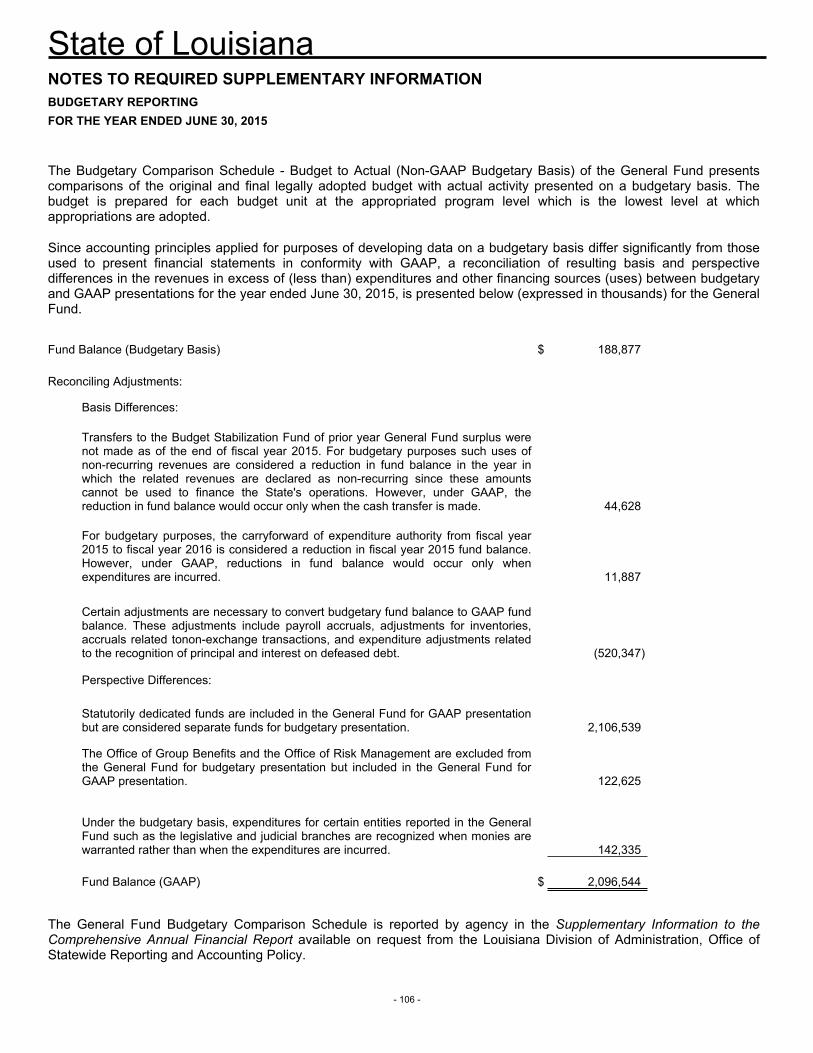
State of Louisiana
- 106 -
NOTES TO REQUIRED SUPPLEMENTARY INFORMATIONBUDGETARY REPORTINGFOR THE YEAR ENDED JUNE 30, 2015
The Budgetary Comparison Schedule - Budget to Actual (Non-GAAP Budgetary Basis) of the General Fund presents comparisons of the original and final legally adopted budget with actual activity presented on a budgetary basis. The budget is prepared for each budget unit at the appropriated program level which is the lowest level at which appropriations are adopted.
Since accounting principles applied for purposes of developing data on a budgetary basis differ significantly from those used to present financial statements in conformity with GAAP, a reconciliation of resulting basis and perspective differences in the revenues in excess of (less than) expenditures and other financing sources (uses) between budgetary and GAAP presentations for the year ended June 30, 2015, is presented below (expressed in thousands) for the General Fund.
Fund Balance (Budgetary Basis) $ 188,877
Reconciling Adjustments:
Basis Differences:
Transfers to the Budget Stabilization Fund of prior year General Fund surplus were not made as of the end of fiscal year 2015. For budgetary purposes such uses of non-recurring revenues are considered a reduction in fund balance in the year in which the related revenues are declared as non-recurring since these amounts cannot be used to finance the State's operations. However, under GAAP, the reduction in fund balance would occur only when the cash transfer is made. 44,628
For budgetary purposes, the carryforward of expenditure authority from fiscal year 2015 to fiscal year 2016 is considered a reduction in fiscal year 2015 fund balance. However, under GAAP, reductions in fund balance would occur only when expenditures are incurred. 11,887
Certain adjustments are necessary to convert budgetary fund balance to GAAP fund balance. These adjustments include payroll accruals, adjustments for inventories, accruals related tonon-exchange transactions, and expenditure adjustments related to the recognition of principal and interest on defeased debt. (520,347)
Perspective Differences:
Statutorily dedicated funds are included in the General Fund for GAAP presentation but are considered separate funds for budgetary presentation. 2,106,539
The Office of Group Benefits and the Office of Risk Management are excluded from the General Fund for budgetary presentation but included in the General Fund for GAAP presentation. 122,625
Under the budgetary basis, expenditures for certain entities reported in the General Fund such as the legislative and judicial branches are recognized when monies are warranted rather than when the expenditures are incurred. 142,335
Fund Balance (GAAP) $ 2,096,544
The General Fund Budgetary Comparison Schedule is reported by agency in the Supplementary Information to the Comprehensive Annual Financial Report available on request from the Louisiana Division of Administration, Office of Statewide Reporting and Accounting Policy.
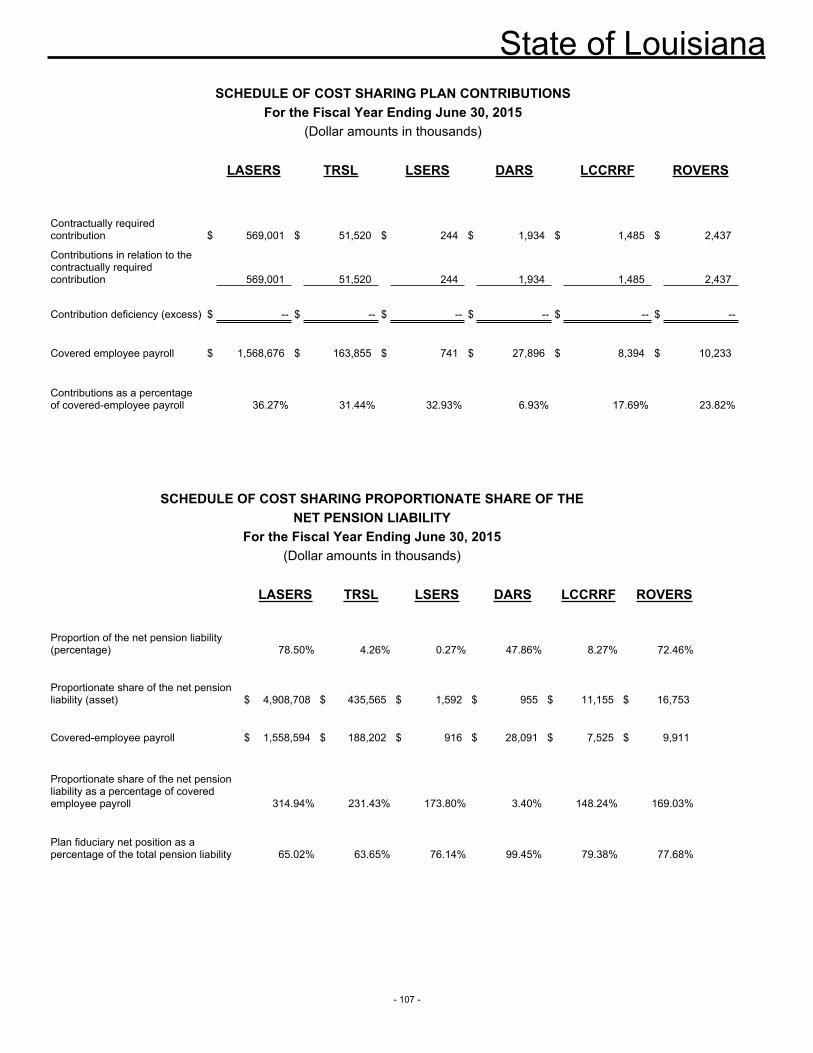
State of Louisiana
- 107 -
SCHEDULE OF COST SHARING PLAN CONTRIBUTIONS For the Fiscal Year Ending June 30, 2015
(Dollar amounts in thousands)
LASERS TRSL LSERS DARS LCCRRF ROVERS
Contractually required contribution $ 569,001 $ 51,520 $ 244 $ 1,934 $ 1,485 $ 2,437
Contributions in relation to the contractually required contribution 569,001 51,520 244 1,934 1,485 2,437
Contribution deficiency (excess) $ -- $ -- $ -- $ -- $ -- $ --
Covered employee payroll $ 1,568,676 $ 163,855 $ 741 $ 27,896 $ 8,394 $ 10,233
Contributions as a percentage of covered-employee payroll 36.27% 31.44% 32.93% 6.93% 17.69% 23.82%
SCHEDULE OF COST SHARING PROPORTIONATE SHARE OF THE NET PENSION LIABILITY
For the Fiscal Year Ending June 30, 2015(Dollar amounts in thousands)
LASERS TRSL LSERS DARS LCCRRF ROVERS
Proportion of the net pension liability (percentage) 78.50% 4.26% 0.27% 47.86% 8.27% 72.46%
Proportionate share of the net pension liability (asset) $ 4,908,708 $ 435,565 $ 1,592 $ 955 $ 11,155 $ 16,753
Covered-employee payroll $ 1,558,594 $ 188,202 $ 916 $ 28,091 $ 7,525 $ 9,911
Proportionate share of the net pension liability as a percentage of covered employee payroll 314.94% 231.43% 173.80% 3.40% 148.24% 169.03%
Plan fiduciary net position as a percentage of the total pension liability 65.02% 63.65% 76.14% 99.45% 79.38% 77.68%
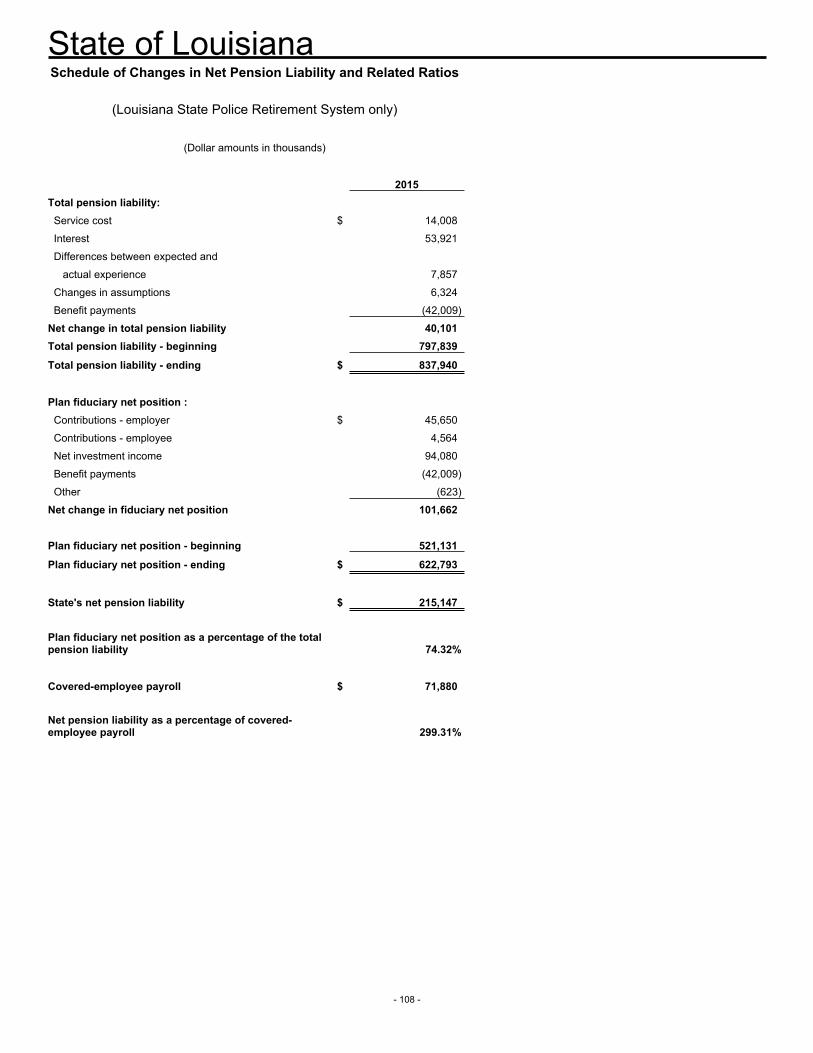
State of Louisiana
- 108 -
Schedule of Changes in Net Pension Liability and Related Ratios
(Louisiana State Police Retirement System only)
(Dollar amounts in thousands)
2015Total pension liability: Service cost $ 14,008
Interest 53,921
Differences between expected and
actual experience 7,857
Changes in assumptions 6,324
Benefit payments (42,009)
Net change in total pension liability 40,101Total pension liability - beginning 797,839
Total pension liability - ending $ 837,940
Plan fiduciary net position : Contributions - employer $ 45,650
Contributions - employee 4,564
Net investment income 94,080
Benefit payments (42,009)
Other (623)
Net change in fiduciary net position 101,662
Plan fiduciary net position - beginning 521,131
Plan fiduciary net position - ending $ 622,793
State's net pension liability $ 215,147
Plan fiduciary net position as a percentage of the total pension liability 74.32%
Covered-employee payroll $ 71,880
Net pension liability as a percentage of covered-employee payroll 299.31%
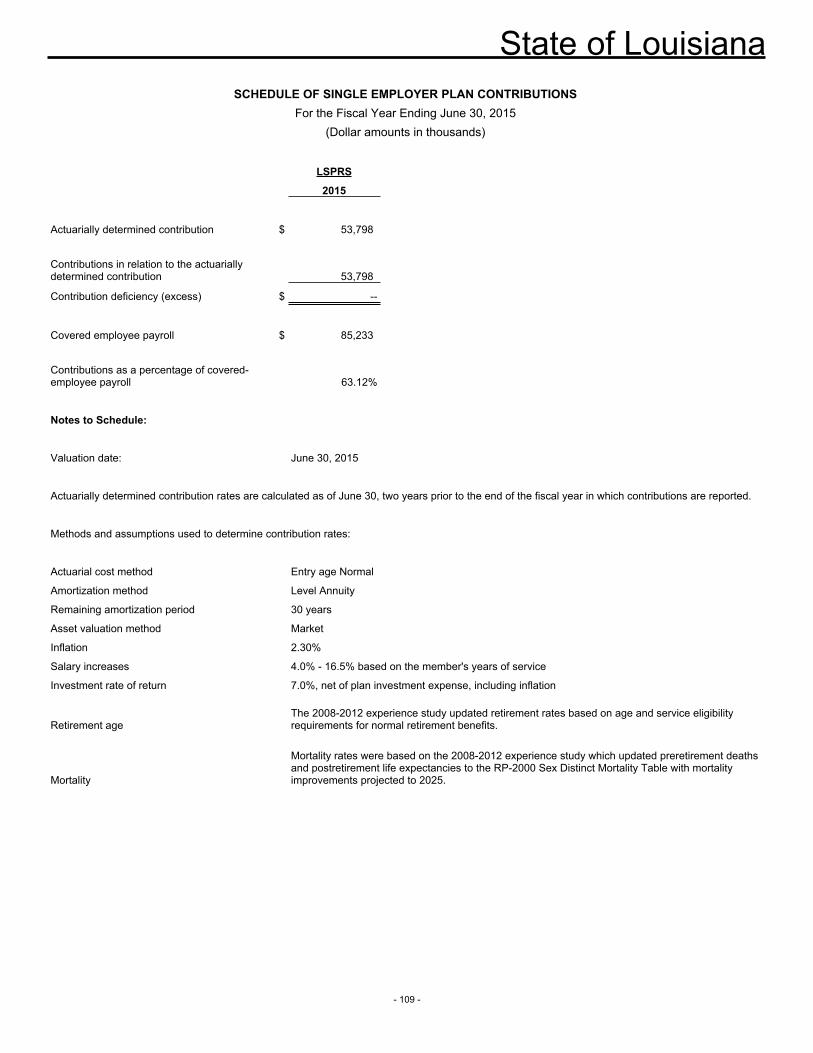
State of Louisiana
- 109 -
SCHEDULE OF SINGLE EMPLOYER PLAN CONTRIBUTIONS For the Fiscal Year Ending June 30, 2015
(Dollar amounts in thousands)
LSPRS
2015
Actuarially determined contribution $ 53,798
Contributions in relation to the actuarially determined contribution 53,798
Contribution deficiency (excess) $ --
Covered employee payroll $ 85,233
Contributions as a percentage of covered-employee payroll 63.12%
Notes to Schedule:
Valuation date: June 30, 2015
Actuarially determined contribution rates are calculated as of June 30, two years prior to the end of the fiscal year in which contributions are reported.
Methods and assumptions used to determine contribution rates:
Actuarial cost method Entry age Normal
Amortization method Level Annuity
Remaining amortization period 30 years
Asset valuation method Market
Inflation 2.30%
Salary increases 4.0% - 16.5% based on the member's years of service
Investment rate of return 7.0%, net of plan investment expense, including inflation
Retirement ageThe 2008-2012 experience study updated retirement rates based on age and service eligibility requirements for normal retirement benefits.
Mortality
Mortality rates were based on the 2008-2012 experience study which updated preretirement deaths and postretirement life expectancies to the RP-2000 Sex Distinct Mortality Table with mortality improvements projected to 2025.
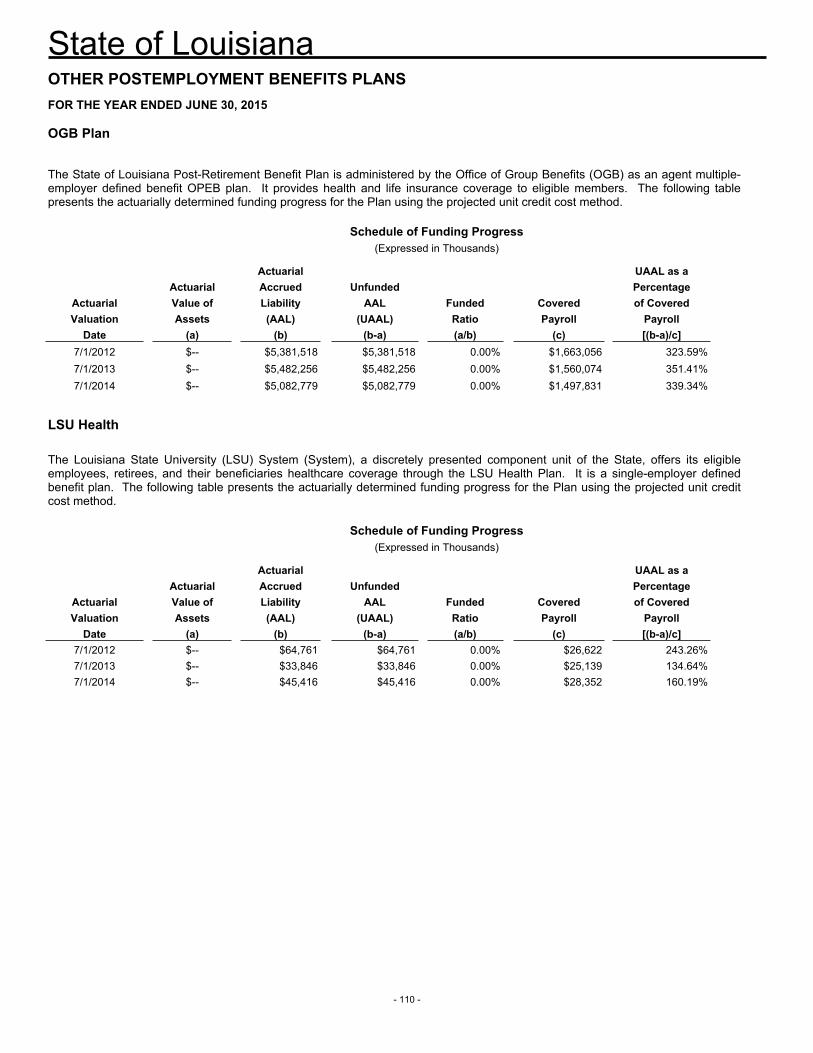
State of Louisiana
- 110 -
OTHER POSTEMPLOYMENT BENEFITS PLANSFOR THE YEAR ENDED JUNE 30, 2015
OGB Plan
The State of Louisiana Post-Retirement Benefit Plan is administered by the Office of Group Benefits (OGB) as an agent multiple-employer defined benefit OPEB plan. It provides health and life insurance coverage to eligible members. The following table presents the actuarially determined funding progress for the Plan using the projected unit credit cost method.
Schedule of Funding Progress(Expressed in Thousands)
Actuarial UAAL as aActuarial Accrued Unfunded Percentage
Actuarial Value of Liability AAL Funded Covered of CoveredValuation Assets (AAL) (UAAL) Ratio Payroll Payroll
Date (a) (b) (b-a) (a/b) (c) [(b-a)/c]7/1/2012 $-- $5,381,518 $5,381,518 0.00% $1,663,056 323.59%7/1/2013 $-- $5,482,256 $5,482,256 0.00% $1,560,074 351.41%7/1/2014 $-- $5,082,779 $5,082,779 0.00% $1,497,831 339.34%
LSU Health PlanThe Louisiana State University (LSU) System (System), a discretely presented component unit of the State, offers its eligible employees, retirees, and their beneficiaries healthcare coverage through the LSU Health Plan. It is a single-employer defined benefit plan. The following table presents the actuarially determined funding progress for the Plan using the projected unit credit cost method.
Schedule of Funding Progress(Expressed in Thousands)
Actuarial UAAL as aActuarial Accrued Unfunded Percentage
Actuarial Value of Liability AAL Funded Covered of CoveredValuation Assets (AAL) (UAAL) Ratio Payroll Payroll
Date (a) (b) (b-a) (a/b) (c) [(b-a)/c]7/1/2012 $-- $64,761 $64,761 0.00% $26,622 243.26%7/1/2013 $-- $33,846 $33,846 0.00% $25,139 134.64%7/1/2014 $-- $45,416 $45,416 0.00% $28,352 160.19%
B U D G E T A R Y C O M P A R I S O N S C H E D U L E
M A J O R D E B T S E R V I C E F U N D
2014-2015 Comprehensive Annual Financial Report

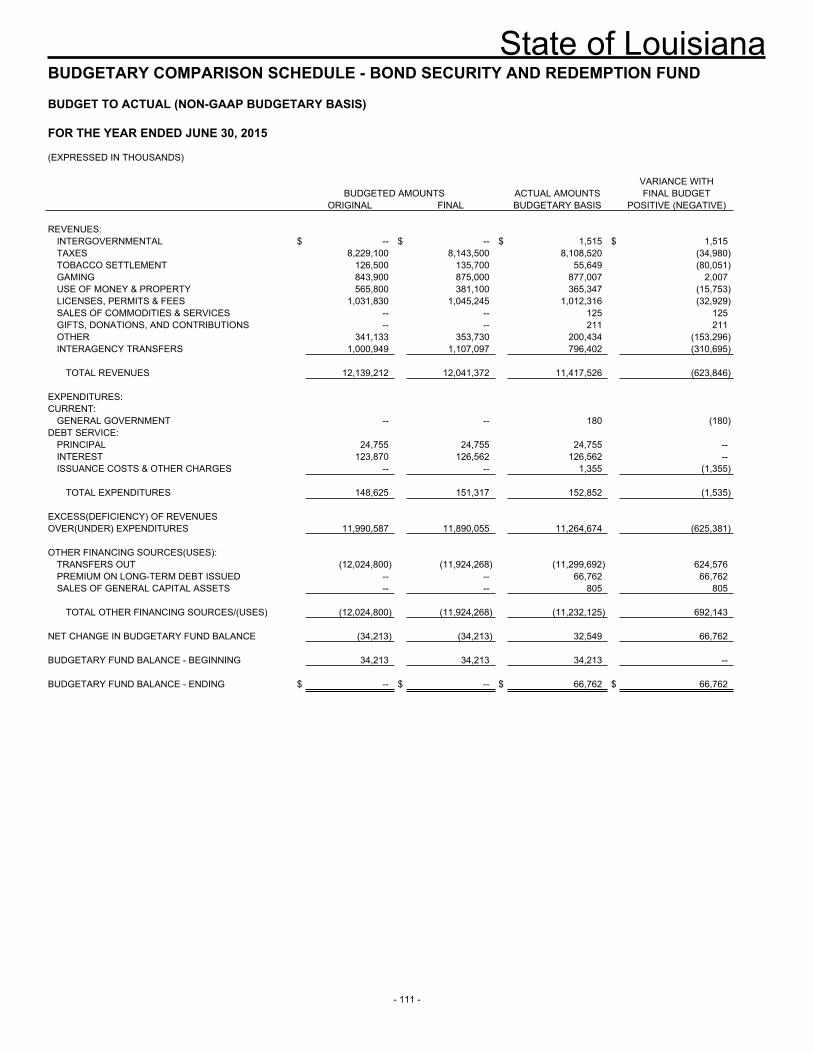
State of Louisiana
- 111 -
BUDGETARY COMPARISON SCHEDULE - BOND SECURITY AND REDEMPTION FUND
BUDGET TO ACTUAL (NON-GAAP BUDGETARY BASIS)
FOR THE YEAR ENDED JUNE 30, 2015 (EXPRESSED IN THOUSANDS) VARIANCE WITH BUDGETED AMOUNTS ACTUAL AMOUNTS FINAL BUDGET ORIGINAL FINAL BUDGETARY BASIS POSITIVE (NEGATIVE) REVENUES:
INTERGOVERNMENTAL $ -- $ -- $ 1,515 $ 1,515TAXES 8,229,100 8,143,500 8,108,520 (34,980)TOBACCO SETTLEMENT 126,500 135,700 55,649 (80,051)GAMING 843,900 875,000 877,007 2,007USE OF MONEY & PROPERTY 565,800 381,100 365,347 (15,753)LICENSES, PERMITS & FEES 1,031,830 1,045,245 1,012,316 (32,929)SALES OF COMMODITIES & SERVICES -- -- 125 125GIFTS, DONATIONS, AND CONTRIBUTIONS -- -- 211 211OTHER 341,133 353,730 200,434 (153,296)INTERAGENCY TRANSFERS 1,000,949 1,107,097 796,402 (310,695)
TOTAL REVENUES 12,139,212 12,041,372 11,417,526 (623,846)
EXPENDITURES: CURRENT:
GENERAL GOVERNMENT -- -- 180 (180)DEBT SERVICE:
PRINCIPAL 24,755 24,755 24,755 --INTEREST 123,870 126,562 126,562 --ISSUANCE COSTS & OTHER CHARGES -- -- 1,355 (1,355)
TOTAL EXPENDITURES 148,625 151,317 152,852 (1,535)
EXCESS(DEFICIENCY) OF REVENUES OVER(UNDER) EXPENDITURES 11,990,587 11,890,055 11,264,674 (625,381) OTHER FINANCING SOURCES(USES):
TRANSFERS OUT (12,024,800) (11,924,268) (11,299,692) 624,576PREMIUM ON LONG-TERM DEBT ISSUED -- -- 66,762 66,762SALES OF GENERAL CAPITAL ASSETS -- -- 805 805
TOTAL OTHER FINANCING SOURCES/(USES) (12,024,800) (11,924,268) (11,232,125) 692,143
NET CHANGE IN BUDGETARY FUND BALANCE (34,213) (34,213) 32,549 66,762 BUDGETARY FUND BALANCE - BEGINNING 34,213 34,213 34,213 -- BUDGETARY FUND BALANCE - ENDING $ -- $ -- $ 66,762 $ 66,762

- 112 -

C O M B I N I N G A N D I N D I V I D U A L F U N D S T A T E M E N T S
2014-2015 Comprehensive Annual Financial Report


- 113 -
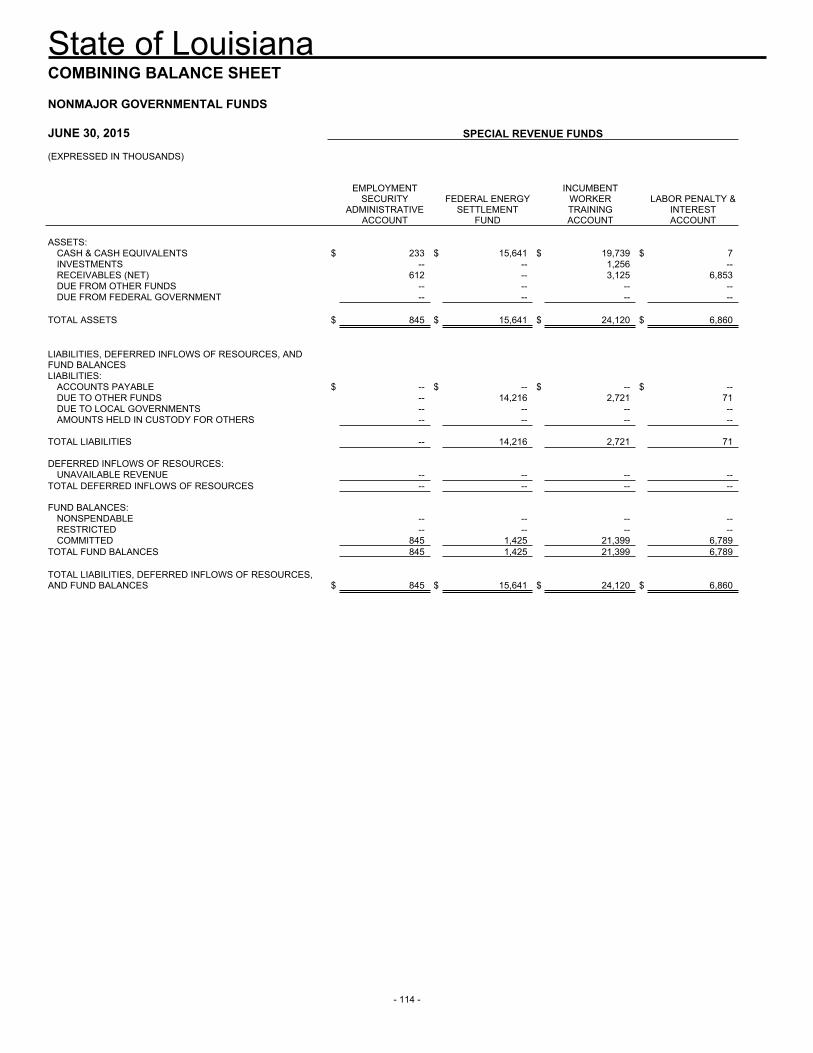
State of Louisiana
- 114 -
COMBINING BALANCE SHEET
NONMAJOR GOVERNMENTAL FUNDS
JUNE 30, 2015 SPECIAL REVENUE FUNDS (EXPRESSED IN THOUSANDS)
EMPLOYMENT SECURITY
ADMINISTRATIVE ACCOUNT
FEDERAL ENERGY SETTLEMENT
FUND
INCUMBENT WORKER TRAINING ACCOUNT
LABOR PENALTY & INTEREST ACCOUNT
ASSETS:
CASH & CASH EQUIVALENTS $ 233 $ 15,641 $ 19,739 $ 7INVESTMENTS -- -- 1,256 --RECEIVABLES (NET) 612 -- 3,125 6,853DUE FROM OTHER FUNDS -- -- -- --DUE FROM FEDERAL GOVERNMENT -- -- -- --
TOTAL ASSETS $ 845 $ 15,641 $ 24,120 $ 6,860 LIABILITIES, DEFERRED INFLOWS OF RESOURCES, AND FUND BALANCES LIABILITIES:
ACCOUNTS PAYABLE $ -- $ -- $ -- $ --DUE TO OTHER FUNDS -- 14,216 2,721 71DUE TO LOCAL GOVERNMENTS -- -- -- --AMOUNTS HELD IN CUSTODY FOR OTHERS -- -- -- --
TOTAL LIABILITIES -- 14,216 2,721 71 DEFERRED INFLOWS OF RESOURCES:
UNAVAILABLE REVENUE -- -- -- --TOTAL DEFERRED INFLOWS OF RESOURCES -- -- -- -- FUND BALANCES:
NONSPENDABLE -- -- -- --RESTRICTED -- -- -- --COMMITTED 845 1,425 21,399 6,789
TOTAL FUND BALANCES 845 1,425 21,399 6,789 TOTAL LIABILITIES, DEFERRED INFLOWS OF RESOURCES, AND FUND BALANCES $ 845 $ 15,641 $ 24,120 $ 6,860
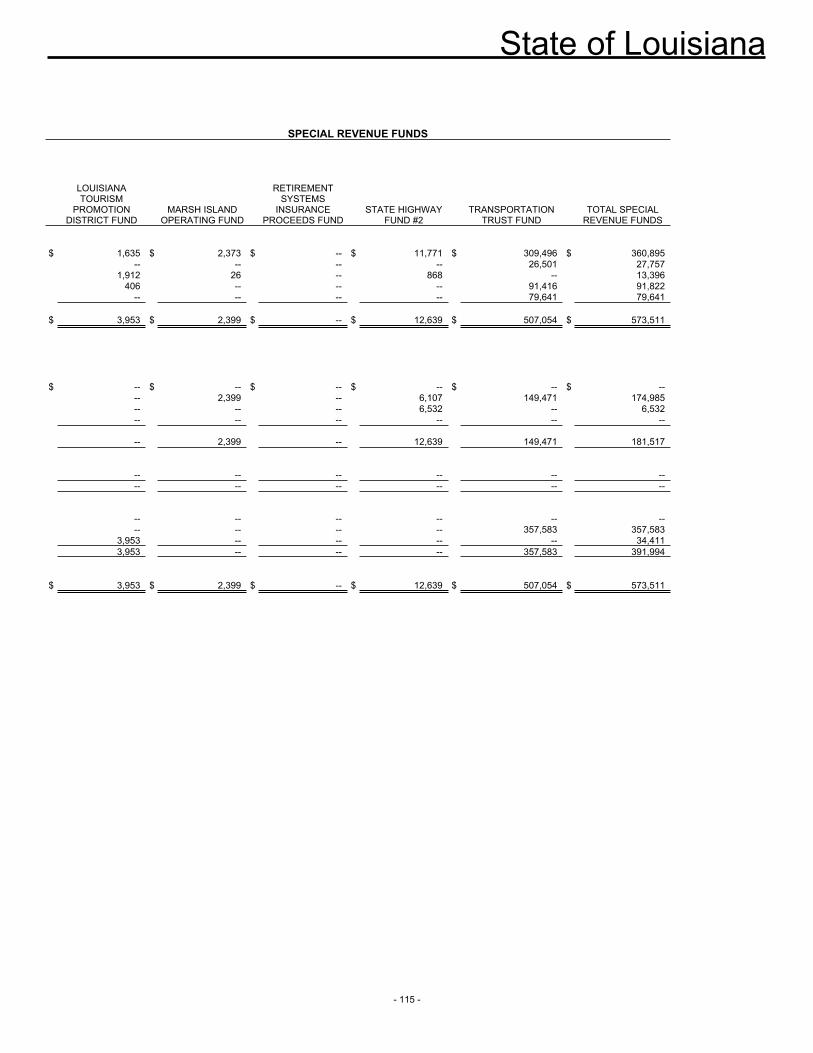
State of Louisiana
- 115 -
SPECIAL REVENUE FUNDS
LOUISIANA TOURISM
PROMOTION DISTRICT FUND
MARSH ISLAND OPERATING FUND
RETIREMENT SYSTEMS
INSURANCE PROCEEDS FUND
STATE HIGHWAY FUND #2
TRANSPORTATION TRUST FUND
TOTAL SPECIAL REVENUE FUNDS
$ 1,635 $ 2,373 $ -- $ 11,771 $ 309,496 $ 360,895 -- -- -- -- 26,501 27,757 1,912 26 -- 868 -- 13,396 406 -- -- -- 91,416 91,822 -- -- -- -- 79,641 79,641
$ 3,953 $ 2,399 $ -- $ 12,639 $ 507,054 $ 573,511
$ -- $ -- $ -- $ -- $ -- $ -- -- 2,399 -- 6,107 149,471 174,985 -- -- -- 6,532 -- 6,532 -- -- -- -- -- -- -- 2,399 -- 12,639 149,471 181,517 -- -- -- -- -- -- -- -- -- -- -- -- -- -- -- -- -- -- -- -- -- -- 357,583 357,583 3,953 -- -- -- -- 34,411 3,953 -- -- -- 357,583 391,994
$ 3,953 $ 2,399 $ -- $ 12,639 $ 507,054 $ 573,511
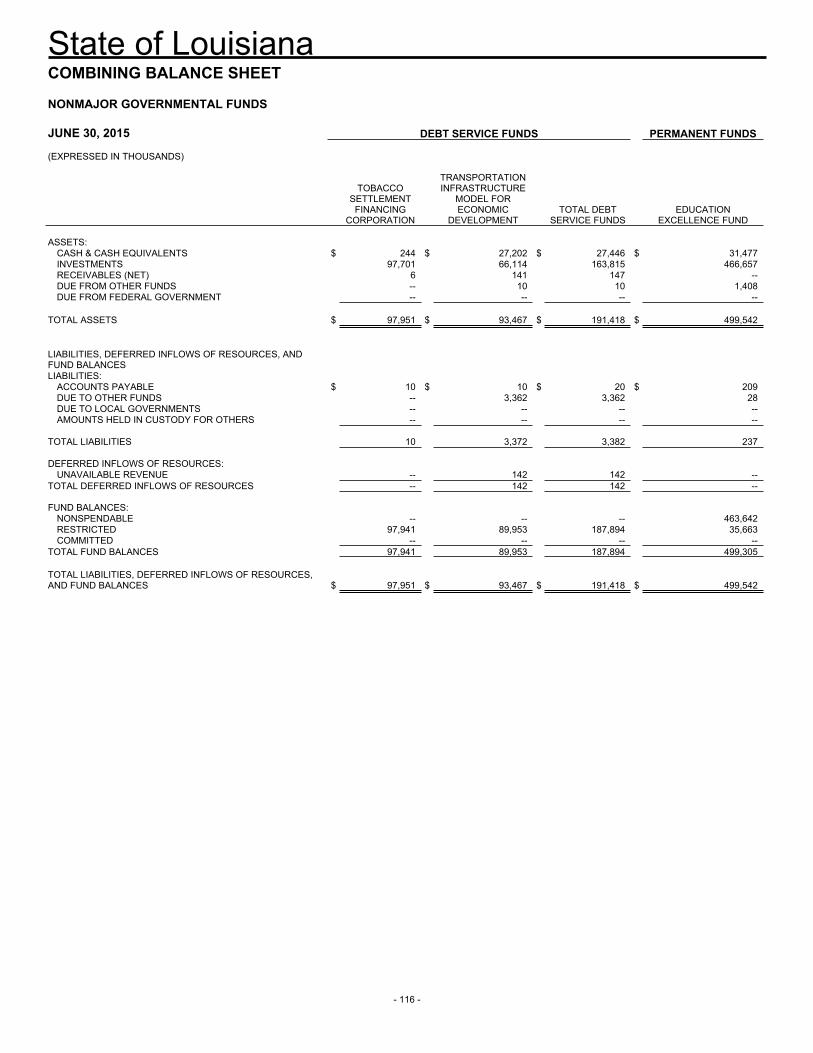
State of Louisiana
- 116 -
COMBINING BALANCE SHEET
NONMAJOR GOVERNMENTAL FUNDS
JUNE 30, 2015 DEBT SERVICE FUNDS PERMANENT FUNDS (EXPRESSED IN THOUSANDS)
TOBACCO SETTLEMENT
FINANCING CORPORATION
TRANSPORTATION INFRASTRUCTURE
MODEL FOR ECONOMIC
DEVELOPMENT TOTAL DEBT
SERVICE FUNDS EDUCATION
EXCELLENCE FUND ASSETS:
CASH & CASH EQUIVALENTS $ 244 $ 27,202 $ 27,446 $ 31,477INVESTMENTS 97,701 66,114 163,815 466,657RECEIVABLES (NET) 6 141 147 --DUE FROM OTHER FUNDS -- 10 10 1,408DUE FROM FEDERAL GOVERNMENT -- -- -- --
TOTAL ASSETS $ 97,951 $ 93,467 $ 191,418 $ 499,542 LIABILITIES, DEFERRED INFLOWS OF RESOURCES, AND FUND BALANCES LIABILITIES:
ACCOUNTS PAYABLE $ 10 $ 10 $ 20 $ 209DUE TO OTHER FUNDS -- 3,362 3,362 28DUE TO LOCAL GOVERNMENTS -- -- -- --AMOUNTS HELD IN CUSTODY FOR OTHERS -- -- -- --
TOTAL LIABILITIES 10 3,372 3,382 237 DEFERRED INFLOWS OF RESOURCES:
UNAVAILABLE REVENUE -- 142 142 --TOTAL DEFERRED INFLOWS OF RESOURCES -- 142 142 -- FUND BALANCES:
NONSPENDABLE -- -- -- 463,642RESTRICTED 97,941 89,953 187,894 35,663COMMITTED -- -- -- --
TOTAL FUND BALANCES 97,941 89,953 187,894 499,305 TOTAL LIABILITIES, DEFERRED INFLOWS OF RESOURCES, AND FUND BALANCES $ 97,951 $ 93,467 $ 191,418 $ 499,542
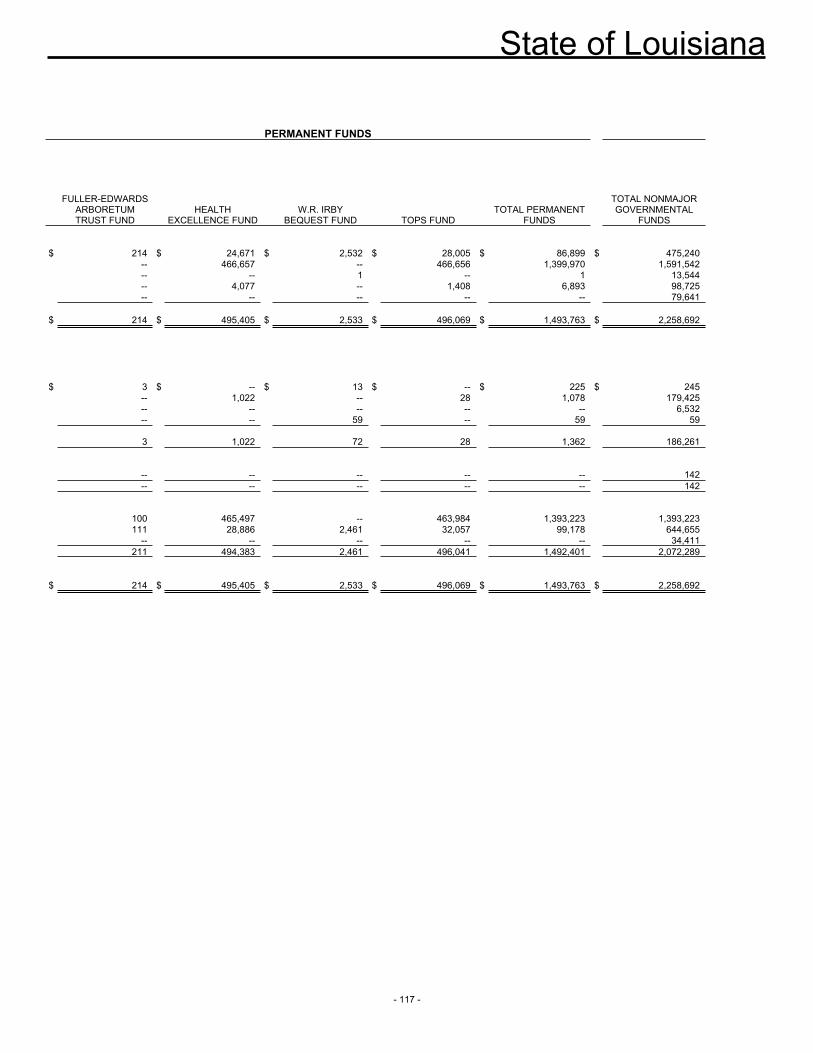
State of Louisiana
- 117 -
PERMANENT FUNDS
FULLER-EDWARDS ARBORETUM TRUST FUND
HEALTH EXCELLENCE FUND
W.R. IRBY BEQUEST FUND TOPS FUND
TOTAL PERMANENT FUNDS
TOTAL NONMAJOR GOVERNMENTAL
FUNDS
$ 214 $ 24,671 $ 2,532 $ 28,005 $ 86,899 $ 475,240 -- 466,657 -- 466,656 1,399,970 1,591,542 -- -- 1 -- 1 13,544 -- 4,077 -- 1,408 6,893 98,725 -- -- -- -- -- 79,641
$ 214 $ 495,405 $ 2,533 $ 496,069 $ 1,493,763 $ 2,258,692
$ 3 $ -- $ 13 $ -- $ 225 $ 245 -- 1,022 -- 28 1,078 179,425 -- -- -- -- -- 6,532 -- -- 59 -- 59 59 3 1,022 72 28 1,362 186,261 -- -- -- -- -- 142 -- -- -- -- -- 142 100 465,497 -- 463,984 1,393,223 1,393,223 111 28,886 2,461 32,057 99,178 644,655 -- -- -- -- -- 34,411 211 494,383 2,461 496,041 1,492,401 2,072,289
$ 214 $ 495,405 $ 2,533 $ 496,069 $ 1,493,763 $ 2,258,692
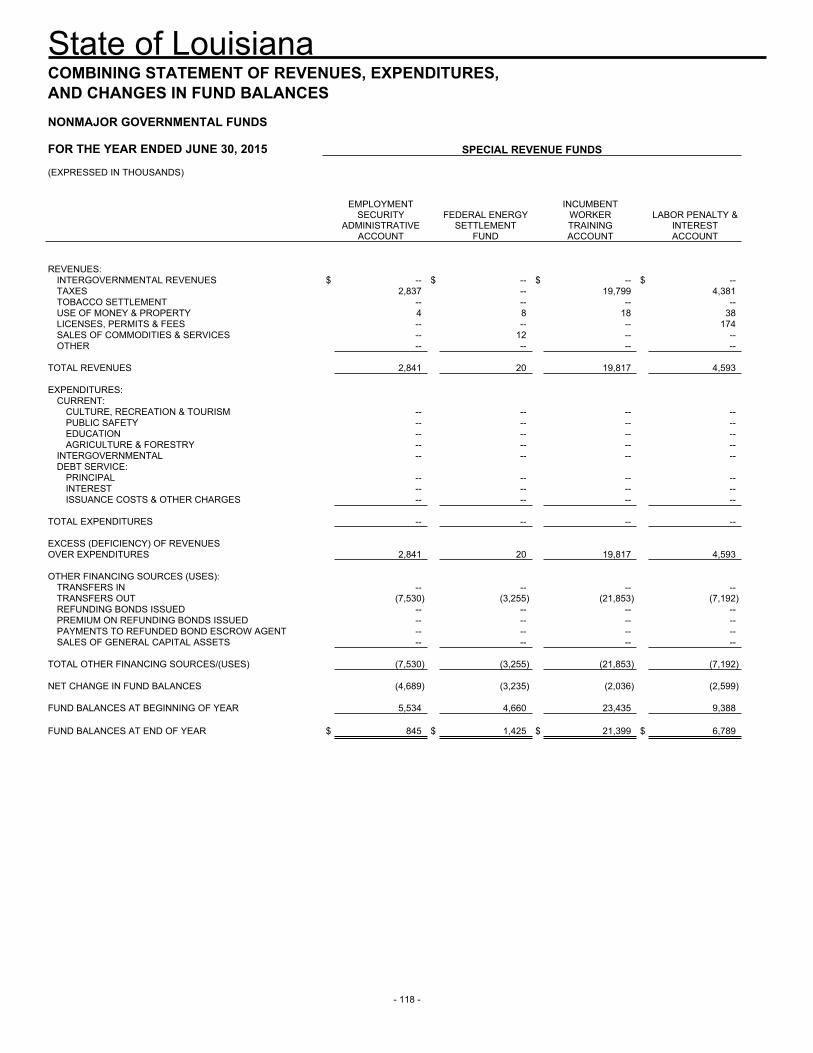
State of Louisiana
- 118 -
COMBINING STATEMENT OF REVENUES, EXPENDITURES,AND CHANGES IN FUND BALANCES NONMAJOR GOVERNMENTAL FUNDS FOR THE YEAR ENDED JUNE 30, 2015 SPECIAL REVENUE FUNDS (EXPRESSED IN THOUSANDS)
EMPLOYMENT SECURITY
ADMINISTRATIVE ACCOUNT
FEDERAL ENERGY SETTLEMENT
FUND
INCUMBENT WORKER TRAINING ACCOUNT
LABOR PENALTY & INTEREST ACCOUNT
REVENUES:
INTERGOVERNMENTAL REVENUES $ -- $ -- $ -- $ --TAXES 2,837 -- 19,799 4,381TOBACCO SETTLEMENT -- -- -- --USE OF MONEY & PROPERTY 4 8 18 38LICENSES, PERMITS & FEES -- -- -- 174SALES OF COMMODITIES & SERVICES -- 12 -- --OTHER -- -- -- --
TOTAL REVENUES 2,841 20 19,817 4,593 EXPENDITURES:
CURRENT: CULTURE, RECREATION & TOURISM -- -- -- --PUBLIC SAFETY -- -- -- --EDUCATION -- -- -- --AGRICULTURE & FORESTRY -- -- -- --
INTERGOVERNMENTAL -- -- -- --DEBT SERVICE:
PRINCIPAL -- -- -- --INTEREST -- -- -- --ISSUANCE COSTS & OTHER CHARGES -- -- -- --
TOTAL EXPENDITURES -- -- -- -- EXCESS (DEFICIENCY) OF REVENUES OVER EXPENDITURES 2,841 20 19,817 4,593 OTHER FINANCING SOURCES (USES):
TRANSFERS IN -- -- -- --TRANSFERS OUT (7,530) (3,255) (21,853) (7,192)REFUNDING BONDS ISSUED -- -- -- --PREMIUM ON REFUNDING BONDS ISSUED -- -- -- --PAYMENTS TO REFUNDED BOND ESCROW AGENT -- -- -- --SALES OF GENERAL CAPITAL ASSETS -- -- -- --
TOTAL OTHER FINANCING SOURCES/(USES) (7,530) (3,255) (21,853) (7,192) NET CHANGE IN FUND BALANCES (4,689) (3,235) (2,036) (2,599) FUND BALANCES AT BEGINNING OF YEAR 5,534 4,660 23,435 9,388 FUND BALANCES AT END OF YEAR $ 845 $ 1,425 $ 21,399 $ 6,789
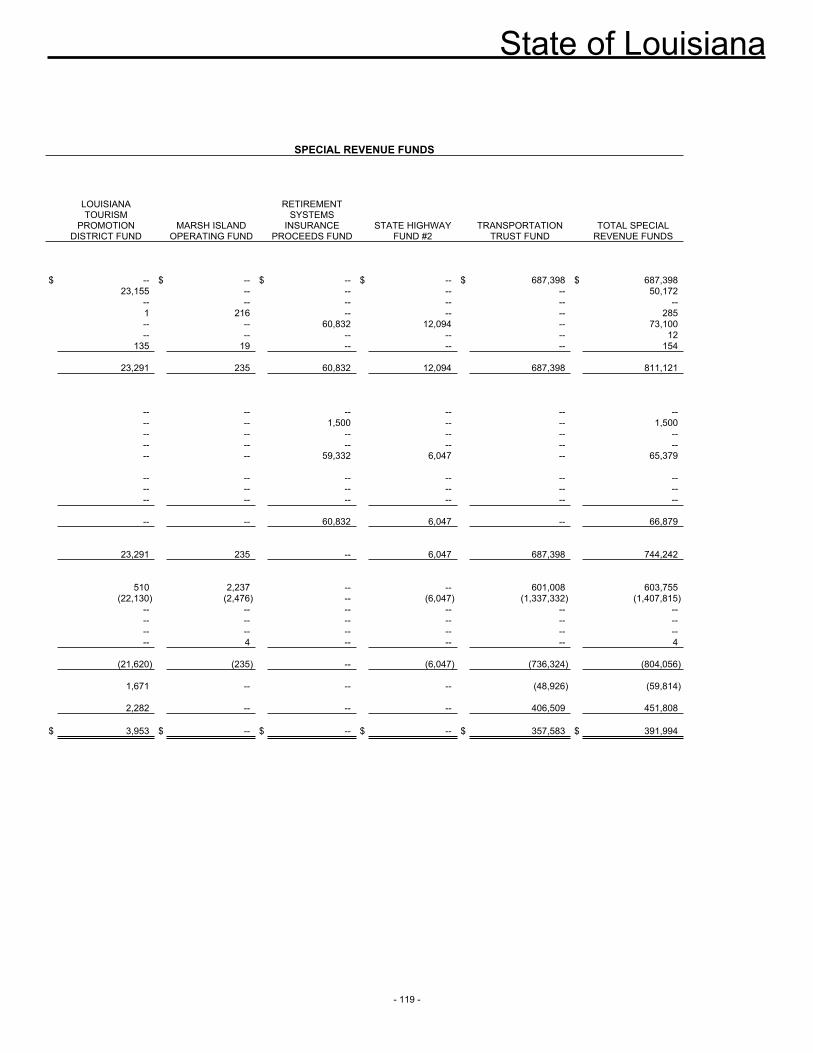
State of Louisiana
- 119 -
SPECIAL REVENUE FUNDS
LOUISIANA TOURISM
PROMOTION DISTRICT FUND
MARSH ISLAND OPERATING FUND
RETIREMENT SYSTEMS
INSURANCE PROCEEDS FUND
STATE HIGHWAY FUND #2
TRANSPORTATION TRUST FUND
TOTAL SPECIAL REVENUE FUNDS
$ -- $ -- $ -- $ -- $ 687,398 $ 687,398 23,155 -- -- -- -- 50,172 -- -- -- -- -- -- 1 216 -- -- -- 285 -- -- 60,832 12,094 -- 73,100 -- -- -- -- -- 12 135 19 -- -- -- 154 23,291 235 60,832 12,094 687,398 811,121 -- -- -- -- -- -- -- -- 1,500 -- -- 1,500 -- -- -- -- -- -- -- -- -- -- -- -- -- -- 59,332 6,047 -- 65,379 -- -- -- -- -- -- -- -- -- -- -- -- -- -- -- -- -- -- -- -- 60,832 6,047 -- 66,879 23,291 235 -- 6,047 687,398 744,242 510 2,237 -- -- 601,008 603,755 (22,130) (2,476) -- (6,047) (1,337,332) (1,407,815) -- -- -- -- -- -- -- -- -- -- -- -- -- -- -- -- -- -- -- 4 -- -- -- 4 (21,620) (235) -- (6,047) (736,324) (804,056) 1,671 -- -- -- (48,926) (59,814) 2,282 -- -- -- 406,509 451,808
$ 3,953 $ -- $ -- $ -- $ 357,583 $ 391,994
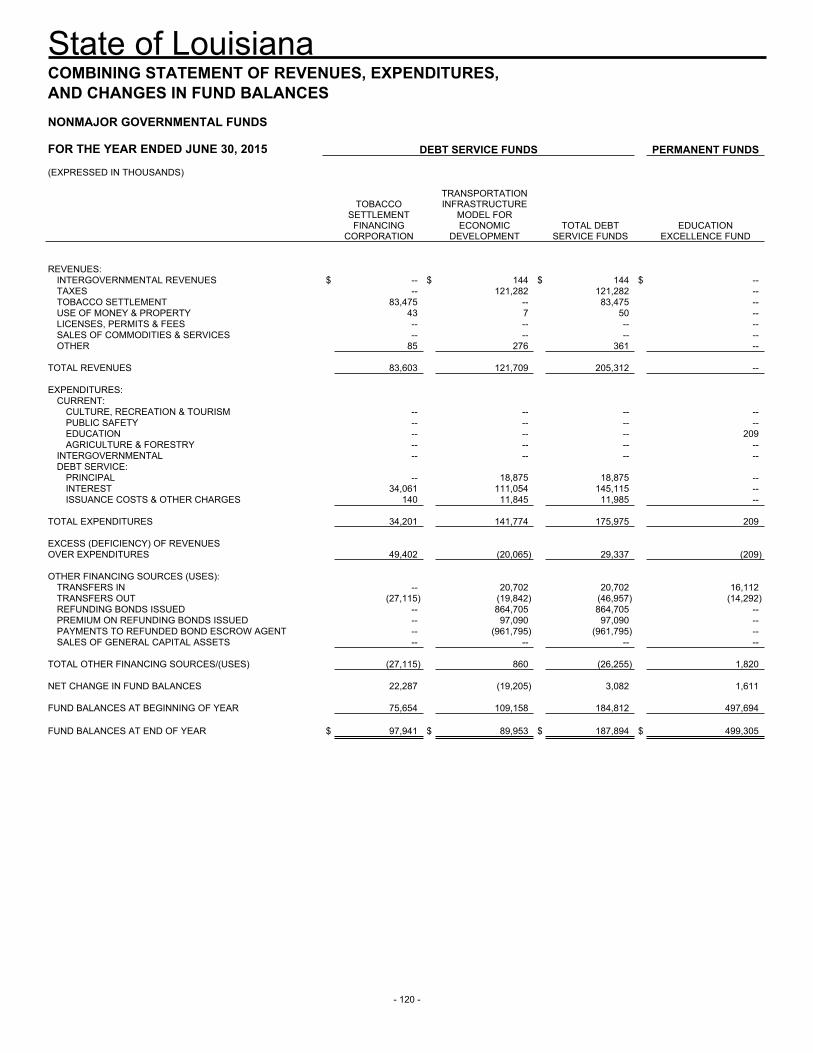
State of Louisiana
- 120 -
COMBINING STATEMENT OF REVENUES, EXPENDITURES,AND CHANGES IN FUND BALANCES NONMAJOR GOVERNMENTAL FUNDS FOR THE YEAR ENDED JUNE 30, 2015 DEBT SERVICE FUNDS PERMANENT FUNDS (EXPRESSED IN THOUSANDS)
TOBACCO SETTLEMENT
FINANCING CORPORATION
TRANSPORTATION INFRASTRUCTURE
MODEL FOR ECONOMIC
DEVELOPMENT TOTAL DEBT
SERVICE FUNDS EDUCATION
EXCELLENCE FUND REVENUES:
INTERGOVERNMENTAL REVENUES $ -- $ 144 $ 144 $ --TAXES -- 121,282 121,282 --TOBACCO SETTLEMENT 83,475 -- 83,475 --USE OF MONEY & PROPERTY 43 7 50 --LICENSES, PERMITS & FEES -- -- -- --SALES OF COMMODITIES & SERVICES -- -- -- --OTHER 85 276 361 --
TOTAL REVENUES 83,603 121,709 205,312 -- EXPENDITURES:
CURRENT: CULTURE, RECREATION & TOURISM -- -- -- --PUBLIC SAFETY -- -- -- --EDUCATION -- -- -- 209AGRICULTURE & FORESTRY -- -- -- --
INTERGOVERNMENTAL -- -- -- --DEBT SERVICE:
PRINCIPAL -- 18,875 18,875 --INTEREST 34,061 111,054 145,115 --ISSUANCE COSTS & OTHER CHARGES 140 11,845 11,985 --
TOTAL EXPENDITURES 34,201 141,774 175,975 209 EXCESS (DEFICIENCY) OF REVENUES OVER EXPENDITURES 49,402 (20,065) 29,337 (209) OTHER FINANCING SOURCES (USES):
TRANSFERS IN -- 20,702 20,702 16,112TRANSFERS OUT (27,115) (19,842) (46,957) (14,292)REFUNDING BONDS ISSUED -- 864,705 864,705 --PREMIUM ON REFUNDING BONDS ISSUED -- 97,090 97,090 --PAYMENTS TO REFUNDED BOND ESCROW AGENT -- (961,795) (961,795) --SALES OF GENERAL CAPITAL ASSETS -- -- -- --
TOTAL OTHER FINANCING SOURCES/(USES) (27,115) 860 (26,255) 1,820 NET CHANGE IN FUND BALANCES 22,287 (19,205) 3,082 1,611 FUND BALANCES AT BEGINNING OF YEAR 75,654 109,158 184,812 497,694 FUND BALANCES AT END OF YEAR $ 97,941 $ 89,953 $ 187,894 $ 499,305
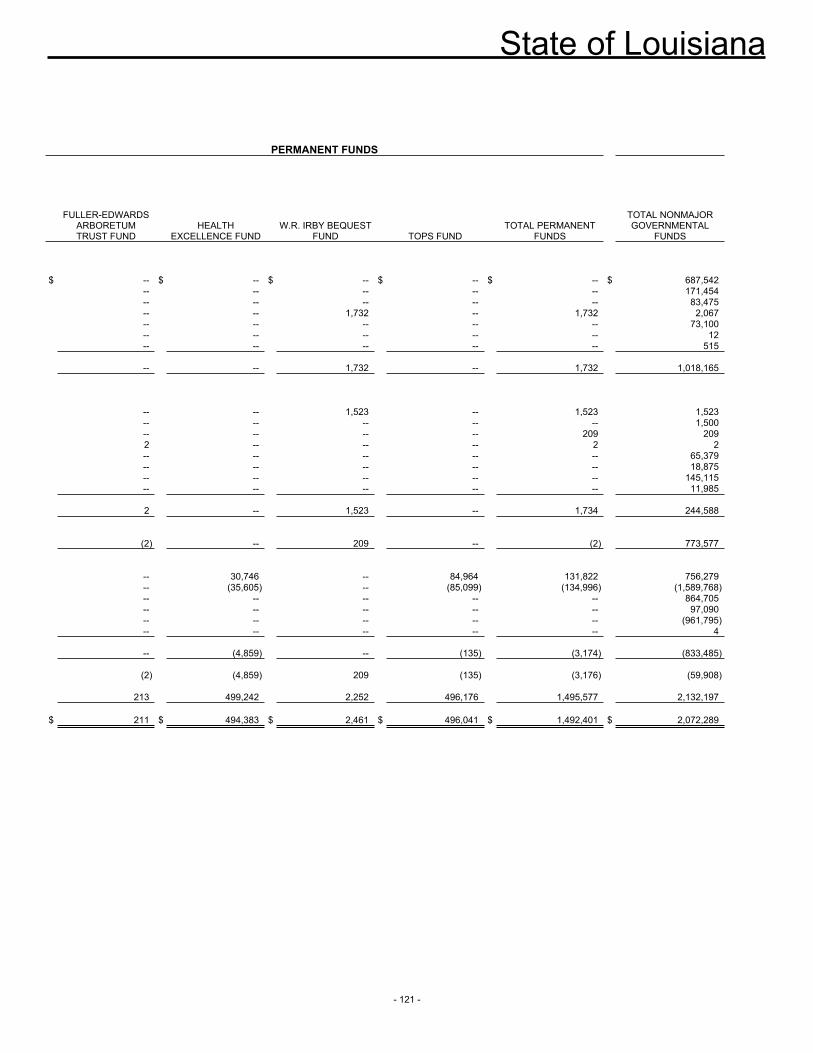
State of Louisiana
- 121 -
PERMANENT FUNDS
FULLER-EDWARDS ARBORETUM TRUST FUND
HEALTH EXCELLENCE FUND
W.R. IRBY BEQUEST FUND TOPS FUND
TOTAL PERMANENT FUNDS
TOTAL NONMAJOR GOVERNMENTAL
FUNDS
$ -- $ -- $ -- $ -- $ -- $ 687,542 -- -- -- -- -- 171,454 -- -- -- -- -- 83,475 -- -- 1,732 -- 1,732 2,067 -- -- -- -- -- 73,100 -- -- -- -- -- 12 -- -- -- -- -- 515 -- -- 1,732 -- 1,732 1,018,165 -- -- 1,523 -- 1,523 1,523 -- -- -- -- -- 1,500 -- -- -- -- 209 209 2 -- -- -- 2 2 -- -- -- -- -- 65,379 -- -- -- -- -- 18,875 -- -- -- -- -- 145,115 -- -- -- -- -- 11,985 2 -- 1,523 -- 1,734 244,588 (2) -- 209 -- (2) 773,577 -- 30,746 -- 84,964 131,822 756,279 -- (35,605) -- (85,099) (134,996) (1,589,768) -- -- -- -- -- 864,705 -- -- -- -- -- 97,090 -- -- -- -- -- (961,795) -- -- -- -- -- 4 -- (4,859) -- (135) (3,174) (833,485) (2) (4,859) 209 (135) (3,176) (59,908) 213 499,242 2,252 496,176 1,495,577 2,132,197
$ 211 $ 494,383 $ 2,461 $ 496,041 $ 1,492,401 $ 2,072,289
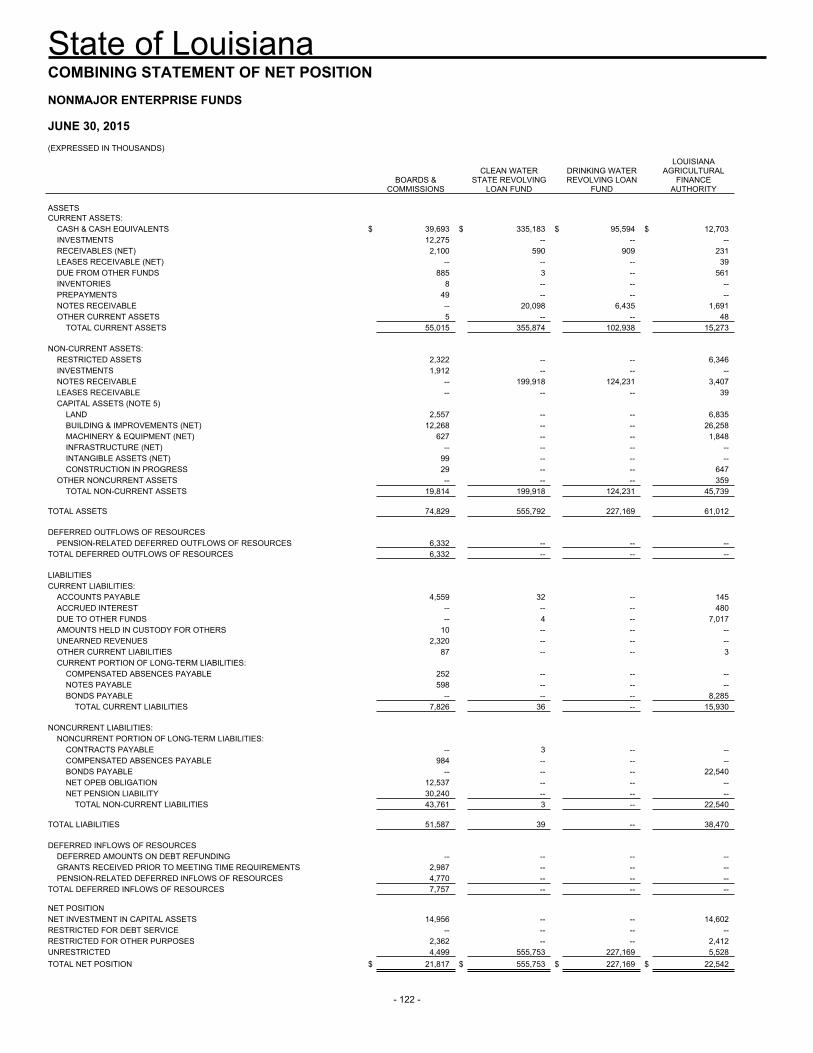
State of Louisiana
- 122 -
COMBINING STATEMENT OF NET POSITION NONMAJOR ENTERPRISE FUNDS JUNE 30, 2015 (EXPRESSED IN THOUSANDS)
BOARDS &
COMMISSIONS
CLEAN WATER STATE REVOLVING
LOAN FUND
DRINKING WATER REVOLVING LOAN
FUND
LOUISIANA AGRICULTURAL
FINANCE AUTHORITY
ASSETS CURRENT ASSETS:
CASH & CASH EQUIVALENTS $ 39,693 $ 335,183 $ 95,594 $ 12,703INVESTMENTS 12,275 -- -- --RECEIVABLES (NET) 2,100 590 909 231LEASES RECEIVABLE (NET) -- -- -- 39DUE FROM OTHER FUNDS 885 3 -- 561INVENTORIES 8 -- -- --PREPAYMENTS 49 -- -- --NOTES RECEIVABLE -- 20,098 6,435 1,691OTHER CURRENT ASSETS 5 -- -- 48
TOTAL CURRENT ASSETS 55,015 355,874 102,938 15,273 NON-CURRENT ASSETS:
RESTRICTED ASSETS 2,322 -- -- 6,346INVESTMENTS 1,912 -- -- --NOTES RECEIVABLE -- 199,918 124,231 3,407LEASES RECEIVABLE -- -- -- 39CAPITAL ASSETS (NOTE 5)
LAND 2,557 -- -- 6,835BUILDING & IMPROVEMENTS (NET) 12,268 -- -- 26,258MACHINERY & EQUIPMENT (NET) 627 -- -- 1,848INFRASTRUCTURE (NET) -- -- -- --INTANGIBLE ASSETS (NET) 99 -- -- --CONSTRUCTION IN PROGRESS 29 -- -- 647
OTHER NONCURRENT ASSETS -- -- -- 359TOTAL NON-CURRENT ASSETS 19,814 199,918 124,231 45,739
TOTAL ASSETS 74,829 555,792 227,169 61,012 DEFERRED OUTFLOWS OF RESOURCES
PENSION-RELATED DEFERRED OUTFLOWS OF RESOURCES 6,332 -- -- --TOTAL DEFERRED OUTFLOWS OF RESOURCES 6,332 -- -- -- LIABILITIES CURRENT LIABILITIES:
ACCOUNTS PAYABLE 4,559 32 -- 145ACCRUED INTEREST -- -- -- 480DUE TO OTHER FUNDS -- 4 -- 7,017AMOUNTS HELD IN CUSTODY FOR OTHERS 10 -- -- --UNEARNED REVENUES 2,320 -- -- --OTHER CURRENT LIABILITIES 87 -- -- 3CURRENT PORTION OF LONG-TERM LIABILITIES:
COMPENSATED ABSENCES PAYABLE 252 -- -- --NOTES PAYABLE 598 -- -- --BONDS PAYABLE -- -- -- 8,285
TOTAL CURRENT LIABILITIES 7,826 36 -- 15,930
NONCURRENT LIABILITIES: NONCURRENT PORTION OF LONG-TERM LIABILITIES:
CONTRACTS PAYABLE -- 3 -- --COMPENSATED ABSENCES PAYABLE 984 -- -- --BONDS PAYABLE -- -- -- 22,540NET OPEB OBLIGATION 12,537 -- -- --NET PENSION LIABILITY 30,240 -- -- --
TOTAL NON-CURRENT LIABILITIES 43,761 3 -- 22,540 TOTAL LIABILITIES 51,587 39 -- 38,470 DEFERRED INFLOWS OF RESOURCES
DEFERRED AMOUNTS ON DEBT REFUNDING -- -- -- --GRANTS RECEIVED PRIOR TO MEETING TIME REQUIREMENTS 2,987 -- -- --PENSION-RELATED DEFERRED INFLOWS OF RESOURCES 4,770 -- -- --
TOTAL DEFERRED INFLOWS OF RESOURCES 7,757 -- -- -- NET POSITION NET INVESTMENT IN CAPITAL ASSETS 14,956 -- -- 14,602RESTRICTED FOR DEBT SERVICE -- -- -- --RESTRICTED FOR OTHER PURPOSES 2,362 -- -- 2,412UNRESTRICTED 4,499 555,753 227,169 5,528TOTAL NET POSITION $ 21,817 $ 555,753 $ 227,169 $ 22,542
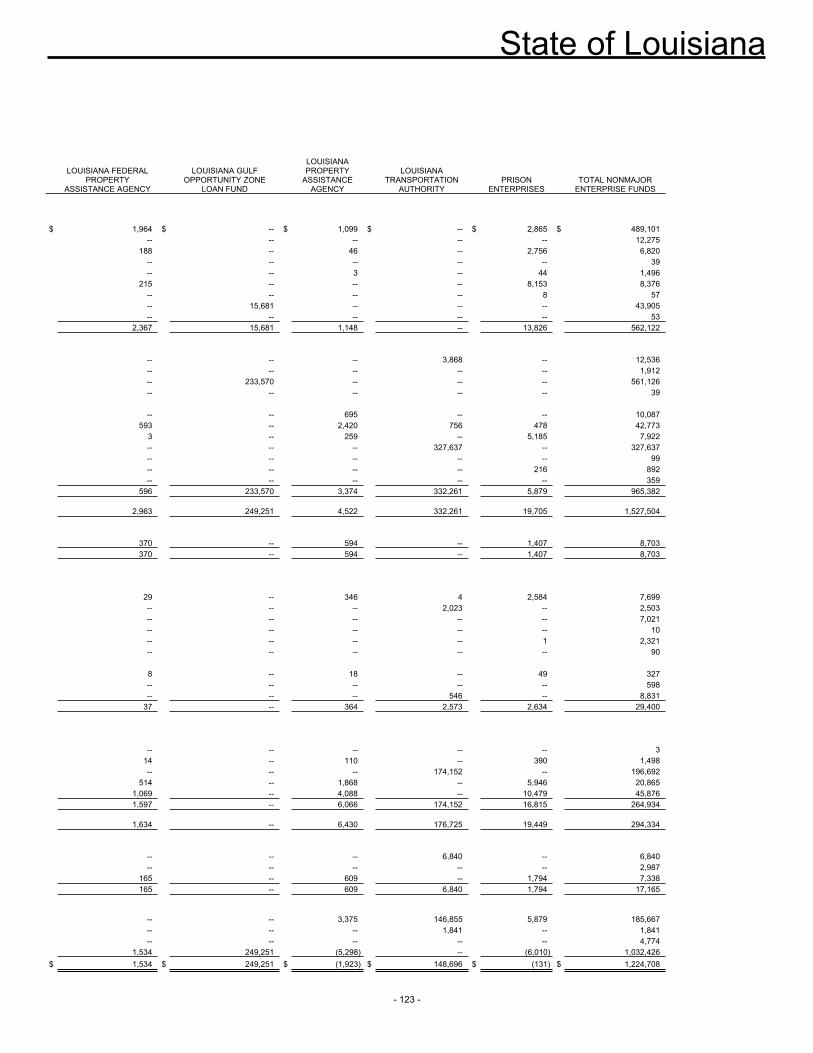
State of Louisiana
- 123 -
LOUISIANA FEDERAL PROPERTY
ASSISTANCE AGENCY
LOUISIANA GULF OPPORTUNITY ZONE
LOAN FUND
LOUISIANA PROPERTY
ASSISTANCE AGENCY
LOUISIANA TRANSPORTATION
AUTHORITY PRISON
ENTERPRISES TOTAL NONMAJOR
ENTERPRISE FUNDS
$ 1,964 $ -- $ 1,099 $ -- $ 2,865 $ 489,101 -- -- -- -- -- 12,275 188 -- 46 -- 2,756 6,820 -- -- -- -- -- 39 -- -- 3 -- 44 1,496 215 -- -- -- 8,153 8,376 -- -- -- -- 8 57 -- 15,681 -- -- -- 43,905 -- -- -- -- -- 53 2,367 15,681 1,148 -- 13,826 562,122 -- -- -- 3,868 -- 12,536 -- -- -- -- -- 1,912 -- 233,570 -- -- -- 561,126 -- -- -- -- -- 39 -- -- 695 -- -- 10,087 593 -- 2,420 756 478 42,773 3 -- 259 -- 5,185 7,922 -- -- -- 327,637 -- 327,637 -- -- -- -- -- 99 -- -- -- -- 216 892 -- -- -- -- -- 359 596 233,570 3,374 332,261 5,879 965,382 2,963 249,251 4,522 332,261 19,705 1,527,504 370 -- 594 -- 1,407 8,703 370 -- 594 -- 1,407 8,703 29 -- 346 4 2,584 7,699 -- -- -- 2,023 -- 2,503 -- -- -- -- -- 7,021 -- -- -- -- -- 10 -- -- -- -- 1 2,321 -- -- -- -- -- 90 8 -- 18 -- 49 327 -- -- -- -- -- 598 -- -- -- 546 -- 8,831 37 -- 364 2,573 2,634 29,400 -- -- -- -- -- 3 14 -- 110 -- 390 1,498 -- -- -- 174,152 -- 196,692 514 -- 1,868 -- 5,946 20,865 1,069 -- 4,088 -- 10,479 45,876 1,597 -- 6,066 174,152 16,815 264,934
1,634 -- 6,430 176,725 19,449 294,334 -- -- -- 6,840 -- 6,840 -- -- -- -- -- 2,987 165 -- 609 -- 1,794 7,338 165 -- 609 6,840 1,794 17,165 -- -- 3,375 146,855 5,879 185,667 -- -- -- 1,841 -- 1,841 -- -- -- -- -- 4,774 1,534 249,251 (5,298) -- (6,010) 1,032,426
$ 1,534 $ 249,251 $ (1,923) $ 148,696 $ (131) $ 1,224,708
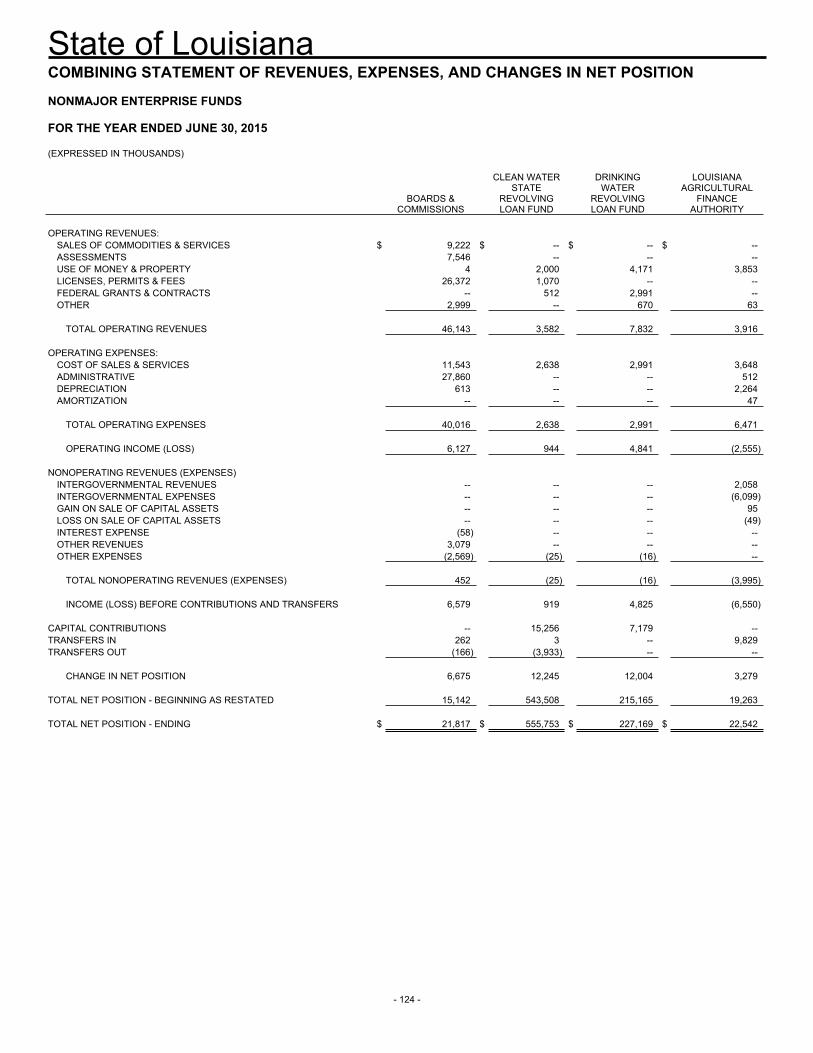
State of Louisiana
- 124 -
COMBINING STATEMENT OF REVENUES, EXPENSES, AND CHANGES IN NET POSITION NONMAJOR ENTERPRISE FUNDS FOR THE YEAR ENDED JUNE 30, 2015 (EXPRESSED IN THOUSANDS)
BOARDS &
COMMISSIONS
CLEAN WATER STATE
REVOLVING LOAN FUND
DRINKING WATER
REVOLVING LOAN FUND
LOUISIANA AGRICULTURAL
FINANCE AUTHORITY
OPERATING REVENUES:
SALES OF COMMODITIES & SERVICES $ 9,222 $ -- $ -- $ --ASSESSMENTS 7,546 -- -- --USE OF MONEY & PROPERTY 4 2,000 4,171 3,853LICENSES, PERMITS & FEES 26,372 1,070 -- --FEDERAL GRANTS & CONTRACTS -- 512 2,991 --OTHER 2,999 -- 670 63
TOTAL OPERATING REVENUES 46,143 3,582 7,832 3,916 OPERATING EXPENSES:
COST OF SALES & SERVICES 11,543 2,638 2,991 3,648ADMINISTRATIVE 27,860 -- -- 512DEPRECIATION 613 -- -- 2,264AMORTIZATION -- -- -- 47
TOTAL OPERATING EXPENSES 40,016 2,638 2,991 6,471
OPERATING INCOME (LOSS) 6,127 944 4,841 (2,555) NONOPERATING REVENUES (EXPENSES)
INTERGOVERNMENTAL REVENUES -- -- -- 2,058INTERGOVERNMENTAL EXPENSES -- -- -- (6,099)GAIN ON SALE OF CAPITAL ASSETS -- -- -- 95LOSS ON SALE OF CAPITAL ASSETS -- -- -- (49)INTEREST EXPENSE (58) -- -- --OTHER REVENUES 3,079 -- -- --OTHER EXPENSES (2,569) (25) (16) --
TOTAL NONOPERATING REVENUES (EXPENSES) 452 (25) (16) (3,995) INCOME (LOSS) BEFORE CONTRIBUTIONS AND TRANSFERS 6,579 919 4,825 (6,550)
CAPITAL CONTRIBUTIONS -- 15,256 7,179 --TRANSFERS IN 262 3 -- 9,829TRANSFERS OUT (166) (3,933) -- --
CHANGE IN NET POSITION 6,675 12,245 12,004 3,279 TOTAL NET POSITION - BEGINNING AS RESTATED 15,142 543,508 215,165 19,263 TOTAL NET POSITION - ENDING $ 21,817 $ 555,753 $ 227,169 $ 22,542
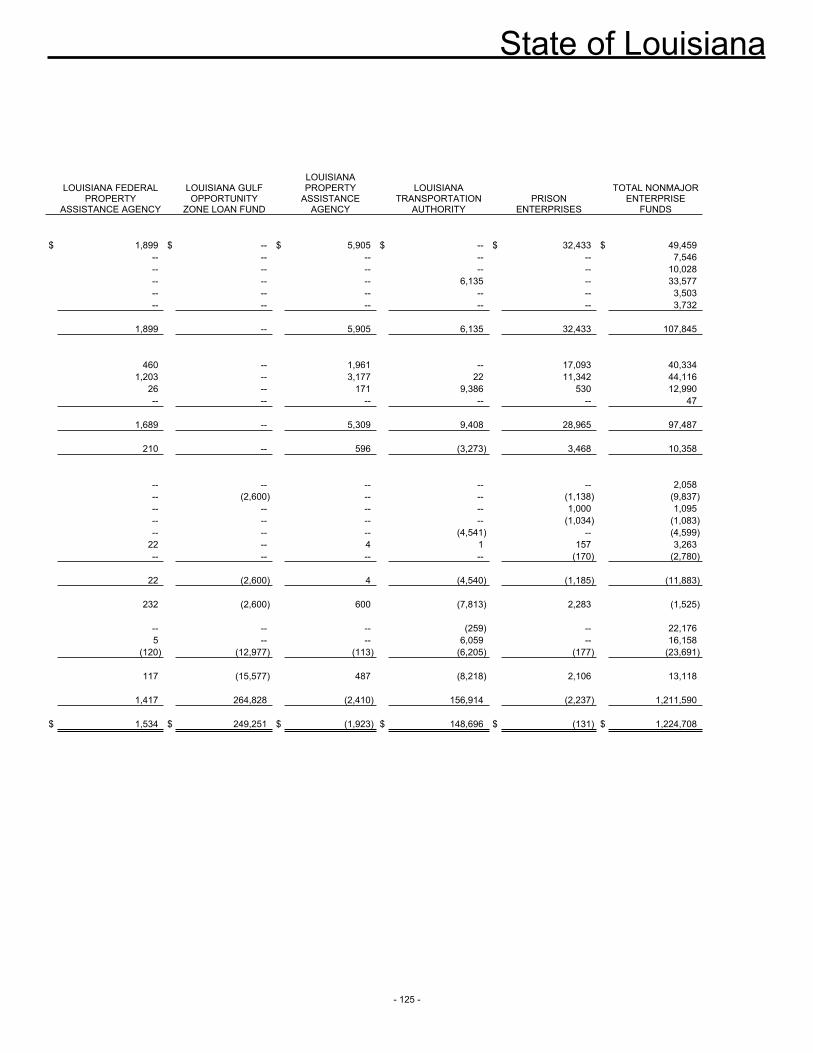
State of Louisiana
- 125 -
LOUISIANA FEDERAL PROPERTY
ASSISTANCE AGENCY
LOUISIANA GULF OPPORTUNITY
ZONE LOAN FUND
LOUISIANA PROPERTY
ASSISTANCE AGENCY
LOUISIANA TRANSPORTATION
AUTHORITY PRISON
ENTERPRISES
TOTAL NONMAJOR ENTERPRISE
FUNDS
$ 1,899 $ -- $ 5,905 $ -- $ 32,433 $ 49,459 -- -- -- -- -- 7,546 -- -- -- -- -- 10,028 -- -- -- 6,135 -- 33,577 -- -- -- -- -- 3,503 -- -- -- -- -- 3,732 1,899 -- 5,905 6,135 32,433 107,845 460 -- 1,961 -- 17,093 40,334 1,203 -- 3,177 22 11,342 44,116 26 -- 171 9,386 530 12,990 -- -- -- -- -- 47 1,689 -- 5,309 9,408 28,965 97,487 210 -- 596 (3,273) 3,468 10,358 -- -- -- -- -- 2,058 -- (2,600) -- -- (1,138) (9,837) -- -- -- -- 1,000 1,095 -- -- -- -- (1,034) (1,083) -- -- -- (4,541) -- (4,599) 22 -- 4 1 157 3,263 -- -- -- -- (170) (2,780) 22 (2,600) 4 (4,540) (1,185) (11,883) 232 (2,600) 600 (7,813) 2,283 (1,525) -- -- -- (259) -- 22,176 5 -- -- 6,059 -- 16,158 (120) (12,977) (113) (6,205) (177) (23,691) 117 (15,577) 487 (8,218) 2,106 13,118 1,417 264,828 (2,410) 156,914 (2,237) 1,211,590
$ 1,534 $ 249,251 $ (1,923) $ 148,696 $ (131) $ 1,224,708
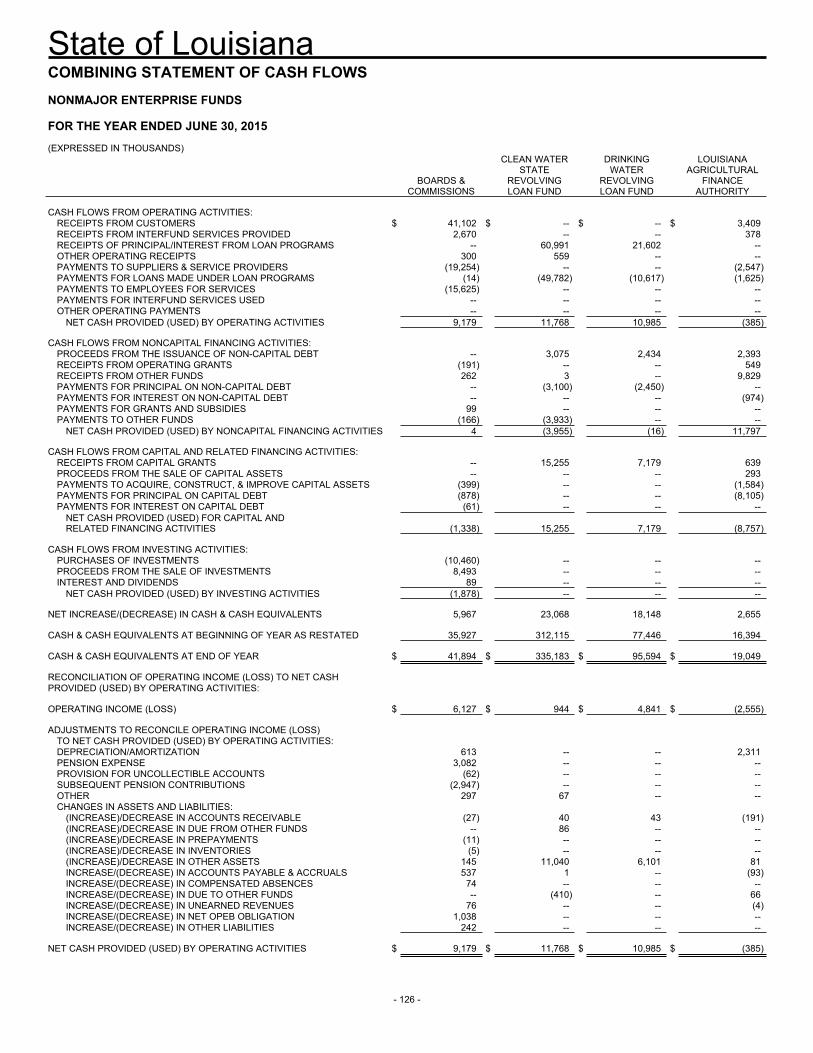
State of Louisiana
- 126 -
COMBINING STATEMENT OF CASH FLOWS NONMAJOR ENTERPRISE FUNDS FOR THE YEAR ENDED JUNE 30, 2015 (EXPRESSED IN THOUSANDS)
BOARDS &
COMMISSIONS
CLEAN WATER STATE
REVOLVING LOAN FUND
DRINKING WATER
REVOLVING LOAN FUND
LOUISIANA AGRICULTURAL
FINANCE AUTHORITY
CASH FLOWS FROM OPERATING ACTIVITIES:
RECEIPTS FROM CUSTOMERS $ 41,102 $ -- $ -- $ 3,409RECEIPTS FROM INTERFUND SERVICES PROVIDED 2,670 -- -- 378RECEIPTS OF PRINCIPAL/INTEREST FROM LOAN PROGRAMS -- 60,991 21,602 --OTHER OPERATING RECEIPTS 300 559 -- --PAYMENTS TO SUPPLIERS & SERVICE PROVIDERS (19,254) -- -- (2,547)PAYMENTS FOR LOANS MADE UNDER LOAN PROGRAMS (14) (49,782) (10,617) (1,625)PAYMENTS TO EMPLOYEES FOR SERVICES (15,625) -- -- --PAYMENTS FOR INTERFUND SERVICES USED -- -- -- --OTHER OPERATING PAYMENTS -- -- -- --
NET CASH PROVIDED (USED) BY OPERATING ACTIVITIES 9,179 11,768 10,985 (385) CASH FLOWS FROM NONCAPITAL FINANCING ACTIVITIES:
PROCEEDS FROM THE ISSUANCE OF NON-CAPITAL DEBT -- 3,075 2,434 2,393RECEIPTS FROM OPERATING GRANTS (191) -- -- 549RECEIPTS FROM OTHER FUNDS 262 3 -- 9,829PAYMENTS FOR PRINCIPAL ON NON-CAPITAL DEBT -- (3,100) (2,450) --PAYMENTS FOR INTEREST ON NON-CAPITAL DEBT -- -- -- (974)PAYMENTS FOR GRANTS AND SUBSIDIES 99 -- -- --PAYMENTS TO OTHER FUNDS (166) (3,933) -- --
NET CASH PROVIDED (USED) BY NONCAPITAL FINANCING ACTIVITIES 4 (3,955) (16) 11,797 CASH FLOWS FROM CAPITAL AND RELATED FINANCING ACTIVITIES:
RECEIPTS FROM CAPITAL GRANTS -- 15,255 7,179 639PROCEEDS FROM THE SALE OF CAPITAL ASSETS -- -- -- 293PAYMENTS TO ACQUIRE, CONSTRUCT, & IMPROVE CAPITAL ASSETS (399) -- -- (1,584)PAYMENTS FOR PRINCIPAL ON CAPITAL DEBT (878) -- -- (8,105)PAYMENTS FOR INTEREST ON CAPITAL DEBT (61) -- -- --
NET CASH PROVIDED (USED) FOR CAPITAL AND RELATED FINANCING ACTIVITIES (1,338) 15,255 7,179 (8,757)
CASH FLOWS FROM INVESTING ACTIVITIES:
PURCHASES OF INVESTMENTS (10,460) -- -- --PROCEEDS FROM THE SALE OF INVESTMENTS 8,493 -- -- --INTEREST AND DIVIDENDS 89 -- -- --
NET CASH PROVIDED (USED) BY INVESTING ACTIVITIES (1,878) -- -- -- NET INCREASE/(DECREASE) IN CASH & CASH EQUIVALENTS 5,967 23,068 18,148 2,655 CASH & CASH EQUIVALENTS AT BEGINNING OF YEAR AS RESTATED 35,927 312,115 77,446 16,394 CASH & CASH EQUIVALENTS AT END OF YEAR $ 41,894 $ 335,183 $ 95,594 $ 19,049 RECONCILIATION OF OPERATING INCOME (LOSS) TO NET CASH PROVIDED (USED) BY OPERATING ACTIVITIES: OPERATING INCOME (LOSS) $ 6,127 $ 944 $ 4,841 $ (2,555) ADJUSTMENTS TO RECONCILE OPERATING INCOME (LOSS)
TO NET CASH PROVIDED (USED) BY OPERATING ACTIVITIES: DEPRECIATION/AMORTIZATION 613 -- -- 2,311PENSION EXPENSE 3,082 -- -- --PROVISION FOR UNCOLLECTIBLE ACCOUNTS (62) -- -- --SUBSEQUENT PENSION CONTRIBUTIONS (2,947) -- -- --OTHER 297 67 -- --CHANGES IN ASSETS AND LIABILITIES:
(INCREASE)/DECREASE IN ACCOUNTS RECEIVABLE (27) 40 43 (191)(INCREASE)/DECREASE IN DUE FROM OTHER FUNDS -- 86 -- --(INCREASE)/DECREASE IN PREPAYMENTS (11) -- -- --(INCREASE)/DECREASE IN INVENTORIES (5) -- -- --(INCREASE)/DECREASE IN OTHER ASSETS 145 11,040 6,101 81INCREASE/(DECREASE) IN ACCOUNTS PAYABLE & ACCRUALS 537 1 -- (93)INCREASE/(DECREASE) IN COMPENSATED ABSENCES 74 -- -- --INCREASE/(DECREASE) IN DUE TO OTHER FUNDS -- (410) -- 66INCREASE/(DECREASE) IN UNEARNED REVENUES 76 -- -- (4)INCREASE/(DECREASE) IN NET OPEB OBLIGATION 1,038 -- -- --INCREASE/(DECREASE) IN OTHER LIABILITIES 242 -- -- --
NET CASH PROVIDED (USED) BY OPERATING ACTIVITIES $ 9,179 $ 11,768 $ 10,985 $ (385)
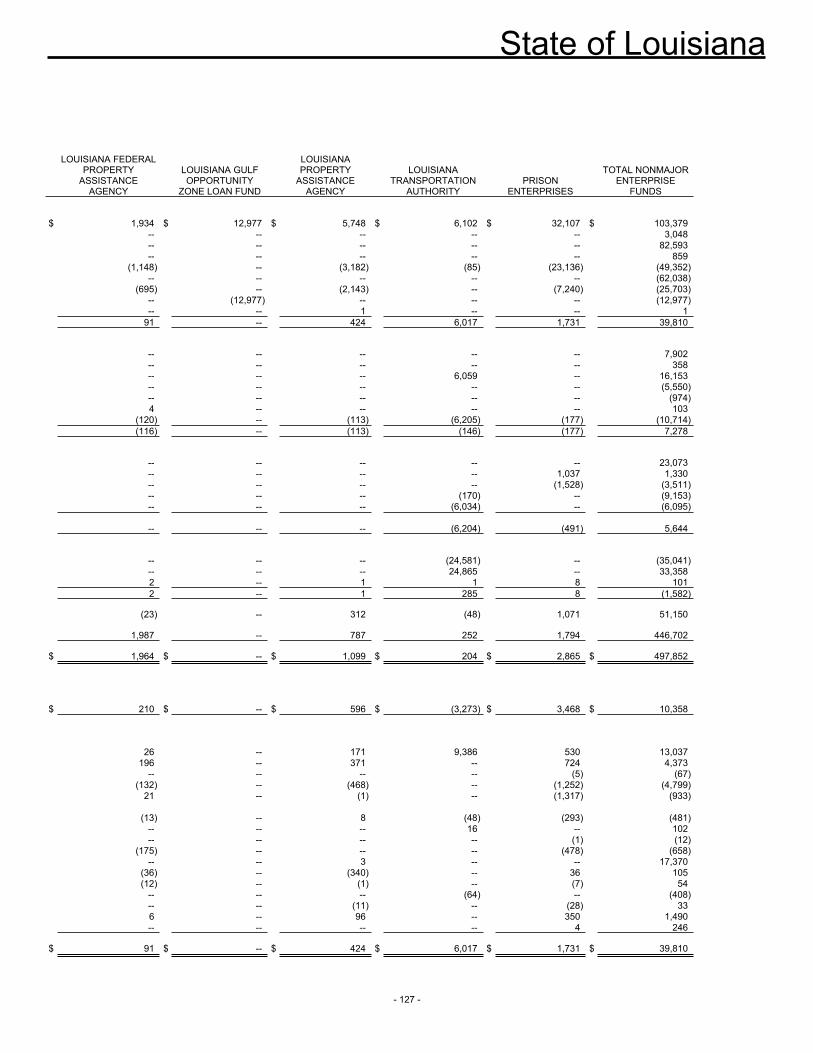
State of Louisiana
- 127 -
LOUISIANA FEDERAL PROPERTY
ASSISTANCE AGENCY
LOUISIANA GULF OPPORTUNITY
ZONE LOAN FUND
LOUISIANA PROPERTY
ASSISTANCE AGENCY
LOUISIANA TRANSPORTATION
AUTHORITY PRISON
ENTERPRISES
TOTAL NONMAJOR ENTERPRISE
FUNDS
$ 1,934 $ 12,977 $ 5,748 $ 6,102 $ 32,107 $ 103,379 -- -- -- -- -- 3,048 -- -- -- -- -- 82,593 -- -- -- -- -- 859 (1,148) -- (3,182) (85) (23,136) (49,352) -- -- -- -- -- (62,038) (695) -- (2,143) -- (7,240) (25,703) -- (12,977) -- -- -- (12,977) -- -- 1 -- -- 1 91 -- 424 6,017 1,731 39,810 -- -- -- -- -- 7,902 -- -- -- -- -- 358 -- -- -- 6,059 -- 16,153 -- -- -- -- -- (5,550) -- -- -- -- -- (974) 4 -- -- -- -- 103 (120) -- (113) (6,205) (177) (10,714) (116) -- (113) (146) (177) 7,278 -- -- -- -- -- 23,073 -- -- -- -- 1,037 1,330 -- -- -- -- (1,528) (3,511) -- -- -- (170) -- (9,153) -- -- -- (6,034) -- (6,095) -- -- -- (6,204) (491) 5,644 -- -- -- (24,581) -- (35,041) -- -- -- 24,865 -- 33,358 2 -- 1 1 8 101 2 -- 1 285 8 (1,582) (23) -- 312 (48) 1,071 51,150 1,987 -- 787 252 1,794 446,702
$ 1,964 $ -- $ 1,099 $ 204 $ 2,865 $ 497,852
$ 210 $ -- $ 596 $ (3,273) $ 3,468 $ 10,358 26 -- 171 9,386 530 13,037 196 -- 371 -- 724 4,373 -- -- -- -- (5) (67) (132) -- (468) -- (1,252) (4,799) 21 -- (1) -- (1,317) (933) (13) -- 8 (48) (293) (481) -- -- -- 16 -- 102 -- -- -- -- (1) (12) (175) -- -- -- (478) (658) -- -- 3 -- -- 17,370 (36) -- (340) -- 36 105 (12) -- (1) -- (7) 54 -- -- -- (64) -- (408) -- -- (11) -- (28) 33 6 -- 96 -- 350 1,490 -- -- -- -- 4 246
$ 91 $ -- $ 424 $ 6,017 $ 1,731 $ 39,810
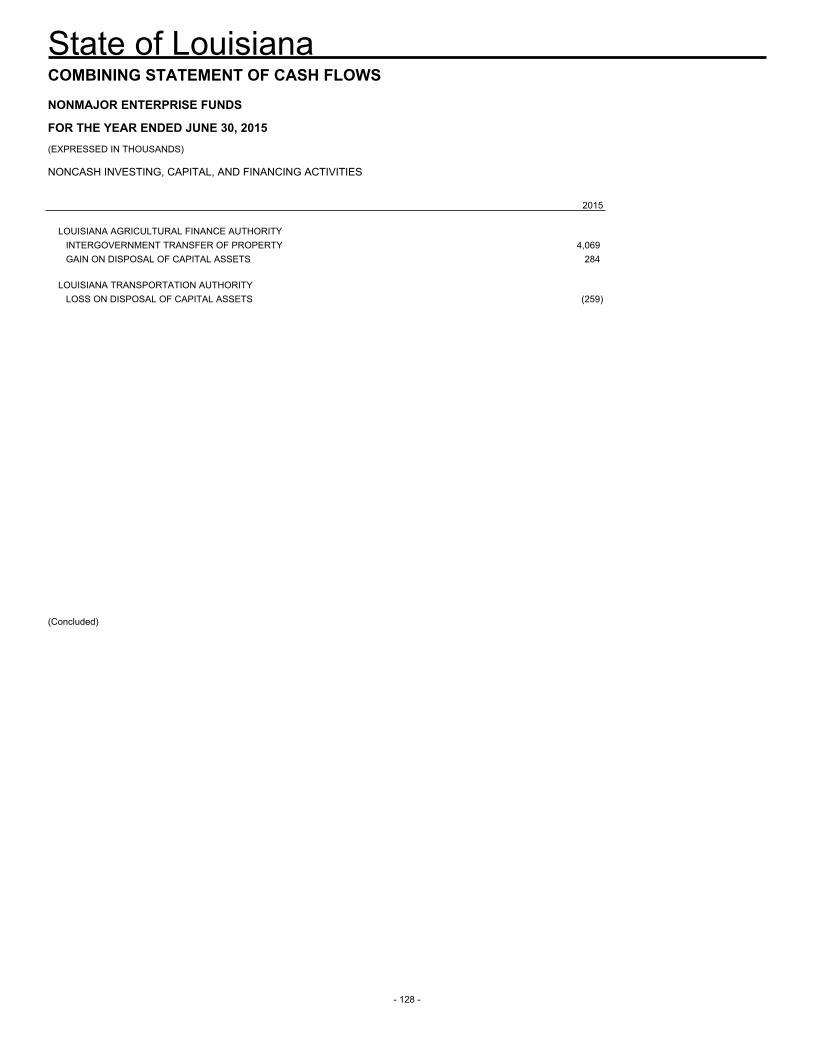
State of Louisiana
- 128 -
COMBINING STATEMENT OF CASH FLOWS
NONMAJOR ENTERPRISE FUNDS
FOR THE YEAR ENDED JUNE 30, 2015(EXPRESSED IN THOUSANDS)
NONCASH INVESTING, CAPITAL, AND FINANCING ACTIVITIES
2015
LOUISIANA AGRICULTURAL FINANCE AUTHORITY INTERGOVERNMENT TRANSFER OF PROPERTY 4,069 GAIN ON DISPOSAL OF CAPITAL ASSETS 284
LOUISIANA TRANSPORTATION AUTHORITY LOSS ON DISPOSAL OF CAPITAL ASSETS (259)
(Concluded)

- 129 -
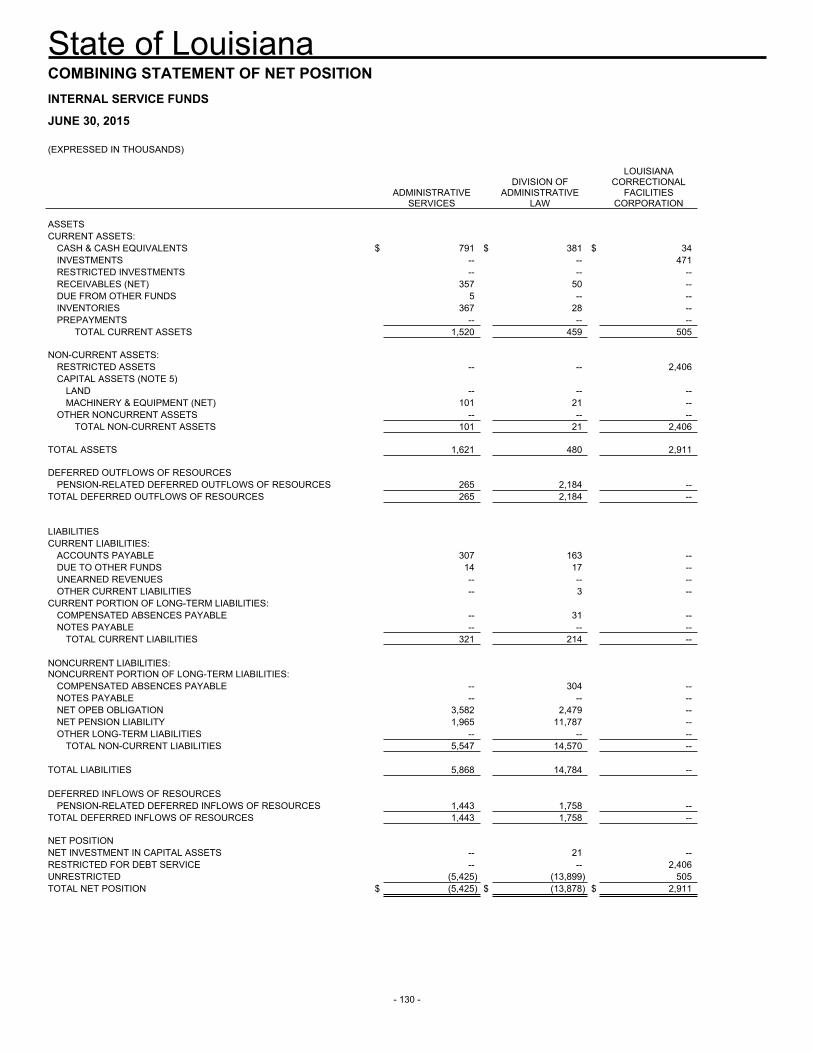
State of Louisiana
- 130 -
COMBINING STATEMENT OF NET POSITION INTERNAL SERVICE FUNDS JUNE 30, 2015 (EXPRESSED IN THOUSANDS)
ADMINISTRATIVE
SERVICES
DIVISION OF ADMINISTRATIVE
LAW
LOUISIANA CORRECTIONAL
FACILITIES CORPORATION
ASSETS CURRENT ASSETS:
CASH & CASH EQUIVALENTS $ 791 $ 381 $ 34INVESTMENTS -- -- 471RESTRICTED INVESTMENTS -- -- --RECEIVABLES (NET) 357 50 --DUE FROM OTHER FUNDS 5 -- --INVENTORIES 367 28 --PREPAYMENTS -- -- --
TOTAL CURRENT ASSETS 1,520 459 505 NON-CURRENT ASSETS:
RESTRICTED ASSETS -- -- 2,406CAPITAL ASSETS (NOTE 5)
LAND -- -- --MACHINERY & EQUIPMENT (NET) 101 21 --
OTHER NONCURRENT ASSETS -- -- --TOTAL NON-CURRENT ASSETS 101 21 2,406
TOTAL ASSETS 1,621 480 2,911 DEFERRED OUTFLOWS OF RESOURCES
PENSION-RELATED DEFERRED OUTFLOWS OF RESOURCES 265 2,184 --TOTAL DEFERRED OUTFLOWS OF RESOURCES 265 2,184 -- LIABILITIES CURRENT LIABILITIES:
ACCOUNTS PAYABLE 307 163 --DUE TO OTHER FUNDS 14 17 --UNEARNED REVENUES -- -- --OTHER CURRENT LIABILITIES -- 3 --
CURRENT PORTION OF LONG-TERM LIABILITIES: COMPENSATED ABSENCES PAYABLE -- 31 --NOTES PAYABLE -- -- --
TOTAL CURRENT LIABILITIES 321 214 --
NONCURRENT LIABILITIES: NONCURRENT PORTION OF LONG-TERM LIABILITIES:
COMPENSATED ABSENCES PAYABLE -- 304 --NOTES PAYABLE -- -- --NET OPEB OBLIGATION 3,582 2,479 --NET PENSION LIABILITY 1,965 11,787 --OTHER LONG-TERM LIABILITIES -- -- --
TOTAL NON-CURRENT LIABILITIES 5,547 14,570 -- TOTAL LIABILITIES 5,868 14,784 -- DEFERRED INFLOWS OF RESOURCES
PENSION-RELATED DEFERRED INFLOWS OF RESOURCES 1,443 1,758 --TOTAL DEFERRED INFLOWS OF RESOURCES 1,443 1,758 -- NET POSITION NET INVESTMENT IN CAPITAL ASSETS -- 21 --RESTRICTED FOR DEBT SERVICE -- -- 2,406UNRESTRICTED (5,425) (13,899) 505TOTAL NET POSITION $ (5,425) $ (13,878) $ 2,911
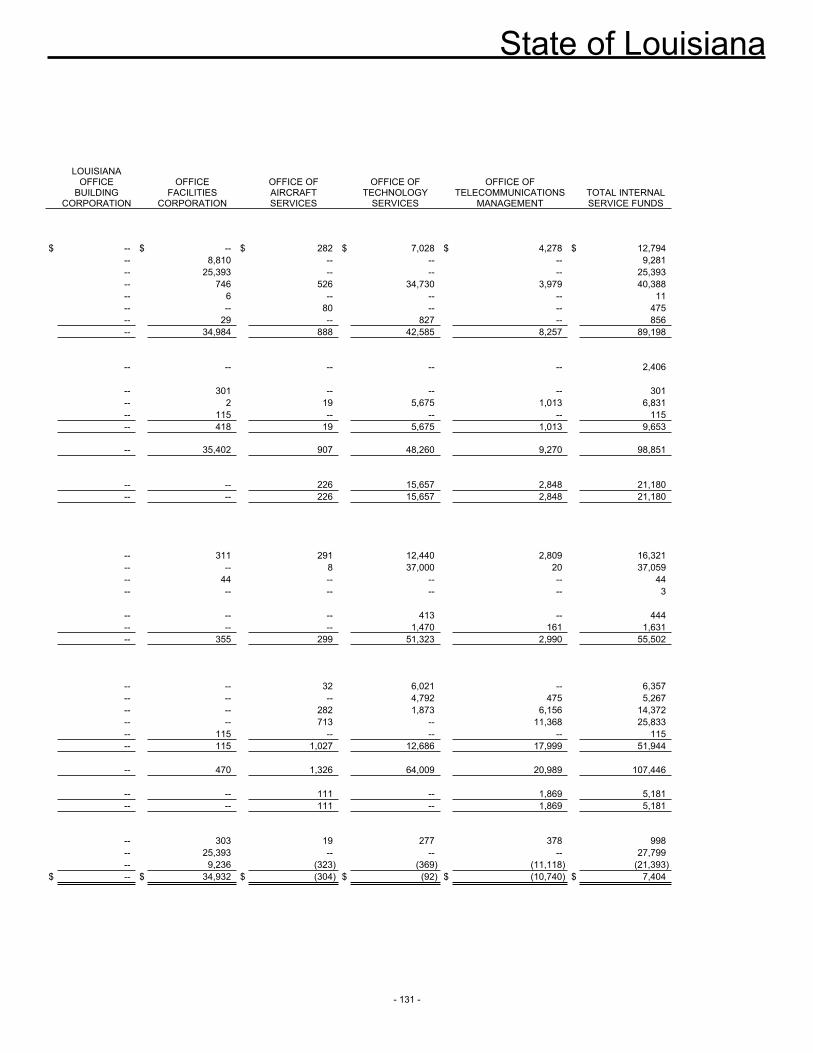
State of Louisiana
- 131 -
LOUISIANA OFFICE
BUILDING CORPORATION
OFFICE FACILITIES
CORPORATION
OFFICE OF AIRCRAFT SERVICES
OFFICE OF TECHNOLOGY
SERVICES
OFFICE OF TELECOMMUNICATIONS
MANAGEMENT TOTAL INTERNAL SERVICE FUNDS
$ -- $ -- $ 282 $ 7,028 $ 4,278 $ 12,794 -- 8,810 -- -- -- 9,281 -- 25,393 -- -- -- 25,393 -- 746 526 34,730 3,979 40,388 -- 6 -- -- -- 11 -- -- 80 -- -- 475 -- 29 -- 827 -- 856 -- 34,984 888 42,585 8,257 89,198 -- -- -- -- -- 2,406 -- 301 -- -- -- 301 -- 2 19 5,675 1,013 6,831 -- 115 -- -- -- 115 -- 418 19 5,675 1,013 9,653 -- 35,402 907 48,260 9,270 98,851 -- -- 226 15,657 2,848 21,180 -- -- 226 15,657 2,848 21,180 -- 311 291 12,440 2,809 16,321 -- -- 8 37,000 20 37,059 -- 44 -- -- -- 44 -- -- -- -- -- 3 -- -- -- 413 -- 444 -- -- -- 1,470 161 1,631 -- 355 299 51,323 2,990 55,502 -- -- 32 6,021 -- 6,357 -- -- -- 4,792 475 5,267 -- -- 282 1,873 6,156 14,372 -- -- 713 -- 11,368 25,833 -- 115 -- -- -- 115 -- 115 1,027 12,686 17,999 51,944
-- 470 1,326 64,009 20,989 107,446 -- -- 111 -- 1,869 5,181 -- -- 111 -- 1,869 5,181 -- 303 19 277 378 998 -- 25,393 -- -- -- 27,799 -- 9,236 (323) (369) (11,118) (21,393)
$ -- $ 34,932 $ (304) $ (92) $ (10,740) $ 7,404
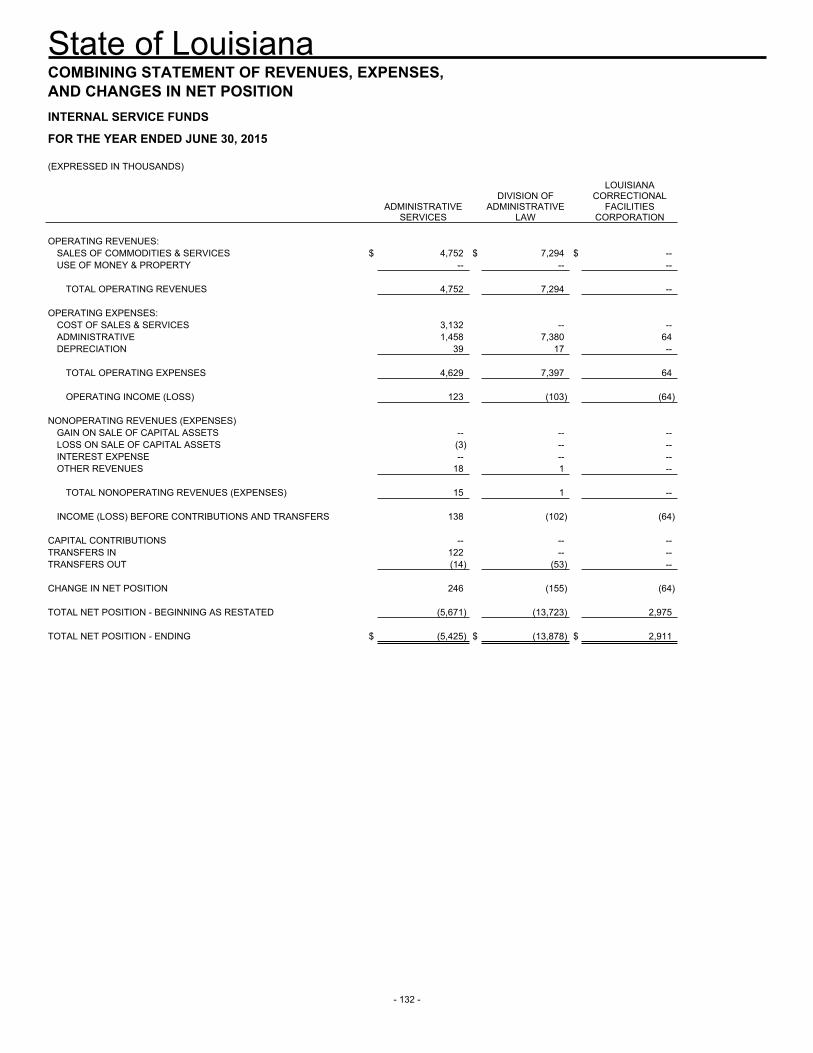
State of Louisiana
- 132 -
COMBINING STATEMENT OF REVENUES, EXPENSES, AND CHANGES IN NET POSITION INTERNAL SERVICE FUNDS FOR THE YEAR ENDED JUNE 30, 2015 (EXPRESSED IN THOUSANDS)
ADMINISTRATIVE
SERVICES
DIVISION OF ADMINISTRATIVE
LAW
LOUISIANA CORRECTIONAL
FACILITIES CORPORATION
OPERATING REVENUES:
SALES OF COMMODITIES & SERVICES $ 4,752 $ 7,294 $ --USE OF MONEY & PROPERTY -- -- --
TOTAL OPERATING REVENUES 4,752 7,294 -- OPERATING EXPENSES:
COST OF SALES & SERVICES 3,132 -- --ADMINISTRATIVE 1,458 7,380 64DEPRECIATION 39 17 --
TOTAL OPERATING EXPENSES 4,629 7,397 64
OPERATING INCOME (LOSS) 123 (103) (64) NONOPERATING REVENUES (EXPENSES)
GAIN ON SALE OF CAPITAL ASSETS -- -- --LOSS ON SALE OF CAPITAL ASSETS (3) -- --INTEREST EXPENSE -- -- --OTHER REVENUES 18 1 --
TOTAL NONOPERATING REVENUES (EXPENSES) 15 1 --
INCOME (LOSS) BEFORE CONTRIBUTIONS AND TRANSFERS 138 (102) (64)
CAPITAL CONTRIBUTIONS -- -- --TRANSFERS IN 122 -- --TRANSFERS OUT (14) (53) -- CHANGE IN NET POSITION 246 (155) (64) TOTAL NET POSITION - BEGINNING AS RESTATED (5,671) (13,723) 2,975 TOTAL NET POSITION - ENDING $ (5,425) $ (13,878) $ 2,911
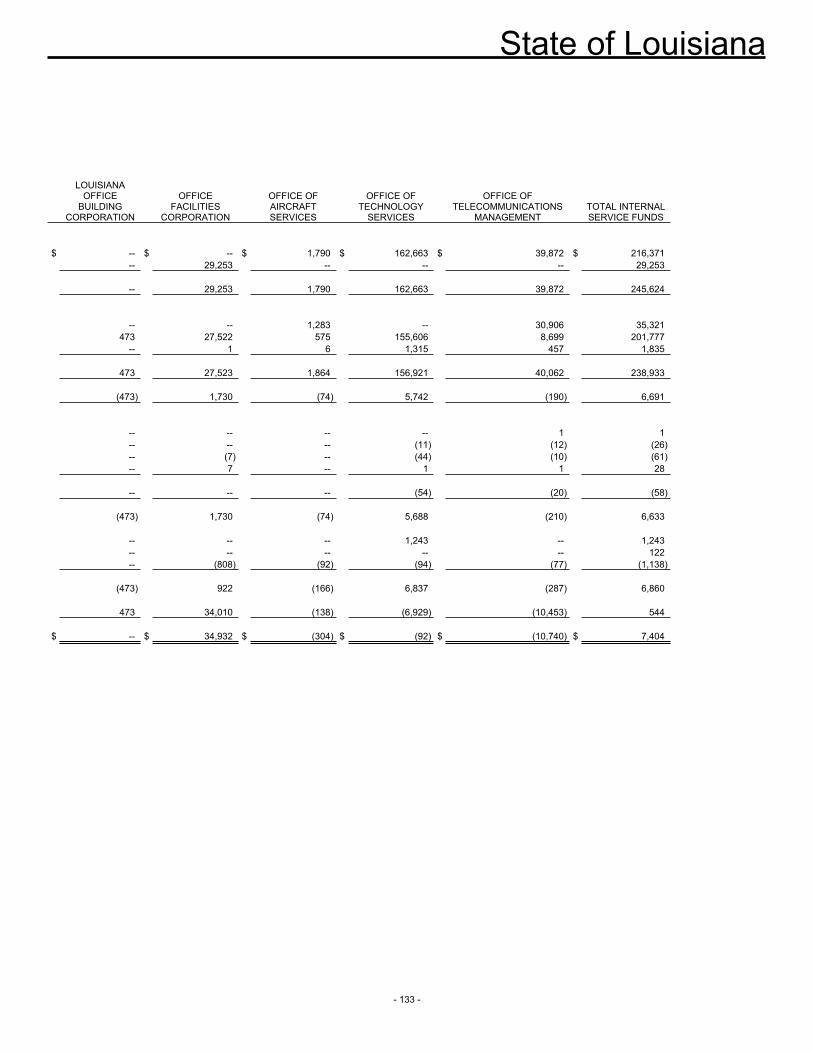
State of Louisiana
- 133 -
LOUISIANA OFFICE
BUILDING CORPORATION
OFFICE FACILITIES
CORPORATION
OFFICE OF AIRCRAFT SERVICES
OFFICE OF TECHNOLOGY
SERVICES
OFFICE OF TELECOMMUNICATIONS
MANAGEMENT TOTAL INTERNAL SERVICE FUNDS
$ -- $ -- $ 1,790 $ 162,663 $ 39,872 $ 216,371 -- 29,253 -- -- -- 29,253 -- 29,253 1,790 162,663 39,872 245,624 -- -- 1,283 -- 30,906 35,321 473 27,522 575 155,606 8,699 201,777 -- 1 6 1,315 457 1,835 473 27,523 1,864 156,921 40,062 238,933 (473) 1,730 (74) 5,742 (190) 6,691 -- -- -- -- 1 1 -- -- -- (11) (12) (26) -- (7) -- (44) (10) (61) -- 7 -- 1 1 28 -- -- -- (54) (20) (58) (473) 1,730 (74) 5,688 (210) 6,633 -- -- -- 1,243 -- 1,243 -- -- -- -- -- 122 -- (808) (92) (94) (77) (1,138) (473) 922 (166) 6,837 (287) 6,860 473 34,010 (138) (6,929) (10,453) 544
$ -- $ 34,932 $ (304) $ (92) $ (10,740) $ 7,404
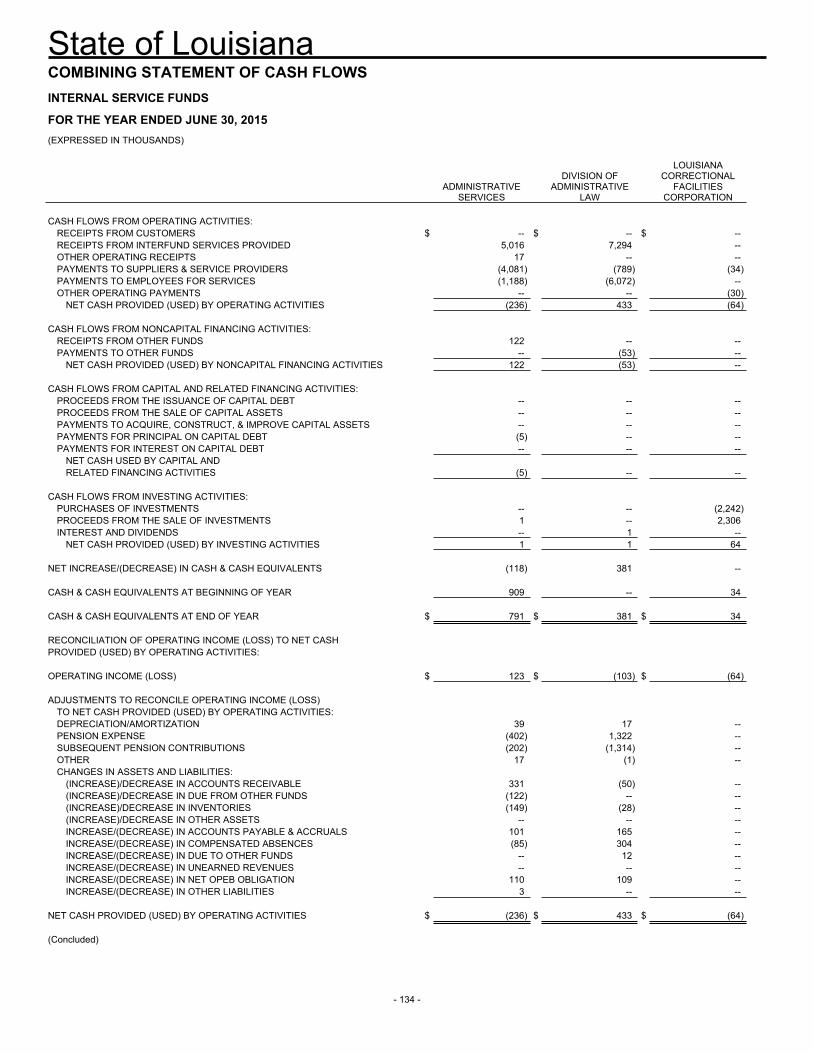
State of Louisiana
- 134 -
COMBINING STATEMENT OF CASH FLOWS INTERNAL SERVICE FUNDS FOR THE YEAR ENDED JUNE 30, 2015 (EXPRESSED IN THOUSANDS)
ADMINISTRATIVE
SERVICES
DIVISION OF ADMINISTRATIVE
LAW
LOUISIANA CORRECTIONAL
FACILITIES CORPORATION
CASH FLOWS FROM OPERATING ACTIVITIES:
RECEIPTS FROM CUSTOMERS $ -- $ -- $ --RECEIPTS FROM INTERFUND SERVICES PROVIDED 5,016 7,294 --OTHER OPERATING RECEIPTS 17 -- --PAYMENTS TO SUPPLIERS & SERVICE PROVIDERS (4,081) (789) (34)PAYMENTS TO EMPLOYEES FOR SERVICES (1,188) (6,072) --OTHER OPERATING PAYMENTS -- -- (30)
NET CASH PROVIDED (USED) BY OPERATING ACTIVITIES (236) 433 (64) CASH FLOWS FROM NONCAPITAL FINANCING ACTIVITIES:
RECEIPTS FROM OTHER FUNDS 122 -- --PAYMENTS TO OTHER FUNDS -- (53) --
NET CASH PROVIDED (USED) BY NONCAPITAL FINANCING ACTIVITIES 122 (53) -- CASH FLOWS FROM CAPITAL AND RELATED FINANCING ACTIVITIES:
PROCEEDS FROM THE ISSUANCE OF CAPITAL DEBT -- -- --PROCEEDS FROM THE SALE OF CAPITAL ASSETS -- -- --PAYMENTS TO ACQUIRE, CONSTRUCT, & IMPROVE CAPITAL ASSETS -- -- --PAYMENTS FOR PRINCIPAL ON CAPITAL DEBT (5) -- --PAYMENTS FOR INTEREST ON CAPITAL DEBT -- -- --
NET CASH USED BY CAPITAL AND RELATED FINANCING ACTIVITIES (5) -- --
CASH FLOWS FROM INVESTING ACTIVITIES:
PURCHASES OF INVESTMENTS -- -- (2,242)PROCEEDS FROM THE SALE OF INVESTMENTS 1 -- 2,306INTEREST AND DIVIDENDS -- 1 --
NET CASH PROVIDED (USED) BY INVESTING ACTIVITIES 1 1 64 NET INCREASE/(DECREASE) IN CASH & CASH EQUIVALENTS (118) 381 -- CASH & CASH EQUIVALENTS AT BEGINNING OF YEAR 909 -- 34 CASH & CASH EQUIVALENTS AT END OF YEAR $ 791 $ 381 $ 34 RECONCILIATION OF OPERATING INCOME (LOSS) TO NET CASH PROVIDED (USED) BY OPERATING ACTIVITIES: OPERATING INCOME (LOSS) $ 123 $ (103) $ (64) ADJUSTMENTS TO RECONCILE OPERATING INCOME (LOSS)
TO NET CASH PROVIDED (USED) BY OPERATING ACTIVITIES: DEPRECIATION/AMORTIZATION 39 17 --PENSION EXPENSE (402) 1,322 --SUBSEQUENT PENSION CONTRIBUTIONS (202) (1,314) --OTHER 17 (1) --CHANGES IN ASSETS AND LIABILITIES:
(INCREASE)/DECREASE IN ACCOUNTS RECEIVABLE 331 (50) --(INCREASE)/DECREASE IN DUE FROM OTHER FUNDS (122) -- --(INCREASE)/DECREASE IN INVENTORIES (149) (28) --(INCREASE)/DECREASE IN OTHER ASSETS -- -- --INCREASE/(DECREASE) IN ACCOUNTS PAYABLE & ACCRUALS 101 165 --INCREASE/(DECREASE) IN COMPENSATED ABSENCES (85) 304 --INCREASE/(DECREASE) IN DUE TO OTHER FUNDS -- 12 --INCREASE/(DECREASE) IN UNEARNED REVENUES -- -- --INCREASE/(DECREASE) IN NET OPEB OBLIGATION 110 109 --INCREASE/(DECREASE) IN OTHER LIABILITIES 3 -- --
NET CASH PROVIDED (USED) BY OPERATING ACTIVITIES $ (236) $ 433 $ (64) (Concluded)
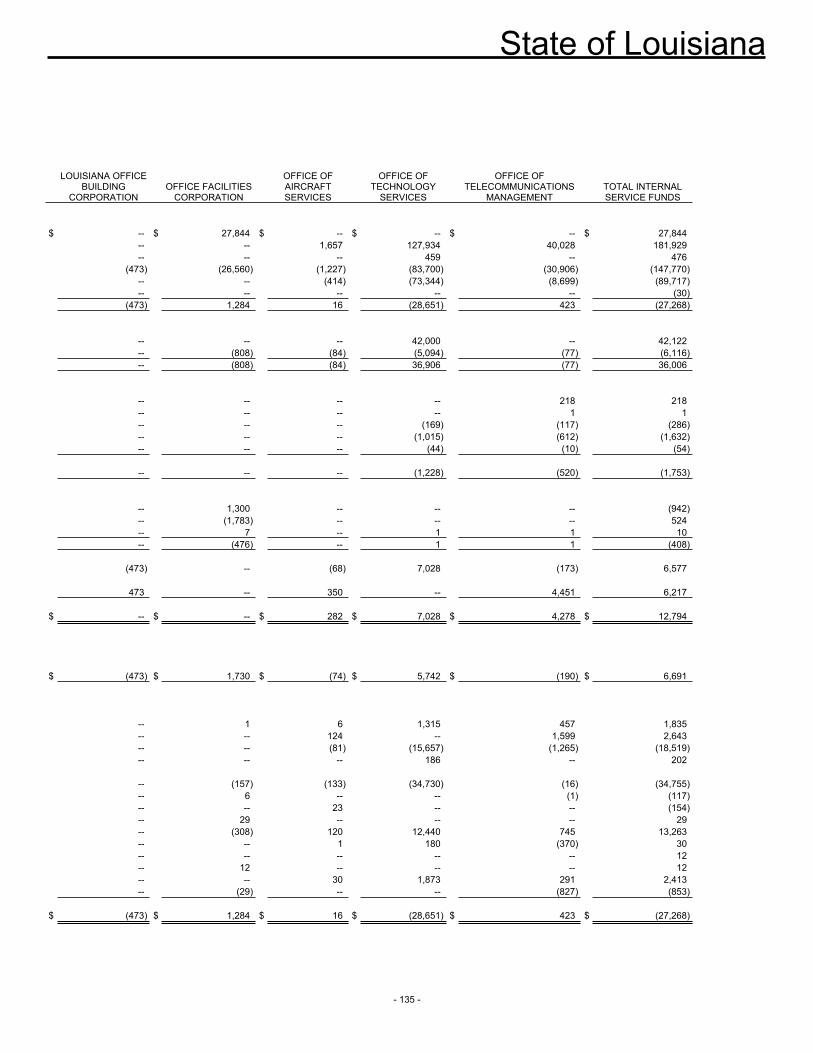
State of Louisiana
- 135 -
LOUISIANA OFFICE BUILDING
CORPORATION OFFICE FACILITIES
CORPORATION
OFFICE OF AIRCRAFT SERVICES
OFFICE OF TECHNOLOGY
SERVICES
OFFICE OF TELECOMMUNICATIONS
MANAGEMENT TOTAL INTERNAL SERVICE FUNDS
$ -- $ 27,844 $ -- $ -- $ -- $ 27,844 -- -- 1,657 127,934 40,028 181,929 -- -- -- 459 -- 476 (473) (26,560) (1,227) (83,700) (30,906) (147,770) -- -- (414) (73,344) (8,699) (89,717) -- -- -- -- -- (30) (473) 1,284 16 (28,651) 423 (27,268) -- -- -- 42,000 -- 42,122 -- (808) (84) (5,094) (77) (6,116) -- (808) (84) 36,906 (77) 36,006 -- -- -- -- 218 218 -- -- -- -- 1 1 -- -- -- (169) (117) (286) -- -- -- (1,015) (612) (1,632) -- -- -- (44) (10) (54) -- -- -- (1,228) (520) (1,753) -- 1,300 -- -- -- (942) -- (1,783) -- -- -- 524 -- 7 -- 1 1 10 -- (476) -- 1 1 (408) (473) -- (68) 7,028 (173) 6,577 473 -- 350 -- 4,451 6,217
$ -- $ -- $ 282 $ 7,028 $ 4,278 $ 12,794
$ (473) $ 1,730 $ (74) $ 5,742 $ (190) $ 6,691 -- 1 6 1,315 457 1,835 -- -- 124 -- 1,599 2,643 -- -- (81) (15,657) (1,265) (18,519) -- -- -- 186 -- 202 -- (157) (133) (34,730) (16) (34,755) -- 6 -- -- (1) (117) -- -- 23 -- -- (154) -- 29 -- -- -- 29 -- (308) 120 12,440 745 13,263 -- -- 1 180 (370) 30 -- -- -- -- -- 12 -- 12 -- -- -- 12 -- -- 30 1,873 291 2,413 -- (29) -- -- (827) (853)
$ (473) $ 1,284 $ 16 $ (28,651) $ 423 $ (27,268)
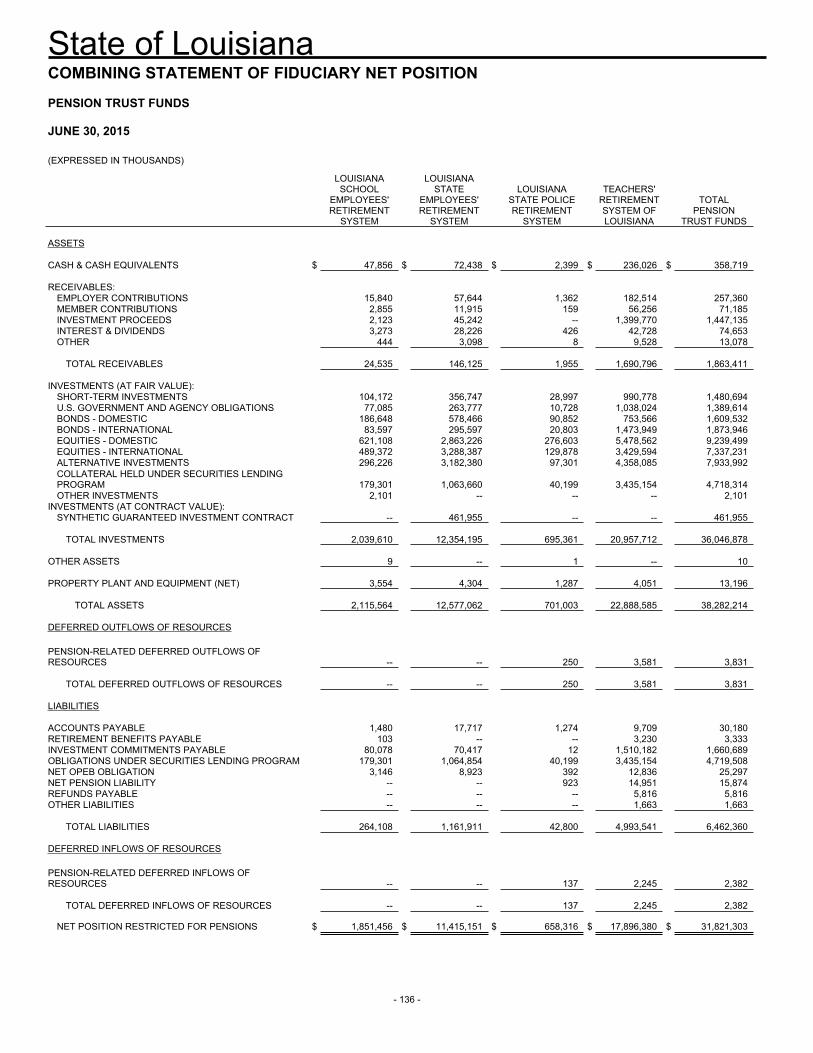
State of Louisiana
- 136 -
COMBINING STATEMENT OF FIDUCIARY NET POSITION
PENSION TRUST FUNDS
JUNE 30, 2015
(EXPRESSED IN THOUSANDS)
LOUISIANA SCHOOL
EMPLOYEES' RETIREMENT
SYSTEM
LOUISIANA STATE
EMPLOYEES' RETIREMENT
SYSTEM
LOUISIANA STATE POLICE RETIREMENT
SYSTEM
TEACHERS' RETIREMENT SYSTEM OF LOUISIANA
TOTAL PENSION
TRUST FUNDS ASSETS CASH & CASH EQUIVALENTS $ 47,856 $ 72,438 $ 2,399 $ 236,026 $ 358,719 RECEIVABLES:
EMPLOYER CONTRIBUTIONS 15,840 57,644 1,362 182,514 257,360MEMBER CONTRIBUTIONS 2,855 11,915 159 56,256 71,185INVESTMENT PROCEEDS 2,123 45,242 -- 1,399,770 1,447,135INTEREST & DIVIDENDS 3,273 28,226 426 42,728 74,653OTHER 444 3,098 8 9,528 13,078
TOTAL RECEIVABLES 24,535 146,125 1,955 1,690,796 1,863,411
INVESTMENTS (AT FAIR VALUE):
SHORT-TERM INVESTMENTS 104,172 356,747 28,997 990,778 1,480,694U.S. GOVERNMENT AND AGENCY OBLIGATIONS 77,085 263,777 10,728 1,038,024 1,389,614BONDS - DOMESTIC 186,648 578,466 90,852 753,566 1,609,532BONDS - INTERNATIONAL 83,597 295,597 20,803 1,473,949 1,873,946EQUITIES - DOMESTIC 621,108 2,863,226 276,603 5,478,562 9,239,499EQUITIES - INTERNATIONAL 489,372 3,288,387 129,878 3,429,594 7,337,231ALTERNATIVE INVESTMENTS 296,226 3,182,380 97,301 4,358,085 7,933,992COLLATERAL HELD UNDER SECURITIES LENDING PROGRAM 179,301 1,063,660 40,199 3,435,154 4,718,314OTHER INVESTMENTS 2,101 -- -- -- 2,101
INVESTMENTS (AT CONTRACT VALUE): SYNTHETIC GUARANTEED INVESTMENT CONTRACT -- 461,955 -- -- 461,955
TOTAL INVESTMENTS 2,039,610 12,354,195 695,361 20,957,712 36,046,878
OTHER ASSETS 9 -- 1 -- 10 PROPERTY PLANT AND EQUIPMENT (NET) 3,554 4,304 1,287 4,051 13,196
TOTAL ASSETS 2,115,564 12,577,062 701,003 22,888,585 38,282,214 DEFERRED OUTFLOWS OF RESOURCES PENSION-RELATED DEFERRED OUTFLOWS OF RESOURCES -- -- 250 3,581 3,831
TOTAL DEFERRED OUTFLOWS OF RESOURCES -- -- 250 3,581 3,831 LIABILITIES ACCOUNTS PAYABLE 1,480 17,717 1,274 9,709 30,180RETIREMENT BENEFITS PAYABLE 103 -- -- 3,230 3,333INVESTMENT COMMITMENTS PAYABLE 80,078 70,417 12 1,510,182 1,660,689OBLIGATIONS UNDER SECURITIES LENDING PROGRAM 179,301 1,064,854 40,199 3,435,154 4,719,508NET OPEB OBLIGATION 3,146 8,923 392 12,836 25,297NET PENSION LIABILITY -- -- 923 14,951 15,874REFUNDS PAYABLE -- -- -- 5,816 5,816OTHER LIABILITIES -- -- -- 1,663 1,663
TOTAL LIABILITIES 264,108 1,161,911 42,800 4,993,541 6,462,360 DEFERRED INFLOWS OF RESOURCES PENSION-RELATED DEFERRED INFLOWS OF RESOURCES -- -- 137 2,245 2,382
TOTAL DEFERRED INFLOWS OF RESOURCES -- -- 137 2,245 2,382 NET POSITION RESTRICTED FOR PENSIONS $ 1,851,456 $ 11,415,151 $ 658,316 $ 17,896,380 $ 31,821,303
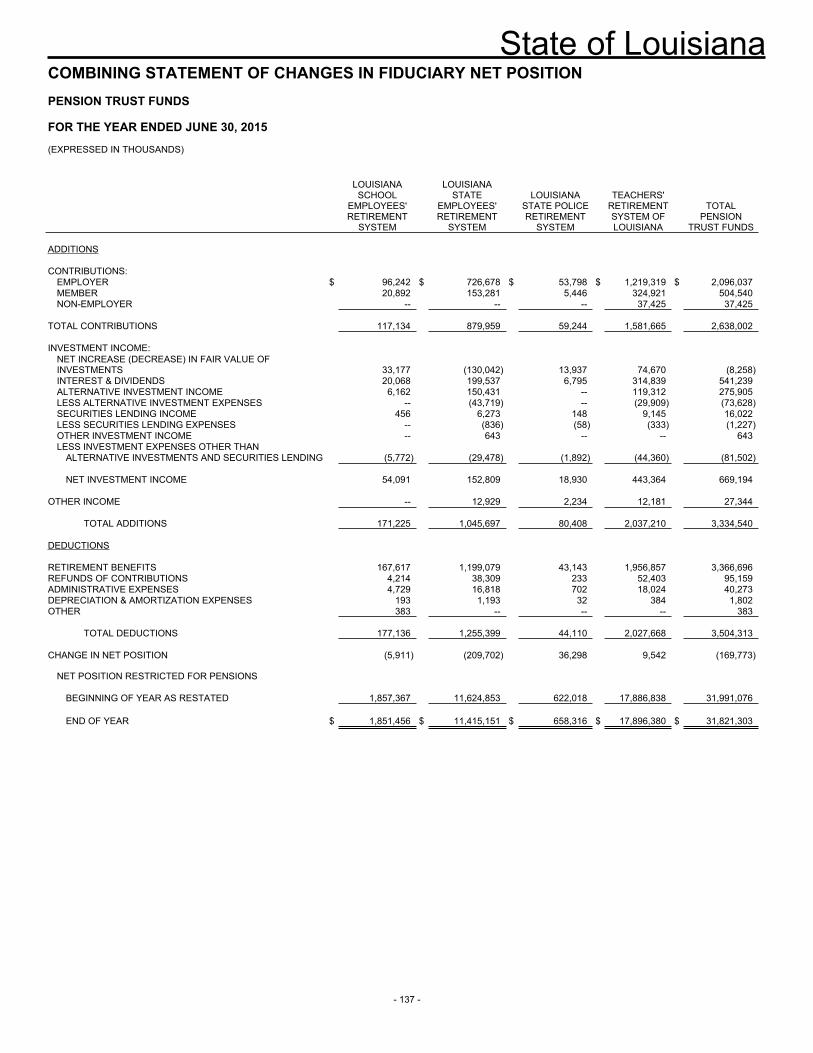
State of Louisiana
- 137 -
COMBINING STATEMENT OF CHANGES IN FIDUCIARY NET POSITION PENSION TRUST FUNDS FOR THE YEAR ENDED JUNE 30, 2015 (EXPRESSED IN THOUSANDS)
LOUISIANA SCHOOL
EMPLOYEES' RETIREMENT
SYSTEM
LOUISIANA STATE
EMPLOYEES' RETIREMENT
SYSTEM
LOUISIANA STATE POLICE RETIREMENT
SYSTEM
TEACHERS' RETIREMENT SYSTEM OF LOUISIANA
TOTAL PENSION
TRUST FUNDS ADDITIONS CONTRIBUTIONS:
EMPLOYER $ 96,242 $ 726,678 $ 53,798 $ 1,219,319 $ 2,096,037MEMBER 20,892 153,281 5,446 324,921 504,540NON-EMPLOYER -- -- -- 37,425 37,425
TOTAL CONTRIBUTIONS 117,134 879,959 59,244 1,581,665 2,638,002 INVESTMENT INCOME:
NET INCREASE (DECREASE) IN FAIR VALUE OF INVESTMENTS 33,177 (130,042) 13,937 74,670 (8,258)INTEREST & DIVIDENDS 20,068 199,537 6,795 314,839 541,239ALTERNATIVE INVESTMENT INCOME 6,162 150,431 -- 119,312 275,905LESS ALTERNATIVE INVESTMENT EXPENSES -- (43,719) -- (29,909) (73,628)SECURITIES LENDING INCOME 456 6,273 148 9,145 16,022LESS SECURITIES LENDING EXPENSES -- (836) (58) (333) (1,227)OTHER INVESTMENT INCOME -- 643 -- -- 643LESS INVESTMENT EXPENSES OTHER THAN
ALTERNATIVE INVESTMENTS AND SECURITIES LENDING (5,772) (29,478) (1,892) (44,360) (81,502)
NET INVESTMENT INCOME 54,091 152,809 18,930 443,364 669,194 OTHER INCOME -- 12,929 2,234 12,181 27,344
TOTAL ADDITIONS 171,225 1,045,697 80,408 2,037,210 3,334,540 DEDUCTIONS RETIREMENT BENEFITS 167,617 1,199,079 43,143 1,956,857 3,366,696REFUNDS OF CONTRIBUTIONS 4,214 38,309 233 52,403 95,159ADMINISTRATIVE EXPENSES 4,729 16,818 702 18,024 40,273DEPRECIATION & AMORTIZATION EXPENSES 193 1,193 32 384 1,802OTHER 383 -- -- -- 383
TOTAL DEDUCTIONS 177,136 1,255,399 44,110 2,027,668 3,504,313 CHANGE IN NET POSITION (5,911) (209,702) 36,298 9,542 (169,773) NET POSITION RESTRICTED FOR PENSIONS
BEGINNING OF YEAR AS RESTATED 1,857,367 11,624,853 622,018 17,886,838 31,991,076
END OF YEAR $ 1,851,456 $ 11,415,151 $ 658,316 $ 17,896,380 $ 31,821,303
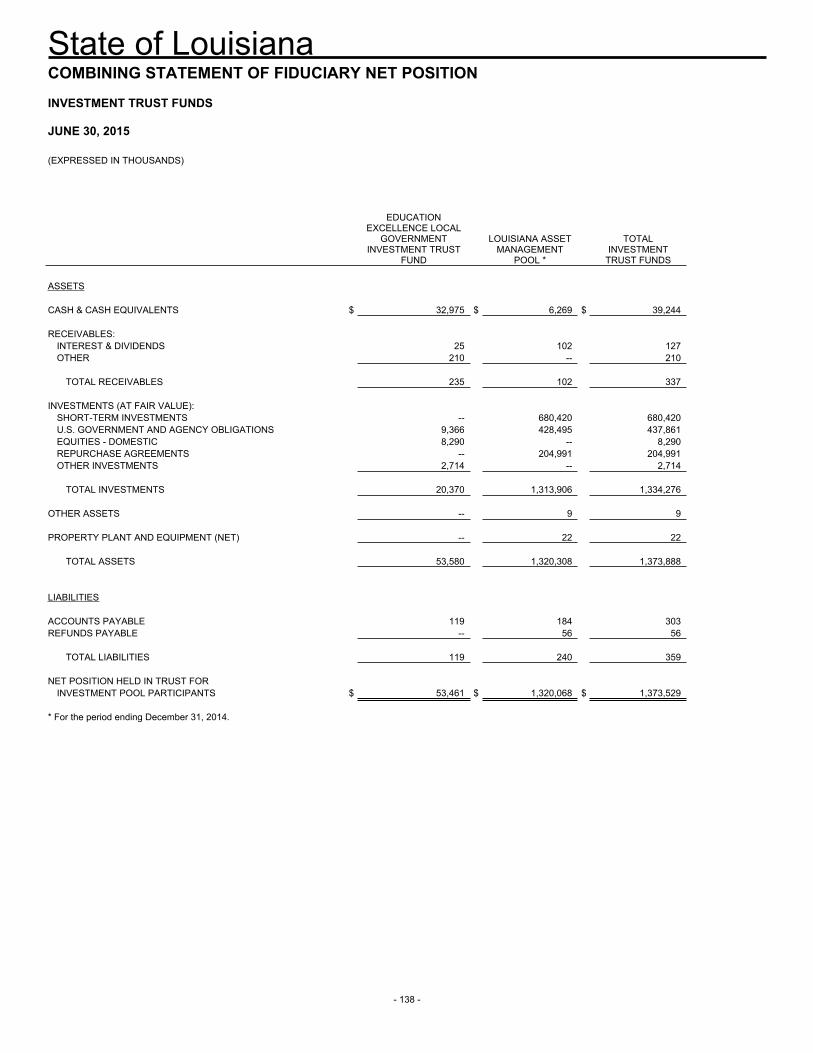
State of Louisiana
- 138 -
COMBINING STATEMENT OF FIDUCIARY NET POSITION INVESTMENT TRUST FUNDS JUNE 30, 2015 (EXPRESSED IN THOUSANDS)
EDUCATION EXCELLENCE LOCAL
GOVERNMENT INVESTMENT TRUST
FUND
LOUISIANA ASSET MANAGEMENT
POOL *
TOTAL INVESTMENT
TRUST FUNDS ASSETS CASH & CASH EQUIVALENTS $ 32,975 $ 6,269 $ 39,244 RECEIVABLES:
INTEREST & DIVIDENDS 25 102 127OTHER 210 -- 210
TOTAL RECEIVABLES 235 102 337
INVESTMENTS (AT FAIR VALUE):
SHORT-TERM INVESTMENTS -- 680,420 680,420U.S. GOVERNMENT AND AGENCY OBLIGATIONS 9,366 428,495 437,861EQUITIES - DOMESTIC 8,290 -- 8,290REPURCHASE AGREEMENTS -- 204,991 204,991OTHER INVESTMENTS 2,714 -- 2,714
TOTAL INVESTMENTS 20,370 1,313,906 1,334,276
OTHER ASSETS -- 9 9 PROPERTY PLANT AND EQUIPMENT (NET) -- 22 22
TOTAL ASSETS 53,580 1,320,308 1,373,888 LIABILITIES ACCOUNTS PAYABLE 119 184 303REFUNDS PAYABLE -- 56 56
TOTAL LIABILITIES 119 240 359 NET POSITION HELD IN TRUST FOR
INVESTMENT POOL PARTICIPANTS $ 53,461 $ 1,320,068 $ 1,373,529 * For the period ending December 31, 2014.
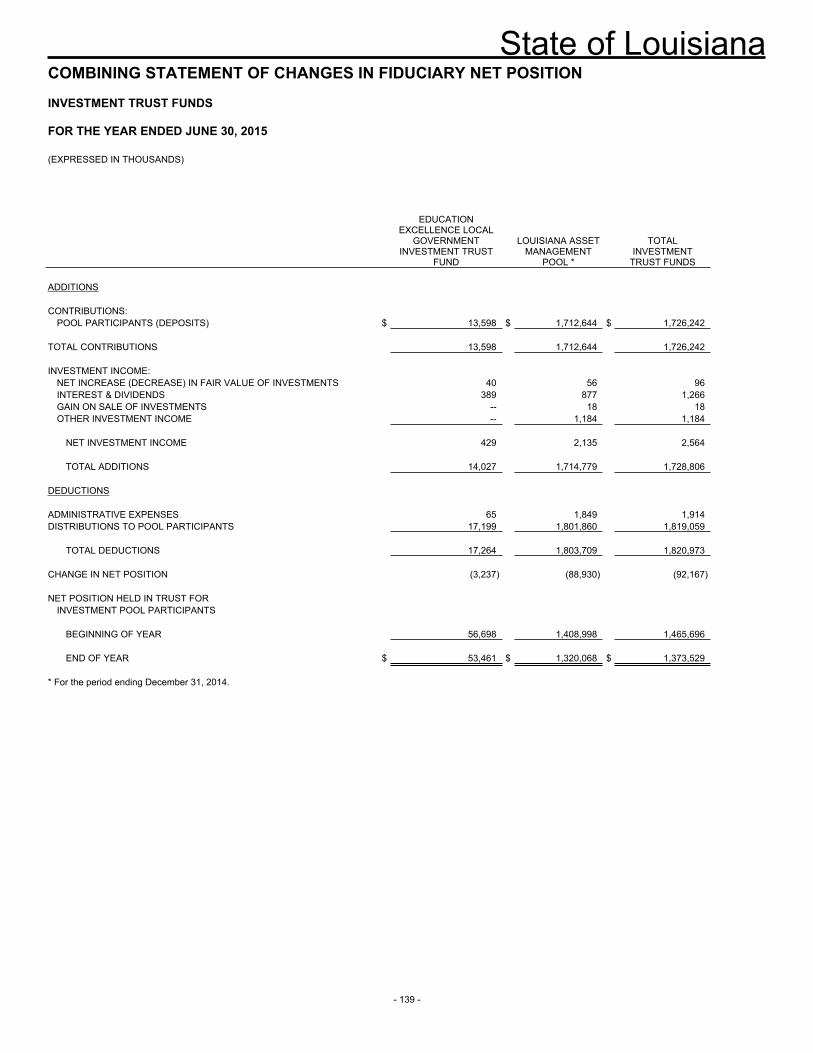
State of Louisiana
- 139 -
COMBINING STATEMENT OF CHANGES IN FIDUCIARY NET POSITION INVESTMENT TRUST FUNDS FOR THE YEAR ENDED JUNE 30, 2015 (EXPRESSED IN THOUSANDS)
EDUCATION EXCELLENCE LOCAL
GOVERNMENT INVESTMENT TRUST
FUND
LOUISIANA ASSET MANAGEMENT
POOL *
TOTAL INVESTMENT
TRUST FUNDS ADDITIONS CONTRIBUTIONS:
POOL PARTICIPANTS (DEPOSITS) $ 13,598 $ 1,712,644 $ 1,726,242 TOTAL CONTRIBUTIONS 13,598 1,712,644 1,726,242 INVESTMENT INCOME:
NET INCREASE (DECREASE) IN FAIR VALUE OF INVESTMENTS 40 56 96INTEREST & DIVIDENDS 389 877 1,266GAIN ON SALE OF INVESTMENTS -- 18 18OTHER INVESTMENT INCOME -- 1,184 1,184
NET INVESTMENT INCOME 429 2,135 2,564
TOTAL ADDITIONS 14,027 1,714,779 1,728,806
DEDUCTIONS ADMINISTRATIVE EXPENSES 65 1,849 1,914DISTRIBUTIONS TO POOL PARTICIPANTS 17,199 1,801,860 1,819,059
TOTAL DEDUCTIONS 17,264 1,803,709 1,820,973 CHANGE IN NET POSITION (3,237) (88,930) (92,167) NET POSITION HELD IN TRUST FOR
INVESTMENT POOL PARTICIPANTS
BEGINNING OF YEAR 56,698 1,408,998 1,465,696
END OF YEAR $ 53,461 $ 1,320,068 $ 1,373,529 * For the period ending December 31, 2014.
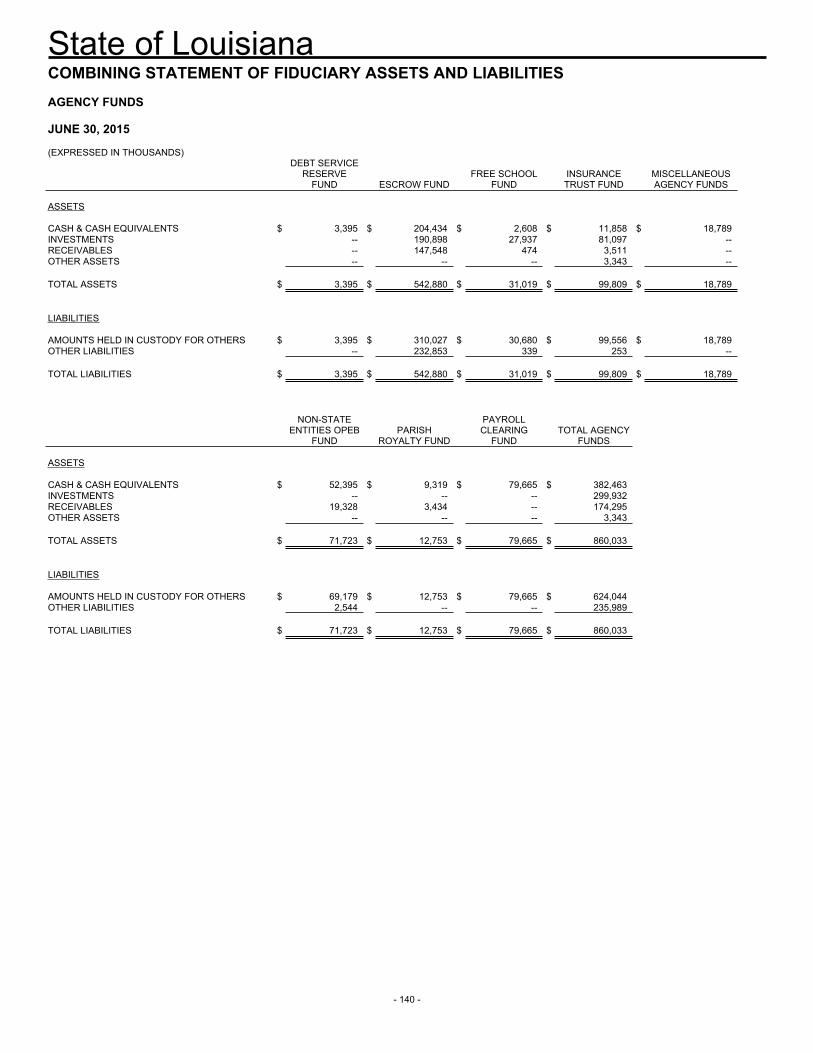
State of Louisiana
- 140 -
COMBINING STATEMENT OF FIDUCIARY ASSETS AND LIABILITIES AGENCY FUNDS JUNE 30, 2015 (EXPRESSED IN THOUSANDS)
DEBT SERVICE RESERVE
FUND ESCROW FUND FREE SCHOOL
FUND INSURANCE TRUST FUND
MISCELLANEOUS AGENCY FUNDS
ASSETS CASH & CASH EQUIVALENTS $ 3,395 $ 204,434 $ 2,608 $ 11,858 $ 18,789INVESTMENTS -- 190,898 27,937 81,097 --RECEIVABLES -- 147,548 474 3,511 --OTHER ASSETS -- -- -- 3,343 -- TOTAL ASSETS $ 3,395 $ 542,880 $ 31,019 $ 99,809 $ 18,789 LIABILITIES AMOUNTS HELD IN CUSTODY FOR OTHERS $ 3,395 $ 310,027 $ 30,680 $ 99,556 $ 18,789OTHER LIABILITIES -- 232,853 339 253 -- TOTAL LIABILITIES $ 3,395 $ 542,880 $ 31,019 $ 99,809 $ 18,789
NON-STATE ENTITIES OPEB
FUND PARISH
ROYALTY FUND
PAYROLL CLEARING
FUND TOTAL AGENCY
FUNDS ASSETS CASH & CASH EQUIVALENTS $ 52,395 $ 9,319 $ 79,665 $ 382,463 INVESTMENTS -- -- -- 299,932 RECEIVABLES 19,328 3,434 -- 174,295 OTHER ASSETS -- -- -- 3,343 TOTAL ASSETS $ 71,723 $ 12,753 $ 79,665 $ 860,033 LIABILITIES AMOUNTS HELD IN CUSTODY FOR OTHERS $ 69,179 $ 12,753 $ 79,665 $ 624,044 OTHER LIABILITIES 2,544 -- -- 235,989 TOTAL LIABILITIES $ 71,723 $ 12,753 $ 79,665 $ 860,033
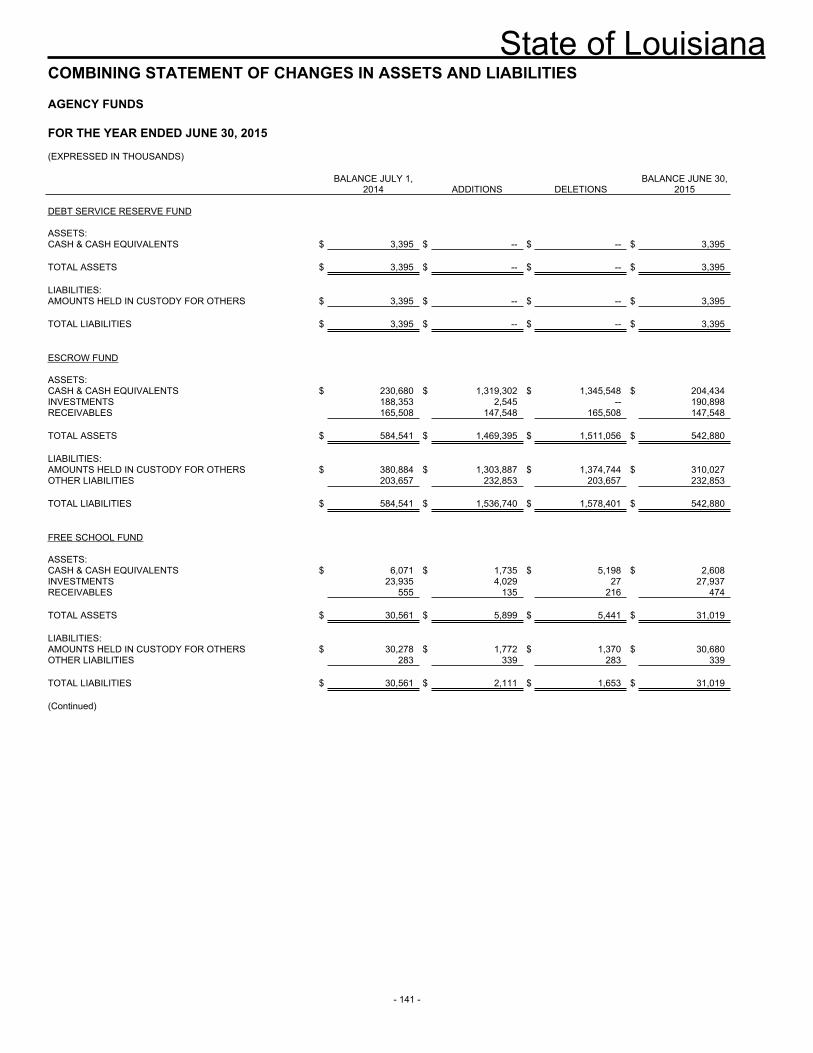
State of Louisiana
- 141 -
COMBINING STATEMENT OF CHANGES IN ASSETS AND LIABILITIES
AGENCY FUNDS
FOR THE YEAR ENDED JUNE 30, 2015 (EXPRESSED IN THOUSANDS)
BALANCE JULY 1,
2014 ADDITIONS DELETIONS BALANCE JUNE 30,
2015 DEBT SERVICE RESERVE FUND ASSETS: CASH & CASH EQUIVALENTS $ 3,395 $ -- $ -- $ 3,395 TOTAL ASSETS $ 3,395 $ -- $ -- $ 3,395 LIABILITIES: AMOUNTS HELD IN CUSTODY FOR OTHERS $ 3,395 $ -- $ -- $ 3,395 TOTAL LIABILITIES $ 3,395 $ -- $ -- $ 3,395 ESCROW FUND ASSETS: CASH & CASH EQUIVALENTS $ 230,680 $ 1,319,302 $ 1,345,548 $ 204,434INVESTMENTS 188,353 2,545 -- 190,898RECEIVABLES 165,508 147,548 165,508 147,548 TOTAL ASSETS $ 584,541 $ 1,469,395 $ 1,511,056 $ 542,880 LIABILITIES: AMOUNTS HELD IN CUSTODY FOR OTHERS $ 380,884 $ 1,303,887 $ 1,374,744 $ 310,027OTHER LIABILITIES 203,657 232,853 203,657 232,853 TOTAL LIABILITIES $ 584,541 $ 1,536,740 $ 1,578,401 $ 542,880 FREE SCHOOL FUND ASSETS: CASH & CASH EQUIVALENTS $ 6,071 $ 1,735 $ 5,198 $ 2,608INVESTMENTS 23,935 4,029 27 27,937RECEIVABLES 555 135 216 474 TOTAL ASSETS $ 30,561 $ 5,899 $ 5,441 $ 31,019 LIABILITIES: AMOUNTS HELD IN CUSTODY FOR OTHERS $ 30,278 $ 1,772 $ 1,370 $ 30,680OTHER LIABILITIES 283 339 283 339 TOTAL LIABILITIES $ 30,561 $ 2,111 $ 1,653 $ 31,019 (Continued)
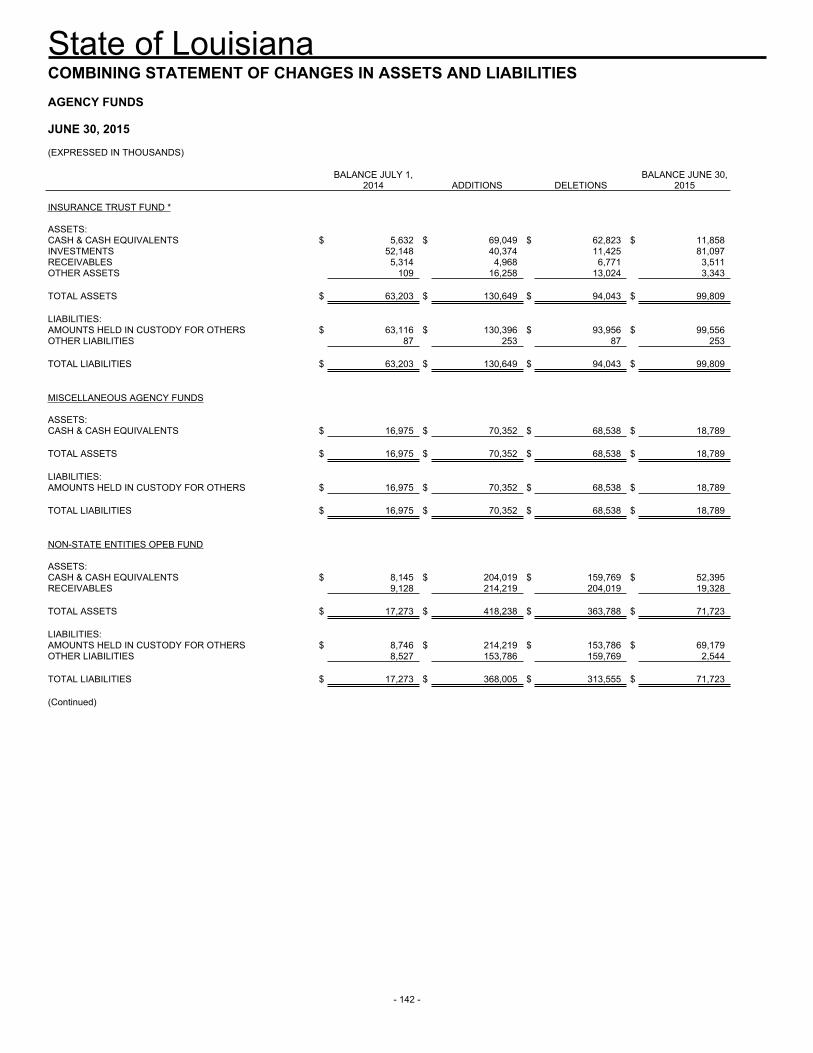
State of Louisiana
- 142 -
COMBINING STATEMENT OF CHANGES IN ASSETS AND LIABILITIES AGENCY FUNDS JUNE 30, 2015 (EXPRESSED IN THOUSANDS)
BALANCE JULY 1,
2014 ADDITIONS DELETIONS BALANCE JUNE 30,
2015 INSURANCE TRUST FUND * ASSETS: CASH & CASH EQUIVALENTS $ 5,632 $ 69,049 $ 62,823 $ 11,858INVESTMENTS 52,148 40,374 11,425 81,097RECEIVABLES 5,314 4,968 6,771 3,511OTHER ASSETS 109 16,258 13,024 3,343 TOTAL ASSETS $ 63,203 $ 130,649 $ 94,043 $ 99,809 LIABILITIES: AMOUNTS HELD IN CUSTODY FOR OTHERS $ 63,116 $ 130,396 $ 93,956 $ 99,556OTHER LIABILITIES 87 253 87 253 TOTAL LIABILITIES $ 63,203 $ 130,649 $ 94,043 $ 99,809 MISCELLANEOUS AGENCY FUNDS ASSETS: CASH & CASH EQUIVALENTS $ 16,975 $ 70,352 $ 68,538 $ 18,789 TOTAL ASSETS $ 16,975 $ 70,352 $ 68,538 $ 18,789 LIABILITIES: AMOUNTS HELD IN CUSTODY FOR OTHERS $ 16,975 $ 70,352 $ 68,538 $ 18,789 TOTAL LIABILITIES $ 16,975 $ 70,352 $ 68,538 $ 18,789 NON-STATE ENTITIES OPEB FUND ASSETS: CASH & CASH EQUIVALENTS $ 8,145 $ 204,019 $ 159,769 $ 52,395RECEIVABLES 9,128 214,219 204,019 19,328 TOTAL ASSETS $ 17,273 $ 418,238 $ 363,788 $ 71,723 LIABILITIES: AMOUNTS HELD IN CUSTODY FOR OTHERS $ 8,746 $ 214,219 $ 153,786 $ 69,179OTHER LIABILITIES 8,527 153,786 159,769 2,544 TOTAL LIABILITIES $ 17,273 $ 368,005 $ 313,555 $ 71,723 (Continued)
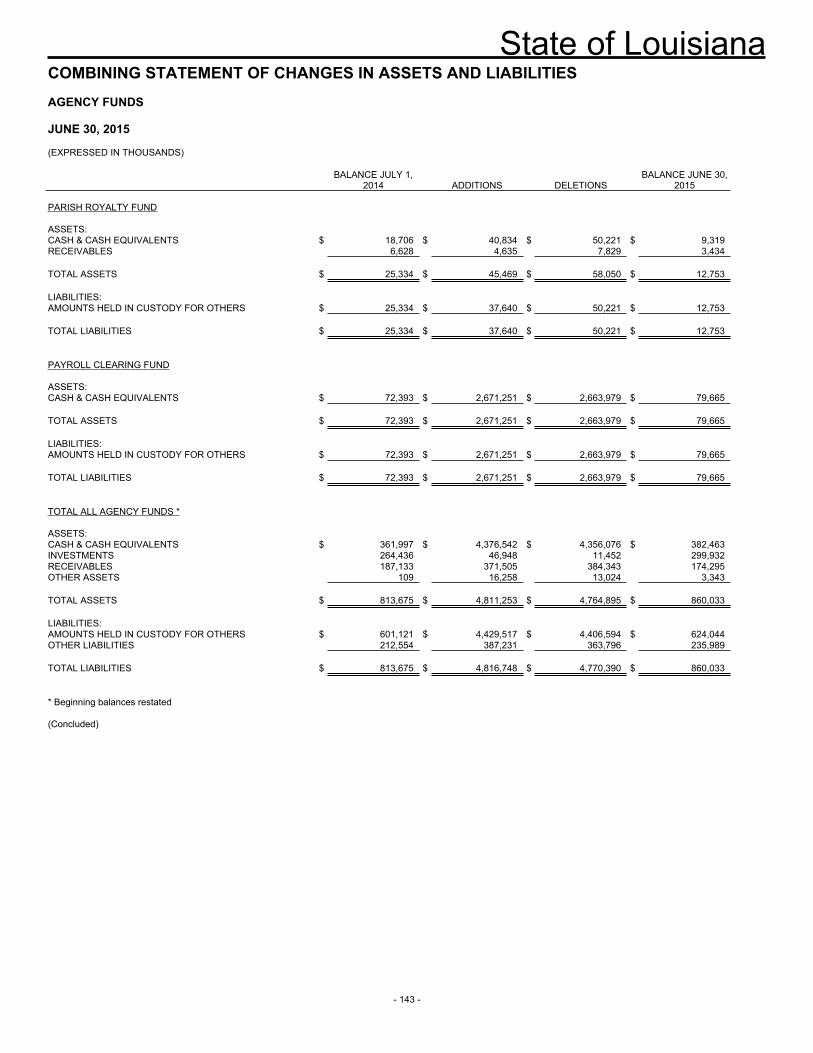
State of Louisiana
- 143 -
COMBINING STATEMENT OF CHANGES IN ASSETS AND LIABILITIES AGENCY FUNDS JUNE 30, 2015 (EXPRESSED IN THOUSANDS)
BALANCE JULY 1,
2014 ADDITIONS DELETIONS BALANCE JUNE 30,
2015 PARISH ROYALTY FUND ASSETS: CASH & CASH EQUIVALENTS $ 18,706 $ 40,834 $ 50,221 $ 9,319RECEIVABLES 6,628 4,635 7,829 3,434 TOTAL ASSETS $ 25,334 $ 45,469 $ 58,050 $ 12,753 LIABILITIES: AMOUNTS HELD IN CUSTODY FOR OTHERS $ 25,334 $ 37,640 $ 50,221 $ 12,753 TOTAL LIABILITIES $ 25,334 $ 37,640 $ 50,221 $ 12,753 PAYROLL CLEARING FUND ASSETS: CASH & CASH EQUIVALENTS $ 72,393 $ 2,671,251 $ 2,663,979 $ 79,665 TOTAL ASSETS $ 72,393 $ 2,671,251 $ 2,663,979 $ 79,665 LIABILITIES: AMOUNTS HELD IN CUSTODY FOR OTHERS $ 72,393 $ 2,671,251 $ 2,663,979 $ 79,665 TOTAL LIABILITIES $ 72,393 $ 2,671,251 $ 2,663,979 $ 79,665 TOTAL ALL AGENCY FUNDS * ASSETS: CASH & CASH EQUIVALENTS $ 361,997 $ 4,376,542 $ 4,356,076 $ 382,463INVESTMENTS 264,436 46,948 11,452 299,932RECEIVABLES 187,133 371,505 384,343 174,295OTHER ASSETS 109 16,258 13,024 3,343 TOTAL ASSETS $ 813,675 $ 4,811,253 $ 4,764,895 $ 860,033 LIABILITIES: AMOUNTS HELD IN CUSTODY FOR OTHERS $ 601,121 $ 4,429,517 $ 4,406,594 $ 624,044OTHER LIABILITIES 212,554 387,231 363,796 235,989 TOTAL LIABILITIES $ 813,675 $ 4,816,748 $ 4,770,390 $ 860,033 * Beginning balances restated (Concluded)
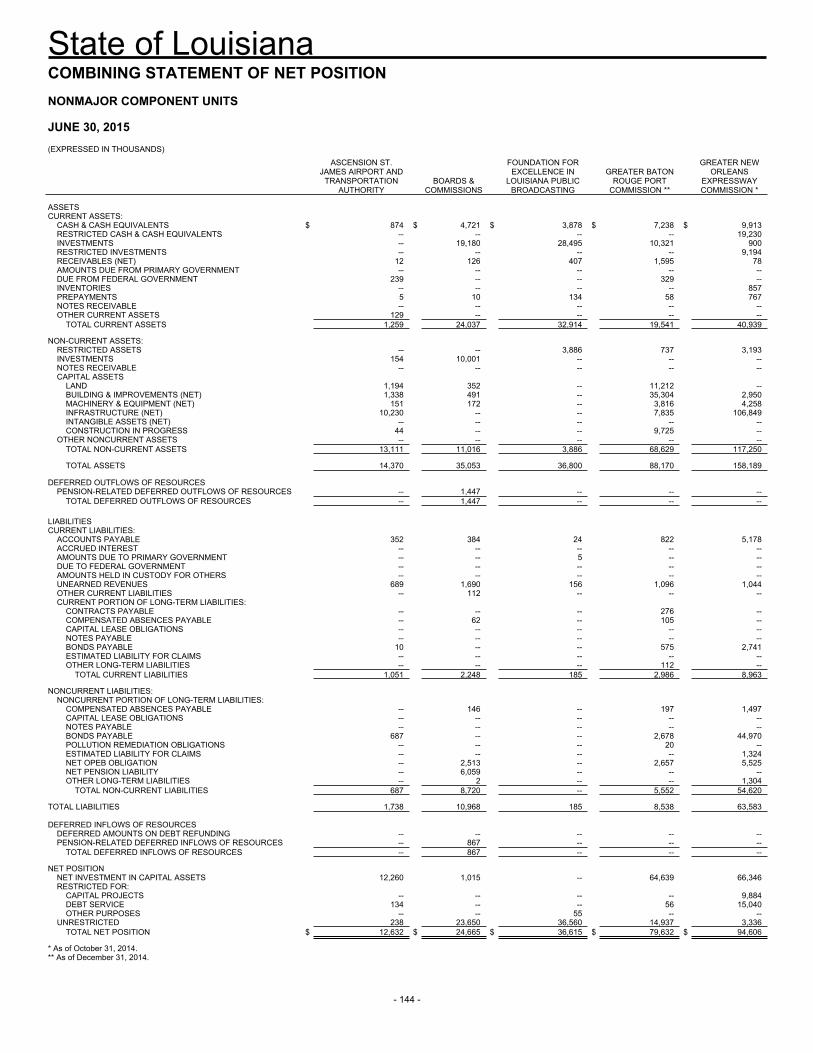
State of Louisiana
- 144 -
COMBINING STATEMENT OF NET POSITION NONMAJOR COMPONENT UNITS JUNE 30, 2015 (EXPRESSED IN THOUSANDS)
ASCENSION ST. JAMES AIRPORT AND
TRANSPORTATION AUTHORITY
BOARDS & COMMISSIONS
FOUNDATION FOR EXCELLENCE IN
LOUISIANA PUBLIC BROADCASTING
GREATER BATON ROUGE PORT
COMMISSION **
GREATER NEW ORLEANS
EXPRESSWAY COMMISSION *
ASSETS CURRENT ASSETS:
CASH & CASH EQUIVALENTS $ 874 $ 4,721 $ 3,878 $ 7,238 $ 9,913RESTRICTED CASH & CASH EQUIVALENTS -- -- -- -- 19,230INVESTMENTS -- 19,180 28,495 10,321 900RESTRICTED INVESTMENTS -- -- -- -- 9,194RECEIVABLES (NET) 12 126 407 1,595 78AMOUNTS DUE FROM PRIMARY GOVERNMENT -- -- -- -- --DUE FROM FEDERAL GOVERNMENT 239 -- -- 329 --INVENTORIES -- -- -- -- 857PREPAYMENTS 5 10 134 58 767NOTES RECEIVABLE -- -- -- -- --OTHER CURRENT ASSETS 129 -- -- -- --
TOTAL CURRENT ASSETS 1,259 24,037 32,914 19,541 40,939 NON-CURRENT ASSETS:
RESTRICTED ASSETS -- -- 3,886 737 3,193INVESTMENTS 154 10,001 -- -- --NOTES RECEIVABLE -- -- -- -- --CAPITAL ASSETS
LAND 1,194 352 -- 11,212 --BUILDING & IMPROVEMENTS (NET) 1,338 491 -- 35,304 2,950MACHINERY & EQUIPMENT (NET) 151 172 -- 3,816 4,258INFRASTRUCTURE (NET) 10,230 -- -- 7,835 106,849INTANGIBLE ASSETS (NET) -- -- -- -- --CONSTRUCTION IN PROGRESS 44 -- -- 9,725 --
OTHER NONCURRENT ASSETS -- -- -- -- --TOTAL NON-CURRENT ASSETS 13,111 11,016 3,886 68,629 117,250
TOTAL ASSETS 14,370 35,053 36,800 88,170 158,189
DEFERRED OUTFLOWS OF RESOURCES
PENSION-RELATED DEFERRED OUTFLOWS OF RESOURCES -- 1,447 -- -- --TOTAL DEFERRED OUTFLOWS OF RESOURCES -- 1,447 -- -- --
LIABILITIES CURRENT LIABILITIES:
ACCOUNTS PAYABLE 352 384 24 822 5,178ACCRUED INTEREST -- -- -- -- --AMOUNTS DUE TO PRIMARY GOVERNMENT -- -- 5 -- --DUE TO FEDERAL GOVERNMENT -- -- -- -- --AMOUNTS HELD IN CUSTODY FOR OTHERS -- -- -- -- --UNEARNED REVENUES 689 1,690 156 1,096 1,044OTHER CURRENT LIABILITIES -- 112 -- -- --CURRENT PORTION OF LONG-TERM LIABILITIES:
CONTRACTS PAYABLE -- -- -- 276 --COMPENSATED ABSENCES PAYABLE -- 62 -- 105 --CAPITAL LEASE OBLIGATIONS -- -- -- -- --NOTES PAYABLE -- -- -- -- --BONDS PAYABLE 10 -- -- 575 2,741ESTIMATED LIABILITY FOR CLAIMS -- -- -- -- --OTHER LONG-TERM LIABILITIES -- -- -- 112 --
TOTAL CURRENT LIABILITIES 1,051 2,248 185 2,986 8,963 NONCURRENT LIABILITIES:
NONCURRENT PORTION OF LONG-TERM LIABILITIES: COMPENSATED ABSENCES PAYABLE -- 146 -- 197 1,497CAPITAL LEASE OBLIGATIONS -- -- -- -- --NOTES PAYABLE -- -- -- -- --BONDS PAYABLE 687 -- -- 2,678 44,970POLLUTION REMEDIATION OBLIGATIONS -- -- -- 20 --ESTIMATED LIABILITY FOR CLAIMS -- -- -- -- 1,324NET OPEB OBLIGATION -- 2,513 -- 2,657 5,525NET PENSION LIABILITY -- 6,059 -- -- --OTHER LONG-TERM LIABILITIES -- 2 -- -- 1,304
TOTAL NON-CURRENT LIABILITIES 687 8,720 -- 5,552 54,620
TOTAL LIABILITIES 1,738 10,968 185 8,538 63,583 DEFERRED INFLOWS OF RESOURCES
DEFERRED AMOUNTS ON DEBT REFUNDING -- -- -- -- --PENSION-RELATED DEFERRED INFLOWS OF RESOURCES -- 867 -- -- --
TOTAL DEFERRED INFLOWS OF RESOURCES -- 867 -- -- -- NET POSITION
NET INVESTMENT IN CAPITAL ASSETS 12,260 1,015 -- 64,639 66,346RESTRICTED FOR:
CAPITAL PROJECTS -- -- -- -- 9,884DEBT SERVICE 134 -- -- 56 15,040OTHER PURPOSES -- -- 55 -- --
UNRESTRICTED 238 23,650 36,560 14,937 3,336TOTAL NET POSITION $ 12,632 $ 24,665 $ 36,615 $ 79,632 $ 94,606
* As of October 31, 2014. ** As of December 31, 2014.
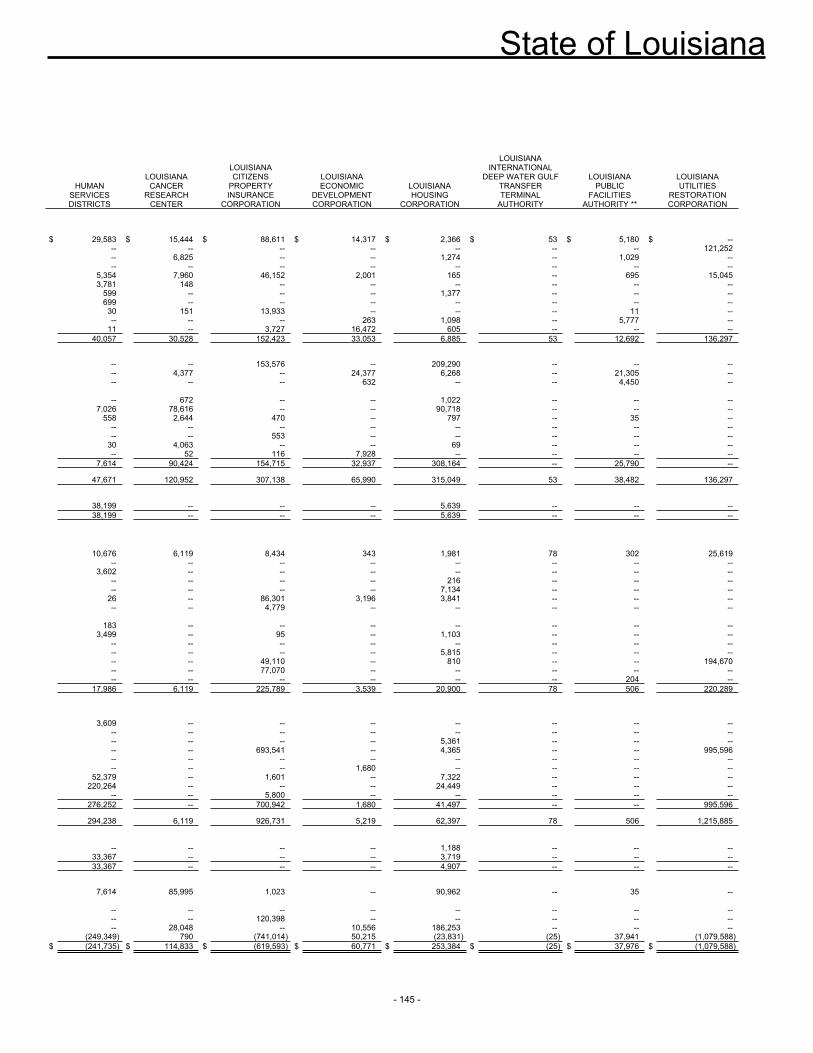
State of Louisiana
- 145 -
HUMAN SERVICES DISTRICTS
LOUISIANA CANCER
RESEARCH CENTER
LOUISIANA CITIZENS
PROPERTY INSURANCE
CORPORATION
LOUISIANA ECONOMIC
DEVELOPMENT CORPORATION
LOUISIANA HOUSING
CORPORATION
LOUISIANA INTERNATIONAL
DEEP WATER GULF TRANSFER TERMINAL
AUTHORITY
LOUISIANA PUBLIC
FACILITIES AUTHORITY **
LOUISIANA UTILITIES
RESTORATION CORPORATION
$ 29,583 $ 15,444 $ 88,611 $ 14,317 $ 2,366 $ 53 $ 5,180 $ -- -- -- -- -- -- -- -- 121,252 -- 6,825 -- -- 1,274 -- 1,029 -- -- -- -- -- -- -- -- -- 5,354 7,960 46,152 2,001 165 -- 695 15,045 3,781 148 -- -- -- -- -- -- 599 -- -- -- 1,377 -- -- -- 699 -- -- -- -- -- -- -- 30 151 13,933 -- -- -- 11 -- -- -- -- 263 1,098 -- 5,777 -- 11 -- 3,727 16,472 605 -- -- -- 40,057 30,528 152,423 33,053 6,885 53 12,692 136,297 -- -- 153,576 -- 209,290 -- -- -- -- 4,377 -- 24,377 6,268 -- 21,305 -- -- -- -- 632 -- -- 4,450 -- -- 672 -- -- 1,022 -- -- -- 7,026 78,616 -- -- 90,718 -- -- -- 558 2,644 470 -- 797 -- 35 -- -- -- -- -- -- -- -- -- -- -- 553 -- -- -- -- -- 30 4,063 -- -- 69 -- -- -- -- 52 116 7,928 -- -- -- -- 7,614 90,424 154,715 32,937 308,164 -- 25,790 -- 47,671 120,952 307,138 65,990 315,049 53 38,482 136,297 38,199 -- -- -- 5,639 -- -- -- 38,199 -- -- -- 5,639 -- -- -- 10,676 6,119 8,434 343 1,981 78 302 25,619 -- -- -- -- -- -- -- -- 3,602 -- -- -- -- -- -- -- -- -- -- -- 216 -- -- -- -- -- -- -- 7,134 -- -- -- 26 -- 86,301 3,196 3,841 -- -- -- -- -- 4,779 -- -- -- -- -- 183 -- -- -- -- -- -- -- 3,499 -- 95 -- 1,103 -- -- -- -- -- -- -- -- -- -- -- -- -- -- -- 5,815 -- -- -- -- -- 49,110 -- 810 -- -- 194,670 -- -- 77,070 -- -- -- -- -- -- -- -- -- -- -- 204 -- 17,986 6,119 225,789 3,539 20,900 78 506 220,289 3,609 -- -- -- -- -- -- -- -- -- -- -- -- -- -- -- -- -- -- -- 5,361 -- -- -- -- -- 693,541 -- 4,365 -- -- 995,596 -- -- -- -- -- -- -- -- -- -- -- 1,680 -- -- -- -- 52,379 -- 1,601 -- 7,322 -- -- -- 220,264 -- -- -- 24,449 -- -- -- -- -- 5,800 -- -- -- -- -- 276,252 -- 700,942 1,680 41,497 -- -- 995,596 294,238 6,119 926,731 5,219 62,397 78 506 1,215,885 -- -- -- -- 1,188 -- -- -- 33,367 -- -- -- 3,719 -- -- -- 33,367 -- -- -- 4,907 -- -- -- 7,614 85,995 1,023 -- 90,962 -- 35 -- -- -- -- -- -- -- -- -- -- -- 120,398 -- -- -- -- -- -- 28,048 -- 10,556 186,253 -- -- -- (249,349) 790 (741,014) 50,215 (23,831) (25) 37,941 (1,079,588)
$ (241,735) $ 114,833 $ (619,593) $ 60,771 $ 253,384 $ (25) $ 37,976 $ (1,079,588)
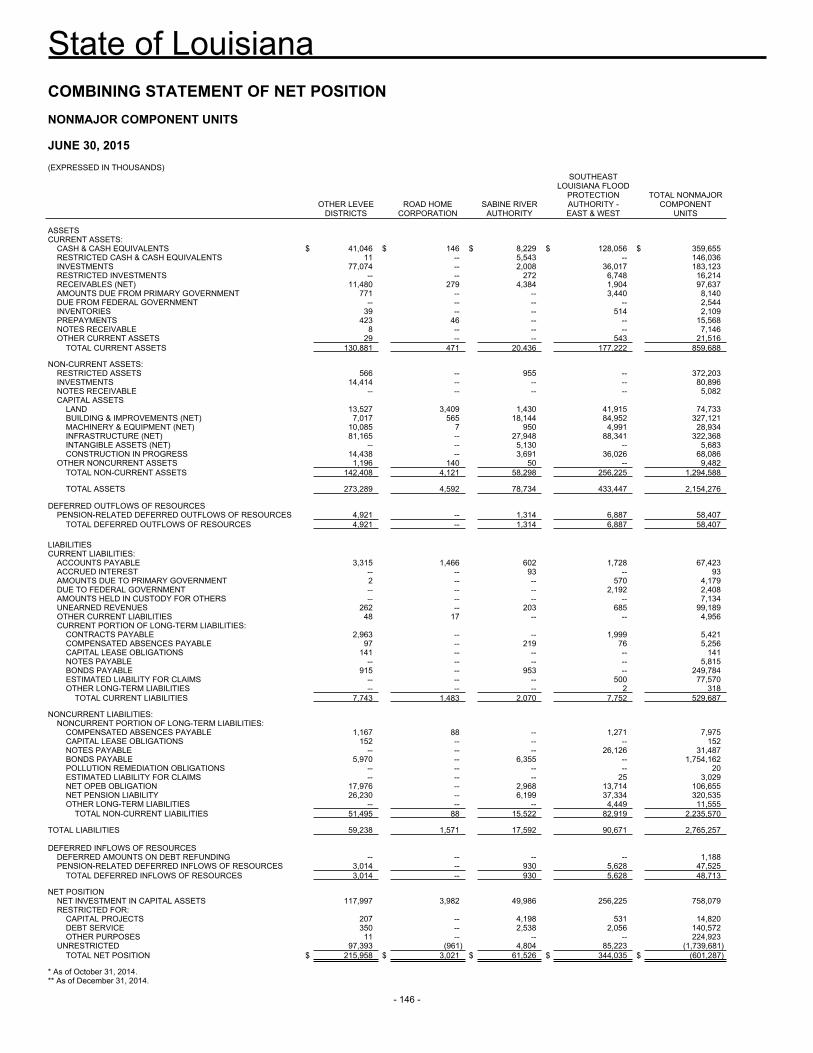
State of Louisiana
- 146 -
COMBINING STATEMENT OF NET POSITION NONMAJOR COMPONENT UNITS JUNE 30, 2015 (EXPRESSED IN THOUSANDS)
OTHER LEVEE
DISTRICTS ROAD HOME
CORPORATION SABINE RIVER
AUTHORITY
SOUTHEAST LOUISIANA FLOOD
PROTECTION AUTHORITY - EAST & WEST
TOTAL NONMAJOR COMPONENT
UNITS
ASSETS CURRENT ASSETS:
CASH & CASH EQUIVALENTS $ 41,046 $ 146 $ 8,229 $ 128,056 $ 359,655RESTRICTED CASH & CASH EQUIVALENTS 11 -- 5,543 -- 146,036INVESTMENTS 77,074 -- 2,008 36,017 183,123RESTRICTED INVESTMENTS -- -- 272 6,748 16,214RECEIVABLES (NET) 11,480 279 4,384 1,904 97,637AMOUNTS DUE FROM PRIMARY GOVERNMENT 771 -- -- 3,440 8,140DUE FROM FEDERAL GOVERNMENT -- -- -- -- 2,544INVENTORIES 39 -- -- 514 2,109PREPAYMENTS 423 46 -- -- 15,568NOTES RECEIVABLE 8 -- -- -- 7,146OTHER CURRENT ASSETS 29 -- -- 543 21,516
TOTAL CURRENT ASSETS 130,881 471 20,436 177,222 859,688 NON-CURRENT ASSETS:
RESTRICTED ASSETS 566 -- 955 -- 372,203INVESTMENTS 14,414 -- -- -- 80,896NOTES RECEIVABLE -- -- -- -- 5,082CAPITAL ASSETS
LAND 13,527 3,409 1,430 41,915 74,733BUILDING & IMPROVEMENTS (NET) 7,017 565 18,144 84,952 327,121MACHINERY & EQUIPMENT (NET) 10,085 7 950 4,991 28,934INFRASTRUCTURE (NET) 81,165 -- 27,948 88,341 322,368INTANGIBLE ASSETS (NET) -- -- 5,130 -- 5,683CONSTRUCTION IN PROGRESS 14,438 -- 3,691 36,026 68,086
OTHER NONCURRENT ASSETS 1,196 140 50 -- 9,482TOTAL NON-CURRENT ASSETS 142,408 4,121 58,298 256,225 1,294,588
TOTAL ASSETS 273,289 4,592 78,734 433,447 2,154,276
DEFERRED OUTFLOWS OF RESOURCES
PENSION-RELATED DEFERRED OUTFLOWS OF RESOURCES 4,921 -- 1,314 6,887 58,407TOTAL DEFERRED OUTFLOWS OF RESOURCES 4,921 -- 1,314 6,887 58,407
LIABILITIES CURRENT LIABILITIES:
ACCOUNTS PAYABLE 3,315 1,466 602 1,728 67,423ACCRUED INTEREST -- -- 93 -- 93AMOUNTS DUE TO PRIMARY GOVERNMENT 2 -- -- 570 4,179DUE TO FEDERAL GOVERNMENT -- -- -- 2,192 2,408AMOUNTS HELD IN CUSTODY FOR OTHERS -- -- -- -- 7,134UNEARNED REVENUES 262 -- 203 685 99,189OTHER CURRENT LIABILITIES 48 17 -- -- 4,956CURRENT PORTION OF LONG-TERM LIABILITIES:
CONTRACTS PAYABLE 2,963 -- -- 1,999 5,421COMPENSATED ABSENCES PAYABLE 97 -- 219 76 5,256CAPITAL LEASE OBLIGATIONS 141 -- -- -- 141NOTES PAYABLE -- -- -- -- 5,815BONDS PAYABLE 915 -- 953 -- 249,784ESTIMATED LIABILITY FOR CLAIMS -- -- -- 500 77,570OTHER LONG-TERM LIABILITIES -- -- -- 2 318
TOTAL CURRENT LIABILITIES 7,743 1,483 2,070 7,752 529,687 NONCURRENT LIABILITIES:
NONCURRENT PORTION OF LONG-TERM LIABILITIES: COMPENSATED ABSENCES PAYABLE 1,167 88 -- 1,271 7,975CAPITAL LEASE OBLIGATIONS 152 -- -- -- 152NOTES PAYABLE -- -- -- 26,126 31,487BONDS PAYABLE 5,970 -- 6,355 -- 1,754,162POLLUTION REMEDIATION OBLIGATIONS -- -- -- -- 20ESTIMATED LIABILITY FOR CLAIMS -- -- -- 25 3,029NET OPEB OBLIGATION 17,976 -- 2,968 13,714 106,655NET PENSION LIABILITY 26,230 -- 6,199 37,334 320,535OTHER LONG-TERM LIABILITIES -- -- -- 4,449 11,555
TOTAL NON-CURRENT LIABILITIES 51,495 88 15,522 82,919 2,235,570 TOTAL LIABILITIES 59,238 1,571 17,592 90,671 2,765,257 DEFERRED INFLOWS OF RESOURCES
DEFERRED AMOUNTS ON DEBT REFUNDING -- -- -- -- 1,188PENSION-RELATED DEFERRED INFLOWS OF RESOURCES 3,014 -- 930 5,628 47,525
TOTAL DEFERRED INFLOWS OF RESOURCES 3,014 -- 930 5,628 48,713 NET POSITION
NET INVESTMENT IN CAPITAL ASSETS 117,997 3,982 49,986 256,225 758,079RESTRICTED FOR:
CAPITAL PROJECTS 207 -- 4,198 531 14,820DEBT SERVICE 350 -- 2,538 2,056 140,572OTHER PURPOSES 11 -- -- -- 224,923
UNRESTRICTED 97,393 (961) 4,804 85,223 (1,739,681)TOTAL NET POSITION $ 215,958 $ 3,021 $ 61,526 $ 344,035 $ (601,287)
* As of October 31, 2014. ** As of December 31, 2014.
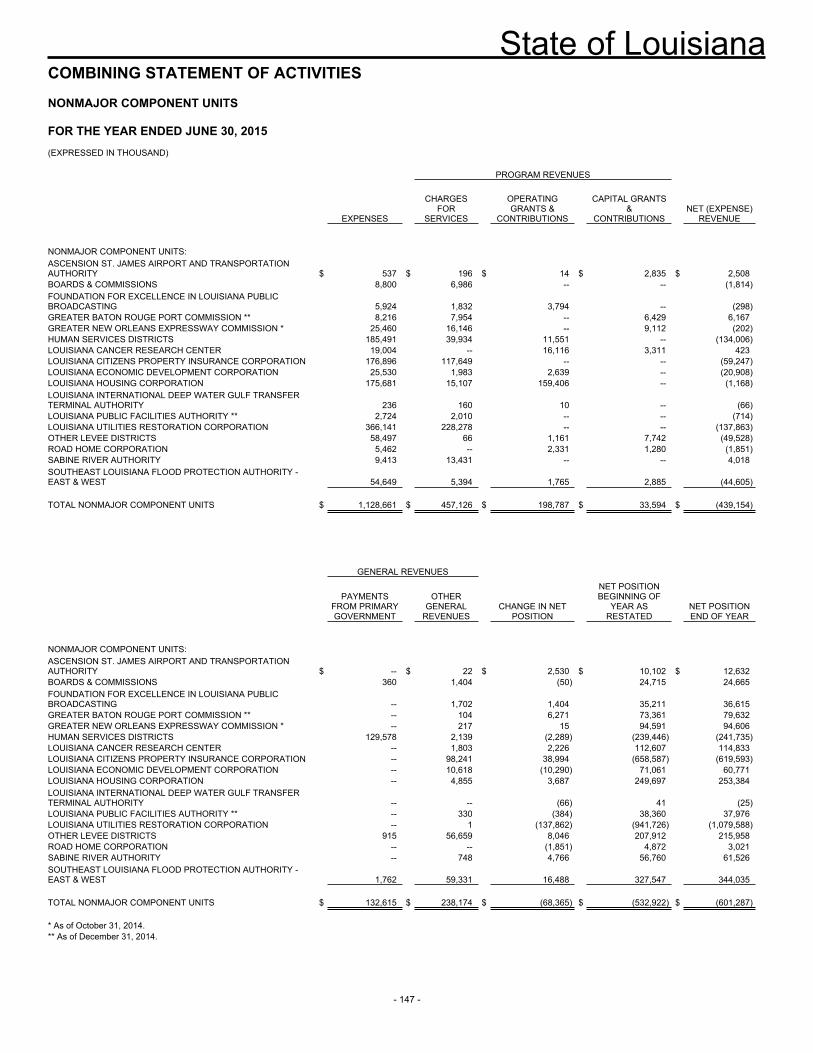
State of Louisiana
- 147 -
COMBINING STATEMENT OF ACTIVITIES
NONMAJOR COMPONENT UNITS
FOR THE YEAR ENDED JUNE 30, 2015 (EXPRESSED IN THOUSAND) PROGRAM REVENUES
EXPENSES
CHARGES FOR
SERVICES
OPERATING GRANTS &
CONTRIBUTIONS
CAPITAL GRANTS &
CONTRIBUTIONS NET (EXPENSE)
REVENUE NONMAJOR COMPONENT UNITS: ASCENSION ST. JAMES AIRPORT AND TRANSPORTATION AUTHORITY $ 537 $ 196 $ 14 $ 2,835 $ 2,508BOARDS & COMMISSIONS 8,800 6,986 -- -- (1,814)FOUNDATION FOR EXCELLENCE IN LOUISIANA PUBLIC BROADCASTING 5,924 1,832 3,794 -- (298)GREATER BATON ROUGE PORT COMMISSION ** 8,216 7,954 -- 6,429 6,167GREATER NEW ORLEANS EXPRESSWAY COMMISSION * 25,460 16,146 -- 9,112 (202)HUMAN SERVICES DISTRICTS 185,491 39,934 11,551 -- (134,006)LOUISIANA CANCER RESEARCH CENTER 19,004 -- 16,116 3,311 423LOUISIANA CITIZENS PROPERTY INSURANCE CORPORATION 176,896 117,649 -- -- (59,247)LOUISIANA ECONOMIC DEVELOPMENT CORPORATION 25,530 1,983 2,639 -- (20,908)LOUISIANA HOUSING CORPORATION 175,681 15,107 159,406 -- (1,168)LOUISIANA INTERNATIONAL DEEP WATER GULF TRANSFER TERMINAL AUTHORITY 236 160 10 -- (66)LOUISIANA PUBLIC FACILITIES AUTHORITY ** 2,724 2,010 -- -- (714)LOUISIANA UTILITIES RESTORATION CORPORATION 366,141 228,278 -- -- (137,863)OTHER LEVEE DISTRICTS 58,497 66 1,161 7,742 (49,528)ROAD HOME CORPORATION 5,462 -- 2,331 1,280 (1,851)SABINE RIVER AUTHORITY 9,413 13,431 -- -- 4,018SOUTHEAST LOUISIANA FLOOD PROTECTION AUTHORITY - EAST & WEST 54,649 5,394 1,765 2,885 (44,605) TOTAL NONMAJOR COMPONENT UNITS $ 1,128,661 $ 457,126 $ 198,787 $ 33,594 $ (439,154) GENERAL REVENUES
PAYMENTS FROM PRIMARY GOVERNMENT
OTHER GENERAL
REVENUES CHANGE IN NET
POSITION
NET POSITION BEGINNING OF
YEAR AS RESTATED
NET POSITION END OF YEAR
NONMAJOR COMPONENT UNITS: ASCENSION ST. JAMES AIRPORT AND TRANSPORTATION AUTHORITY $ -- $ 22 $ 2,530 $ 10,102 $ 12,632BOARDS & COMMISSIONS 360 1,404 (50) 24,715 24,665FOUNDATION FOR EXCELLENCE IN LOUISIANA PUBLIC BROADCASTING -- 1,702 1,404 35,211 36,615GREATER BATON ROUGE PORT COMMISSION ** -- 104 6,271 73,361 79,632GREATER NEW ORLEANS EXPRESSWAY COMMISSION * -- 217 15 94,591 94,606HUMAN SERVICES DISTRICTS 129,578 2,139 (2,289) (239,446) (241,735)LOUISIANA CANCER RESEARCH CENTER -- 1,803 2,226 112,607 114,833LOUISIANA CITIZENS PROPERTY INSURANCE CORPORATION -- 98,241 38,994 (658,587) (619,593)LOUISIANA ECONOMIC DEVELOPMENT CORPORATION -- 10,618 (10,290) 71,061 60,771LOUISIANA HOUSING CORPORATION -- 4,855 3,687 249,697 253,384LOUISIANA INTERNATIONAL DEEP WATER GULF TRANSFER TERMINAL AUTHORITY -- -- (66) 41 (25)LOUISIANA PUBLIC FACILITIES AUTHORITY ** -- 330 (384) 38,360 37,976LOUISIANA UTILITIES RESTORATION CORPORATION -- 1 (137,862) (941,726) (1,079,588)OTHER LEVEE DISTRICTS 915 56,659 8,046 207,912 215,958ROAD HOME CORPORATION -- -- (1,851) 4,872 3,021SABINE RIVER AUTHORITY -- 748 4,766 56,760 61,526SOUTHEAST LOUISIANA FLOOD PROTECTION AUTHORITY - EAST & WEST 1,762 59,331 16,488 327,547 344,035 TOTAL NONMAJOR COMPONENT UNITS $ 132,615 $ 238,174 $ (68,365) $ (532,922) $ (601,287) * As of October 31, 2014. ** As of December 31, 2014.

- 148 -
I I I . STATISTICAL SECTION
2014-2015 Comprehensive Annual Financial Report

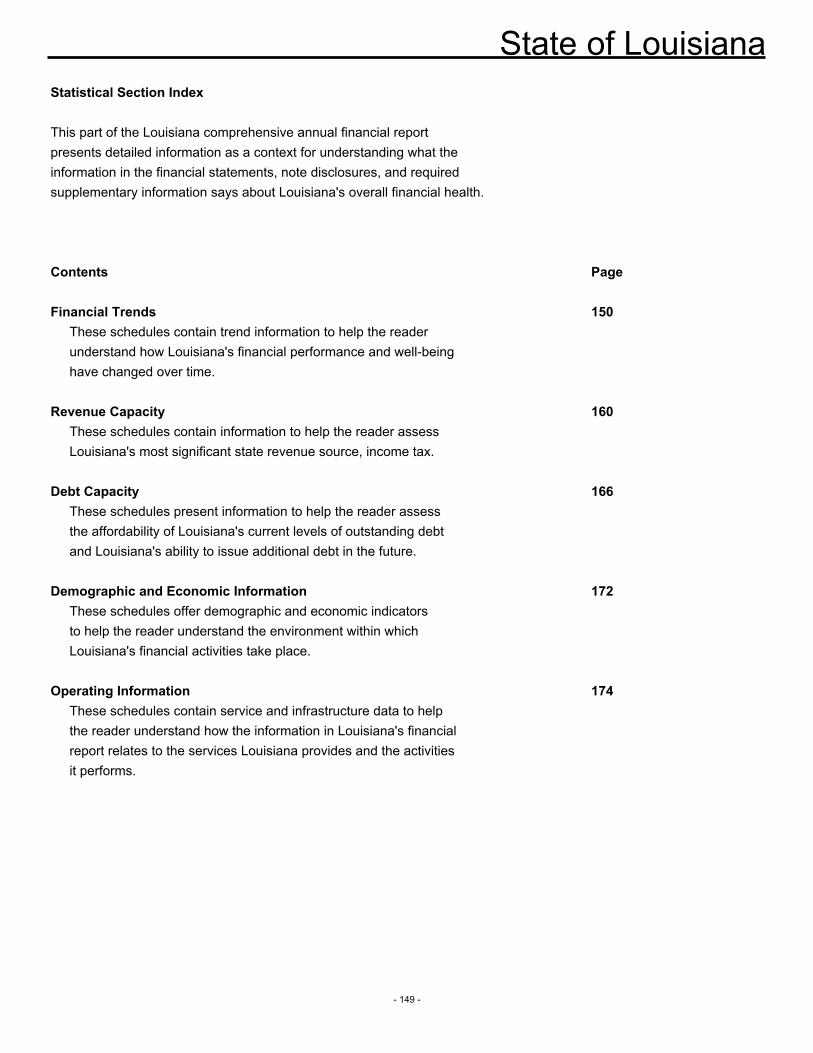
State of Louisiana
- 149 -
Statistical Section Index
This part of the Louisiana comprehensive annual financial reportpresents detailed information as a context for understanding what theinformation in the financial statements, note disclosures, and requiredsupplementary information says about Louisiana's overall financial health.
Contents Page
Financial Trends 150These schedules contain trend information to help the reader understand how Louisiana's financial performance and well-beinghave changed over time.
Revenue Capacity 160These schedules contain information to help the reader assess Louisiana's most significant state revenue source, income tax.
Debt Capacity 166These schedules present information to help the reader assess the affordability of Louisiana's current levels of outstanding debtand Louisiana's ability to issue additional debt in the future.
Demographic and Economic Information 172These schedules offer demographic and economic indicatorsto help the reader understand the environment within whichLouisiana's financial activities take place.
Operating Information 174These schedules contain service and infrastructure data to help the reader understand how the information in Louisiana's financialreport relates to the services Louisiana provides and the activitiesit performs.
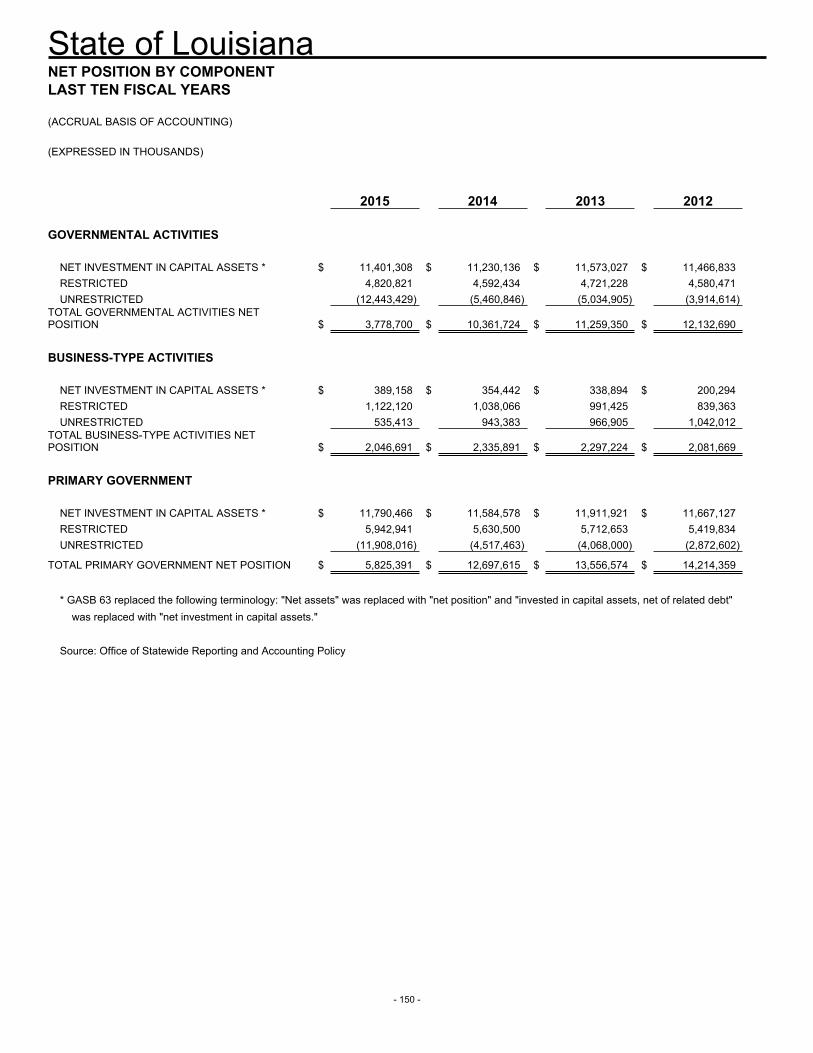
State of Louisiana
- 150 -
NET POSITION BY COMPONENTLAST TEN FISCAL YEARS
(ACCRUAL BASIS OF ACCOUNTING)
(EXPRESSED IN THOUSANDS)
2015 2014 2013 2012
GOVERNMENTAL ACTIVITIES
NET INVESTMENT IN CAPITAL ASSETS * $ 11,401,308 $ 11,230,136 $ 11,573,027 $ 11,466,833RESTRICTED 4,820,821 4,592,434 4,721,228 4,580,471UNRESTRICTED (12,443,429) (5,460,846) (5,034,905) (3,914,614)
TOTAL GOVERNMENTAL ACTIVITIES NET POSITION $ 3,778,700 $ 10,361,724 $ 11,259,350 $ 12,132,690
BUSINESS-TYPE ACTIVITIES
NET INVESTMENT IN CAPITAL ASSETS * $ 389,158 $ 354,442 $ 338,894 $ 200,294RESTRICTED 1,122,120 1,038,066 991,425 839,363UNRESTRICTED 535,413 943,383 966,905 1,042,012
TOTAL BUSINESS-TYPE ACTIVITIES NET POSITION $ 2,046,691 $ 2,335,891 $ 2,297,224 $ 2,081,669
PRIMARY GOVERNMENT
NET INVESTMENT IN CAPITAL ASSETS * $ 11,790,466 $ 11,584,578 $ 11,911,921 $ 11,667,127RESTRICTED 5,942,941 5,630,500 5,712,653 5,419,834UNRESTRICTED (11,908,016) (4,517,463) (4,068,000) (2,872,602)
TOTAL PRIMARY GOVERNMENT NET POSITION $ 5,825,391 $ 12,697,615 $ 13,556,574 $ 14,214,359
* GASB 63 replaced the following terminology: "Net assets" was replaced with "net position" and "invested in capital assets, net of related debt"was replaced with "net investment in capital assets."
Source: Office of Statewide Reporting and Accounting Policy
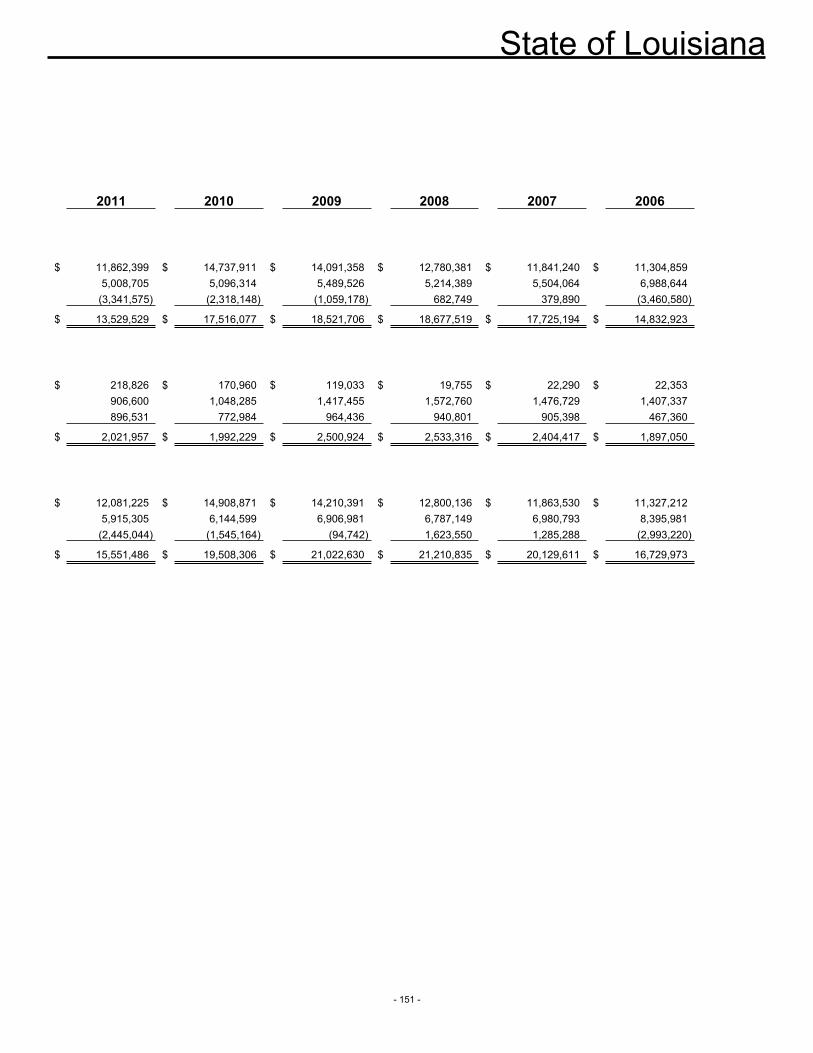
State of Louisiana
- 151 -
2011 2010 2009 2008 2007 2006
$ 11,862,399 $ 14,737,911 $ 14,091,358 $ 12,780,381 $ 11,841,240 $ 11,304,8595,008,705 5,096,314 5,489,526 5,214,389 5,504,064 6,988,644
(3,341,575) (2,318,148) (1,059,178) 682,749 379,890 (3,460,580)
$ 13,529,529 $ 17,516,077 $ 18,521,706 $ 18,677,519 $ 17,725,194 $ 14,832,923
$ 218,826 $ 170,960 $ 119,033 $ 19,755 $ 22,290 $ 22,353906,600 1,048,285 1,417,455 1,572,760 1,476,729 1,407,337896,531 772,984 964,436 940,801 905,398 467,360
$ 2,021,957 $ 1,992,229 $ 2,500,924 $ 2,533,316 $ 2,404,417 $ 1,897,050
$ 12,081,225 $ 14,908,871 $ 14,210,391 $ 12,800,136 $ 11,863,530 $ 11,327,2125,915,305 6,144,599 6,906,981 6,787,149 6,980,793 8,395,981
(2,445,044) (1,545,164) (94,742) 1,623,550 1,285,288 (2,993,220)
$ 15,551,486 $ 19,508,306 $ 21,022,630 $ 21,210,835 $ 20,129,611 $ 16,729,973
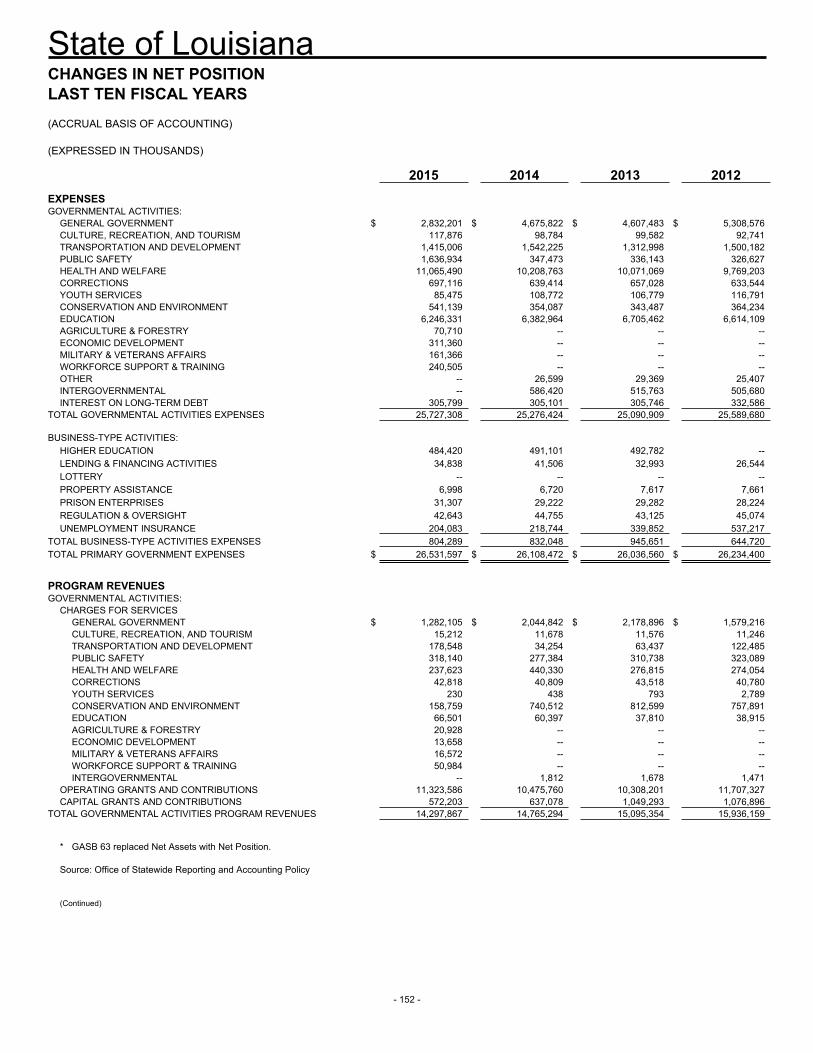
State of Louisiana
- 152 -
CHANGES IN NET POSITIONLAST TEN FISCAL YEARS
(ACCRUAL BASIS OF ACCOUNTING)
(EXPRESSED IN THOUSANDS)
2015 2014 2013 2012EXPENSESGOVERNMENTAL ACTIVITIES:
GENERAL GOVERNMENT $ 2,832,201 $ 4,675,822 $ 4,607,483 $ 5,308,576CULTURE, RECREATION, AND TOURISM 117,876 98,784 99,582 92,741TRANSPORTATION AND DEVELOPMENT 1,415,006 1,542,225 1,312,998 1,500,182PUBLIC SAFETY 1,636,934 347,473 336,143 326,627HEALTH AND WELFARE 11,065,490 10,208,763 10,071,069 9,769,203CORRECTIONS 697,116 639,414 657,028 633,544YOUTH SERVICES 85,475 108,772 106,779 116,791CONSERVATION AND ENVIRONMENT 541,139 354,087 343,487 364,234EDUCATION 6,246,331 6,382,964 6,705,462 6,614,109AGRICULTURE & FORESTRY 70,710 -- -- --ECONOMIC DEVELOPMENT 311,360 -- -- --MILITARY & VETERANS AFFAIRS 161,366 -- -- --WORKFORCE SUPPORT & TRAINING 240,505 -- -- --OTHER -- 26,599 29,369 25,407INTERGOVERNMENTAL -- 586,420 515,763 505,680INTEREST ON LONG-TERM DEBT 305,799 305,101 305,746 332,586
TOTAL GOVERNMENTAL ACTIVITIES EXPENSES 25,727,308 25,276,424 25,090,909 25,589,680
BUSINESS-TYPE ACTIVITIES:HIGHER EDUCATION 484,420 491,101 492,782 --LENDING & FINANCING ACTIVITIES 34,838 41,506 32,993 26,544LOTTERY -- -- -- --PROPERTY ASSISTANCE 6,998 6,720 7,617 7,661PRISON ENTERPRISES 31,307 29,222 29,282 28,224REGULATION & OVERSIGHT 42,643 44,755 43,125 45,074UNEMPLOYMENT INSURANCE 204,083 218,744 339,852 537,217
TOTAL BUSINESS-TYPE ACTIVITIES EXPENSES 804,289 832,048 945,651 644,720TOTAL PRIMARY GOVERNMENT EXPENSES $ 26,531,597 $ 26,108,472 $ 26,036,560 $ 26,234,400
PROGRAM REVENUESGOVERNMENTAL ACTIVITIES:
CHARGES FOR SERVICESGENERAL GOVERNMENT $ 1,282,105 $ 2,044,842 $ 2,178,896 $ 1,579,216CULTURE, RECREATION, AND TOURISM 15,212 11,678 11,576 11,246TRANSPORTATION AND DEVELOPMENT 178,548 34,254 63,437 122,485PUBLIC SAFETY 318,140 277,384 310,738 323,089HEALTH AND WELFARE 237,623 440,330 276,815 274,054CORRECTIONS 42,818 40,809 43,518 40,780YOUTH SERVICES 230 438 793 2,789CONSERVATION AND ENVIRONMENT 158,759 740,512 812,599 757,891EDUCATION 66,501 60,397 37,810 38,915AGRICULTURE & FORESTRY 20,928 -- -- --ECONOMIC DEVELOPMENT 13,658 -- -- --MILITARY & VETERANS AFFAIRS 16,572 -- -- --WORKFORCE SUPPORT & TRAINING 50,984 -- -- --INTERGOVERNMENTAL -- 1,812 1,678 1,471
OPERATING GRANTS AND CONTRIBUTIONS 11,323,586 10,475,760 10,308,201 11,707,327CAPITAL GRANTS AND CONTRIBUTIONS 572,203 637,078 1,049,293 1,076,896
TOTAL GOVERNMENTAL ACTIVITIES PROGRAM REVENUES 14,297,867 14,765,294 15,095,354 15,936,159
* GASB 63 replaced Net Assets with Net Position.
Source: Office of Statewide Reporting and Accounting Policy
(Continued)
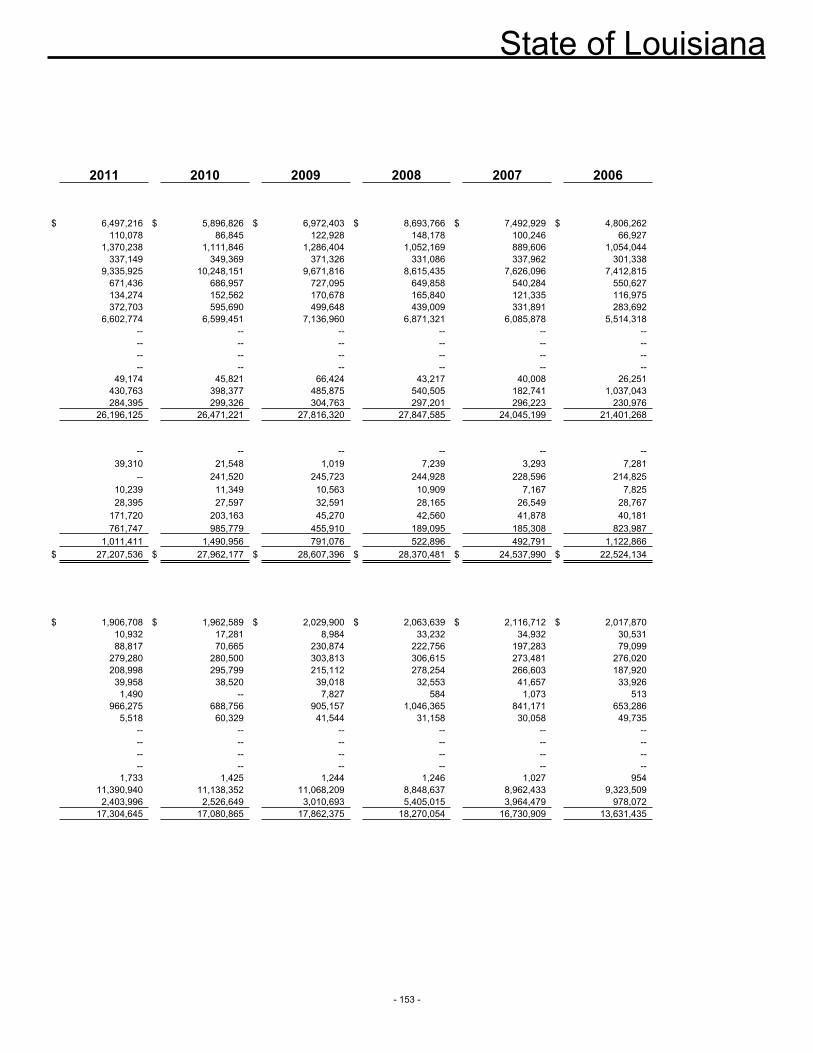
State of Louisiana
- 153 -
2011 2010 2009 2008 2007 2006
$ 6,497,216 $ 5,896,826 $ 6,972,403 $ 8,693,766 $ 7,492,929 $ 4,806,262110,078 86,845 122,928 148,178 100,246 66,927
1,370,238 1,111,846 1,286,404 1,052,169 889,606 1,054,044337,149 349,369 371,326 331,086 337,962 301,338
9,335,925 10,248,151 9,671,816 8,615,435 7,626,096 7,412,815671,436 686,957 727,095 649,858 540,284 550,627134,274 152,562 170,678 165,840 121,335 116,975372,703 595,690 499,648 439,009 331,891 283,692
6,602,774 6,599,451 7,136,960 6,871,321 6,085,878 5,514,318-- -- -- -- -- ---- -- -- -- -- ---- -- -- -- -- ---- -- -- -- -- --
49,174 45,821 66,424 43,217 40,008 26,251430,763 398,377 485,875 540,505 182,741 1,037,043284,395 299,326 304,763 297,201 296,223 230,976
26,196,125 26,471,221 27,816,320 27,847,585 24,045,199 21,401,268
-- -- -- -- -- --39,310 21,548 1,019 7,239 3,293 7,281
-- 241,520 245,723 244,928 228,596 214,82510,239 11,349 10,563 10,909 7,167 7,82528,395 27,597 32,591 28,165 26,549 28,767
171,720 203,163 45,270 42,560 41,878 40,181761,747 985,779 455,910 189,095 185,308 823,987
1,011,411 1,490,956 791,076 522,896 492,791 1,122,866$ 27,207,536 $ 27,962,177 $ 28,607,396 $ 28,370,481 $ 24,537,990 $ 22,524,134
$ 1,906,708 $ 1,962,589 $ 2,029,900 $ 2,063,639 $ 2,116,712 $ 2,017,87010,932 17,281 8,984 33,232 34,932 30,53188,817 70,665 230,874 222,756 197,283 79,099
279,280 280,500 303,813 306,615 273,481 276,020208,998 295,799 215,112 278,254 266,603 187,920
39,958 38,520 39,018 32,553 41,657 33,9261,490 -- 7,827 584 1,073 513
966,275 688,756 905,157 1,046,365 841,171 653,2865,518 60,329 41,544 31,158 30,058 49,735
-- -- -- -- -- ---- -- -- -- -- ---- -- -- -- -- ---- -- -- -- -- --
1,733 1,425 1,244 1,246 1,027 95411,390,940 11,138,352 11,068,209 8,848,637 8,962,433 9,323,509
2,403,996 2,526,649 3,010,693 5,405,015 3,964,479 978,07217,304,645 17,080,865 17,862,375 18,270,054 16,730,909 13,631,435
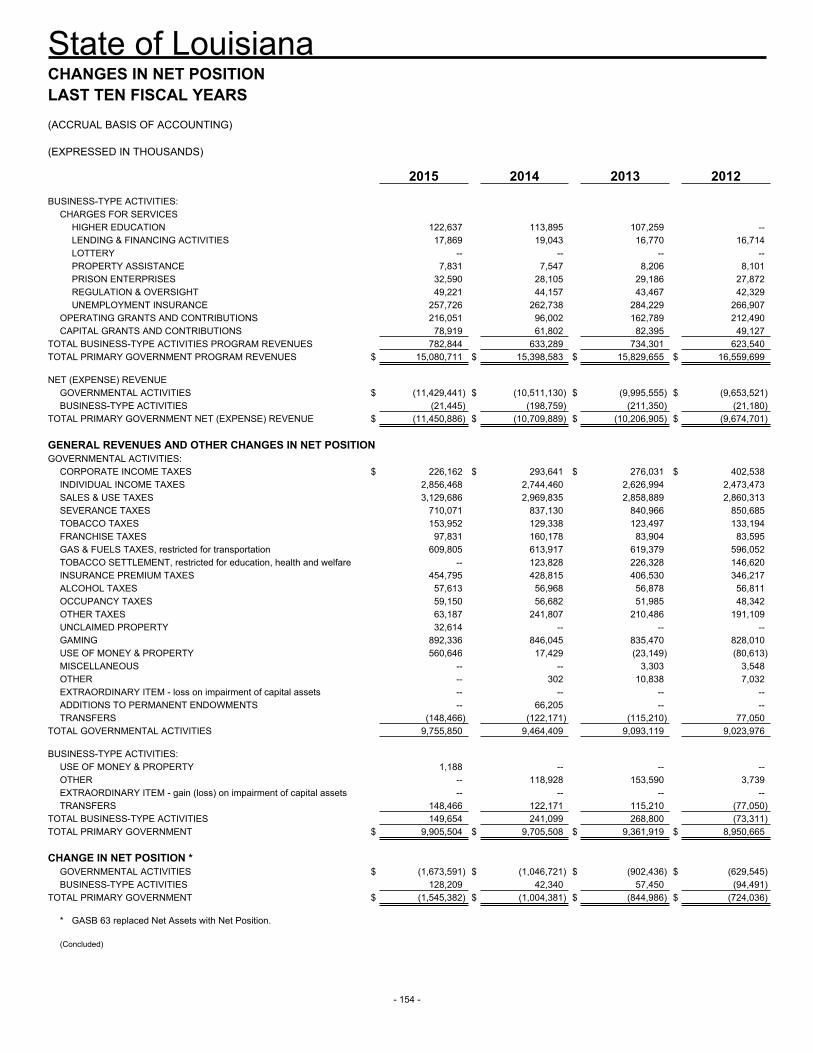
State of Louisiana
- 154 -
CHANGES IN NET POSITIONLAST TEN FISCAL YEARS
(ACCRUAL BASIS OF ACCOUNTING)
(EXPRESSED IN THOUSANDS)
2015 2014 2013 2012
BUSINESS-TYPE ACTIVITIES:CHARGES FOR SERVICES
HIGHER EDUCATION 122,637 113,895 107,259 --LENDING & FINANCING ACTIVITIES 17,869 19,043 16,770 16,714LOTTERY -- -- -- --PROPERTY ASSISTANCE 7,831 7,547 8,206 8,101PRISON ENTERPRISES 32,590 28,105 29,186 27,872REGULATION & OVERSIGHT 49,221 44,157 43,467 42,329UNEMPLOYMENT INSURANCE 257,726 262,738 284,229 266,907
OPERATING GRANTS AND CONTRIBUTIONS 216,051 96,002 162,789 212,490CAPITAL GRANTS AND CONTRIBUTIONS 78,919 61,802 82,395 49,127
TOTAL BUSINESS-TYPE ACTIVITIES PROGRAM REVENUES 782,844 633,289 734,301 623,540TOTAL PRIMARY GOVERNMENT PROGRAM REVENUES $ 15,080,711 $ 15,398,583 $ 15,829,655 $ 16,559,699
NET (EXPENSE) REVENUEGOVERNMENTAL ACTIVITIES $ (11,429,441) $ (10,511,130) $ (9,995,555) $ (9,653,521)BUSINESS-TYPE ACTIVITIES (21,445) (198,759) (211,350) (21,180)
TOTAL PRIMARY GOVERNMENT NET (EXPENSE) REVENUE $ (11,450,886) $ (10,709,889) $ (10,206,905) $ (9,674,701)
GENERAL REVENUES AND OTHER CHANGES IN NET POSITIONGOVERNMENTAL ACTIVITIES:
CORPORATE INCOME TAXES $ 226,162 $ 293,641 $ 276,031 $ 402,538INDIVIDUAL INCOME TAXES 2,856,468 2,744,460 2,626,994 2,473,473SALES & USE TAXES 3,129,686 2,969,835 2,858,889 2,860,313SEVERANCE TAXES 710,071 837,130 840,966 850,685TOBACCO TAXES 153,952 129,338 123,497 133,194FRANCHISE TAXES 97,831 160,178 83,904 83,595GAS & FUELS TAXES, restricted for transportation 609,805 613,917 619,379 596,052TOBACCO SETTLEMENT, restricted for education, health and welfare -- 123,828 226,328 146,620INSURANCE PREMIUM TAXES 454,795 428,815 406,530 346,217ALCOHOL TAXES 57,613 56,968 56,878 56,811OCCUPANCY TAXES 59,150 56,682 51,985 48,342OTHER TAXES 63,187 241,807 210,486 191,109UNCLAIMED PROPERTY 32,614 -- -- --GAMING 892,336 846,045 835,470 828,010USE OF MONEY & PROPERTY 560,646 17,429 (23,149) (80,613)MISCELLANEOUS -- -- 3,303 3,548OTHER -- 302 10,838 7,032EXTRAORDINARY ITEM - loss on impairment of capital assets -- -- -- --ADDITIONS TO PERMANENT ENDOWMENTS -- 66,205 -- --TRANSFERS (148,466) (122,171) (115,210) 77,050
TOTAL GOVERNMENTAL ACTIVITIES 9,755,850 9,464,409 9,093,119 9,023,976
BUSINESS-TYPE ACTIVITIES:USE OF MONEY & PROPERTY 1,188 -- -- --OTHER -- 118,928 153,590 3,739EXTRAORDINARY ITEM - gain (loss) on impairment of capital assets -- -- -- --TRANSFERS 148,466 122,171 115,210 (77,050)
TOTAL BUSINESS-TYPE ACTIVITIES 149,654 241,099 268,800 (73,311)TOTAL PRIMARY GOVERNMENT $ 9,905,504 $ 9,705,508 $ 9,361,919 $ 8,950,665
CHANGE IN NET POSITION *GOVERNMENTAL ACTIVITIES $ (1,673,591) $ (1,046,721) $ (902,436) $ (629,545)BUSINESS-TYPE ACTIVITIES 128,209 42,340 57,450 (94,491)
TOTAL PRIMARY GOVERNMENT $ (1,545,382) $ (1,004,381) $ (844,986) $ (724,036)
* GASB 63 replaced Net Assets with Net Position.
(Concluded)
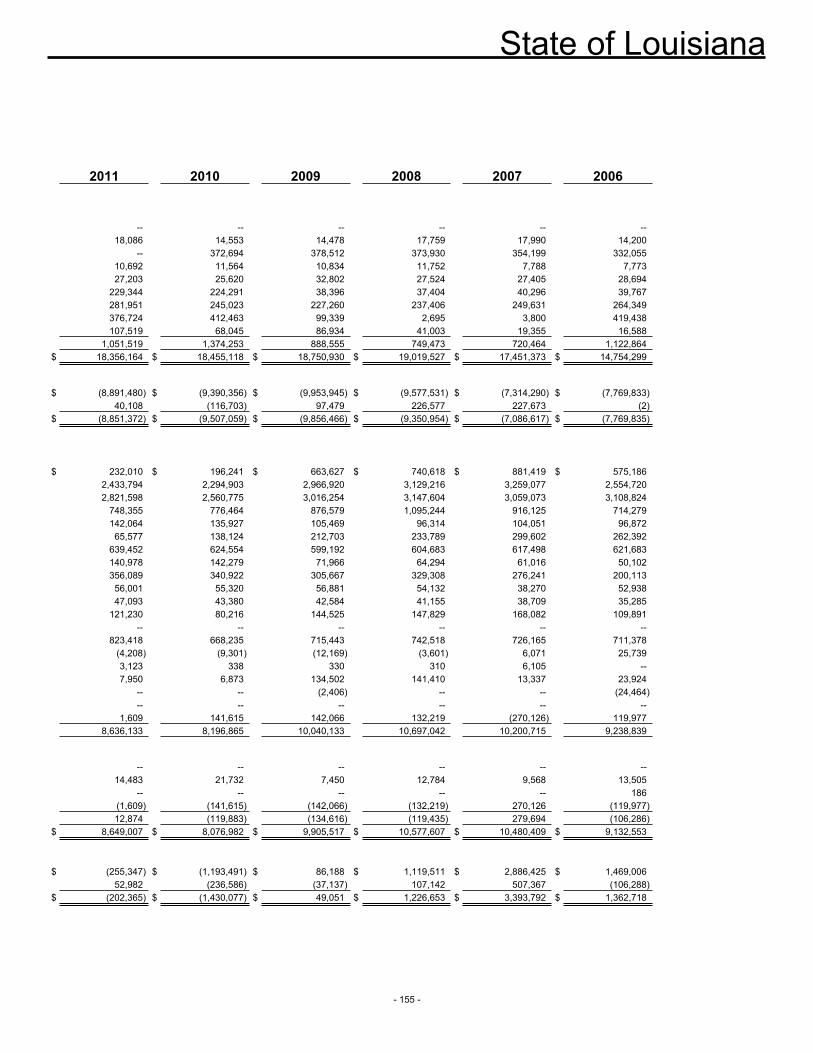
State of Louisiana
- 155 -
2011 2010 2009 2008 2007 2006
-- -- -- -- -- --18,086 14,553 14,478 17,759 17,990 14,200
-- 372,694 378,512 373,930 354,199 332,05510,692 11,564 10,834 11,752 7,788 7,77327,203 25,620 32,802 27,524 27,405 28,694
229,344 224,291 38,396 37,404 40,296 39,767281,951 245,023 227,260 237,406 249,631 264,349376,724 412,463 99,339 2,695 3,800 419,438107,519 68,045 86,934 41,003 19,355 16,588
1,051,519 1,374,253 888,555 749,473 720,464 1,122,864$ 18,356,164 $ 18,455,118 $ 18,750,930 $ 19,019,527 $ 17,451,373 $ 14,754,299
$ (8,891,480) $ (9,390,356) $ (9,953,945) $ (9,577,531) $ (7,314,290) $ (7,769,833)40,108 (116,703) 97,479 226,577 227,673 (2)
$ (8,851,372) $ (9,507,059) $ (9,856,466) $ (9,350,954) $ (7,086,617) $ (7,769,835)
$ 232,010 $ 196,241 $ 663,627 $ 740,618 $ 881,419 $ 575,1862,433,794 2,294,903 2,966,920 3,129,216 3,259,077 2,554,7202,821,598 2,560,775 3,016,254 3,147,604 3,059,073 3,108,824
748,355 776,464 876,579 1,095,244 916,125 714,279142,064 135,927 105,469 96,314 104,051 96,872
65,577 138,124 212,703 233,789 299,602 262,392639,452 624,554 599,192 604,683 617,498 621,683140,978 142,279 71,966 64,294 61,016 50,102356,089 340,922 305,667 329,308 276,241 200,113
56,001 55,320 56,881 54,132 38,270 52,93847,093 43,380 42,584 41,155 38,709 35,285
121,230 80,216 144,525 147,829 168,082 109,891-- -- -- -- -- --
823,418 668,235 715,443 742,518 726,165 711,378(4,208) (9,301) (12,169) (3,601) 6,071 25,7393,123 338 330 310 6,105 --7,950 6,873 134,502 141,410 13,337 23,924
-- -- (2,406) -- -- (24,464)-- -- -- -- -- --
1,609 141,615 142,066 132,219 (270,126) 119,9778,636,133 8,196,865 10,040,133 10,697,042 10,200,715 9,238,839
-- -- -- -- -- --14,483 21,732 7,450 12,784 9,568 13,505
-- -- -- -- -- 186(1,609) (141,615) (142,066) (132,219) 270,126 (119,977)12,874 (119,883) (134,616) (119,435) 279,694 (106,286)
$ 8,649,007 $ 8,076,982 $ 9,905,517 $ 10,577,607 $ 10,480,409 $ 9,132,553
$ (255,347) $ (1,193,491) $ 86,188 $ 1,119,511 $ 2,886,425 $ 1,469,00652,982 (236,586) (37,137) 107,142 507,367 (106,288)
$ (202,365) $ (1,430,077) $ 49,051 $ 1,226,653 $ 3,393,792 $ 1,362,718
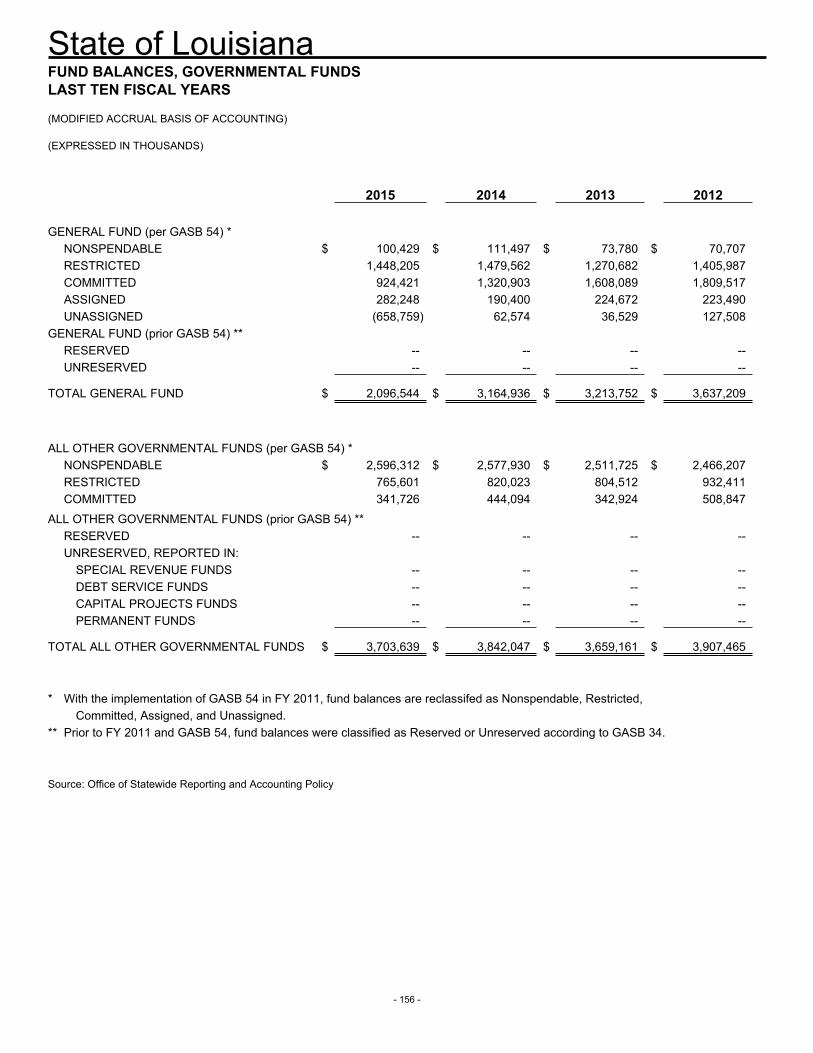
State of Louisiana
- 156 -
FUND BALANCES, GOVERNMENTAL FUNDSLAST TEN FISCAL YEARS
(MODIFIED ACCRUAL BASIS OF ACCOUNTING)
(EXPRESSED IN THOUSANDS)
2015 2014 2013 2012
GENERAL FUND (per GASB 54) *NONSPENDABLE $ 100,429 $ 111,497 $ 73,780 $ 70,707RESTRICTED 1,448,205 1,479,562 1,270,682 1,405,987COMMITTED 924,421 1,320,903 1,608,089 1,809,517ASSIGNED 282,248 190,400 224,672 223,490UNASSIGNED (658,759) 62,574 36,529 127,508
GENERAL FUND (prior GASB 54) **RESERVED -- -- -- --UNRESERVED -- -- -- --
TOTAL GENERAL FUND $ 2,096,544 $ 3,164,936 $ 3,213,752 $ 3,637,209
ALL OTHER GOVERNMENTAL FUNDS (per GASB 54) *NONSPENDABLE $ 2,596,312 $ 2,577,930 $ 2,511,725 $ 2,466,207RESTRICTED 765,601 820,023 804,512 932,411COMMITTED 341,726 444,094 342,924 508,847
ALL OTHER GOVERNMENTAL FUNDS (prior GASB 54) **RESERVED -- -- -- --UNRESERVED, REPORTED IN:
SPECIAL REVENUE FUNDS -- -- -- --DEBT SERVICE FUNDS -- -- -- --CAPITAL PROJECTS FUNDS -- -- -- --PERMANENT FUNDS -- -- -- --
TOTAL ALL OTHER GOVERNMENTAL FUNDS $ 3,703,639 $ 3,842,047 $ 3,659,161 $ 3,907,465
* With the implementation of GASB 54 in FY 2011, fund balances are reclassifed as Nonspendable, Restricted,Committed, Assigned, and Unassigned.
** Prior to FY 2011 and GASB 54, fund balances were classified as Reserved or Unreserved according to GASB 34.
Source: Office of Statewide Reporting and Accounting Policy
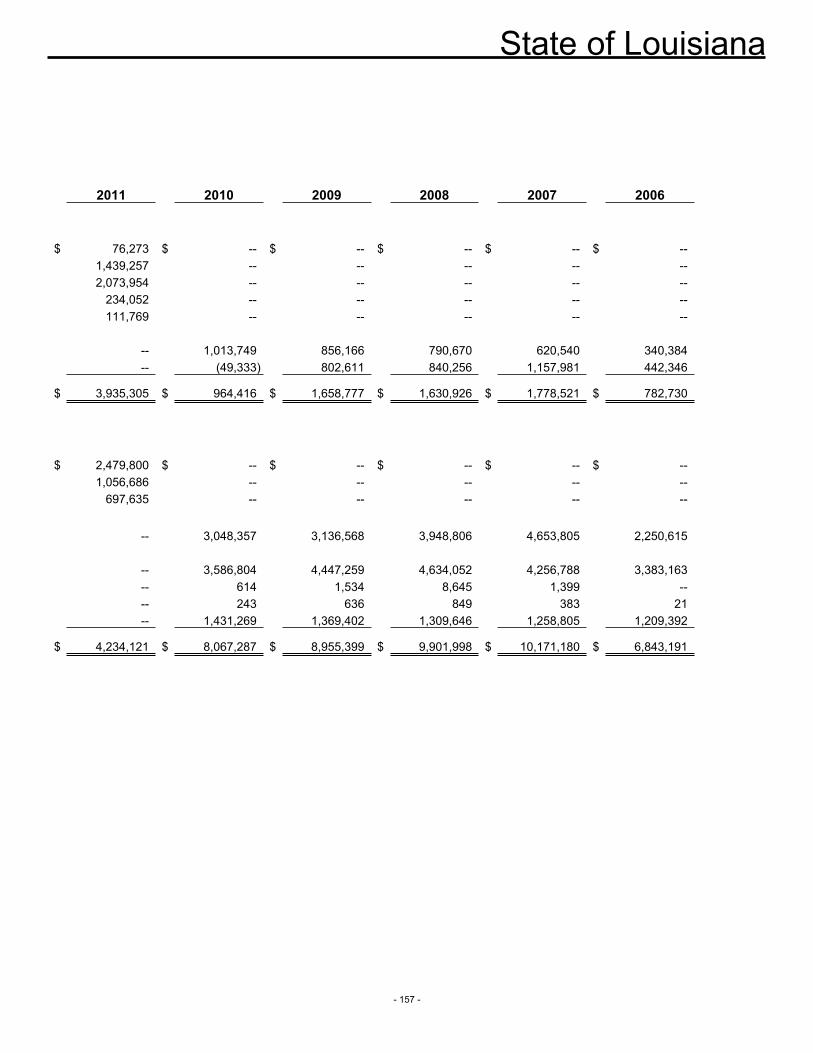
State of Louisiana
- 157 -
2011 2010 2009 2008 2007 2006
$ 76,273 $ -- $ -- $ -- $ -- $ --1,439,257 -- -- -- -- --2,073,954 -- -- -- -- --
234,052 -- -- -- -- --111,769 -- -- -- -- --
-- 1,013,749 856,166 790,670 620,540 340,384-- (49,333) 802,611 840,256 1,157,981 442,346
$ 3,935,305 $ 964,416 $ 1,658,777 $ 1,630,926 $ 1,778,521 $ 782,730
$ 2,479,800 $ -- $ -- $ -- $ -- $ --1,056,686 -- -- -- -- --
697,635 -- -- -- -- --
-- 3,048,357 3,136,568 3,948,806 4,653,805 2,250,615
-- 3,586,804 4,447,259 4,634,052 4,256,788 3,383,163-- 614 1,534 8,645 1,399 ---- 243 636 849 383 21-- 1,431,269 1,369,402 1,309,646 1,258,805 1,209,392
$ 4,234,121 $ 8,067,287 $ 8,955,399 $ 9,901,998 $ 10,171,180 $ 6,843,191
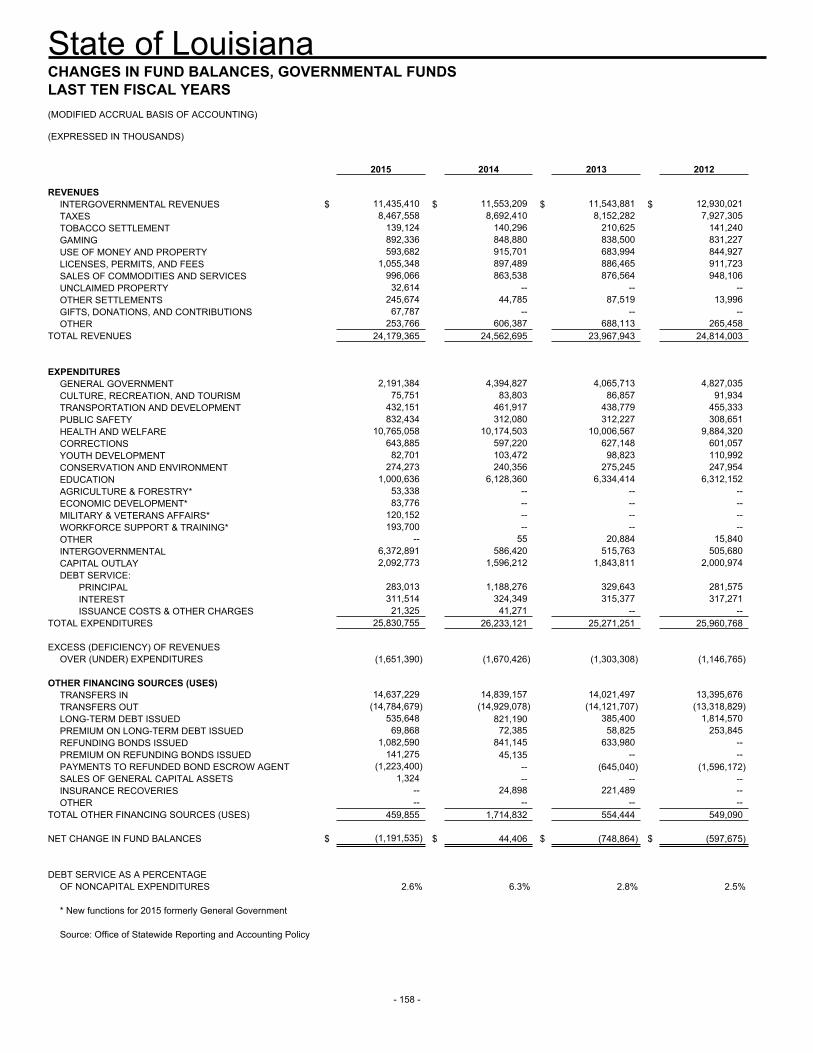
State of Louisiana
- 158 -
CHANGES IN FUND BALANCES, GOVERNMENTAL FUNDSLAST TEN FISCAL YEARS(MODIFIED ACCRUAL BASIS OF ACCOUNTING)
(EXPRESSED IN THOUSANDS)
2015 2014 2013 2012
REVENUESINTERGOVERNMENTAL REVENUES $ 11,435,410 $ 11,553,209 $ 11,543,881 $ 12,930,021TAXES 8,467,558 8,692,410 8,152,282 7,927,305TOBACCO SETTLEMENT 139,124 140,296 210,625 141,240GAMING 892,336 848,880 838,500 831,227USE OF MONEY AND PROPERTY 593,682 915,701 683,994 844,927LICENSES, PERMITS, AND FEES 1,055,348 897,489 886,465 911,723SALES OF COMMODITIES AND SERVICES 996,066 863,538 876,564 948,106UNCLAIMED PROPERTY 32,614 -- -- --OTHER SETTLEMENTS 245,674 44,785 87,519 13,996GIFTS, DONATIONS, AND CONTRIBUTIONS 67,787 -- -- --OTHER 253,766 606,387 688,113 265,458
TOTAL REVENUES 24,179,365 24,562,695 23,967,943 24,814,003
EXPENDITURESGENERAL GOVERNMENT 2,191,384 4,394,827 4,065,713 4,827,035CULTURE, RECREATION, AND TOURISM 75,751 83,803 86,857 91,934TRANSPORTATION AND DEVELOPMENT 432,151 461,917 438,779 455,333PUBLIC SAFETY 832,434 312,080 312,227 308,651HEALTH AND WELFARE 10,765,058 10,174,503 10,006,567 9,884,320CORRECTIONS 643,885 597,220 627,148 601,057YOUTH DEVELOPMENT 82,701 103,472 98,823 110,992CONSERVATION AND ENVIRONMENT 274,273 240,356 275,245 247,954EDUCATION 1,000,636 6,128,360 6,334,414 6,312,152AGRICULTURE & FORESTRY* 53,338 -- -- --ECONOMIC DEVELOPMENT* 83,776 -- -- --MILITARY & VETERANS AFFAIRS* 120,152 -- -- --WORKFORCE SUPPORT & TRAINING* 193,700 -- -- --OTHER -- 55 20,884 15,840INTERGOVERNMENTAL 6,372,891 586,420 515,763 505,680CAPITAL OUTLAY 2,092,773 1,596,212 1,843,811 2,000,974DEBT SERVICE:
PRINCIPAL 283,013 1,188,276 329,643 281,575INTEREST 311,514 324,349 315,377 317,271ISSUANCE COSTS & OTHER CHARGES 21,325 41,271 -- --
TOTAL EXPENDITURES 25,830,755 26,233,121 25,271,251 25,960,768
EXCESS (DEFICIENCY) OF REVENUESOVER (UNDER) EXPENDITURES (1,651,390) (1,670,426) (1,303,308) (1,146,765)
OTHER FINANCING SOURCES (USES)TRANSFERS IN 14,637,229 14,839,157 14,021,497 13,395,676TRANSFERS OUT (14,784,679) (14,929,078) (14,121,707) (13,318,829)LONG-TERM DEBT ISSUED 535,648 821,190 385,400 1,814,570PREMIUM ON LONG-TERM DEBT ISSUED 69,868 72,385 58,825 253,845REFUNDING BONDS ISSUED 1,082,590 841,145 633,980 --PREMIUM ON REFUNDING BONDS ISSUED 141,275 45,135 -- --PAYMENTS TO REFUNDED BOND ESCROW AGENT (1,223,400) -- (645,040) (1,596,172)SALES OF GENERAL CAPITAL ASSETS 1,324 -- -- --INSURANCE RECOVERIES -- 24,898 221,489 --OTHER -- -- -- --
TOTAL OTHER FINANCING SOURCES (USES) 459,855 1,714,832 554,444 549,090
NET CHANGE IN FUND BALANCES $ (1,191,535) $ 44,406 $ (748,864) $ (597,675)
DEBT SERVICE AS A PERCENTAGEOF NONCAPITAL EXPENDITURES 2.6% 6.3% 2.8% 2.5%
* New functions for 2015 formerly General Government
Source: Office of Statewide Reporting and Accounting Policy
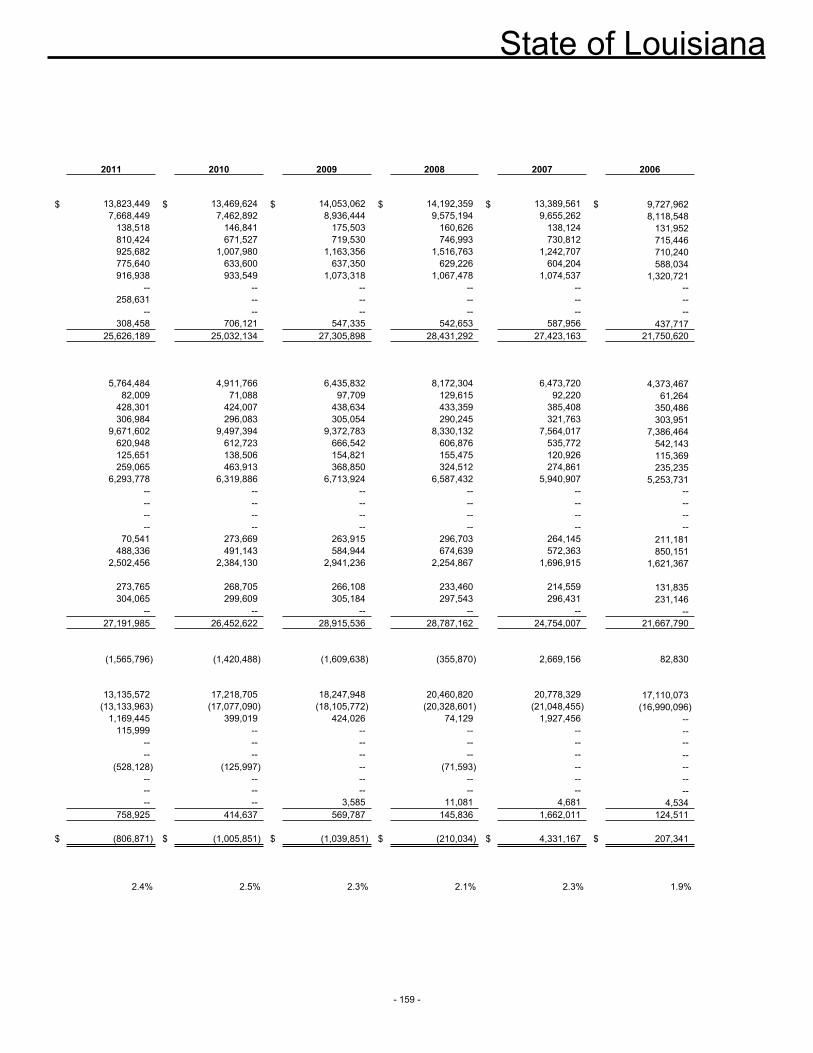
State of Louisiana
- 159 -
2011 2010 2009 2008 2007 2006
$ 13,823,449 $ 13,469,624 $ 14,053,062 $ 14,192,359 $ 13,389,561 $ 9,727,9627,668,449 7,462,892 8,936,444 9,575,194 9,655,262 8,118,548
138,518 146,841 175,503 160,626 138,124 131,952810,424 671,527 719,530 746,993 730,812 715,446925,682 1,007,980 1,163,356 1,516,763 1,242,707 710,240775,640 633,600 637,350 629,226 604,204 588,034916,938 933,549 1,073,318 1,067,478 1,074,537 1,320,721
-- -- -- -- -- --258,631 -- -- -- -- --
-- -- -- -- -- --308,458 706,121 547,335 542,653 587,956 437,717
25,626,189 25,032,134 27,305,898 28,431,292 27,423,163 21,750,620
5,764,484 4,911,766 6,435,832 8,172,304 6,473,720 4,373,46782,009 71,088 97,709 129,615 92,220 61,264
428,301 424,007 438,634 433,359 385,408 350,486306,984 296,083 305,054 290,245 321,763 303,951
9,671,602 9,497,394 9,372,783 8,330,132 7,564,017 7,386,464620,948 612,723 666,542 606,876 535,772 542,143125,651 138,506 154,821 155,475 120,926 115,369259,065 463,913 368,850 324,512 274,861 235,235
6,293,778 6,319,886 6,713,924 6,587,432 5,940,907 5,253,731-- -- -- -- -- ---- -- -- -- -- ---- -- -- -- -- ---- -- -- -- -- --
70,541 273,669 263,915 296,703 264,145 211,181488,336 491,143 584,944 674,639 572,363 850,151
2,502,456 2,384,130 2,941,236 2,254,867 1,696,915 1,621,367
273,765 268,705 266,108 233,460 214,559 131,835304,065 299,609 305,184 297,543 296,431 231,146
-- -- -- -- -- --27,191,985 26,452,622 28,915,536 28,787,162 24,754,007 21,667,790
(1,565,796) (1,420,488) (1,609,638) (355,870) 2,669,156 82,830
13,135,572 17,218,705 18,247,948 20,460,820 20,778,329 17,110,073(13,133,963) (17,077,090) (18,105,772) (20,328,601) (21,048,455) (16,990,096)
1,169,445 399,019 424,026 74,129 1,927,456 --115,999 -- -- -- -- --
-- -- -- -- -- ---- -- -- -- -- --
(528,128) (125,997) -- (71,593) -- ---- -- -- -- -- ---- -- -- -- -- ---- -- 3,585 11,081 4,681 4,534
758,925 414,637 569,787 145,836 1,662,011 124,511
$ (806,871) $ (1,005,851) $ (1,039,851) $ (210,034) $ 4,331,167 $ 207,341
2.4% 2.5% 2.3% 2.1% 2.3% 1.9%
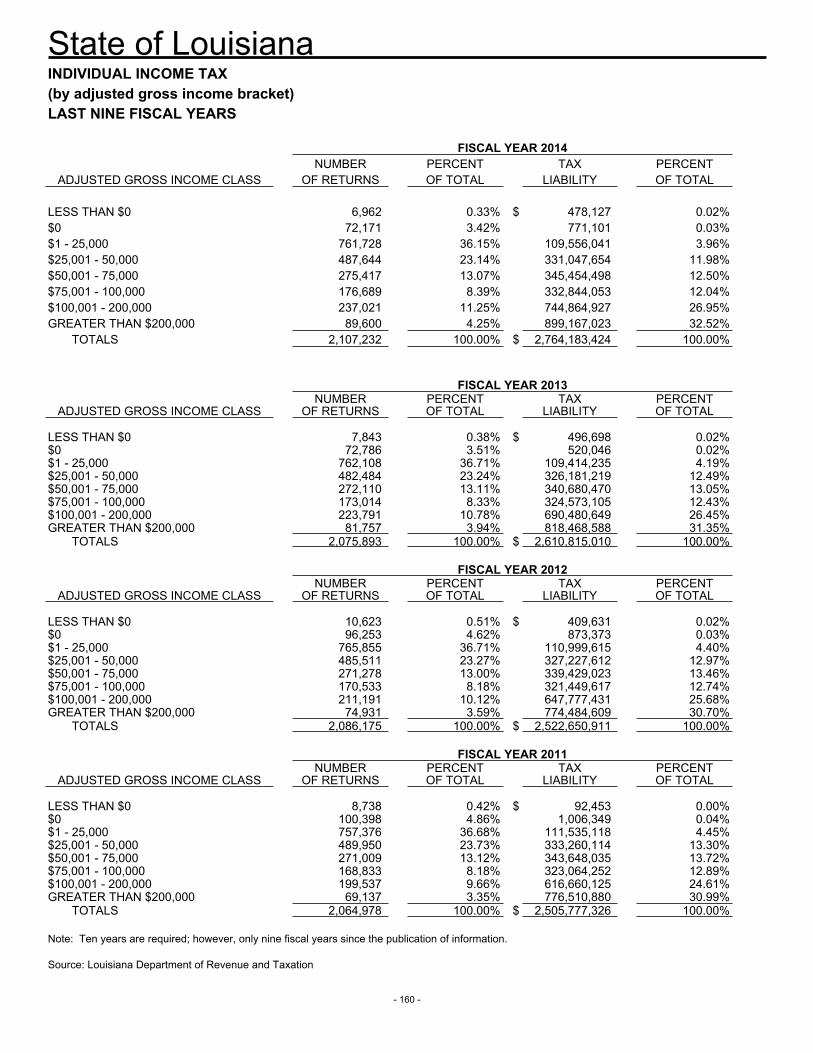
State of Louisiana
- 160 -
INDIVIDUAL INCOME TAX(by adjusted gross income bracket)LAST NINE FISCAL YEARS
FISCAL YEAR 2014NUMBER PERCENT TAX PERCENT
ADJUSTED GROSS INCOME CLASS OF RETURNS OF TOTAL LIABILITY OF TOTAL
LESS THAN $0 6,962 0.33% $ 478,127 0.02%$0 72,171 3.42% 771,101 0.03%$1 - 25,000 761,728 36.15% 109,556,041 3.96%$25,001 - 50,000 487,644 23.14% 331,047,654 11.98%$50,001 - 75,000 275,417 13.07% 345,454,498 12.50%$75,001 - 100,000 176,689 8.39% 332,844,053 12.04%$100,001 - 200,000 237,021 11.25% 744,864,927 26.95%GREATER THAN $200,000 89,600 4.25% 899,167,023 32.52%
TOTALS 2,107,232 100.00% $ 2,764,183,424 100.00%
FISCAL YEAR 2013NUMBER PERCENT TAX PERCENT
ADJUSTED GROSS INCOME CLASS OF RETURNS OF TOTAL LIABILITY OF TOTAL
LESS THAN $0 7,843 0.38% $ 496,698 0.02%$0 72,786 3.51% 520,046 0.02%$1 - 25,000 762,108 36.71% 109,414,235 4.19%$25,001 - 50,000 482,484 23.24% 326,181,219 12.49%$50,001 - 75,000 272,110 13.11% 340,680,470 13.05%$75,001 - 100,000 173,014 8.33% 324,573,105 12.43%$100,001 - 200,000 223,791 10.78% 690,480,649 26.45%GREATER THAN $200,000 81,757 3.94% 818,468,588 31.35%
TOTALS 2,075,893 100.00% $ 2,610,815,010 100.00%
FISCAL YEAR 2012NUMBER PERCENT TAX PERCENT
ADJUSTED GROSS INCOME CLASS OF RETURNS OF TOTAL LIABILITY OF TOTAL
LESS THAN $0 10,623 0.51% $ 409,631 0.02%$0 96,253 4.62% 873,373 0.03%$1 - 25,000 765,855 36.71% 110,999,615 4.40%$25,001 - 50,000 485,511 23.27% 327,227,612 12.97%$50,001 - 75,000 271,278 13.00% 339,429,023 13.46%$75,001 - 100,000 170,533 8.18% 321,449,617 12.74%$100,001 - 200,000 211,191 10.12% 647,777,431 25.68%GREATER THAN $200,000 74,931 3.59% 774,484,609 30.70%
TOTALS 2,086,175 100.00% $ 2,522,650,911 100.00%
FISCAL YEAR 2011NUMBER PERCENT TAX PERCENT
ADJUSTED GROSS INCOME CLASS OF RETURNS OF TOTAL LIABILITY OF TOTAL
LESS THAN $0 8,738 0.42% $ 92,453 0.00%$0 100,398 4.86% 1,006,349 0.04%$1 - 25,000 757,376 36.68% 111,535,118 4.45%$25,001 - 50,000 489,950 23.73% 333,260,114 13.30%$50,001 - 75,000 271,009 13.12% 343,648,035 13.72%$75,001 - 100,000 168,833 8.18% 323,064,252 12.89%$100,001 - 200,000 199,537 9.66% 616,660,125 24.61%GREATER THAN $200,000 69,137 3.35% 776,510,880 30.99%
TOTALS 2,064,978 100.00% $ 2,505,777,326 100.00%
Note: Ten years are required; however, only nine fiscal years since the publication of information.
Source: Louisiana Department of Revenue and Taxation
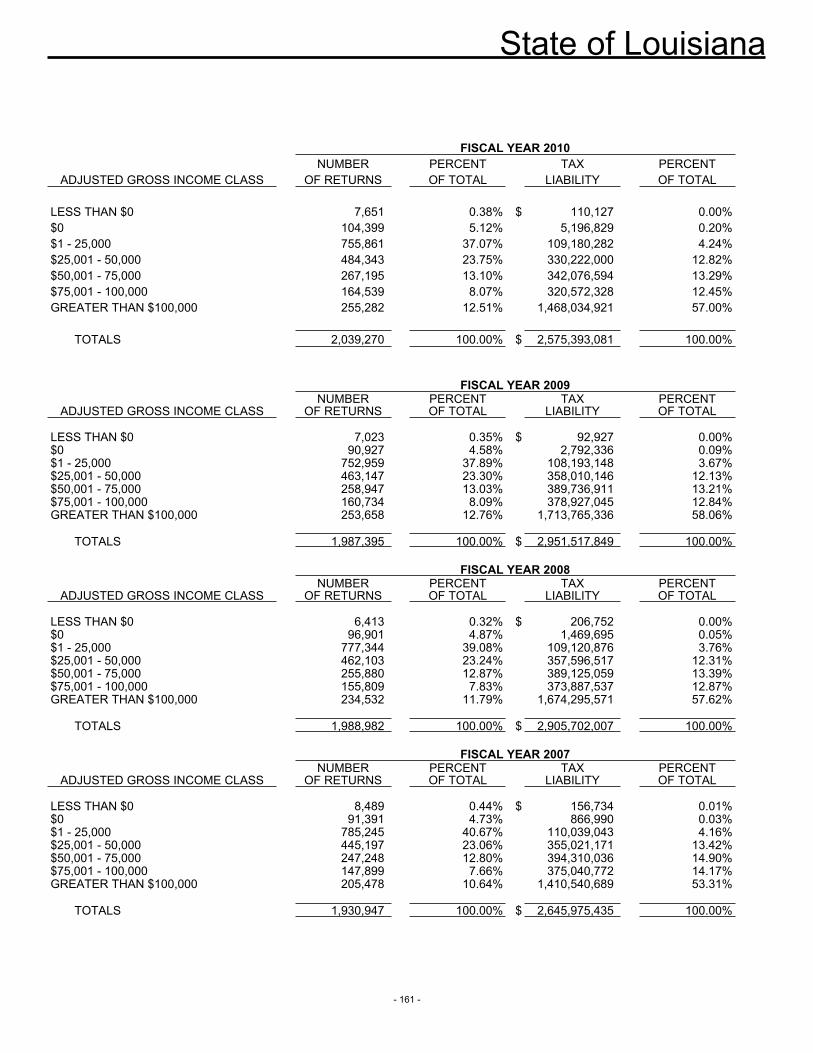
State of Louisiana
- 161 -
FISCAL YEAR 2010NUMBER PERCENT TAX PERCENT
ADJUSTED GROSS INCOME CLASS OF RETURNS OF TOTAL LIABILITY OF TOTAL
LESS THAN $0 7,651 0.38% $ 110,127 0.00%$0 104,399 5.12% 5,196,829 0.20%$1 - 25,000 755,861 37.07% 109,180,282 4.24%$25,001 - 50,000 484,343 23.75% 330,222,000 12.82%$50,001 - 75,000 267,195 13.10% 342,076,594 13.29%$75,001 - 100,000 164,539 8.07% 320,572,328 12.45%GREATER THAN $100,000 255,282 12.51% 1,468,034,921 57.00%
TOTALS 2,039,270 100.00% $ 2,575,393,081 100.00%
FISCAL YEAR 2009NUMBER PERCENT TAX PERCENT
ADJUSTED GROSS INCOME CLASS OF RETURNS OF TOTAL LIABILITY OF TOTAL
LESS THAN $0 7,023 0.35% $ 92,927 0.00%$0 90,927 4.58% 2,792,336 0.09%$1 - 25,000 752,959 37.89% 108,193,148 3.67%$25,001 - 50,000 463,147 23.30% 358,010,146 12.13%$50,001 - 75,000 258,947 13.03% 389,736,911 13.21%$75,001 - 100,000 160,734 8.09% 378,927,045 12.84%GREATER THAN $100,000 253,658 12.76% 1,713,765,336 58.06%
TOTALS 1,987,395 100.00% $ 2,951,517,849 100.00%
FISCAL YEAR 2008NUMBER PERCENT TAX PERCENT
ADJUSTED GROSS INCOME CLASS OF RETURNS OF TOTAL LIABILITY OF TOTAL
LESS THAN $0 6,413 0.32% $ 206,752 0.00%$0 96,901 4.87% 1,469,695 0.05%$1 - 25,000 777,344 39.08% 109,120,876 3.76%$25,001 - 50,000 462,103 23.24% 357,596,517 12.31%$50,001 - 75,000 255,880 12.87% 389,125,059 13.39%$75,001 - 100,000 155,809 7.83% 373,887,537 12.87%GREATER THAN $100,000 234,532 11.79% 1,674,295,571 57.62%
TOTALS 1,988,982 100.00% $ 2,905,702,007 100.00%
FISCAL YEAR 2007NUMBER PERCENT TAX PERCENT
ADJUSTED GROSS INCOME CLASS OF RETURNS OF TOTAL LIABILITY OF TOTAL
LESS THAN $0 8,489 0.44% $ 156,734 0.01%$0 91,391 4.73% 866,990 0.03%$1 - 25,000 785,245 40.67% 110,039,043 4.16%$25,001 - 50,000 445,197 23.06% 355,021,171 13.42%$50,001 - 75,000 247,248 12.80% 394,310,036 14.90%$75,001 - 100,000 147,899 7.66% 375,040,772 14.17%GREATER THAN $100,000 205,478 10.64% 1,410,540,689 53.31%
TOTALS 1,930,947 100.00% $ 2,645,975,435 100.00%
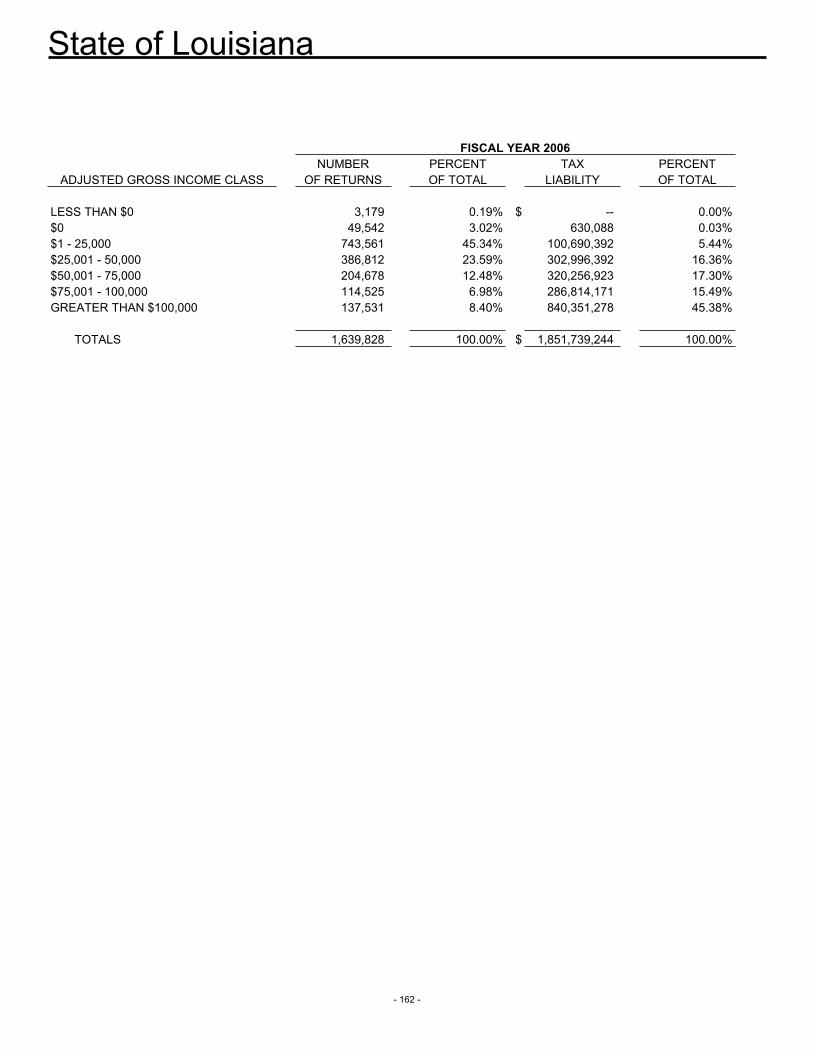
State of Louisiana
- 162 -
FISCAL YEAR 2006NUMBER PERCENT TAX PERCENT
ADJUSTED GROSS INCOME CLASS OF RETURNS OF TOTAL LIABILITY OF TOTAL
LESS THAN $0 3,179 0.19% $ -- 0.00%$0 49,542 3.02% 630,088 0.03%$1 - 25,000 743,561 45.34% 100,690,392 5.44%$25,001 - 50,000 386,812 23.59% 302,996,392 16.36%$50,001 - 75,000 204,678 12.48% 320,256,923 17.30%$75,001 - 100,000 114,525 6.98% 286,814,171 15.49%GREATER THAN $100,000 137,531 8.40% 840,351,278 45.38%
TOTALS 1,639,828 100.00% $ 1,851,739,244 100.00%
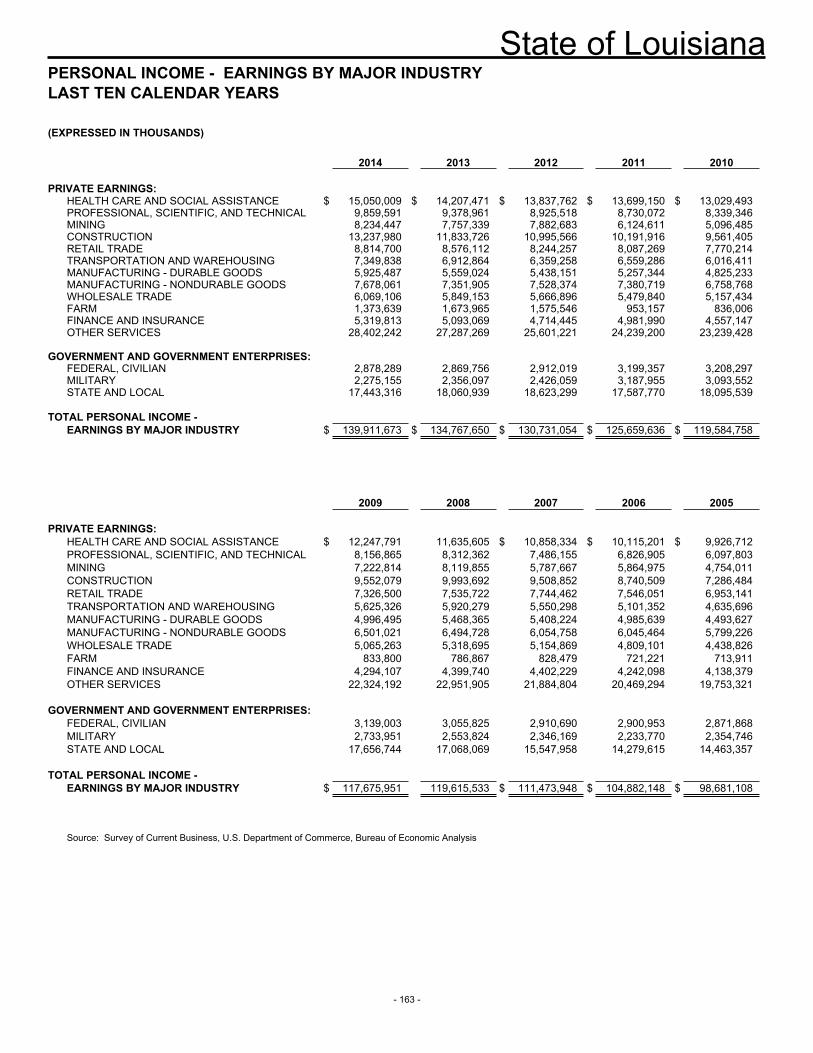
State of Louisiana
- 163 -
PERSONAL INCOME - EARNINGS BY MAJOR INDUSTRYLAST TEN CALENDAR YEARS
(EXPRESSED IN THOUSANDS)
2014 2013 2012 2011 2010
PRIVATE EARNINGS:HEALTH CARE AND SOCIAL ASSISTANCE $ 15,050,009 $ 14,207,471 $ 13,837,762 $ 13,699,150 $ 13,029,493PROFESSIONAL, SCIENTIFIC, AND TECHNICAL 9,859,591 9,378,961 8,925,518 8,730,072 8,339,346MINING 8,234,447 7,757,339 7,882,683 6,124,611 5,096,485CONSTRUCTION 13,237,980 11,833,726 10,995,566 10,191,916 9,561,405RETAIL TRADE 8,814,700 8,576,112 8,244,257 8,087,269 7,770,214TRANSPORTATION AND WAREHOUSING 7,349,838 6,912,864 6,359,258 6,559,286 6,016,411MANUFACTURING - DURABLE GOODS 5,925,487 5,559,024 5,438,151 5,257,344 4,825,233MANUFACTURING - NONDURABLE GOODS 7,678,061 7,351,905 7,528,374 7,380,719 6,758,768WHOLESALE TRADE 6,069,106 5,849,153 5,666,896 5,479,840 5,157,434FARM 1,373,639 1,673,965 1,575,546 953,157 836,006FINANCE AND INSURANCE 5,319,813 5,093,069 4,714,445 4,981,990 4,557,147OTHER SERVICES 28,402,242 27,287,269 25,601,221 24,239,200 23,239,428
GOVERNMENT AND GOVERNMENT ENTERPRISES:FEDERAL, CIVILIAN 2,878,289 2,869,756 2,912,019 3,199,357 3,208,297MILITARY 2,275,155 2,356,097 2,426,059 3,187,955 3,093,552STATE AND LOCAL 17,443,316 18,060,939 18,623,299 17,587,770 18,095,539
TOTAL PERSONAL INCOME - EARNINGS BY MAJOR INDUSTRY $ 139,911,673 $ 134,767,650 $ 130,731,054 $ 125,659,636 $ 119,584,758
2009 2008 2007 2006 2005
PRIVATE EARNINGS:HEALTH CARE AND SOCIAL ASSISTANCE $ 12,247,791 11,635,605 $ 10,858,334 $ 10,115,201 $ 9,926,712PROFESSIONAL, SCIENTIFIC, AND TECHNICAL 8,156,865 8,312,362 7,486,155 6,826,905 6,097,803MINING 7,222,814 8,119,855 5,787,667 5,864,975 4,754,011CONSTRUCTION 9,552,079 9,993,692 9,508,852 8,740,509 7,286,484RETAIL TRADE 7,326,500 7,535,722 7,744,462 7,546,051 6,953,141TRANSPORTATION AND WAREHOUSING 5,625,326 5,920,279 5,550,298 5,101,352 4,635,696MANUFACTURING - DURABLE GOODS 4,996,495 5,468,365 5,408,224 4,985,639 4,493,627MANUFACTURING - NONDURABLE GOODS 6,501,021 6,494,728 6,054,758 6,045,464 5,799,226WHOLESALE TRADE 5,065,263 5,318,695 5,154,869 4,809,101 4,438,826FARM 833,800 786,867 828,479 721,221 713,911FINANCE AND INSURANCE 4,294,107 4,399,740 4,402,229 4,242,098 4,138,379OTHER SERVICES 22,324,192 22,951,905 21,884,804 20,469,294 19,753,321
GOVERNMENT AND GOVERNMENT ENTERPRISES:FEDERAL, CIVILIAN 3,139,003 3,055,825 2,910,690 2,900,953 2,871,868MILITARY 2,733,951 2,553,824 2,346,169 2,233,770 2,354,746STATE AND LOCAL 17,656,744 17,068,069 15,547,958 14,279,615 14,463,357
TOTAL PERSONAL INCOME - EARNINGS BY MAJOR INDUSTRY $ 117,675,951 119,615,533 $ 111,473,948 $ 104,882,148 $ 98,681,108
Source: Survey of Current Business, U.S. Department of Commerce, Bureau of Economic Analysis
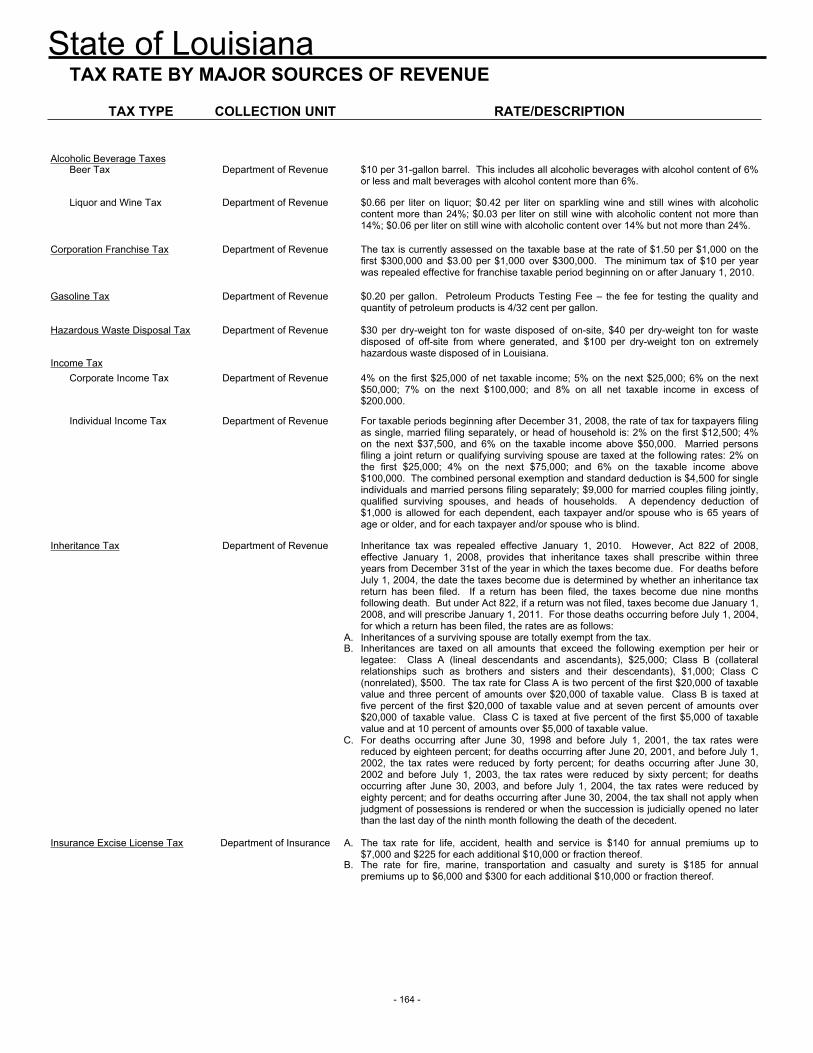
State of Louisiana
- 164 -
TAX RATE BY MAJOR SOURCES OF REVENUE
TAX TYPE COLLECTION UNIT RATE/DESCRIPTION
Alcoholic Beverage TaxesBeer Tax Department of Revenue $10 per 31-gallon barrel. This includes all alcoholic beverages with alcohol content of 6%
or less and malt beverages with alcohol content more than 6%.
Liquor and Wine Tax Department of Revenue $0.66 per liter on liquor; $0.42 per liter on sparkling wine and still wines with alcoholic content more than 24%; $0.03 per liter on still wine with alcoholic content not more than 14%; $0.06 per liter on still wine with alcoholic content over 14% but not more than 24%.
Corporation Franchise Tax Department of Revenue The tax is currently assessed on the taxable base at the rate of $1.50 per $1,000 on the first $300,000 and $3.00 per $1,000 over $300,000. The minimum tax of $10 per year was repealed effective for franchise taxable period beginning on or after January 1, 2010.
Gasoline Tax Department of Revenue $0.20 per gallon. Petroleum Products Testing Fee – the fee for testing the quality and quantity of petroleum products is 4/32 cent per gallon.
Hazardous Waste Disposal Tax Department of Revenue $30 per dry-weight ton for waste disposed of on-site, $40 per dry-weight ton for waste disposed of off-site from where generated, and $100 per dry-weight ton on extremely hazardous waste disposed of in Louisiana.
Income TaxCorporate Income Tax Department of Revenue 4% on the first $25,000 of net taxable income; 5% on the next $25,000; 6% on the next
$50,000; 7% on the next $100,000; and 8% on all net taxable income in excess of $200,000.
Individual Income Tax Department of Revenue For taxable periods beginning after December 31, 2008, the rate of tax for taxpayers filing as single, married filing separately, or head of household is: 2% on the first $12,500; 4% on the next $37,500, and 6% on the taxable income above $50,000. Married persons filing a joint return or qualifying surviving spouse are taxed at the following rates: 2% on the first $25,000; 4% on the next $75,000; and 6% on the taxable income above $100,000. The combined personal exemption and standard deduction is $4,500 for single individuals and married persons filing separately; $9,000 for married couples filing jointly, qualified surviving spouses, and heads of households. A dependency deduction of $1,000 is allowed for each dependent, each taxpayer and/or spouse who is 65 years of age or older, and for each taxpayer and/or spouse who is blind.
Inheritance Tax Department of Revenue Inheritance tax was repealed effective January 1, 2010. However, Act 822 of 2008, effective January 1, 2008, provides that inheritance taxes shall prescribe within three years from December 31st of the year in which the taxes become due. For deaths before July 1, 2004, the date the taxes become due is determined by whether an inheritance tax return has been filed. If a return has been filed, the taxes become due nine months following death. But under Act 822, if a return was not filed, taxes become due January 1, 2008, and will prescribe January 1, 2011. For those deaths occurring before July 1, 2004, for which a return has been filed, the rates are as follows:
A. Inheritances of a surviving spouse are totally exempt from the tax. B. Inheritances are taxed on all amounts that exceed the following exemption per heir or
legatee: Class A (lineal descendants and ascendants), $25,000; Class B (collateral relationships such as brothers and sisters and their descendants), $1,000; Class C (nonrelated), $500. The tax rate for Class A is two percent of the first $20,000 of taxable value and three percent of amounts over $20,000 of taxable value. Class B is taxed at five percent of the first $20,000 of taxable value and at seven percent of amounts over $20,000 of taxable value. Class C is taxed at five percent of the first $5,000 of taxable value and at 10 percent of amounts over $5,000 of taxable value.
C. For deaths occurring after June 30, 1998 and before July 1, 2001, the tax rates were reduced by eighteen percent; for deaths occurring after June 20, 2001, and before July 1, 2002, the tax rates were reduced by forty percent; for deaths occurring after June 30, 2002 and before July 1, 2003, the tax rates were reduced by sixty percent; for deaths occurring after June 30, 2003, and before July 1, 2004, the tax rates were reduced by eighty percent; and for deaths occurring after June 30, 2004, the tax shall not apply when judgment of possessions is rendered or when the succession is judicially opened no later than the last day of the ninth month following the death of the decedent.
Insurance Excise License Tax Department of Insurance A. The tax rate for life, accident, health and service is $140 for annual premiums up to $7,000 and $225 for each additional $10,000 or fraction thereof.
B. The rate for fire, marine, transportation and casualty and surety is $185 for annual premiums up to $6,000 and $300 for each additional $10,000 or fraction thereof.
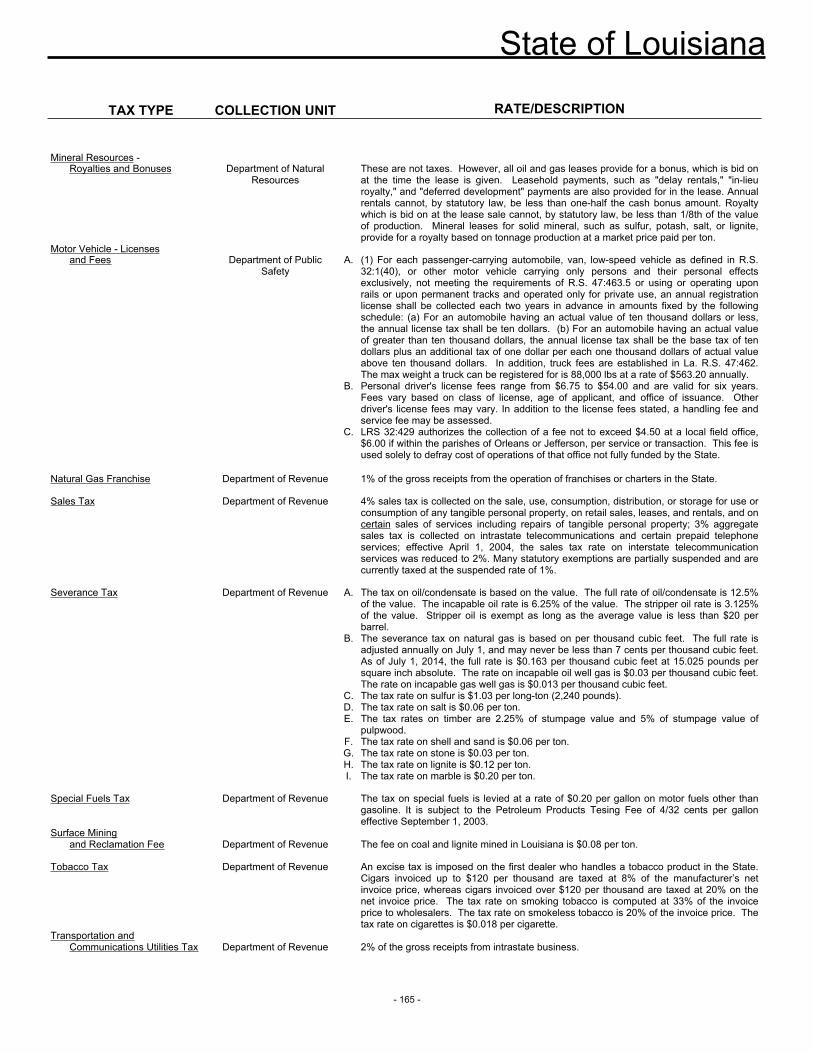
State of Louisiana
- 165 -
TAX TYPE COLLECTION UNIT RATE/DESCRIPTION
Mineral Resources -Royalties and Bonuses Department of Natural
ResourcesThese are not taxes. However, all oil and gas leases provide for a bonus, which is bid on at the time the lease is given. Leasehold payments, such as "delay rentals," "in-lieu royalty," and "deferred development" payments are also provided for in the lease. Annual rentals cannot, by statutory law, be less than one-half the cash bonus amount. Royalty which is bid on at the lease sale cannot, by statutory law, be less than 1/8th of the value of production. Mineral leases for solid mineral, such as sulfur, potash, salt, or lignite, provide for a royalty based on tonnage production at a market price paid per ton.
Motor Vehicle - Licensesand Fees Department of Public
SafetyA. (1) For each passenger-carrying automobile, van, low-speed vehicle as defined in R.S.
32:1(40), or other motor vehicle carrying only persons and their personal effects exclusively, not meeting the requirements of R.S. 47:463.5 or using or operating upon rails or upon permanent tracks and operated only for private use, an annual registration license shall be collected each two years in advance in amounts fixed by the following schedule: (a) For an automobile having an actual value of ten thousand dollars or less, the annual license tax shall be ten dollars. (b) For an automobile having an actual value of greater than ten thousand dollars, the annual license tax shall be the base tax of ten dollars plus an additional tax of one dollar per each one thousand dollars of actual value above ten thousand dollars. In addition, truck fees are established in La. R.S. 47:462. The max weight a truck can be registered for is 88,000 lbs at a rate of $563.20 annually.
B. Personal driver's license fees range from $6.75 to $54.00 and are valid for six years. Fees vary based on class of license, age of applicant, and office of issuance. Other driver's license fees may vary. In addition to the license fees stated, a handling fee and service fee may be assessed.
C. LRS 32:429 authorizes the collection of a fee not to exceed $4.50 at a local field office, $6.00 if within the parishes of Orleans or Jefferson, per service or transaction. This fee is used solely to defray cost of operations of that office not fully funded by the State.
Natural Gas Franchise Department of Revenue 1% of the gross receipts from the operation of franchises or charters in the State.
Sales Tax Department of Revenue 4% sales tax is collected on the sale, use, consumption, distribution, or storage for use or consumption of any tangible personal property, on retail sales, leases, and rentals, and on certain sales of services including repairs of tangible personal property; 3% aggregate sales tax is collected on intrastate telecommunications and certain prepaid telephone services; effective April 1, 2004, the sales tax rate on interstate telecommunication services was reduced to 2%. Many statutory exemptions are partially suspended and are currently taxed at the suspended rate of 1%.
Severance Tax Department of Revenue A. The tax on oil/condensate is based on the value. The full rate of oil/condensate is 12.5% of the value. The incapable oil rate is 6.25% of the value. The stripper oil rate is 3.125% of the value. Stripper oil is exempt as long as the average value is less than $20 per barrel.
B. The severance tax on natural gas is based on per thousand cubic feet. The full rate is adjusted annually on July 1, and may never be less than 7 cents per thousand cubic feet. As of July 1, 2014, the full rate is $0.163 per thousand cubic feet at 15.025 pounds per square inch absolute. The rate on incapable oil well gas is $0.03 per thousand cubic feet. The rate on incapable gas well gas is $0.013 per thousand cubic feet.
C. The tax rate on sulfur is $1.03 per long-ton (2,240 pounds).D. The tax rate on salt is $0.06 per ton.E. The tax rates on timber are 2.25% of stumpage value and 5% of stumpage value of
pulpwood.F. The tax rate on shell and sand is $0.06 per ton. G. The tax rate on stone is $0.03 per ton.H. The tax rate on lignite is $0.12 per ton.I. The tax rate on marble is $0.20 per ton.
Special Fuels Tax Department of Revenue The tax on special fuels is levied at a rate of $0.20 per gallon on motor fuels other than gasoline. It is subject to the Petroleum Products Tesing Fee of 4/32 cents per gallon effective September 1, 2003.
Surface Miningand Reclamation Fee Department of Revenue The fee on coal and lignite mined in Louisiana is $0.08 per ton.
Tobacco Tax Department of Revenue An excise tax is imposed on the first dealer who handles a tobacco product in the State. Cigars invoiced up to $120 per thousand are taxed at 8% of the manufacturer’s net invoice price, whereas cigars invoiced over $120 per thousand are taxed at 20% on the net invoice price. The tax rate on smoking tobacco is computed at 33% of the invoice price to wholesalers. The tax rate on smokeless tobacco is 20% of the invoice price. The tax rate on cigarettes is $0.018 per cigarette.
Transportation and Communications Utilities Tax Department of Revenue 2% of the gross receipts from intrastate business.
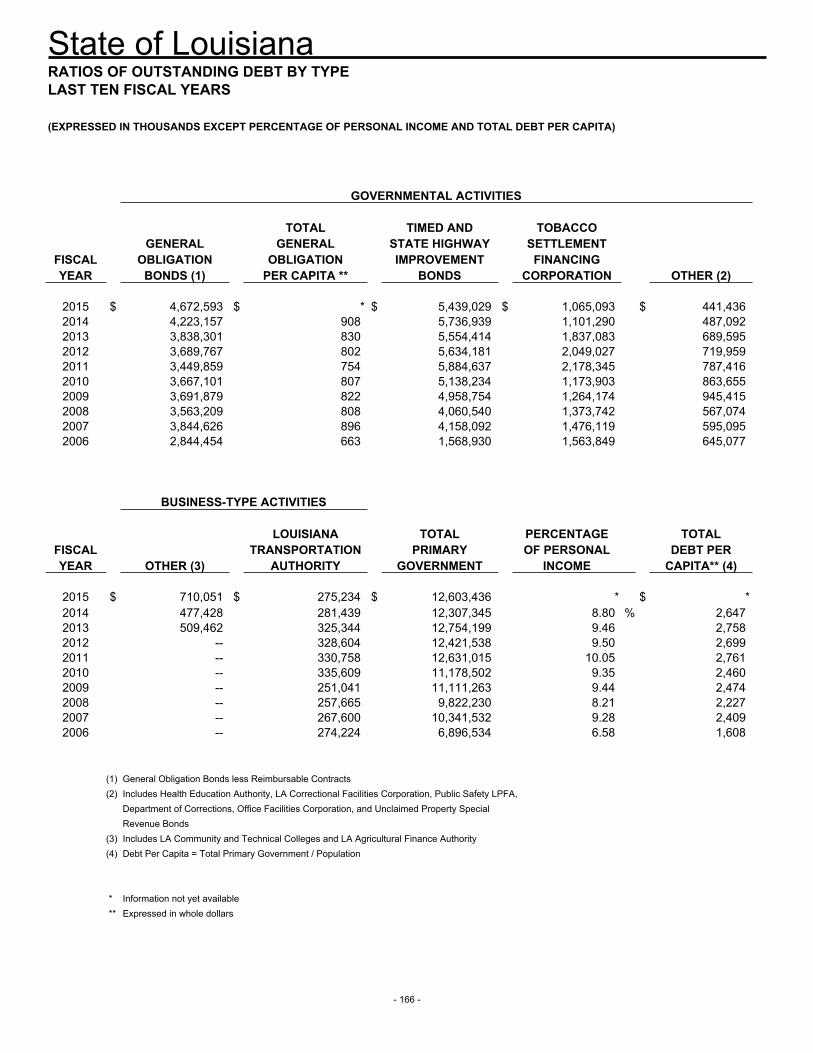
State of Louisiana
- 166 -
RATIOS OF OUTSTANDING DEBT BY TYPELAST TEN FISCAL YEARS
(EXPRESSED IN THOUSANDS EXCEPT PERCENTAGE OF PERSONAL INCOME AND TOTAL DEBT PER CAPITA)
GOVERNMENTAL ACTIVITIES
TOTAL TIMED AND TOBACCOGENERAL GENERAL STATE HIGHWAY SETTLEMENT
FISCAL OBLIGATION OBLIGATION IMPROVEMENT FINANCINGYEAR BONDS (1) PER CAPITA ** BONDS CORPORATION OTHER (2)
2015 $ 4,672,593 $ * $ 5,439,029 $ 1,065,093 $ 441,4362014 4,223,157 908 5,736,939 1,101,290 487,0922013 3,838,301 830 5,554,414 1,837,083 689,5952012 3,689,767 802 5,634,181 2,049,027 719,9592011 3,449,859 754 5,884,637 2,178,345 787,4162010 3,667,101 807 5,138,234 1,173,903 863,6552009 3,691,879 822 4,958,754 1,264,174 945,4152008 3,563,209 808 4,060,540 1,373,742 567,0742007 3,844,626 896 4,158,092 1,476,119 595,0952006 2,844,454 663 1,568,930 1,563,849 645,077
BUSINESS-TYPE ACTIVITIES
LOUISIANA TOTAL PERCENTAGE TOTALFISCAL TRANSPORTATION PRIMARY OF PERSONAL DEBT PERYEAR OTHER (3) AUTHORITY GOVERNMENT INCOME CAPITA** (4)
2015 $ 710,051 $ 275,234 $ 12,603,436 * $ *2014 477,428 281,439 12,307,345 8.80 % 2,6472013 509,462 325,344 12,754,199 9.46 2,7582012 -- 328,604 12,421,538 9.50 2,6992011 -- 330,758 12,631,015 10.05 2,7612010 -- 335,609 11,178,502 9.35 2,4602009 -- 251,041 11,111,263 9.44 2,4742008 -- 257,665 9,822,230 8.21 2,2272007 -- 267,600 10,341,532 9.28 2,4092006 -- 274,224 6,896,534 6.58 1,608
(1) General Obligation Bonds less Reimbursable Contracts(2) Includes Health Education Authority, LA Correctional Facilities Corporation, Public Safety LPFA,
Department of Corrections, Office Facilities Corporation, and Unclaimed Property SpecialRevenue Bonds
(3) Includes LA Community and Technical Colleges and LA Agricultural Finance Authority(4) Debt Per Capita = Total Primary Government / Population
* Information not yet available** Expressed in whole dollars

- 167 -
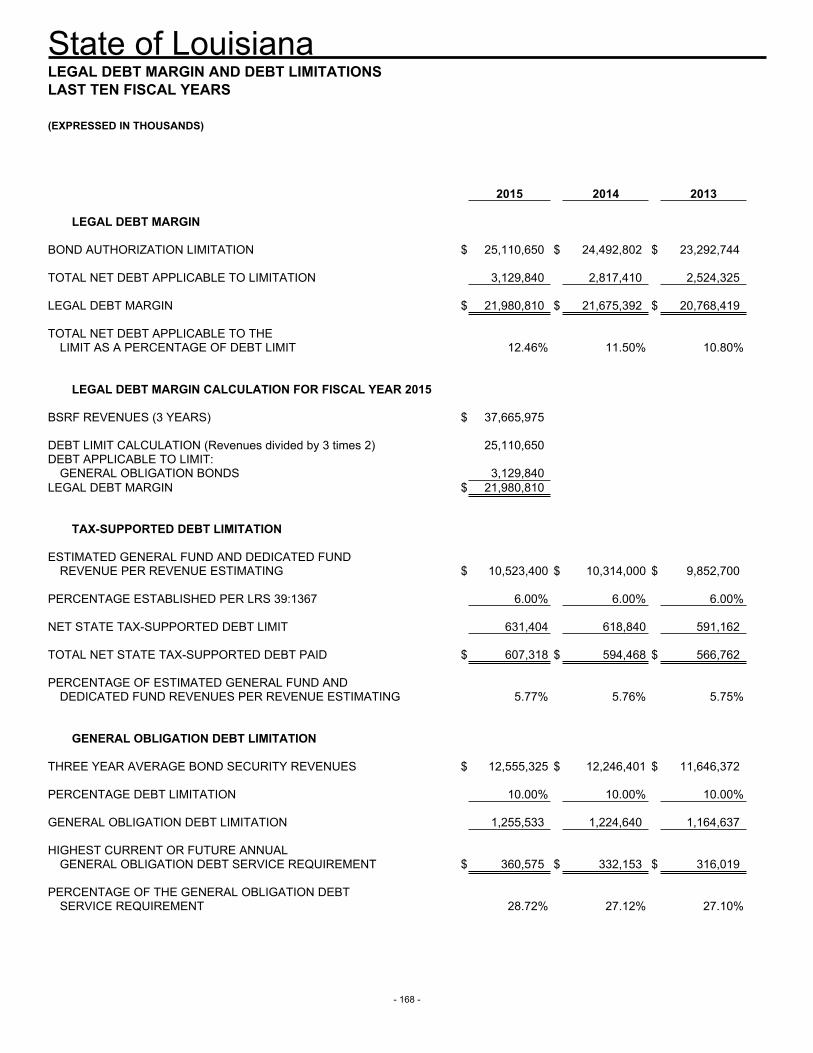
State of Louisiana
- 168 -
LEGAL DEBT MARGIN AND DEBT LIMITATIONSLAST TEN FISCAL YEARS
(EXPRESSED IN THOUSANDS)
2015 2014 2013
LEGAL DEBT MARGIN
BOND AUTHORIZATION LIMITATION $ 25,110,650 $ 24,492,802 $ 23,292,744
TOTAL NET DEBT APPLICABLE TO LIMITATION 3,129,840 2,817,410 2,524,325
LEGAL DEBT MARGIN $ 21,980,810 $ 21,675,392 $ 20,768,419
TOTAL NET DEBT APPLICABLE TO THELIMIT AS A PERCENTAGE OF DEBT LIMIT 12.46% 11.50% 10.80%
LEGAL DEBT MARGIN CALCULATION FOR FISCAL YEAR 2015
BSRF REVENUES (3 YEARS) $ 37,665,975
DEBT LIMIT CALCULATION (Revenues divided by 3 times 2) 25,110,650DEBT APPLICABLE TO LIMIT:
GENERAL OBLIGATION BONDS 3,129,840LEGAL DEBT MARGIN $ 21,980,810
TAX-SUPPORTED DEBT LIMITATION
ESTIMATED GENERAL FUND AND DEDICATED FUNDREVENUE PER REVENUE ESTIMATING $ 10,523,400 $ 10,314,000 $ 9,852,700
PERCENTAGE ESTABLISHED PER LRS 39:1367 6.00% 6.00% 6.00%
NET STATE TAX-SUPPORTED DEBT LIMIT 631,404 618,840 591,162
TOTAL NET STATE TAX-SUPPORTED DEBT PAID $ 607,318 $ 594,468 $ 566,762
PERCENTAGE OF ESTIMATED GENERAL FUND ANDDEDICATED FUND REVENUES PER REVENUE ESTIMATING 5.77% 5.76% 5.75%
GENERAL OBLIGATION DEBT LIMITATION
THREE YEAR AVERAGE BOND SECURITY REVENUES $ 12,555,325 $ 12,246,401 $ 11,646,372
PERCENTAGE DEBT LIMITATION 10.00% 10.00% 10.00%
GENERAL OBLIGATION DEBT LIMITATION 1,255,533 1,224,640 1,164,637
HIGHEST CURRENT OR FUTURE ANNUALGENERAL OBLIGATION DEBT SERVICE REQUIREMENT $ 360,575 $ 332,153 $ 316,019
PERCENTAGE OF THE GENERAL OBLIGATION DEBTSERVICE REQUIREMENT 28.72% 27.12% 27.10%
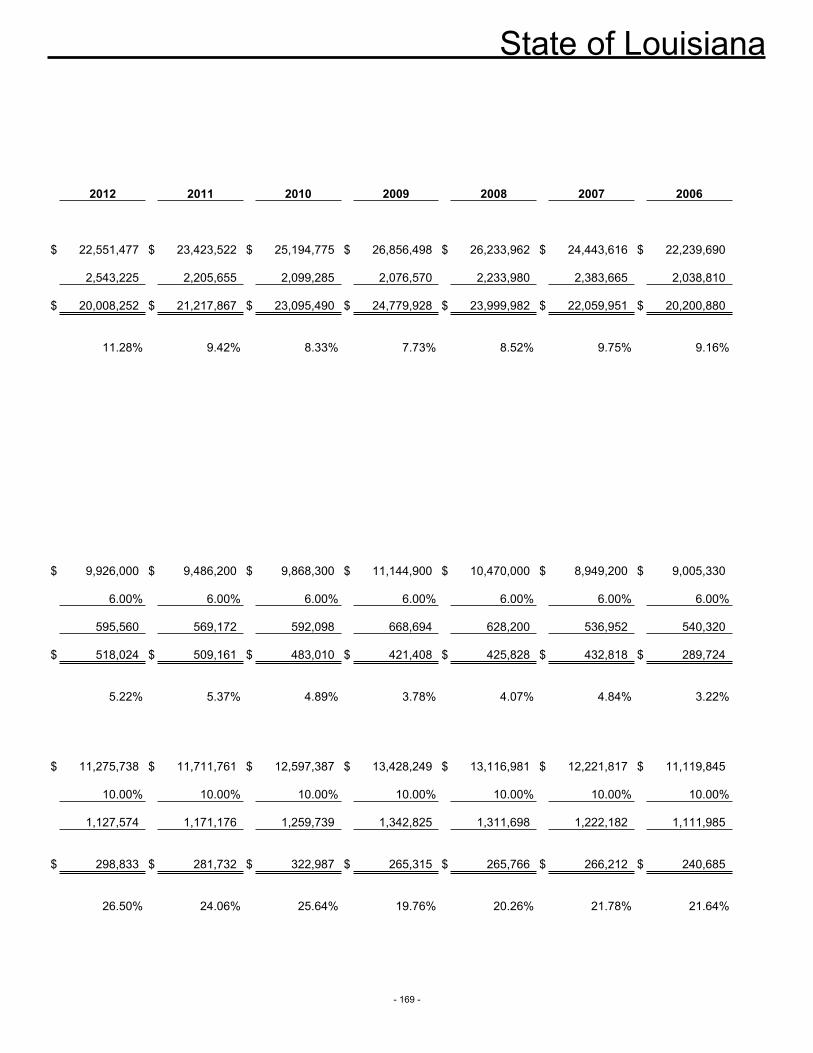
State of Louisiana
- 169 -
2012 2011 2010 2009 2008 2007 2006
$ 22,551,477 $ 23,423,522 $ 25,194,775 $ 26,856,498 $ 26,233,962 $ 24,443,616 $ 22,239,690
2,543,225 2,205,655 2,099,285 2,076,570 2,233,980 2,383,665 2,038,810
$ 20,008,252 $ 21,217,867 $ 23,095,490 $ 24,779,928 $ 23,999,982 $ 22,059,951 $ 20,200,880
11.28% 9.42% 8.33% 7.73% 8.52% 9.75% 9.16%
$ 9,926,000 $ 9,486,200 $ 9,868,300 $ 11,144,900 $ 10,470,000 $ 8,949,200 $ 9,005,330
6.00% 6.00% 6.00% 6.00% 6.00% 6.00% 6.00%
595,560 569,172 592,098 668,694 628,200 536,952 540,320
$ 518,024 $ 509,161 $ 483,010 $ 421,408 $ 425,828 $ 432,818 $ 289,724
5.22% 5.37% 4.89% 3.78% 4.07% 4.84% 3.22%
$ 11,275,738 $ 11,711,761 $ 12,597,387 $ 13,428,249 $ 13,116,981 $ 12,221,817 $ 11,119,845
10.00% 10.00% 10.00% 10.00% 10.00% 10.00% 10.00%
1,127,574 1,171,176 1,259,739 1,342,825 1,311,698 1,222,182 1,111,985
$ 298,833 $ 281,732 $ 322,987 $ 265,315 $ 265,766 $ 266,212 $ 240,685
26.50% 24.06% 25.64% 19.76% 20.26% 21.78% 21.64%
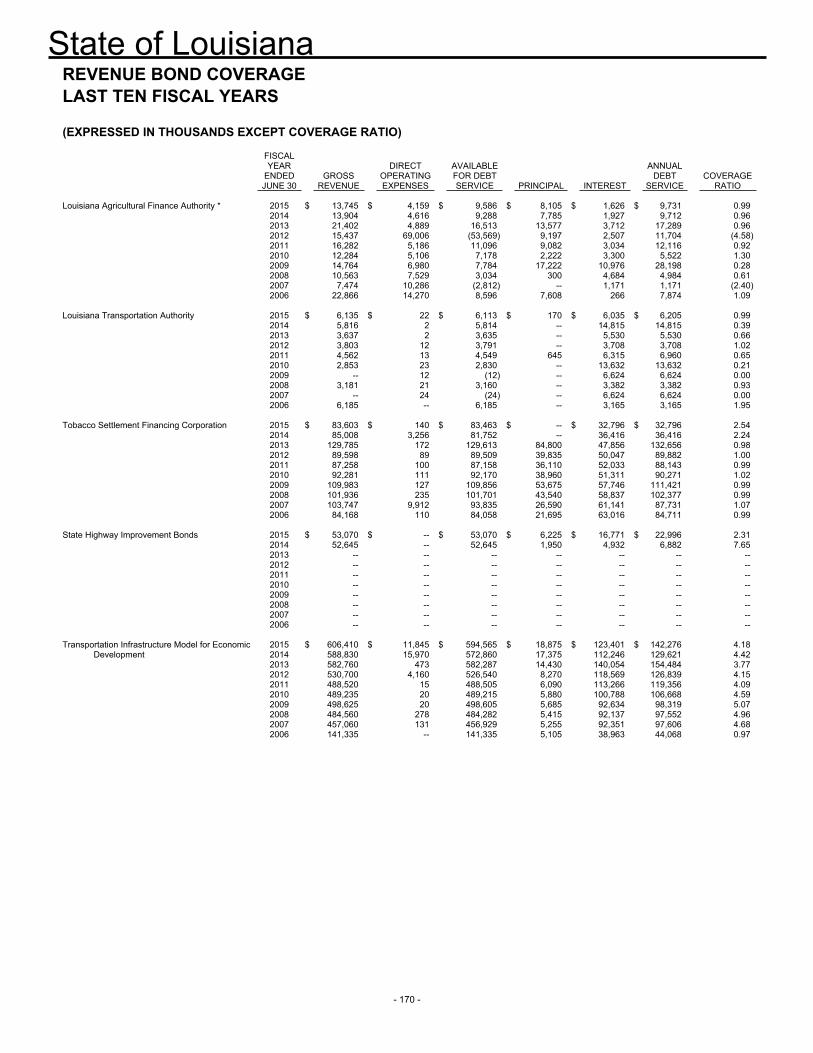
State of Louisiana
- 170 -
REVENUE BOND COVERAGELAST TEN FISCAL YEARS
(EXPRESSED IN THOUSANDS EXCEPT COVERAGE RATIO)
FISCALYEAR DIRECT AVAILABLE ANNUAL
ENDED GROSS OPERATING FOR DEBT DEBT COVERAGEJUNE 30 REVENUE EXPENSES SERVICE PRINCIPAL INTEREST SERVICE RATIO
Louisiana Agricultural Finance Authority * 2015 $ 13,745 $ 4,159 $ 9,586 $ 8,105 $ 1,626 $ 9,731 0.992014 13,904 4,616 9,288 7,785 1,927 9,712 0.962013 21,402 4,889 16,513 13,577 3,712 17,289 0.962012 15,437 69,006 (53,569) 9,197 2,507 11,704 (4.58)2011 16,282 5,186 11,096 9,082 3,034 12,116 0.922010 12,284 5,106 7,178 2,222 3,300 5,522 1.302009 14,764 6,980 7,784 17,222 10,976 28,198 0.282008 10,563 7,529 3,034 300 4,684 4,984 0.612007 7,474 10,286 (2,812) -- 1,171 1,171 (2.40)2006 22,866 14,270 8,596 7,608 266 7,874 1.09
Louisiana Transportation Authority 2015 $ 6,135 $ 22 $ 6,113 $ 170 $ 6,035 $ 6,205 0.992014 5,816 2 5,814 -- 14,815 14,815 0.392013 3,637 2 3,635 -- 5,530 5,530 0.662012 3,803 12 3,791 -- 3,708 3,708 1.022011 4,562 13 4,549 645 6,315 6,960 0.652010 2,853 23 2,830 -- 13,632 13,632 0.212009 -- 12 (12) -- 6,624 6,624 0.002008 3,181 21 3,160 -- 3,382 3,382 0.932007 -- 24 (24) -- 6,624 6,624 0.002006 6,185 -- 6,185 -- 3,165 3,165 1.95
Tobacco Settlement Financing Corporation 2015 $ 83,603 $ 140 $ 83,463 $ -- $ 32,796 $ 32,796 2.542014 85,008 3,256 81,752 -- 36,416 36,416 2.242013 129,785 172 129,613 84,800 47,856 132,656 0.982012 89,598 89 89,509 39,835 50,047 89,882 1.002011 87,258 100 87,158 36,110 52,033 88,143 0.992010 92,281 111 92,170 38,960 51,311 90,271 1.022009 109,983 127 109,856 53,675 57,746 111,421 0.992008 101,936 235 101,701 43,540 58,837 102,377 0.992007 103,747 9,912 93,835 26,590 61,141 87,731 1.072006 84,168 110 84,058 21,695 63,016 84,711 0.99
State Highway Improvement Bonds 2015 $ 53,070 $ -- $ 53,070 $ 6,225 $ 16,771 $ 22,996 2.312014 52,645 -- 52,645 1,950 4,932 6,882 7.652013 -- -- -- -- -- -- --2012 -- -- -- -- -- -- --2011 -- -- -- -- -- -- --2010 -- -- -- -- -- -- --2009 -- -- -- -- -- -- --2008 -- -- -- -- -- -- --2007 -- -- -- -- -- -- --2006 -- -- -- -- -- -- --
Transportation Infrastructure Model for Economic 2015 $ 606,410 $ 11,845 $ 594,565 $ 18,875 $ 123,401 $ 142,276 4.18 Development 2014 588,830 15,970 572,860 17,375 112,246 129,621 4.42
2013 582,760 473 582,287 14,430 140,054 154,484 3.772012 530,700 4,160 526,540 8,270 118,569 126,839 4.152011 488,520 15 488,505 6,090 113,266 119,356 4.092010 489,235 20 489,215 5,880 100,788 106,668 4.592009 498,625 20 498,605 5,685 92,634 98,319 5.072008 484,560 278 484,282 5,415 92,137 97,552 4.962007 457,060 131 456,929 5,255 92,351 97,606 4.682006 141,335 -- 141,335 5,105 38,963 44,068 0.97
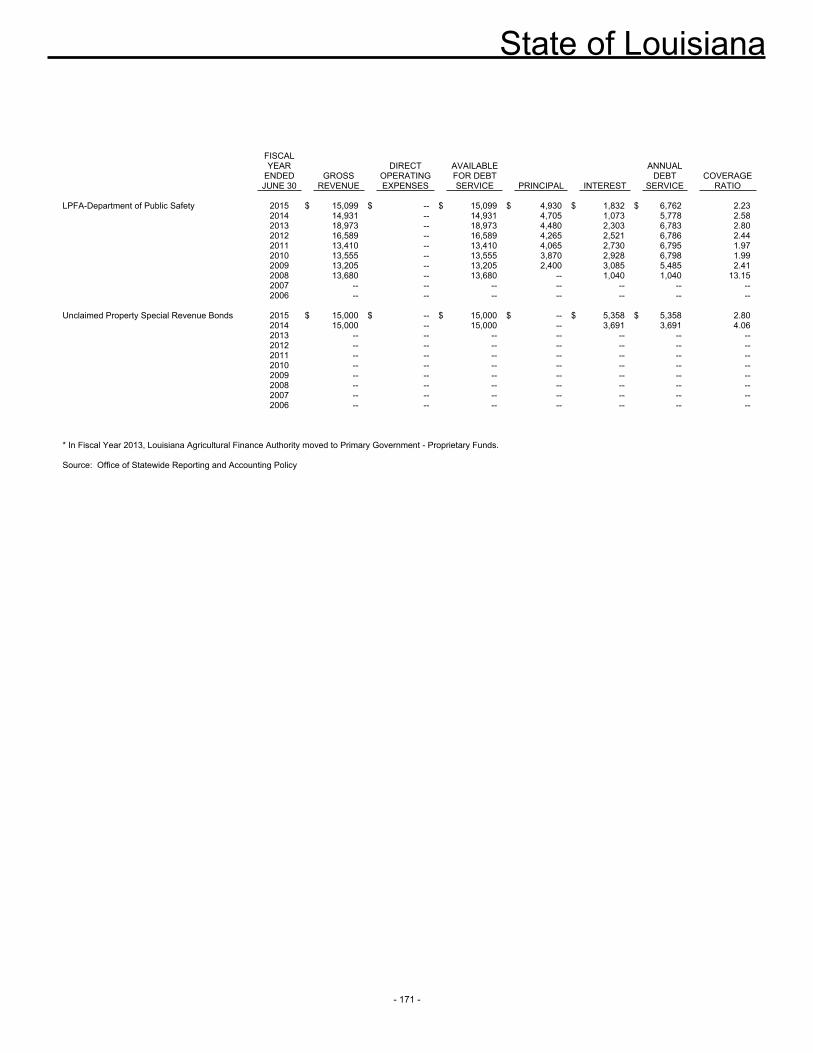
State of Louisiana
- 171 -
FISCALYEAR DIRECT AVAILABLE ANNUAL
ENDED GROSS OPERATING FOR DEBT DEBT COVERAGEJUNE 30 REVENUE EXPENSES SERVICE PRINCIPAL INTEREST SERVICE RATIO
LPFA-Department of Public Safety 2015 $ 15,099 $ -- $ 15,099 $ 4,930 $ 1,832 $ 6,762 2.232014 14,931 -- 14,931 4,705 1,073 5,778 2.582013 18,973 -- 18,973 4,480 2,303 6,783 2.802012 16,589 -- 16,589 4,265 2,521 6,786 2.442011 13,410 -- 13,410 4,065 2,730 6,795 1.972010 13,555 -- 13,555 3,870 2,928 6,798 1.992009 13,205 -- 13,205 2,400 3,085 5,485 2.412008 13,680 -- 13,680 -- 1,040 1,040 13.152007 -- -- -- -- -- -- --2006 -- -- -- -- -- -- --
Unclaimed Property Special Revenue Bonds 2015 $ 15,000 $ -- $ 15,000 $ -- $ 5,358 $ 5,358 2.802014 15,000 -- 15,000 -- 3,691 3,691 4.062013 -- -- -- -- -- -- --2012 -- -- -- -- -- -- --2011 -- -- -- -- -- -- --2010 -- -- -- -- -- -- --2009 -- -- -- -- -- -- --2008 -- -- -- -- -- -- --2007 -- -- -- -- -- -- --2006 -- -- -- -- -- -- --
* In Fiscal Year 2013, Louisiana Agricultural Finance Authority moved to Primary Government - Proprietary Funds. Source: Office of Statewide Reporting and Accounting Policy
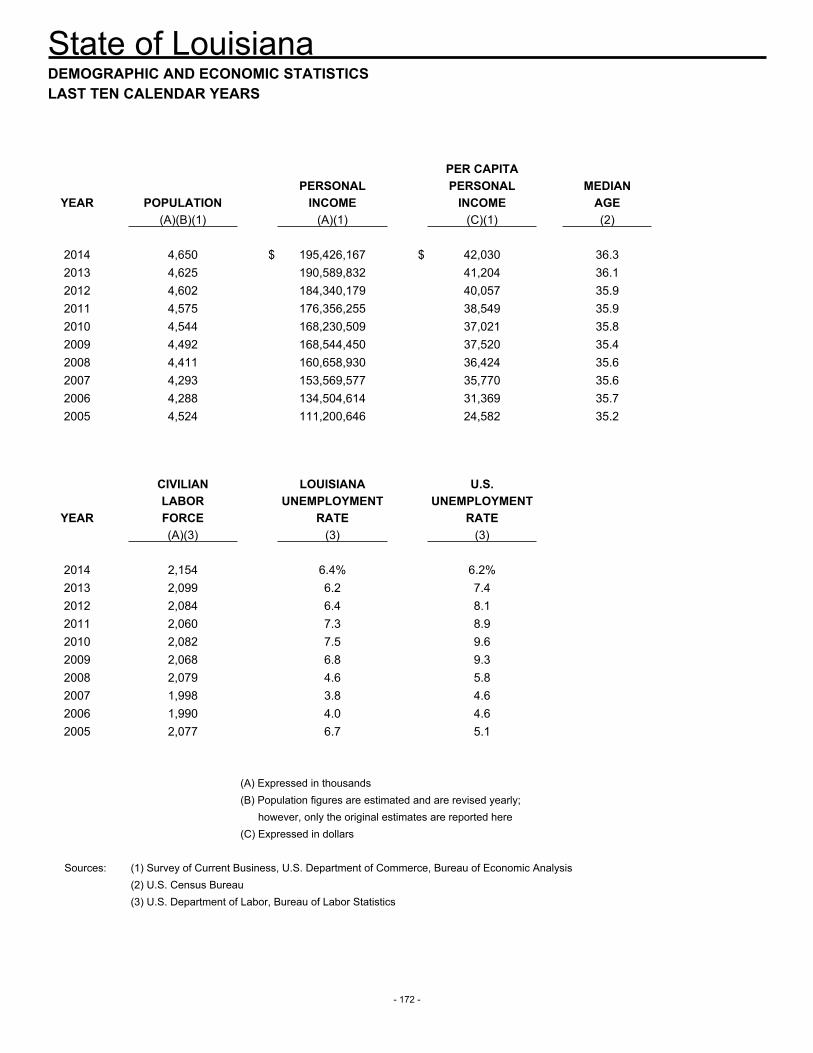
State of Louisiana
- 172 -
DEMOGRAPHIC AND ECONOMIC STATISTICSLAST TEN CALENDAR YEARS
PER CAPITAPERSONAL PERSONAL MEDIAN
YEAR POPULATION INCOME INCOME AGE(A)(B)(1) (A)(1) (C)(1) (2)
2014 4,650 $ 195,426,167 $ 42,030 36.32013 4,625 190,589,832 41,204 36.1 2012 4,602 184,340,179 40,057 35.9 2011 4,575 176,356,255 38,549 35.9 2010 4,544 168,230,509 37,021 35.8 2009 4,492 168,544,450 37,520 35.4 2008 4,411 160,658,930 36,424 35.6 2007 4,293 153,569,577 35,770 35.6 2006 4,288 134,504,614 31,369 35.7 2005 4,524 111,200,646 24,582 35.2
CIVILIAN LOUISIANA U.S.LABOR UNEMPLOYMENT UNEMPLOYMENT
YEAR FORCE RATE RATE(A)(3) (3) (3)
2014 2,154 6.4% 6.2%2013 2,099 6.2 7.42012 2,084 6.4 8.1 2011 2,060 7.3 8.9 2010 2,082 7.5 9.6 2009 2,068 6.8 9.3 2008 2,079 4.6 5.8 2007 1,998 3.8 4.6 2006 1,990 4.0 4.6 2005 2,077 6.7 5.1
(A) Expressed in thousands(B) Population figures are estimated and are revised yearly; however, only the original estimates are reported here(C) Expressed in dollars
Sources: (1) Survey of Current Business, U.S. Department of Commerce, Bureau of Economic Analysis(2) U.S. Census Bureau(3) U.S. Department of Labor, Bureau of Labor Statistics
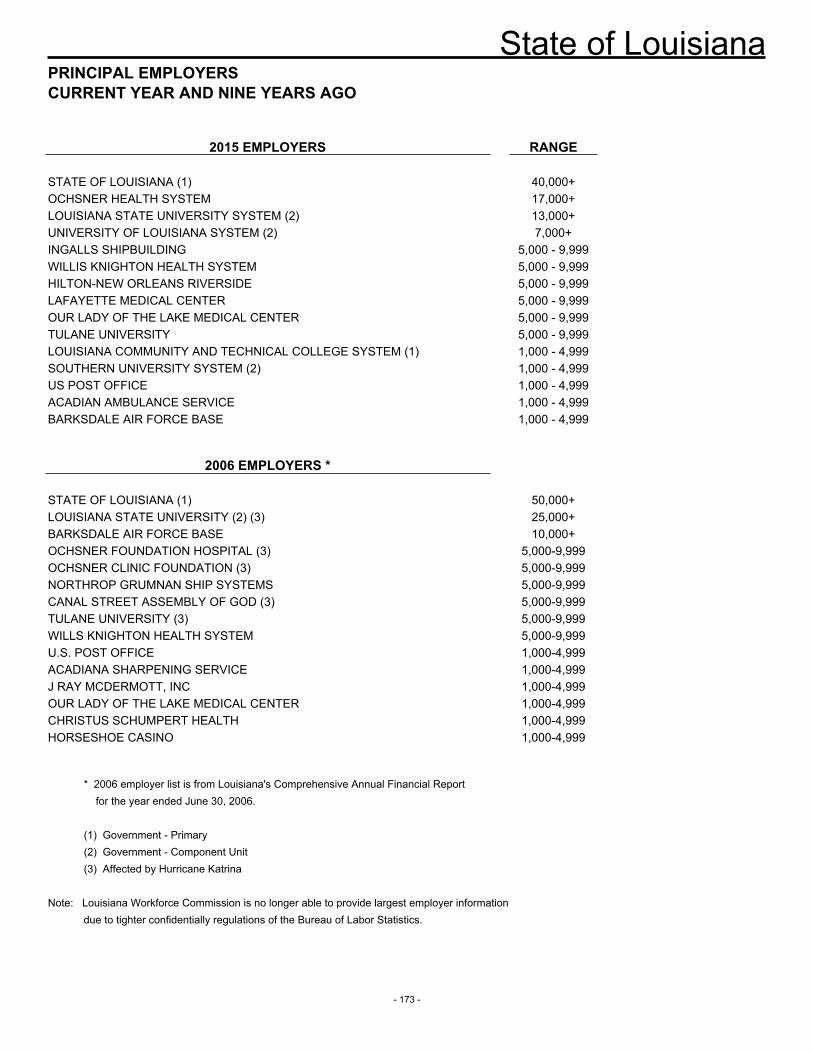
State of Louisiana
- 173 -
PRINCIPAL EMPLOYERSCURRENT YEAR AND NINE YEARS AGO
2015 EMPLOYERS RANGE
STATE OF LOUISIANA (1) 40,000+OCHSNER HEALTH SYSTEM 17,000+LOUISIANA STATE UNIVERSITY SYSTEM (2) 13,000+UNIVERSITY OF LOUISIANA SYSTEM (2) 7,000+INGALLS SHIPBUILDING 5,000 - 9,999WILLIS KNIGHTON HEALTH SYSTEM 5,000 - 9,999HILTON-NEW ORLEANS RIVERSIDE 5,000 - 9,999LAFAYETTE MEDICAL CENTER 5,000 - 9,999OUR LADY OF THE LAKE MEDICAL CENTER 5,000 - 9,999TULANE UNIVERSITY 5,000 - 9,999LOUISIANA COMMUNITY AND TECHNICAL COLLEGE SYSTEM (1) 1,000 - 4,999SOUTHERN UNIVERSITY SYSTEM (2) 1,000 - 4,999US POST OFFICE 1,000 - 4,999ACADIAN AMBULANCE SERVICE 1,000 - 4,999BARKSDALE AIR FORCE BASE 1,000 - 4,999
2006 EMPLOYERS *
STATE OF LOUISIANA (1) 50,000+LOUISIANA STATE UNIVERSITY (2) (3) 25,000+BARKSDALE AIR FORCE BASE 10,000+OCHSNER FOUNDATION HOSPITAL (3) 5,000-9,999OCHSNER CLINIC FOUNDATION (3) 5,000-9,999NORTHROP GRUMNAN SHIP SYSTEMS 5,000-9,999CANAL STREET ASSEMBLY OF GOD (3) 5,000-9,999TULANE UNIVERSITY (3) 5,000-9,999WILLS KNIGHTON HEALTH SYSTEM 5,000-9,999U.S. POST OFFICE 1,000-4,999ACADIANA SHARPENING SERVICE 1,000-4,999J RAY MCDERMOTT, INC 1,000-4,999OUR LADY OF THE LAKE MEDICAL CENTER 1,000-4,999CHRISTUS SCHUMPERT HEALTH 1,000-4,999HORSESHOE CASINO 1,000-4,999
* 2006 employer list is from Louisiana's Comprehensive Annual Financial Reportfor the year ended June 30, 2006.
(1) Government - Primary(2) Government - Component Unit(3) Affected by Hurricane Katrina
Note: Louisiana Workforce Commission is no longer able to provide largest employer information due to tighter confidentially regulations of the Bureau of Labor Statistics.
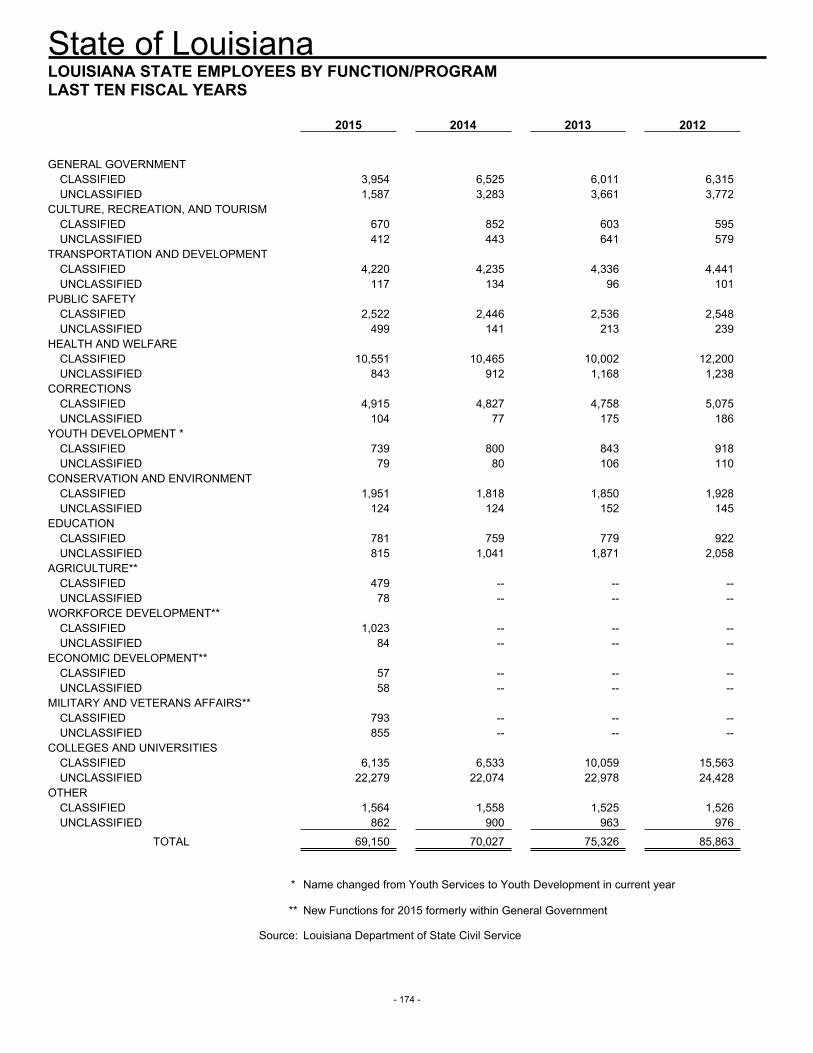
State of Louisiana
- 174 -
LOUISIANA STATE EMPLOYEES BY FUNCTION/PROGRAMLAST TEN FISCAL YEARS
2015 2014 2013 2012
GENERAL GOVERNMENTCLASSIFIED 3,954 6,525 6,011 6,315UNCLASSIFIED 1,587 3,283 3,661 3,772
CULTURE, RECREATION, AND TOURISMCLASSIFIED 670 852 603 595UNCLASSIFIED 412 443 641 579
TRANSPORTATION AND DEVELOPMENTCLASSIFIED 4,220 4,235 4,336 4,441UNCLASSIFIED 117 134 96 101
PUBLIC SAFETYCLASSIFIED 2,522 2,446 2,536 2,548UNCLASSIFIED 499 141 213 239
HEALTH AND WELFARECLASSIFIED 10,551 10,465 10,002 12,200UNCLASSIFIED 843 912 1,168 1,238
CORRECTIONSCLASSIFIED 4,915 4,827 4,758 5,075UNCLASSIFIED 104 77 175 186
YOUTH DEVELOPMENT *CLASSIFIED 739 800 843 918UNCLASSIFIED 79 80 106 110
CONSERVATION AND ENVIRONMENTCLASSIFIED 1,951 1,818 1,850 1,928UNCLASSIFIED 124 124 152 145
EDUCATIONCLASSIFIED 781 759 779 922UNCLASSIFIED 815 1,041 1,871 2,058
AGRICULTURE**CLASSIFIED 479 -- -- --UNCLASSIFIED 78 -- -- --
WORKFORCE DEVELOPMENT**CLASSIFIED 1,023 -- -- --UNCLASSIFIED 84 -- -- --
ECONOMIC DEVELOPMENT**CLASSIFIED 57 -- -- --UNCLASSIFIED 58 -- -- --
MILITARY AND VETERANS AFFAIRS**CLASSIFIED 793 -- -- --UNCLASSIFIED 855 -- -- --
COLLEGES AND UNIVERSITIESCLASSIFIED 6,135 6,533 10,059 15,563UNCLASSIFIED 22,279 22,074 22,978 24,428
OTHERCLASSIFIED 1,564 1,558 1,525 1,526UNCLASSIFIED 862 900 963 976
TOTAL 69,150 70,027 75,326 85,863
* Name changed from Youth Services to Youth Development in current year
** New Functions for 2015 formerly within General Government
Source: Louisiana Department of State Civil Service
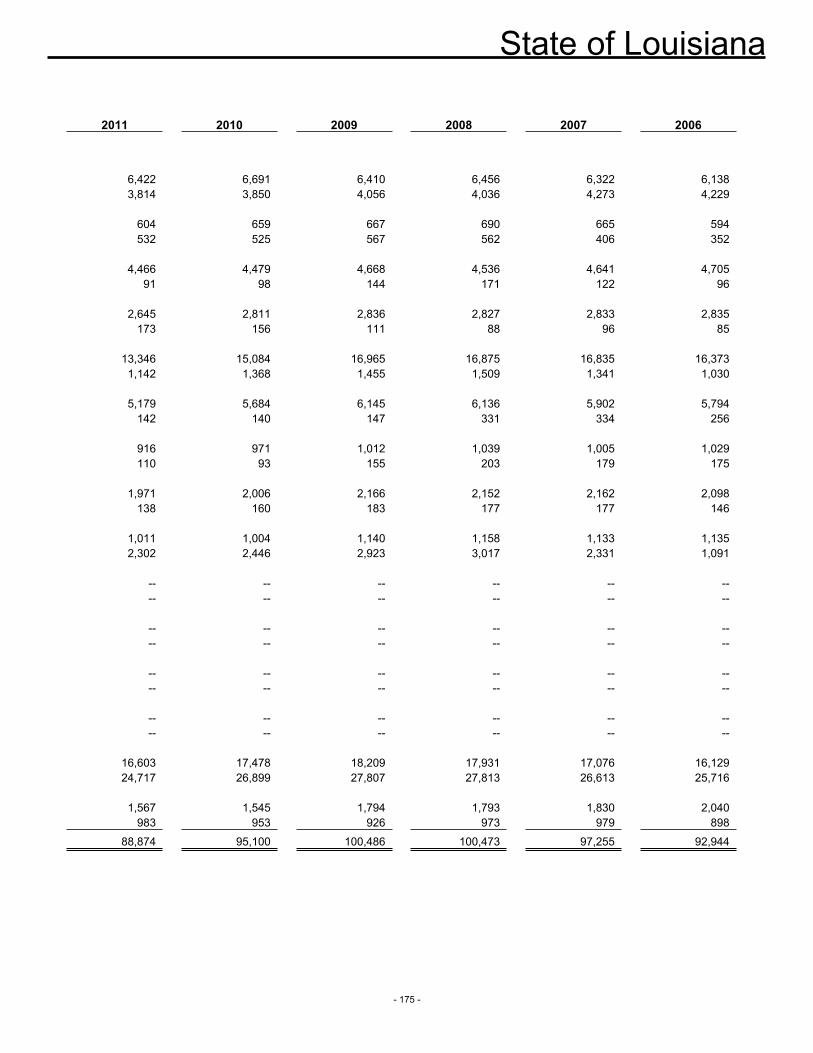
State of Louisiana
- 175 -
2011 2010 2009 2008 2007 2006
6,422 6,691 6,410 6,456 6,322 6,1383,814 3,850 4,056 4,036 4,273 4,229
604 659 667 690 665 594532 525 567 562 406 352
4,466 4,479 4,668 4,536 4,641 4,70591 98 144 171 122 96
2,645 2,811 2,836 2,827 2,833 2,835173 156 111 88 96 85
13,346 15,084 16,965 16,875 16,835 16,3731,142 1,368 1,455 1,509 1,341 1,030
5,179 5,684 6,145 6,136 5,902 5,794142 140 147 331 334 256
916 971 1,012 1,039 1,005 1,029110 93 155 203 179 175
1,971 2,006 2,166 2,152 2,162 2,098138 160 183 177 177 146
1,011 1,004 1,140 1,158 1,133 1,1352,302 2,446 2,923 3,017 2,331 1,091
-- -- -- -- -- ---- -- -- -- -- --
-- -- -- -- -- ---- -- -- -- -- --
-- -- -- -- -- ---- -- -- -- -- --
-- -- -- -- -- ---- -- -- -- -- --
16,603 17,478 18,209 17,931 17,076 16,12924,717 26,899 27,807 27,813 26,613 25,716
1,567 1,545 1,794 1,793 1,830 2,040983 953 926 973 979 898
88,874 95,100 100,486 100,473 97,255 92,944
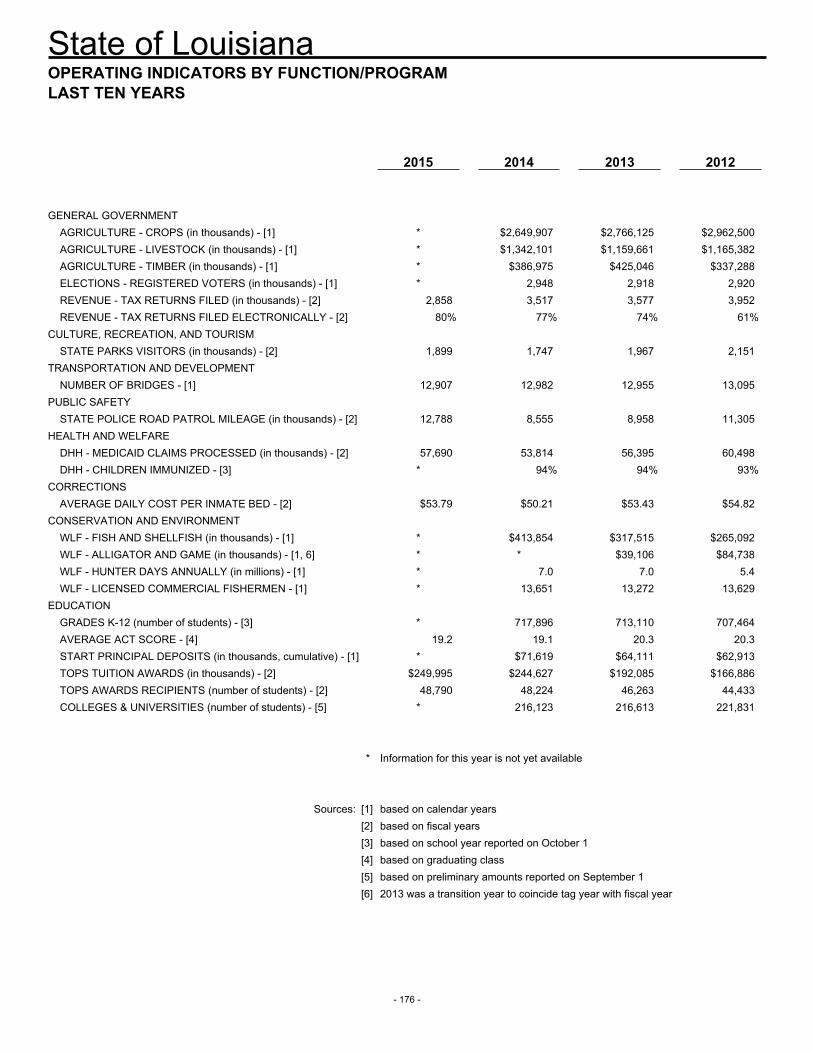
State of Louisiana
- 176 -
OPERATING INDICATORS BY FUNCTION/PROGRAMLAST TEN YEARS
2015 2014 2013 2012
GENERAL GOVERNMENTAGRICULTURE - CROPS (in thousands) - [1] * $2,649,907 $2,766,125 $2,962,500AGRICULTURE - LIVESTOCK (in thousands) - [1] * $1,342,101 $1,159,661 $1,165,382AGRICULTURE - TIMBER (in thousands) - [1] * $386,975 $425,046 $337,288ELECTIONS - REGISTERED VOTERS (in thousands) - [1] * 2,948 2,918 2,920REVENUE - TAX RETURNS FILED (in thousands) - [2] 2,858 3,517 3,577 3,952REVENUE - TAX RETURNS FILED ELECTRONICALLY - [2] 80% 77% 74% 61%
CULTURE, RECREATION, AND TOURISMSTATE PARKS VISITORS (in thousands) - [2] 1,899 1,747 1,967 2,151
TRANSPORTATION AND DEVELOPMENTNUMBER OF BRIDGES - [1] 12,907 12,982 12,955 13,095
PUBLIC SAFETYSTATE POLICE ROAD PATROL MILEAGE (in thousands) - [2] 12,788 8,555 8,958 11,305
HEALTH AND WELFAREDHH - MEDICAID CLAIMS PROCESSED (in thousands) - [2] 57,690 53,814 56,395 60,498DHH - CHILDREN IMMUNIZED - [3] * 94% 94% 93%
CORRECTIONSAVERAGE DAILY COST PER INMATE BED - [2] $53.79 $50.21 $53.43 $54.82
CONSERVATION AND ENVIRONMENTWLF - FISH AND SHELLFISH (in thousands) - [1] * $413,854 $317,515 $265,092WLF - ALLIGATOR AND GAME (in thousands) - [1, 6] * * $39,106 $84,738WLF - HUNTER DAYS ANNUALLY (in millions) - [1] * 7.0 7.0 5.4WLF - LICENSED COMMERCIAL FISHERMEN - [1] * 13,651 13,272 13,629
EDUCATIONGRADES K-12 (number of students) - [3] * 717,896 713,110 707,464AVERAGE ACT SCORE - [4] 19.2 19.1 20.3 20.3START PRINCIPAL DEPOSITS (in thousands, cumulative) - [1] * $71,619 $64,111 $62,913TOPS TUITION AWARDS (in thousands) - [2] $249,995 $244,627 $192,085 $166,886TOPS AWARDS RECIPIENTS (number of students) - [2] 48,790 48,224 46,263 44,433COLLEGES & UNIVERSITIES (number of students) - [5] * 216,123 216,613 221,831
* Information for this year is not yet available
Sources: [1] based on calendar years[2] based on fiscal years[3] based on school year reported on October 1[4] based on graduating class[5] based on preliminary amounts reported on September 1[6] 2013 was a transition year to coincide tag year with fiscal year
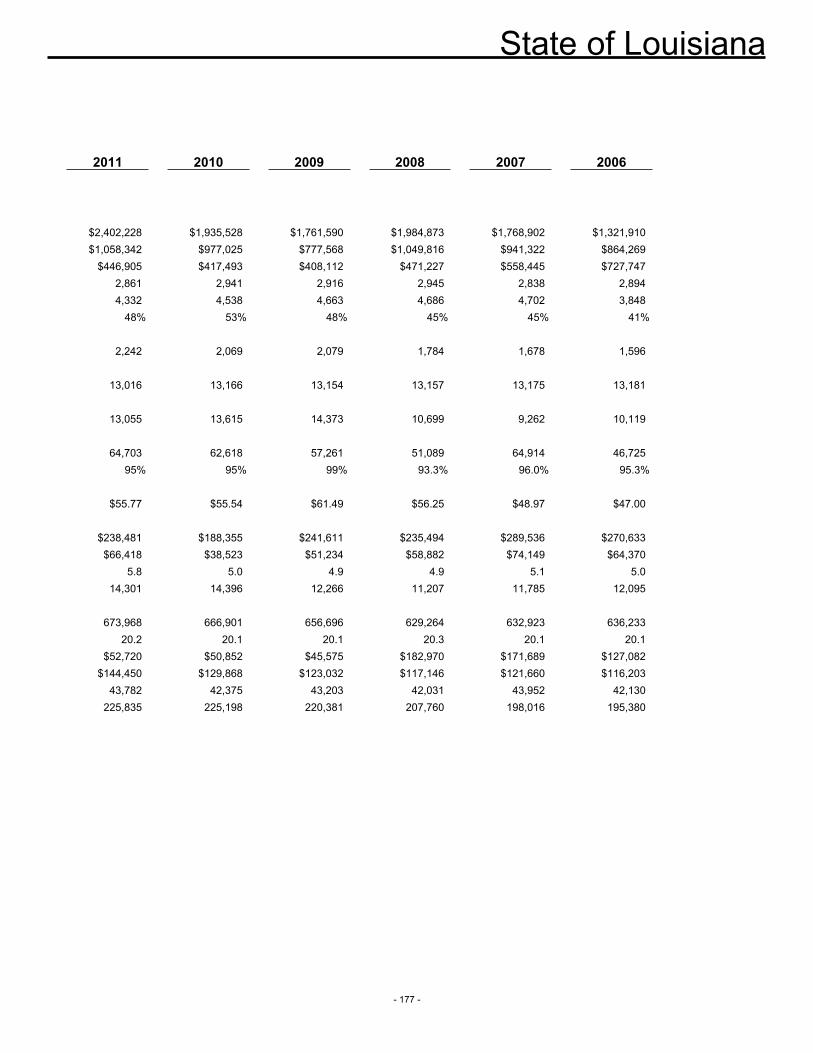
State of Louisiana
- 177 -
2011 2010 2009 2008 2007 2006
$2,402,228 $1,935,528 $1,761,590 $1,984,873 $1,768,902 $1,321,910$1,058,342 $977,025 $777,568 $1,049,816 $941,322 $864,269
$446,905 $417,493 $408,112 $471,227 $558,445 $727,7472,861 2,941 2,916 2,945 2,838 2,8944,332 4,538 4,663 4,686 4,702 3,848
48% 53% 48% 45% 45% 41%
2,242 2,069 2,079 1,784 1,678 1,596
13,016 13,166 13,154 13,157 13,175 13,181
13,055 13,615 14,373 10,699 9,262 10,119
64,703 62,618 57,261 51,089 64,914 46,72595% 95% 99% 93.3% 96.0% 95.3%
$55.77 $55.54 $61.49 $56.25 $48.97 $47.00
$238,481 $188,355 $241,611 $235,494 $289,536 $270,633$66,418 $38,523 $51,234 $58,882 $74,149 $64,370
5.8 5.0 4.9 4.9 5.1 5.014,301 14,396 12,266 11,207 11,785 12,095
673,968 666,901 656,696 629,264 632,923 636,23320.2 20.1 20.1 20.3 20.1 20.1
$52,720 $50,852 $45,575 $182,970 $171,689 $127,082$144,450 $129,868 $123,032 $117,146 $121,660 $116,203
43,782 42,375 43,203 42,031 43,952 42,130225,835 225,198 220,381 207,760 198,016 195,380
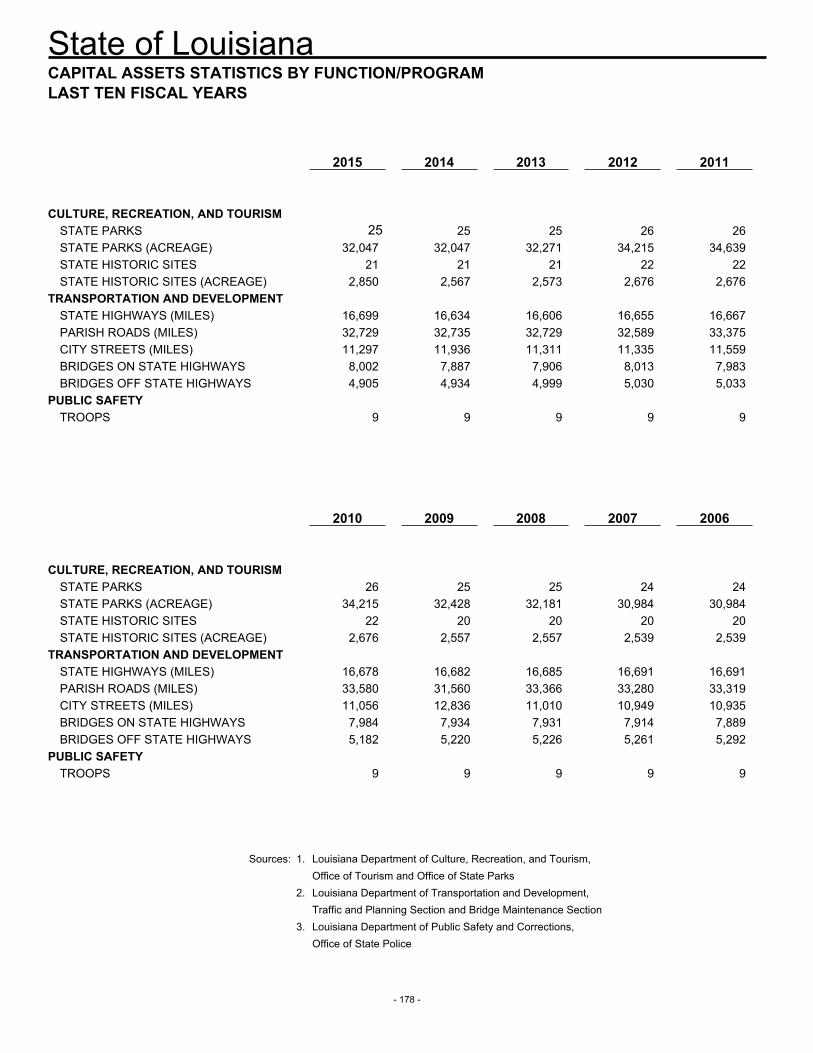
State of Louisiana
- 178 -
CAPITAL ASSETS STATISTICS BY FUNCTION/PROGRAMLAST TEN FISCAL YEARS
2015 2014 2013 2012 2011
CULTURE, RECREATION, AND TOURISMSTATE PARKS 25 25 25 26 26STATE PARKS (ACREAGE) 32,047 32,047 32,271 34,215 34,639STATE HISTORIC SITES 21 21 21 22 22STATE HISTORIC SITES (ACREAGE) 2,850 2,567 2,573 2,676 2,676
TRANSPORTATION AND DEVELOPMENTSTATE HIGHWAYS (MILES) 16,699 16,634 16,606 16,655 16,667PARISH ROADS (MILES) 32,729 32,735 32,729 32,589 33,375CITY STREETS (MILES) 11,297 11,936 11,311 11,335 11,559BRIDGES ON STATE HIGHWAYS 8,002 7,887 7,906 8,013 7,983BRIDGES OFF STATE HIGHWAYS 4,905 4,934 4,999 5,030 5,033
PUBLIC SAFETYTROOPS 9 9 9 9 9
2010 2009 2008 2007 2006
CULTURE, RECREATION, AND TOURISMSTATE PARKS 26 25 25 24 24STATE PARKS (ACREAGE) 34,215 32,428 32,181 30,984 30,984STATE HISTORIC SITES 22 20 20 20 20STATE HISTORIC SITES (ACREAGE) 2,676 2,557 2,557 2,539 2,539
TRANSPORTATION AND DEVELOPMENTSTATE HIGHWAYS (MILES) 16,678 16,682 16,685 16,691 16,691PARISH ROADS (MILES) 33,580 31,560 33,366 33,280 33,319CITY STREETS (MILES) 11,056 12,836 11,010 10,949 10,935BRIDGES ON STATE HIGHWAYS 7,984 7,934 7,931 7,914 7,889BRIDGES OFF STATE HIGHWAYS 5,182 5,220 5,226 5,261 5,292
PUBLIC SAFETYTROOPS 9 9 9 9 9
Sources: 1. Louisiana Department of Culture, Recreation, and Tourism,Office of Tourism and Office of State Parks
2. Louisiana Department of Transportation and Development,Traffic and Planning Section and Bridge Maintenance Section
3. Louisiana Department of Public Safety and Corrections, Office of State Police
State of Louisiana
- 179 -
ACKNOWLEDGMENTS
REPORT PREPARED BY:
State of LouisianaDivision of Administration
Stafford Olivia Palmieri, CommissionerAfranie Adomako, CPA, Assistant Commissioner - Management & Finance
Office of Statewide Reporting and Accounting PolicyJohn McLean, CPA, Interim Director
Randie Latiolais, Administrative Assistant
Financial Reporting SectionKatherine Porche, CPA, Interim Manager
Mark Rhodes, CPA, ManagerRhonda Coston, CPA
Kimberly DwinYuchi Fong
Tonia Jackson, CPASean LangloisPam Stephens
Deborah Zundel, CPA
Financial System SectionJames Lodge, Manager
Carrie ChenCarmencita Christian
Chantelle Coates, CPAJudy DavidsonHolly Ketterer
Inga KimbroughEvelyn Myles
Joyce Sanders-RileyBridget Theriot
Jennifer Williams
Additional Assistance Provided ByOffice of Technology Services
All State Fiscal Personnel