Embed Size (px)
Citation preview
The Meat and Dairy Sector in Bosnia and Herzegovina
Preparation of IPARD Sector Analyses in Bosnia and Herzegovina
2012
FAO Regional Of ice for Europe and Central Asia
FAO Regional Offi ce for Europe and Central Asia
31 August 2012
The
Mea
t and
Dai
ry S
ecto
r in
Bosn
ia a
nd H
erze
govi
na
This project is funded by the European Union
Please address comments and inquiries to:
Regional Offi ce for Europe and Central Asia Food and Agriculture Organiza on of the United Na ons (FAO)
Benczúr u. 34, 1068 Budapest, HungaryTelephone: (+36) 1 461 2000Fax: (+36) 1 351 7029Email: [email protected]: www.fao.org/europe/en
Electronic Version of the report: h p://www.fao.org/europe/publica ons/documents-and-reports/IPARD-BiH/

Cover photograph: ©FAO/Vlado Pijunovic
The Meat and Dairy Sector in Bosnia and Herzegovina
Prepara on of IPARD Sector Analyses in Bosnia and Herzegovina
GCP/BIH/007/ECContract number: 2010/256–560
Regional Offi ce for Europe and Central Asia Food and Agriculture Organiza on
of the United Na ons
This publica on has been produced with the assistance of the European Union. The contents of this publica on are the sole responsibility of the Regional Offi ce for Europe and Central Asia of the Food and Agriculture
Organiza on of the United Na ons and can in no way be taken to refl ect the views of the European Union.
The designa ons employed and the presenta on of material in this publica on do not imply the expression of any opinion whatsoever on the part of the Food and Agriculture Organiza on of the United Na ons (FAO) concerning the legal or development status of any country, territory, city or area or of its authori es, or concerning the delimita on of its fron ers or boundaries. The men on of specifi c companies or products of manufacturers, whether or not these have been patented, does not imply that these have been endorsed or recommended by FAO in preference to others of a similar nature that are not men oned.
All rights reserved. FAO encourages reproduc on and dissemina on of material in this publica on. Non-commercial uses will be authorized free of charge. Reproduc on for resale or other commercial purposes, including educa onal purposes, may incur fees. Applica ons for permission to reproduce or disseminate FAO copyright materials and all other queries on rights and licences, should be addressed by e-mail to [email protected] or to the Chief, Publishing Policy and Support Branch, Offi ce of Knowledge Exchange, Research and Extension, FAO,Viale delle Terme di Caracalla, 00153 Rome, Italy.
© FAO 2012
Mesni i mliječni sektor u Bosni i Hercegovini1. Izvršni sažetak
Ovaj dokument je sačinjen u standardnom IPARD formatu sektorske studije, sa analizom koja se progresivno razrađuje kroz poglavlja kako slijedi:
1.1 Osnovne informacije i ključni podaci
Poglavlje 1 pruža opšte informacije o Bosni i Hercegovini kao i sektoru stočarstva, pripremljeno za svaku pojedinačnu sektorsku studiju na osnovu objavljenih sta s čkih podataka.
– Ključni nalaz 1: Stočarstvo je najavažniji sektor BiH poljoprivrede
Ukupno BDP: € 12,7 milijardi Poljoprivreda BDP: € 930 miliona (7 posto) Stočarstvo dobitak: € 900 millona (cijena proizvoda koju dobija farma)
– Ključni nalaz 2: Preko 300.000 poljoprivrednih gazdinstava drži nešto stoke, čime se značajno doprinosi prihodu domaćinstva
Na anke ranim farmama: Mlijeko i mliječni proizvodi uzimaju učešće sa 20 procenata u prihodu domaćinstva Mlijeko i stoka uzimaju učešće sa 50 procenata u prihodu domaćinstva
1.2 Farmeri / poljoprivredni proizvođači
Poglavlje 2 daje pregled ključnih sta s čkih podataka a potom razrađuje kvan ta van opis i pologiju stočarskih farmi u Bosni
i Hercegovini; i objedinjuje sta s čke podatake kao i nalaze ankete koja je sprovedena na farmama u svrhu ove studije kako bi se formirala sveobuhvatna procjena broja stada i jata, broja živo nja, kao i proizvodnje mlijeka i mliječnih proizvoda kao i vrste marke nga za svaki p farme, sa procjenama vrijednos i obima
– Ključni nalaz 3: Stočarskim sektorom dominira veliki broj veoma malih gazdinstava
– Ključni nalaz 4: Broj “komercijalnih” farmi je veoma malen, premda proizvode većinu peradi kao i umjeren omjer ukupnog broja ovaca
Stočarske farme u BiH mogu da se podijele u tri sektora: Domaćinski sektor, koji uglavnom proizvodi u svrhu sopstvene proizvodnje plus nešto malo neformalne prodaje • Goveda = 1 krava• Ovce = 1-5 ovaca/janjad za tovljenje• Svinje = 1 krmača/1-3 svinje za tovljenje• Perad = 1-20 kvočki/1-50 brojlera Komercijalni sektor, veće farme koje uglavnom proizvode za prodaju registrovanim klaonicama i mljekarama:• Goveda = preko 20 krava• Ovce = preko 100 ovaca• Svinje = preko 20 krmača/200 svinja za
tovljenje po ciklusu • Perad = preko 500 kvočki / 1.000 brojlera
po ciklusu
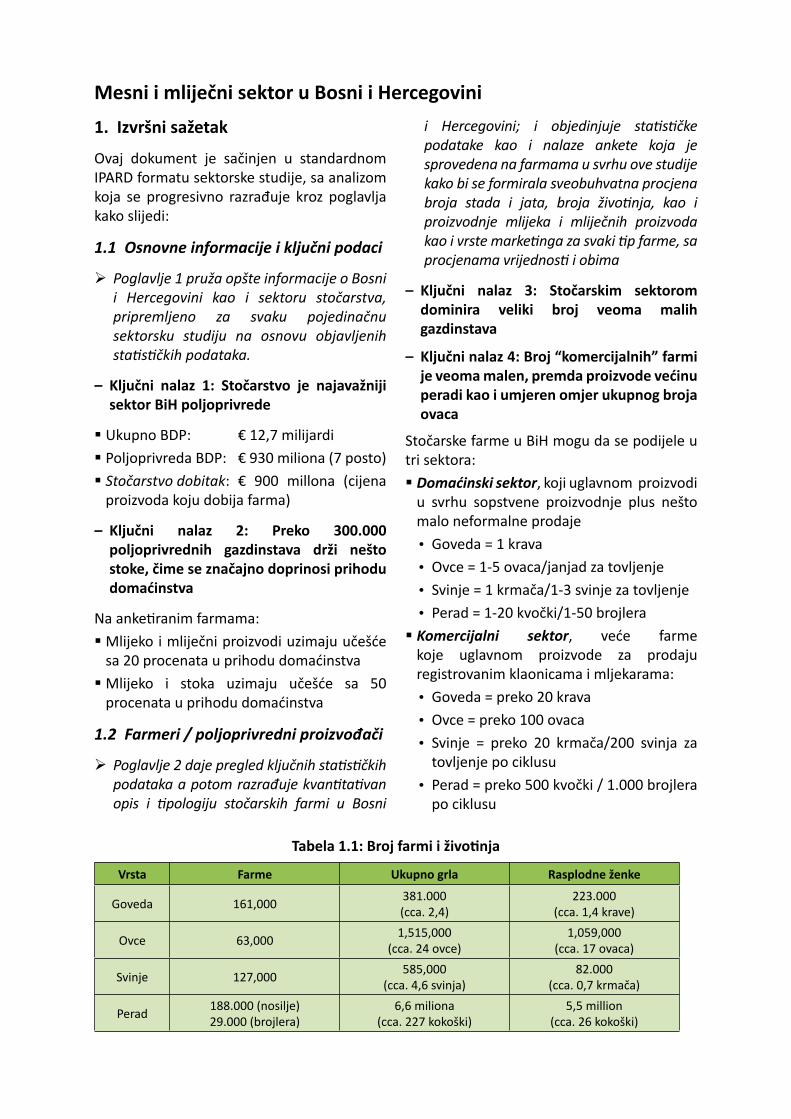
Tabela 1.1: Broj farmi i živo nja
Vrsta Farme Ukupno grla Rasplodne ženke
Goveda 161,000 381.000(cca. 2,4)
223.000(cca. 1,4 krave)
Ovce 63,000 1,515,000(cca. 24 ovce)
1,059,000(cca. 17 ovaca)
Svinje 127,000 585,000(cca. 4,6 svinja)
82.000(cca. 0,7 krmača)
Perad 188.000 (nosilje)29.000 (brojlera)
6,6 miliona(cca. 227 kokoški)
5,5 million(cca. 26 kokoški)
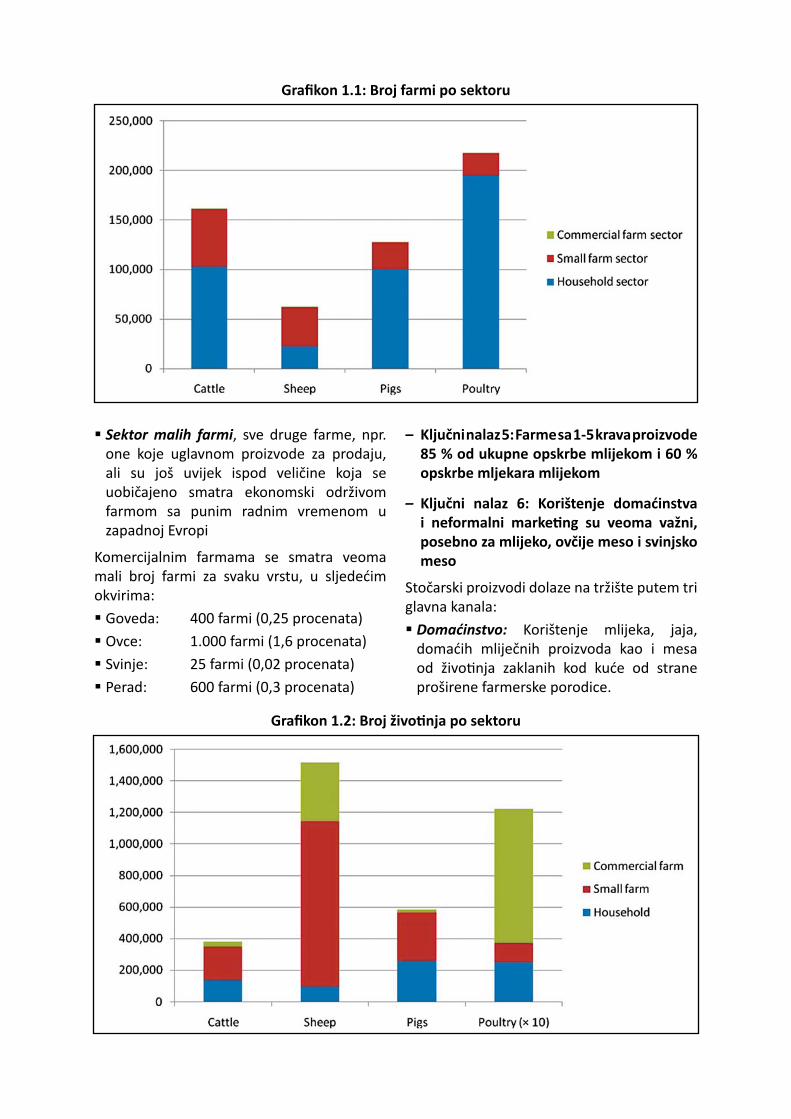
Sektor malih farmi, sve druge farme, npr. one koje uglavnom proizvode za prodaju, ali su još uvijek ispod veličine koja se uobičajeno smatra ekonomski održivom farmom sa punim radnim vremenom u zapadnoj Evropi
Komercijalnim farmama se smatra veoma mali broj farmi za svaku vrstu, u sljedećim okvirima: Goveda: 400 farmi (0,25 procenata) Ovce: 1.000 farmi (1,6 procenata) Svinje: 25 farmi (0,02 procenata) Perad: 600 farmi (0,3 procenata)
– Ključni nalaz 5: Farme sa 1-5 krava proizvode 85 % od ukupne opskrbe mlijekom i 60 % opskrbe mljekara mlijekom
– Ključni nalaz 6: Korištenje domaćinstva i neformalni marke ng su veoma važni, posebno za mlijeko, ovčije meso i svinjsko meso
Stočarski proizvodi dolaze na tržište putem tri glavna kanala: Domaćinstvo: Korištenje mlijeka, jaja, domaćih mliječnih proizvoda kao i mesa od živo nja zaklanih kod kuće od strane proširene farmerske porodice.
Grafi kon 1.1: Broj farmi po sektoru
Grafi kon 1.2: Broj živo nja po sektoru
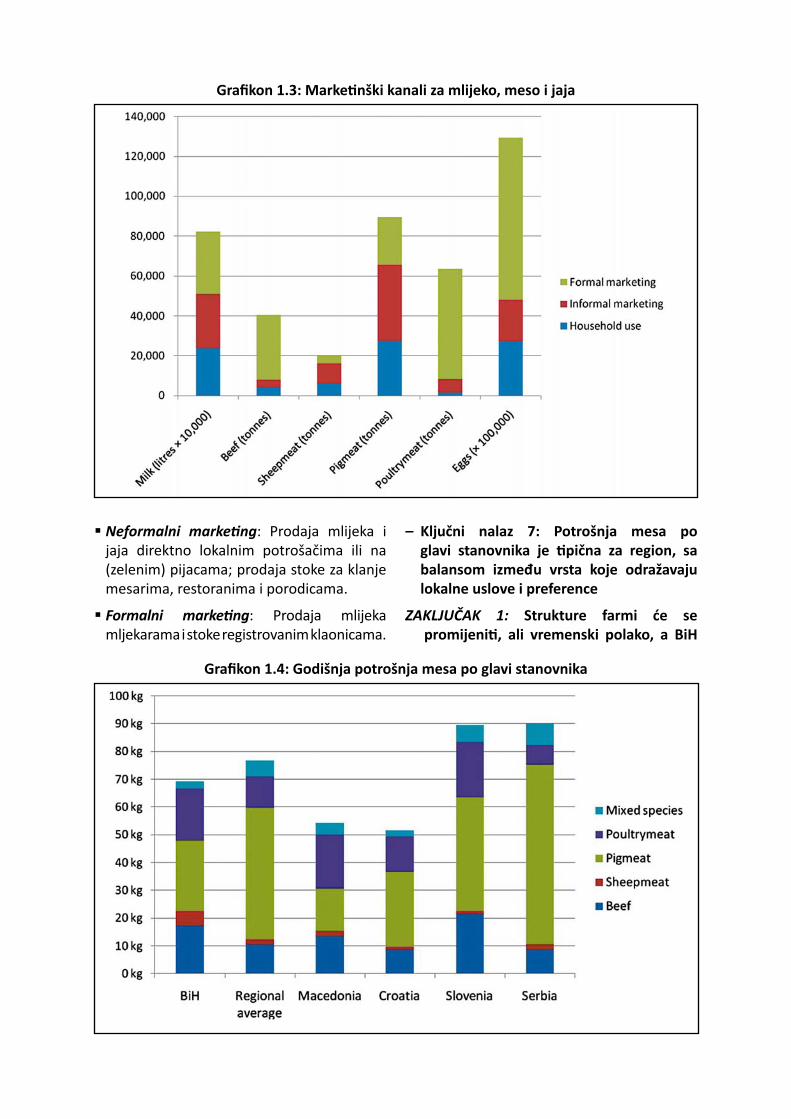
Neformalni marke ng: Prodaja mlijeka i jaja direktno lokalnim potrošačima ili na (zelenim) pijacama; prodaja stoke za klanje mesarima, restoranima i porodicama.
Formalni marke ng: Prodaja mlijeka mljekarama i stoke registrovanim klaonicama.
– Ključni nalaz 7: Potrošnja mesa po glavi stanovnika je pična za region, sa balansom između vrsta koje odražavaju lokalne uslove i preference
ZAKL JUČAK 1: Strukture farmi će se promijeni , ali vremenski polako, a BiH
Grafi kon 1.3: Marke nški kanali za mlijeko, meso i jaja
Grafi kon 1.4: Godišnja potrošnja mesa po glavi stanovnika
treba da planira ulazak u EU sa stočarskim sektorom kojim dominiraju male farme
ZAKL JUČAK 2: Broj farmi dovoljno velikih da budu uspješno konkurentne za IPARD grantove je mali, i većina farmi će zah jeva dodatne izvore inves ranja
1.3 Prerađivači
Poglavlje 3 daje sistemski opis formalne proizvodnje mlijeka i mliječnih proizvoda u Bosni i Hercegovini, a prvenstveno se zasniva na anke izvršenoj licem u lice sa proizvođačima od strane projektnog ma.
– Ključni nalaz 8: Prerađivački sektor se oporavio nakon rata, u nekim slučajevima čak uspijeva i da “prevaziđe” susjedne zemlje
– Ključni nalaz 9: Prikupljanje mlijeka je raznovrsno, a uključuje otkupne centre i posrednike kao i direktno prikupljanje od strane mljekara, a određene količine sirovog mlijeka još uvijek nije rashlađeno
– Ključni nalaz 10: Dnevno prikupljanje mlijeka po farmi je neznatno (cca. 26 litara), čime se povećava jedinična cijena
– Ključni nalaz 11: Tes ranje sirovog mlijeka teče dobro u RS, ali ne i u FBiH
– Ključni nalaz 12: Proizvodnja mlijeka je dvomodna
Više od 75 % prikupljenog mlijeka obrađuje 7 mljekara Oko 50 mljekara, plus nepoznat broj mikro mljekara obrađuje preostalih 25 %
– Ključni nalaz 13: Većina mljekara se koncentrise na etablirane regionalne proizvode, sa većim mljekarama koje također proizvode UHT mlijeko
– Ključni nalaz 14: Većina mljekara je u dobrom stanju u tehničkom i fi nansijskom smislu, a gotove sve imaju HACCP ser fi kat
– Ključni nalaz 15: Osnovne potrebe se odnose na laboratorije, i posebno na odgovarajuće odlaganje tekućeg otpada
– Ključni nalaz 16: Prerada mlijeka kombinuje lokalne zalihe sa je inim uvozom
Proizvođači navode da: Meso lokalnih proizvođača je do 30 % skuplje nego uvoz Kvaliteta uveženog mesa je dosta adekvatna obradi Željeli bi da koriste više uveženog mesa
– Ključni nalaz 17: Asor man mesnih proizvoda je tradicionalan, usmjeren ka lokalnom i CEFTA tržištu, sa dobrom kontrolom kvaliteta i pakiranjem
– Ključni nalaz 18: Tvornice za mesnu preradu subrom stanju, ali neophodna su znatna ulaganja u klaonice za crveno meso
– Ključni nalaz 19: BiH nema odgovarajući sistem odlaganja otpada iz klaonica kao ni uginule ili oboljele stoke
ZAKL JUČAK 3: Mljekare i proizvođači mlijeka treba da učine svoj asor man raznolikijim kako bi prodrli na tržište EU – ali imaju male pods caje na inovacije bez pristupa tržištu
ZAKL JUČAK 4: Kako proces EU integracije povećava pristup je inijem uvoznom mesu, benefi cije od istog će osje prerađivači, ali će to stavi dodatni pri sak na proizvođače
ZAKL JUČAK 5: Najvažniji inves cioni prioritet u preradi koji je relevantan za IPARD je tretman tekućeg otpada i odlaganje otpada
1.4 Javna poli ka
Poglavlje4 daje pregled državne podrške, regulatorne i trgovinske poli ke koje u ču stočarske farme i prerađivački; uključuje i opš uvod u strategije na državnom i en teskom nivou, koje su izrađene za svih pet sektorskih studija.
– Ključni nalaz 20: Jedinstvena administra vna struktura BiH pruža posebne izazove u smislu kreiranja poli ka, implementacije kao i sprovođenja is h
– Ključni nalaz 21: Subvencije za stočarstvo u oba en teta favorizuju veće farme i uglavnom streme ka socijalnim a ne razvojnim ciljevima
ZAKL JUČAK 6: BiH će teško dobiti EU odobrenje za izvoz mesnih proizvoda bez osiguranja unifi ciranog sistema veterinarske kontrole
ZAKL JUČAK 7: Oba en teta treba da preusmjere svoju podršku stočarstvu na manje farme kako bi se pripremile ua pristupanje EU
1.5 Marke ng
Poglavlje 5 daje prikaz raznih domaćih marke nških kanala koji se koriste u stočarstvu i proizvode; prezentuje sistemsku analizu trgovinskih podataka i iden fi kuje glavne trgovinske partnere BiH za svaku vrstu stočarskog proizvoda; prezentuje balans između nabavke i upotrebe, u smislu vrijednos , za čitav sektor stočarstva.
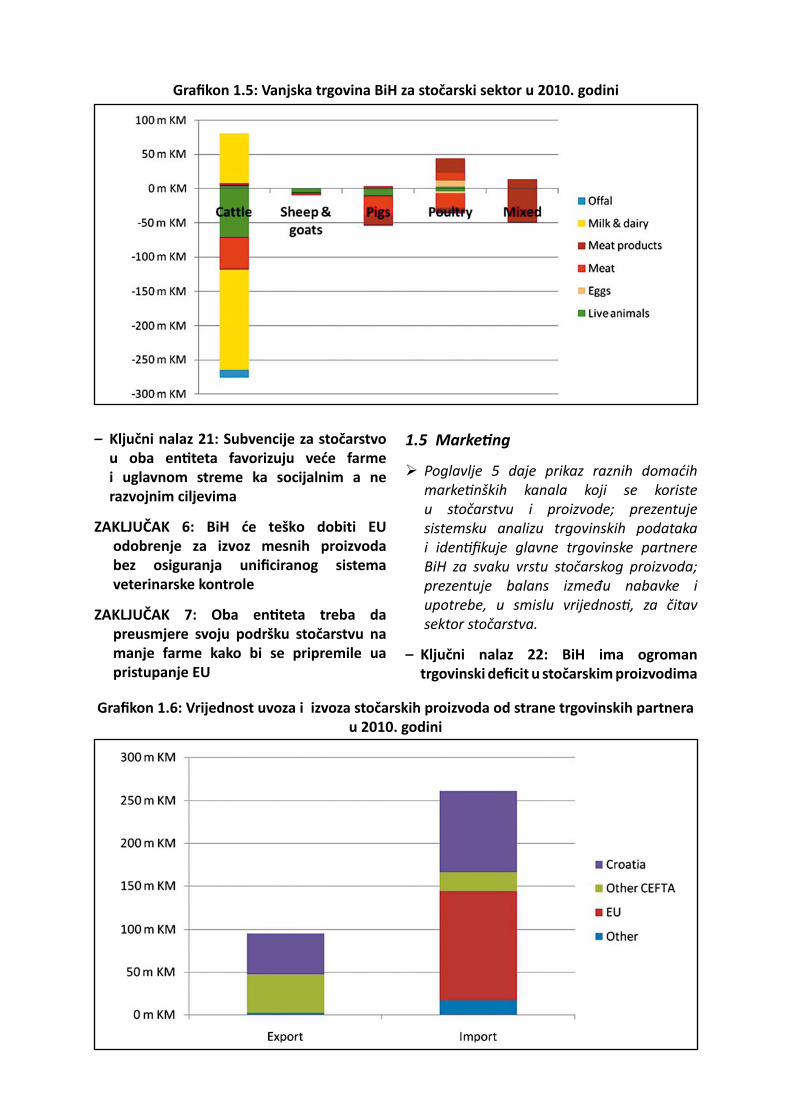
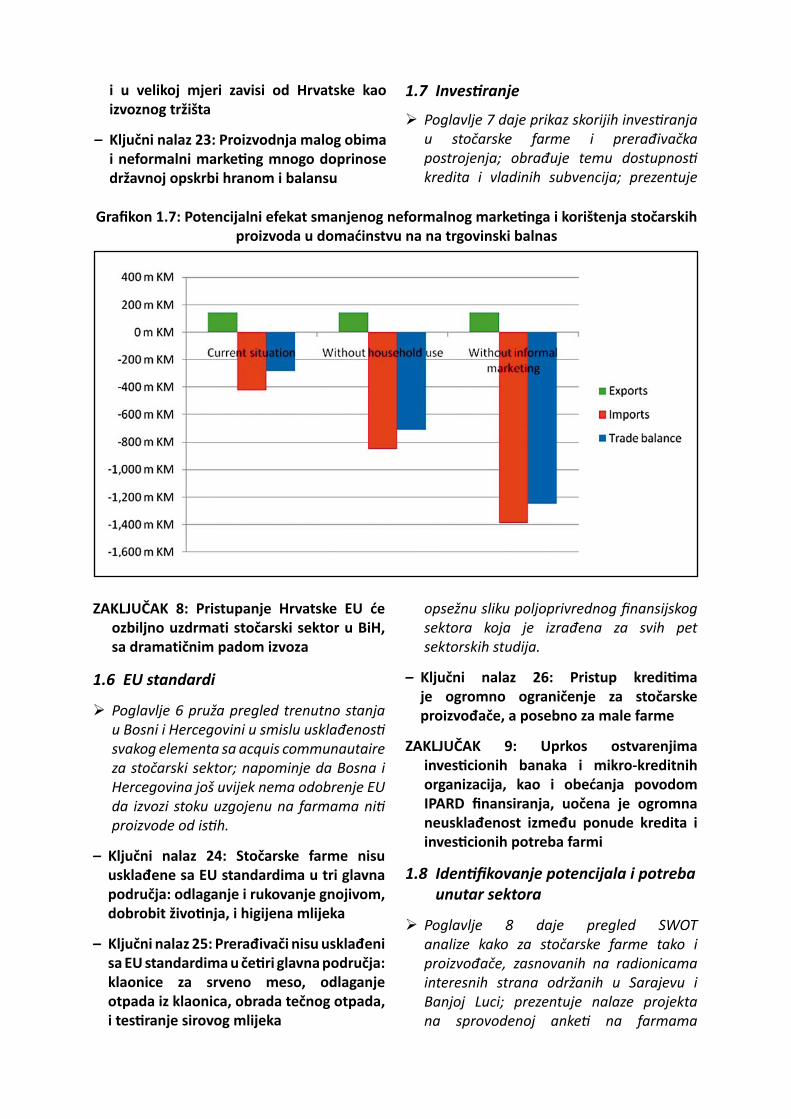
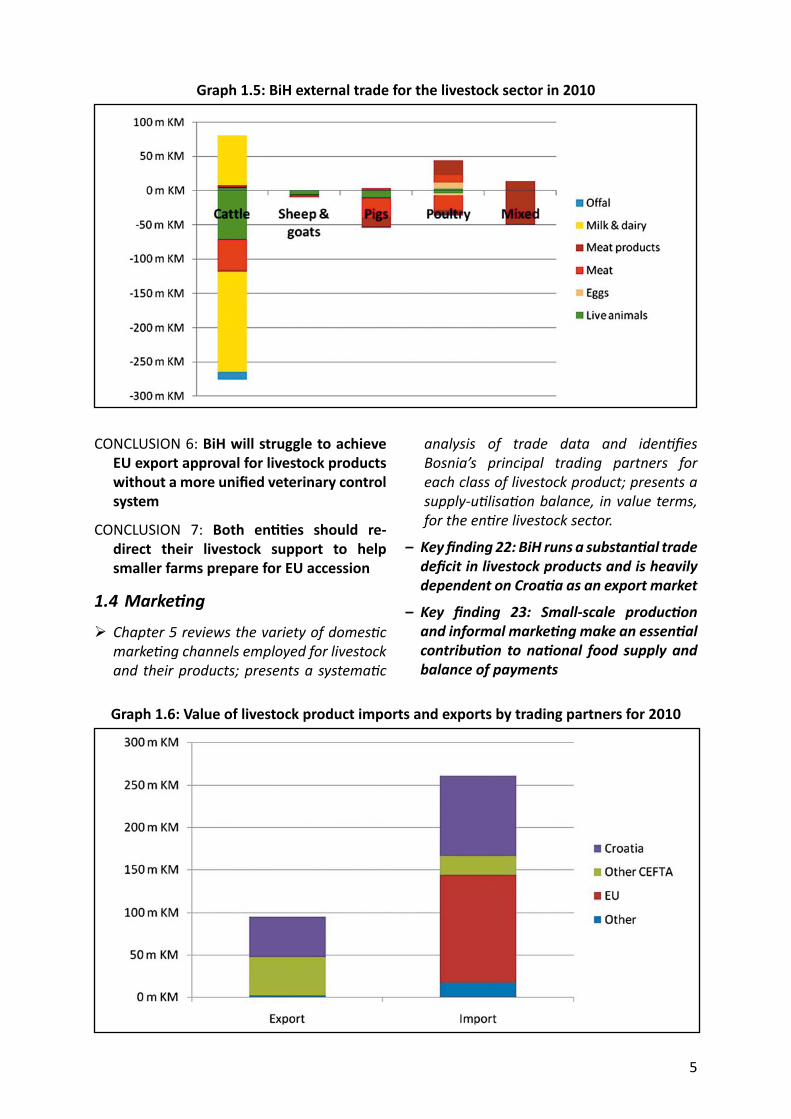
– Ključni nalaz 22: BiH ima ogroman trgovinski defi cit u stočarskim proizvodima
Grafi kon 1.5: Vanjska trgovina BiH za stočarski sektor u 2010. godini
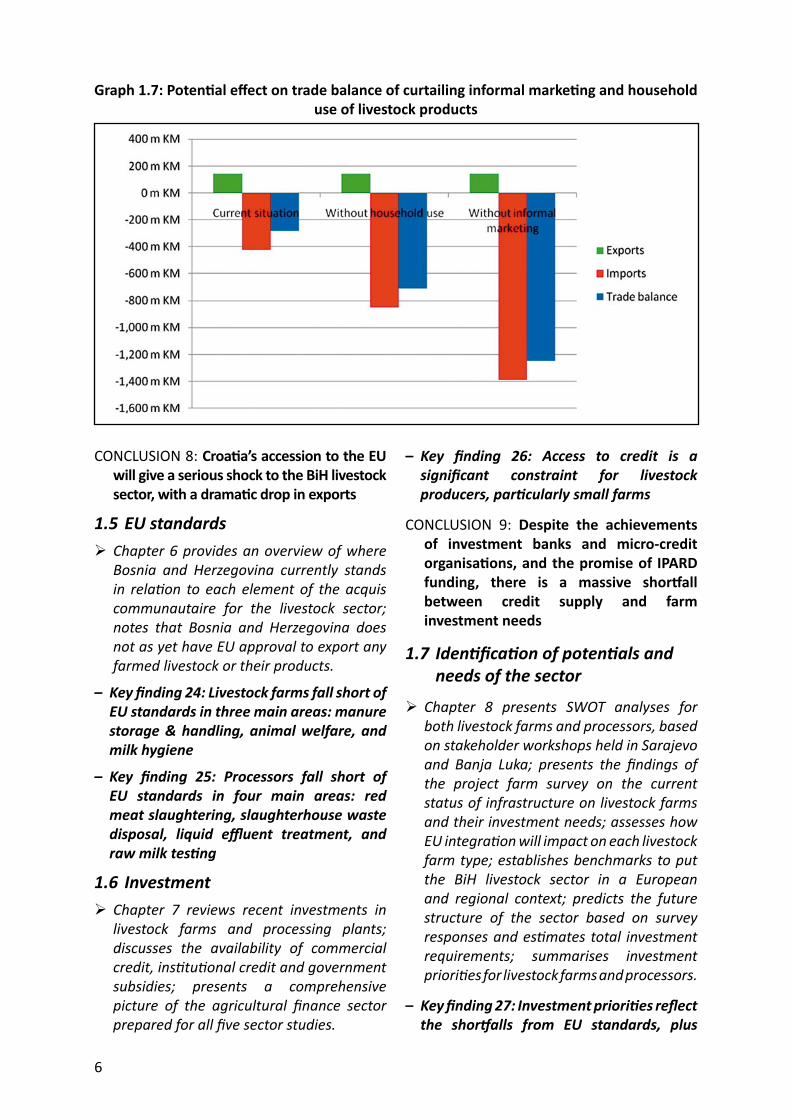
Grafi kon 1.6: Vrijednost uvoza i izvoza stočarskih proizvoda od strane trgovinskih partnera u 2010. godini
i u velikoj mjeri zavisi od Hrvatske kao izvoznog tržišta
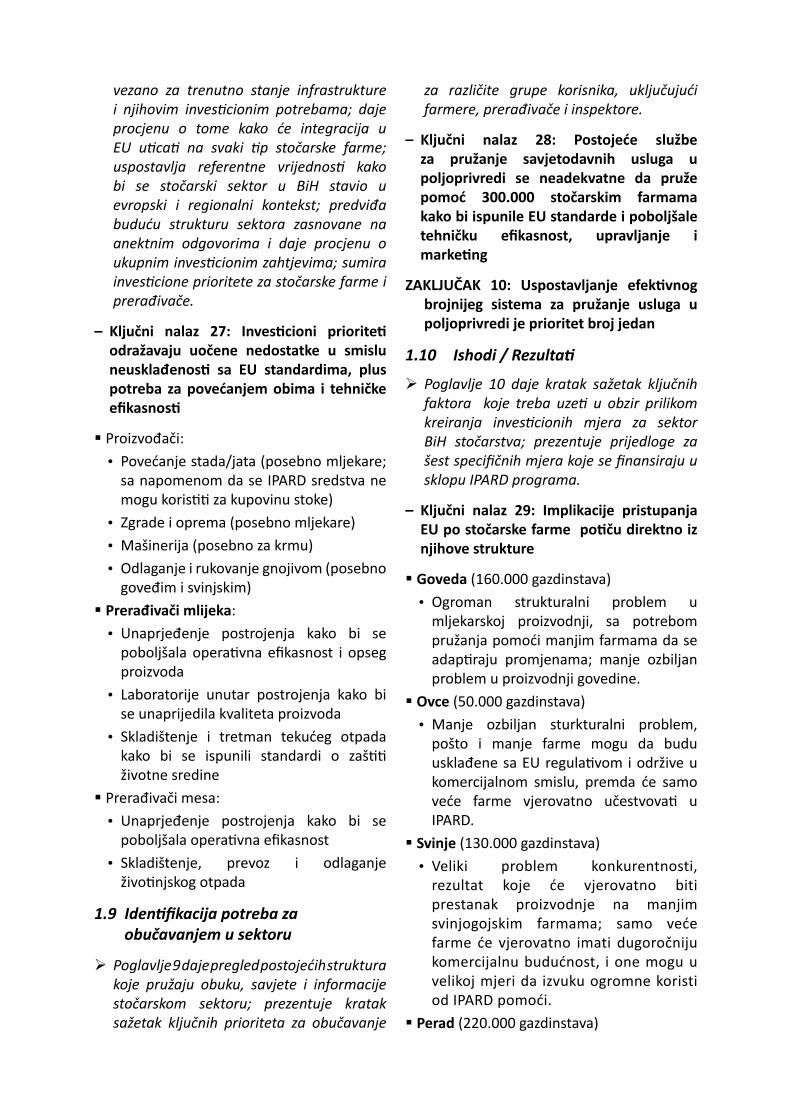
– Klju čni nalaz 23: Proizvodnja malog obima i neformalni marke ng mnogo doprinose državnoj opskrbi hranom i balansu
1.7 Inves ranje
Poglavlje 7 daje prikaz skorijih inves ranja u stočarske farme i prerađivačka postrojenja; obrađuje temu dostupnos kredita i vladinih subvencija; prezentuje
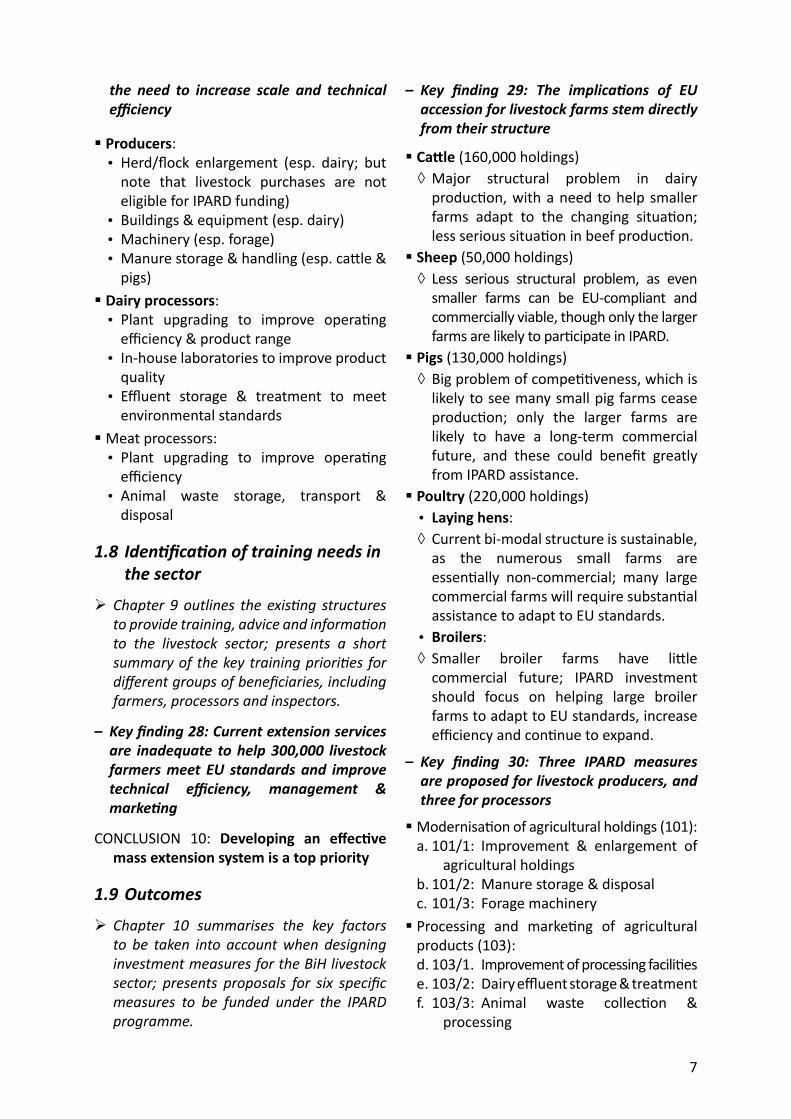
Grafi kon 1.7: Potencijalni efekat smanjenog neformalnog marke nga i korištenja stočarskih proizvoda u domaćinstvu na na trgovinski balnas
ZAKLJUČ AK 8: Pristupanje Hrvatske EU će ozbiljno uzdrmati stočarski sektor u BiH, sa dramatičnim padom izvoza
1.6 EU standardi
Poglavlje 6 pruža pregled trenutno stanja u Bosni i Hercegovini u smislu usklađenos svakog elementa sa acquis communautaire za stočarski sektor; napominje da Bosna i Hercegovina još uvijek nema odobrenje EU da izvozi stoku uzgojenu na farmama ni proizvode od is h.
– Ključni nalaz 24: Stočarske farme nisu usklađene sa EU standardima u tri glavna područja: odlaganje i rukovanje gnojivom, dobrobit živo nja, i higijena mlijeka
– Ključni nalaz 25: Prerađivači nisu usklađeni sa EU standardima u če ri glavna područja: klaonice za srveno meso, odlaganje otpada iz klaonica, obrada tečnog otpada, i tes ranje sirovog mlijeka
opsežnu sliku poljoprivrednog fi nansijskog sektora koja je izrađena za svih pet sektorskih studija.
– Ključni nalaz 26: Pristup kredi ma je ogromno ograničenje za stočarske proizvođače, a posebno za male farme
ZAKLJUČ AK 9: Uprkos ostvarenjima inves cionih banaka i mikro-kreditnih organizacija, kao i obećanja povodom IPARD fi nansiranja, uočena je ogromna neusklađenost između ponude kredita i inves cionih potreba farmi
1.8 Iden fi kovanje potencijala i potreba unutar sektora
Poglavlje 8 daje pregled SWOT analize kako za stočarske farme tako i proizvođače, zasnovanih na radionicama interesnih strana održanih u Sarajevu i Banjoj Luci; prezentuje nalaze projekta na sprovodenoj anke na farmama
vezano za trenutno stanje infrastrukture i njihovim inves cionim potrebama; daje procjenu o tome kako će integracija u EU u ca na svaki p stočarske farme; uspostavlja referentne vrijednos kako bi se stočarski sektor u BiH stavio u evropski i regionalni kontekst; predviđa buduću strukturu sektora zasnovane na anektnim odgovorima i daje procjenu o ukupnim inves cionim zahtjevima; sumira inves cione prioritete za stočarske farme i prerađivače.
– Ključni nalaz 27: Inves cioni priorite odražavaju uočene nedostatke u smislu neusklađenos sa EU standardima, plus potreba za povećanjem obima i tehničke efi kasnos
Proizvođači:• Povećanje stada/jata (posebno mljekare;
sa napomenom da se IPARD sredstva ne mogu koris za kupovinu stoke)
• Zgrade i oprema (posebno mljekare)• Mašinerija (posebno za krmu)• Odlaganje i rukovanje gnojivom (posebno
goveđim i svinjskim) Prerađivači mlijeka:• Unaprjeđenje postrojenja kako bi se
poboljšala opera vna efi kasnost i opseg proizvoda
• Laboratorije unutar postrojenja kako bi se unaprijedila kvaliteta proizvoda
• Skladištenje i tretman tekućeg otpada kako bi se ispunili standardi o zaš životne sredine
Prerađivači mesa:• Unaprjeđenje postrojenja kako bi se
poboljšala opera vna efi kasnost • Skladištenje, prevoz i odlaganje
živo njskog otpada
1.9 Iden fi kacija potreba za obučavanjem u sektoru
Poglavlje 9 daje pregled postojećih struktura koje pružaju obuku, savjete i informacije stočarskom sektoru; prezentuje kratak sažetak ključnih prioriteta za obučavanje
za različite grupe korisnika, uključujući farmere, prerađivače i inspektore.
– Ključni nalaz 28: Postojeće službe za pružanje savjetodavnih usluga u poljoprivredi se neadekvatne da pruže pomoć 300.000 stočarskim farmama kako bi ispunile EU standarde i poboljšale tehničku efi kasnost, upravljanje i marke ng
ZAKLJUČ AK 10: Uspostavljanje efek vnog brojnijeg sistema za pružanje usluga u poljoprivredi je prioritet broj jedan
1.10 Ishodi / Rezulta
Poglavlje 10 daje kratak sažetak ključnih faktora koje treba uze u obzir prilikom kreiranja inves cionih mjera za sektor BiH stočarstva; prezentuje prijedloge za šest specifi čnih mjera koje se fi nansiraju u sklopu IPARD programa.
– Ključni nalaz 29: Implikacije pristupanja EU po stočarske farme po ču direktno iz njihove strukture
Goveda (160.000 gazdinstava)• Ogroman strukturalni problem u
mljekarskoj proizvodnji, sa potrebom pružanja pomoći manjim farmama da se adap raju promjenama; manje ozbiljan problem u proizvodnji govedine.
Ovce (50.000 gazdinstava)• Manje ozbiljan sturkturalni problem,
pošto i manje farme mogu da budu usklađene sa EU regula vom i održive u komercijalnom smislu, premda će samo veće farme vjerovatno učestvova u IPARD.
Svinje (130.000 gazdinstava)• Veliki problem konkurentnosti,
rezultat koje će vjerovatno biti prestanak proizvodnje na manjim svinjogojskim farmama; samo veće farme će vjerovatno imati dugoročniju komercijalnu budućnost, i one mogu u velikoj mjeri da izvuku ogromne koristi od IPARD pomoći.
Perad (220.000 gazdinstava)
• Kvočke: » Trenutna dvomodalna stuktura je održiva, pošto je veliki broj malih farmi u suš ni nekomercijalan; mnoge velike komercijalne farme će zah jeva značajnu podršku kako bi se uskladile sa EU standardima.
• Brojleri: » Manje farme brojlera imaju neznatnu komercijalnu budućnost; IPARD ulaganje treba da se fokusira na pomaganje velikim farmama brojlera da se usklade sa EU standardima, povećaju efi kasnost i da nastave da se šire.
– Ključni nalaz 30: 3 IPARD mjere su predložene za proizvođače a tri za prerađivače stočarskih proizvoda
Modernizacija poljoprivrednog gazdinstva (101):
a. 101/1: Unaprjeđenje i uvećanje poljoprivrednog gazdinstva
b. 101/2: Skladištenje i odlaganje gnojiva
c. 101/3: Mašinerija za krmno bilje
Obrada i marke ng poljoprivrednih proizvoda (103):
a. 103/1. Unaprjeđenje prerađivačkih postrojenja
b. 103/2: Skladištenje i odlaganje mljekarskog tekućeg otpada
c. 103/3: Sakupljanje i obrada živo njskog otpada
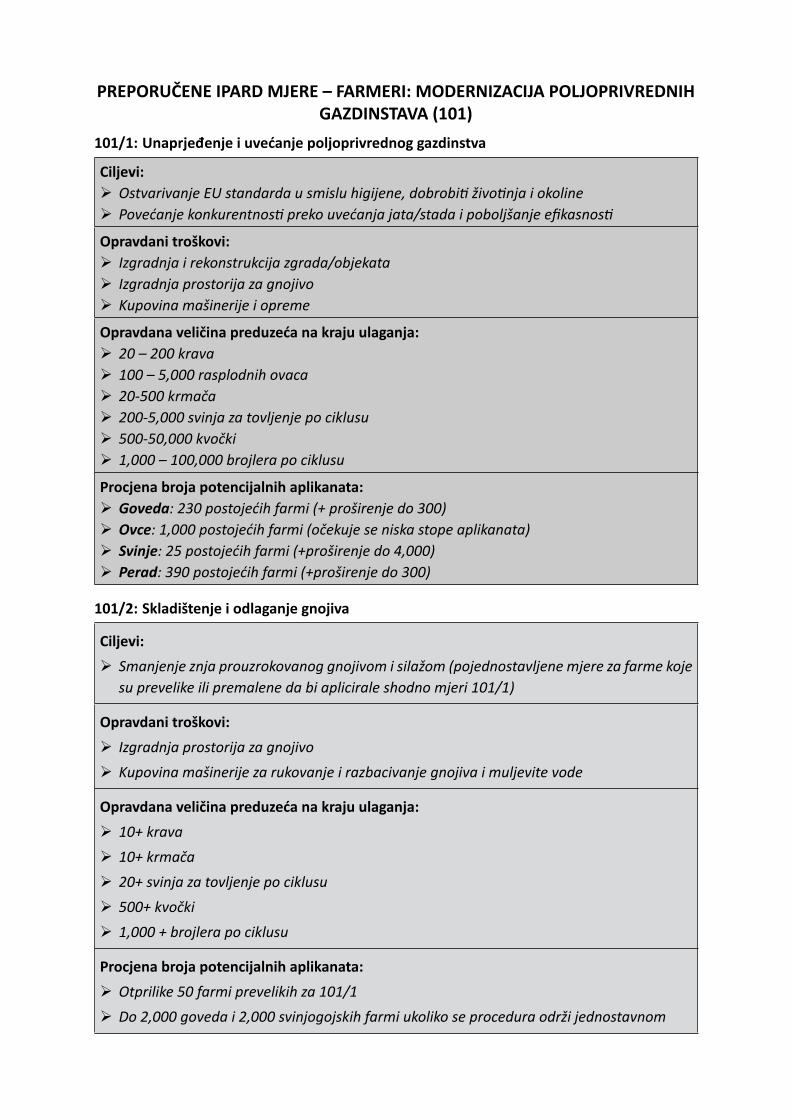
PREPORUČENE IPARD MJERE – FARMERI: MODERNIZACIJA POLJOPRIVREDNIH GAZDINSTAVA (101)
101/1: Unaprjeđenje i uvećanje poljoprivrednog gazdinstva
Ciljevi: Ostvarivanje EU standarda u smislu higijene, dobrobi živo nja i okoline Povećanje konkurentnos preko uvećanja jata/stada i poboljšanje efi kasnos
Opravdani troškovi: Izgradnja i rekonstrukcija zgrada/objekata Izgradnja prostorija za gnojivo Kupovina mašinerije i opreme
Opravdana veličina preduzeća na kraju ulaganja: 20 – 200 krava 100 – 5,000 rasplodnih ovaca 20-500 krmača 200-5,000 svinja za tovljenje po ciklusu 500-50,000 kvočki 1,000 – 100,000 brojlera po ciklusu
Procjena broja potencijalnih aplikanata: Goveda: 230 postojećih farmi (+ proširenje do 300) Ovce: 1,000 postojećih farmi (očekuje se niska stope aplikanata) Svinje: 25 postojećih farmi (+proširenje do 4,000) Perad: 390 postojećih farmi (+proširenje do 300)
101/2: Skladištenje i odlaganje gnojiva
Ciljevi: Smanjenje znja prouzrokovanog gnojivom i silažom (pojednostavljene mjere za farme koje su prevelike ili premalene da bi aplicirale shodno mjeri 101/1)
Opravdani troškovi: Izgradnja prostorija za gnojivo Kupovina mašinerije za rukovanje i razbacivanje gnojiva i muljevite vode
Opravdana veličina preduzeća na kraju ulaganja: 10+ krava 10+ krmača 20+ svinja za tovljenje po ciklusu 500+ kvočki 1,000 + brojlera po ciklusu
Procjena broja potencijalnih aplikanata: Otprilike 50 farmi prevelikih za 101/1 Do 2,000 goveda i 2,000 svinjogojskih farmi ukoliko se procedura održi jednostavnom
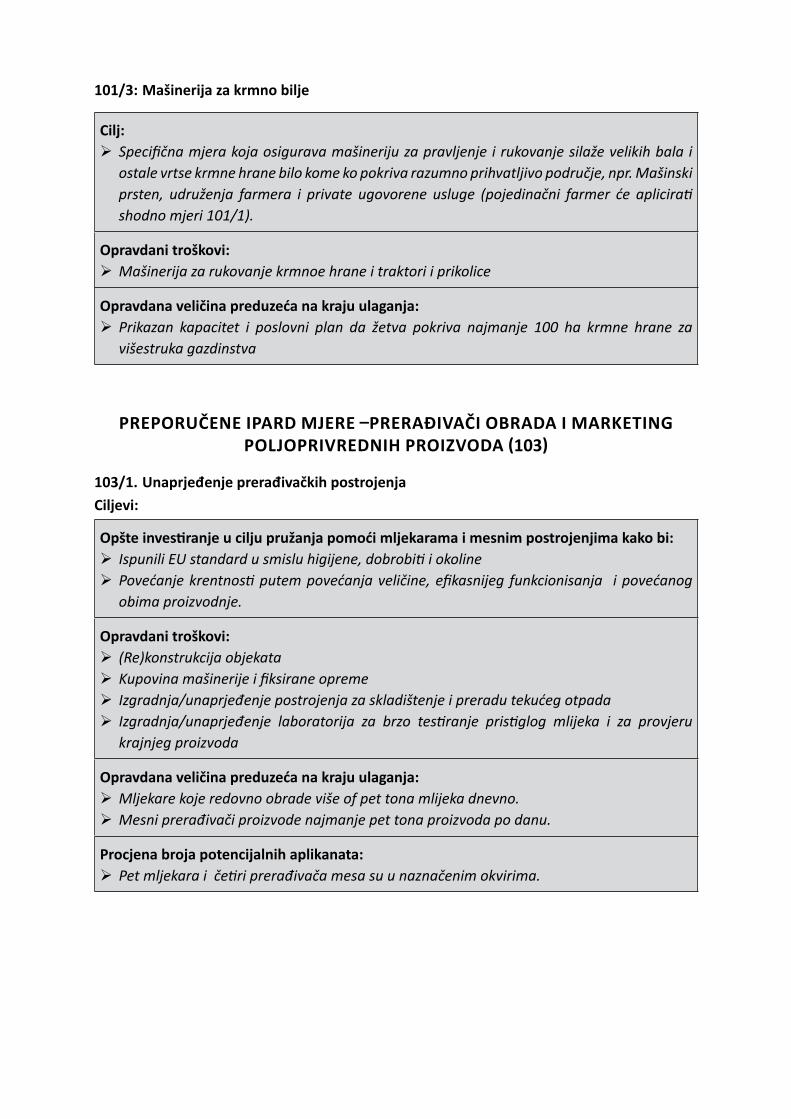
PREPORUČENE IPARD MJERE PRERAĐIVAČI OBRADA I MARKETING POLJOPRIVREDNIH PROIZVODA 103
103/1. Unaprjeđenje prerađivačkih postrojenja Ciljevi:
Opšte inves ranje u cilju pružanja pomoći mljekarama i mesnim postrojenjima kako bi: Ispunili EU standard u smislu higijene, dobrobi i okoline Povećanje krentnos putem povećanja veličine, efi kasnijeg funkcionisanja i povećanog obima proizvodnje.
Opravdani troškovi: (Re)konstrukcija objekata Kupovina mašinerije i fi ksirane opreme Izgradnja/unaprjeđenje postrojenja za skladištenje i preradu tekućeg otpada Izgradnja/unaprjeđenje laboratorija za brzo tes ranje pris glog mlijeka i za provjeru krajnjeg proizvoda
Opravdana veličina preduzeća na kraju ulaganja: Mljekare koje redovno obrade više of pet tona mlijeka dnevno. Mesni prerađivači proizvode najmanje pet tona proizvoda po danu.
Procjena broja potencijalnih aplikanata: Pet mljekara i če ri prerađivača mesa su u naznačenim okvirima.
101/3: Mašinerija za krmno bilje
Cilj: Specifi čna mjera koja osigurava mašineriju za pravljenje i rukovanje silaže velikih bala i ostale vrtse krmne hrane bilo kome ko pokriva razumno prihvatljivo područje, npr. Mašinski prsten, udruženja farmera i private ugovorene usluge (pojedinačni farmer će aplicira shodno mjeri 101/1).
Opravdani troškovi: Mašinerija za rukovanje krmnoe hrane i traktori i prikolice
Opravdana veličina preduzeća na kraju ulaganja: Prikazan kapacitet i poslovni plan da žetva pokriva najmanje 100 ha krmne hrane za višestruka gazdinstva
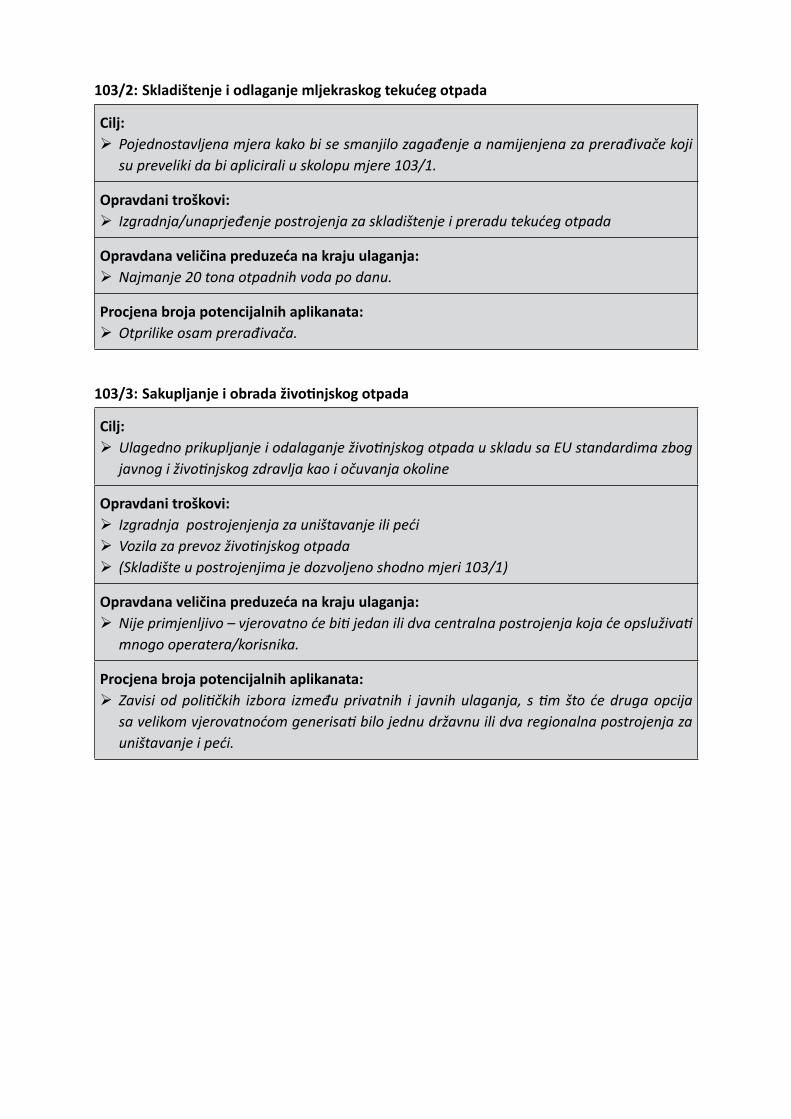
103/2: Skladištenje i odlaganje mljekraskog tekućeg otpada
Cilj: Pojednostavljena mjera kako bi se smanjilo zagađenje a namijenjena za prerađivače koji su preveliki da bi aplicirali u skolopu mjere 103/1.
Opravdani troškovi: Izgradnja/unaprjeđenje postrojenja za skladištenje i preradu tekućeg otpada
Opravdana veličina preduzeća na kraju ulaganja: Najmanje 20 tona otpadnih voda po danu.
Procjena broja potencijalnih aplikanata: Otprilike osam prerađivača.
103/3: Sakupljanje i obrada živo njskog otpada
Cilj: Ulagedno prikupljanje i odalaganje živo njskog otpada u skladu sa EU standardima zbog javnog i živo njskog zdravlja kao i očuvanja okoline
Opravdani troškovi: Izgradnja postrojenjenja za uništavanje ili peći Vozila za prevoz živo njskog otpada (Skladište u postrojenjima je dozvoljeno shodno mjeri 103/1)
Opravdana veličina preduzeća na kraju ulaganja: Nije primjenljivo – vjerovatno će bi jedan ili dva centralna postrojenja koja će opsluživa mnogo operatera/korisnika.
Procjena broja potencijalnih aplikanata: Zavisi od poli čkih izbora između privatnih i javnih ulaganja, s m što će druga opcija sa velikom vjerovatnoćom generisa bilo jednu državnu ili dva regionalna postrojenja za uništavanje i peći.
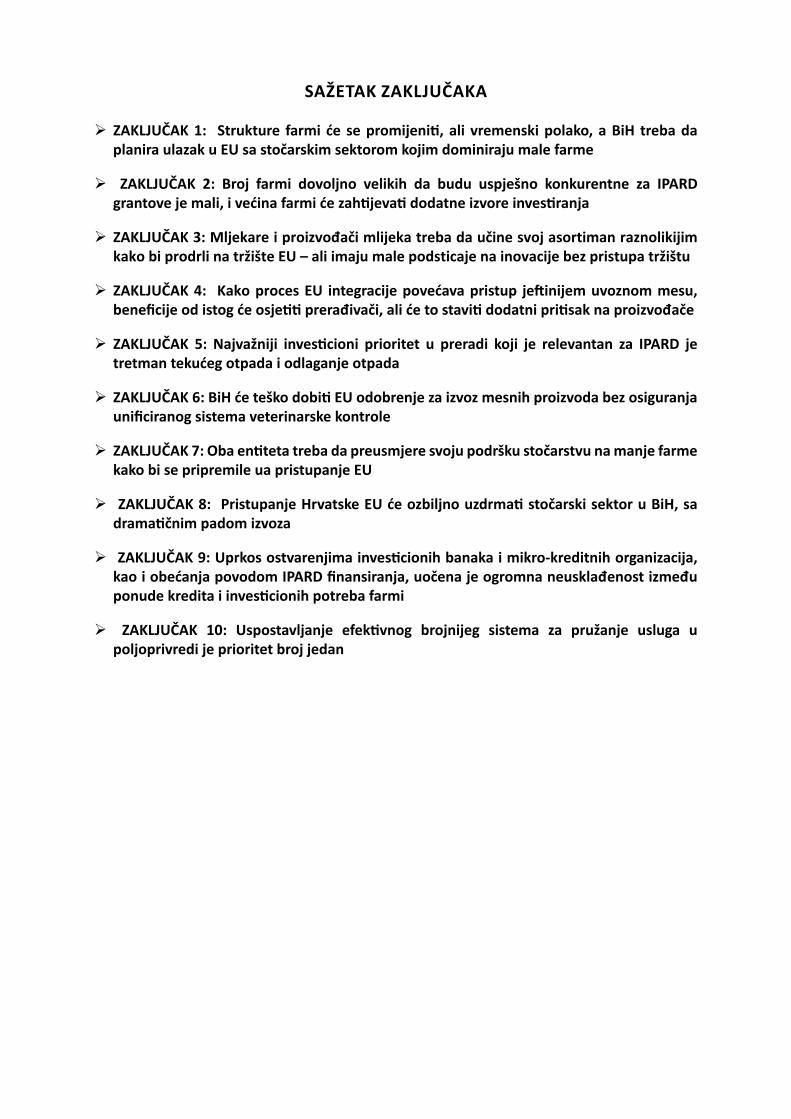
SAŽETAK ZAKLJUČAKA
ZAKLJUČAK 1: Strukture farmi će se promijeni , ali vremenski polako, a BiH treba da planira ulazak u EU sa stočarskim sektorom kojim dominiraju male farme
ZAKLJUČAK 2: Broj farmi dovoljno velikih da budu uspješno konkurentne za IPARD grantove je mali, i većina farmi će zah jeva dodatne izvore inves ranja
ZAKLJUČAK 3: Mljekare i proizvođači mlijeka treba da učine svoj asortiman raznolikijim kako bi prodrli na tržište EU – ali imaju male podsticaje na inovacije bez pristupa tržištu
ZAKLJUČAK 4: Kako proces EU integracije povećava pristup je inijem uvoznom mesu, benefi cije od istog će osje prerađivači, ali će to stavi dodatni pri sak na proizvođače
ZAKLJUČAK 5: Najvažniji inves cioni prioritet u preradi koji je relevantan za IPARD je tretman tekućeg otpada i odlaganje otpada
ZAKLJUČAK 6: BiH će teško dobi EU odobrenje za izvoz mesnih proizvoda bez osiguranja unifi ciranog sistema veterinarske kontrole
ZAKLJUČAK 7: Oba en teta treba da preusmjere svoju podršku stočarstvu na manje farme kako bi se pripremile ua pristupanje EU
ZAKLJUČAK 8: Pristupanje Hrvatske EU će ozbiljno uzdrma stočarski sektor u BiH, sa drama čnim padom izvo za
ZAKLJUČAK 9: Uprkos ostvarenjima inves cionih banaka i mikro-kreditnih organizacija, kao i obećanja povodom IPARD fi nansiranja, uočena je ogromna neusklađenost između ponude kredita i inves cionih potreba far mi
ZAKLJUČAK 10: Uspostavljanje efek vnog brojnijeg sistema za pružanje usluga u poljoprivredi je prioritet broj jedan
i
Table of Contents
ABBREVIATIONS AND ACRONYMS vii
INTRODUCTION ix
1. EXECUTIVE SUMMARY 1
1.1 B 11.1 F 11.2 P 41.3 P 41.4 M 51.5 EU 61.6 I 61.7 I 61.8 I 71.9 O 7
2. BACKGROUND AND KEY FIGURES 13
2.1 G B H 132.2 C 15
2.2.1 General context of the sector analyses: Prepara on for EU accession 152.2.2 Sector context 15
2.3 G B H 162.4 A 182.5 T B H 22
3. FARMERS 23
3.1 M 233.1.1 Strengths and weaknesses of each dataset 233.1.2 Methodology to combine data sources 243.1.3 Comparison of results from diff erent data sources 27
3.2 O 293.2.1 Age and succession 293.2.2 Farm household income 30
3.3 C 313.3.1 Sta s cal overview 313.3.2 Typology of ca le farms 323.3.3 Ca le breed and herd structure 373.3.4 Milk produc on and marke ng 383.3.5 Beef produc on and marke ng 42
3.4 S 433.4.1 Sta s cal overview 443.4.2 Typology of sheep farms 453.4.3 Marke ng of sheep meat 47
3.5 P 493.5.1 Sta s cal overview 493.5.2 Typology of pig farms 503.5.3 Marke ng of pig meat 53
ii
3.6 P 543.6.1 Sta s cal overview 543.6.2 Typology of poultry farms 563.6.3 Marke ng of poultry meat and eggs 59
3.7 M 613.7.1 Sta s cs on animals and milk produc on by species 613.7.2 Milking sheep case study 633.7.3 Economic issues 64
3.8 E G O 653.9 S 663.10 S -U B 70
4. PROCESSING 73
4.1 R 734.2 F 75
4.2.1 Milk collec on and transport 754.2.2 Livestock marke ng 77
4.3 M 784.3.1 Recent development of the dairy processing sector 784.3.2 Current structure of the dairy processing industry 804.3.3 Raw milk deliveries for processing 814.3.4 Produc on profi les of dairies 814.3.5 Milk and dairy products manufactured 824.3.6 Assessment of visited dairies 844.3.7 Financial state of dairies 844.3.8 Interna onal comparisons 84
4.4 M 854.4.1 Background 854.4.2 Raw material sources 854.4.3 Slaughtering 864.4.4 Processing plants 874.4.5 Product range 884.4.6 The market 894.4.7 Management and fi nance 894.4.8 Meat processing survey 89
4.5 C 91
5. GOVERNMENT POLICY FOR THE SECTOR 93
5.1 P - 935.2 S 93
5.2.1 State level strategy 935.2.2 Strategy within the Federa on of Bosnia and Herzegovina 965.2.3 Strategy within Republika Srpska 975.2.4 Strategy within Brčko District 985.2.5 Conclusions on the strategic planning framework 99
5.3 D 995.3.1 Livestock support in Federa on of Bosnia and Herzegovina 995.3.2 Livestock support in Republika Srpska 1045.3.3 Livestock support in Brčko District 1055.3.4 Average support payments received 105
iii
5.4 T 1055.5 R 1075.6 C 109
6. MARKETS AND TRADE 111
6.1 O 1116.1.1 Factors underlying the current situa on 111
6.2 D 1136.2.1 Marke ng of milk and dairy products 1136.2.2 The market for milk and dairy products 1146.2.3 Domes c market channels 114
6.3 I 1166.3.1 Trade balance by product 1176.3.2 Principal trading partners 1196.3.3 The threat of EU enlargement 124
6.4 S 1256.5 T - 1256.6 S 129
7. LEVEL OF ATTAINMENT OF RELEVANT EU STANDARDS 131
7.1 EU 1317.2 S 131
7.2.1 Animal health 1317.2.2 Animal welfare 1317.2.3 Animal iden fi ca on 134
7.3 M 1347.3.1 EU standards in force 1347.3.2 Recent ac ons to achieve EU standards 1357.3.3 Factors aff ec ng milk quality 137
7.4 S 1387.4.1 Dairy processors 1387.4.2 Meat processors 138
7.5 E EU 1397.6 C EU 139
8. INVESTMENT TRENDS AND FUTURE DEVELOPMENTS 141
8.1 R 1418.1.1 Investments on farms 1418.1.2 Investments in processing 141
8.2 T B H 1428.2.1 Financing through commercial banks 1438.2.2 Lending through microcredit organiza ons and companies 1468.2.3 Lending through savings and credit organiza ons 1488.2.4 Guarantee Funds 1498.2.5 Leasing 150
8.3 P 1508.4 C 151
9. IDENTIFICATION OF POTENTIAL AND NEEDS OF THE SECTOR 153
9.1 M 153
iv
9.2 S , W , O T (SWOT) 1539.2.1 Strengths 1549.2.2 Weaknesses 1549.2.3 Opportuni es 1559.2.4 Threats 156
9.3 SWOT 1579.4 I 158
9.4.1 Infrastructure on ca le farms 1589.4.2 Infrastructure on sheep farms 1599.4.3 Infrastructure on pig farms 1599.4.4 Infrastructure on poultry farms 159
9.5 T EU 1599.5.1 Ca le 1599.5.2 Sheep 1649.5.3 Pigs 1659.5.4 Poultry 1679.5.5 Processors 168
9.6 B 1689.6.1 Ca le 1699.6.2 Sheep 1739.6.3 Pigs 1759.6.4 Poultry 1779.6.5 Livestock farm structures 180
9.7 E - 1809.7.1 Poten al changes in farm structures 1819.7.2 Investment costs 1879.7.3 Investment requirements 189
9.8 C : I 1909.8.1 Priority investments on farms 1919.8.2 Priority investments in processing 192
10. IDENTIFICATION OF TRAINING NEEDS IN THE SECTOR 193
10.1 C , 19310.2 G EU 19410.3 T 19410.4 T 19610.5 T 19810.6 C 198
11. OUTCOMES 199
11.1 S 19911.1.1 Key investment needs 19911.1.2 Key constraints 19911.1.3 Farm size distribu on 199
11.2 P IPARD 20011.2.1 Measure 101/1: Improvement and enlargement of agricultural holdings 20011.2.2 Measure 101/2: Manure storage and disposal 20111.2.3 Measure 101/3: Forage machinery 20211.2.4 Measure 103/1: Improvement of processing facili es 20211.2.5 Measure 103/2: Dairy effl uent storage and treatment 202
v
11.2.6 Measure 103/3: Animal waste collec on and processing 20211.2.7 Measures considered but rejected 202
11.3 S EU 20311.3.1 Improving the policy and regulatory environment 20311.3.2 Improving effi ciency through extension and training 203
ANNEX 1: ANALYSIS OF POULTRY NUMBERS 205
ANNEX 2: SWOT WORKSHOP CONCLUSIONS 209
ANNEX 3: PROCESSING SURVEY QUESTIONNAIRES 215
ANNEX 4: PROCESSING CASE STUDIES 219
ANNEX 5: MILK SAMPLING NUMBERS 225
ANNEX 6: CHECKLIST FOR AN EU STANDARD DAIRY FARM 229
ANNEX 7: ESTIMATED FARM AND ANIMAL NUMBERS BY ENTITY 231

vi
vii
Abbrevia ons and Acronyms
AMIS Agricultural Market Informa on SystemBAM BiH currency; 1 EUR = 1.9558 BAMBD Brčko DistrictBHAS Bosnia and Herzegovina Agency for Sta s csBHMAC Bosnia and Herzegovina Mine Ac on CentreBiH Bosnia and HerzegovinaCAP Common Agricultural Policy CEFTA Central European Free Trade AgreementEU European UnionEUD Delega on of the European Union to Bosnia and HerzegovinaEUR EuroFADN Farm Accountancy Data NetworkFAO Food and Agriculture Organiza on of the United Na onsFBiH Federa on of Bosnia and Herzegovina FSA Food Safety Agency FVO Food and Veterinary Offi ceGAECs Good Agricultural and Environmental Condi onsGAEP Good Agricultural and Environmental Prac ceGAP Good Agricultural Prac ceGDP Gross Domes c ProductGoBiH Government of BiHGVA Gross Value AddedHa hectareHACCP Hazard Analysis Cri cal Control PointsI&R Iden fi ca on and Registra on (system)IDB Investment Development BankIFAD Interna onal Fund for Agricultural DevelopmentIFS Interna onal Food StandardIPARD Instrument for Pre-Accession Assistance for Rural DevelopmentIPHC Interna onal Plant Health Conven onISO Interna onal Organiza on for Standardiza onKg kilogramLSU livestock unitLU Legal UnitMCO microcredit organiza onMoFTER Ministry of Foreign Trade and Economic Rela onsMS Master SampleNGO non-governmental organiza onNVA Net Value AddedPAC Pilot Agricultural CensusPHPA Plant Health Protec on Administra onPPP Power Point Presenta onRASFF Rapid Alert System for Food and FeedRS Republika SrpskaSAA Stabilisa on and Associa on AgreementSAFFRD Sector for Agriculture, Food, Forestry and Rural DevelopmentSAPARD Special Accession Programme for Agriculture and Rural Development
viii
SAPS Single Area Payment SchemeSCC Soma c Cell CountSESMARD Support for Establishment of the State Ministry of Agriculture and Rural
DevelopmentSIDA Swedish Interna onal Development Coopera on AgencySPS Single Payment SchemeSWOT Strengths, Weaknesses, Opportuni es and Threats (analysis)TBC total bacterial countUNDP United Na ons Development ProgrammeUPOV Interna onal Union for the Protec on of New Varie es of PlantsVAT Value Added TaxWB World BankWTO World Trade Organiza on
Currency Equivalents
Exchange rates
USD for 1 EUR2005- 2009 1.3483
BAM for 1 USD2012 1.58557
BAM for 1 EURSince 2002 – 1.95583
European Central Bank: h p://www.ecb.int/
ix
Introduc on
Survey fi eldwork:• Agricultural extension service, Republika
Srpska• Team of assistants from the Sarajevo
Faculty of Agriculture and Food Science Support:• Vlado Pijunović, background papers• Zorica Jovanović, desk research
The report was reviewed by Gerold Boedeker, Magali Herranz, Raimund Jehle, Andriy Rozstalnyy and Dmitry Zvyagintsev (all FAO). Valuable support regarding language edi ng was provided by Tom Hunter and Valerie Guidi.
Acknowledgements
The FAO team would like to extend its sincere thanks for the assistance and close collabora on in the implementa on of the project to the following organiza ons and individuals: BiH Ministry of Foreign Trade and Economic Rela ons (MoFTER):• Dušan Nešković, Assistant Minister• Melisa Ljuša, Expert Advisor, Policy
Analysis, and key daily contact• Ms Jelena Prorok, Expert Advisor Federa on of BiH (FBiH), Ministry of Agriculture, Water Management and Forestry:• Contact point, Kasbašić Azijada Republika Srpska (RS), Ministry of Agriculture, Forestry and Water Management:• Contact point, Marko Srdić Brčko District, Department of Agriculture, Forestry and Water Management:• Contact point, Abdulah Ribić
1 The fi nal concept for pre-accession assistance to agriculture and rural development a er 2013 is not yet known, and it may be diff erent from the current IPARD model. As a ma er of simplicity, reference is made to IPARD throughout the sector analyses.
2 The University of Sarajevo team managed the farm survey and SWOT workshops in FBiH but did not par cipate in the analysis or dra ing of the report. Dra s of the report were submi ed to them for comment before being fi nalised.
This is one of fi ve sector analyses (Meat and Dairy; Fruit and Vegetables; Cereals; Wine; Diversifi ca on) prepared between spring 2011 and spring 2012 for the agricultural authori es in Bosnia and Herzegovina (BiH) at state, en ty and Brčko District level. The sector analyses are inputs for use during the design of measures to be fi nanced under the European Union (EU) Instrument for Pre-accession Assistance for Rural Development (IPARD).1 They are also for use during the design of en ty level interven ons in general. The analyses were commissioned by the EU and monitored by task manager Ms Timea Makra, EU Delega on in Sarajevo. The analyses were coordinated by Mr Morten Kvistgaard, Interna onal Team Leader under the overall management of Mr Gerold Boedeker, Budget Holder and Mr Raimund Jehle, Lead Technical Offi cer, Regional Offi ce for Europe and Central Asia of the Food and Agriculture Organiza on of the United Na ons (FAO) in Budapest.
Further informa on on the studies themselves and on the IPARD planning process is provided in Chapter 2 of this report.
Study team
This study was conducted by the following team: Core team:• Dr Steve Goss• John Howells (processing)• Dr Željko Vaško, Dr Ljiljana Drinić and
Dr Gordana Rokvić, University of Banja Luka, Ins tute of Agricultural Economics
• Dr Aleksandra Nikolić and Dragan Ognjenović, Faculty of Agriculture and Food Science, University of Sarajevo2

x
BiH Agency for Sta s cs FBiH Federal Offi ce of Sta s cs RS Ins tute of Sta s cs BiH Agency for Animal Iden fi ca on EU-funded project on “Agricultural Informa on Systems”, led by Colin Sco Vlado Cirko, for wide-ranging logis cal support
1
1. Execu ve summary
This document follows the standard format of an IPARD sectoral study, with the analysis developing progressively through the chapters as follows:
1.1 Background and key fi gures
Chapter 1 provides a general introduc on to Bosnia and Herzegovina and its livestock sector, prepared for each of the fi ve sectoral studies on the basis of published sta s cs.
– Key fi nding 1: Livestock is the most important sector in BiH agriculture
Total GDP: € 12.7 billion Agriculture GDP: € 930 million (7 percent) Livestock output: € 900 million (farm-gate value)
– Key fi nding 2: Over 300,000 agricultural holdings keep some kind of livestock, which makes a signifi cant contribu on to household income
On the surveyed farms: Milk and dairy products contributed 20 percent of household income Meat and livestock contributed 50 percent of household income
1.1 Farmers Chapter 2 presents the key sta s cal data and then develops a quan ta ve descrip on and typology of livestock farms in Bosnia and Herzegovina; and brings together sta s cal data and the fi ndings of a farm survey conducted for this study to create
comprehensive es mates of fl ock and herd numbers, animal numbers, and milk and meat produc on and marke ng for each farm type, with es mates of value and volume.
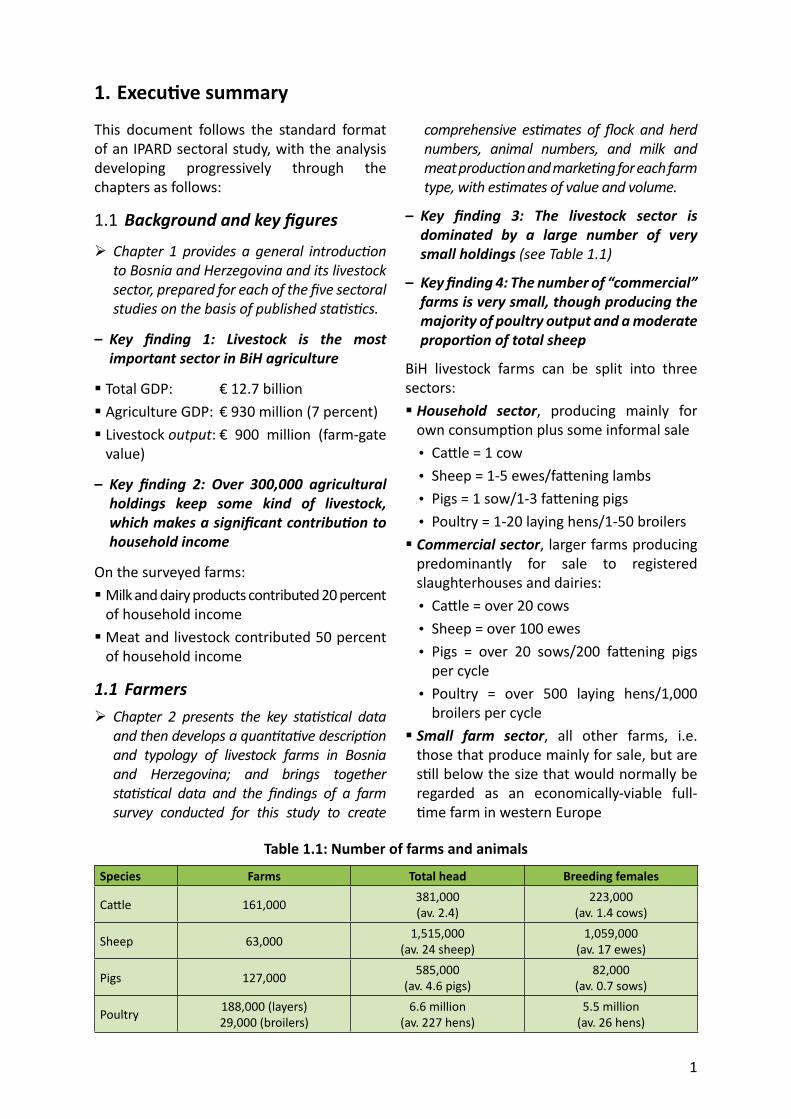
– Key fi nding 3: The livestock sector is dominated by a large number of very small holdings (see Table 1.1)
– Key fi nding 4: The number of “commercial” farms is very small, though producing the majority of poultry output and a moderate propor on of total sheep
BiH livestock farms can be split into three sectors: Household sector, producing mainly for own consump on plus some informal sale• Ca le = 1 cow• Sheep = 1-5 ewes/fa ening lambs• Pigs = 1 sow/1-3 fa ening pigs• Poultry = 1-20 laying hens/1-50 broilers Commercial sector, larger farms producing predominantly for sale to registered slaughterhouses and dairies:• Ca le = over 20 cows• Sheep = over 100 ewes• Pigs = over 20 sows/200 fa ening pigs
per cycle• Poultry = over 500 laying hens/1,000
broilers per cycle Small farm sector, all other farms, i.e. those that produce mainly for sale, but are s ll below the size that would normally be regarded as an economically-viable full- me farm in western Europe
Table 1.1: Number of farms and animals
Species Farms Total head Breeding females
Ca le 161,000 381,000(av. 2.4)
223,000(av. 1.4 cows)
Sheep 63,000 1,515,000(av. 24 sheep)
1,059,000(av. 17 ewes)
Pigs 127,000 585,000(av. 4.6 pigs)
82,000(av. 0.7 sows)
Poultry 188,000 (layers)29,000 (broilers)
6.6 million(av. 227 hens)
5.5 million(av. 26 hens)
2
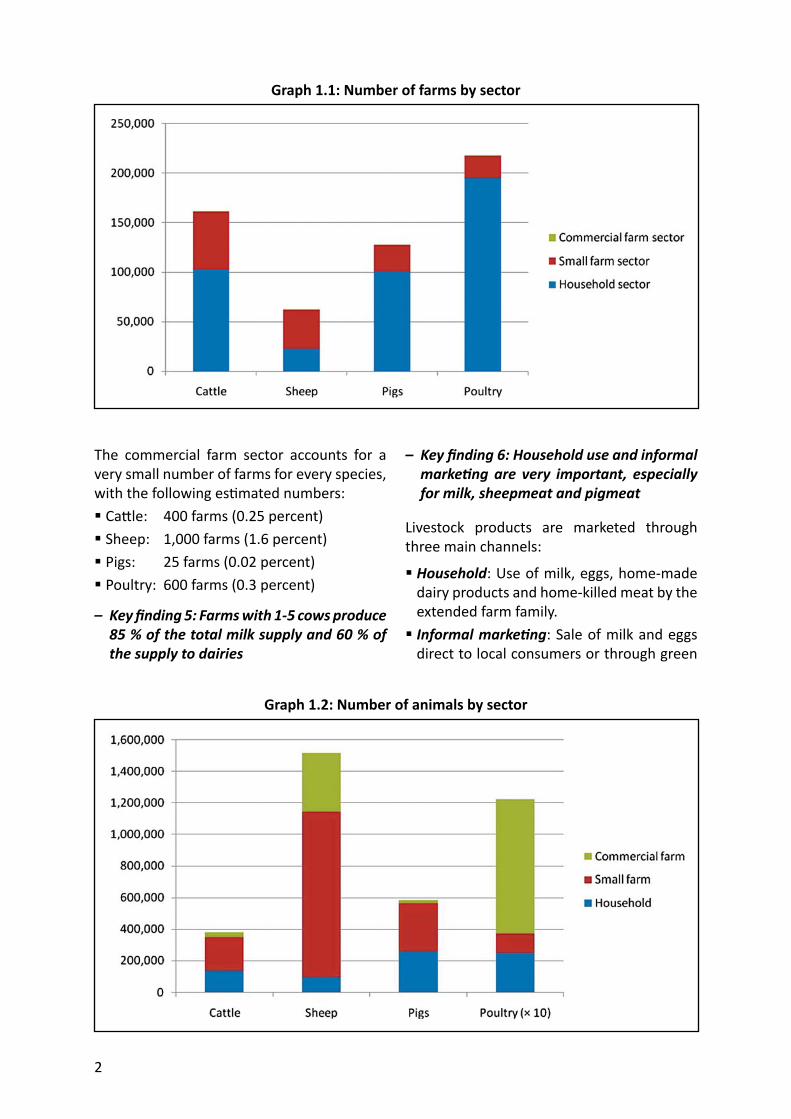
The commercial farm sector accounts for a very small number of farms for every species, with the following es mated numbers: Ca le: 400 farms (0.25 percent) Sheep: 1,000 farms (1.6 percent) Pigs: 25 farms (0.02 percent) Poultry: 600 farms (0.3 percent)
– Key fi nding 5: Farms with 1-5 cows produce 85 % of the total milk supply and 60 % of the supply to dairies
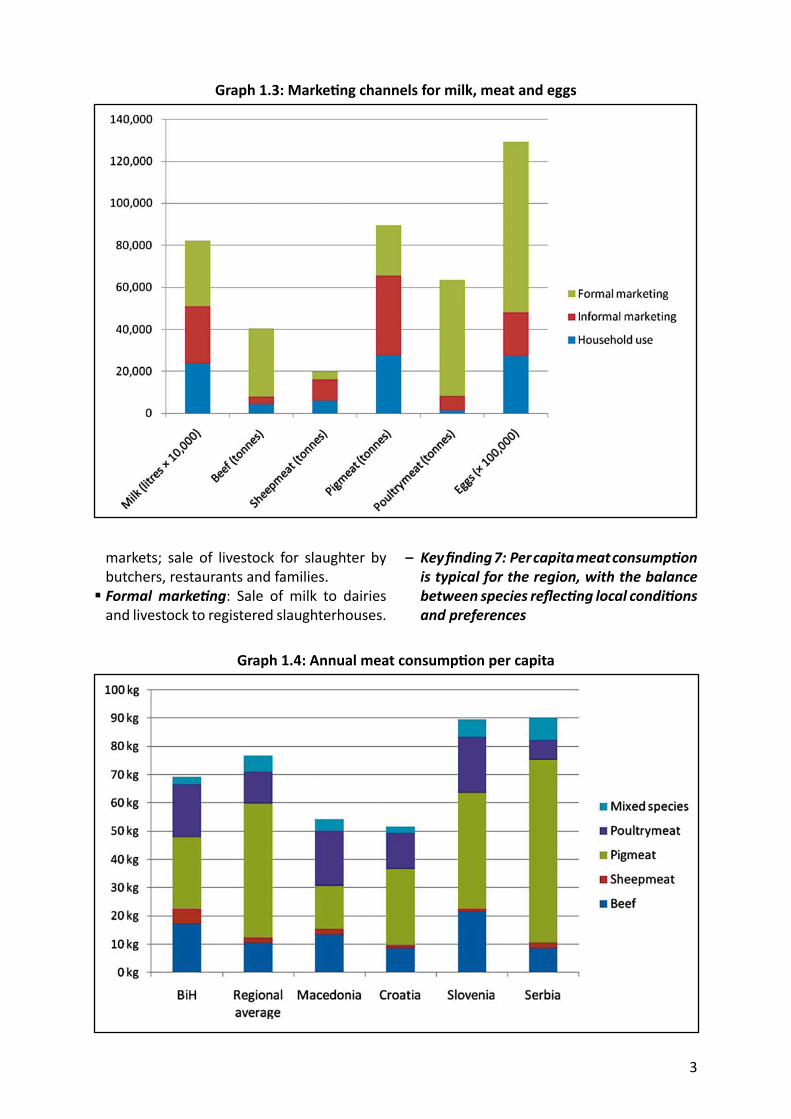
– Key fi nding 6: Household use and informal marke ng are very important, especially for milk, sheepmeat and pigmeat
Livestock products are marketed through three main channels:
Household: Use of milk, eggs, home-made dairy products and home-killed meat by the extended farm family. Informal marke ng: Sale of milk and eggs direct to local consumers or through green
Graph 1.1: Number of farms by sector
Graph 1.2: Number of animals by sector
3
markets; sale of livestock for slaughter by butchers, restaurants and families. Formal marke ng: Sale of milk to dairies and livestock to registered slaughterhouses.
– Key fi nding 7: Per capita meat consump on is typical for the region, with the balance between species refl ec ng local condi ons and preferences
Graph 1.3: Marke ng channels for milk, meat and eggs
Graph 1.4: Annual meat consump on per capita
4
CONCLUSION 1: Farm structures will change, but slowly, and BiH should plan on entering the EU with a livestock sector dominated by small farms
CONCLUSION 2: The number of farms large enough to compete successfully for IPARD grants is small, and most farms will require other sources of investment
1.2 Processors
Chapter 3 provides a systema c descrip on of formal milk and meat processing in Bosnia and Herzegovina, based heavily on a face-to-face survey of processors carried out by the project team.
– Key fi nding 8: The processing sector has recovered a er the war, in some cases managing to “leap-frog” past neighbouring countries
– Key fi nding 9: Milk collec on is diverse, including collec ng centres and middlemen as well as direct collec on by dairies, and some raw milk is not yet cooled
– Key fi nding 10: Daily milk collec on per farm is small (av. 26 litres), increasing unit cost
– Key fi nding 11: Raw milk tes ng works well in RS but not yet in FBiH
– Key fi nding 12: Milk processing is bimodal
More than 75 % of collected milk is processed by 7 dairies Around 50 dairies, plus an unknown number of micro-dairies, process the other 25 % – Key fi nding 13: Most dairies concentrate on established regional products, with larger dairies also producing UHT milk
– Key fi nding 14: Most dairies are in good technical and fi nancial condi on, and almost all have HACCP cer fi ca on
– Key fi nding 15: Major needs are in-house laboratories and, especially, proper effl uent disposal
– Key fi nding 16: Meat processing combines local supplies with cheaper imports
Processors report that: Local meat is up to 30 % more expensive than imports Quality of imported meat is quite adequate for processing They would like to use more imported meat
– Key fi nding 17: The range of meat products is tradi onal, targe ng the local and CEFTA markets, with good quality control and packaging
– Key fi nding 18: Meat processing plants are generally in good condi on, but red meat slaughterhouses need considerable investment
– Key fi nding 19: BiH has no adequate system to dispose of slaughterhouse waste and fallen stock
CONCLUSION 3: Dair ies and meat processors will need to diversify their product range to penetrate EU markets – but have li le incen ve to innovate without market access
CONCLUSION 4: As E U integra on increases access to cheaper imported meat, it will benefi t processors but increase pressure on producers
CONCLUSION 5: The top investment priority in processing relevant to IPARD is effl uent treatment and waste disposal
1.3 Policy
Chapter 4 outlines the na onal support, regulatory and trade policies aff ec ng the livestock farm and processing sectors; includes a common introduc on on state- and en ty-level strategies, developed for all fi ve sectoral studies.
– Key fi nding 20: BiH’s unique administra ve structure creates special challenges in policy making, implementa on and enforcement
– Key fi nding 21: Livestock subsidies in both en es favour larger farms and mainly pursue social rather than development goals
5
CONCLUSION 6: BiH will struggle to achieve EU export approval for livestock products without a more unifi ed veterinary control system
CONCLUSION 7: Both en es should re-direct their livestock support to help smaller farms prepare for EU accession
1.4 Marke ng
Chapter 5 reviews the variety of domes c marke ng channels employed for livestock and their products; presents a systema c
Graph 1.5: BiH external trade for the livestock sector in 2010
analysis of trade data and iden fi es Bosnia’s principal trading partners for each class of livestock product; presents a supply-u lisa on balance, in value terms, for the en re livestock sector.
– Key fi nding 22: BiH runs a substan al trade defi cit in livestock products and is heavily dependent on Croa a as an export market
– Key fi nding 23: Smal l-scale produc on and informal marke ng make an essen al contribu on to na onal food supply and balance of payments
Graph 1.6: Value of livestock product imports and exports by trading partners for 2010
6
CONCLUSION 8: Croa a ’s accession to the EU will give a serious shock to the BiH livestock sector, with a drama c drop in exports
1.5 EU standards Chapter 6 provides an overview of where Bosnia and Herzegovina currently stands in rela on to each element of the acquis communautaire for the livestock sector; notes that Bosnia and Herzegovina does not as yet have EU approval to export any farmed livestock or their products.
– Key fi nding 24: Livestock farms fall short of EU standards in three main areas: manure storage & handling, animal welfare, and milk hygiene
– Key fi nding 25: Processors fall short of EU standards in four main areas: red meat slaughtering, slaughterhouse waste disposal, liquid effl uent treatment, and raw milk tes ng
1.6 Investment Chapter 7 reviews recent investments in livestock farms and processing plants; discusses the availability of commercial credit, ins tu onal credit and government subsidies; presents a comprehensive picture of the agricultural fi nance sector prepared for all fi ve sector studies.
Graph 1.7: Poten al eff ect on trade balance of curtailing informal marke ng and household use of livestock products
– Key fi nding 26: Access to credit is a signifi cant constraint for livestock producers, par cularly small farms
CONCLUSION 9: Despite the achievements of investment banks and micro-credit organisa ons, and the promise of IPARD funding, there is a massive shor all between credit supply and farm investment needs
1.7 Iden fi ca on of poten als and needs of the sector
Chapter 8 presents SWOT analyses for both livestock farms and processors, based on stakeholder workshops held in Sarajevo and Banja Luka; presents the fi ndings of the project farm survey on the current status of infrastructure on livestock farms and their investment needs; assesses how EU integra on will impact on each livestock farm type; establishes benchmarks to put the BiH livestock sector in a European and regional context; predicts the future structure of the sector based on survey responses and es mates total investment requirements; summarises investment priori es for livestock farms and processors.
– Key fi nding 27: Investment priori es refl ect the shor alls from EU standards, plus
7
the need to increase scale and technical effi ciency
Producers:• Herd/fl ock enlargement (esp. dairy; but
note that livestock purchases are not eligible for IPARD funding)
• Buildings & equipment (esp. dairy)• Machinery (esp. forage)• Manure storage & handling (esp. ca le &
pigs) Dairy processors:• Plant upgrading to improve opera ng
effi ciency & product range• In-house laboratories to improve product
quality• Effl uent storage & treatment to meet
environmental standards Meat processors:• Plant upgrading to improve opera ng
effi ciency• Animal waste storage, transport &
disposal
1.8 Iden fi ca on of training needs in the sector
Chapter 9 outlines the exis ng structures to provide training, advice and informa on to the livestock sector; presents a short summary of the key training priori es for diff erent groups of benefi ciaries, including farmers, processors and inspectors.
– Key fi nding 28: Current extension services are inadequate to help 300,000 livestock farmers meet EU standards and improve technical effi ciency, management & marke ng
CONCLUSION 10: Develop ing an eff ec ve mass extension system is a top priority
1.9 Outcomes
Chapter 10 summarises the key factors to be taken into account when designing investment measures for the BiH livestock sector; presents proposals for six specifi c measures to be funded under the IPARD programme.
– Key fi nding 29: The implica ons of EU accession for livestock farms stem directly from their structure
Ca le (160,000 holdings)◊ Major structural problem in dairy
produc on, with a need to help smaller farms adapt to the changing situa on; less serious situa on in beef produc on.
Sheep (50,000 holdings)◊ Less serious structural problem, as even
smaller farms can be EU-compliant and commercially viable, though only the larger farms are likely to par cipate in IPARD.
Pigs (130,000 holdings)◊ Big problem of compe veness, which is
likely to see many small pig farms cease produc on; only the larger farms are likely to have a long-term commercial future, and these could benefi t greatly from IPARD assistance.
Poultry (220,000 holdings)• Laying hens:◊ Current bi-modal structure is sustainable,
as the numerous small farms are essen ally non-commercial; many large commercial farms will require substan al assistance to adapt to EU standards.
• Broilers:◊ Smaller broiler farms have li le
commercial future; IPARD investment should focus on helping large broiler farms to adapt to EU standards, increase effi ciency and con nue to expand.
– Key fi nding 30: Three IPARD measures are proposed for livestock producers, and three for processors
Modernisa on of agricultural holdings (101):a. 101/1: Improvement & enlargement of
agricultural holdingsb. 101/2: Manure storage & disposalc. 101/3: Forage machinery Processing and marke ng of agricultural products (103):d. 103/1. Improvement of processing facili ese. 103/2: Dairy effl uent storage & treatmentf. 103/3: Animal waste collec on &
processing
8
R IPARD – F M (101)
101/1: Improvement & enlargement of agricultural holdings
Objec ves: Achieving EU standards for hygiene, animal welfare & environment Increasing compe veness through herd/fl ock enlargement and improving effi ciency
Eligible expenditure: Construc on & reconstruc on of buildings Construc on of manure stores Purchase of machinery and equipment
Eligible enterprise size at end of investment: 20 – 200 cows 100 – 5,000 breeding ewes 20-500 sows 200-5,000 fa ening pigs per cycle 500-50,000 laying hens 1,000 – 100,000 broilers per cycle
Es mated number of poten al applicants: Ca le: 230 current farms (+ up to 300 expanding) Sheep: 1,000 current farms (low applica on rate expected) Pigs: 25 current farms (+ up to 4,000 expanding) Poultry: 390 current farms (+ up to 300 expanding)
101/2: Manure storage & disposal
Objec ves: Reducing pollu on from manure & silage (simplifi ed measure for farms that are too large or too small to apply under 101/1)
Eligible expenditure: Construc on of manure stores Purchase of machinery for handling & spreading manure & slurry
Eligible enterprise size at end of investment: 10+ cows 10+ sows 20+ fa ening pigs per cycle 500+ laying hens 1,000 + broilers per cycle
Es mated number of poten al applicants: Approx. 50 farms too large for 101/1 Up to 2,000 ca le & 2,000 pig farms if procedure kept simple
9
101/3: Forage machinery
Objec ve: Specifi c measure to provide machinery for making and handling big-bale silage and other kinds of forage, to anyone who will cover a reasonable area, e.g. machinery rings, farmers’ associa ons and private contrac ng services (individual farmers would apply under measure 101/1).
Eligible expenditure: Forage-handling machinery and associated tractors & trailers
Eligible size by end of investment: Demonstrated capacity & business plan to harvest at least 100 ha of forage for mul ple holdings
10
R IPARD – P P (103)
103/1. Improvement of processing facili es
Objec ves:General investment with the aim of helping dairies & meat plants to: Meet EU hygiene, welfare &/or environmental standards Increase compe veness through increased size, more effi cient opera on and increased product range.
Eligible expenditure: (Re)construc on of buildings Purchase of machinery and fi xed equipment Construc on/upgrading of effl uent storage & treatment facili es Construc on/upgrading of in-house laboratories for rapid tes ng of incoming milk and for checking fi nal products
Eligible size by end of investment: Dairies opera ng regularly at more than fi ve tonnes daily milk intake. Meat processors producing at least fi ve tonnes of products per day.
Es mated number of poten al applicants: Five dairies and four meat processors are known to be within this size range.
103/2: Dairy effl uent storage & treatment
Objec ve: Simplifi ed measure specifi cally to reduce pollu on aimed at processors that are too large to apply under 103/1.
Eligible expenditure: Construc on/upgrading of effl uent storage & treatment facili es
Eligible size by end of investment: At least 20 tonnes of waste water per day.
Es mated number of poten al applicants: Approximately eight processors.
11
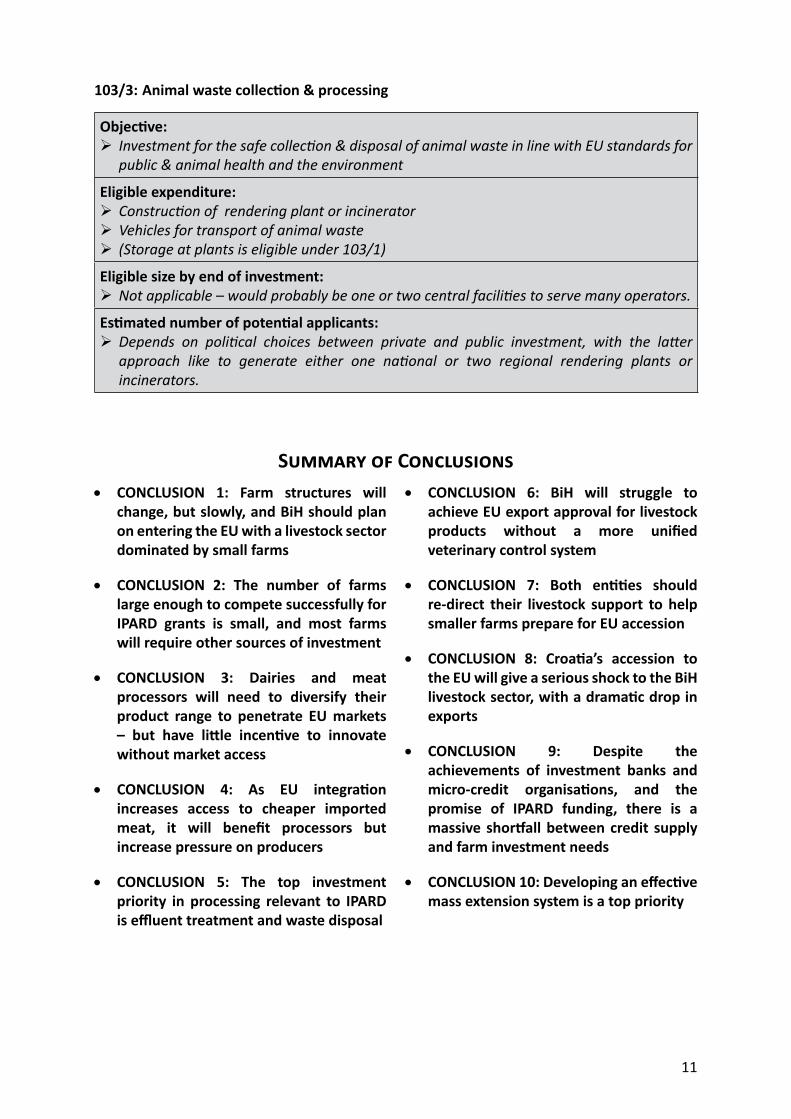
103/3: Animal waste collec on & processing
Objec ve: Investment for the safe collec on & disposal of animal waste in line with EU standards for public & animal health and the environment
Eligible expenditure: Construc on of rendering plant or incinerator Vehicles for transport of animal waste (Storage at plants is eligible under 103/1)
Eligible size by end of investment: Not applicable – would probably be one or two central facili es to serve many operators.
Es mated number of poten al applicants: Depends on poli cal choices between private and public investment, with the la er approach like to generate either one na onal or two regional rendering plants or incinerators.
S C CONCLUSION 1: Farm structures will
change, but slowly, and BiH should plan on entering the EU with a livestock sector dominated by small farm s
CONCLUSION 2: The number of farms large enough to compete successfully for IPARD grants is small, and most farms will require other sources of investm ent
CONCLUSIO N 3: Dairies and meat processors will need to diversify their product range to penetrate EU markets – but have li le incen ve to innovate without market a ccess
CONCLUS ION 4: As EU integra on increases access to cheaper imported meat, it will benefi t processors but increase pressure on pr oducers
CONCL USION 5: The top investment priority in processing relevant to IPARD is effl uent treatment and waste disposal
CON CLUSION 6: BiH will struggle to achieve EU export approval for livestock products without a more unifi ed veterinary con trol system
C ONCLUSION 7: Both en es should re-direct their livestock support to help smaller farms prepare for EU accession
CONCLUSION 8: Croa a’s accession to the EU will give a serious shock to the BiH livestock sector, with a drama c drop in expor ts
CONCLUSION 9: Despite the achievements of investment banks and micro-credit organisa ons, and the promise of IPARD funding, there is a massive shor all between credit supply and farm investment ne eds
CONCLUSION 10: Developing an eff ec ve mass extension system is a top priority

12
13
2. Background and key fi gures
This sec on provides a general background to Bosnia and Herzegovina and its economy and agriculture, developed for all fi ve of the sectoral studies. Sec on 2.1 presents general informa on about t he country. Sec on 2.2 explains the context and objec ve of the sec tor studies. Sec on 2.3 gives some further informa on on the BiH econom y as a whole. Sec on 2.4 reviews the main agricultural indicators and sta s cs.
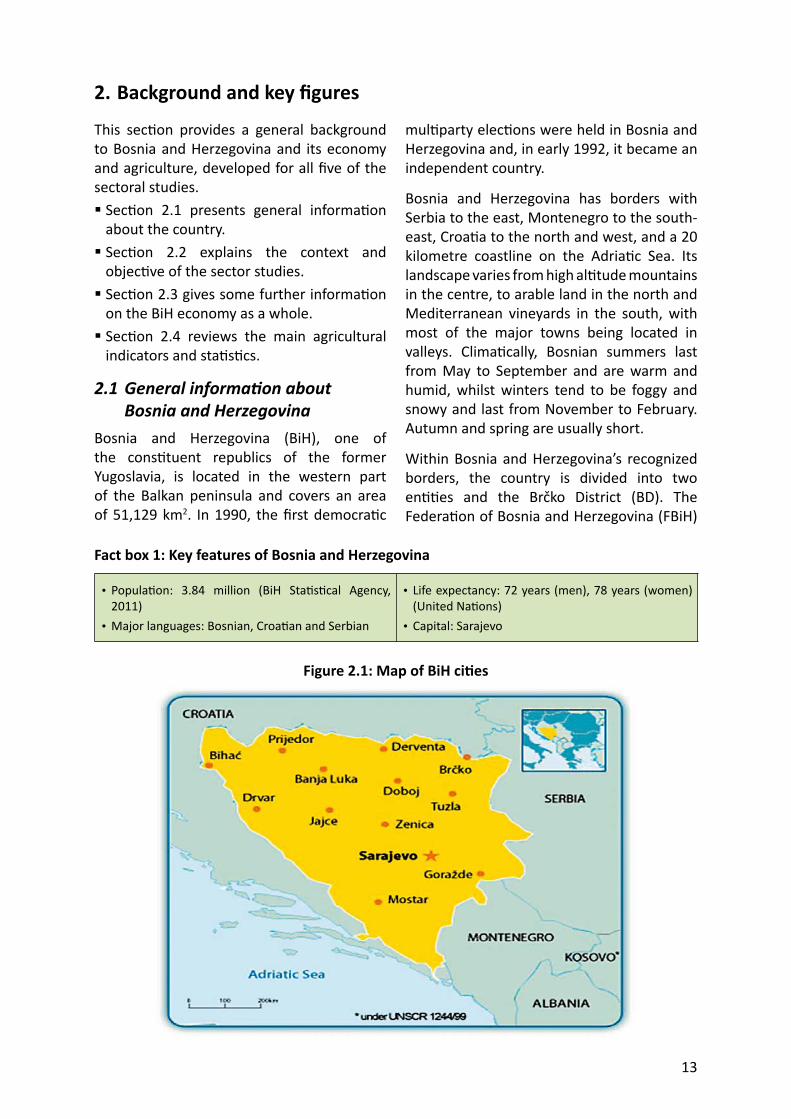
2.1 General informa on about Bosnia and Herzegovina
Bosnia and Herzegovina (BiH), one of the cons tuent republics of the former Yugoslavia, is located in the western part of the Balkan peninsula and covers an area of 51,129 km2. In 1990, the fi rst democra c
mul party elec ons were held in Bosnia and Herzegovina and, in early 1992, it became an independent country.
Bosnia and Herzegovina has borders with Serbia to the east, Montenegro to the south-east, Croa a to the north and west, and a 20 kilometre coastline on the Adria c Sea. Its landscape varies from high al tude mountains in the centre, to arable land in the north and Mediterranean vineyards in the south, with most of the major towns being located in valleys. Clima cally, Bosnian summers last from May to September and are warm and humid, whilst winters tend to be foggy and snowy and last from November to February. Autumn and spring are usually short.
Within Bosnia and Herzegovina’s recognized borders, the country is divided into two en es and the Brčko District (BD). The Federa on of Bosnia and Herzegovina (FBiH)
Fact box 1: Key features of Bosnia and Herzegovina
• Popula on: 3.84 million (BiH Sta s cal Agency, 2011)
• Major languages: Bosnian, Croa an and Serbian
• Life expectancy: 72 years (men), 78 years (women) (United Na ons)
• Capital: Sarajevo
Figure 2.1: Map of BiH ci es
14
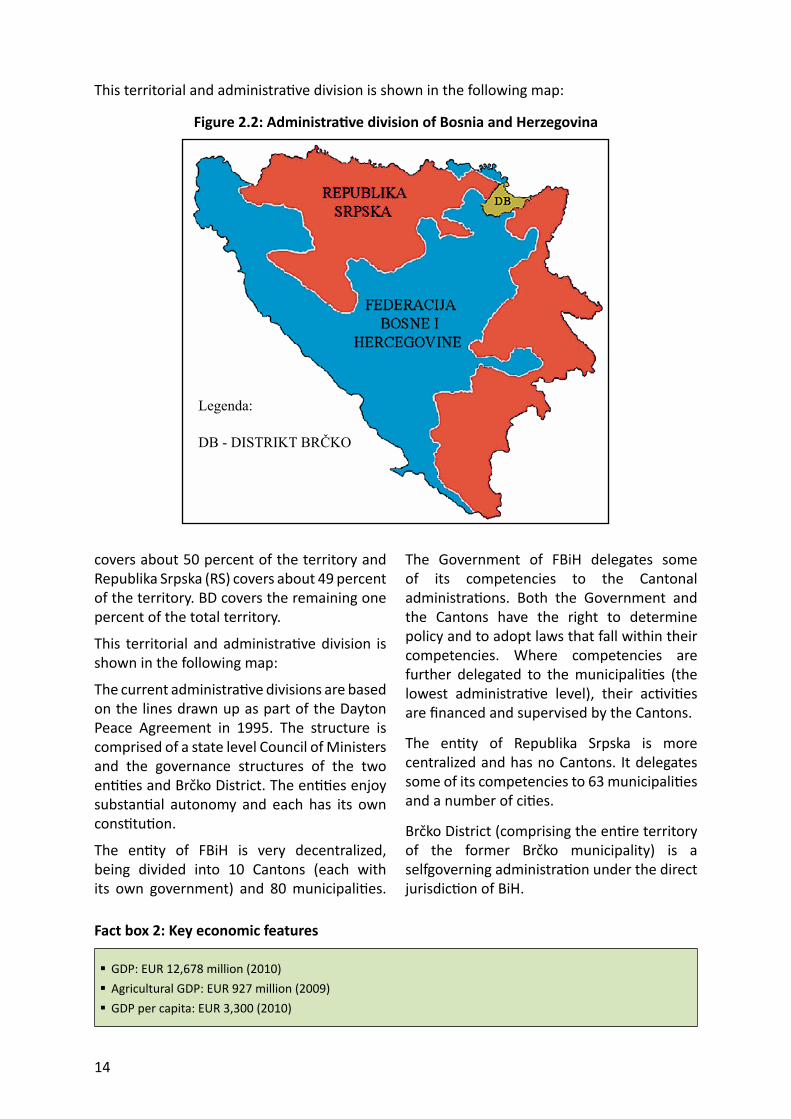
covers about 50 percent of the territory and Republika Srpska (RS) covers about 49 percent of the territory. BD covers the remaining one percent of the total territory.
This territorial and administra ve division is shown in the following map:
The current administra ve divisions are based on the lines drawn up as part of the Dayton Peace Agreement in 1995. The structure is comprised of a state level Council of Ministers and the governance structures of the two en es and Brčko District. The en es enjoy substan al autonomy and each has its own cons tu on.
The en ty of FBiH is very decentralized, being divided into 10 Cantons (each with its own government) and 80 municipali es.
This territorial and administra ve division is shown in the following map:
Figure 2.2: Administra ve division of Bosnia and Herzegovina
The Government of FBiH delegates some of its competencies to the Cantonal administra ons. Both the Government and the Cantons have the right to determine policy and to adopt laws that fall within their competencies. Where competencies are further delegated to the municipali es (the lowest administra ve level), their ac vi es are fi nanced and supervised by the Cantons.
The en ty of Republika Srpska is more centralized and has no Cantons. It delegates some of its competencies to 63 municipali es and a number of ci es.
Brčko District (comprising the en re territory of the former Brčko municipality) is a selfgoverning administra on under the direct jurisdic on of BiH.
Fact box 2: Key economic features
GDP: EUR 12,678 million (2010) Agricultural GDP: EUR 927 million (2009) GDP per capita: EUR 3,300 (2010)
Legenda:
DB - DISTRIKT BRČKO
15
Since the Dayton Peace Agreement, the country has made remarkable progress in postconfl ict reconstruc on, social integra on and state building.3 Based on its economic recovery and sustained social stability, which have been supported by high levels of interna onal assistance, the country is now working towards accession to the European Union and membership in the World Trade Organiza on.
The popula on is es mated at a li le less than 4 million, but a precise fi gure is not available, since there has been no recent census. The last popula on census was carried out in 1991 and major popula on movements have taken place since then, par cularly during the confl ict of the early 1990s.The offi cial fi gure of 3.8 million, given by the BiH Sta s cal Agency, is used in FAO sta s cs and for calcula ons in this report.
2.2 Context and objec ve of the sector analyses
2.2.1 General context of the sector analyses: Prepara on for EU accession
Bosnia and Herzegovina is a poten al candidate country for EU accession following the Thessaloniki European Council of June 2003. In June 2008, the EU and Bosnia and Herzegovina signed a “Stabilisa on and Associa on Agreement” (SAA). An “Interim Agreement on Trade and Trade-related Issues” entered into force on 1 July 2008 and a new European partnership with Bosnia and Herzegovina was adopted by the Council on 18 February 2008.4
Bosnia and Herzegovina has benefi ted from EU autonomous trade measures since 2000. A er the Interim Agreement came into force on 1 July 2008, EU access to products from Bosnia and Herzegovina has expanded, and
EU exports to the country have been granted trade preferences.
It was a milestone on Bosnia and Herzegovina’s road to Europe that it and the EC signed the Financing Agreement for the “Instrument for Pre-accession Assistance” (IPA) 2007 Na onal Programme on 31 July 2008. The total fi nancial alloca on within IPA is EUR 11.47 billion (current prices) over the 2007–2013 period.
As a pre-candidate country, Bosnia and Herzegovina cannot yet take full advantage of IPA support, as certain aspects of the support only apply to Candidate Countries. However, prepara ons are already being made to implement the full IPA programme, including IPARD support for agricultural and rural development, once BiH receives Candidate Country status.
2.2.2 Sector context
In order for Bosnia and Herzegovina to benefi t from the pre-accession assistance under the IPARD, it must: Achieve candidate country status Have an IPARD Programme adopted by the European Commission Conclude the Framework and Sectoral Agreements Establish IPARD opera onal structure and receive na onal accredita on Receive accredita on and conferral of management decisions from the Commission Conclude a Mul -annual Financing Agreement
The IPA Implemen ng Regula on (718/2007) (Ar cle 184, Paragraph “2.b”) indicates that the IPARD Programme should be based on an analysis of the current situa on in rural areas and on in-depth analysis of the sectors concerned.5 Among other things, the IPARD programme should include a quan fi ed
3 Ministry for Human Rights and Refugees in BiH4 See EU Delega on Website for Bosnia and Herzegovina: h p://www.delBIH.ec.europa.eu/5 The fi nal concept for pre-accession assistance to agriculture and rural development a er 2013 is not yet known,
and it may be diff erent from the current IPARD model, and the new regula on might diff er from the current IPA Implemen ng Regula on (718/2007). As a ma er of simplicity reference is made to IPARD in the sector analyses.
16
descrip on of the current situa on, showing dispari es, shortcomings and poten al for development. The programme should also include quan fi ed objec ves. The analyses of the situa on and priori za onof the areas for poten al interven on should be made with the help of independent exper se.
Bearing this in mind, the main objec ve of the sector analyses is to provide a solid input to the prepara on of the IPARD Programme and provide the grounds for jus fi ed and appropriate targe ng of the measures included in the IPARD Programme. Therefore, the sector studies are not a part of the IPARD Programme as such, but rather cons tute a basic input to the programming process.
Furthermore, it should be emphasized that the na onal authori es may use the sector studies as inputs for the prepara on of any interven on targe ng the agricultural and rural sectors. As such the sector studies do not exclusively contribute to the prepara on of the IPARD Programme.
IPARD support will, if so decided, address the weaker links in the produc on and supply chains. The objec ves of the IPARD interven on are to contribute towards upgrading to EU standards, strengthening overall compe veness and performance as well as fostering the sustainable development of the sector in the context of EU accession. In this respect, the sector analyses have been undertaken for the most demanding sectors in terms of the costs of mee ng the standards, for which the highest poten al and added-value of the interven on is an cipated.
The agricultural sector analyses carried out in Bosnia and Herzegovina have been selected based on a consulta on process with local authori es and are based on EU standard relevance as well as economic relevance. Analyses have been prepared for: Meat, including rendering, and Dairy Fruits and Vegetables Cereals (wheat and maize) Wine Diversifi ca on
The sector analyses provide a comprehensive analysis of the current state of the sectors. They iden fy the weaknesses and sector concerns to be addressed by the IPARD interven on and by other state, en ty and district level interven ons. Where appropriate the sector analyses take into account specifi c regional development needs.
Report structure
This sector analysis follows a standard structure applied in all sectors and pre-candidate countries, and covers: Background and key fi gures for the sector Structural characteris cs of the sector: Producers and processing industry Government policy for the sector at state and en ty level Markets and trade Level of a ainment of relevant EU standards Past trends and future developments in terms of investment Iden fi ca on of poten als and needs of the sector Iden fi ca on of training needs in the sector Outcome: As an outcome, the analysis of the sector provides:• A transparent overview of the sector
containing a quan ta ve and qualita ve descrip on of the situa on;
• Detailed analysis of poten al and obstacles in the produc on and marke ng chain;
• Recommenda ons for targe ng of specifi c IPARD investments, primarily focusing on the weakest links in supply chain.
2.3 General economic indicators for Bosnia and Herzegovina
This sec on of the report provides basic economic informa on about the development of the BiH economy.
The development from 2004 to 2010 in Gross Domes c Product (GDP) is presented in the table below. The economy demonstrated very posi ve performance from 2004 to 2008 with an average yearly growth of 13 percent
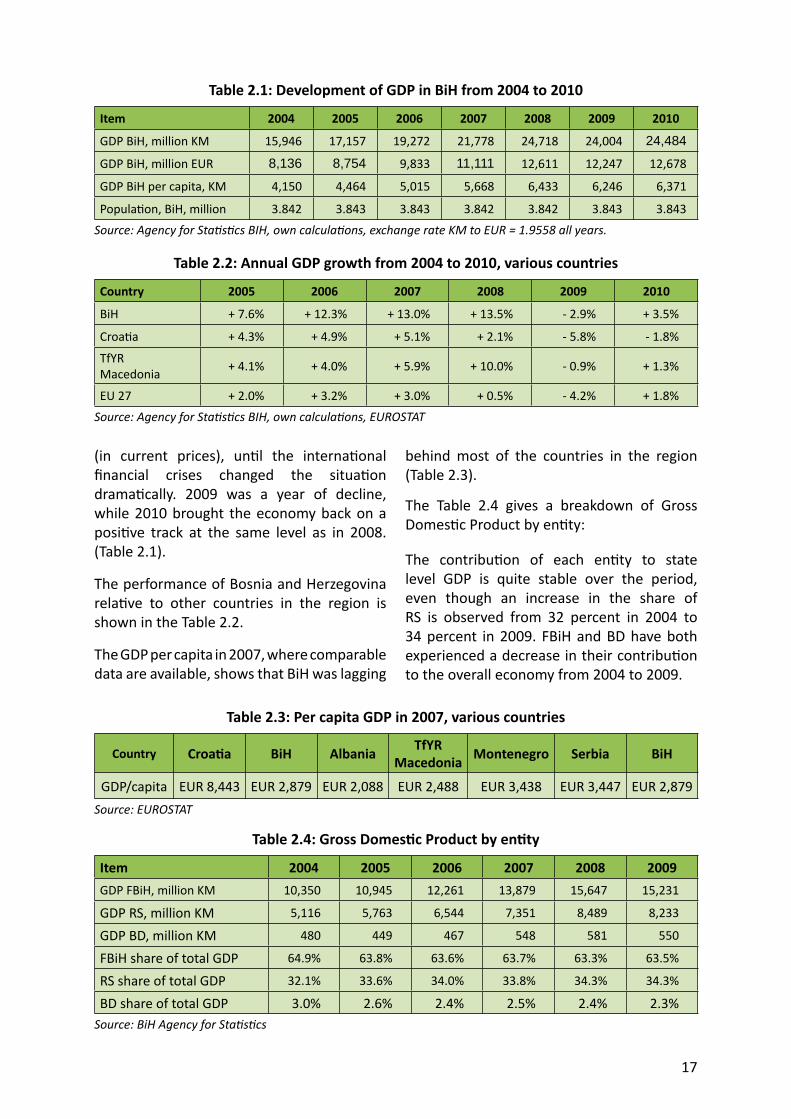
17
(in current prices), un l the interna onal fi nancial crises changed the situa on drama cally. 2009 was a year of decline, while 2010 brought the economy back on a posi ve track at the same level as in 2008. (Table 2.1).
The performance of Bosnia and Herzegovina rela ve to other countries in the region is shown in the Table 2.2.
The GDP per capita in 2007, where comparable data are available, shows that BiH was lagging
Table 2.1: Development of GDP in BiH from 2004 to 2010
Item 2004 2005 2006 2007 2008 2009 2010
GDP BiH, million KM 15,946 17,157 19,272 21,778 24,718 24,004 24,484
GDP BiH, million EUR 8,136 8,754 9,833 11,111 12,611 12,247 12,678
GDP BiH per capita, KM 4,150 4,464 5,015 5,668 6,433 6,246 6,371
Popula on, BiH, million 3.842 3.843 3.843 3.842 3.842 3.843 3.843Source: Agency for Sta s cs BIH, own calcula ons, exchange rate KM to EUR = 1.9558 all years.
behind most of the countries in the region (Table 2.3).
The Table 2.4 gives a breakdown of Gross Domes c Product by en ty:
The contribu on of each en ty to state level GDP is quite stable over the period, even though an increase in the share of RS is observed from 32 percent in 2004 to 34 percent in 2009. FBiH and BD have both experienced a decrease in their contribu on to the overall economy from 2004 to 2009.
Table 2.2: Annual GDP growth from 2004 to 2010, various countries
Country 2005 2006 2007 2008 2009 2010
BiH + 7.6% + 12.3% + 13.0% + 13.5% - 2.9% + 3.5%
Croa a + 4.3% + 4.9% + 5.1% + 2.1% - 5.8% - 1.8%
TfYRMacedonia + 4.1% + 4.0% + 5.9% + 10.0% - 0.9% + 1.3%
EU 27 + 2.0% + 3.2% + 3.0% + 0.5% - 4.2% + 1.8%Source: Agency for Sta s cs BIH, own calcula ons, EUROSTAT
Table 2.3: Per capita GDP in 2007, various countries
Country Croa a BiH Albania TfYRMacedonia Montenegro Serbia BiH
GDP/capita EUR 8,443 EUR 2,879 EUR 2,088 EUR 2,488 EUR 3,438 EUR 3,447 EUR 2,879Source: EUROSTAT
Table 2.4: Gross Domes c Product by en ty
Item 2004 2005 2006 2007 2008 2009GDP FBiH, million KM 10,350 10,945 12,261 13,879 15,647 15,231
GDP RS, million KM 5,116 5,763 6,544 7,351 8,489 8,233
GDP BD, million KM 480 449 467 548 581 550
FBiH share of total GDP 64.9% 63.8% 63.6% 63.7% 63.3% 63.5%
RS share of total GDP 32.1% 33.6% 34.0% 33.8% 34.3% 34.3%
BD share of total GDP 3.0% 2.6% 2.4% 2.5% 2.4% 2.3%Source: BiH Agency for Sta s cs
18
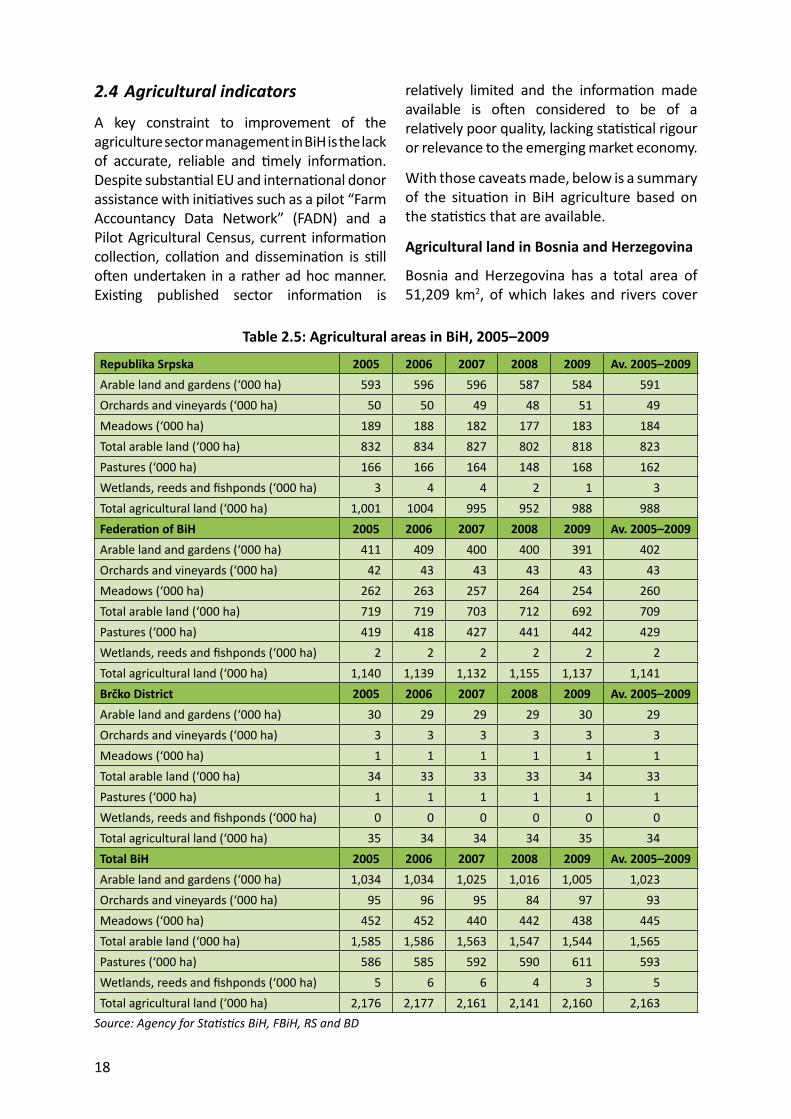
2.4 Agricultural indicators
A key constraint to improvement of the agriculture sector management in BiH is the lack of accurate, reliable and mely informa on. Despite substan al EU and interna onal donor assistance with ini a ves such as a pilot “Farm Accountancy Data Network” (FADN) and a Pilot Agricultural Census, current informa on collec on, colla on and dissemina on is s ll o en undertaken in a rather ad hoc manner. Exis ng published sector informa on is
Table 2.5: Agricultural areas in BiH, 2005–2009
Republika Srpska 2005 2006 2007 2008 2009 Av. 2005–2009Arable land and gardens (‘000 ha) 593 596 596 587 584 591Orchards and vineyards (‘000 ha) 50 50 49 48 51 49Meadows (‘000 ha) 189 188 182 177 183 184Total arable land (‘000 ha) 832 834 827 802 818 823Pastures (‘000 ha) 166 166 164 148 168 162Wetlands, reeds and fi shponds (‘000 ha) 3 4 4 2 1 3Total agricultural land (‘000 ha) 1,001 1004 995 952 988 988Federa on of BiH 2005 2006 2007 2008 2009 Av. 2005–2009Arable land and gardens (‘000 ha) 411 409 400 400 391 402Orchards and vineyards (‘000 ha) 42 43 43 43 43 43Meadows (‘000 ha) 262 263 257 264 254 260Total arable land (‘000 ha) 719 719 703 712 692 709Pastures (‘000 ha) 419 418 427 441 442 429Wetlands, reeds and fi shponds (‘000 ha) 2 2 2 2 2 2Total agricultural land (‘000 ha) 1,140 1,139 1,132 1,155 1,137 1,141 Brčko District 2005 2006 2007 2008 2009 Av. 2005–2009Arable land and gardens (‘000 ha) 30 29 29 29 30 29Orchards and vineyards (‘000 ha) 3 3 3 3 3 3Meadows (‘000 ha) 1 1 1 1 1 1Total arable land (‘000 ha) 34 33 33 33 34 33Pastures (‘000 ha) 1 1 1 1 1 1Wetlands, reeds and fi shponds (‘000 ha) 0 0 0 0 0 0Total agricultural land (‘000 ha) 35 34 34 34 35 34Total BiH 2005 2006 2007 2008 2009 Av. 2005–2009Arable land and gardens (‘000 ha) 1,034 1,034 1,025 1,016 1,005 1,023Orchards and vineyards (‘000 ha) 95 96 95 84 97 93Meadows (‘000 ha) 452 452 440 442 438 445Total arable land (‘000 ha) 1,585 1,586 1,563 1,547 1,544 1,565Pastures (‘000 ha) 586 585 592 590 611 593Wetlands, reeds and fi shponds (‘000 ha) 5 6 6 4 3 5Total agricultural land (‘000 ha) 2,176 2,177 2,161 2,141 2,160 2,163
Source: Agency for Sta s cs BiH, FBiH, RS and BD
rela vely limited and the informa on made available is o en considered to be of a rela vely poor quality, lacking sta s cal rigour or relevance to the emerging market economy.
With those caveats made, below is a summary of the situa on in BiH agriculture based on the sta s cs that are available.
Agricultural land in Bosnia and Herzegovina
Bosnia and Herzegovina has a total area of 51,209 km2, of which lakes and rivers cover
19
6 A report of the Agriculture Sector in Bosnia and Herzegovina 2007, Ministry of Foreign Trade and Economic Rela ons. 2008. p. 6
7 Ac on Plan for Environmental Protec on BiH (Na onal Environmental Ac on Plan of Bosnia and Herzegovina), Ministry of Urbanism, Housing and Services, Civil Engineering and Ecology and the Federa on Ministry of Spa al Planning and Environment. 2003. p. 10
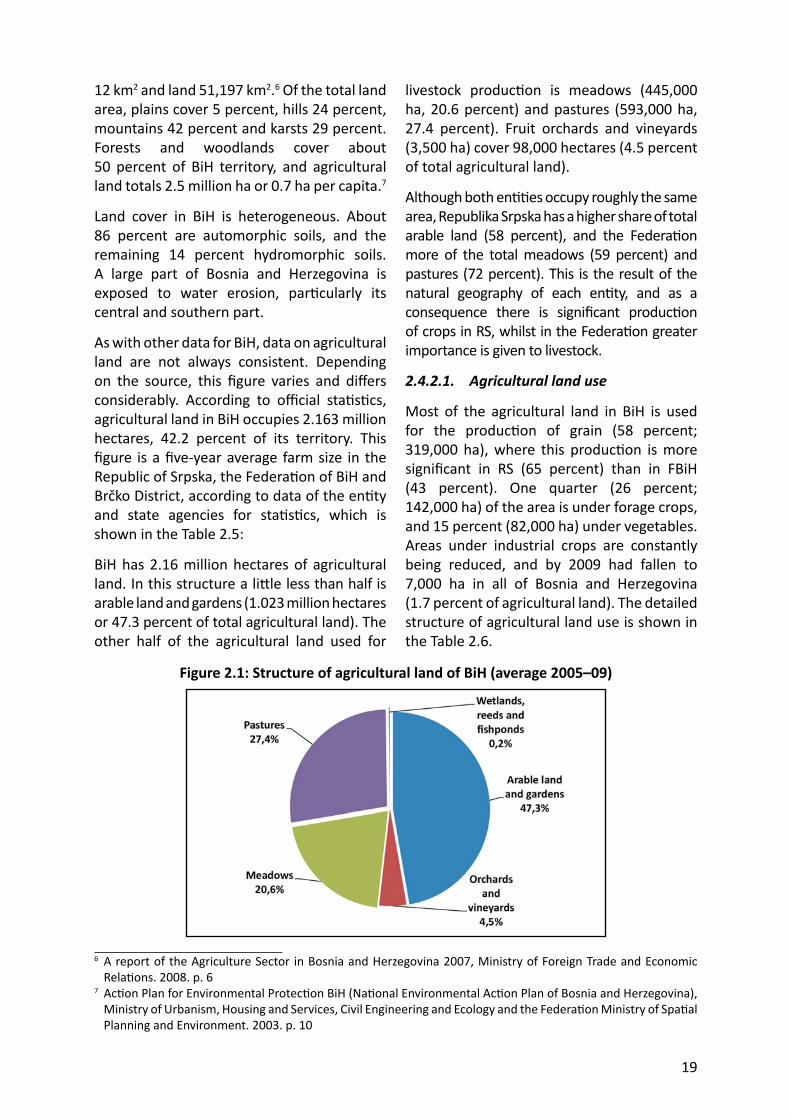
Figure 2.1: Structure of agricultural land of BiH (average 2005–09)
12 km2 and land 51,197 km2.6 Of the total land area, plains cover 5 percent, hills 24 percent, mountains 42 percent and karsts 29 percent. Forests and woodlands cover about 50 percent of BiH territory, and agricultural land totals 2.5 million ha or 0.7 ha per capita.7
Land cover in BiH is heterogeneous. About 86 percent are automorphic soils, and the remaining 14 percent hydromorphic soils. A large part of Bosnia and Herzegovina is exposed to water erosion, par cularly its central and southern part.
As with other data for BiH, data on agricultural land are not always consistent. Depending on the source, this fi gure varies and diff ers considerably. According to offi cial sta s cs, agricultural land in BiH occupies 2.163 million hectares, 42.2 percent of its territory. This fi gure is a fi ve-year average farm size in the Republic of Srpska, the Federa on of BiH and Brčko District, according to data of the en ty and state agencies for sta s cs, which is shown in the Table 2.5:
BiH has 2.16 million hectares of agricultural land. In this structure a li le less than half is arable land and gardens (1.023 million hectares or 47.3 percent of total agricultural land). The other half of the agricultural land used for
livestock produc on is meadows (445,000 ha, 20.6 percent) and pastures (593,000 ha, 27.4 percent). Fruit orchards and vineyards (3,500 ha) cover 98,000 hectares (4.5 percent of total agricultural land).
Although both en es occupy roughly the same area, Republika Srpska has a higher share of total arable land (58 percent), and the Federa on more of the total meadows (59 percent) and pastures (72 percent). This is the result of the natural geography of each en ty, and as a consequence there is signifi cant produc on of crops in RS, whilst in the Federa on greater importance is given to livestock.
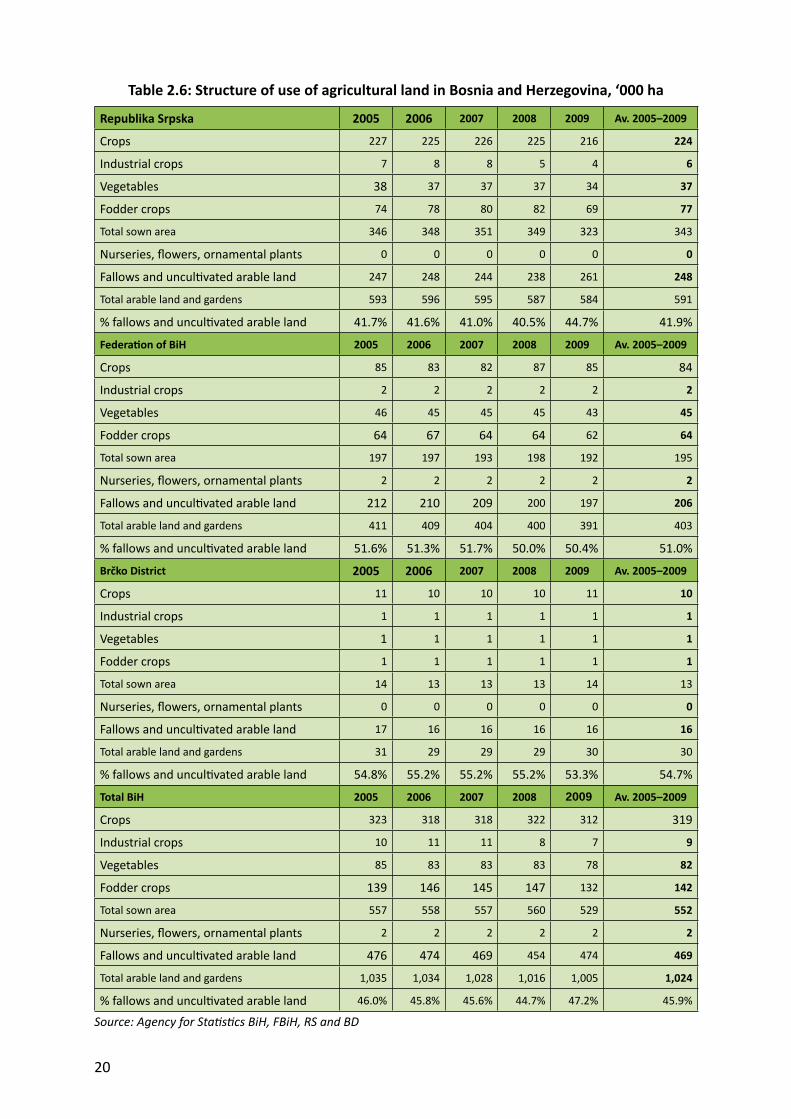
2.4.2.1. Agricultural land use
Most of the agricultural land in BiH is used for the produc on of grain (58 percent; 319,000 ha), where this produc on is more signifi cant in RS (65 percent) than in FBiH (43 percent). One quarter (26 percent; 142,000 ha) of the area is under forage crops, and 15 percent (82,000 ha) under vegetables. Areas under industrial crops are constantly being reduced, and by 2009 had fallen to 7,000 ha in all of Bosnia and Herzegovina (1.7 percent of agricultural land). The detailed structure of agricultural land use is shown in the Table 2.6.
20
Table 2.6: Structure of use of agricultural land in Bosnia and Herzegovina, ‘000 ha
Republika Srpska 2005 2006 2007 2008 2009 Av. 2005–2009
Crops 227 225 226 225 216 224
Industrial crops 7 8 8 5 4 6
Vegetables 38 37 37 37 34 37
Fodder crops 74 78 80 82 69 77
Total sown area 346 348 351 349 323 343
Nurseries, fl owers, ornamental plants 0 0 0 0 0 0
Fallows and uncul vated arable land 247 248 244 238 261 248
Total arable land and gardens 593 596 595 587 584 591
% fallows and uncul vated arable land 41.7% 41.6% 41.0% 40.5% 44.7% 41.9%
Federa on of BiH 2005 2006 2007 2008 2009 Av. 2005–2009
Crops 85 83 82 87 85 84
Industrial crops 2 2 2 2 2 2
Vegetables 46 45 45 45 43 45
Fodder crops 64 67 64 64 62 64
Total sown area 197 197 193 198 192 195
Nurseries, fl owers, ornamental plants 2 2 2 2 2 2
Fallows and uncul vated arable land 212 210 209 200 197 206
Total arable land and gardens 411 409 404 400 391 403
% fallows and uncul vated arable land 51.6% 51.3% 51.7% 50.0% 50.4% 51.0%
Brčko District 2005 2006 2007 2008 2009 Av. 2005–2009
Crops 11 10 10 10 11 10
Industrial crops 1 1 1 1 1 1
Vegetables 1 1 1 1 1 1
Fodder crops 1 1 1 1 1 1
Total sown area 14 13 13 13 14 13
Nurseries, fl owers, ornamental plants 0 0 0 0 0 0
Fallows and uncul vated arable land 17 16 16 16 16 16
Total arable land and gardens 31 29 29 29 30 30
% fallows and uncul vated arable land 54.8% 55.2% 55.2% 55.2% 53.3% 54.7%
Total BiH 2005 2006 2007 2008 2009 Av. 2005–2009
Crops 323 318 318 322 312 319
Industrial crops 10 11 11 8 7 9
Vegetables 85 83 83 83 78 82
Fodder crops 139 146 145 147 132 142
Total sown area 557 558 557 560 529 552
Nurseries, fl owers, ornamental plants 2 2 2 2 2 2
Fallows and uncul vated arable land 476 474 469 454 474 469
Total arable land and gardens 1,035 1,034 1,028 1,016 1,005 1,024
% fallows and uncul vated arable land 46.0% 45.8% 45.6% 44.7% 47.2% 45.9%
Source: Agency for Sta s cs BiH, FBiH, RS and BD
21
Close to half of the arable land in BiH is not cul vated (450–480,000 hectares). There are many contribu ng factors, including the presence of mines,8 the absence of economic mo va on of producers to be involved in agricultural produc on, the ageing of rural households, and the number of proper es s ll remaining vacant a er the war.
Household and farm structure
During the period of the Socialist Federal Republic of Yugoslavia, the size of private farms was limited to 10 ha on fl at and hilly land, whilst in mountain regions farmers were allowed to own up to about 30 ha. Moreover, private proper es and farms were not much favoured by the government during that me, and full a en on was paid only to state farms, which worked about 5 percent of all agricultural land.9
In 2006, it was es mated that there were over 500,000 agricultural holdings in BiH. More than 50 percent of these agricultural holdings are es mated to be less than 2 ha, and over 80 percent are less than 5 ha. These small farms are o en further divided into 7–9 small parcels crea ng major problems for produc vity and overall effi ciency. Although the size of land areas actually cul vated by individual farms may be larger, the extent of land fragmenta on restricts the adop on of more modern agricultural systems.
Recent surveys indicate that subsistence and semi-subsistence farms, which consume the majority of their produc on and produce only li le marketable surplus, remain the dominant form of farm structure in BiH. However, in recent years, there is increasing evidence of more farmers producing for the market. Most commercially oriented farms tend to be larger, though they are o en
restricted in their development due to their status as par ally priva zed en es, which limits their access to and use of modern management and investment capital; consequently many have leased parts of their lands to smaller private farmers. Overall, the need for consolida on of fragmented farm holdings into more viable economic units is recognized as one of the most pressing agricultural policy issues in BiH today.
The general problem of inadequate and uncoordinated data extends also to cadastral and land ownership data, much of which have not been updated since the war and so do not refl ect the current situa on. There is as yet no comprehensive farm or sta s cal register, so no offi cial data are available on the numbers of landowners or agricultural households. In the immediate post-war period there was evidence that the number of landowners was growing and the average size of holdings contrac ng, in marked contrast to the pa erns shown in almost every country of Europe;10 as the economy returns to a more normal condi on, a progressive migra on to the towns (shown consistently in Yugoslavia throughout its existence) may be expected to resume.
Agricultural GDP
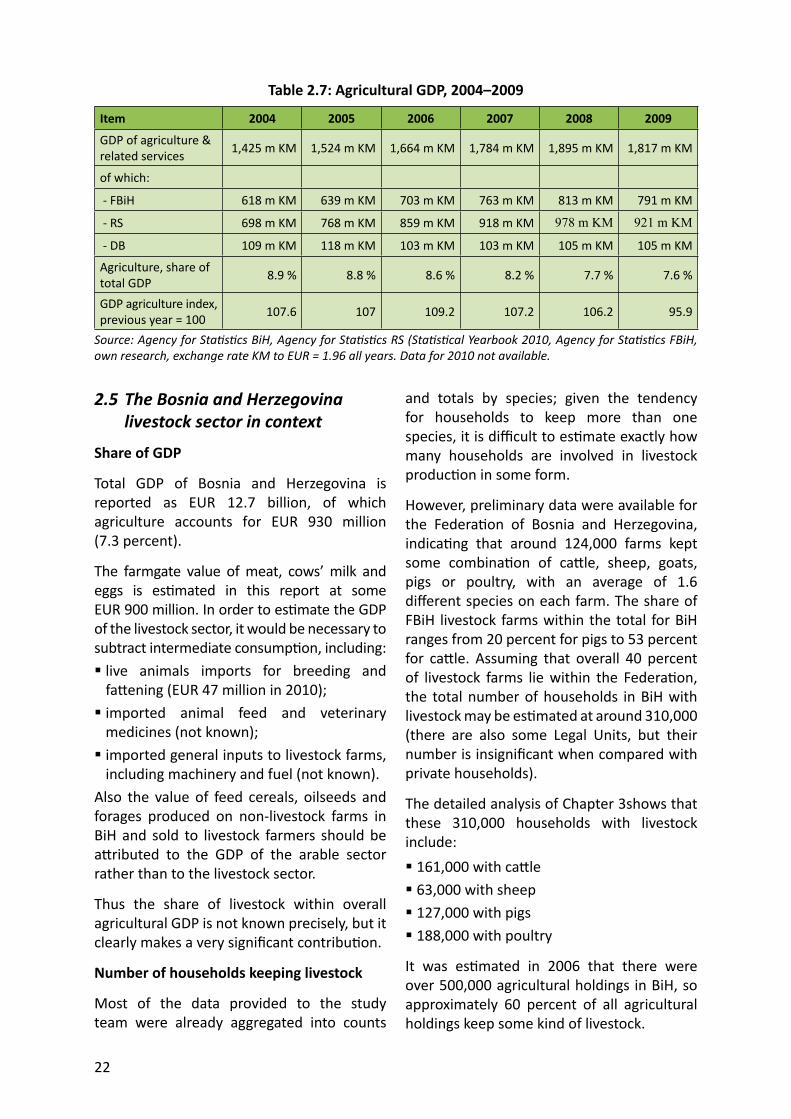
The recent development of agricultural GDP is presented in the Table 2.7.
The share of agriculture in overall GDP has decreased steadily from 2004 to 2009, and is rela vely low compared with other coun es in the region. In 2004, FBiH generated 43 percent of agricultural GDP, RS 49 percent and BD the remaining 8 percent. In 2009, FBiH generated 43.5 percent, RS 50.7 percent and BD 5.8 percent, represen ng a rela vely stable distribu on.
8 According to the BiH Mine Ac on Strategy (2009–2019), the Council of Ministers BiH, 2008, p. 6, BiH at the end of 2008, had suspected 1,573 km2 (mined) areas, which is slightly more than 3 percent of the territory. According to the Managing Director of the Bosnia and Herzegovina Mine Ac on Centre (BHMAC), the suspected area is today (June 2012) 1,544 km2 equal to 3.04 percent of the territory, see Atlan c Ini a ve Newsle er, June 2012. The capacity of demining is 35–40 km2 per year from 2012 to 2019, if fully opera onal. Recent data from the EUD indicate a suspected area of 1,442 km2 equal to 2.81 percent of the BiH territory.
9 Čustović, H. & Ljuša, M. Par cipatory Land Use Development in Bosnia and Herzegovina.p. 1.10 Čustović, H. & Ljuša, M. Par cipatory Land Use Development in Bosnia and Herzegovina. p.3.
22
2.5 The Bosnia and Herzegovina livestock sector in context
Share of GDP
Total GDP of Bosnia and Herzegovina is reported as EUR 12.7 billion, of which agriculture accounts for EUR 930 million (7.3 percent).
The farmgate value of meat, cows’ milk and eggs is es mated in this report at some EUR 900 million. In order to es mate the GDP of the livestock sector, it would be necessary to subtract intermediate consump on, including: live animals imports for breeding and fa ening (EUR 47 million in 2010); imported animal feed and veterinary medicines (not known); imported general inputs to livestock farms, including machinery and fuel (not known).
Also the value of feed cereals, oilseeds and forages produced on non-livestock farms in BiH and sold to livestock farmers should be a ributed to the GDP of the arable sector rather than to the livestock sector.
Thus the share of livestock within overall agricultural GDP is not known precisely, but it clearly makes a very signifi cant contribu on.
Number of households keeping livestock
Most of the data provided to the study team were already aggregated into counts
Table 2.7: Agricultural GDP, 2004–2009
Item 2004 2005 2006 2007 2008 2009
GDP of agriculture & related services 1,425 m KM 1,524 m KM 1,664 m KM 1,784 m KM 1,895 m KM 1,817 m KM
of which:
- FBiH 618 m KM 639 m KM 703 m KM 763 m KM 813 m KM 791 m KM
- RS 698 m KM 768 m KM 859 m KM 918 m KM 978 m KM 921 m KM
- DB 109 m KM 118 m KM 103 m KM 103 m KM 105 m KM 105 m KM
Agriculture, share of total GDP 8.9 % 8.8 % 8.6 % 8.2 % 7.7 % 7.6 %
GDP agriculture index, previous year = 100 107.6 107 109.2 107.2 106.2 95.9
Source: Agency for Sta s cs BiH, Agency for Sta s cs RS (Sta s cal Yearbook 2010, Agency for Sta s cs FBiH, own research, exchange rate KM to EUR = 1.96 all years. Data for 2010 not available.
and totals by species; given the tendency for households to keep more than one species, it is diffi cult to es mate exactly how many households are involved in livestock produc on in some form.
However, preliminary data were available for the Federa on of Bosnia and Herzegovina, indica ng that around 124,000 farms kept some combina on of ca le, sheep, goats, pigs or poultry, with an average of 1.6 diff erent species on each farm. The share of FBiH livestock farms within the total for BiH ranges from 20 percent for pigs to 53 percent for ca le. Assuming that overall 40 percent of livestock farms lie within the Federa on, the total number of households in BiH with livestock may be es mated at around 310,000 (there are also some Legal Units, but their number is insignifi cant when compared with private households).
The detailed analysis of Chapter 3shows that these 310,000 households with livestock include: 161,000 with ca le 63,000 with sheep 127,000 with pigs 188,000 with poultry
It was es mated in 2006 that there were over 500,000 agricultural holdings in BiH, so approximately 60 percent of all agricultural holdings keep some kind of livestock.
23
3. Farmers
This sec on presents a detailed qualita ve and quan ta ve descrip on of livestock producers, according to the following structure:
Sec on 3.1 describes the methodology and data sources employed, as the basis for the rest of this chapter.
Sec on 3.2 gives a short socio-economic overview of livestock farmers, based on the results of the Project Farm Survey.
Sec on 3.3 discusses ca le farms and their produc on of milk and beef meat.
Sec on 3.4 covers the produc on of sheep and sheep meat.
Sec on 3.5 covers pigs and pig meat.
Sec on 3.6 covers poultry and the produc on of poultry meat and eggs.
Sec on 3.7 deals briefl y with the produc on of milk from sheep and goats.
Sec on 3.8 presents es mates of Gross Output from the primary livestock sector.
Sec on 3.9 gives an overall summary of livestock produc on and processing structure, and highlights some of the issues relevant to the policy and investment response.
Sec on 3.10 combines this chapter’s es mates of farm-level output with customs data on imports and exports to produce an overall supply-u liza on balance for meat, and compares its es mates of per capita consump on with those for other countries in the region.
3.1 Methodology and data sources employed
Almost every commentator refers to the diffi cul es of obtaining reliable sta s cs in Bosnia and Herzegovina. It was clear from the outset that this would be a major challenge for this study, and so considerable a en on has been given to assessing,
comparing and combining diff erent datasets, and to developing a project livestock survey to fi ll the most important gaps in current knowledge. The overall methodology is summarized in this sec on, and the specifi c approach taken to poultry is detailed in Annex 1.
The study team would like to thank the en ty sta s cal offi ces, the Sta s cal Agency of Bosnia and Herzegovina, and the Agency for Animal Iden fi ca on for their kind coopera on, generous provision of data, and willingness to enter into open debate about the strengths and weaknesses of their own datasets.
In summary, the es mates of livestock numbers made in this study are based on a survey of some 15,000 private farms carried out by the sta s cal offi ces, plus direct repor ng from all legal units, which compares favourably with the methodology applied in other countries. As an example, Serbia has been developing its agricultural sta s cs system with Eurostat support and its offi cial es mates of livestock numbers are now based on an annual survey of 5,000 holdings, divided into ten strata, plus direct repor ng from all legal units.
Readers not specifi cally concerned with the detailed methodology may wish to jump straight to sec on 3.2.
3.1.1 Strengths and weaknesses of each dataset
Offi cial sta s cs provide es mates of the total number of livestock of each species, and how many of these are breeding females (cows and heifers; sows and gilts; ewes; laying hens) as compared to other (usually fa ening) animals. These data are collected year a er year in a consistent way and so provide the best available indicator of trends in the sector. However, there are some recognized limita ons in the sta s cal methodology
24
employed11 and these sta s cs do not give any es mate of the number of livestock farms nor any picture of their structure, neither by herd/fl ock size nor by orienta on of produc on (towards milk, meat or eggs, or towards breeding or fa ening).
As part of the input to offi cial agricultural sta s cs, each farm registered as a legal unit (e.g. company or coopera ve) is obliged to provide an annual report on livestock numbers to its local sta s cal offi ce, so for legal units both the number of farms and the number of livestock are known. Despite the obliga on to report annually, it is understood that some enterprises do not always provide data, so these numbers will be a slight underes mate of the true posi on.
The Master Sample of some 15,000 private farms and agricultural households gives a detailed picture of the size distribu on of livestock holdings, but records only one livestock defi ni on for each species (the total number of animals for ca le, pigs and poultry, and the number of breeding females for sheep). With a simple ques onnaire and a large sample site, this source provides a small number of variables with a high degree of sta s cal accuracy.
The Pilot Agricultural Census covered 866 farms, 657 of which kept livestock, and collected full informa on from each of them using a ques onnaire based on the EU Farm Structure Survey, covering the period October 2009 to September 2010. It included the numbers and types of livestock kept (by age, sex, weight, breed type and/or purpose, according to context), so allowing each livestock enterprise to be placed in an agriculturally meaningful category such as “small dairy farm” or “pig fa ening”. With its medium sample size, small number of sampling units, and detailed ques onnaire,
11 The number of animals of each kind on private farms and households is provided by “es mators” in each municipality, rather than by any structured survey or census methodology. The en ty and state-level sta s cal bodies are currently in the process of developing new methods of data collec on in line with interna onal and Eurostat standards, with support from the EU and na onal donors. As a result of this work, Bosnia should soon be in possession of much more reliable and comprehensive sta s cal data which may be used in place of the various es mates that had to be made in this study.
this source is less reliable as a standalone es mate of livestock or farm numbers, but can provide reasonably robust es mates of the share of livestock on each farm type.
None of these sources records farm-level informa on on outputs or marke ng channels, so this informa on was collected through a purpose-designed stra fi ed survey of 121 livestock farms, carried out specifi cally for this study. This is quite a small sample, not suffi cient to give a reliable es mate of something that varies greatly from farm to farm (such as the number of livestock of each type), but moderately reliable for es ma ng less variable numbers, such as output per animal or price per kilogram.
In the case just of ca le, an addi onal data source was available, in the form of the Animal Iden fi ca on and Registra on (I&R) database, established in 2006–7 in line with EU legisla on. Like all such systems in the region, the database was probably at its most accurate immediately a er the ini al ear-tagging campaigns in each en ty, which were completed in 2006 in RS and BD, and in 2007 in FBiH. It will then have become progressively less reliable as a sta s cal data source due to delayed or under-repor ng of deaths, births and movements. It was therefore agreed with the Agency for Animal Iden fi ca on to work with two extracts from the historical database, showing the situa on in RS and BD at the end of 2006, and the situa on in FBiH at the end of 2007; the implica ons of changes in the ca le popula on since these dates is discussed in the relevant sec ons below.
3.1.2 Methodology to combine data sources
Data from these diff erent sources was combined as follows:
25
Pilot Agricultural Census
Each livestock enterprise (ca le, sheep, pigs, poultry) on each of the 866 farms of the Pilot Agricultural Census was classifi ed in two ways:• By herd/fl ock size group (1, 2, 3–5, 6–10,
etc.) for either total animals or (in the case of sheep) for the number of breeding females;
• By enterprise type, combining data on size, breed and the rela ve share of diff erent categories of livestock; a diff erent approach was developed for each kind of livestock, as described in the following sec ons.
For each species and herd/fl ock size group, the following ra os were calculated:• Percentage of farms falling into each farm
type;• Percentage of total animals falling into
each farm type;• Ra o of breeding females to total animals
for each farm type.
Master Sample (MS)
Tables were provided by the Sta s cal Agency for each livestock species, by en ty and municipality, showing:• The number of farms in each herd/fl ock
size group (using the same groups as for the Pilot Agricultural Census);
• The number of livestock (total or breeding females) in each herd/fl ock size group.
The numbers of farms and livestock recorded by the Master Sample for each municipality were divided by the response-adjusted sampling frac on achieved in each en ty (6.88 percent in FBiH, 6.86 percent in RS, 18.02 percent in BD) in order to generate unbiased popula on es mates. The Sta s cal Agency advised that the Master Sample data were not reliable at the level of individual municipali es, so municipality-level es mates were only used as building blocks to combine into larger units with greater sta s cal accuracy. The following aggregate es mates were made:
• En ty;• Agro-ecological zone (Lowland; Hilly;
Hilly-Mountainous; Mountainous; Mediterranean; Mediterranean-Mountainous);
• Al tude: » Lowland = Lowland + Hilly + Mediterranean » Upland = Hilly-Mountainous + Mountainous + Mediterranean-Mountainous
Legal Units (LUs)
The Master Sample covered only private farms and agricultural households, not legal units (companies, coopera ves, etc.), so data on legal units from the FBiH and RS Sta s cal Offi ces were added to the Master Sample es mates as an addi onal special size group. No data on legal units were available for Brčko District, so for each species the number of animals on legal units in Brčko District was es mated from the ra o of animals on legal units to animals on private holdings for the rest of Bosnia and Herzegovina. This is not a par cularly reliable es mator, but the propor on of total livestock represented by legal units in Brčko District is so small (0.07 percent of all ca le, 0.00 percent of all sheep, 0.10 percent of all pigs, and 0.51 percent of all poultry) that its eff ect on overall numbers is negligible. In the absence of any informa on on the number of legal units in Brčko District, these small numbers of es mated livestock were all considered to lie on one token farm.
Combining data from the Master Sample, Legal Units, and the Pilot Agricultural Census
The Master Sample and Legal Units data were used, as described above, to es mate the total number of livestock of each species and the number of farms keeping each species, by municipality and by herd/fl ock size group. The number of breeding females of each species, by municipality and herd/fl ock size group, was calculated from the ra o of
26
breeding females to total livestock found in the Pilot Agricultural Census.12
Within each species, municipality and size group, the total number of farms, animals and breeding females was allocated between farm types in propor on to the share found in the Pilot Agricultural Census for that species and size group. The individual es mates were then summed up to produce na onal es mates of the numbers of farms, animals and breeding females for each farm type.
Project Farm Survey
Each farm in the Project Farm Survey was classifi ed as a type of ca le, sheep, pig and poultry, using iden cal farm-type defi ni ons as for the Pilot Agricultural Census. The following averages were calculated for each farm type in the Project Farm Survey:• The quan ty and value of milk, eggs
and meat produced, and livestock slaughtered, per head of breeding or fa ening livestock;
• The quan ty and value of meat, milk and eggs used or sold through each marke ng channel (home consump on, direct sale, sale to dairy, etc. as relevant to the kind of output).
The na onal es mates of animal numbers for each farm type were mul plied by these es mates of output quan ty and value per head to generate total output by farm type. This total output was then allocated between the diff erent marke ng channels in propor on to the split found in the Project Farm Survey for each farm type.
The Project Farm Survey also collected data on farm family structure, income sources and plans, which is analysed in sec on 3.2, and on farm infrastructure and investment needs, which is presented in Chapter 9 on Iden fi ca on of poten al and needs of the sector.
Ca le Iden fi ca on and Registra on Database
Each farm in the animal iden fi ca on database was classifi ed by herd size group (trea ng any female over 24 months old as a cow) and by agro-ecological zone, and then analysed to give:• The herd size distribu on;• The breakdown of ca le by breed, split
by en ty and by agro-ecological zone. These data are presented in sec on 3.3.3 as addi onal informa on about ca le produc on.
Cross-check with other sources
The fi nal results of all these calcula ons were then cross-checked with various sta s cs, reports and stakeholders in order to confi rm their overall plausibility. The results of these cross-checks are presented in the following sec ons.
Note on en ty-level results
The Master Sample is large enough to give reliable es mates of farm and animal numbers at en ty level, which are included in Annex 7; The Pilot Agricultural Census included only two municipali es in each main en ty, together with all of Brčko District. This is insuffi cient to detect reliably diff erences in the shares of farm types between the en es, so its results have been applied na onally; The Project Farm Survey was conducted in both en es. When analysing all farms in the sample together (as in the analysis of farm households in sec on 3.2) it is just about possible to diff eren ate between the en es, but when the farms are further roken down by type, the numbers in each cell become too small for further subdivision by en ty. Therefore es mates of output and marke ng are given at the na onal level only.
12 In the case of sheep, where the Master Sample recorded ewes, the reverse approach was employed, es ma ng total sheep from the number of breeding females.
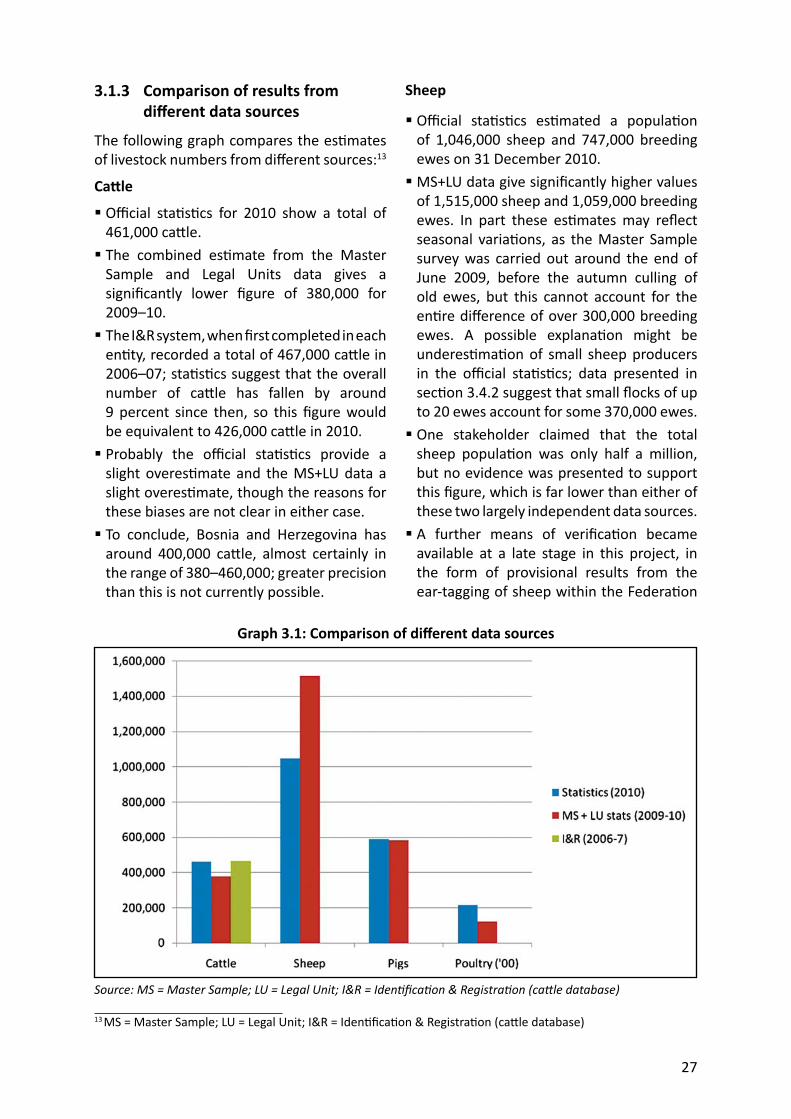
27
3.1.3 Comparison of results from diff erent data sources
The following graph compares the es mates of livestock numbers from diff erent sources:13
Ca le
Offi cial sta s cs for 2010 show a total of 461,000 ca le. The combined es mate from the Master Sample and Legal Units data gives a signifi cantly lower fi gure of 380,000 for 2009–10. The I&R system, when fi rst completed in each en ty, recorded a total of 467,000 ca le in 2006–07; sta s cs suggest that the overall number of ca le has fallen by around 9 percent since then, so this fi gure would be equivalent to 426,000 ca le in 2010. Probably the offi cial sta s cs provide a slight overes mate and the MS+LU data a slight overes mate, though the reasons for these biases are not clear in either case. To conclude, Bosnia and Herzegovina has around 400,000 ca le, almost certainly in the range of 380–460,000; greater precision than this is not currently possible.
Sheep
Offi cial sta s cs es mated a popula on of 1,046,000 sheep and 747,000 breeding ewes on 31 December 2010. MS+LU data give signifi cantly higher values of 1,515,000 sheep and 1,059,000 breeding ewes. In part these es mates may refl ect seasonal varia ons, as the Master Sample survey was carried out around the end of June 2009, before the autumn culling of old ewes, but this cannot account for the en re diff erence of over 300,000 breeding ewes. A possible explana on might be underes ma on of small sheep producers in the offi cial sta s cs; data presented in sec on 3.4.2 suggest that small fl ocks of up to 20 ewes account for some 370,000 ewes. One stakeholder claimed that the total sheep popula on was only half a million, but no evidence was presented to support this fi gure, which is far lower than either of these two largely independent data sources. A further means of verifi ca on became available at a late stage in this project, in the form of provisional results from the ear-tagging of sheep within the Federa on
Graph 3.1: Comparison of diff erent data sources
Source: MS = Master Sample; LU = Legal Unit; I&R = Iden fi ca on & Registra on (ca le database)
13 MS = Master Sample; LU = Legal Unit; I&R = Iden fi ca on & Registra on (ca le database)
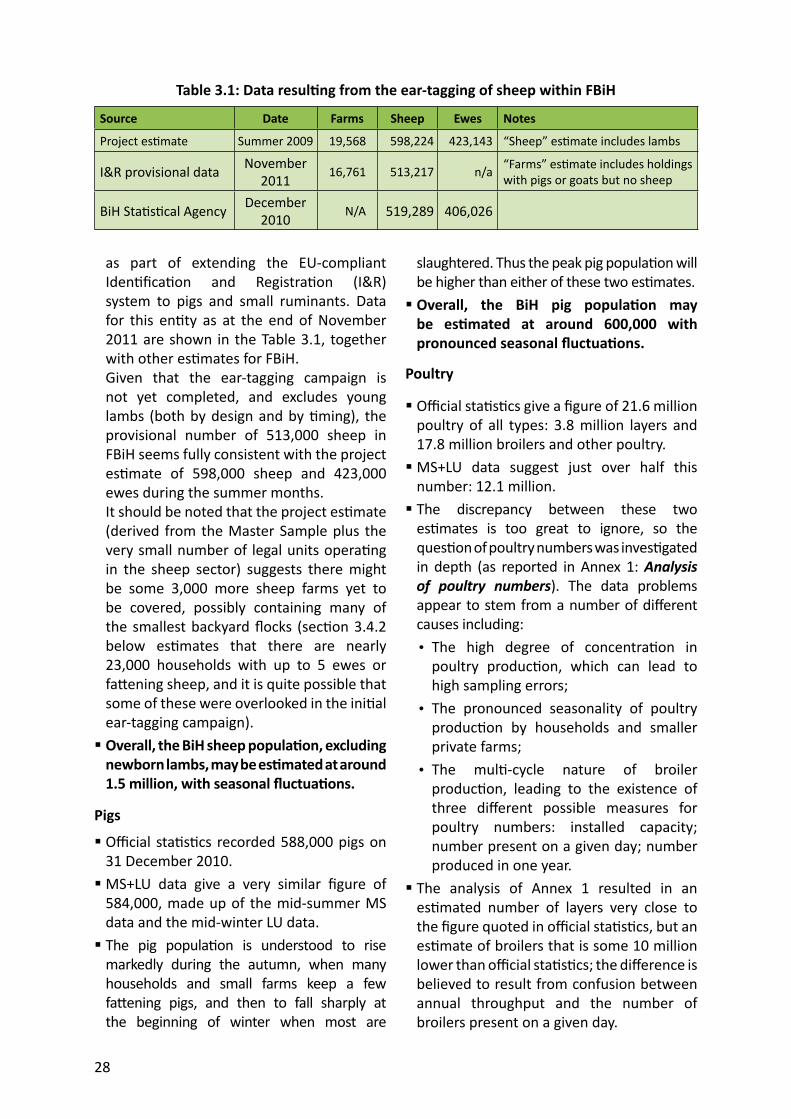
28
as part of extending the EU-compliant Iden fi ca on and Registra on (I&R) system to pigs and small ruminants. Data for this en ty as at the end of November 2011 are shown in the Table 3.1, together with other es mates for FBiH. Given that the ear-tagging campaign is not yet completed, and excludes young lambs (both by design and by ming), the provisional number of 513,000 sheep in FBiH seems fully consistent with the project es mate of 598,000 sheep and 423,000 ewes during the summer months. It should be noted that the project es mate (derived from the Master Sample plus the very small number of legal units opera ng in the sheep sector) suggests there might be some 3,000 more sheep farms yet to be covered, possibly containing many of the smallest backyard fl ocks (sec on 3.4.2 below es mates that there are nearly 23,000 households with up to 5 ewes or fa ening sheep, and it is quite possible that some of these were overlooked in the ini al ear-tagging campaign). Overall, the BiH sheep popula on, excluding newborn lambs, may be es mated at around 1.5 million, with seasonal fl uctua ons.
Pigs
Offi cial sta s cs recorded 588,000 pigs on 31 December 2010. MS+LU data give a very similar fi gure of 584,000, made up of the mid-summer MS data and the mid-winter LU data. The pig popula on is understood to rise markedly during the autumn, when many households and small farms keep a few fa ening pigs, and then to fall sharply at the beginning of winter when most are
Table 3.1: Data resul ng from the ear-tagging of sheep within FBiH
Source Date Farms Sheep Ewes Notes
Project es mate Summer 2009 19,568 598,224 423,143 “Sheep” es mate includes lambs
I&R provisional data November 2011 16,761 513,217 n/a “Farms” es mate includes holdings
with pigs or goats but no sheep
BiH Sta s cal Agency December 2010 N/A 519,289 406,026
slaughtered. Thus the peak pig popula on will be higher than either of these two es mates. Overall, the BiH pig popula on may be es mated at around 600,000 with pronounced seasonal fl uctua ons.
Poultry
Offi cial sta s cs give a fi gure of 21.6 million poultry of all types: 3.8 million layers and 17.8 million broilers and other poultry. MS+LU data suggest just over half this number: 12.1 million. The discrepancy between these two es mates is too great to ignore, so the ques on of poultry numbers was inves gated in depth (as reported in Annex 1: Analysis of poultry numbers). The data problems appear to stem from a number of diff erent causes including:• The high degree of concentra on in
poultry produc on, which can lead to high sampling errors;
• The pronounced seasonality of poultry produc on by households and smaller private farms;
• The mul -cycle nature of broiler produc on, leading to the existence of three diff erent possible measures for poultry numbers: installed capacity; number present on a given day; number produced in one year.
The analysis of Annex 1 resulted in an es mated number of layers very close to the fi gure quoted in offi cial sta s cs, but an es mate of broilers that is some 10 million lower than offi cial sta s cs; the diff erence is believed to result from confusion between annual throughput and the number of broilers present on a given day.
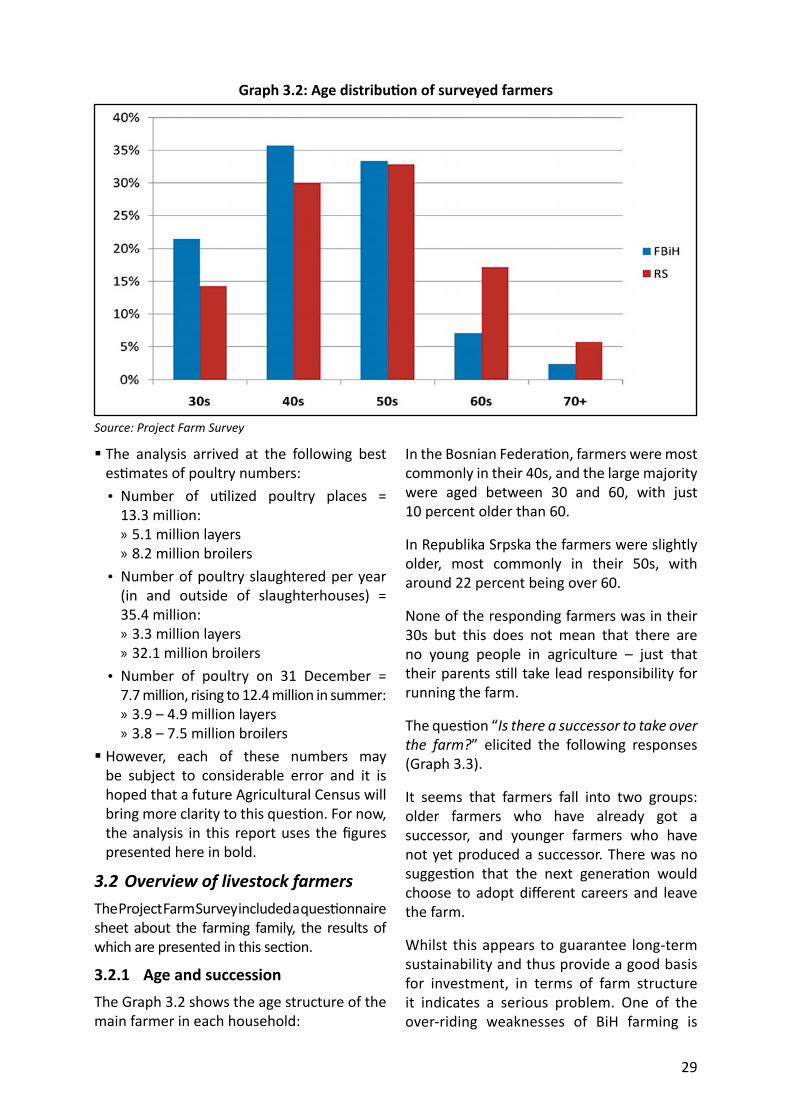
29
The analysis arrived at the following best es mates of poultry numbers:• Number of u lized poultry places =
13.3 million: » 5.1 million layers » 8.2 million broilers
• Number of poultry slaughtered per year (in and outside of slaughterhouses) = 35.4 million: » 3.3 million layers » 32.1 million broilers
• Number of poultry on 31 December = 7.7 million, rising to 12.4 million in summer: » 3.9 – 4.9 million layers » 3.8 – 7.5 million broilers
However, each of these numbers may be subject to considerable error and it is hoped that a future Agricultural Census will bring more clarity to this ques on. For now, the analysis in this report uses the fi gures presented here in bold.
3.2 Overview of livestock farmersThe Project Farm Survey included a ques onnaire sheet about the farming family, the results of which are presented in this sec on.
3.2.1 Age and successionThe Graph 3.2 shows the age structure of the main farmer in each household:
Graph 3.2: Age distribu on of surveyed farmers
Source: Project Farm Survey
In the Bosnian Federa on, farmers were most commonly in their 40s, and the large majority were aged between 30 and 60, with just 10 percent older than 60.
In Republika Srpska the farmers were slightly older, most commonly in their 50s, with around 22 percent being over 60.
None of the responding farmers was in their 30s but this does not mean that there are no young people in agriculture – just that their parents s ll take lead responsibility for running the farm.
The ques on “Is there a successor to take over the farm?” elicited the following responses (Graph 3.3).
It seems that farmers fall into two groups: older farmers who have already got a successor, and younger farmers who have not yet produced a successor. There was no sugges on that the next genera on would choose to adopt diff erent careers and leave the farm.
Whilst this appears to guarantee long-term sustainability and thus provide a good basis for investment, in terms of farm structure it indicates a serious problem. One of the over-riding weaknesses of BiH farming is
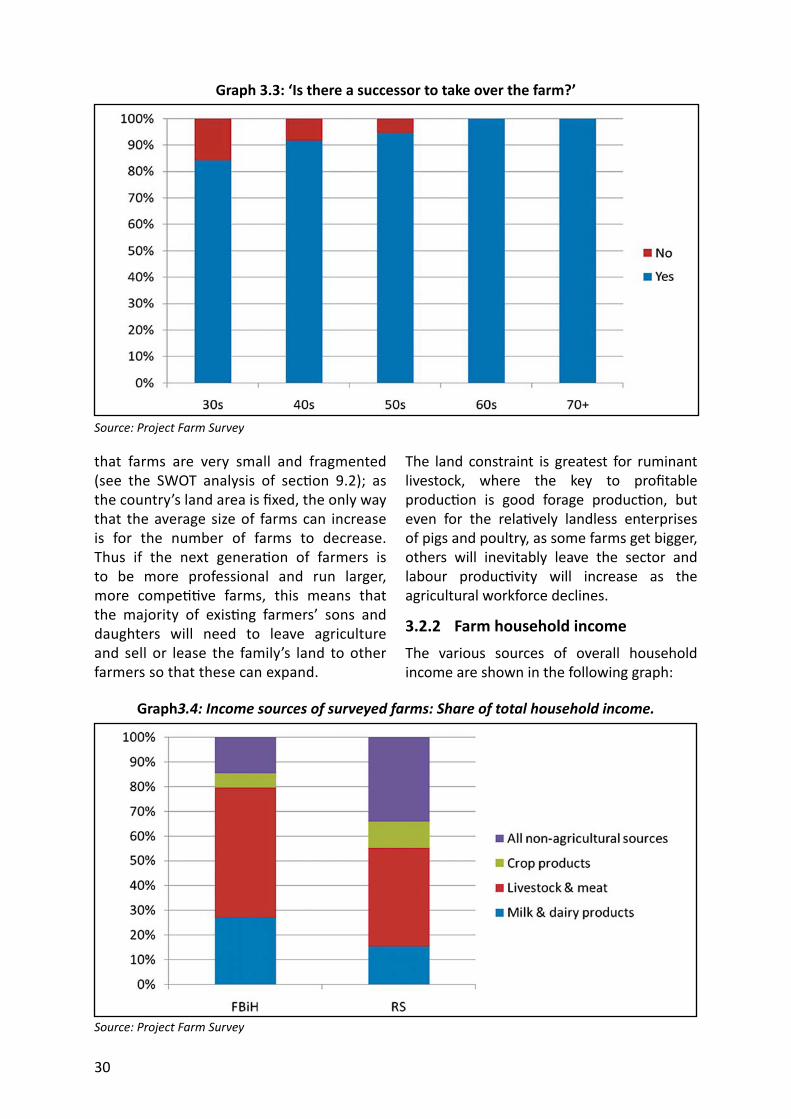
30
that farms are very small and fragmented (see the SWOT analysis of sec on 9.2); as the country’s land area is fi xed, the only way that the average size of farms can increase is for the number of farms to decrease. Thus if the next genera on of farmers is to be more professional and run larger, more compe ve farms, this means that the majority of exis ng farmers’ sons and daughters will need to leave agriculture and sell or lease the family’s land to other farmers so that these can expand.
Graph 3.3: ‘Is there a successor to take over the farm?’
Source: Project Farm Survey
The land constraint is greatest for ruminant livestock, where the key to profi table produc on is good forage produc on, but even for the rela vely landless enterprises of pigs and poultry, as some farms get bigger, others will inevitably leave the sector and labour produc vity will increase as the agricultural workforce declines.
3.2.2 Fa rm household incomeThe various sources of overall household income are shown in the following graph:
Graph3.4: Income sources of surveyed farms: Share of total household income.
Source: Project Farm Survey
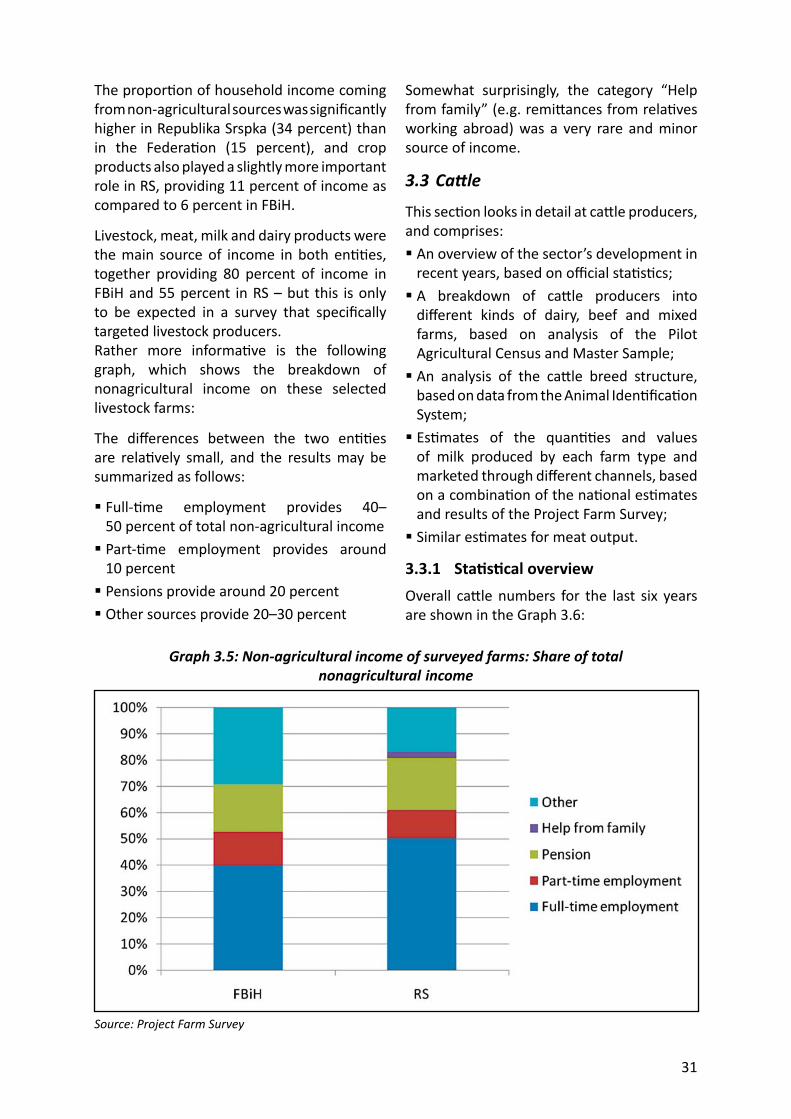
31
The propor on of household income coming from non-agricultural sources was signifi cantly higher in Republika Srspka (34 percent) than in the Federa on (15 percent), and crop products also played a slightly more important role in RS, providing 11 percent of income as compared to 6 percent in FBiH.
Livestock, meat, milk and dairy products were the main source of income in both en es, together providing 80 percent of income in FBiH and 55 percent in RS – but this is only to be expected in a survey that specifi cally targeted livestock producers.Rather more informa ve is the following graph, which shows the breakdown of nonagricultural income on these selected livestock farms:
The diff erences between the two en es are rela vely small, and the results may be summarized as follows:
Full- me employment provides 40–50 percent of total non-agricultural income Part- me employment provides around 10 percent Pensions provide around 20 percent Other sources provide 20–30 percent
Somewhat surprisingly, the category “Help from family” (e.g. remi ances from rela ves working abroad) was a very rare and minor source of income.
3.3 Ca le
This sec on looks in detail at ca le producers, and comprises: An overview of the sector’s development in recent years, based on offi cial sta s cs; A breakdown of ca le producers into diff erent kinds of dairy, beef and mixed farms, based on analysis of the Pilot Agricultural Census and Master Sample; An analysis of the ca le breed structure, based on data from the Animal Iden fi ca on System; Es mates of the quan es and values of milk produced by each farm type and marketed through diff erent channels, based on a combina on of the na onal es mates and results of the Project Farm Survey; Similar es mates for meat output.
3.3.1 Sta s cal overviewOverall ca le numbers for the last six years are shown in the Graph 3.6:
Graph 3.5: Non-agricultural income of surveyed farms: Share of total nonagricultural income
Source: Project Farm Survey
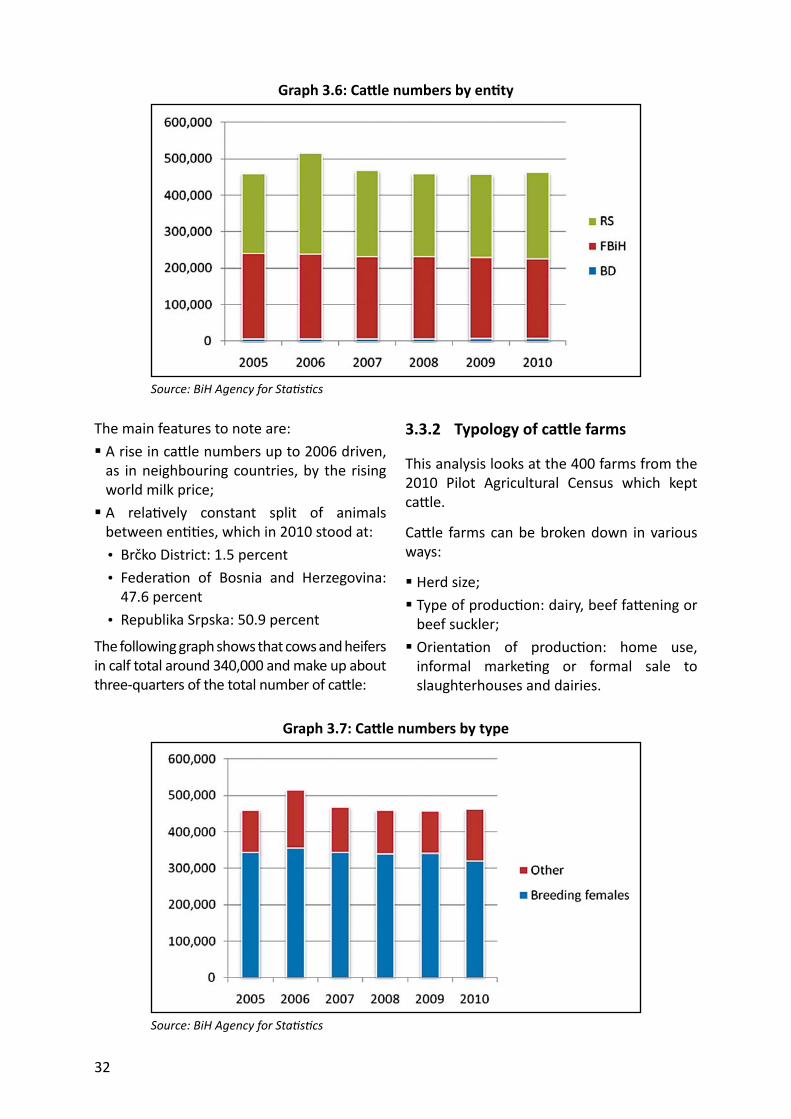
32
The main features to note are: A rise in ca le numbers up to 2006 driven, as in neighbouring countries, by the rising world milk price; A rela vely constant split of animals between en es, which in 2010 stood at:• Brčko District: 1.5 percent• Federa on of Bosnia and Herzegovina:
47.6 percent• Republika Srpska: 50.9 percent
The following graph shows that cows and heifers in calf total around 340,000 and make up about three-quarters of the total number of ca le:
Graph 3.6: Ca le numbers by en ty
Source: BiH Agency for Sta s cs
3.3.2 Typolo gy of ca le farms
This analysis looks at the 400 farms from the 2010 Pilot Agricultural Census which kept ca le.
Ca le farms can be broken down in various ways:
Herd size; Type of produc on: dairy, beef fa ening or beef suckler; Orienta on of produc on: home use, informal marke ng or formal sale to slaughterhouses and dairies.
Graph 3.7: Ca le numbers by type
Source: BiH Agency for Sta s cs
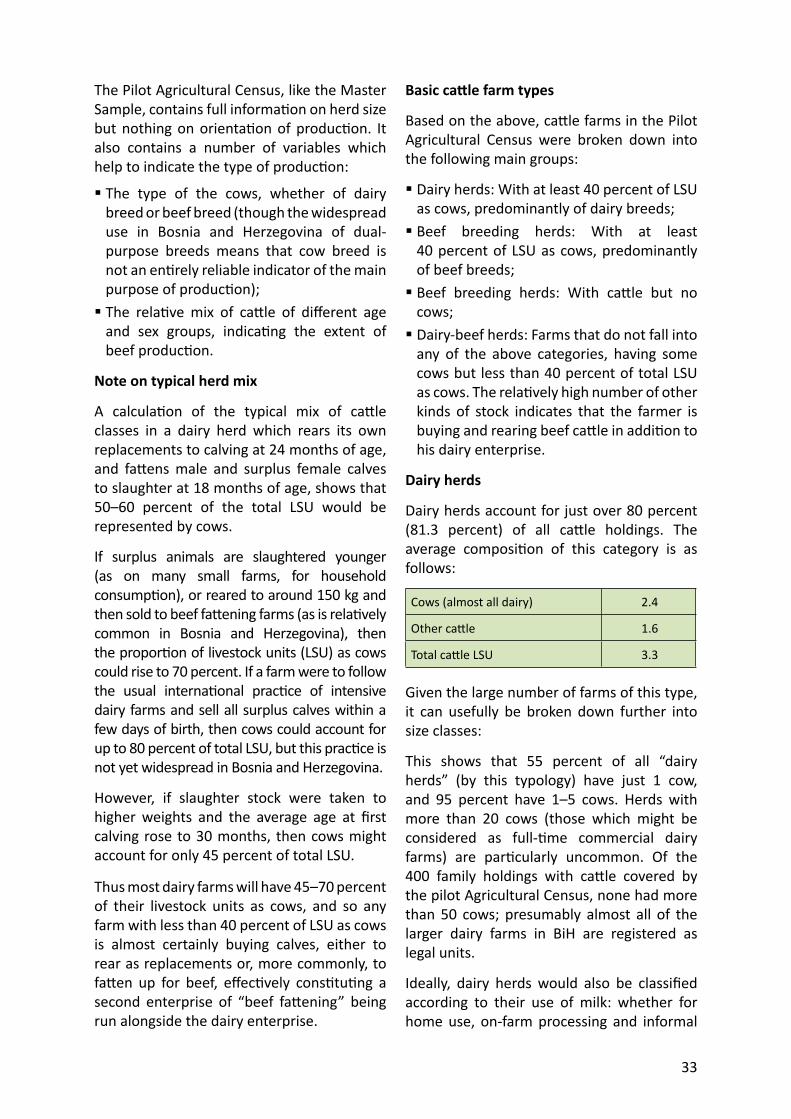
33
The Pilot Agricultural Census, like the Master Sample, contains full informa on on herd size but nothing on orienta on of produc on. It also contains a number of variables which help to indicate the type of produc on:
The type of the cows, whether of dairy breed or beef breed (though the widespread use in Bosnia and Herzegovina of dual-purpose breeds means that cow breed is not an en rely reliable indicator of the main purpose of produc on); The rela ve mix of ca le of diff erent age and sex groups, indica ng the extent of beef produc on.
Note on typical herd mix
A calcula on of the typical mix of ca le classes in a dairy herd which rears its own replacements to calving at 24 months of age, and fa ens male and surplus female calves to slaughter at 18 months of age, shows that 50–60 percent of the total LSU would be represented by cows.
If surplus animals are slaughtered younger (as on many small farms, for household consump on), or reared to around 150 kg and then sold to beef fa ening farms (as is rela vely common in Bosnia and Herzegovina), then the propor on of livestock units (LSU) as cows could rise to 70 percent. If a farm were to follow the usual interna onal prac ce of intensive dairy farms and sell all surplus calves within a few days of birth, then cows could account for up to 80 percent of total LSU, but this prac ce is not yet widespread in Bosnia and Herzegovina.
However, if slaughter stock were taken to higher weights and the average age at fi rst calving rose to 30 months, then cows might account for only 45 percent of total LSU.
Thus most dairy farms will have 45–70 percent of their livestock units as cows, and so any farm with less than 40 percent of LSU as cows is almost certainly buying calves, either to rear as replacements or, more commonly, to fa en up for beef, eff ec vely cons tu ng a second enterprise of “beef fa ening” being run alongside the dairy enterprise.
Basic ca le farm types
Based on the above, ca le farms in the Pilot Agricultural Census were broken down into the following main groups:
Dairy herds: With at least 40 percent of LSU as cows, predominantly of dairy breeds; Beef breeding herds: With at least 40 percent of LSU as cows, predominantly of beef breeds; Beef breeding herds: With ca le but no cows; Dairy-beef herds: Farms that do not fall into any of the above categories, having some cows but less than 40 percent of total LSU as cows. The rela vely high number of other kinds of stock indicates that the farmer is buying and rearing beef ca le in addi on to his dairy enterprise.
Dairy herds
Dairy herds account for just over 80 percent (81.3 percent) of all ca le holdings. The average composi on of this category is as follows:
Cows (almost all dairy) 2.4
Other ca le 1.6
Total ca le LSU 3.3
Given the large number of farms of this type, it can usefully be broken down further into size classes:
This shows that 55 percent of all “dairy herds” (by this typology) have just 1 cow, and 95 percent have 1–5 cows. Herds with more than 20 cows (those which might be considered as full- me commercial dairy farms) are par cularly uncommon. Of the 400 family holdings with ca le covered by the pilot Agricultural Census, none had more than 50 cows; presumably almost all of the larger dairy farms in BiH are registered as legal units.
Ideally, dairy herds would also be classifi ed according to their use of milk: whether for home use, on-farm processing and informal
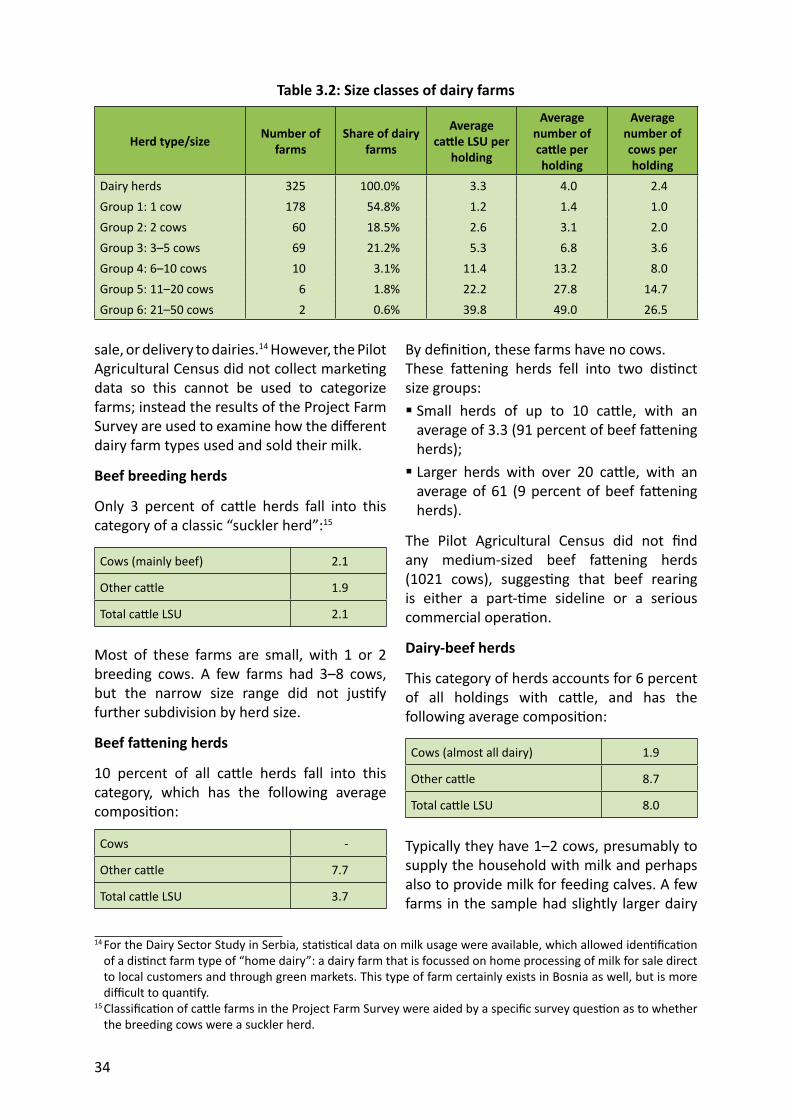
34
sale, or delivery to dairies.14 However, the Pilot Agricultural Census did not collect marke ng data so this cannot be used to categorize farms; instead the results of the Project Farm Survey are used to examine how the diff erent dairy farm types used and sold their milk.
Beef breeding herds
Only 3 percent of ca le herds fall into this category of a classic “suckler herd”:15
Cows (mainly beef) 2.1
Other ca le 1.9
Total ca le LSU 2.1
Most of these farms are small, with 1 or 2 breeding cows. A few farms had 3–8 cows, but the narrow size range did not jus fy further subdivision by herd size.
Beef fa ening herds
10 percent of all ca le herds fall into this category, which has the following average composi on:
Cows -
Other ca le 7.7
Total ca le LSU 3.7
Table 3.2: Size classes of dairy farms
Herd type/size Number of farms
Share of dairy farms
Average ca le LSU per
holding
Average number of ca le per holding
Average number of cows per holding
Dairy herds 325 100.0% 3.3 4.0 2.4Group 1: 1 cow 178 54.8% 1.2 1.4 1.0Group 2: 2 cows 60 18.5% 2.6 3.1 2.0Group 3: 3–5 cows 69 21.2% 5.3 6.8 3.6Group 4: 6–10 cows 10 3.1% 11.4 13.2 8.0Group 5: 11–20 cows 6 1.8% 22.2 27.8 14.7Group 6: 21–50 cows 2 0.6% 39.8 49.0 26.5
By defi ni on, these farms have no cows.These fa ening herds fell into two dis nct size groups: Small herds of up to 10 ca le, with an average of 3.3 (91 percent of beef fa ening herds); Larger herds with over 20 ca le, with an average of 61 (9 percent of beef fa ening herds).
The Pilot Agricultural Census did not fi nd any medium-sized beef fa ening herds (1021 cows), sugges ng that beef rearing is either a part- me sideline or a serious commercial opera on.
Dairy-beef herds
This category of herds accounts for 6 percent of all holdings with ca le, and has the following average composi on:
Cows (almost all dairy) 1.9
Other ca le 8.7
Total ca le LSU 8.0
Typically they have 1–2 cows, presumably to supply the household with milk and perhaps also to provide milk for feeding calves. A few farms in the sample had slightly larger dairy
14 For the Dairy Sector Study in Serbia, sta s cal data on milk usage were available, which allowed iden fi ca on of a dis nct farm type of “home dairy”: a dairy farm that is focussed on home processing of milk for sale direct to local customers and through green markets. This type of farm certainly exists in Bosnia as well, but is more diffi cult to quan fy.
15 Classifi ca on of ca le farms in the Project Farm Survey were aided by a specifi c survey ques on as to whether the breeding cows were a suckler herd.
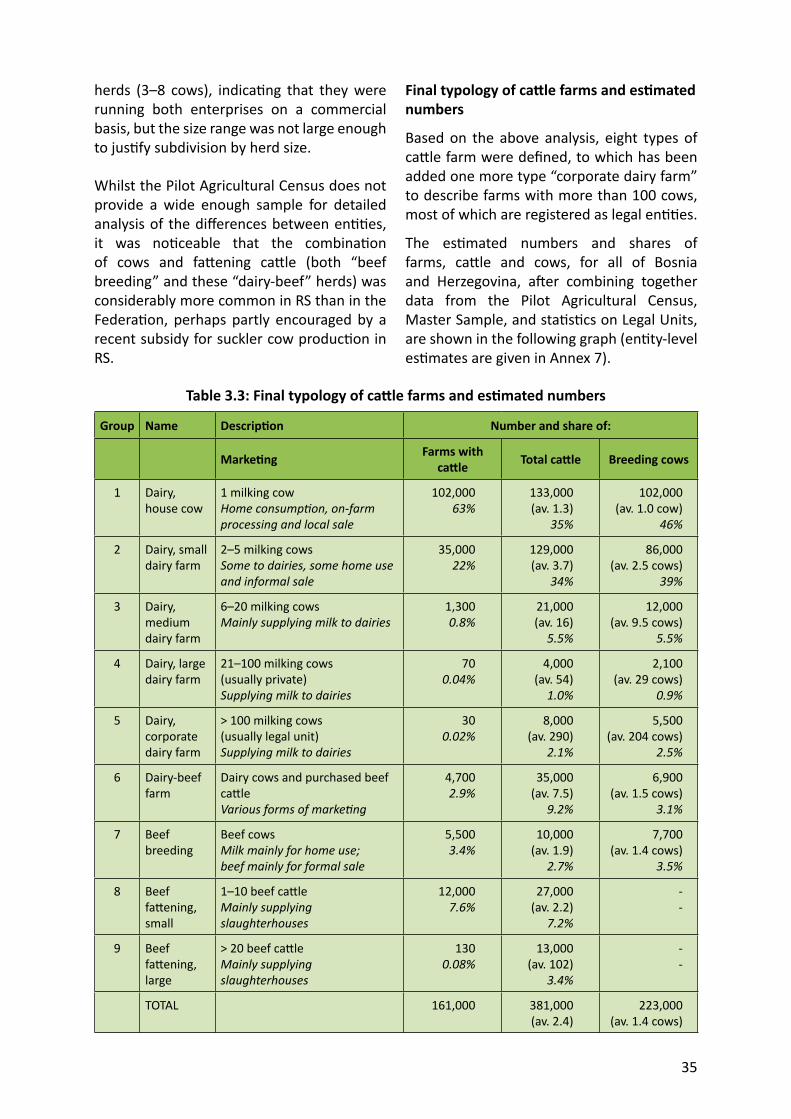
35
herds (3–8 cows), indica ng that they were running both enterprises on a commercial basis, but the size range was not large enough to jus fy subdivision by herd size.
Whilst the Pilot Agricultural Census does not provide a wide enough sample for detailed analysis of the diff erences between en es, it was no ceable that the combina on of cows and fa ening ca le (both “beef breeding” and these “dairy-beef” herds) was considerably more common in RS than in the Federa on, perhaps partly encouraged by a recent subsidy for suckler cow produc on in RS.
Final typology of ca le farms and es mated numbers
Based on the above analysis, eight types of ca le farm were defi ned, to which has been added one more type “corporate dairy farm” to describe farms with more than 100 cows, most of which are registered as legal en es.
The es mated numbers and shares of farms, ca le and cows, for all of Bosnia and Herzegovina, a er combining together data from the Pilot Agricultural Census, Master Sample, and sta s cs on Legal Units, are shown in the following graph (en ty-level es mates are given in Annex 7).
Table 3.3: Final typology of ca le farms and es mated numbers
Group Name Descrip on Number and share of:
Marke ng Farms with ca le Total ca le Breeding cows
1 Dairy, house cow
1 milking cowHome consump on, on-farm processing and local sale
102,00063%
133,000 (av. 1.3)
35%
102,000 (av. 1.0 cow)
46%
2 Dairy, small dairy farm
2–5 milking cowsSome to dairies, some home use and informal sale
35,00022%
129,000 (av. 3.7)
34%
86,000 (av. 2.5 cows)
39%
3 Dairy, medium dairy farm
6–20 milking cowsMainly supplying milk to dairies
1,3000.8%
21,000 (av. 16)
5.5%
12,000 (av. 9.5 cows)
5.5%
4 Dairy, large dairy farm
21–100 milking cows (usually private)Supplying milk to dairies
700.04%
4,000 (av. 54)
1.0%
2,100 (av. 29 cows)
0.9%
5 Dairy, corporate dairy farm
> 100 milking cows (usually legal unit)Supplying milk to dairies
300.02%
8,000 (av. 290)
2.1%
5,500 (av. 204 cows)
2.5%
6 Dairy-beef farm
Dairy cows and purchased beef ca leVarious forms of marke ng
4,7002.9%
35,000 (av. 7.5)
9.2%
6,900 (av. 1.5 cows)
3.1%
7 Beef breeding
Beef cowsMilk mainly for home use; beef mainly for formal sale
5,5003.4%
10,000 (av. 1.9)
2.7%
7,700 (av. 1.4 cows)
3.5%
8 Beef fa ening, small
1–10 beef ca leMainly supplying slaughterhouses
12,0007.6%
27,000 (av. 2.2)
7.2%
--
9 Beef fa ening, large
> 20 beef ca leMainly supplying slaughterhouses
1300.08%
13,000 (av. 102)
3.4%
--
TOTAL 161,000 381,000(av. 2.4)
223,000(av. 1.4 cows)
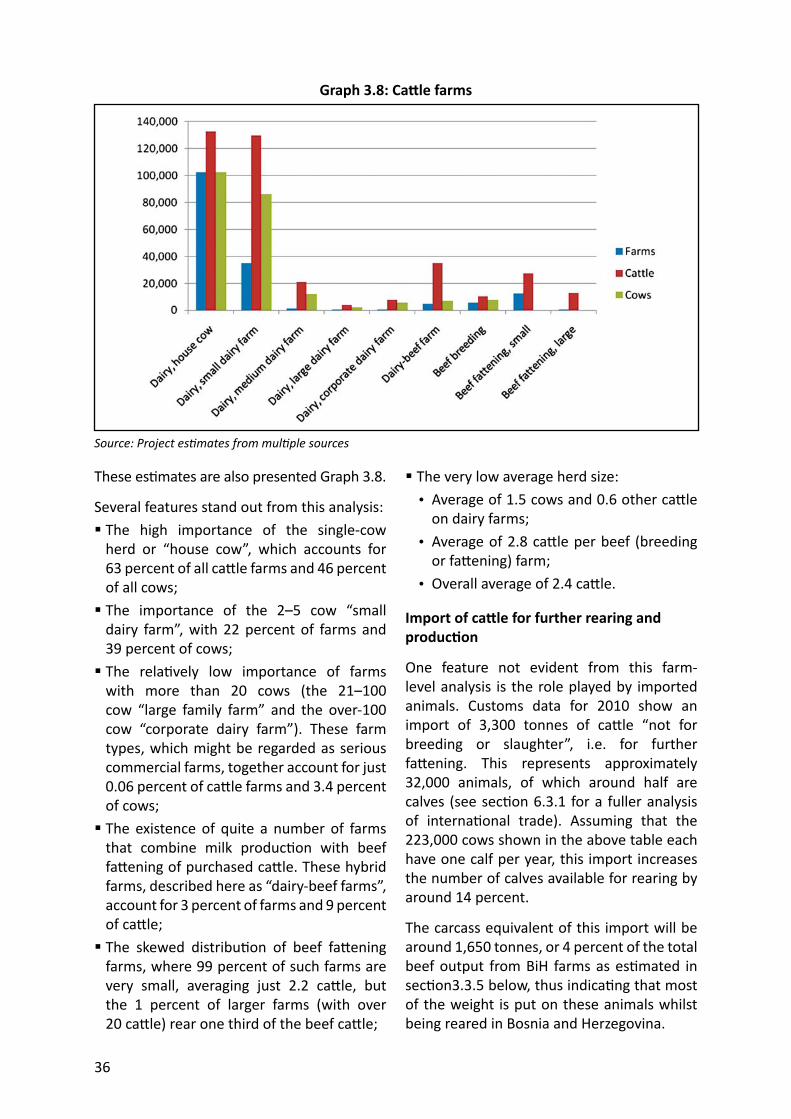
36
These es mates are also presented Graph 3.8.
Several features stand out from this analysis: The high importance of the single-cow herd or “house cow”, which accounts for 63 percent of all ca le farms and 46 percent of all cows; The importance of the 2–5 cow “small dairy farm”, with 22 percent of farms and 39 percent of cows; The rela vely low importance of farms with more than 20 cows (the 21–100 cow “large family farm” and the over-100 cow “corporate dairy farm”). These farm types, which might be regarded as serious commercial farms, together account for just 0.06 percent of ca le farms and 3.4 percent of cows; The existence of quite a number of farms that combine milk produc on with beef fa ening of purchased ca le. These hybrid farms, described here as “dairy-beef farms”, account for 3 percent of farms and 9 percent of ca le; The skewed distribu on of beef fa ening farms, where 99 percent of such farms are very small, averaging just 2.2 ca le, but the 1 percent of larger farms (with over 20 ca le) rear one third of the beef ca le;
Graph 3.8: Ca le farms
Source: Project es mates from mul ple sources
The very low average herd size:• Average of 1.5 cows and 0.6 other ca le
on dairy farms;• Average of 2.8 ca le per beef (breeding
or fa ening) farm;• Overall average of 2.4 ca le.
Import of ca le for further rearing and produc on
One feature not evident from this farm-level analysis is the role played by imported animals. Customs data for 2010 show an import of 3,300 tonnes of ca le “not for breeding or slaughter”, i.e. for further fa ening. This represents approximately 32,000 animals, of which around half are calves (see sec on 6.3.1 for a fuller analysis of interna onal trade). Assuming that the 223,000 cows shown in the above table each have one calf per year, this import increases the number of calves available for rearing by around 14 percent.
The carcass equivalent of this import will be around 1,650 tonnes, or 4 percent of the total beef output from BiH farms as es mated in sec on3.3.5 below, thus indica ng that most of the weight is put on these animals whilst being reared in Bosnia and Herzegovina.
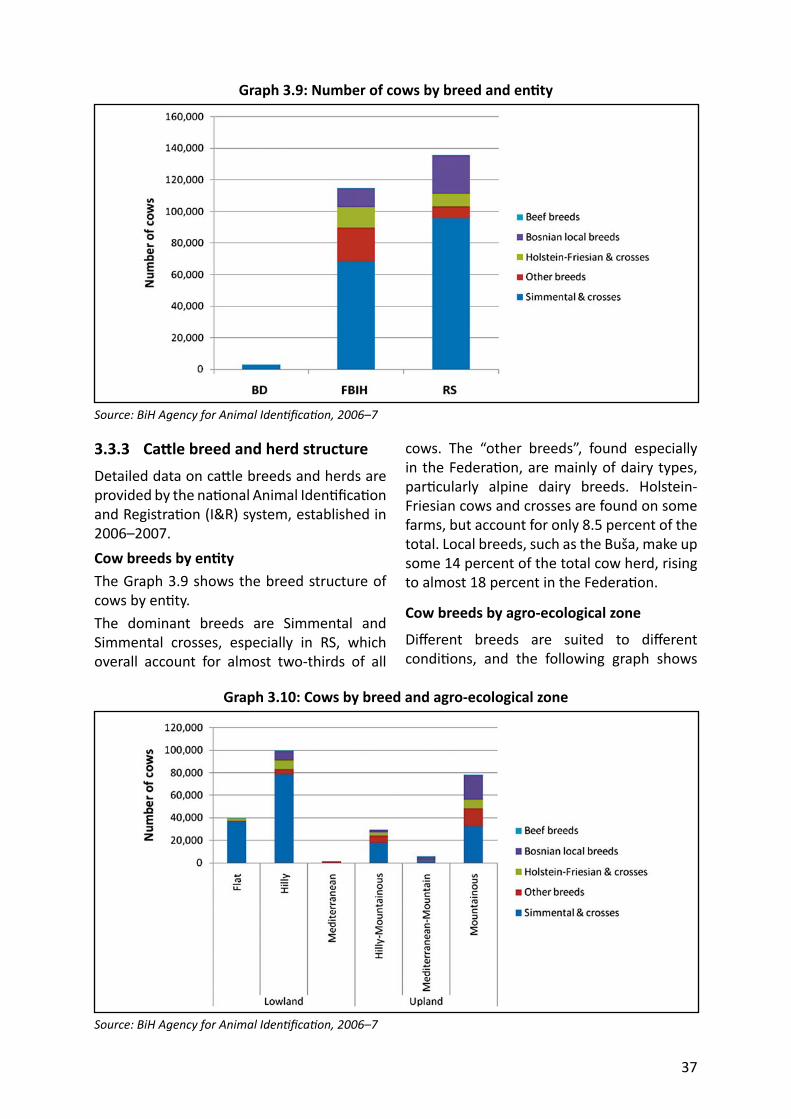
37
3.3.3 C a le breed and herd structureDetailed data on ca le breeds and herds are provided by the na onal Animal Iden fi ca on and Registra on (I&R) system, established in 2006–2007.Cow breeds by en tyThe Graph 3.9 shows the breed structure of cows by en ty.The dominant breeds are Simmental and Simmental crosses, especially in RS, which overall account for almost two-thirds of all
Graph 3.9: Number of cows by breed and en ty
Source: BiH Agency for Animal Iden fi ca on, 2006–7
cows. The “other breeds”, found especially in the Federa on, are mainly of dairy types, par cularly alpine dairy breeds. Holstein-Friesian cows and crosses are found on some farms, but account for only 8.5 percent of the total. Local breeds, such as the Buša, make up some 14 percent of the total cow herd, rising to almost 18 percent in the Federa on.
Cow breeds by agro-ecological zone
Diff erent breeds are suited to diff erent condi ons, and the following graph shows
Graph 3.10: Cows by breed and agro-ecological zone
Source: BiH Agency for Animal Iden fi ca on, 2006–7
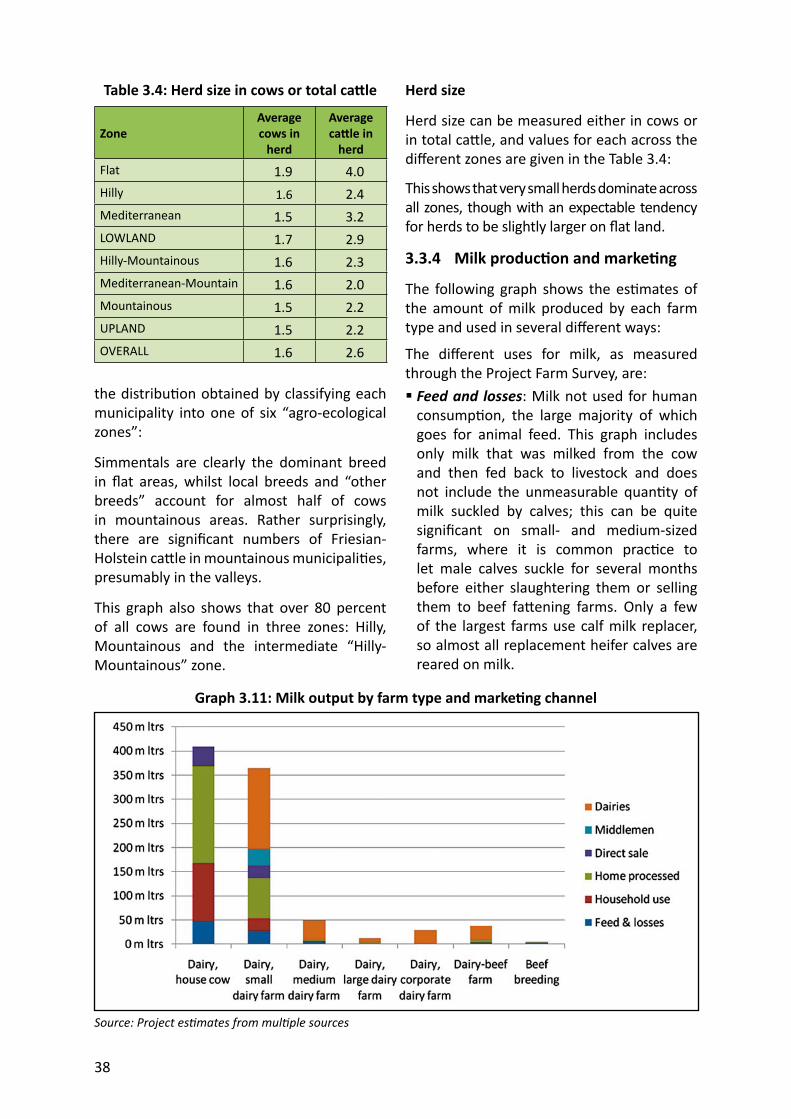
38
the distribu on obtained by classifying each municipality into one of six “agro-ecological zones”:
Simmentals are clearly the dominant breed in fl at areas, whilst local breeds and “other breeds” account for almost half of cows in mountainous areas. Rather surprisingly, there are signifi cant numbers of Friesian-Holstein ca le in mountainous municipali es, presumably in the valleys.
This graph also shows that over 80 percent of all cows are found in three zones: Hilly, Mountainous and the intermediate “Hilly-Mountainous” zone.
Herd size
Herd size can be measured either in cows or in total ca le, and values for each across the diff erent zones are given in the Table 3.4:
This shows that very small herds dominate across all zones, though with an expectable tendency for herds to be slightly larger on fl at land.
3.3.4 Milk produc on and marke ng
The following graph shows the es mates of the amount of milk produced by each farm type and used in several diff erent ways:
The diff erent uses for milk, as measured through the Project Farm Survey, are: Feed and losses: Milk not used for human consump on, the large majority of which goes for animal feed. This graph includes only milk that was milked from the cow and then fed back to livestock and does not include the unmeasurable quan ty of milk suckled by calves; this can be quite signifi cant on small- and medium-sized farms, where it is common prac ce to let male calves suckle for several months before either slaughtering them or selling them to beef fa ening farms. Only a few of the largest farms use calf milk replacer, so almost all replacement heifer calves are reared on milk.
Graph 3.11: Milk output by farm type and marke ng channel
Source: Project es mates from mul ple sources
Table 3.4: Herd size in cows or total ca le
ZoneAverage cows in
herd
Average ca le in
herdFlat 1.9 4.0Hilly 1.6 2.4Mediterranean 1.5 3.2LOWLAND 1.7 2.9Hilly-Mountainous 1.6 2.3Mediterranean-Mountain 1.6 2.0Mountainous 1.5 2.2UPLAND 1.5 2.2OVERALL 1.6 2.6
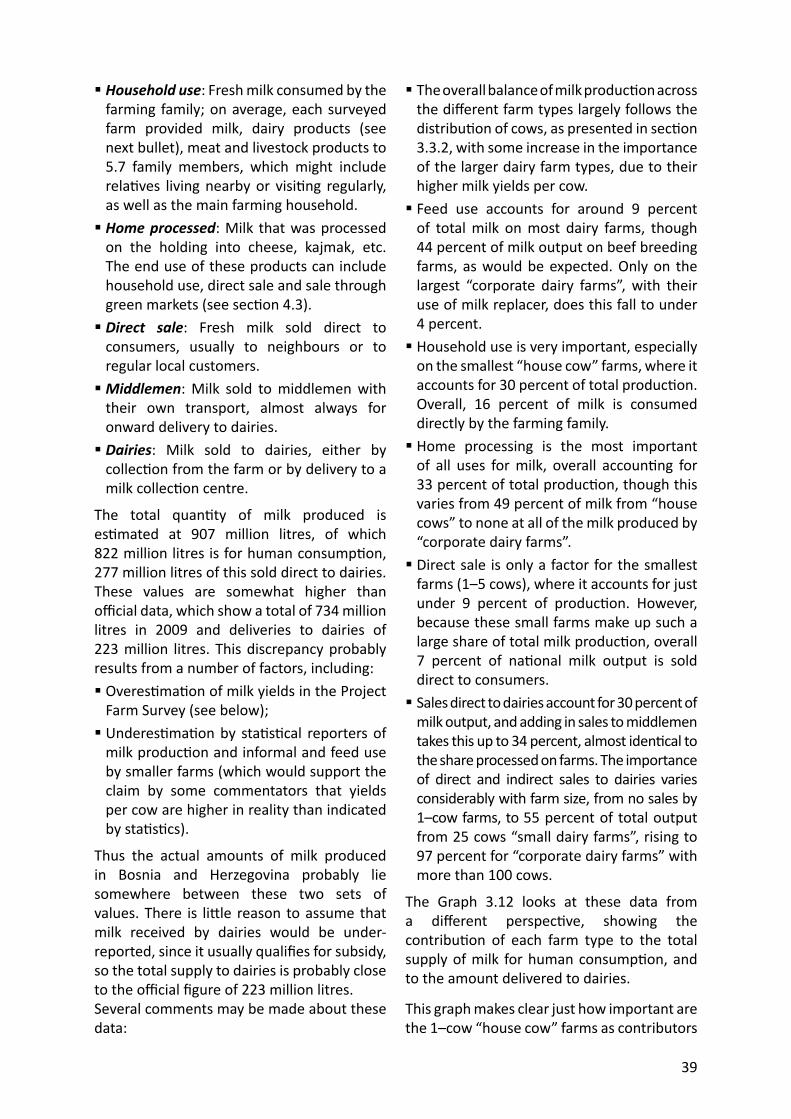
39
Household use: Fresh milk consumed by the farming family; on average, each surveyed farm provided milk, dairy products (see next bullet), meat and livestock products to 5.7 family members, which might include rela ves living nearby or visi ng regularly, as well as the main farming household. Home processed: Milk that was processed on the holding into cheese, kajmak, etc. The end use of these products can include household use, direct sale and sale through green markets (see sec on 4.3). Direct sale: Fresh milk sold direct to consumers, usually to neighbours or to regular local customers. Middlemen: Milk sold to middlemen with their own transport, almost always for onward delivery to dairies. Dairies: Milk sold to dairies, either by collec on from the farm or by delivery to a milk collec on centre.
The total quan ty of milk produced is es mated at 907 million litres, of which 822 million litres is for human consump on, 277 million litres of this sold direct to dairies. These values are somewhat higher than offi cial data, which show a total of 734 million litres in 2009 and deliveries to dairies of 223 million litres. This discrepancy probably results from a number of factors, including: Overes ma on of milk yields in the Project Farm Survey (see below); Underes ma on by sta s cal reporters of milk produc on and informal and feed use by smaller farms (which would support the claim by some commentators that yields per cow are higher in reality than indicated by sta s cs).
Thus the actual amounts of milk produced in Bosnia and Herzegovina probably lie somewhere between these two sets of values. There is li le reason to assume that milk received by dairies would be under-reported, since it usually qualifi es for subsidy, so the total supply to dairies is probably close to the offi cial fi gure of 223 million litres.Several comments may be made about these data:
The overall balance of milk produc on across the diff erent farm types largely follows the distribu on of cows, as presented in sec on 3.3.2, with some increase in the importance of the larger dairy farm types, due to their higher milk yields per cow. Feed use accounts for around 9 percent of total milk on most dairy farms, though 44 percent of milk output on beef breeding farms, as would be expected. Only on the largest “corporate dairy farms”, with their use of milk replacer, does this fall to under 4 percent. Household use is very important, especially on the smallest “house cow” farms, where it accounts for 30 percent of total produc on. Overall, 16 percent of milk is consumed directly by the farming family. Home processing is the most important of all uses for milk, overall accoun ng for 33 percent of total produc on, though this varies from 49 percent of milk from “house cows” to none at all of the milk produced by “corporate dairy farms”. Direct sale is only a factor for the smallest farms (1–5 cows), where it accounts for just under 9 percent of produc on. However, because these small farms make up such a large share of total milk produc on, overall 7 percent of na onal milk output is sold direct to consumers. Sales direct to dairies account for 30 percent of milk output, and adding in sales to middlemen takes this up to 34 percent, almost iden cal to the share processed on farms. The importance of direct and indirect sales to dairies varies considerably with farm size, from no sales by 1–cow farms, to 55 percent of total output from 25 cows “small dairy farms”, rising to 97 percent for “corporate dairy farms” with more than 100 cows.
The Graph 3.12 looks at these data from a diff erent perspec ve, showing the contribu on of each farm type to the total supply of milk for human consump on, and to the amount delivered to dairies.
This graph makes clear just how important are the 1–cow “house cow” farms as contributors
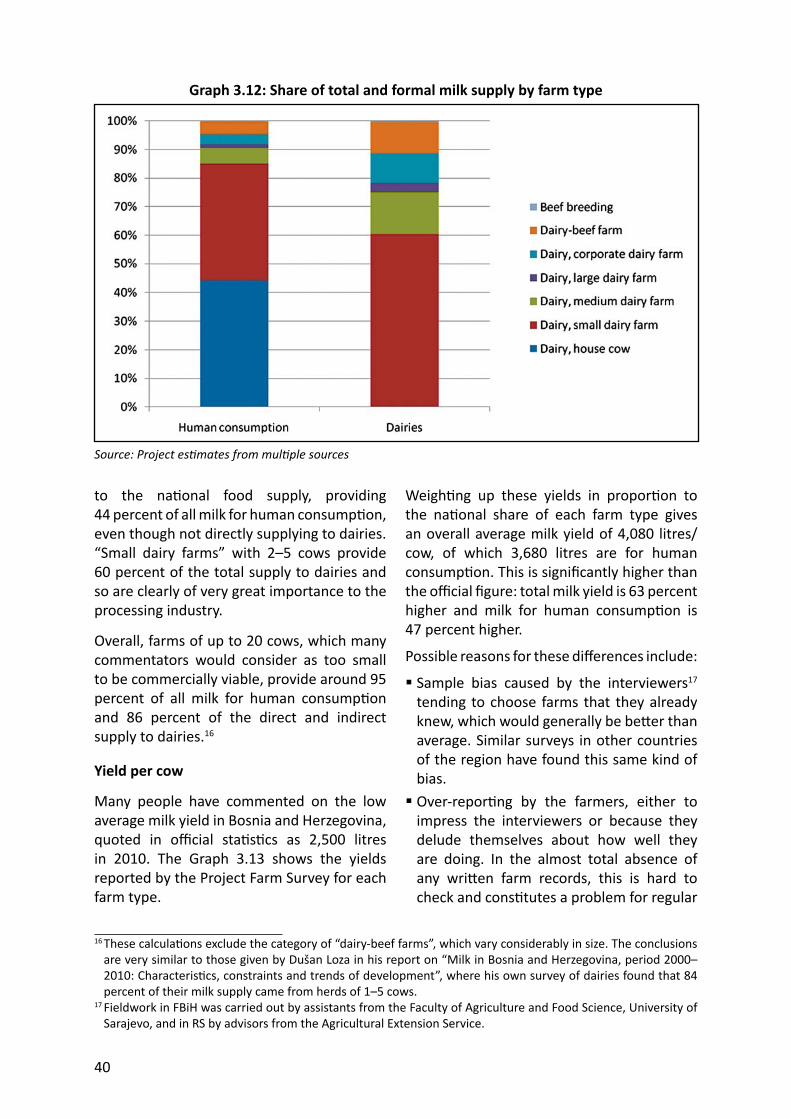
40
to the na onal food supply, providing 44 percent of all milk for human consump on, even though not directly supplying to dairies.“Small dairy farms” with 2–5 cows provide 60 percent of the total supply to dairies and so are clearly of very great importance to the processing industry.
Overall, farms of up to 20 cows, which many commentators would consider as too small to be commercially viable, provide around 95 percent of all milk for human consump on and 86 percent of the direct and indirect supply to dairies.16
Yield per cow
Many people have commented on the low average milk yield in Bosnia and Herzegovina, quoted in offi cial sta s cs as 2,500 litres in 2010. The Graph 3.13 shows the yields reported by the Project Farm Survey for each farm type.
Graph 3.12: Share of total and formal milk supply by farm type
Source: Project es mates from mul ple sources
Weigh ng up these yields in propor on to the na onal share of each farm type gives an overall average milk yield of 4,080 litres/cow, of which 3,680 litres are for human consump on. This is signifi cantly higher than the offi cial fi gure: total milk yield is 63 percent higher and milk for human consump on is 47 percent higher.
Possible reasons for these diff erences include:
Sample bias caused by the interviewers17 tending to choose farms that they already knew, which would generally be be er than average. Similar surveys in other countries of the region have found this same kind of bias. Over-repor ng by the farmers, either to impress the interviewers or because they delude themselves about how well they are doing. In the almost total absence of any wri en farm records, this is hard to check and cons tutes a problem for regular
16 These calcula ons exclude the category of “dairy-beef farms”, which vary considerably in size. The conclusions are very similar to those given by Dušan Loza in his report on “Milk in Bosnia and Herzegovina, period 2000–2010: Characteris cs, constraints and trends of development”, where his own survey of dairies found that 84 percent of their milk supply came from herds of 1–5 cows.
17 Fieldwork in FBiH was carried out by assistants from the Faculty of Agriculture and Food Science, University of Sarajevo, and in RS by advisors from the Agricultural Extension Service.
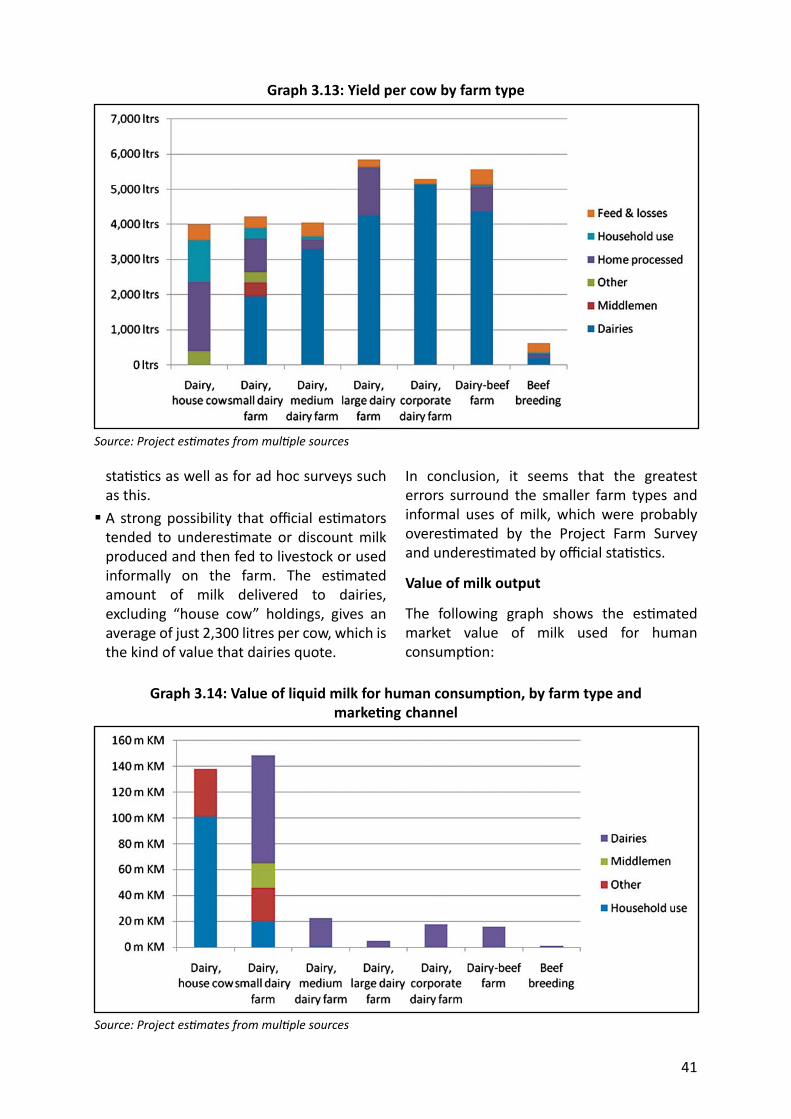
41
sta s cs as well as for ad hoc surveys such as this. A strong possibility that offi cial es mators tended to underes mate or discount milk produced and then fed to livestock or used informally on the farm. The es mated amount of milk delivered to dairies, excluding “house cow” holdings, gives an average of just 2,300 litres per cow, which is the kind of value that dairies quote.
Graph 3.13: Yield per cow by farm type
Source: Project es mates from mul ple sources
In conclusion, it seems that the greatest errors surround the smaller farm types and informal uses of milk, which were probably overes mated by the Project Farm Survey and underes mated by offi cial sta s cs.
Value of milk output
The following graph shows the es mated market value of milk used for human consump on:
Graph 3.14: Value of liquid milk for human consump on, by farm type and marke ng channel
Source: Project es mates from mul ple sources
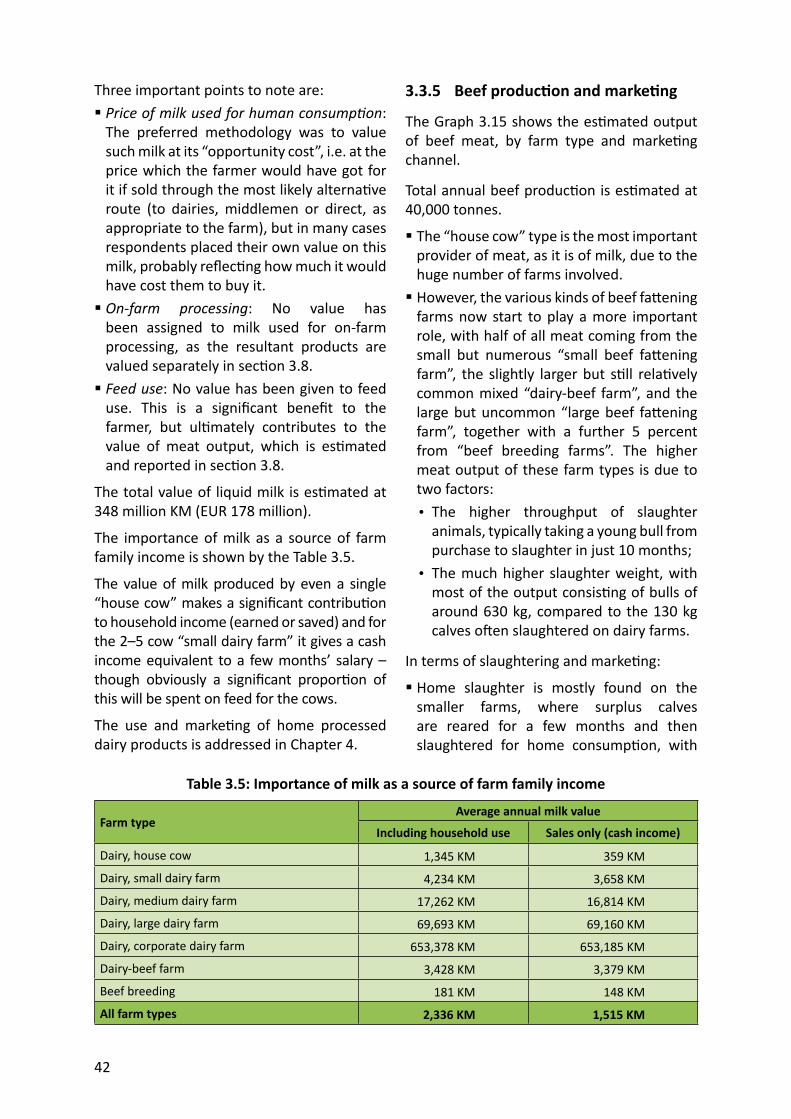
42
Three important points to note are: Price of milk used for human consump on: The preferred methodology was to value such milk at its “opportunity cost”, i.e. at the price which the farmer would have got for it if sold through the most likely alterna ve route (to dairies, middlemen or direct, as appropriate to the farm), but in many cases respondents placed their own value on this milk, probably refl ec ng how much it would have cost them to buy it. On-farm processing: No value has been assigned to milk used for on-farm processing, as the resultant products are valued separately in sec on 3.8. Feed use: No value has been given to feed use. This is a signifi cant benefi t to the farmer, but ul mately contributes to the value of meat output, which is es mated and reported in sec on 3.8.
The total value of liquid milk is es mated at 348 million KM (EUR 178 million).
The importance of milk as a source of farm family income is shown by the Table 3.5.
The value of milk produced by even a single “house cow” makes a signifi cant contribu on to household income (earned or saved) and for the 2–5 cow “small dairy farm” it gives a cash income equivalent to a few months’ salary – though obviously a signifi cant propor on of this will be spent on feed for the cows.
The use and marke ng of home processed dairy products is addressed in Chapter 4.
Table 3.5: Importance of milk as a source of farm family income
Farm typeAverage annual milk value
Including household use Sales only (cash income)
Dairy, house cow 1,345 KM 359 KM
Dairy, small dairy farm 4,234 KM 3,658 KM
Dairy, medium dairy farm 17,262 KM 16,814 KM
Dairy, large dairy farm 69,693 KM 69,160 KM
Dairy, corporate dairy farm 653,378 KM 653,185 KM
Dairy-beef farm 3,428 KM 3,379 KM
Beef breeding 181 KM 148 KM
All farm types 2,336 KM 1,515 KM
3.3.5 Beef produc on and marke ng
The Graph 3.15 shows the es mated output of beef meat, by farm type and marke ng channel.
Total annual beef produc on is es mated at 40,000 tonnes.
The “house cow” type is the most important provider of meat, as it is of milk, due to the huge number of farms involved. However, the various kinds of beef fa ening farms now start to play a more important role, with half of all meat coming from the small but numerous “small beef fa ening farm”, the slightly larger but s ll rela vely common mixed “dairy-beef farm”, and the large but uncommon “large beef fa ening farm”, together with a further 5 percent from “beef breeding farms”. The higher meat output of these farm types is due to two factors:• The higher throughput of slaughter
animals, typically taking a young bull from purchase to slaughter in just 10 months;
• The much higher slaughter weight, with most of the output consis ng of bulls of around 630 kg, compared to the 130 kg calves o en slaughtered on dairy farms.
In terms of slaughtering and marke ng:
Home slaughter is mostly found on the smaller farms, where surplus calves are reared for a few months and then slaughtered for home consump on, with
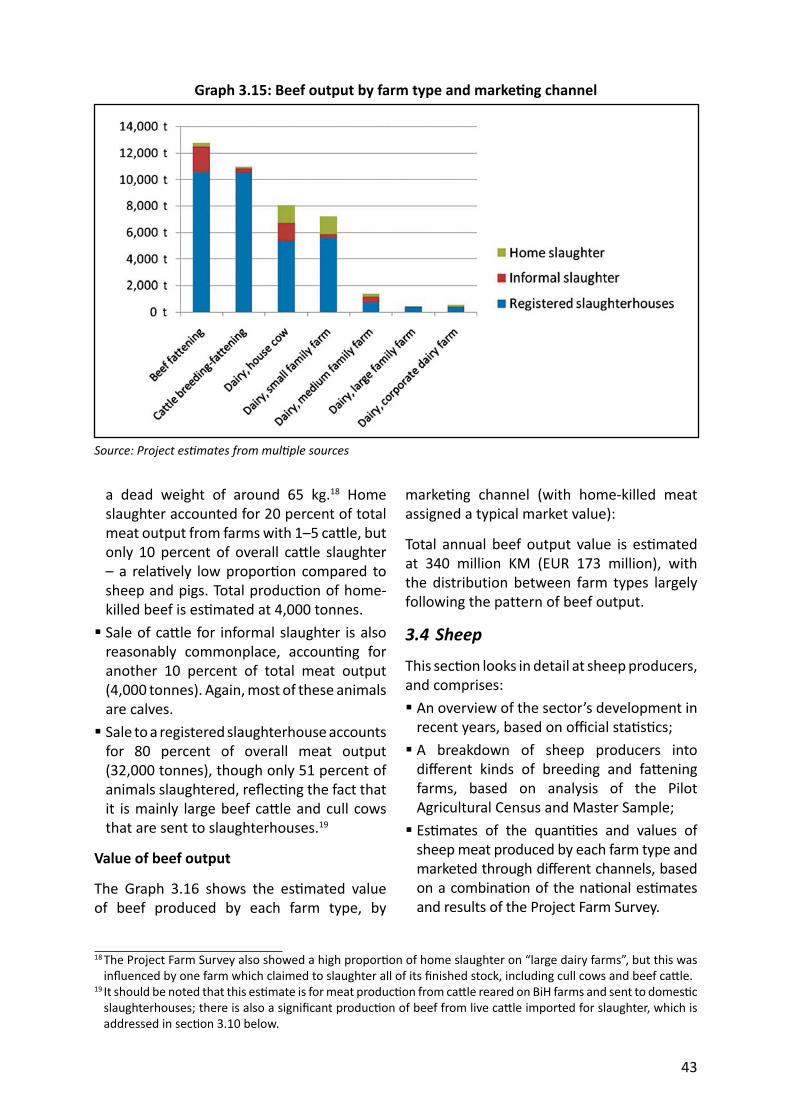
43
a dead weight of around 65 kg.18 Home slaughter accounted for 20 percent of total meat output from farms with 1–5 ca le, but only 10 percent of overall ca le slaughter – a rela vely low propor on compared to sheep and pigs. Total produc on of home-killed beef is es mated at 4,000 tonnes. Sale of ca le for informal slaughter is also reasonably commonplace, accoun ng for another 10 percent of total meat output (4,000 tonnes). Again, most of these animals are calves. Sale to a registered slaughterhouse accounts for 80 percent of overall meat output (32,000 tonnes), though only 51 percent of animals slaughtered, refl ec ng the fact that it is mainly large beef ca le and cull cows that are sent to slaughterhouses.19
Value of beef output
The Graph 3.16 shows the es mated value of beef produced by each farm type, by
Graph 3.15: Beef output by farm type and marke ng channel
Source: Project es mates from mul ple sources
marke ng channel (with home-killed meat assigned a typical market value):
Total annual beef output value is es mated at 340 million KM (EUR 173 million), with the distribution between farm types largely following the pattern of beef output.
3.4 Sh eep
This sec on looks in detail at sheep producers, and comprises: An overview of the sector’s development in recent years, based on offi cial sta s cs; A breakdown of sheep producers into diff erent kinds of breeding and fa ening farms, based on analysis of the Pilot Agricultural Census and Master Sample; Es mates of the quan es and values of sheep meat produced by each farm type and marketed through diff erent channels, based on a combina on of the na onal es mates and results of the Project Farm Survey.
18 The Project Farm Survey also showed a high propor on of home slaughter on “large dairy farms”, but this was infl uenced by one farm which claimed to slaughter all of its fi nished stock, including cull cows and beef ca le.
19 It should be noted that this es mate is for meat produc on from ca le reared on BiH farms and sent to domes c slaughterhouses; there is also a signifi cant produc on of beef from live ca le imported for slaughter, which is addressed in sec on 3.10 below.
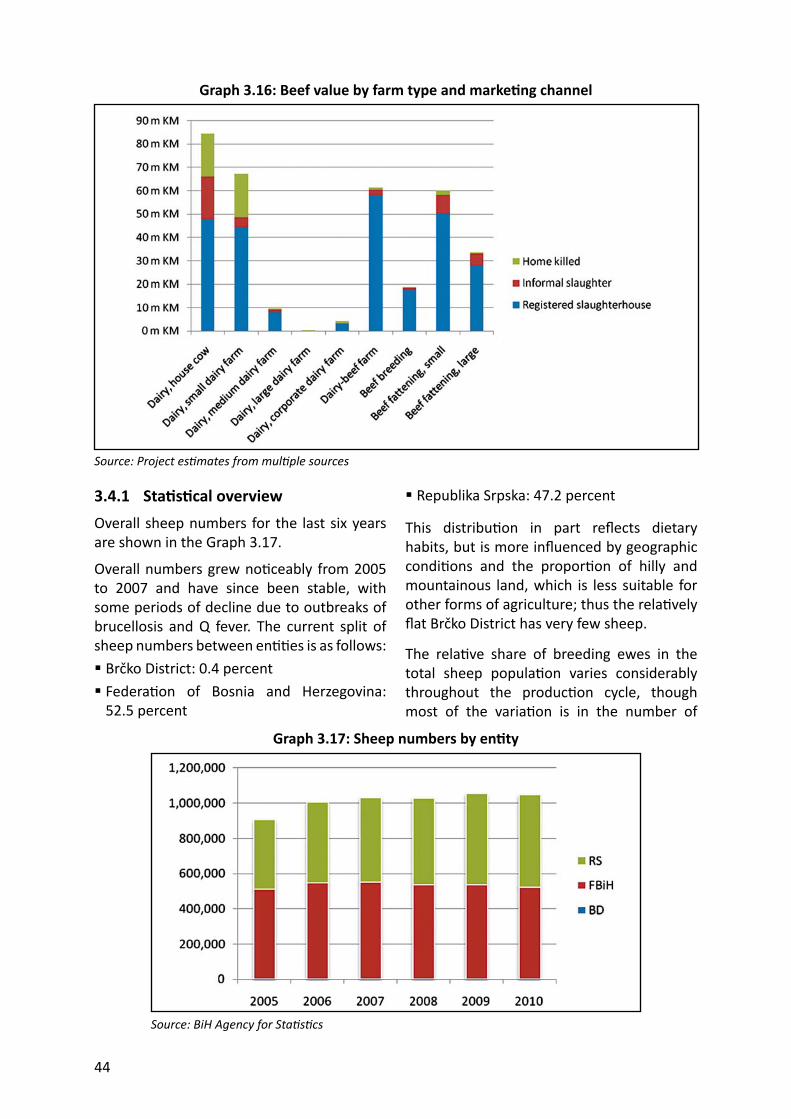
44
3.4.1 Sta s cal overviewOverall sheep numbers for the last six years are shown in the Graph 3.17.
Overall numbers grew no ceably from 2005 to 2007 and have since been stable, with some periods of decline due to outbreaks of brucellosis and Q fever. The current split of sheep numbers between en es is as follows: Brčko District: 0.4 percent Federa on of Bosnia and Herzegovina: 52.5 percent
Graph 3.16: Beef value by farm type and marke ng channel
Source: Project es mates from mul ple sources
Republika Srpska: 47.2 percent
This distribu on in part refl ects dietary habits, but is more infl uenced by geographic condi ons and the propor on of hilly and mountainous land, which is less suitable for other forms of agriculture; thus the rela vely fl at Brčko District has very few sheep.
The rela ve share of breeding ewes in the total sheep popula on varies considerably throughout the produc on cycle, though most of the varia on is in the number of
Graph 3.17: Sheep numbers by en ty
Source: BiH Agency for Sta s cs
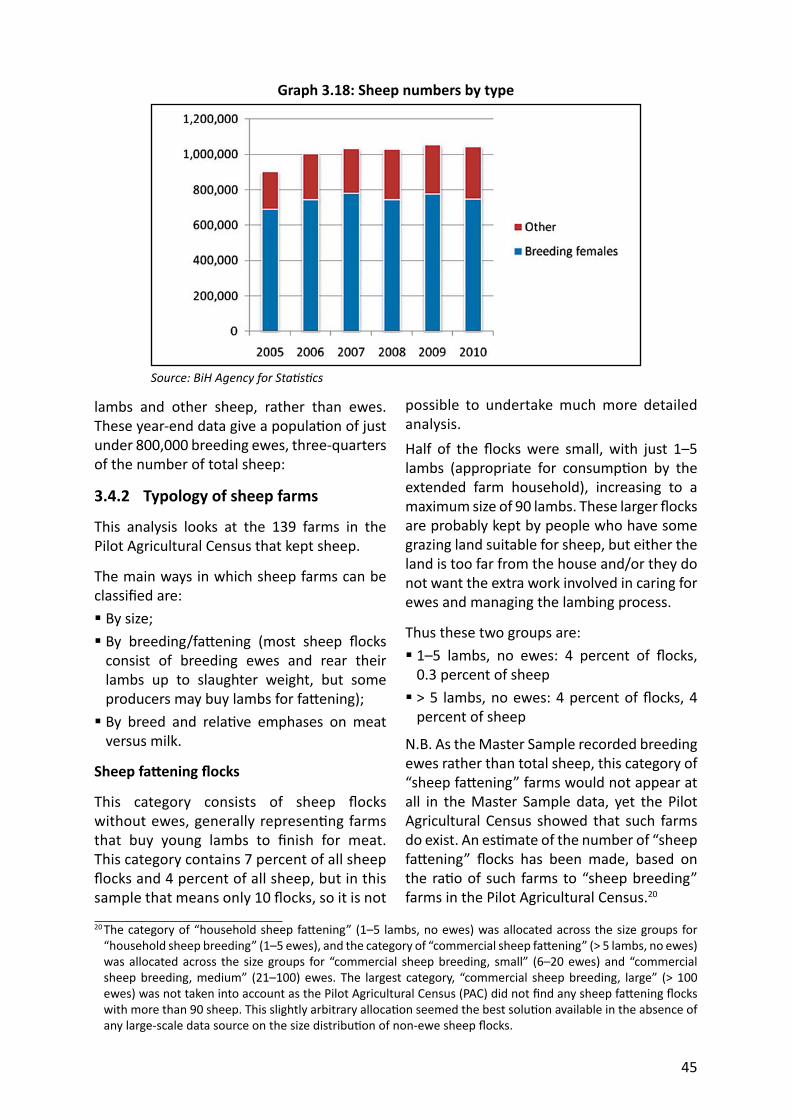
45
lambs and other sheep, rather than ewes. These year-end data give a popula on of just under 800,000 breeding ewes, three-quarters of the number of total sheep:
3.4.2 Typo logy of sheep farms
This analysis looks at the 139 farms in the Pilot Agricultural Census that kept sheep.
The main ways in which sheep farms can be classifi ed are: By size; By breeding/fa ening (most sheep fl ocks consist of breeding ewes and rear their lambs up to slaughter weight, but some producers may buy lambs for fa ening); By breed and rela ve emphases on meat versus milk.
Sheep fa ening fl ocks
This category consists of sheep fl ocks without ewes, generally represen ng farms that buy young lambs to fi nish for meat. This category contains 7 percent of all sheep fl ocks and 4 percent of all sheep, but in this sample that means only 10 fl ocks, so it is not
Graph 3.18: Sheep numbers by type
Source: BiH Agency for Sta s cs
possible to undertake much more detailed analysis.Half of the fl ocks were small, with just 1–5 lambs (appropriate for consump on by the extended farm household), increasing to a maximum size of 90 lambs. These larger fl ocks are probably kept by people who have some grazing land suitable for sheep, but either the land is too far from the house and/or they do not want the extra work involved in caring for ewes and managing the lambing process.
Thus these two groups are: 1–5 lambs, no ewes: 4 percent of fl ocks, 0.3 percent of sheep > 5 lambs, no ewes: 4 percent of fl ocks, 4 percent of sheep
N.B. As the Master Sample recorded breeding ewes rather than total sheep, this category of “sheep fa ening” farms would not appear at all in the Master Sample data, yet the Pilot Agricultural Census showed that such farms do exist. An es mate of the number of “sheep fa ening” fl ocks has been made, based on the ra o of such farms to “sheep breeding” farms in the Pilot Agricultural Census.20
20 The category of “household sheep fa ening” (1–5 lambs, no ewes) was allocated across the size groups for “household sheep breeding” (1–5 ewes), and the category of “commercial sheep fa ening” (> 5 lambs, no ewes) was allocated across the size groups for “commercial sheep breeding, small” (6–20 ewes) and “commercial sheep breeding, medium” (21–100) ewes. The largest category, “commercial sheep breeding, large” (> 100 ewes) was not taken into account as the Pilot Agricultural Census (PAC) did not fi nd any sheep fa ening fl ocks with more than 90 sheep. This slightly arbitrary alloca on seemed the best solu on available in the absence of any large-scale data source on the size distribu on of non-ewe sheep fl ocks.
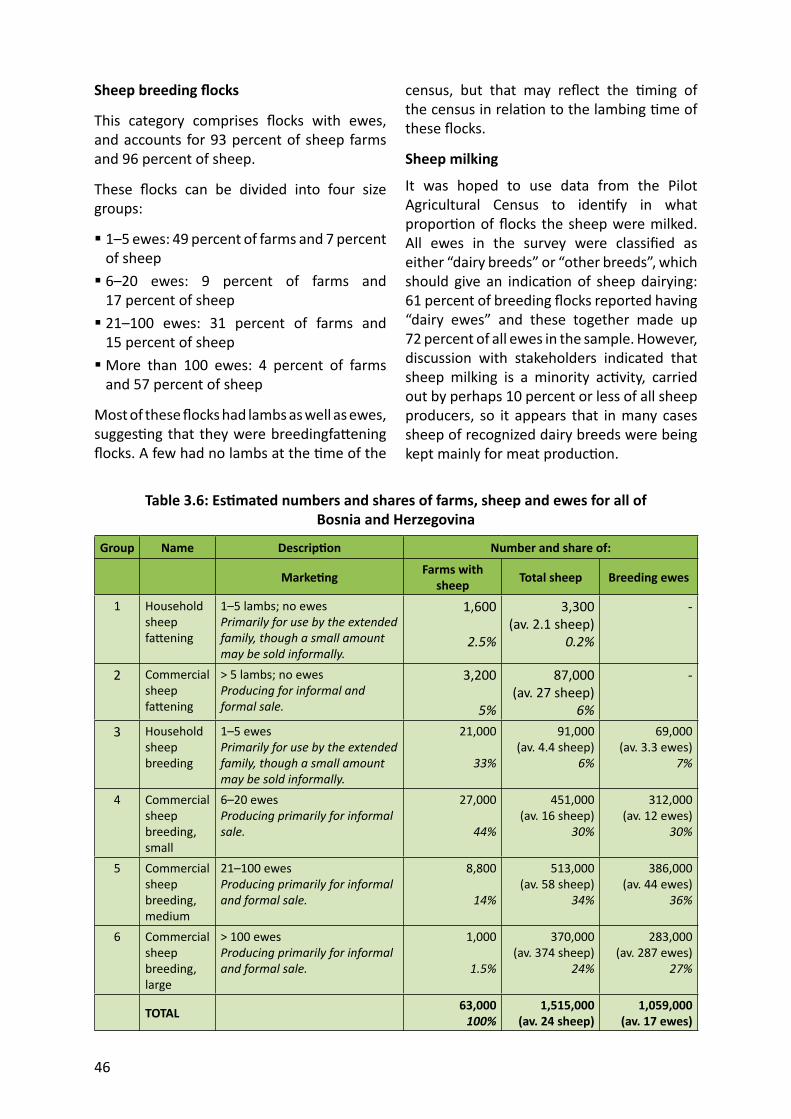
46
Sheep breeding fl ocks
This category comprises fl ocks with ewes, and accounts for 93 percent of sheep farms and 96 percent of sheep.
These fl ocks can be divided into four size groups:
1–5 ewes: 49 percent of farms and 7 percent of sheep 6–20 ewes: 9 percent of farms and 17 percent of sheep 21–100 ewes: 31 percent of farms and 15 percent of sheep More than 100 ewes: 4 percent of farms and 57 percent of sheep
Most of these fl ocks had lambs as well as ewes, sugges ng that they were breedingfa ening fl ocks. A few had no lambs at the me of the
Table 3.6: Es mated numbers and shares of farms, sheep and ewes for all of Bosnia and Herzegovina
Group Name Descrip on Number and share of:
Marke ng Farms with sheep Total sheep Breeding ewes
1 Household sheep fa ening
1–5 lambs; no ewesPrimarily for use by the extended family, though a small amount may be sold informally.
1,600
2.5%
3,300(av. 2.1 sheep)
0.2%
-
2 Commercial sheep fa ening
> 5 lambs; no ewesProducing for informal and formal sale.
3,200
5%
87,000(av. 27 sheep)
6%
-
3 Household sheep breeding
1–5 ewesPrimarily for use by the extended family, though a small amount may be sold informally.
21,000
33%
91,000(av. 4.4 sheep)
6%
69,000(av. 3.3 ewes)
7%
4 Commercial sheep breeding, small
6–20 ewesProducing primarily for informal sale.
27,000
44%
451,000(av. 16 sheep)
30%
312,000(av. 12 ewes)
30%
5 Commercial sheep breeding, medium
21–100 ewesProducing primarily for informal and formal sale.
8,800
14%
513,000(av. 58 sheep)
34%
386,000(av. 44 ewes)
36%
6 Commercial sheep breeding, large
> 100 ewesProducing primarily for informal and formal sale.
1,000
1.5%
370,000(av. 374 sheep)
24%
283,000(av. 287 ewes)
27%
TOTAL 63,000100%
1,515,000(av. 24 sheep)
1,059,000(av. 17 ewes)
census, but that may refl ect the ming of the census in rela on to the lambing me of these fl ocks.
Shee p milking
It was hoped to use data from the Pilot Agricultural Census to iden fy in what propor on of fl ocks the sheep were milked. All ewes in the survey were classifi ed as either “dairy breeds” or “other breeds”, which should give an indica on of sheep dairying: 61 percent of breeding fl ocks reported having “dairy ewes” and these together made up 72 percent of all ewes in the sample. However, discussion with stakeholders indicated that sheep milking is a minority ac vity, carried out by perhaps 10 percent or less of all sheep producers, so it appears that in many cases sheep of recognized dairy breeds were being kept mainly for meat produc on.
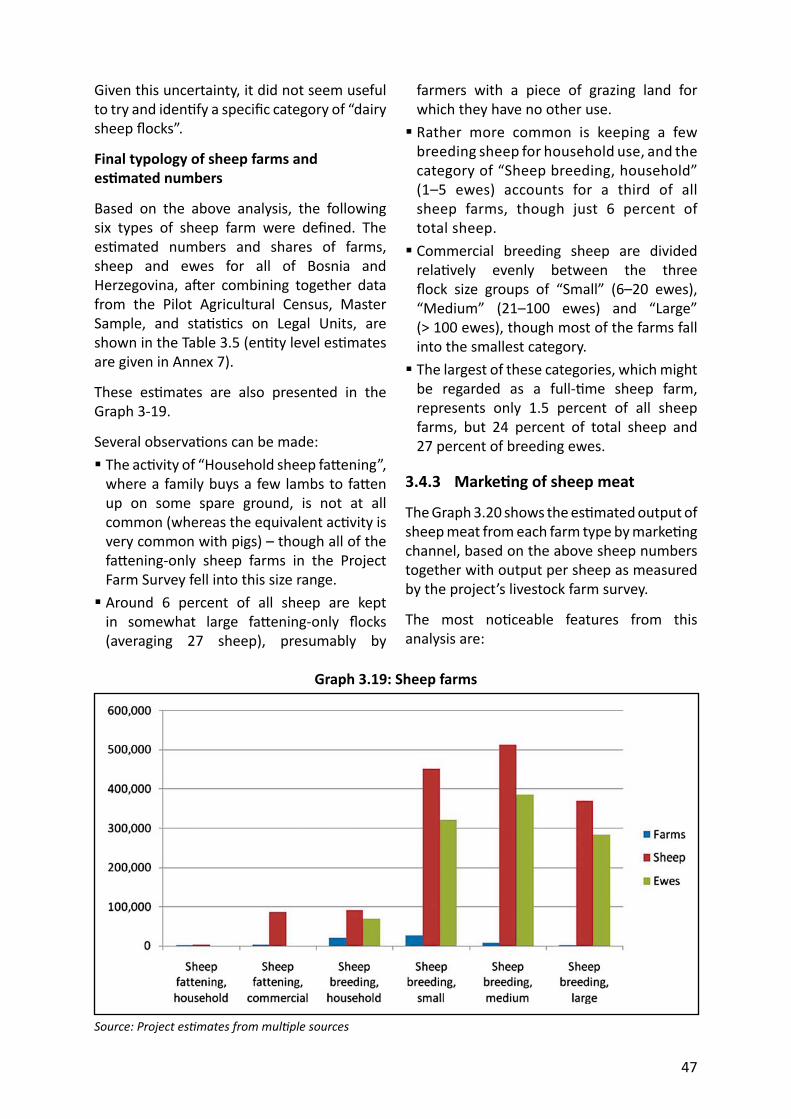
47
Given this uncertainty, it did not seem useful to try and iden fy a specifi c category of “dairy sheep fl ocks”.
Final typology of sheep farms and es mated numbers
Based on the above analysis, the following six types of sheep farm were defi ned. The es mated numbers and shares of farms, sheep and ewes for all of Bosnia and Herzegovina, a er combining together data from the Pilot Agricultural Census, Master Sample, and sta s cs on Legal Units, are shown in the Table 3.5 (en ty level es mates are given in Annex 7).
These es mates are also presented in the Graph 3-19.
Several observa ons can be made: The ac vity of “Household sheep fa ening”, where a family buys a few lambs to fa en up on some spare ground, is not at all common (whereas the equivalent ac vity is very common with pigs) – though all of the fa ening-only sheep farms in the Project Farm Survey fell into this size range. Around 6 percent of all sheep are kept in somewhat large fa ening-only fl ocks (averaging 27 sheep), presumably by
Graph 3.19: Sheep farms
Source: Project es mates from mul ple sources
farmers with a piece of grazing land for which they have no other use. Rather more common is keeping a few breeding sheep for household use, and the category of “Sheep breeding, household” (1–5 ewes) accounts for a third of all sheep farms, though just 6 percent of total sheep. Commercial breeding sheep are divided rela vely evenly between the three fl ock size groups of “Small” (6–20 ewes), “Medium” (21–100 ewes) and “Large” (> 100 ewes), though most of the farms fall into the smallest category. The largest of these categories, which might be regarded as a full- me sheep farm, represents only 1.5 percent of all sheep farms, but 24 percent of total sheep and 27 percent of breeding ewes.
3.4.3 Marke ng of sheep meat
The Graph 3.20 shows the es mated output of sheep meat from each farm type by marke ng channel, based on the above sheep numbers together with output per sheep as measured by the project’s livestock farm survey.
The most no ceable features from this analysis are:
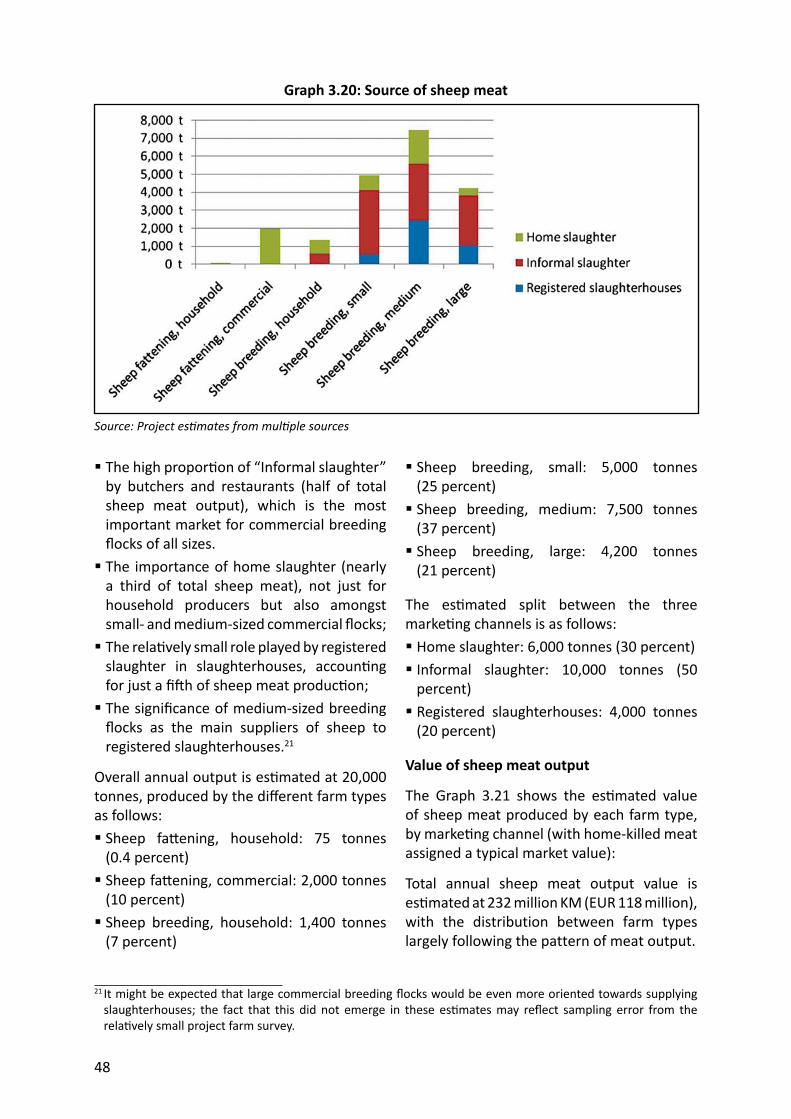
48
The high propor on of “Informal slaughter” by butchers and restaurants (half of total sheep meat output), which is the most important market for commercial breeding fl ocks of all sizes. The importance of home slaughter (nearly a third of total sheep meat), not just for household producers but also amongst small- and medium-sized commercial fl ocks; The rela vely small role played by registered slaughter in slaughterhouses, accoun ng for just a fi h of sheep meat produc on; The signifi cance of medium-sized breeding fl ocks as the main suppliers of sheep to registered slaughterhouses.21
Overall annual output is es mated at 20,000 tonnes, produced by the diff erent farm types as follows: Sheep fa ening, household: 75 tonnes (0.4 percent) Sheep fa ening, commercial: 2,000 tonnes (10 percent) Sheep breeding, household: 1,400 tonnes (7 percent)
Graph 3.20: Source of sheep meat
Source: Project es mates from mul ple sources
Sheep breeding, small: 5,000 tonnes (25 percent) Sheep breeding, medium: 7,500 tonnes (37 percent) Sheep breeding, large: 4,200 tonnes (21 percent)
The es mated split between the three marke ng channels is as follows: Home slaughter: 6,000 tonnes (30 percent) Informal slaughter: 10,000 tonnes (50 percent) Registered slaughterhouses: 4,000 tonnes (20 percent)
Value of sheep meat output
The Graph 3.21 shows the es mated value of sheep meat produced by each farm type, by marke ng channel (with home-killed meat assigned a typical market value):
Total annual sheep meat output value is es mated at 232 million KM (EUR 118 million), with the distribution between farm types largely following the pattern of meat output.
21 It might be expected that large commercial breeding fl ocks would be even more oriented towards supplying slaughterhouses; the fact that this did not emerge in these es mates may refl ect sampling error from the rela vely small project farm survey.
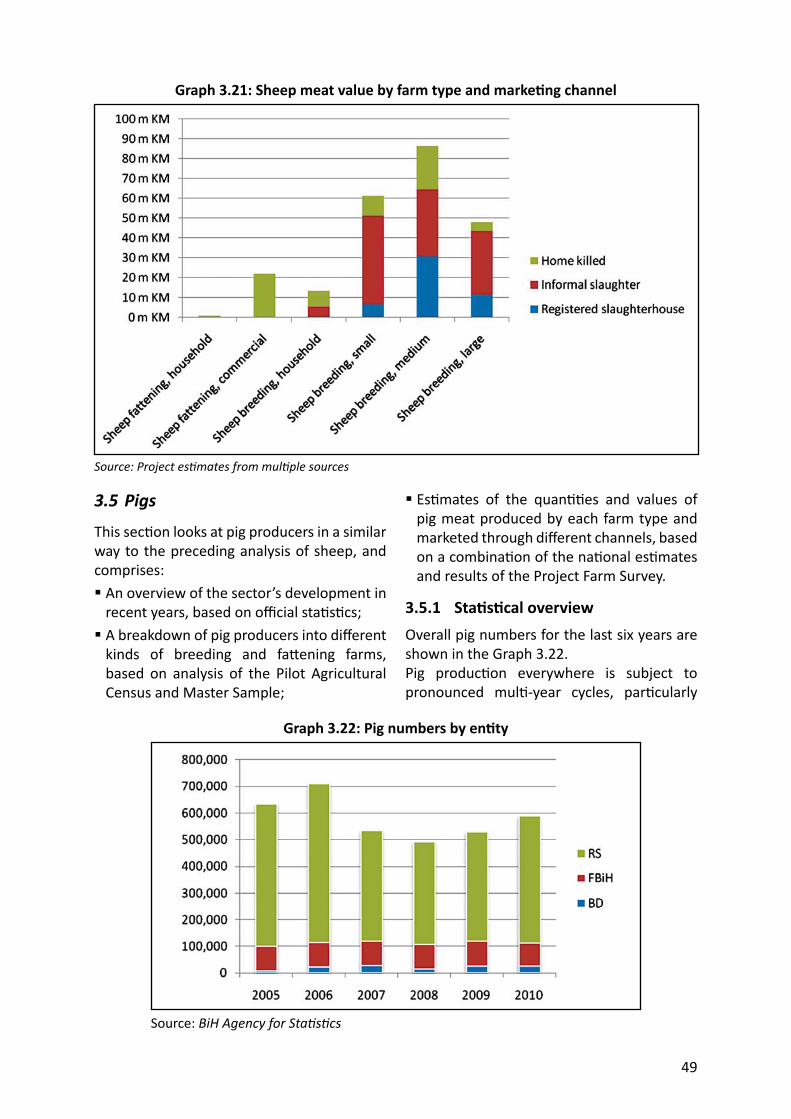
49
3.5 Pig s
This sec on looks at pig producers in a similar way to the preceding analysis of sheep, and comprises: An overview of the sector’s development in recent years, based on offi cial sta s cs; A breakdown of pig producers into diff erent kinds of breeding and fa ening farms, based on analysis of the Pilot Agricultural Census and Master Sample;
Graph 3.21: Sheep meat value by farm type and marke ng channel
Source: Project es mates from mul ple sources
Es mates of the quan es and values of pig meat produced by each farm type and marketed through diff erent channels, based on a combina on of the na onal es mates and results of the Project Farm Survey.
3.5.1 Sta s cal overviewOverall pig numbers for the last six years are shown in the Graph 3.22.Pig produc on everywhere is subject to pronounced mul -year cycles, par cularly
Graph 3.22: Pig numbers by en ty
Source: BiH Agency for Sta s cs
50
in countries such as Bosnia and Herzegovina where produc on is dominated by small-scale producers who can easily switch in or out of pig produc on in response to market condi ons. The last cycle peaked in 2006, fell to its trough in 2008, and is currently rising towards a new peak.
Pig meat is predominantly consumed by the Serbian and Croat popula ons, resul ng in the following split of pig numbers between en es: Brčko District: 4.3 percent Federa on of Bosnia and Herzegovina: 14.9 percent Republika Srpska: 80.8 percent
With one sow normally producing ten or more piglets per li er, the majority of any pig popula on is made up of young and fa ening pigs. The following graph indicates that the popula on of breeding sows fell from a high of almost 200,000 in 2005 to just 97,000 in 2010, making up some 17 percent of the total pig popula on (Graph 3.23).
3.5.2 Typology of pig farms
Pig farms can be classifi ed in several diff erent ways: By size of farm; By type of produc on:• Breeding piglets for slaughter at light
weights for sale to other farmers;
Graph 3.23: Pig number by type
Source: BiH Agency for Sta s cs
• Fa ening piglets bought from breeders;• Combined breeding and fa ening on the
same farm. By weight of pigs produced:• Light slaughter piglets, typically killed
with a live weight of around 30 kg to be roasted for family celebra ons or by restaurants;
• Medium-weight porkers, typically going to slaughter with a live weight of 105–110 kg for consump on as pork or use by the pork meat industry;
• Heavy cu ers, typically slaughtered at a live weight of 150–200 kg and used for processing into ham, bacon and other cuts, or for tradi onal home-made smoked products.
By market orienta on: for home consump on, local sale, or formal markets.
Of the 866 farms with livestock in the Pilot Agricultural Census (PAC), some 412 (48 percent) kept pigs; in Republika Srspka and Brčko District this propor on rose to 74 percent. Analysing these 412 farms showed the following main groupings:
Pig fa ening herds
This category consists of pig herds without sows, i.e. people who buy weaners and rear them up for meat. It contains 42 percent of all pig herds and 12 percent of all pigs in the PAC.
51
Of these fa ening herds, 83 percent were very small, rearing just 1–3 pigs, which suggests that they are producing for their extended family rather than for commercial sale.
Almost all pig fa eners had rather low numbers of pigs, o en equivalent to just one li er, and of the 172 farms in this category, only 2 were fa ening more than 20 pigs. This suggests that the large fa ening herds (which are known to exist) were either too uncommon to have been found by this sample survey and/or are registered as legal units rather than family holdings.
For the purposes of analysis in this study, pig fa ening herds are broken into two types: Household pig fa ening (1–3 pigs; no sows or gilts) Commercial pig fa ening (> 3 pigs; no sows or gilts)
Pig breeding herds
These herds have breeding sows but a rela vely small number of other pigs,22 indica ng that they most probably sell some or all of their piglets to the specialist “pig fa ening herds“ of the fi rst group.
Overall, this category accounts for 38 percent of pig farms and 48 percent of total pigs in the PAC. The average pig numbers on these farms was as follows:
Sows 3.3
Piglets < 20 kg 10.8
Fa ening pigs > 20 kg 2.4
This shows that most of the piglets are sold whilst s ll young, either for further rearing or for slaughter as piglets. In addi on, these farms fa en a few pigs to heavier weights, presumably for home consump on.
These herds can be divided into three main size groups:
1 sow: 25 percent of farms and 8 percent of pigs in this category. 2–5 sows: 60 percent of farms and 56 percent of pigs in this category. 6–20 sows: 15 percent of farms and 36 percent of pigs in this category.
Most commonly, herds of this type have 2–5 sows, with an average of 3 sows and probably selling around 50 piglets per year. The largest breeding herd in the sample had just 15 sows.
Given the rela vely small size range of these farms, for the purposes of analysis pig breeding herds have been broken down into just two types: Commercial pig breeding (≥ 40 percent of pig LSU as sows and gilts; ≥ 2 sows and gilts) Household pig breeding/fa ening (1 sow; with or without rearing pigs) – this “house sow” category spans both “pig breeding herds” and the next category of “pig breeding-fa ening” herds
Pig breeding-fa ening herds
This category comprises self-contained pig herds that keep breeding sows and rear their progeny for meat. It contains 20 percent of all pig herds but 41 percent of all pigs in the PAC. Almost all herds have around 8–9 fa ening pigs per sow, indica ng that they fa en all of the piglets that they produce and neither buy nor sell signifi cant numbers of piglets.
These herds can be divided into three main size groups: 1 sow: 54 percent of farms and 19 percent of pigs in this category. 2–5 sows: 32 percent of farms and 35 percent of pigs in this category. 6–20 sows: 15 percent of farms and 47 percent of pigs in this category.
The sample contained no breeder-fa ener herds with more than 20 sows.
22 The defi ni on used for a “pig breeding herd“ was that at least 40 percent of the total pig livestock units were comprised of sows and gilts. The logic was that a typical breeding unit of one sow and her 11 piglets under 20 kg would have exactly 50 percent of its LSU represented by the sow and 50 percent by the piglets. In a larger breeding herd there would as well be some rearing gilts and at least one boar, but also some of the sows would be dry and without piglets, so the LSU balance would remain about the same. Any farm with less than 40 percent of its pig LSU as sows and gilts is assumed to be rearing as well as fa ening.
52
Again, the rela vely narrow size range of these herds suggested that analysis should cover just two groups: Commercial pig breeding-fa ening (<40 percent of pig LSU as sows and gilts; ≥ 2 sows and gilts) Household pig breeding/fa ening (1 sow; with or without rearing pigs) – this “house sow” category spans both “pig breeding-fa ening herds” and the previous category of “pig breeding” herds
Note on Legal Units
The sta s cs on Legal Units, together with the es mate made for Brčko District, show a total of just 24 Legal Units with pigs in Bosnia and Herzegovina, each with an average of 127 sows and 803 total pigs, or around 3.5 percent of the total pig popula on. These 24 farms may well include some specialized
Table 3.7: Final typology of pig farms and es mated numbers
Group Name Descrip on Number and share of:
Marke ng Farms with pigs Total pigs Breeding
sows1 Household
pig fa ening1–3 pigs; no sows or giltsPrimarily for use by the extended family, though a small amount may be sold informally.
78,000
61%
154,000(av. 1.9 pigs)
26%
0(no sows)
0%
2 Household pig breeding/fa ening, “House sow”
1 sow; piglets may be sold for further rearing by others (“Breeding herd”) or fa ened on the holding (“Breeding-fa ening herd”),In prac ce almost all farms in this group will market some pigs, as even a large extended family is unlikely to eat 1525 pigs per year.
23,000
18%
118,000(av. 4.9 pigs)
20%
24,000(av. 1.0 sow)
29%
3 Commercial pig fa ening
> 3 pigs; no sows or giltsBuying weaners and fa ening them for sale on formal or informal markets.
8,000
6%
50,000(av. 6.6 pigs)
8%
0(no sows)
0%4 Commercial
pig breeding-fa ening
< 40 % of pig LSU as sows and gilts; ≥ 2 sows and giltsRearing and fa ening pigs for sale on formal or informal markets.
2,000
2%
85,000(av. 44 pigs)
15%
10,000(av. 5.5 sows)
13%
5 Commercial pig breeding
≥ 40 % of pig LSU as sows and gilts; ≥ 2 sows and giltsRearing pigs, mainly for informal sale to others in groups 1 and 3 for fa ening.
16,000
13%
178,000(av. 11.4 pigs)
31%
48,000(av. 3.1 sows)
58%
TOTAL 127,000 585,000(av. 4.6 pigs)
82,000(av. 0.7 sows)
pig farms with large numbers of animals, and some that have a diff erent main enterprise and just keep a few pigs as a sideline or for home consump on.
No informa on was available on the breeding-fa ening split of these farms, so they have been allocated to pig farm types in propor on to the split amongst the larger pig herds in the Master Sample.
Final typology of pig farms and es mated numbers
Based on the above analysis, the following fi ve types of pig farm were defi ned. The es mated numbers and shares of farms, pigs and sows are for all of Bosnia and Herzegovina, a er combining together data from the Pilot Agricultural Census, Master Sample, and sta s cs on Legal Units, are shown in the Table 3.7 (en ty-level es mates are given in Annex 7).
53
Graph 3.24: Pig farms
Source: Project es mates from mul ple sources
Graph 3.25: Pig meat output by farm type and marke ng channel
Source: Project es mates from mul ple sources
These es mates are also illustrated in the Graph 3.24.
Several features stand out from this analysis: The very high importance of “backyard” pig keeping; almost 80,000 households are es mated to fa en a couple of pigs for their own use, and some 23,000 households keep a breeding sow to generate piglets for sale to their neighbours. Overall almost 80 percent of pig holdings and nearly half (46 percent) of all pigs fall into these categories;
The rela vely small role played by specialist commercial pig fa ening units, with just 6 percent of all pig holdings and 8 percent of all pigs. This suggests that most of the piglets produced by specialist breeding units are slaughtered young, rather than sold for further fa ening.
3.5.3 Marke ng of pig meat
The Graph 3.25 shows the es mated output of pig meat from each farm type by marke ng
54
channel, based on the above pig numbers together with output per pig as measured by the project’s livestock farm survey.
These es mates show the very high importance of home slaughter and informal slaughter (by butchers, restaurants, etc.) for the pig sector, with less than a third of all pig meat origina ng from registered slaughter in slaughterhouses.
Overall annual output is es mated at 88,000 tonnes, of which 34,000 tonnes (39 percent) is generated by backyard producers. The es mated split between the three marke ng channels is as follows:
Home slaughter: 23,000 tonnes (26 percent) Informal slaughter: 37,000 tonnes (37 percent) Registered slaughterhouses: 28,000 tonnes (32 percent)
Value of pig meat output
The following graph shows the es mated value of pig meat produced by each farm type, by marke ng channel (with home-killed meat assigned a typical market value):Total annual pig-meat output value is
Graph 3.26: Pig meat value by farm type and marke ng channel
Source: Project es mates from mul ple sources
es mated at 361 million KM (EUR 184 million), with the distribution between farm types largely following the pattern of meat output.
3.6 Pou ltry
This sec on looks in detail at poultry producers, and comprises: An overview of the sector’s development in recent years, based on offi cial sta s cs; A breakdown of poultry producers into diff erent kinds of layer and broiler farms, based on analysis of the Pilot Agricultural Census and Master Sample; Es mates of the quan es and values of poultry meat and eggs produced by each farm type and marketed through diff erent channels, based on a combina on of the na onal es mates and results of the Project Farm Survey.
3.6.1 Sta s cal overview
Overall poultry numbers for the last six years are shown in the Graph 3.27. For the purposes of comparison, offi cial sta s cs have been used for all six years, but the comments on poultry numbers from sec on 3.1.3 should be borne in mind.
55
These data show that poultry produc on has been the fastest growing of all the livestock sectors in recent years, more than doubling from 10.4 million in 2005 to 21.6 million in 2010. The growth rates have varied somewhat between en es: Republika Srpska has seen growth of 119 percent over this period, and now has 57.0 percent of all poultry in BiH; The Federa on of Bosnia and Herzegovina saw almost as rapid growth, up by 103 percent and now accoun ng for 39.3 percent of total poultry; Brčko District grew less fast but s ll increased by 43 percent, resul ng in 3.7 percent of total poultry numbers.
Graph 3.27: Poultry numbers by en ty
Source: BiH Agency for Sta s cs
Brčko District, with its arable land resources, is well suited to produc on of grain-fed pigs and poultry, and pig meat is consumed by most of its popula on; thus its share in total pig and poultry produc on (4.3 percent and 3.7 percent respec vely) is around twice its share in human popula on (2.0 percent), whilst it has rather fewer ca le and very few sheep in propor on to its size.
The following graph shows that the growth in poultry numbers has been almost en rely in broilers (shown as “Other”) rather than layers (labelled as “breeding females”), so that laying hens now account for just 18 percent of the total poultry popula on:
Graph 3.28: Poultry number by type
Source: BiH Agency for Sta s cs
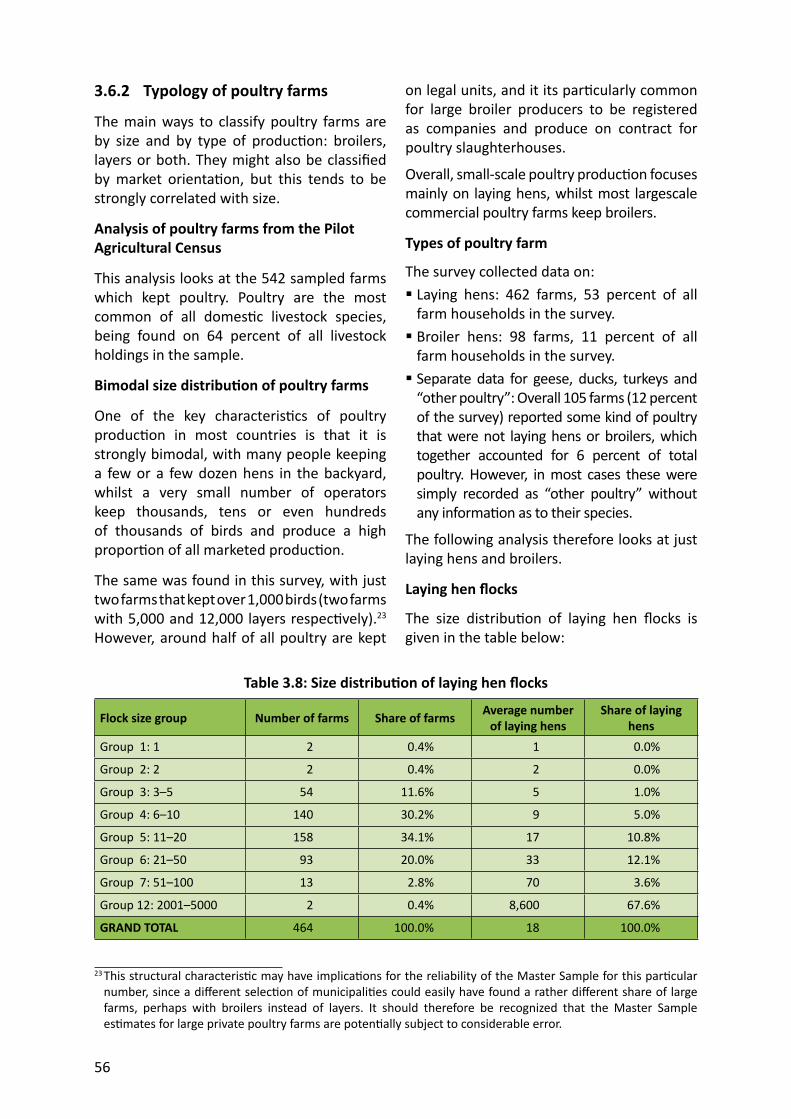
56
3.6.2 Typology of poultry farms
The main ways to classify poultry farms are by size and by type of produc on: broilers, layers or both. They might also be classifi ed by market orienta on, but this tends to be strongly correlated with size.
Analysis of poultry farms from the Pilot Agricultural Census
This analysis looks at the 542 sampled farms which kept poultry. Poultry are the most common of all domes c livestock species, being found on 64 percent of all livestock holdings in the sample.
Bimodal size distribu on of poultry farms
One of the key characteris cs of poultry produc on in most countries is that it is strongly bimodal, with many people keeping a few or a few dozen hens in the backyard, whilst a very small number of operators keep thousands, tens or even hundreds of thousands of birds and produce a high propor on of all marketed produc on.
The same was found in this survey, with just two farms that kept over 1,000 birds (two farms with 5,000 and 12,000 layers respec vely).23 However, around half of all poultry are kept
on legal units, and it its par cularly common for large broiler producers to be registered as companies and produce on contract for poultry slaughterhouses.
Overall, small-scale poultry produc on focuses mainly on laying hens, whilst most largescale commercial poultry farms keep broilers.
Types of poultry farm
The survey collected data on: Laying hens: 462 farms, 53 percent of all farm households in the survey. Broiler hens: 98 farms, 11 percent of all farm households in the survey. Separate data for geese, ducks, turkeys and “other poultry”: Overall 105 farms (12 percent of the survey) reported some kind of poultry that were not laying hens or broilers, which together accounted for 6 percent of total poultry. However, in most cases these were simply recorded as “other poultry” without any informa on as to their species.
The following analysis therefore looks at just laying hens and broilers.
Laying hen fl ocks
The size distribu on of laying hen fl ocks is given in the table below:
Table 3.8: Size distribu on of laying hen fl ocks
Flock size group Number of farms Share of farms Average number of laying hens
Share of laying hens
Group 1: 1 2 0.4% 1 0.0%
Group 2: 2 2 0.4% 2 0.0%
Group 3: 3–5 54 11.6% 5 1.0%
Group 4: 6–10 140 30.2% 9 5.0%
Group 5: 11–20 158 34.1% 17 10.8%
Group 6: 21–50 93 20.0% 33 12.1%
Group 7: 51–100 13 2.8% 70 3.6%
Group 12: 2001–5000 2 0.4% 8,600 67.6%
GRAND TOTAL 464 100.0% 18 100.0%
23 This structural characteris c may have implica ons for the reliability of the Master Sample for this par cular number, since a diff erent selec on of municipali es could easily have found a rather diff erent share of large farms, perhaps with broilers instead of layers. It should therefore be recognized that the Master Sample es mates for large private poultry farms are poten ally subject to considerable error.
57
Most of these farms (65 percent) kept 6–20 laying hens, and the average fl ock size excluding the two large farms was 18 birds. This would produce more eggs than a normal household could consume, but might serve the extended family. Alterna vely, these families might be producing some addi onal eggs for sale to neighbours or to middlemen for sale at the green market.
With 54 percent of all farms in the survey keeping an average of 18 laying hens, there are almost 10 laying hens for every farm in the country, indica ng that small-scale chicken keeping makes a signifi cant contribu on to na onal egg produc on.
Broiler fl ocks
The size distribu on of broiler fl ocks is given in the Table 3.9.
Here the dominant size group is 21–50 broilers, which would typically meet the needs of an extended family, perhaps rearing 50 chickens just once in the year, or around 20 chickens 23 mes per year. It is understood that such produc on takes place mainly in the summer, when hea ng is not needed.
For health reasons, poultry meat is not normally sold at green markets, so the main informal sale channel is direct to friends and neighbours.
Broilers are less common than laying hens, being found on only 12 percent of farms in the sample, giving an overall average of
just 3.5 broilers per farm household in the country. This indicates that the na onal poultry meat supply is more dependent on large commercial producers.
Produc on of layers and broilers on the same farm
Whilst commercial poultry fl ocks tend to focus exclusively on layers or broilers, it is rela vely common to fi nd an agricultural household that keeps both. There were 78 such farms in the Pilot Agricultural Census (14 percent of all farms with poultry), each keeping an average of 20 layers and 32 broilers. As these are eff ec vely separate enterprises, normally using diff erent breeds of poultry, no a empt has been made to iden fy a “layer-broiler” farm type, and so a given farm may appear twice in the analysis, once as a layer farm and again as a broiler farm (in exactly the same way as a farm may contribute to the es mates for both ca le and sheep).
Note on Legal Units
The sta s cs on Legal Units, together with the es mate made for Brčko District, suggest that there are around 42 Legal Units with poultry in Bosnia and Herzegovina, es mated as:
17 layer farms, each with an average of 45,000 laying hens, giving a total of 750,000; 25 broiler farms, each with an average of 210,000 broilers at any given me (and thus an annual throughput of over a million birds each), giving a total of 5.3 million.
Table 3.9: Size distribu on of broiler fl ocks
Flock size group Number of farms Share of farms Average number of broilers Share of broilers
Group 2: 2 1 1.0% 2 0.1%
Group: 3–5 1 1.0% 4 0.1%
Group 4: 6–10 15 15.3% 10 4.8%
Group 5: 11–20 28 28.6% 18 17.2%
Group 6: 21–50 43 43.9% 35 50.6%
Group 7: 51–100 9 9.2% 73 22.2%
Group 8: 101–200 1 1.0% 150 5.1%
GRAND TOTAL 98 100.0% 30 100.0%
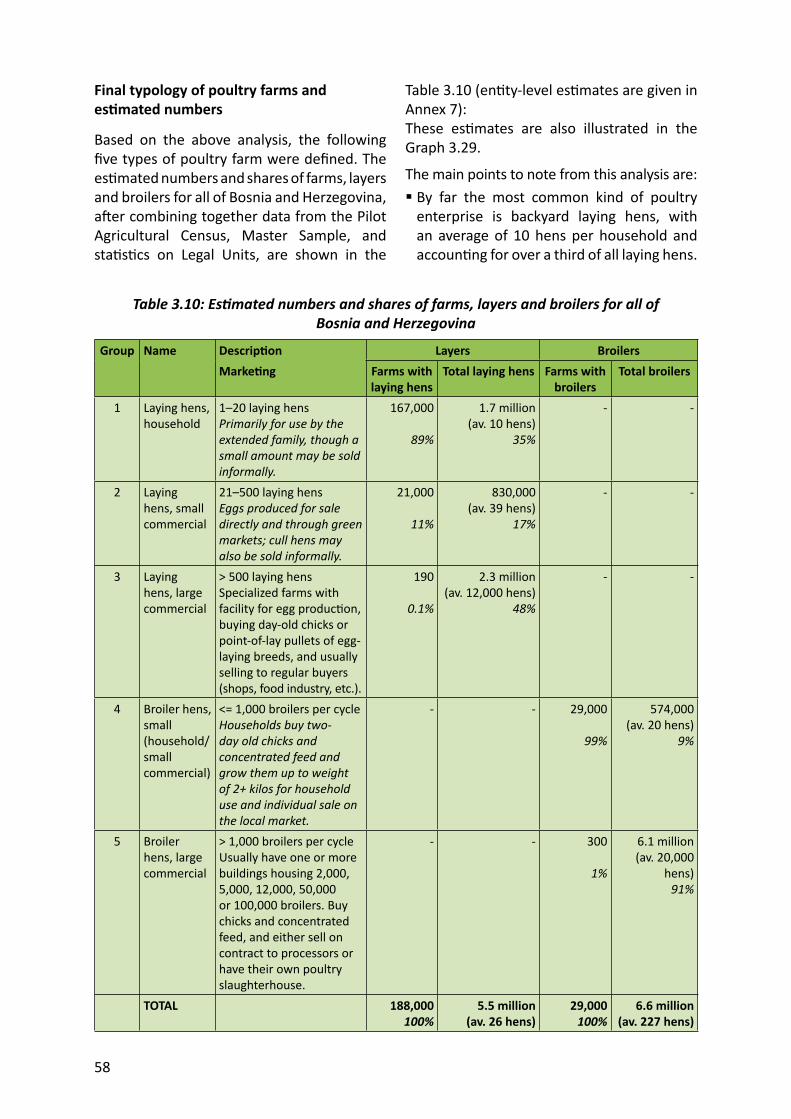
58
Final typology of poultry farms and es mated numbers
Based on the above analysis, the following fi ve types of poultry farm were defi ned. The es mated numbers and shares of farms, layers and broilers for all of Bosnia and Herzegovina, a er combining together data from the Pilot Agricultural Census, Master Sample, and sta s cs on Legal Units, are shown in the
Table 3.10: Es mated numbers and shares of farms, layers and broilers for all of Bosnia and Herzegovina
Group Name Descrip on Layers BroilersMarke ng Farms with
laying hensTotal laying hens Farms with
broilersTotal broilers
1 Laying hens, household
1–20 laying hensPrimarily for use by the extended family, though a small amount may be sold informally.
167,000
89%
1.7 million(av. 10 hens)
35%
- -
2 Laying hens, small commercial
21–500 laying hensEggs produced for sale directly and through green markets; cull hens may also be sold informally.
21,000
11%
830,000(av. 39 hens)
17%
- -
3 Laying hens, large commercial
> 500 laying hensSpecialized farms with facility for egg produc on, buying day-old chicks or point-of-lay pullets of egg-laying breeds, and usually selling to regular buyers (shops, food industry, etc.).
190
0.1%
2.3 million(av. 12,000 hens)
48%
- -
4 Broiler hens, small(household/small commercial)
<= 1,000 broilers per cycleHouseholds buy two-day old chicks and concentrated feed and grow them up to weight of 2+ kilos for household use and individual sale on the local market.
- - 29,000
99%
574,000(av. 20 hens)
9%
5 Broiler hens, large commercial
> 1,000 broilers per cycleUsually have one or more buildings housing 2,000, 5,000, 12,000, 50,000 or 100,000 broilers. Buy chicks and concentrated feed, and either sell on contract to processors or have their own poultry slaughterhouse.
- - 300
1%
6.1 million(av. 20,000
hens)91%
TOTAL 188,000100%
5.5 million(av. 26 hens)
29,000100%
6.6 million(av. 227 hens)
Table 3.10 (en ty-level es mates are given in Annex 7):These es mates are also illustrated in the Graph 3.29.
The main points to note from this analysis are: By far the most common kind of poultry enterprise is backyard laying hens, with an average of 10 hens per household and accoun ng for over a third of all laying hens.
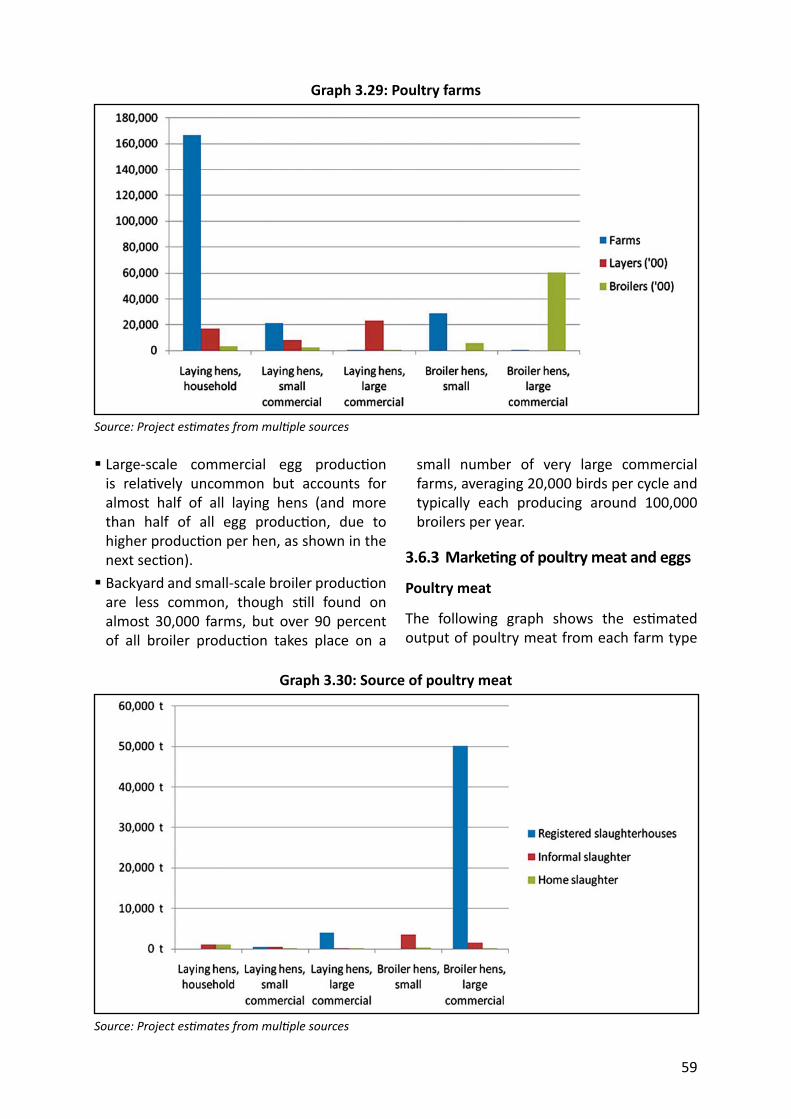
59
Large-scale commercial egg produc on is rela vely uncommon but accounts for almost half of all laying hens (and more than half of all egg produc on, due to higher produc on per hen, as shown in the next sec on). Backyard and small-scale broiler produc on are less common, though s ll found on almost 30,000 farms, but over 90 percent of all broiler produc on takes place on a
Graph 3.29: Poultry farms
Source: Project es mates from mul ple sources
small number of very large commercial farms, averaging 20,000 birds per cycle and typically each producing around 100,000 broilers per year.
3.6.3 Marke ng of poultry meat and eggs
Poultry meat
The following graph shows the es mated output of poultry meat from each farm type
Graph 3.30: Source of poultry meat
Source: Project es mates from mul ple sources
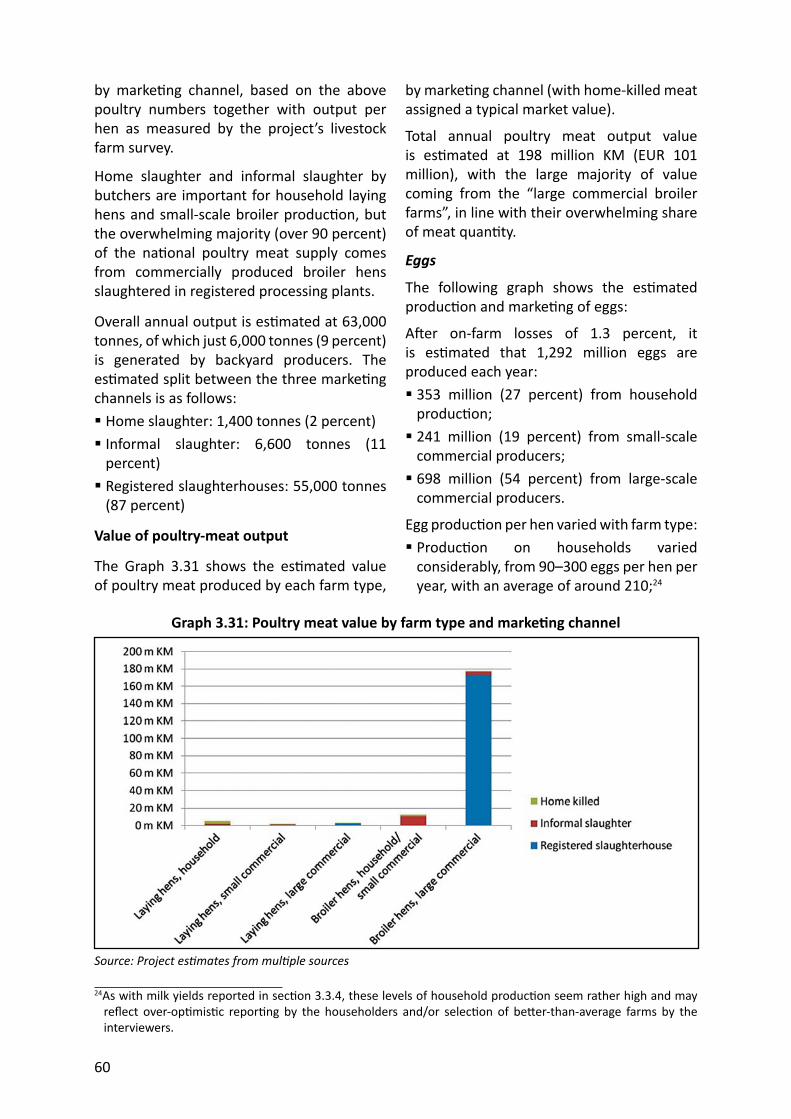
60
by marke ng channel, based on the above poultry numbers together with output per hen as measured by the project’s livestock farm survey.
Home slaughter and informal slaughter by butchers are important for household laying hens and small-scale broiler produc on, but the overwhelming majority (over 90 percent) of the na onal poultry meat supply comes from commercially produced broiler hens slaughtered in registered processing plants.
Overall annual output is es mated at 63,000 tonnes, of which just 6,000 tonnes (9 percent) is generated by backyard producers. The es mated split between the three marke ng channels is as follows: Home slaughter: 1,400 tonnes (2 percent) Informal slaughter: 6,600 tonnes (11 percent) Registered slaughterhouses: 55,000 tonnes (87 percent)
Value of poultry-meat output
The Graph 3.31 shows the es mated value of poultry meat produced by each farm type,
Graph 3.31: Poultry meat value by farm type and marke ng channel
Source: Project es mates from mul ple sources
by marke ng channel (with home-killed meat assigned a typical market value).
Total annual poultry meat output value is es mated at 198 million KM (EUR 101 million), with the large majority of value coming from the “large commercial broiler farms”, in line with their overwhelming share of meat quan ty.
Eggs
The following graph shows the es mated produc on and marke ng of eggs:
A er on-farm losses of 1.3 percent, it is es mated that 1,292 million eggs are produced each year: 353 million (27 percent) from household produc on; 241 million (19 percent) from small-scale commercial producers; 698 million (54 percent) from large-scale commercial producers.
Egg produc on per hen varied with farm type: Produc on on households varied considerably, from 90–300 eggs per hen per year, with an average of around 210;24
24As with milk yields reported in sec on 3.3.4, these levels of household produc on seem rather high and may refl ect over-op mis c repor ng by the householders and/or selec on of be er-than-average farms by the interviewers.
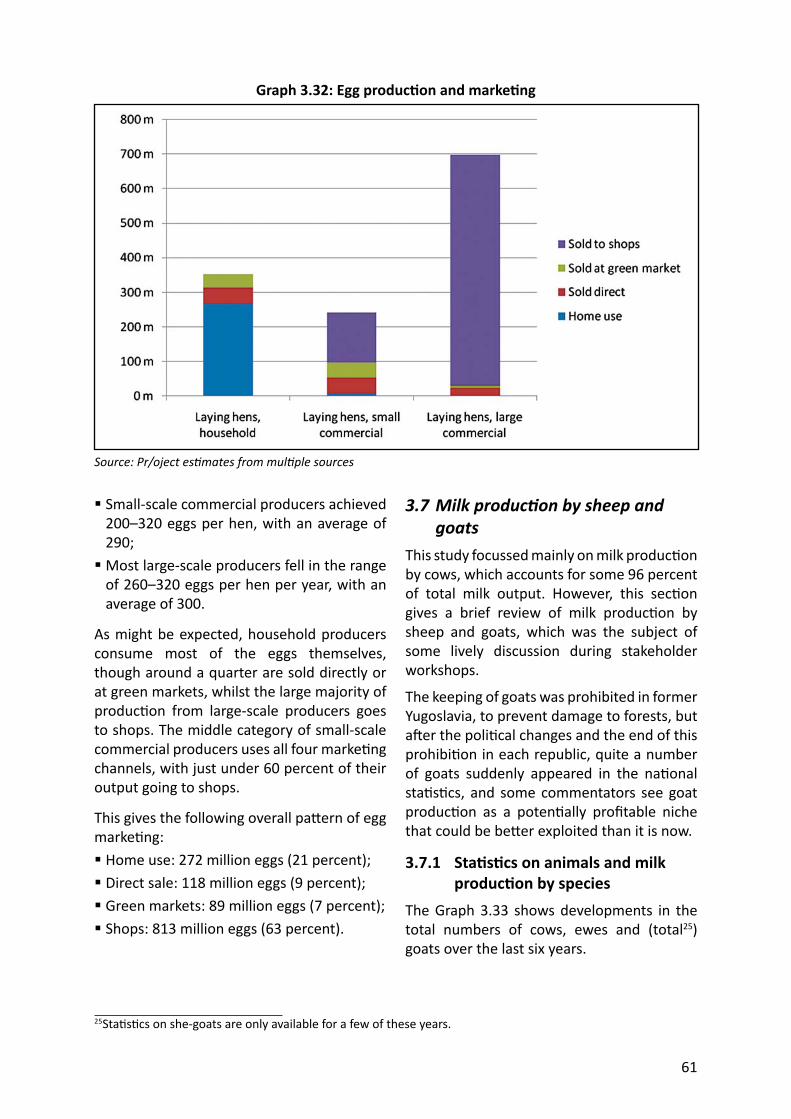
61
Small-scale commercial producers achieved 200–320 eggs per hen, with an average of 290; Most large-scale producers fell in the range of 260–320 eggs per hen per year, with an average of 300.
As might be expected, household producers consume most of the eggs themselves, though around a quarter are sold directly or at green markets, whilst the large majority of produc on from large-scale producers goes to shops. The middle category of small-scale commercial producers uses all four marke ng channels, with just under 60 percent of their output going to shops.
This gives the following overall pa ern of egg marke ng: Home use: 272 million eggs (21 percent); Direct sale: 118 million eggs (9 percent); Green markets: 89 million eggs (7 percent); Shops: 813 million eggs (63 percent).
Graph 3.32: Egg produc on and marke ng
Source: Pr/oject es mates from mul ple sources
3.7 Milk produc on by sheep and goats
This study focussed mainly on milk produc on by cows, which accounts for some 96 percent of total milk output. However, this sec on gives a brief review of milk produc on by sheep and goats, which was the subject of some lively discussion during stakeholder workshops.
The keeping of goats was prohibited in former Yugoslavia, to prevent damage to forests, but a er the poli cal changes and the end of this prohibi on in each republic, quite a number of goats suddenly appeared in the na onal sta s cs, and some commentators see goat produc on as a poten ally profi table niche that could be be er exploited than it is now.
3.7.1 Sta s cs on animals and milk produc on by species
The Graph 3.33 shows developments in the total numbers of cows, ewes and (total25) goats over the last six years.
25Sta s cs on she-goats are only available for a few of these years.
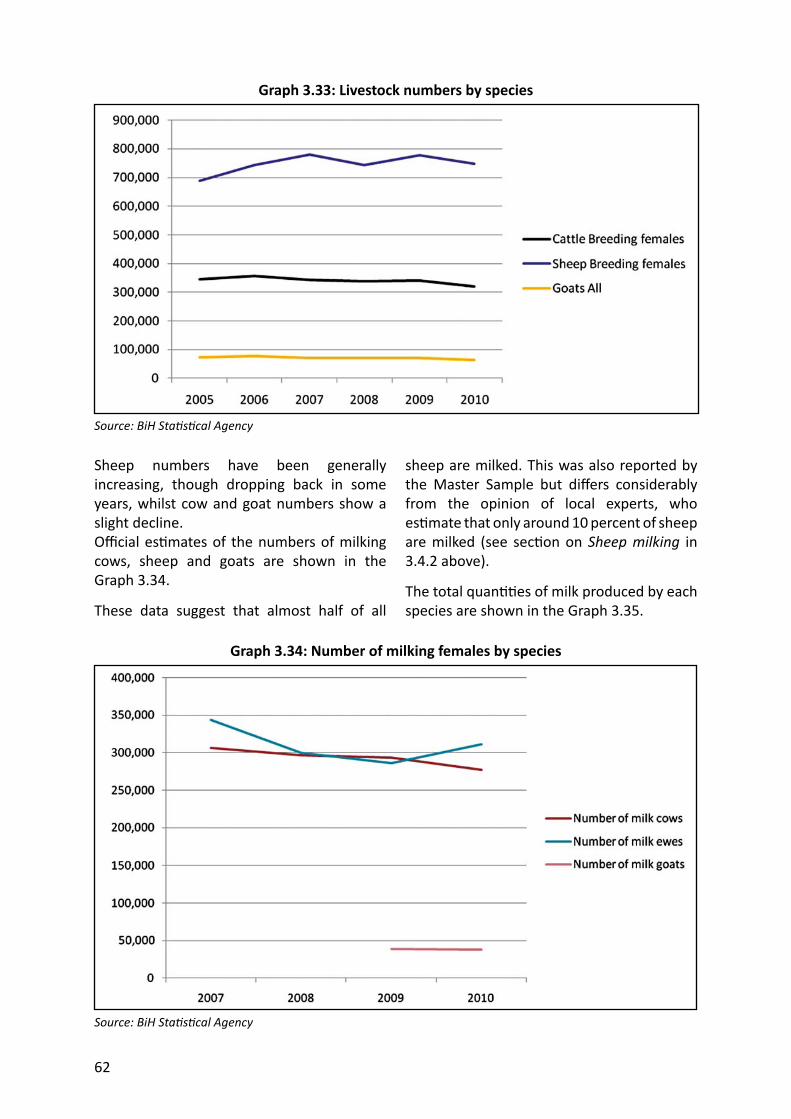
62
Sheep numbers have been generally increasing, though dropping back in some years, whilst cow and goat numbers show a slight decline.Offi cial es mates of the numbers of milking cows, sheep and goats are shown in the Graph 3.34.
These data suggest that almost half of all
Graph 3.33: Livestock numbers by species
Source: BiH Sta s cal Agency
sheep are milked. This was also reported by the Master Sample but diff ers considerably from the opinion of local experts, who es mate that only around 10 percent of sheep are milked (see sec on on Sheep milking in 3.4.2 above).
The total quan es of milk produced by each species are shown in the Graph 3.35.
Graph 3.34: Number of milking females by species
Source: BiH Sta s cal Agency
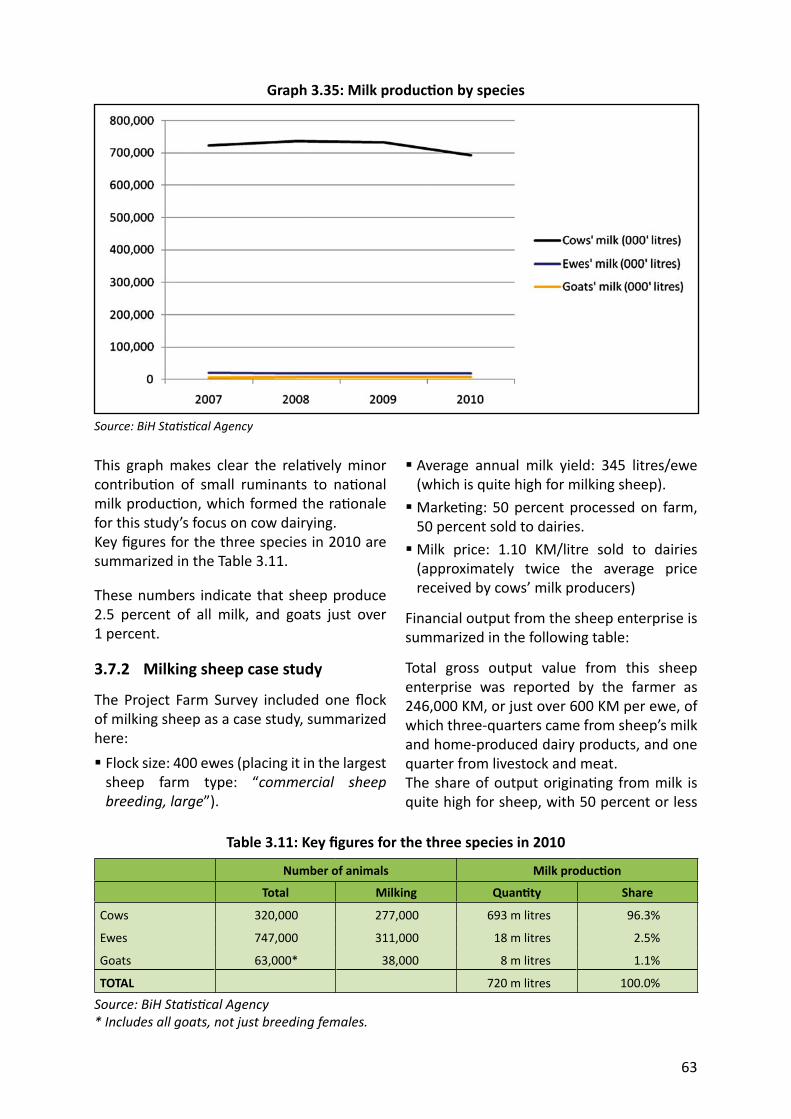
63
This graph makes clear the rela vely minor contribu on of small ruminants to na onal milk produc on, which formed the ra onale for this study’s focus on cow dairying.Key fi gures for the three species in 2010 are summarized in the Table 3.11.
These numbers indicate that sheep produce 2.5 percent of all milk, and goats just over 1 percent.
3.7.2 Milking sheep case study
The Project Farm Survey included one fl ock of milking sheep as a case study, summarized here: Flock size: 400 ewes (placing it in the largest sheep farm type: “commercial sheep breeding, large”).
Graph 3.35: Milk produc on by species
Source: BiH Sta s cal Agency
Average annual milk yield: 345 litres/ewe (which is quite high for milking sheep). Marke ng: 50 percent processed on farm, 50 percent sold to dairies. Milk price: 1.10 KM/litre sold to dairies (approximately twice the average price received by cows’ milk producers)
Financial output from the sheep enterprise is summarized in the following table:
Total gross output value from this sheep enterprise was reported by the farmer as 246,000 KM, or just over 600 KM per ewe, of which three-quarters came from sheep’s milk and home-produced dairy products, and one quarter from livestock and meat.The share of output origina ng from milk is quite high for sheep, with 50 percent or less
Table 3.11: Key fi gures for the three species in 2010
Number of animals Milk produc on
Total Milking Quan ty Share
Cows 320,000 277,000 693 m litres 96.3%
Ewes 747,000 311,000 18 m litres 2.5%
Goats 63,000* 38,000 8 m litres 1.1%
TOTAL 720 m litres 100.0%
Source: BiH Sta s cal Agency* Includes all goats, not just breeding females.
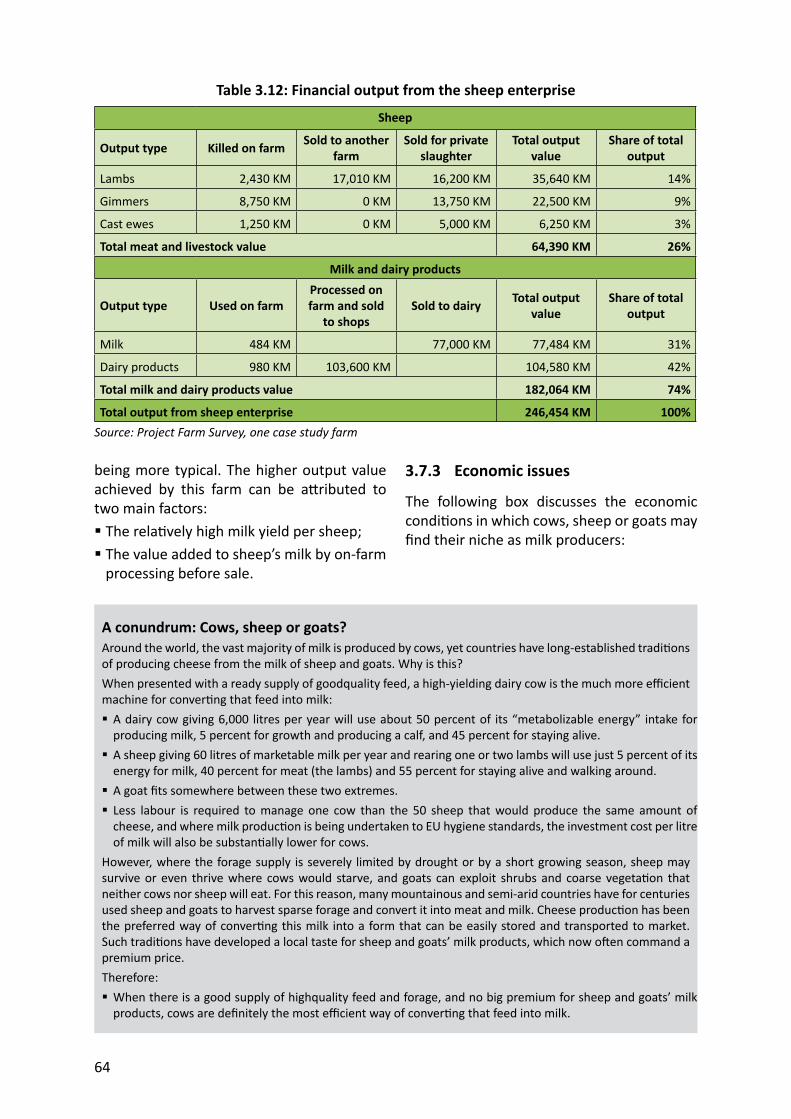
64
being more typical. The higher output value achieved by this farm can be a ributed to two main factors: The rela vely high milk yield per sheep; The value added to sheep’s milk by on-farm processing before sale.
Table 3.12: Financial output from the sheep enterprise
Sheep
Output type Killed on farm Sold to another farm
Sold for private slaughter
Total output value
Share of total output
Lambs 2,430 KM 17,010 KM 16,200 KM 35,640 KM 14%
Gimmers 8,750 KM 0 KM 13,750 KM 22,500 KM 9%
Cast ewes 1,250 KM 0 KM 5,000 KM 6,250 KM 3%
Total meat and livestock value 64,390 KM 26%
Milk and dairy products
Output type Used on farmProcessed on farm and sold
to shopsSold to dairy Total output
valueShare of total
output
Milk 484 KM 77,000 KM 77,484 KM 31%
Dairy products 980 KM 103,600 KM 104,580 KM 42%
Total milk and dairy products value 182,064 KM 74%
Total output from sheep enterprise 246,454 KM 100%Source: Project Farm Survey, one case study farm
3.7.3 Economic issues
The following box discusses the economic condi ons in which cows, sheep or goats may fi nd their niche as milk producers:
A conundrum: Cows, sheep or goats?Around the world, the vast majority of milk is produced by cows, yet countries have long-established tradi ons of producing cheese from the milk of sheep and goats. Why is this?When presented with a ready supply of goodquality feed, a high-yielding dairy cow is the much more effi cient machine for conver ng that feed into milk: A dairy cow giving 6,000 litres per year will use about 50 percent of its “metabolizable energy” intake for producing milk, 5 percent for growth and producing a calf, and 45 percent for staying alive. A sheep giving 60 litres of marketable milk per year and rearing one or two lambs will use just 5 percent of its energy for milk, 40 percent for meat (the lambs) and 55 percent for staying alive and walking around. A goat fi ts somewhere between these two extremes. Less labour is required to manage one cow than the 50 sheep that would produce the same amount of cheese, and where milk produc on is being undertaken to EU hygiene standards, the investment cost per litre of milk will also be substan ally lower for cows.
However, where the forage supply is severely limited by drought or by a short growing season, sheep may survive or even thrive where cows would starve, and goats can exploit shrubs and coarse vegeta on that neither cows nor sheep will eat. For this reason, many mountainous and semi-arid countries have for centuries used sheep and goats to harvest sparse forage and convert it into meat and milk. Cheese produc on has been the preferred way of conver ng this milk into a form that can be easily stored and transported to market. Such tradi ons have developed a local taste for sheep and goats’ milk products, which now o en command a premium price.Therefore: When there is a good supply of highquality feed and forage, and no big premium for sheep and goats’ milk products, cows are defi nitely the most effi cient way of conver ng that feed into milk.
65
Generally speaking, in Bosnia and Herzegovina milking sheep and goats tends to be kept rather extensively with low investment in buildings and equipment for milking and milk storage, typically being milked by hand in the pasture or stable. Whilst the milk and dairy products remain des ned for informal sale direct to customers and via lightly regulated green markets, such an approach is viable. However, within the EU the supply of sheep’s and goats’ milk to registered dairies for processing and sale on the na onal market is subject to regula ons almost as ght as those applicable to cows’ milk, requiring substan al investment on the part of producers. Given the much lower milk yield of small ruminants,
Where there is a lowquality forage resource that cows cannot use, sheep and goats present almost the only way to make money from it, with the best emphasis on meat versus milk being determined by the rela ve prices of these two products and the cost of labour. Where highquality feed is available and there is a clear market premium for hygienic sheep and goats’ milk products, high-yielding goats are generally more effi cient than sheep, both in terms of feed conversion and in per unit costs of labour and capital.
This means that there is economic scope for three dis nct systems: Intensively fed dairy ca le; Intensively fed dairy goats; Extensively grazed sheep and goats of local breeds.
na onal rather than EU regula on, and; Development of large fl ocks of milking sheep and goats, with modern hygiene standards and good yields, supplying specialist dairies that are able to sell their products for a premium price. Such niche development might well be supported under the IPARD diversifi ca on measures, and is discussed further in the sector study on diversifi ca on.
3.8 Es mated Gross OutputBased on the above es mates, the farmgate value of livestock produc on can be valued at approximately 1.8 billion KM (about EUR 900 million), broken down as follows:
Table 3.13: Farmgate value of livestock produc on
Species Meat Milk/Eggs Total
Ca le 340 m KM 502 m KM 842 m KM
Sheep 232 m KM - 232 m KM
Pigs 361 m KM - 361 m KM
Poultry 198 m KM 151 m KM 349 m KM
TOTAL 1,130 m KM 653 m KM 1,783 m KM
only rela vely large fl ocks are able to repay such investment, and probably need to command premium prices for their products in order to do so.
Thus the milking sheep and goat sector in Bosnia and Herzegovina has two main possible direc ons for development: Small-scale milk produc on and on-farm processing to generate “small quan es of product for direct sale to the fi nal consumer”, which will remain subject to
These es mates include produce consumed on-farm and marketed informally, but do not yet include the value of:
The value added to home-produced meat and dairy products that are sold informally (these have been valued at the typical selling price of the meat and milk used to produce them); Milk and milk products from sheep and goats; Wool.
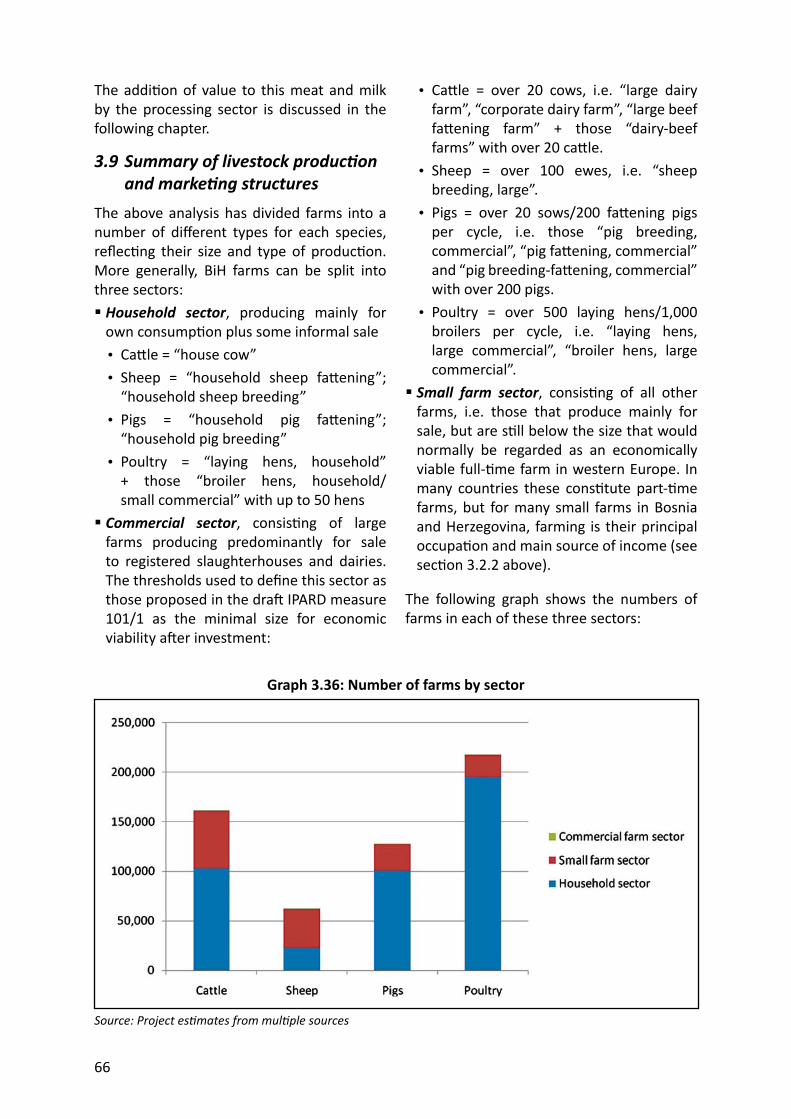
66
The addi on of value to this meat and milk by the processing sector is discussed in the following chapter.
3.9 Summary of livestock produc on and marke ng structures
The above analysis has divided farms into a number of diff erent types for each species, refl ec ng their size and type of produc on. More generally, BiH farms can be split into three sectors: Household sector, producing mainly for own consump on plus some informal sale• Ca le = “house cow”• Sheep = “household sheep fa ening”;
“household sheep breeding”• Pigs = “household pig fa ening”;
“household pig breeding”• Poultry = “laying hens, household”
+ those “broiler hens, household/small commercial” with up to 50 hens
Commercial sector, consis ng of large farms producing predominantly for sale to registered slaughterhouses and dairies. The thresholds used to defi ne this sector as those proposed in the dra IPARD measure 101/1 as the minimal size for economic viability a er investment:
• Ca le = over 20 cows, i.e. “large dairy farm”, “corporate dairy farm”, “large beef fa ening farm” + those “dairy-beef farms” with over 20 ca le.
• Sheep = over 100 ewes, i.e. “sheep breeding, large”.
• Pigs = over 20 sows/200 fa ening pigs per cycle, i.e. those “pig breeding, commercial”, “pig fa ening, commercial” and “pig breeding-fa ening, commercial” with over 200 pigs.
• Poultry = over 500 laying hens/1,000 broilers per cycle, i.e. “laying hens, large commercial”, “broiler hens, large commercial”.
Small farm sector, consis ng of all other farms, i.e. those that produce mainly for sale, but are s ll below the size that would normally be regarded as an economically viable full- me farm in western Europe. In many countries these cons tute part- me farms, but for many small farms in Bosnia and Herzegovina, farming is their principal occupa on and main source of income (see sec on 3.2.2 above).
The following graph shows the numbers of farms in each of these three sectors:
Graph 3.36: Number of farms by sector
Source: Project es mates from mul ple sources
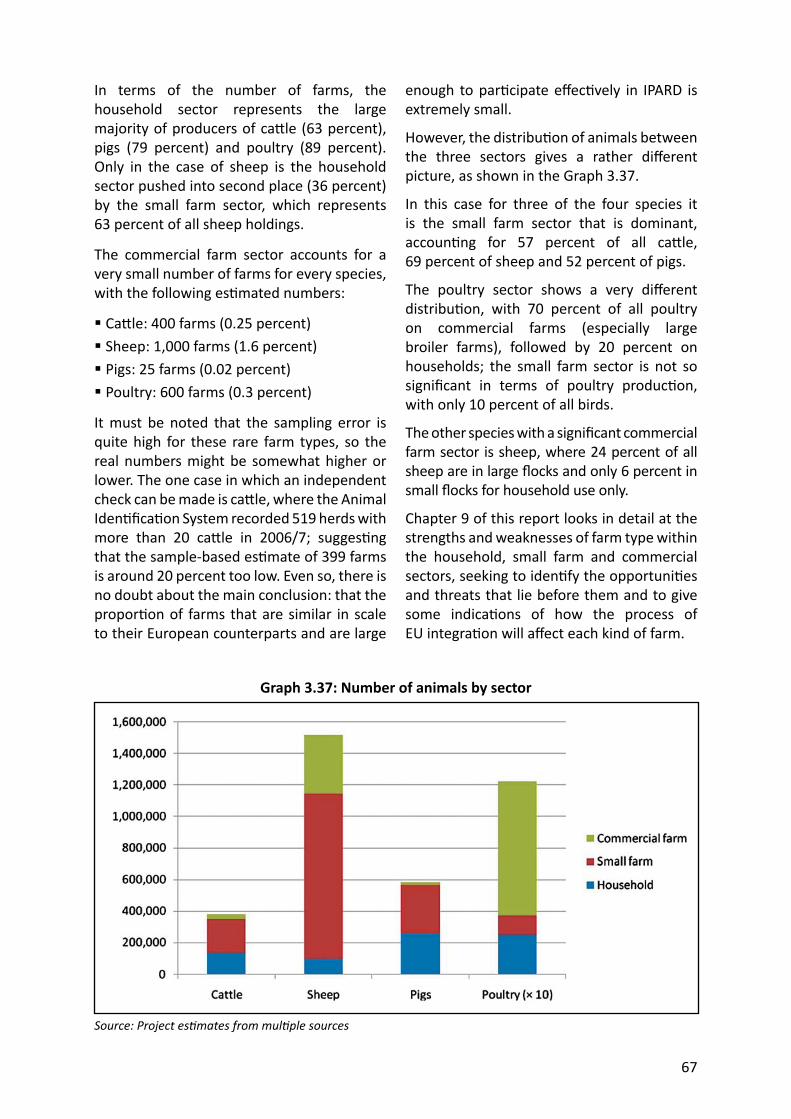
67
In terms of the number of farms, the household sector represents the large majority of producers of ca le (63 percent), pigs (79 percent) and poultry (89 percent). Only in the case of sheep is the household sector pushed into second place (36 percent) by the small farm sector, which represents 63 percent of all sheep holdings.
The commercial farm sector accounts for a very small number of farms for every species, with the following es mated numbers:
Ca le: 400 farms (0.25 percent) Sheep: 1,000 farms (1.6 percent) Pigs: 25 farms (0.02 percent) Poultry: 600 farms (0.3 percent)
It must be noted that the sampling error is quite high for these rare farm types, so the real numbers might be somewhat higher or lower. The one case in which an independent check can be made is ca le, where the Animal Iden fi ca on System recorded 519 herds with more than 20 ca le in 2006/7; sugges ng that the sample-based es mate of 399 farms is around 20 percent too low. Even so, there is no doubt about the main conclusion: that the propor on of farms that are similar in scale to their European counterparts and are large
Graph 3.37: Number of animals by sector
Source: Project es mates from mul ple sources
enough to par cipate eff ec vely in IPARD is extremely small.
However, the distribu on of animals between the three sectors gives a rather diff erent picture, as shown in the Graph 3.37.
In this case for three of the four species it is the small farm sector that is dominant, accoun ng for 57 percent of all ca le, 69 percent of sheep and 52 percent of pigs.
The poultry sector shows a very diff erent distribu on, with 70 percent of all poultry on commercial farms (especially large broiler farms), followed by 20 percent on households; the small farm sector is not so signifi cant in terms of poultry produc on, with only 10 percent of all birds.
The other species with a signifi cant commercial farm sector is sheep, where 24 percent of all sheep are in large fl ocks and only 6 percent in small fl ocks for household use only.
Chapter 9 of this report looks in detail at the strengths and weaknesses of farm type within the household, small farm and commercial sectors, seeking to iden fy the opportuni es and threats that lie before them and to give some indica ons of how the process of EU integra on will aff ect each kind of farm.
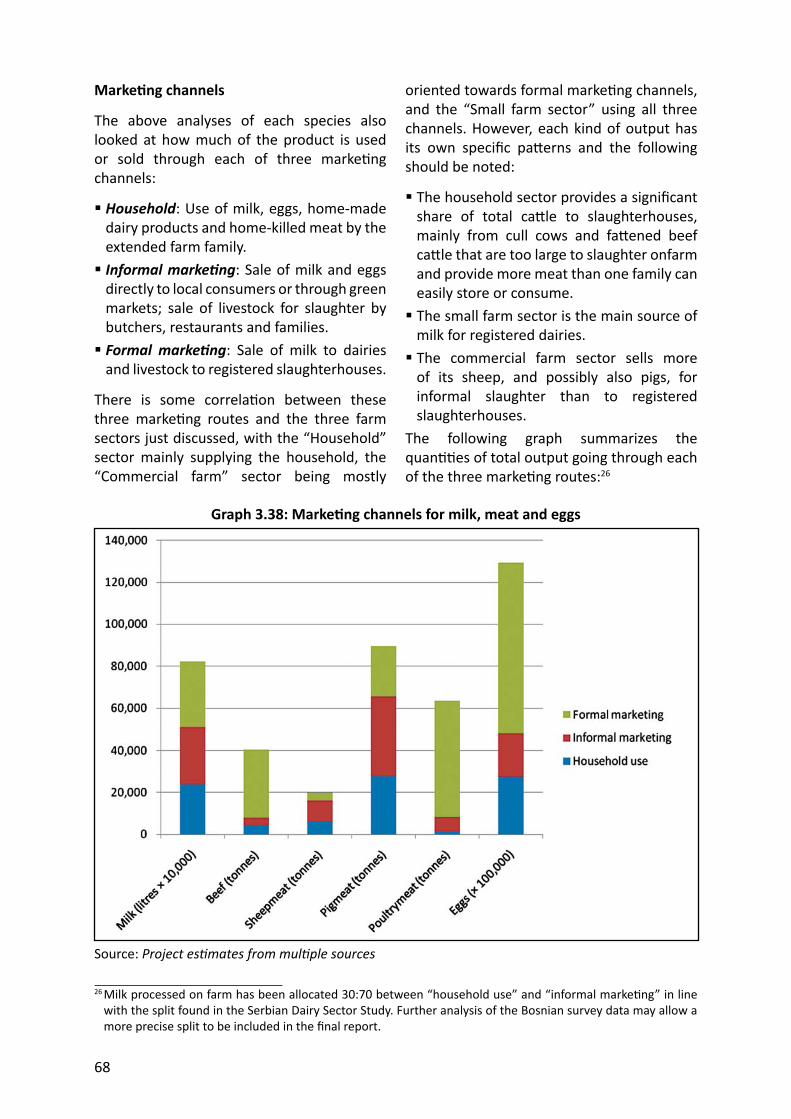
68
Marke ng channels
The above analyses of each species also looked at how much of the product is used or sold through each of three marke ng channels:
Household: Use of milk, eggs, home-made dairy products and home-killed meat by the extended farm family. Informal marke ng: Sale of milk and eggs directly to local consumers or through green markets; sale of livestock for slaughter by butchers, restaurants and families. Formal marke ng: Sale of milk to dairies and livestock to registered slaughterhouses.
There is some correla on between these three marke ng routes and the three farm sectors just discussed, with the “Household” sector mainly supplying the household, the “Commercial farm” sector being mostly
Graph 3.38: Marke ng channels for milk, meat and eggs
Source: Project es mates from mul ple sources
26 Milk processed on farm has been allocated 30:70 between “household use” and “informal marke ng” in line with the split found in the Serbian Dairy Sector Study. Further analysis of the Bosnian survey data may allow a more precise split to be included in the fi nal report.
oriented towards formal marke ng channels, and the “Small farm sector” using all three channels. However, each kind of output has its own specifi c pa erns and the following should be noted:
The household sector provides a signifi cant share of total ca le to slaughterhouses, mainly from cull cows and fa ened beef ca le that are too large to slaughter onfarm and provide more meat than one family can easily store or consume. The small farm sector is the main source of milk for registered dairies. The commercial farm sector sells more of its sheep, and possibly also pigs, for informal slaughter than to registered slaughterhouses.
The following graph summarizes the quan es of total output going through each of the three marke ng routes:26
69
This shows that formal marke ng is the dominant channel only for beef, poultry meat and eggs, whilst informal marke ng is most important for sheep meat; all three marke ng channels are of almost equal importance for milk and pig meat.
Overall the split of output between the three marke ng channels may be summarized as:
Milk Meat Eggs
Household use 29% 18% 21%
Informal marke ng 33% 28% 16%
Formal marke ng 38% 54% 63%
Comparison with slaughter sta s cs
As well as producing es mates of on-farm and informal slaughter, the methodology employed here has also resulted in es mates of meat produc on by registered slaughterhouses that are markedly higher than offi cial sta s cs, as shown in the following table:
Table 3.14: Es mates of meat produc on by registered slaughterhouses
Slaughter weight
Offi cial sta s cs
Project es mates Diff erence
Ca le 23,000 t 32,000 t + 38%
Sheep 2,000 t 4,000 t + 98%
Pigs 13,000 t 24,000 t + 80%
Poultry 38,000 t 55,000 t + 47%
TOTAL 76,000 t 115,000 t + 51%Source: See legend
The methodology employed by the BiH Agency for Sta s cs is described in their “First release” bulle n as follows:
Data on legal en es and parts of legal en es are submi ed based on bookkeeping, whereas for entrepreneurs aba oir data are given from approved municipal (veterinary inspec on) departments on the basis of available evidence.
A senior member of the Veterinary Department in another former Yugoslav republic told the consultant that offi cial
slaughter sta s cs seriously underes mated the actual quan ty processed in slaughterhouses, since these declared only a por on of their total throughput in order to avoid taxa on and inspec on charges; it seems that a similar situa on may well occur in Bosnia and Herzegovina.
Conclusions
The structural picture is diff erent for each species and livestock product. In simplifi ed terms: Ca le produc on is characterized by many small farms supplying formal slaughterhouses and dairies, plus a signifi cant amount of household consump on and informal marke ng of milk and dairy products. Sheep produc on is characterized by a broad spread of small, medium and large farms producing mainly for household use and informal slaughter. Pig produc on is characterized by small and medium-sized farms producing for household use and informal slaughter, with few large farms. Poultry produc on is characterized by two extremes: very many small farms producing for household use, and very few large farms producing for formal markets and accoun ng for the majority of output.
Thus the policy and investment response must do three things: It must include strategies for the three kinds of farms in Bosnia and Herzegovina: household sector, small farm sector, and commercial sector, since all three are important. It must include strategies for all three marke ng channels found in Bosnia and Herzegovina: household use, informal marke ng and formal marke ng. It must recognize the diff erences between each species and each livestock product, and deliver responses appropriate to each.
The current policy and investment responses are reviewed briefl y in Chapters 5 and 8.
70
A possible development path and specifi c investment needs are discussed in Chapter 9, and recommenda ons for support through the IPARD programme are given in Chapter 11.
3.10 Supply-U liza on Balance for meat
The data presented in this chapter so far concern only the produc on of meat by farms and households in BiH. Sec on 6.3.1 looks at interna onal trade in livestock products in value terms. The following table combines the es mates from this chapter with traded quan es of slaughter livestock, meat and meat products, in order to generate an overall supplyu liza on balance and to es mate per capita consump on for comparison with other countries in the region.
The following points should be noted: Trade data are as supplied by Customs via MoFTER, for 2010. The fi rst three lines of data are the project es mates of meat produc on from BiH farms and households, as presented earlier in this chapter. The fourth line adds the import of ca le for slaughter. Some 16,000 tonnes of slaughter-ca le imports are reported, and a killing-out percentage of 50 percent has been used to es mate a contribu on of 7,800 tonnes to the domes c meat supply, assumed all to have been generated in registered slaughterhouses. Customs data do not dis nguish whether interna onal trade in other species is for immediate slaughter, but total trade in adult non-breeding sheep, goats, pigs and poultry was small, and it is understood that this is not a signifi cant factor in the overall supply balance. The next sec on of the table shows the import of meat, meat products and off al. Most of the trade in meat products is for items such as sausages, which are not classifi ed by species and may o en contain meat from more than one species; these
are shown in the column headed “Mixed species”. Each meat product or item has its own technical conversion factor (weight of product produced as a percentage of carcass weight used); this factor involves both wastage (primarily the removal of bones) and the addi on of non-meat ingredients. Detailed informa on on this subject may be found in the FAO publica on “Technical Conversion Factors for Agricultural Commodi es”;27 some of the more relevant factors quoted there include:• Boneless meat: 71 percent (ca le),
73 percent (pigs)• Sausages: 80 percent (ca le), 85 percent
(pigs)The most common items in interna onal trade with BiH are boneless cuts of meat, and sausages; therefore both meat and meat products have been divided by an overall conversion factor of 80 percent to es mate the carcass weight equivalent of imports and exports. No data were available on opening and closing stocks (which would apply mainly to preserved meat products), and it is assumed that there is no major change in stocks from one year-end to the next. Total meat supply is es mated at 276,000 tonnes, of which:• 77 percent was reared on BiH farms;• 3 percent was imported as live ca le for
immediate slaughter;• 20percent was imported as meat and
meat products. The next block shows BiH’s recorded exports (including a small export of slaughter ca le to Lebanon). Overall, exports accounted for 12,000 tonnes, or 5 percent of total meat supply. Domes c consump on of meat and meat products is es mated by subtrac ng known exports from total supply, resul ng in an overall consump on of 266,000 tonnes, broken down as follows:
27 h p://www.fao.org/fi leadmin/templates/ess/documents/methodology/tcf.pdf
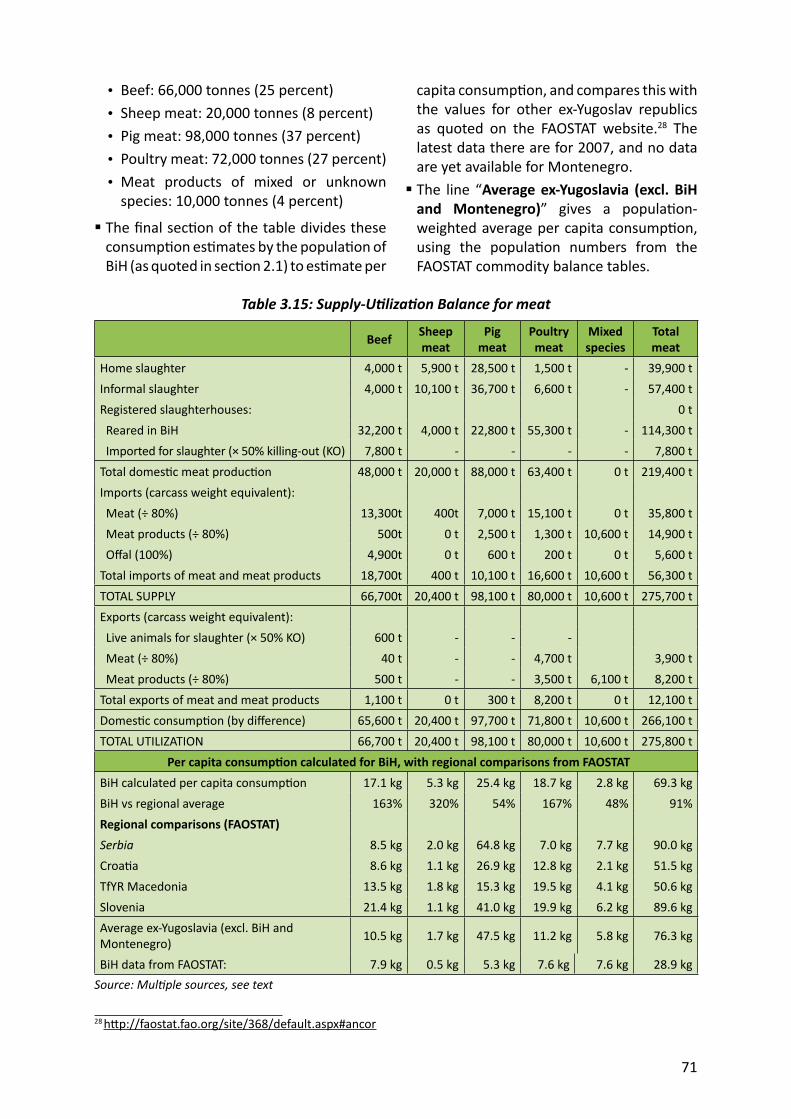
71
• Beef: 66,000 tonnes (25 percent)• Sheep meat: 20,000 tonnes (8 percent)• Pig meat: 98,000 tonnes (37 percent)• Poultry meat: 72,000 tonnes (27 percent)• Meat products of mixed or unknown
species: 10,000 tonnes (4 percent)
The fi nal sec on of the table divides these consump on es mates by the popula on of BiH (as quoted in sec on 2.1) to es mate per
28 h p://faostat.fao.org/site/368/default.aspx#ancor
capita consump on, and compares this with the values for other ex-Yugoslav republics as quoted on the FAOSTAT website.28 The latest data there are for 2007, and no data are yet available for Montenegro. The line “Average ex-Yugoslavia (excl. BiH and Montenegro)” gives a popula on-weighted average per capita consump on, using the popula on numbers from the FAOSTAT commodity balance tables.
Table 3.15: Supply-U liza on Balance for meat
Beef Sheep meat
Pig meat
Poultry meat
Mixed species
Total meat
Home slaughter 4,000 t 5,900 t 28,500 t 1,500 t - 39,900 tInformal slaughter 4,000 t 10,100 t 36,700 t 6,600 t - 57,400 tRegistered slaughterhouses: 0 t Reared in BiH 32,200 t 4,000 t 22,800 t 55,300 t - 114,300 t Imported for slaughter (× 50% killing-out (KO) 7,800 t - - - - 7,800 tTotal domes c meat produc on 48,000 t 20,000 t 88,000 t 63,400 t 0 t 219,400 tImports (carcass weight equivalent): Meat (÷ 80%) 13,300t 400t 7,000 t 15,100 t 0 t 35,800 t Meat products (÷ 80%) 500t 0 t 2,500 t 1,300 t 10,600 t 14,900 t Off al (100%) 4,900t 0 t 600 t 200 t 0 t 5,600 tTotal imports of meat and meat products 18,700t 400 t 10,100 t 16,600 t 10,600 t 56,300 tTOTAL SUPPLY 66,700t 20,400 t 98,100 t 80,000 t 10,600 t 275,700 tExports (carcass weight equivalent): Live animals for slaughter (× 50% KO) 600 t - - - Meat (÷ 80%) 40 t - - 4,700 t 3,900 t Meat products (÷ 80%) 500 t - - 3,500 t 6,100 t 8,200 tTotal exports of meat and meat products 1,100 t 0 t 300 t 8,200 t 0 t 12,100 tDomes c consump on (by diff erence) 65,600 t 20,400 t 97,700 t 71,800 t 10,600 t 266,100 tTOTAL UTILIZATION 66,700 t 20,400 t 98,100 t 80,000 t 10,600 t 275,800 t
Per capita consump on calculated for BiH, with regional comparisons from FAOSTATBiH calculated per capita consump on 17.1 kg 5.3 kg 25.4 kg 18.7 kg 2.8 kg 69.3 kgBiH vs regional average 163% 320% 54% 167% 48% 91%Regional comparisons (FAOSTAT) Serbia 8.5 kg 2.0 kg 64.8 kg 7.0 kg 7.7 kg 90.0 kgCroa a 8.6 kg 1.1 kg 26.9 kg 12.8 kg 2.1 kg 51.5 kgTfYR Macedonia 13.5 kg 1.8 kg 15.3 kg 19.5 kg 4.1 kg 50.6 kgSlovenia 21.4 kg 1.1 kg 41.0 kg 19.9 kg 6.2 kg 89.6 kgAverage ex-Yugoslavia (excl. BiH and Montenegro) 10.5 kg 1.7 kg 47.5 kg 11.2 kg 5.8 kg 76.3 kg
BiH data from FAOSTAT: 7.9 kg 0.5 kg 5.3 kg 7.6 kg 7.6 kg 28.9 kgSource: Mul ple sources, see text
72
Overall per capita meat consump on for BiH is es mated at 69 kg per year, or 91 percent of the regional average. This value is higher than for Croa a and The former Yugoslav Republic of Macedonia, and lower than Serbia and Slovenia. Consump on of meat by species refl ects the specifi ci es of produc on and consump on in BiH:
Beef consump on is some 60 percent higher than the regional average, second only to Slovenia;
Sheep meat consump on, whilst s ll rela vely low at 5 kg per person per year, is three mes the regional average;
Pig meat consump on is just over half the regional average, with only TfYR Macedonia repor ng a lower per capita value, yet it s ll accounts for over a third of all meat consump on in BiH and, at 25 kg per person per year, is the most consumed of all meats. This fi nding may come as a surprise to some observers, but it has a logic: pig meat is generally cheaper than beef,29 and pigs are well suited to backyard produc on, par cularly for households that do not have the land or me to keep ca le or sheep; thus for those segments of the popula on that do include pig meat in their diet, it can
29 See for example h p://www.seebiz.eu/potrosnja-pile ne-u-bih-zbog-niske-cijene-uzletjela-100/ar-24684/ which reports that beef currently costs 40 percent more than pork in BiH.
make up a signifi cant propor on of their total meat consump on.
Poultry meat consump on is two-thirds higher than the regional average, though both TfYR Macedonia and Slovenia show higher values, and is the second most important meat in terms of the quan ty consumed.
This analysis indicates that the es mated quan es of meat produced on farms, both overall and by species, are en rely consistent with the regional pa ern of meat consump on and the specifi c features of Bosnia and Herzegovina.
The fi nal row of the table quotes the per capita consump on values for BiH from the FAOSTAT website. These values are markedly lower than the es mates made in this chapter, refl ec ng the signifi cant underes ma on by offi cial sta s cs of informal livestock produc on and unregistered slaughter in BiH (as discussed in Sec on 3.9 above, under Comparison with slaughter sta s cs). It is possible that some of the data reported to FAO by other countries in the region include similar omissions (the low value of pig meat in TfYR Macedonia stands out in par cular, and may refl ect underes ma on of household produc on and slaughter in that country).
73
4. Processing
This chapter examines the milk and meat processing industries. Most of the focus is on formal processing by registered slaughterhouses and dairies, but a en on is also given to the important role of on-farm and informal processing. Sec on 4.1 gives a brief overview of how the 1990s Balkans confl ict aff ected the livestock processing industry in Bosnia and Herzegovina, and the extent to which it has managed to recover. Sec on 4.2 looks at how raw milk and slaughter livestock move from the farm to the processor, forming the bridge from Chapter 3 to this chapter. Sec on 4.3 looks at the structure and func oning of the dairy processing industry. Sec on 4.4 looks at the slaughtering and meat processing industry.
4.1 Recent history of the processing industry
The agricultural processing industry suff ered severely during the Balkan Confl ict in the 1990s: The raw material base from milk producers was fragmented, forcing many dairies to resort to the import of milk powder for recombina on in order to keep the market supplied. The meat industry also suff ered serious damage or even destruc on of many plants, with livestock numbers almost decimated. Numbers and prac ces have s ll not recovered, witnessed by the con nuing dependence on meat imports. Dairies in Bihač, Mostar and Sarajevo in par cular were damaged, some severely. The Milkos dairy in Sarajevo was s ll in very poor condi on in 1995, but has been relocated in modern premises, and many livestock farms were destroyed. Due to this raw material shortage, the dairy product range was confi ned mainly to pasteurized milk, which is simpler to process
and was used as a staple part of nutri on during and immediately a er the confl ict. Many transport vehicles were destroyed, damaged or confi scated, further hindering the collec on of such raw material that was s ll available from farms. Technological development was arrested, and many key workers were dra ed into the army or forced to seek refuge.
It is against this background that progress needs to be measured, and the history of Bosnia and Herzegovina accounts to a large extent for the rela ve underdevelopment of the subsector, par cularly in terms of the product range and product development.
However it is interes ng at this juncture to look at how dairies have responded to changing circumstances in their post-war development. This development can be divided into three dis nct phases: Up to 2000, most had recovered their pre-war status and many new dairies were established, ensuring that basic dairy products became increasingly available to meet the needs of the market. The next phase, up to 2005, was a me of consolida on and gradual moderniza on and expansion of processing capacity. Also, priva za on of former state-owned plants was mainly completed. Since 2005, foreign companies have invested in dairies in Bosnia and Herzegovina, mainly in the larger enterprises. These investments from Serbia, Germany and Slovenia saw the start of expansion of the product range, for example in new varie es of exis ng products such as yoghurt, together with the manufacture of Feta-type cheese. This phase also saw the closure of many dairies, mostly of small capacity and limited technology, which became unable to compete in the more demanding and dynamic market. This phase also saw increased investment by local entrepreneurs, in brand new buildings, plant and technology.
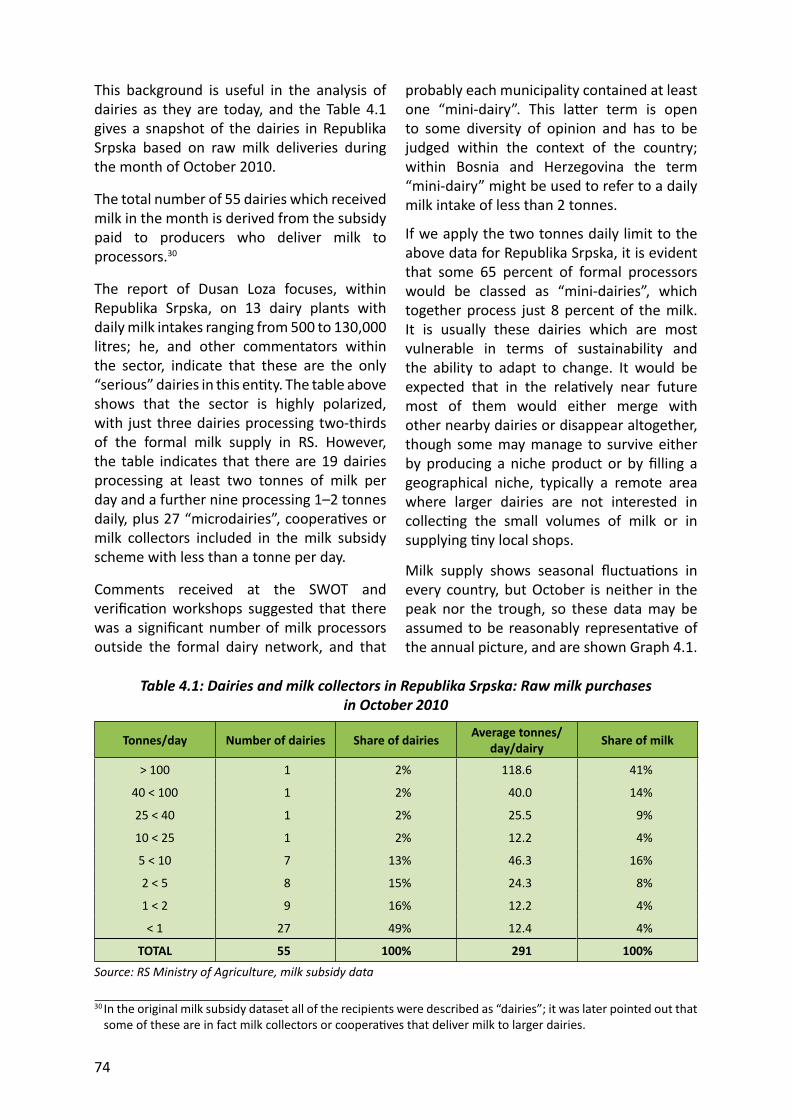
74
This background is useful in the analysis of dairies as they are today, and the Table 4.1 gives a snapshot of the dairies in Republika Srpska based on raw milk deliveries during the month of October 2010.
The total number of 55 dairies which received milk in the month is derived from the subsidy paid to producers who deliver milk to processors.30
The report of Dusan Loza focuses, within Republika Srpska, on 13 dairy plants with daily milk intakes ranging from 500 to 130,000 litres; he, and other commentators within the sector, indicate that these are the only “serious” dairies in this en ty. The table above shows that the sector is highly polarized, with just three dairies processing two-thirds of the formal milk supply in RS. However, the table indicates that there are 19 dairies processing at least two tonnes of milk per day and a further nine processing 1–2 tonnes daily, plus 27 “microdairies”, coopera ves or milk collectors included in the milk subsidy scheme with less than a tonne per day.
Comments received at the SWOT and verifi ca on workshops suggested that there was a signifi cant number of milk processors outside the formal dairy network, and that
Table 4.1: Dairies and milk collectors in Republika Srpska: Raw milk purchases in October 2010
Tonnes/day Number of dairies Share of dairies Average tonnes/day/dairy Share of milk
> 100 1 2% 118.6 41%
40 < 100 1 2% 40.0 14%
25 < 40 1 2% 25.5 9%
10 < 25 1 2% 12.2 4%
5 < 10 7 13% 46.3 16%
2 < 5 8 15% 24.3 8%
1 < 2 9 16% 12.2 4%
< 1 27 49% 12.4 4%
TOTAL 55 100% 291 100%Source: RS Ministry of Agriculture, milk subsidy data
probably each municipality contained at least one “mini-dairy”. This la er term is open to some diversity of opinion and has to be judged within the context of the country; within Bosnia and Herzegovina the term “mini-dairy” might be used to refer to a daily milk intake of less than 2 tonnes.
If we apply the two tonnes daily limit to the above data for Republika Srpska, it is evident that some 65 percent of formal processors would be classed as “mini-dairies”, which together process just 8 percent of the milk. It is usually these dairies which are most vulnerable in terms of sustainability and the ability to adapt to change. It would be expected that in the rela vely near future most of them would either merge with other nearby dairies or disappear altogether, though some may manage to survive either by producing a niche product or by fi lling a geographical niche, typically a remote area where larger dairies are not interested in collec ng the small volumes of milk or in supplying ny local shops.
Milk supply shows seasonal fl uctua ons in every country, but October is neither in the peak nor the trough, so these data may be assumed to be reasonably representa ve of the annual picture, and are shown Graph 4.1.
30 In the original milk subsidy dataset all of the recipients were described as “dairies”; it was later pointed out that some of these are in fact milk collectors or coopera ves that deliver milk to larger dairies.
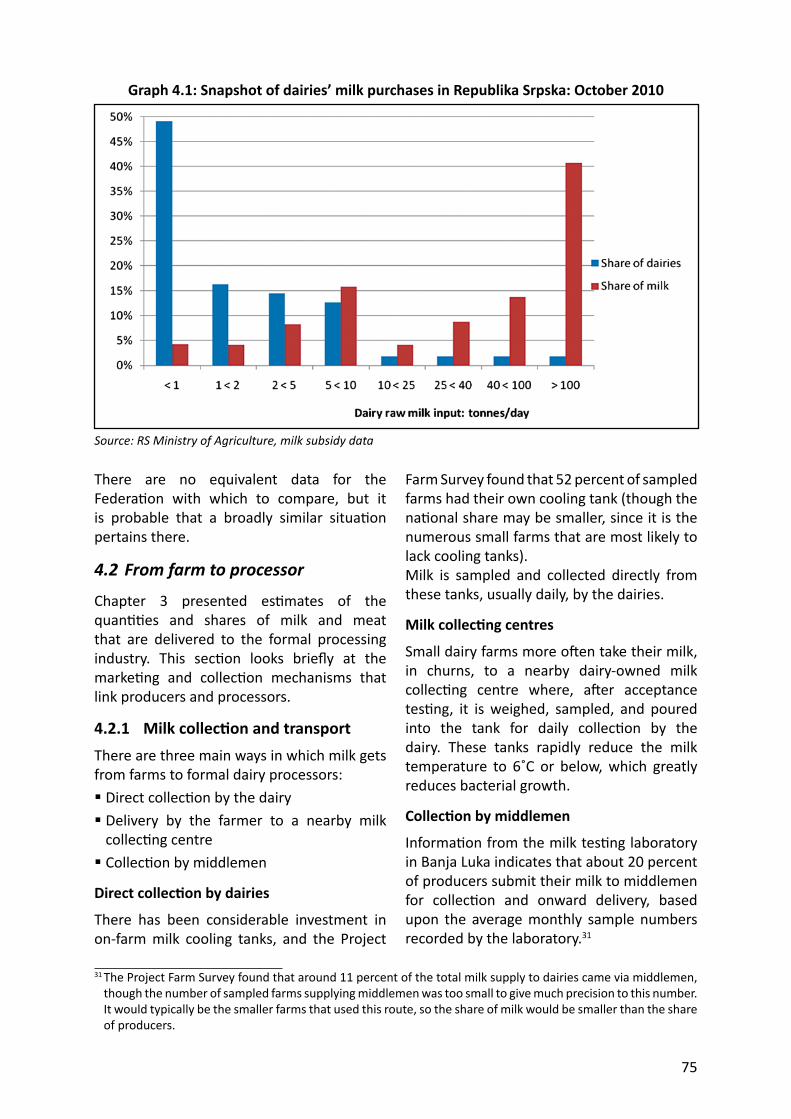
75
There are no equivalent data for the Federa on with which to compare, but it is probable that a broadly similar situa on pertains there.
4.2 F rom farm to processor
Chapter 3 presented es mates of the quan es and shares of milk and meat that are delivered to the formal processing industry. This sec on looks briefl y at the marke ng and collec on mechanisms that link producers and processors.
4.2.1 M ilk collec on and transportThere are three main ways in which milk gets from farms to formal dairy processors: Direct collec on by the dairy Delivery by the farmer to a nearby milk collec ng centre Collec on by middlemen
Direct collec on by dairies
There has been considerable investment in on-farm milk cooling tanks, and the Project
Graph 4.1: Snapshot of dairies’ milk purchases in Republika Srpska: October 2010
Source: RS Ministry of Agriculture, milk subsidy data
Farm Survey found that 52 percent of sampled farms had their own cooling tank (though the na onal share may be smaller, since it is the numerous small farms that are most likely to lack cooling tanks).Milk is sampled and collected directly from these tanks, usually daily, by the dairies.
Milk collec ng centres
Small dairy farms more o en take their milk, in churns, to a nearby dairy-owned milk collec ng centre where, a er acceptance tes ng, it is weighed, sampled, and poured into the tank for daily collec on by the dairy. These tanks rapidly reduce the milk temperature to 6˚C or below, which greatly reduces bacterial growth.
Collec on by middlemen
Informa on from the milk tes ng laboratory in Banja Luka indicates that about 20 percent of producers submit their milk to middlemen for collec on and onward delivery, based upon the average monthly sample numbers recorded by the laboratory.31
31 The Project Farm Survey found that around 11 percent of the total milk supply to dairies came via middlemen, though the number of sampled farms supplying middlemen was too small to give much precision to this number. It would typically be the smaller farms that used this route, so the share of milk would be smaller than the share of producers.
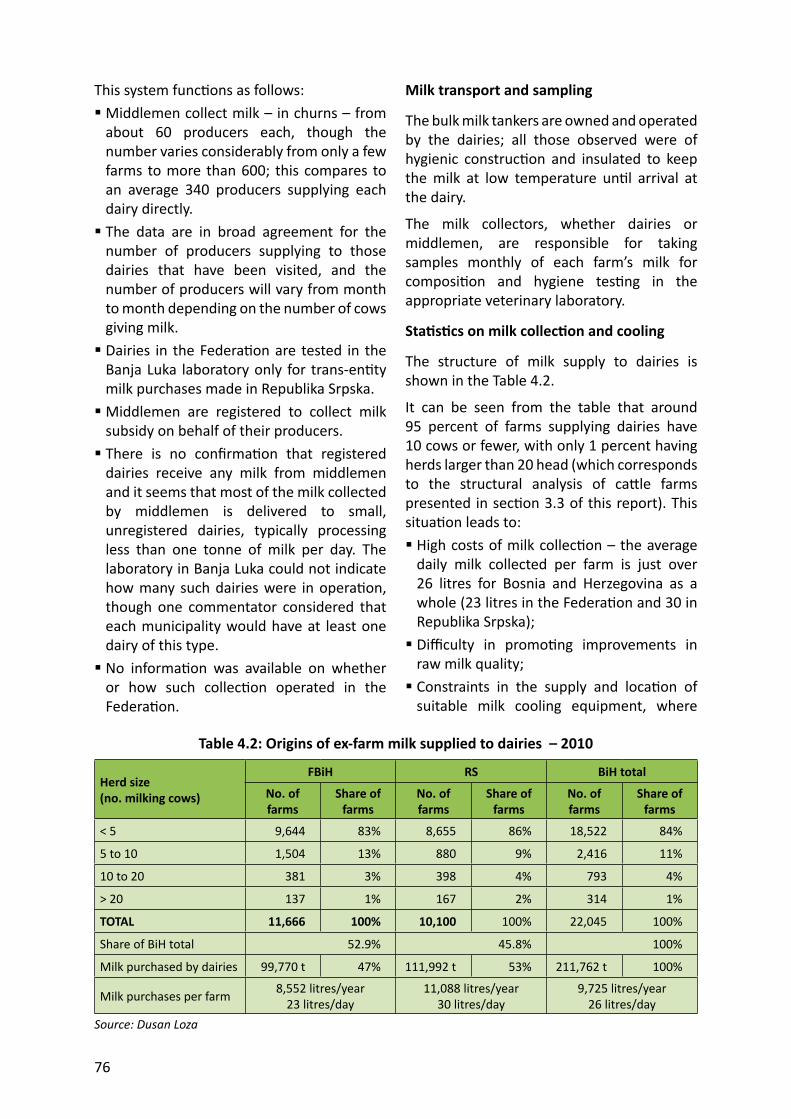
76
This system func ons as follows: Middlemen collect milk – in churns – from about 60 producers each, though the number varies considerably from only a few farms to more than 600; this compares to an average 340 producers supplying each dairy directly. The data are in broad agreement for the number of producers supplying to those dairies that have been visited, and the number of producers will vary from month to month depending on the number of cows giving milk. Dairies in the Federa on are tested in the Banja Luka laboratory only for trans-en ty milk purchases made in Republika Srpska. Middlemen are registered to collect milk subsidy on behalf of their producers. There is no confi rma on that registered dairies receive any milk from middlemen and it seems that most of the milk collected by middlemen is delivered to small, unregistered dairies, typically processing less than one tonne of milk per day. The laboratory in Banja Luka could not indicate how many such dairies were in opera on, though one commentator considered that each municipality would have at least one dairy of this type. No informa on was available on whether or how such collec on operated in the Federa on.
Milk transport and sampling
The bulk milk tankers are owned and operated by the dairies; all those observed were of hygienic construc on and insulated to keep the milk at low temperature un l arrival at the dairy.
The milk collectors, whether dairies or middlemen, are responsible for taking samples monthly of each farm’s milk for composi on and hygiene tes ng in the appropriate veterinary laboratory.
Sta s cs on milk collec on and cooling
The structure of milk supply to dairies is shown in the Table 4.2.
It can be seen from the table that around 95 percent of farms supplying dairies have 10 cows or fewer, with only 1 percent having herds larger than 20 head (which corresponds to the structural analysis of ca le farms presented in sec on 3.3 of this report). This situa on leads to: High costs of milk collec on – the average daily milk collected per farm is just over 26 litres for Bosnia and Herzegovina as a whole (23 litres in the Federa on and 30 in Republika Srpska); Diffi culty in promo ng improvements in raw milk quality; Constraints in the supply and loca on of suitable milk cooling equipment, where
Table 4.2: Origins of ex-farm milk supplied to dairies – 2010
Herd size(no. milking cows)
FBiH RS BiH total
No. of farms
Share of farms
No. of farms
Share of farms
No. of farms
Share of farms
< 5 9,644 83% 8,655 86% 18,522 84%
5 to 10 1,504 13% 880 9% 2,416 11%
10 to 20 381 3% 398 4% 793 4%
> 20 137 1% 167 2% 314 1%
TOTAL 11,666 100% 10,100 100% 22,045 100%
Share of BiH total 52.9% 45.8% 100%
Milk purchased by dairies 99,770 t 47% 111,992 t 53% 211,762 t 100%
Milk purchases per farm 8,552 litres/year23 litres/day
11,088 litres/year30 litres/day
9,725 litres/year26 litres/day
Source: Dusan Loza
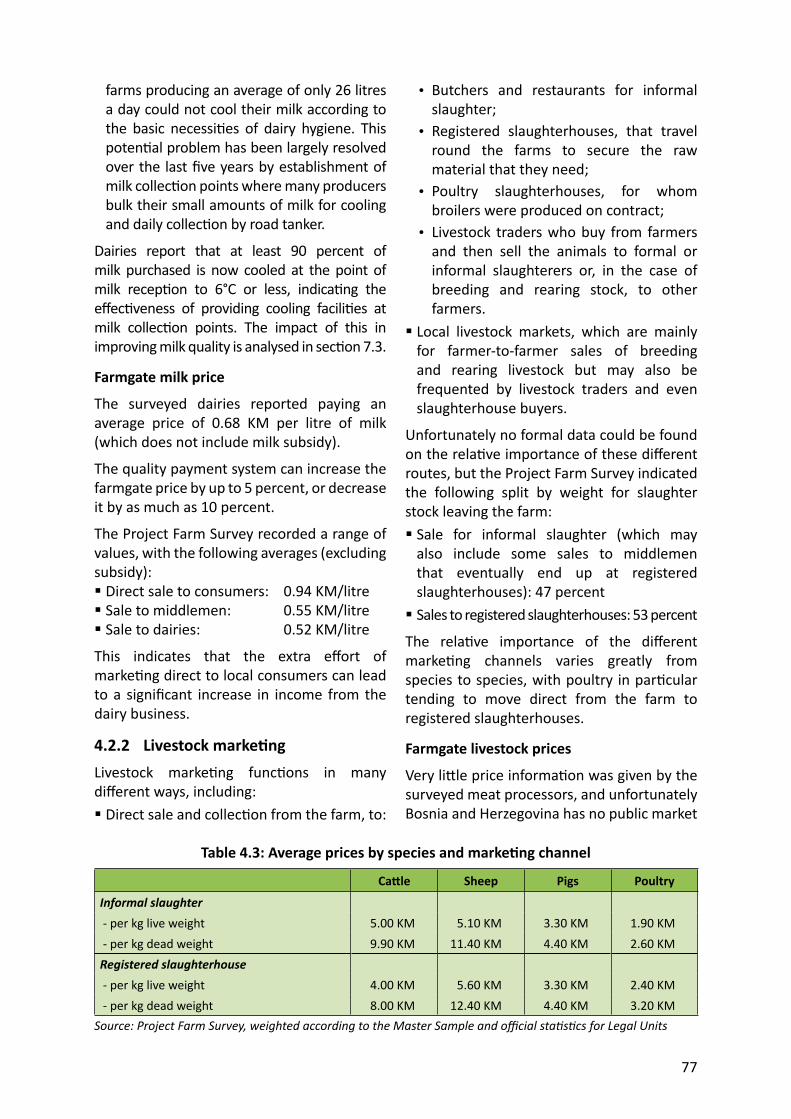
77
farms producing an average of only 26 litres a day could not cool their milk according to the basic necessi es of dairy hygiene. This poten al problem has been largely resolved over the last fi ve years by establishment of milk collec on points where many producers bulk their small amounts of milk for cooling and daily collec on by road tanker.
Dairies report that at least 90 percent of milk purchased is now cooled at the point of milk recep on to 6°C or less, indica ng the eff ec veness of providing cooling facili es at milk collec on points. The impact of this in improving milk quality is analysed in sec on 7.3.
Farmgate milk price
The surveyed dairies reported paying an average price of 0.68 KM per litre of milk (which does not include milk subsidy).
The quality payment system can increase the farmgate price by up to 5 percent, or decrease it by as much as 10 percent.
The Project Farm Survey recorded a range of values, with the following averages (excluding subsidy): Direct sale to consumers: 0.94 KM/litre Sale to middlemen: 0.55 KM/litre Sale to dairies: 0.52 KM/litre
This indicates that the extra eff ort of marke ng direct to local consumers can lead to a signifi cant increase in income from the dairy business.
4.2.2 Livestock marke ngLivestock marke ng func ons in many diff erent ways, including: Direct sale and collec on from the farm, to:
• Butchers and restaurants for informal slaughter;
• Registered slaughterhouses, that travel round the farms to secure the raw material that they need;
• Poultry slaughterhouses, for whom broilers were produced on contract;
• Livestock traders who buy from farmers and then sell the animals to formal or informal slaughterers or, in the case of breeding and rearing stock, to other farmers.
Local livestock markets, which are mainly for farmer-to-farmer sales of breeding and rearing livestock but may also be frequented by livestock traders and even slaughterhouse buyers.
Unfortunately no formal data could be found on the rela ve importance of these diff erent routes, but the Project Farm Survey indicated the following split by weight for slaughter stock leaving the farm: Sale for informal slaughter (which may also include some sales to middlemen that eventually end up at registered slaughterhouses): 47 percent Sales to registered slaughterhouses: 53 percent
The rela ve importance of the diff erent marke ng channels varies greatly from species to species, with poultry in par cular tending to move direct from the farm to registered slaughterhouses.
Farmgate livestock prices
Very li le price informa on was given by the surveyed meat processors, and unfortunately Bosnia and Herzegovina has no public market
Table 4.3: Average prices by species and marke ng channel
Ca le Sheep Pigs Poultry
Informal slaughter - per kg live weight 5.00 KM 5.10 KM 3.30 KM 1.90 KM - per kg dead weight 9.90 KM 11.40 KM 4.40 KM 2.60 KMRegistered slaughterhouse - per kg live weight 4.00 KM 5.60 KM 3.30 KM 2.40 KM - per kg dead weight 8.00 KM 12.40 KM 4.40 KM 3.20 KM
Source: Project Farm Survey, weighted according to the Master Sample and offi cial sta s cs for Legal Units
78
informa on system, so the only source of data on this topic is the Project Farm Survey, which found the following average prices by species and marke ng channel.
It should be noted that these are weighted average prices for all classes of stock slaughtered so, for example, the ca le price includes calves, cull cows and fa ened bulls.
4.3 Milk processingThis sec on looks at formal milk processing by registered dairies. The focus is on processing by the registered dairies recognized by the en ty ministries and by industry commentators; it is understood that there is also a semi-formal level of small local dairies, but it was not possible to gain any systema c picture of these.
4.3.1 Recent development of the dairy processing sector
Despite the tragedies of the 1990s, it is clear from the thirteen dairies recently
visited in Bosnia and Herzegovina that the dairy processing industry has recovered remarkably well, and developed a modern and vibrant successor capable of facing the future possibility of EU membership and all that will entail. Currently, more than 60 percent of dairy cows and milk produc on in FBiH are in Tuzla, Una-Sana and Zenica-Doboj cantons, whereas Livno canton has recorded the highest recent growth of milk output at more than 50 percent. For RS, 70 percent of milk produc on is generated by Prijedor, Bijeljina and Doboj districts, with more than half of that produced in Prijedor district.
Development since 2005 shows clear changes, which are tabulated below.
The table illustrates that overall, the following changes have occurred in Republika Srpska: Milking cow popula on over the period has reduced by 8.3 percent,
Table 4.4: Five years analysis from 2005 –Republika Srpska
Year Number of cows
Annual or 5-year change
Milk produc on
Annual change
Milk yield/cow
Annual or 5-year change
2005 155,900 - 302 m litres - 1,935 litres -2006 152,200 - 2.4% 331 m litres + 9.6% 2,172 litres + 12.2%2007 154,400 + 1.4% 401 m litres + 21.3% 2,597 litres + 19.6%2008 144,200 - 6.6% 405 m litres + 1.0% 2,809 litres + 8.2%2009 143,000 - 0.8% 405 m litres + 0.0% 2,833 litres + 0.9%
2009/05 - 8.3% + 34.3% + 46.4%Source: Sta s cal Agency of BiH
Table 4.5: Five years analysis from 2005 – Federa on of BiH
Year Number of cows
Annual or 5-year change
Milk produc on
Annual change
Milk yield/cow
Annual or 5-year change
2005 156,900 - 305 m litres - 1,947 litres -
2006 157,600 + 0.4% 312 m litres + 2.3% 1,969 litres + 1.1%
2007 150,200 - 4.7% 313 m litres + 0.4% 2,088 litres + 6.0%
2008 150,000 - 0.1% 322 m litres +2.8% 2,188 litres + 4.8%
2009 148,400 - 1.1% 321 m litres - 0.3% 2,163 litres - 1.1%
2009/05 - 5.4% + 5.3% + 11.1%Source: Sta s cal Agency of BiH
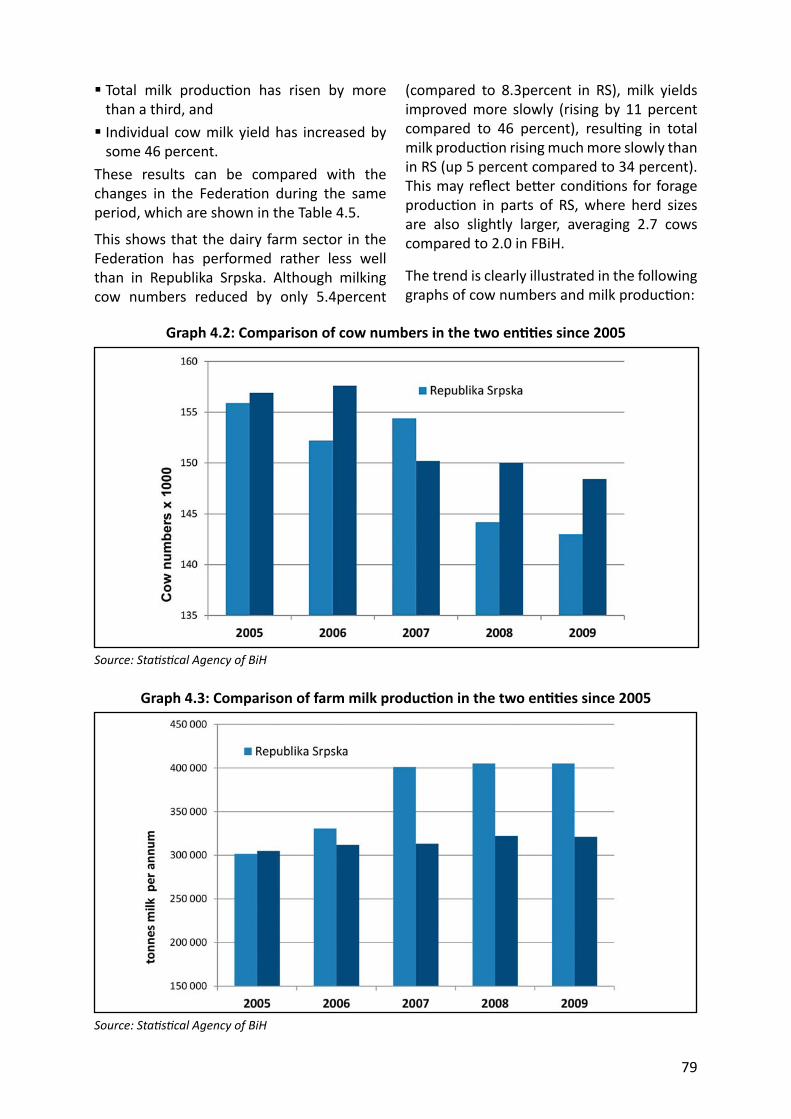
79
Total milk produc on has risen by more than a third, and Individual cow milk yield has increased by some 46 percent.
These results can be compared with the changes in the Federa on during the same period, which are shown in the Table 4.5.
This shows that the dairy farm sector in the Federa on has performed rather less well than in Republika Srpska. Although milking cow numbers reduced by only 5.4percent
(compared to 8.3percent in RS), milk yields improved more slowly (rising by 11 percent compared to 46 percent), resul ng in total milk produc on rising much more slowly than in RS (up 5 percent compared to 34 percent). This may refl ect be er condi ons for forage produc on in parts of RS, where herd sizes are also slightly larger, averaging 2.7 cows compared to 2.0 in FBiH.
The trend is clearly illustrated in the following graphs of cow numbers and milk produc on:
Graph 4.2: Comparison of cow numbers in the two en es since 2005
Source: Sta s cal Agency of BiH
Graph 4.3: Comparison of farm milk produc on in the two en es since 2005
Source: Sta s cal Agency of BiH
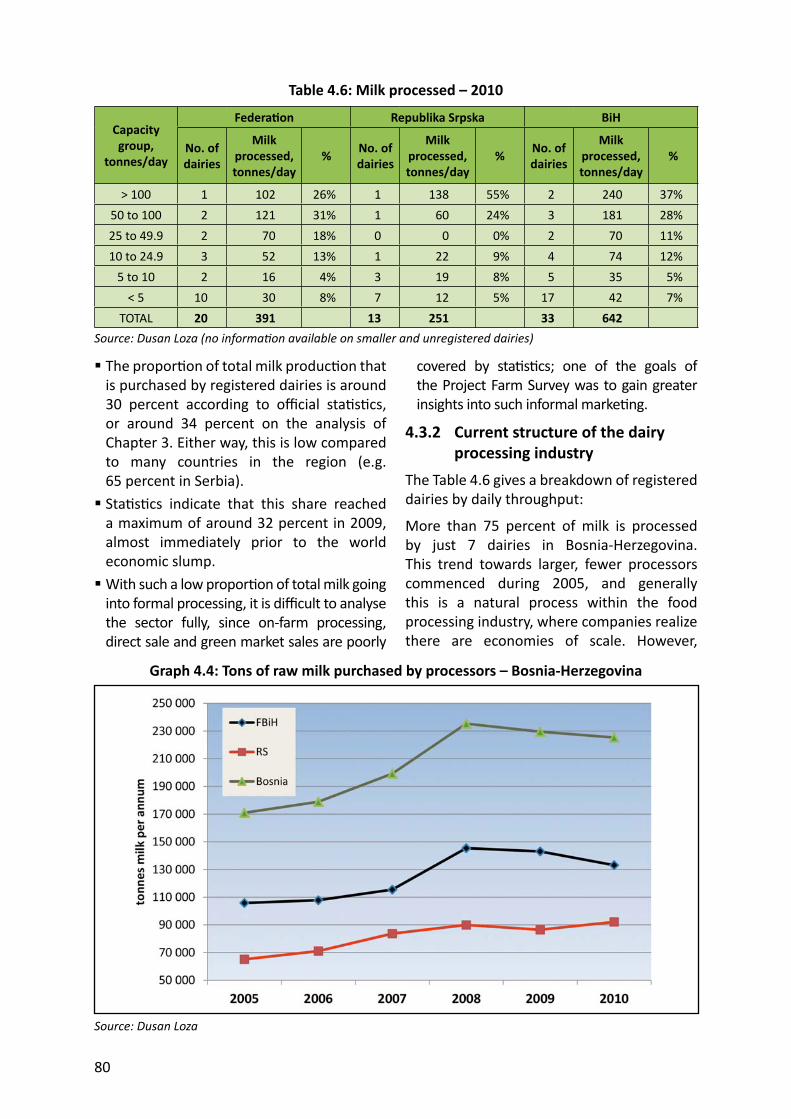
80
The propor on of total milk produc on that is purchased by registered dairies is around 30 percent according to offi cial sta s cs, or around 34 percent on the analysis of Chapter 3. Either way, this is low compared to many countries in the region (e.g. 65 percent in Serbia). Sta s cs indicate that this share reached a maximum of around 32 percent in 2009, almost immediately prior to the world economic slump. With such a low propor on of total milk going into formal processing, it is diffi cult to analyse the sector fully, since on-farm processing, direct sale and green market sales are poorly
Table 4.6: Milk processed – 2010
Capacity group,
tonnes/day
Federa on Republika Srpska BiH
No. of dairies
Milk processed, tonnes/day
% No. of dairies
Milk processed, tonnes/day
% No. of dairies
Milk processed, tonnes/day
%
> 100 1 102 26% 1 138 55% 2 240 37%50 to 100 2 121 31% 1 60 24% 3 181 28%25 to 49.9 2 70 18% 0 0 0% 2 70 11%10 to 24.9 3 52 13% 1 22 9% 4 74 12%
5 to 10 2 16 4% 3 19 8% 5 35 5%< 5 10 30 8% 7 12 5% 17 42 7%
TOTAL 20 391 13 251 33 642 Source: Dusan Loza (no informa on available on smaller and unregistered dairies)
covered by sta s cs; one of the goals of the Project Farm Survey was to gain greater insights into such informal marke ng.
4.3.2 Current structure of the dairy processing industry
The Table 4.6 gives a breakdown of registered dairies by daily throughput:
More than 75 percent of milk is processed by just 7 dairies in Bosnia-Herzegovina. This trend towards larger, fewer processors commenced during 2005, and generally this is a natural process within the food processing industry, where companies realize there are economies of scale. However,
Graph 4.4: Tons of raw milk purchased by processors – Bosnia-Herzegovina
Source: Dusan Loza
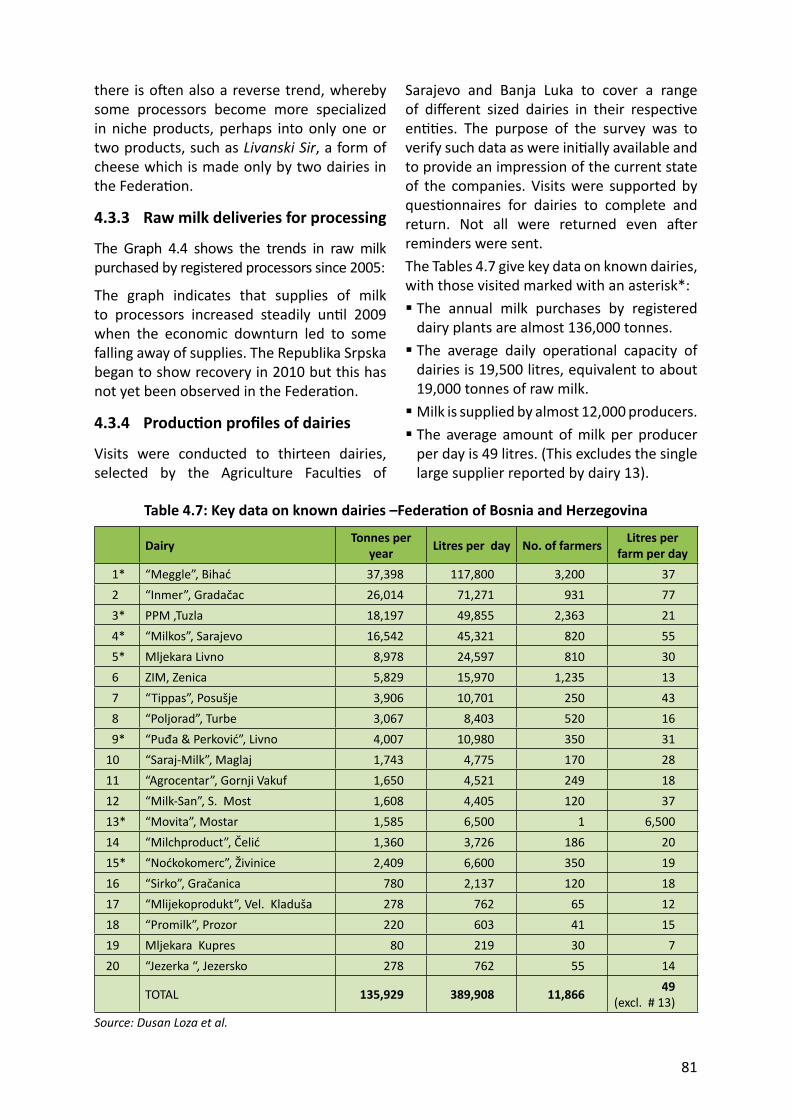
81
there is o en also a reverse trend, whereby some processors become more specialized in niche products, perhaps into only one or two products, such as Livanski Sir, a form of cheese which is made only by two dairies in the Federa on.
4.3.3 Raw milk deliveries for processing
The Graph 4.4 shows the trends in raw milk purchased by registered processors since 2005:
The graph indicates that supplies of milk to processors increased steadily un l 2009 when the economic downturn led to some falling away of supplies. The Republika Srpska began to show recovery in 2010 but this has not yet been observed in the Federa on.
4.3.4 Produc on profi les of dairies
Visits were conducted to thirteen dairies, selected by the Agriculture Facul es of
Table 4.7: Key data on known dairies –Federa on of Bosnia and Herzegovina
Dairy Tonnes per year Litres per day No. of farmers Litres per
farm per day 1* “Meggle”, Bihać 37,398 117,800 3,200 37 2 “Inmer”, Gradačac 26,014 71,271 931 77 3* PPM ,Tuzla 18,197 49,855 2,363 21 4* “Milkos”, Sarajevo 16,542 45,321 820 55 5* Mljekara Livno 8,978 24,597 810 30 6 ZIM, Zenica 5,829 15,970 1,235 13 7 “Tippas”, Posušje 3,906 10,701 250 43 8 “Poljorad”, Turbe 3,067 8,403 520 16 9* “Puđa & Perković”, Livno 4,007 10,980 350 3110 “Saraj-Milk”, Maglaj 1,743 4,775 170 2811 “Agrocentar”, Gornji Vakuf 1,650 4,521 249 1812 “Milk-San”, S. Most 1,608 4,405 120 3713* “Movita”, Mostar 1,585 6,500 1 6,50014 “Milchproduct”, Čelić 1,360 3,726 186 2015* “Noćkokomerc”, Živinice 2,409 6,600 350 1916 “Sirko”, Gračanica 780 2,137 120 1817 “Mlijekoprodukt”, Vel. Kladuša 278 762 65 1218 “Promilk”, Prozor 220 603 41 1519 Mljekara Kupres 80 219 30 720 “Jezerka “, Jezersko 278 762 55 14
TOTAL 135,929 389,908 11,866 49(excl. # 13)
Source: Dusan Loza et al.
Sarajevo and Banja Luka to cover a range of diff erent sized dairies in their respec ve en es. The purpose of the survey was to verify such data as were ini ally available and to provide an impression of the current state of the companies. Visits were supported by ques onnaires for dairies to complete and return. Not all were returned even a er reminders were sent.The Tables 4.7 give key data on known dairies, with those visited marked with an asterisk*: The annual milk purchases by registered dairy plants are almost 136,000 tonnes. The average daily opera onal capacity of dairies is 19,500 litres, equivalent to about 19,000 tonnes of raw milk. Milk is supplied by almost 12,000 producers. The average amount of milk per producer per day is 49 litres. (This excludes the single large supplier reported by dairy 13).
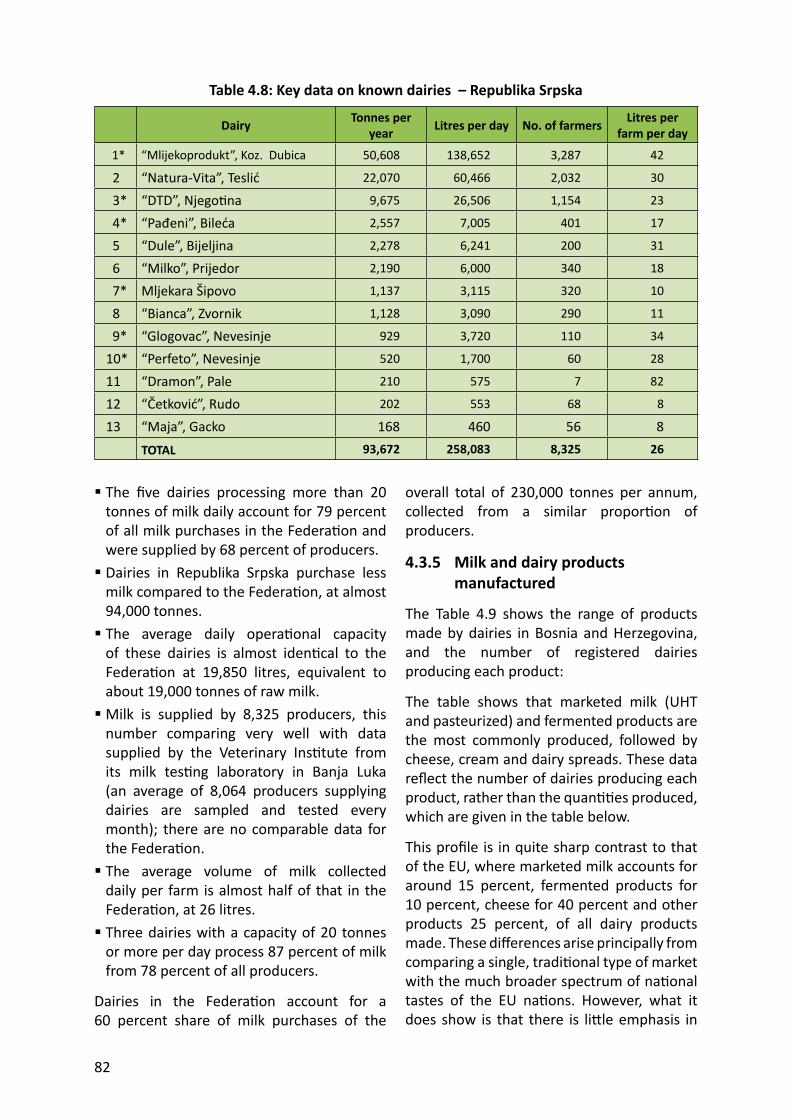
82
The fi ve dairies processing more than 20 tonnes of milk daily account for 79 percent of all milk purchases in the Federa on and were supplied by 68 percent of producers. Dairies in Republika Srpska purchase less milk compared to the Federa on, at almost 94,000 tonnes. The average daily opera onal capacity of these dairies is almost iden cal to the Federa on at 19,850 litres, equivalent to about 19,000 tonnes of raw milk. Milk is supplied by 8,325 producers, this number comparing very well with data supplied by the Veterinary Ins tute from its milk tes ng laboratory in Banja Luka (an average of 8,064 producers supplying dairies are sampled and tested every month); there are no comparable data for the Federa on. The average volume of milk collected daily per farm is almost half of that in the Federa on, at 26 litres. Three dairies with a capacity of 20 tonnes or more per day process 87 percent of milk from 78 percent of all producers.
Dairies in the Federa on account for a 60 percent share of milk purchases of the
Table 4.8: Key data on known dairies – Republika Srpska
Dairy Tonnes per year Litres per day No. of farmers Litres per
farm per day
1* “Mlijekoprodukt”, Koz. Dubica 50,608 138,652 3,287 42
2 “Natura-Vita”, Teslić 22,070 60,466 2,032 30
3* “DTD”, Njego na 9,675 26,506 1,154 23
4* “Pađeni”, Bileća 2,557 7,005 401 17
5 “Dule”, Bijeljina 2,278 6,241 200 31
6 “Milko”, Prijedor 2,190 6,000 340 18
7* Mljekara Šipovo 1,137 3,115 320 10
8 “Bianca”, Zvornik 1,128 3,090 290 11
9* “Glogovac”, Nevesinje 929 3,720 110 34
10* “Perfeto”, Nevesinje 520 1,700 60 28
11 “Dramon”, Pale 210 575 7 82
12 “Četković”, Rudo 202 553 68 8
13 “Maja”, Gacko 168 460 56 8 TOTAL 93,672 258,083 8,325 26
overall total of 230,000 tonnes per annum, collected from a similar propor on of producers.
4.3.5 Milk and dairy products manufactured
The Table 4.9 shows the range of products made by dairies in Bosnia and Herzegovina, and the number of registered dairies producing each product:
The table shows that marketed milk (UHT and pasteurized) and fermented products are the most commonly produced, followed by cheese, cream and dairy spreads. These data refl ect the number of dairies producing each product, rather than the quan es produced, which are given in the table below.
This profi le is in quite sharp contrast to that of the EU, where marketed milk accounts for around 15 percent, fermented products for 10 percent, cheese for 40 percent and other products 25 percent, of all dairy products made. These diff erences arise principally from comparing a single, tradi onal type of market with the much broader spectrum of na onal tastes of the EU na ons. However, what it does show is that there is li le emphasis in
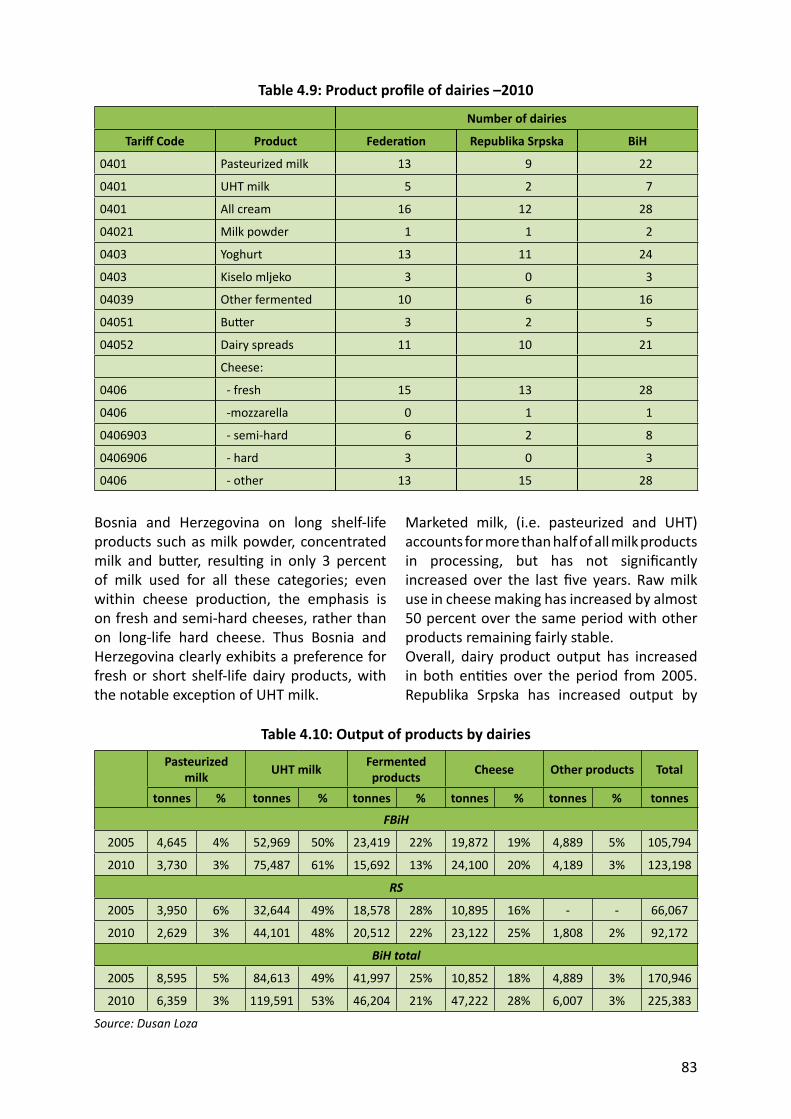
83
Bosnia and Herzegovina on long shelf-life products such as milk powder, concentrated milk and bu er, resul ng in only 3 percent of milk used for all these categories; even within cheese produc on, the emphasis is on fresh and semi-hard cheeses, rather than on long-life hard cheese. Thus Bosnia and Herzegovina clearly exhibits a preference for fresh or short shelf-life dairy products, with the notable excep on of UHT milk.
Table 4.9: Product profi le of dairies –2010
Number of dairies
Tariff Code Product Federa on Republika Srpska BiH
0401 Pasteurized milk 13 9 22
0401 UHT milk 5 2 7
0401 All cream 16 12 28
04021 Milk powder 1 1 2
0403 Yoghurt 13 11 24
0403 Kiselo mljeko 3 0 3
04039 Other fermented 10 6 16
04051 Bu er 3 2 5
04052 Dairy spreads 11 10 21
Cheese:
0406 - fresh 15 13 28
0406 -mozzarella 0 1 1
0406903 - semi-hard 6 2 8
0406906 - hard 3 0 3
0406 - other 13 15 28
Table 4.10: Output of products by dairies
Pasteurized milk UHT milk Fermented
products Cheese Other products Total
tonnes % tonnes % tonnes % tonnes % tonnes % tonnes
FBiH
2005 4,645 4% 52,969 50% 23,419 22% 19,872 19% 4,889 5% 105,794
2010 3,730 3% 75,487 61% 15,692 13% 24,100 20% 4,189 3% 123,198
RS
2005 3,950 6% 32,644 49% 18,578 28% 10,895 16% - - 66,067
2010 2,629 3% 44,101 48% 20,512 22% 23,122 25% 1,808 2% 92,172
BiH total
2005 8,595 5% 84,613 49% 41,997 25% 10,852 18% 4,889 3% 170,946
2010 6,359 3% 119,591 53% 46,204 21% 47,222 28% 6,007 3% 225,383
Source: Dusan Loza
Marketed milk, (i.e. pasteurized and UHT) accounts for more than half of all milk products in processing, but has not signifi cantly increased over the last fi ve years. Raw milk use in cheese making has increased by almost 50 percent over the same period with other products remaining fairly stable.Overall, dairy product output has increased in both en es over the period from 2005. Republika Srpska has increased output by
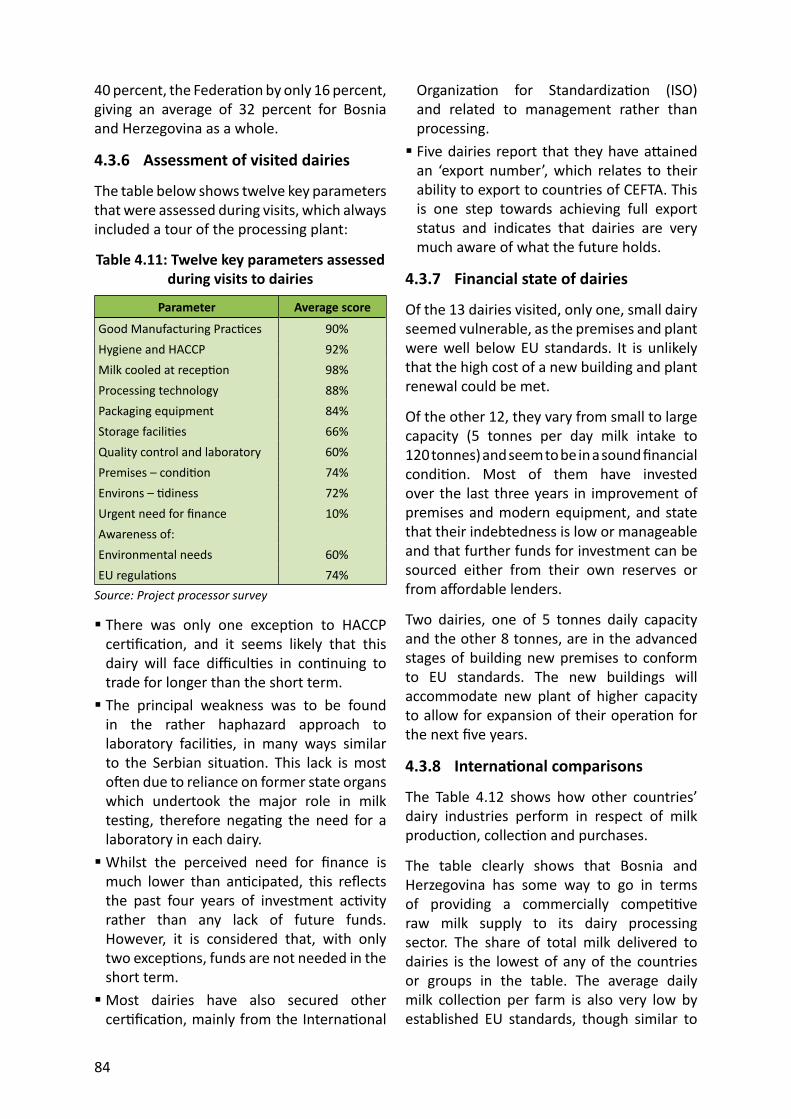
84
40 percent, the Federa on by only 16 percent, giving an average of 32 percent for Bosnia and Herzegovina as a whole.
4.3.6 Assessment of visited dairies
The table below shows twelve key parameters that were assessed during visits, which always included a tour of the processing plant:
Table 4.11: Twelve key parameters assessed during visits to dairies
Parameter Average score
Good Manufacturing Prac ces 90%Hygiene and HACCP 92%Milk cooled at recep on 98%Processing technology 88%Packaging equipment 84%Storage facili es 66%Quality control and laboratory 60%Premises – condi on 74%Environs – diness 72%Urgent need for fi nance 10%Awareness of:Environmental needs 60%EU regula ons 74%
Source: Project processor survey
There was only one excep on to HACCP cer fi ca on, and it seems likely that this dairy will face diffi cul es in con nuing to trade for longer than the short term. The principal weakness was to be found in the rather haphazard approach to laboratory facili es, in many ways similar to the Serbian situa on. This lack is most o en due to reliance on former state organs which undertook the major role in milk tes ng, therefore nega ng the need for a laboratory in each dairy. Whilst the perceived need for fi nance is much lower than an cipated, this refl ects the past four years of investment ac vity rather than any lack of future funds. However, it is considered that, with only two excep ons, funds are not needed in the short term. Most dairies have also secured other cer fi ca on, mainly from the Interna onal
Organiza on for Standardiza on (ISO) and related to management rather than processing. Five dairies report that they have a ained an ‘export number’, which relates to their ability to export to countries of CEFTA. This is one step towards achieving full export status and indicates that dairies are very much aware of what the future holds.
4.3.7 Financial state of dairies
Of the 13 dairies visited, only one, small dairy seemed vulnerable, as the premises and plant were well below EU standards. It is unlikely that the high cost of a new building and plant renewal could be met.
Of the other 12, they vary from small to large capacity (5 tonnes per day milk intake to 120 tonnes) and seem to be in a sound fi nancial condi on. Most of them have invested over the last three years in improvement of premises and modern equipment, and state that their indebtedness is low or manageable and that further funds for investment can be sourced either from their own reserves or from aff ordable lenders.
Two dairies, one of 5 tonnes daily capacity and the other 8 tonnes, are in the advanced stages of building new premises to conform to EU standards. The new buildings will accommodate new plant of higher capacity to allow for expansion of their opera on for the next fi ve years.
4.3.8 Interna onal comparisons
The Table 4.12 shows how other countries’ dairy industries perform in respect of milk produc on, collec on and purchases.
The table clearly shows that Bosnia and Herzegovina has some way to go in terms of providing a commercially compe ve raw milk supply to its dairy processing sector. The share of total milk delivered to dairies is the lowest of any of the countries or groups in the table. The average daily milk collec on per farm is also very low by established EU standards, though similar to
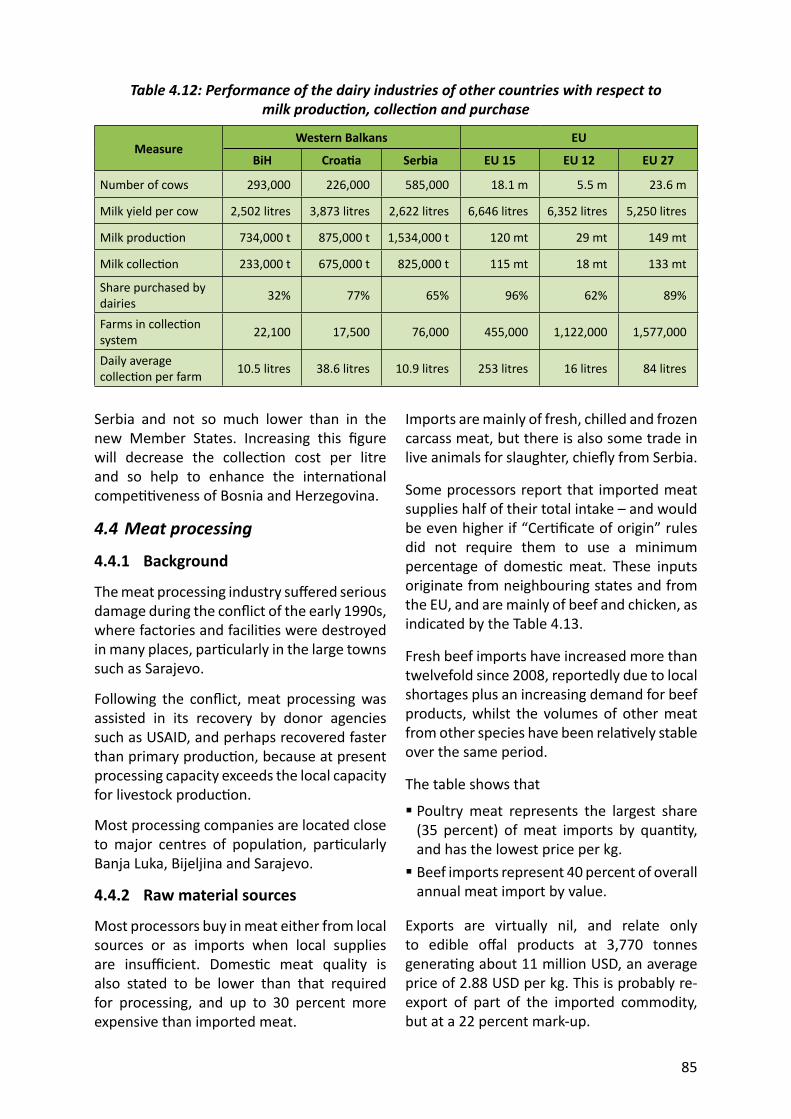
85
Serbia and not so much lower than in the new Member States. Increasing this fi gure will decrease the collec on cost per litre and so help to enhance the interna onal compe veness of Bosnia and Herzegovina.
4.4 Meat processing
4.4.1 Background
The meat processing industry suff ered serious damage during the confl ict of the early 1990s, where factories and facili es were destroyed in many places, par cularly in the large towns such as Sarajevo.
Following the confl ict, meat processing was assisted in its recovery by donor agencies such as USAID, and perhaps recovered faster than primary produc on, because at present processing capacity exceeds the local capacity for livestock produc on.
Most processing companies are located close to major centres of popula on, par cularly Banja Luka, Bijeljina and Sarajevo.
4.4.2 Raw material sources
Most processors buy in meat either from local sources or as imports when local supplies are insuffi cient. Domes c meat quality is also stated to be lower than that required for processing, and up to 30 percent more expensive than imported meat.
Table 4.12: Performance of the dairy industries of other countries with respect to milk produc on, collec on and purchase
MeasureWestern Balkans EU
BiH Croa a Serbia EU 15 EU 12 EU 27
Number of cows 293,000 226,000 585,000 18.1 m 5.5 m 23.6 m
Milk yield per cow 2,502 litres 3,873 litres 2,622 litres 6,646 litres 6,352 litres 5,250 litres
Milk produc on 734,000 t 875,000 t 1,534,000 t 120 mt 29 mt 149 mt
Milk collec on 233,000 t 675,000 t 825,000 t 115 mt 18 mt 133 mt
Share purchased by dairies 32% 77% 65% 96% 62% 89%
Farms in collec on system 22,100 17,500 76,000 455,000 1,122,000 1,577,000
Daily average collec on per farm 10.5 litres 38.6 litres 10.9 litres 253 litres 16 litres 84 litres
Imports are mainly of fresh, chilled and frozen carcass meat, but there is also some trade in live animals for slaughter, chiefl y from Serbia.
Some processors report that imported meat supplies half of their total intake – and would be even higher if “Cer fi cate of origin” rules did not require them to use a minimum percentage of domes c meat. These inputs originate from neighbouring states and from the EU, and are mainly of beef and chicken, as indicated by the Table 4.13.
Fresh beef imports have increased more than twelvefold since 2008, reportedly due to local shortages plus an increasing demand for beef products, whilst the volumes of other meat from other species have been rela vely stable over the same period.
The table shows that
Poultry meat represents the largest share (35 percent) of meat imports by quan ty, and has the lowest price per kg. Beef imports represent 40 percent of overall annual meat import by value.
Exports are virtually nil, and relate only to edible off al products at 3,770 tonnes genera ng about 11 million USD, an average price of 2.88 USD per kg. This is probably re-export of part of the imported commodity, but at a 22 percent mark-up.
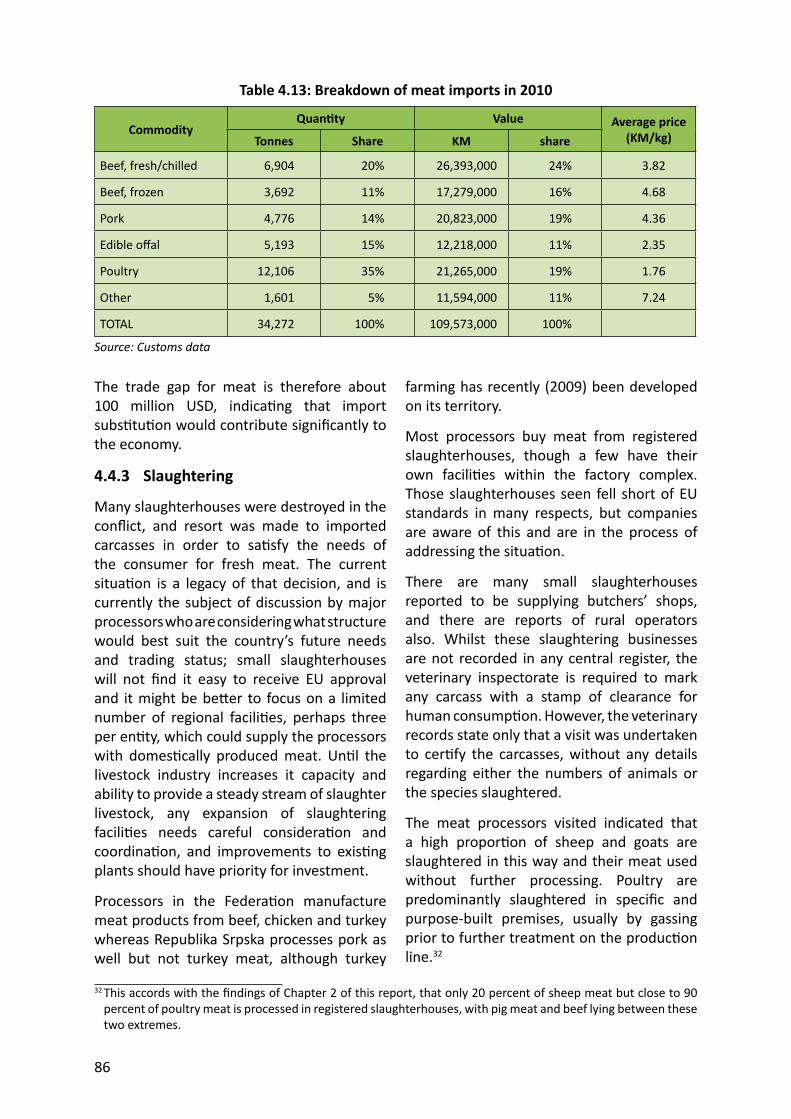
86
The trade gap for meat is therefore about 100 million USD, indica ng that import subs tu on would contribute signifi cantly to the economy.
4.4.3 Slaughtering
Many slaughterhouses were destroyed in the confl ict, and resort was made to imported carcasses in order to sa sfy the needs of the consumer for fresh meat. The current situa on is a legacy of that decision, and is currently the subject of discussion by major processors who are considering what structure would best suit the country’s future needs and trading status; small slaughterhouses will not fi nd it easy to receive EU approval and it might be be er to focus on a limited number of regional facili es, perhaps three per en ty, which could supply the processors with domes cally produced meat. Un l the livestock industry increases it capacity and ability to provide a steady stream of slaughter livestock, any expansion of slaughtering facili es needs careful considera on and coordina on, and improvements to exis ng plants should have priority for investment.
Processors in the Federa on manufacture meat products from beef, chicken and turkey whereas Republika Srpska processes pork as well but not turkey meat, although turkey
Table 4.13: Breakdown of meat imports in 2010
CommodityQuan ty Value Average price
(KM/kg)Tonnes Share KM share
Beef, fresh/chilled 6,904 20% 26,393,000 24% 3.82
Beef, frozen 3,692 11% 17,279,000 16% 4.68
Pork 4,776 14% 20,823,000 19% 4.36
Edible off al 5,193 15% 12,218,000 11% 2.35
Poultry 12,106 35% 21,265,000 19% 1.76
Other 1,601 5% 11,594,000 11% 7.24
TOTAL 34,272 100% 109,573,000 100%
Source: Customs data
farming has recently (2009) been developed on its territory.
Most processors buy meat from registered slaughterhouses, though a few have their own facili es within the factory complex. Those slaughterhouses seen fell short of EU standards in many respects, but companies are aware of this and are in the process of addressing the situa on.
There are many small slaughterhouses reported to be supplying butchers’ shops, and there are reports of rural operators also. Whilst these slaughtering businesses are not recorded in any central register, the veterinary inspectorate is required to mark any carcass with a stamp of clearance for human consump on. However, the veterinary records state only that a visit was undertaken to cer fy the carcasses, without any details regarding either the numbers of animals or the species slaughtered.
The meat processors visited indicated that a high propor on of sheep and goats are slaughtered in this way and their meat used without further processing. Poultry are predominantly slaughtered in specifi c and purpose-built premises, usually by gassing prior to further treatment on the produc on line.32
32 This accords with the fi ndings of Chapter 2 of this report, that only 20 percent of sheep meat but close to 90 percent of poultry meat is processed in registered slaughterhouses, with pig meat and beef lying between these two extremes.
87
Slaughter in the Federa on is according to Halal procedures, whereas Republika Srpska has no need to do so. Halal is a term assigned to an ar cle or procedure which is permissible for use according to Islamic law. The term is not confi ned to animal slaughtering procedures but is applied in a manner similar to kosher. Halal is defi ned as “permissible” in rela on to an object or procedure, whereas the method of slaughtering an animal is known as dhabiha. This procedure consists of using a well-sharpened knife to make a swi , deep incision that cuts the front of the throat, the caro d artery, trachea and jugular veins but leaves the spinal cord intact.
Slaughterhouse waste
There is no detailed record of the disposal of waste material from slaughterhouses, the majority of which are capable of handling only up to 60 head per day. Slaughterhouse waste needs to be collected and either incinerated or processed in a recovery or rendering plant, to eliminate pollu on and add value from the subsequent by-products recovered.
Data from the sta s cal offi ce in Republika Srpska indicate that about 300 tonnes of slaughterhouse waste is processed or otherwise recovered, as skins or hides and melted fat of pigs, sheep and beef. This represents a small por on of what might be expected from the produc on of more than 100,000 tonnes of meat per year.1
The ques on of safe disposal of slaughterhouse and other animal wastes was addressed at length in a 2005 study funded by the EU CARDS programme.2 BiH adopted a waste management strategy in 2000 and had by 2005 already adopted EU-harmonized laws on waste management and on air protec on, with the study no ng that further legisla ve work was needed to implement other relevant aspects of the acquis, such as Direc ve EC 1774/2002 on animal by-products. The
33 Total meat produc on by registered slaughterhouses was es mated as 115,000 tonnes: 32,000 tonnes beef; 4,000 tonnes sheep meat; 24,000 tonnes pig meat; 55,000 tonnes poultry meat.
34 “ANIWASTE: The integral solving of waste problem from farms and slaughterhouses in NW BiH region –Feasibility study”, Agency for Development of Small and Medium Enterprises Srbac – APIS, 2005.
study concluded that the following solu ons were likely to be most cost-eff ec ve in Bosnia and Herzegovina: Solid slaughterhouse waste: Incinera on on-site at larger slaughterhouses, with a municipal or state service to collect and incinerate waste from smaller slaughterhouses. Contaminated water from slaughterhouses:• minimize the quan ty of contaminated
water by processing blood into usable by-products and by keeping uncontaminated cooling water separate from contaminated wash water and sterilizing water;
• then treat on-site to make it safe for discharge into the public sewage system.
Poultry waste (dead poultry): Incinera on on-site at the large commercial poultry farms which dominate this sector. Fallen stock (other than poultry): Collec on and incinera on by the municipal or state service handling waste from smaller slaughterhouses.
Unfortunately li le progress has been made in implemen ng these recommenda ons, and so Bosnia and Herzegovina is s ll without an adequate solu on to the problem of disposing safely of slaughterhouse waste and fallen stock.
4.4.4 Processing plants
There are only 20 known meat processors in Bosnia and Herzegovina, mostly with small- to medium-scale opera ons producing 5 to 30 tonnes of product per day. The total annual output of all processed meat products is es mated to be about 18,000 tonnes, according to sources within the industry; this represents around 12 percent of the total supply of meat from registered slaughterhouses and imports. Ques onnaires were sent in advance to those selected for
88
visits and to all others to record their key data. The response was very low and only four ques onnaires were completed and returned.
With one excep on, the seven meat processors visited were all well equipped in clean, modern premises to produce the tradi onal variety of Balkan products (see sec on 4.4.5 below). The expected equipment for meat prepara on and subsequent processing was present, though the processes are reliant on a high level of manual labour compared to dairies, for example. This is partly due to the batch nature of meat processing, as meat does not lend itself readily to con nuous and mechanized processing. Also, as meat processing in Bosnia and Herzegovina is rela vely small scale, more automated technology might be neither appropriate nor aff ordable.
All visited processors display HACCP cer fi ca on, but there is some doubt that all the prescrip ons are suffi ciently respected, par cularly in general cleanliness of the manufacturing area and in one case in the condi on of employees’ protec ve clothing.
Four companies are in the process of upgrading their processing or slaughtering facili es, but the current economic situa on is causing them some delay.
All of them are aware of the EU requirements and are in the process of implemen ng the necessary measures.
The highest cost item is reported in respect of raw material, (in one case as much as 75 percent of total expenses) where carcass quality is paramount to the produc on of processed food.
Processors with adjacent slaughtering facili es usually market fresh meat as well, which requires a fresh meat area in the factory separated from the processing plant, to conform to regula ons. The slaughterhouse is also isolated from the factory processing area with no common entrance or exit and separate staff .
Waste material is collected by the local authority, as a separate category of waste, for fi nal disposal.
4.4.5 Product range
The types of tradi onal product commonly produced include: Cooked sausages; Short shelf-life sausages; Long shelf-life sausages, usually smoked; Sliced meat; Meat paste; Mortadella; Smoked meat; Bacon; Dried meat; Salami; Pork fat; “Pršut” ham.
The products are made from beef, pork, chicken and turkey, and usually packed in a rac vely printed, clear plas c pouches which are vacuum-packed and sealed, though products off ered at high net weight, such as 5–7 kg may be without such outer packaging. In Republika Srpska, data suggest that 75 percent of meat products are from beef and veal, with diff erent varie es of sausages being by far the most common product.
Product shelf-life varies between 7 and 180 days according to variety, with some products requiring ageing in the factory for up to 90 days. These matured products entail having cash ed up un l the point of sale three months later, a risk which is accepted as necessary in sa sfying market demand.
Companies produce at least 40 diff erent product lines (one markets 90), though many of these are simply diff erent net weight packages of the same product.
Smoked products can be either cold or hot smoked, and are o en off ered as both varie es.
One company producing a small range of goulash and meat paste products uses only ns for packaging, and uses only boneless
89
meat as raw material for ease of processing and to minimize wastage.
4.4.6 The market
The domes c market consists almost en rely of tradi onal Balkan products as outlined above. Imports from TfYR Macedonia, Croa a and other neighbours are mainly of a similar type.
In common with other processed foods, such as dairy products and fruit and vegetables, it appears that there is hardly any penetra on of the market by European-style meat products, indica ng that the domes c market is strongly tradi onal in its requirements.
Exports go chiefl y to CEFTA countries, where export cer fi ca on has been granted. Three companies have arranged exports to neighbouring EU countries by the expedient of sister businesses, in Austria for example, although the procedure was not fully explained. (This vagueness also applied when fi nancial ma ers were discussed, so all fi gures quoted should be viewed in this context).
Companies complain of “anarchy” when discussing foreign trade of meat and meat products, and consider that the government should be more protec onist and also introduce export subsidies. It was claimed that Bosnia and Herzegovina is the only CEFTA member not to provide export subsidies, thereby placing its exporters at a compe ve disadvantage compared to the other countries.
4.4.7 Management and fi nance
The majority of businesses are private and family owned, o en with a long tradi on of meat butchering and processing. They exhibit a professional approach to management and marke ng, and each company has an air of prosperity which gives hope for the future of the industry.
Annual turnovers are said to be up to 15 million KM for a plant producing 30 tonnes of product per day. This corresponds quite well with a fi gure of 5.5 million KM by a company
with an output of 8 tonnes per day. Turnovers of this scale should allow for confi dence in inves ng for the future, and most businesses have planned for some addi ons or improvements. These include: The establishment of large-scale animal produc on (pigs and beef) together with slaughterhouse and rendering plant; Equipment for cold smoking; Effl uent treatment plant; New processing premises to EU standards.
It is diffi cult to escape the view of op mism that these companies project, and if successful these enterprises will represent the future of meat processing in Bosnia and Herzegovina.
4.4.8 Meat processing survey
The processor survey was designed to include meat processors as well as dairies, and ques onnaires were sent in advance to fi een meat processors. Only four of these ques onnaires were completed and returned, and meat processors were generally reluctant to reveal any fi nancial data either through the ques onnaires or during the visits.
Slaughterhouses
In the two cases where there was a red meat slaughterhouse a ached to the meat plant being visited, the operators stated that these were not up to the required standard and not suitable for a visit. However, one poultry slaughterhouse did complete the ques onnaire, and the key points are given below: The unit has been in opera on since 2006 and employs more than 200 staff to handle about 2,200 chickens per hour, which represents just under half of the design capacity. The company processes broilers which are over 90 percent locally produced. The total intake of birds for 2010 was reckoned to be approximately 15,000 tonnes, at an average price of 1.86 KM/kg for local birds and 1.97 KM/kg for the small amount of imports.
90
The factory operates under full HACCP and is cer fi ed to slaughter according to Halal prac ces.
All factory effl uent is treated on site.
The products comprise both fresh and frozen tradi onal cuts, and are mainly sold into the local market.
There have been signifi cant recent investments of about 4.2 million KM, mainly in plant and equipment, and a further 5.1 million KM is planned for the next phase of investment.
Meat processing plants
Six meat processors were visited, with the view to assess the current status of the industry and its needs in progress towards EU accession.
In general, meat processing is small-scale compared to EU na ons, with factories producing from 5 to 30 tonnes of product per day.
Processors showed awareness of the needs for the future as well as suffi cient knowledge and experience of their businesses. Companies have achieved HACCP cer fi ca on as well as management cer fi ca on such as ISO. Meat processors in the Federa on do not process pork meat, although some pork products are available on the market.
Raw material supply
Most processors import meat from neighbouring countries, and some also from the EU, due to the lack of suffi cient local supplies and reportedly indiff erent quality. Certainly, the trade defi cit of more than USD 100 million indicates that the primary livestock sector in Bosnia and Herzegovina is insuffi cient to sa sfy domes c demand.
Up to fi y diff erent ingredients are used in meat prepara ons, and many of these also need to be imported. The industry is signifi cantly dependent on imports, indica ng opportuni es for import subs tu on if the livestock sector can rise to the challenge.
Product range
With only one excep on, processors produce a virtually iden cal range of products, which are diff eren ated mainly according to pack labelling and product branding. Packaging is a rac ve, extremely durable and performed using modern materials and packing machinery.
The range of product is targeted to the domes c market, plus countries within the CEFTA trading group, which also compete on the BiH market with their imports. Future expansion into other markets, for example in the EU, is likely to require widening and adapta on of the product range.
Processors iden fi ed raw material as their highest single cost, as much as 60 percent of total costs in one or two cases. Beef is the most popular raw material for processing, although poultry meat is increasing in its popularity and product range. For example, one processor sources turkey meat within Bosnia and Herzegovina and has successfully introduced a unique range of smoked and sausage products based on turkey.
Much of the processed meat output is of sausages, both short and long shelf-life (up to 120 days). Dried and smoked meats are also popular and there is a variety of “pasteta” (paté) products. Plants that make a high propor on of long shelf-life and slow-maturing products are more vulnerable to cash fl ow diffi cul es, yet companies do not complain of serious outstanding creditors.
One or two factories also manufacture canned meat products, using retort-sterilizers for goulash and similar products. Cans are imported ready-printed from Serbia and Croa a. Some processors only use frozen raw material, o en boneless, thus reducing their levels of waste.
Investment plans
Companies are increasingly looking to invest in cold-smoking technology to complement the more usual hot-smoking and many have already invested in new buildings and machinery. There is an atmosphere of
91
progress and a lack of “fear of the future” within the factories visited, most of which are family owned, some of them for more than two genera ons.
Two companies are in the process of establishing their own farms for producing livestock, to give control over the supply, price and quality of the raw material. In one case, they are looking at rearing 1,000 beef ca le and producing 20,000 pigs per annum.
The annual turnover of plants clearly is related to their output and product range, but for an output of around 1,000 tonnes of meat, 12 million KM has been indicated. This company has also prepared plans for building of a new slaughterhouse and waste rendering plant, and is seeking funds of some EUR 3.5 million.
4.5 Conclusions
In many respects, the meat and milk processing sector in BiH has made signifi cant achievements in rebuilding and developing a er the confl icts of the 1990s, though there are s ll a number of weak or underdeveloped areas that require further a en on:
Achievements
The processors consist of a vibrant group of mainly family businesses, and those that are owned by foreign investors are also secure and sustainable.
Premises – except those for the slaughter of red meat – are in excellent condi on, packaging is a rac ve and modern, and product quality is regularly monitored and presents no major challenges.
All but two of the nineteen processors is opera ng at sustainable capacity and producing products that are readily accepted by the local market, which forms at least 90 percent of their overall market.
Bosnia and Herzegovina’s dairy industry has responded well considering the general lack of government support in terms of legisla on and control. Private ini a ves have forged a fl ourishing processing sector, concentra ng
ini ally on local product requirements, but with clear evidence now of looking at compe on from imports of more specialized products.
Import of raw materials
The signifi cant role played by imported raw materials for the meat industry can be seen as a strength (by adding value and crea ng jobs in the processing sector) or as a weakness (in terms of balance of trade and possible missed opportuni es by the farm sector). Either way, it is a current fact, though it is important to note that import of raw material is confi ned almost en rely to the meat processing industry, with just a very small cross-border trade in raw milk.
Areas for further development
There is a general lack of environmental awareness in respect of effl uent treatment and disposal, and a need to develop a programme to reduce the waste of raw material, especially in meat processing. However, the import of frozen meat for further processing does result in a lower propor on of waste.
The reclama on of waste from both slaughtering and processing is poorly developed, resul ng in lost opportunity for the produc on of dried blood, rendered fat and gela ne, which would add to profi tability of the businesses.
The rela vely unsophis cated product range, especially in dairy products, renders export poten al of a low order and confi ned to CEFTA members. Product development and sophis ca on are expensive programmes and need to be supported by sound export poten al; un l processors have access to EU markets they will be reluctant to invest in developing products that they cannot yet sell.
Overall conclusion
It is clear from the visits undertaken that the dairy and meat processing industries are in suffi ciently good order to face EU accession when it comes, with the most notable weak point being premises for the slaughter of red meat.

92
93
5. Government policy for the sector
This chapter reviews the policy environment for livestock produc on, processing, marke ng and trade. Sec on 5.1 briefl y outlines the hierarchy of policy-making structures in the country. Sec on 5.2 summarizes the strategies and planning documents currently opera ng at state level and in the en es and Brčko District (common text for all sector studies). Sec on 5.3 reviews support policies for the livestock sector, as implemented by the various levels of government. Sec on 5.4 covers trade policy for livestock and livestock products. Sec on 5.5 looks at regula on and control of the livestock sector, throughout the marke ng chain. Sec on 5.6 presents overall conclusions on strategy, trade policy, support policy and regula on.
5.1 Policy-making structures
Within Bosnia and Herzegovina, policy aff ec ng agriculture is set at up to four diff erent levels: State level, where agriculture and rural development fall within the competence of the Ministry of Foreign Trade and Economic Rela ons (MoFTER). En ty and Brčko District level, within the respec ve ministry or department of agriculture. Canton level, for the Federa on of Bosnia and Herzegovina only. Municipal level.
Detailed strategies for agriculture and rural development exist mainly at the top two levels (state and en ty), whilst direct support to livestock producers can be found at each of the three lower levels (en ty, canton and municipality).
5.2 Strategies in force at state and en ty level
This sec on provides a summary of the strategic documents governing all of agriculture and rural development at the state, en ty and Brčko District levels, and has been prepared as common background for each of the sector studies.
5.2.1 State level strategy
The principal strategic and planning documents for agriculture and rural development at the state level are: “Strategic Plan for the Harmoniza on of Agriculture, Food and Rural Development” “Harmoniza on Opera onal Programme: 2008–2011” (agriculture and rural development) “Dra Development Strategy: 2008–2013” (whole economy) “Social Inclusion Strategy: 2008–2013” (whole economy)
In addi on, the “Mid-term Development Strategy: 2004–2007” (English tle: “Poverty Reduc on Strategy”) played a strategic role up to 2007 but is no longer in force. At the beginning of 2009 prepara on began of a new BiH development and social exclusion strategy for the period 2010–2014; a dra version has been available since 2010 on the Web page of the “Directorate for Economic Planning” of the BiH Council of Ministers,35 but has not yet been approved.
Strategic Plan for the Harmoniza on of Agriculture, Food and Rural Development
The “Strategic Plan of BiH for the Harmoniza on of Agriculture, Food and Rural Development” was adopted in January 2009, together with a “Harmoniza on Opera onal Programme” for the period 2008–2011,
35 h p://www.dep.gov.ba/razvojni_dokumen /razvojna_strategija/Archive.aspx?template_id=71&pageIndex=1
94
with the objec ves of improving the compe veness of the agricultural and food processing sectors, and harmonizing and implemen ng rural development measures throughout the country.
It is intended to provide a pla orm for the introduc on of pre-IPARD ac ons to be undertaken from 2008 onwards, allowing the founda ons to be in place by 2011 for receipt of EU rural development funds. Further, the Strategic Plan provides a framework within which essen al public sector reforms can be introduced to strengthen the coordina on and management of the sector, enhance the role and focus of execu ve agencies responsible for food safety, veterinary and phytosanitary issues, and accelerate legisla ve and ins tu onal reforms to ensure gradual compliance with interna onal standards.
The objec ves of all ac ons defi ned in these documents are to:a. Gradually harmonize sector policies
and mechanisms at state, en ty and canton levels both within BiH and with the EU, specifi cally including gradual alignment with the EU’s IPARD regula on (EC Regula on 1085/2005, Ar cle 172) and its implemen ng regula on (EC Regula on 718/2007);
b. Progressively establish appropriate ins tu onal structures, capaci es, systems and procedures at state level to coordinate and guide the management of pre-accession harmoniza on prepara ons and gradual adop on of the agricultural acquis communautaire.
To achieve these objec ves, implementa on of the strategy will focus on six Priority Areas:
Priority Area 1: Establish the required func onal ins tu onal capacity, coordina on and implementa on mechanisms at all levels. Priority Area 2: Enhance the quality and safety of domes c products with a compe ve advantage in produc on, processing and trade.
Priority Area 3: Support primary produc on with direct farm support measures to gradually align between en es and with EU mechanisms. Priority Area 4: Increase compe veness of the agri-food sector of BiH through indirect support measures for produc on, processing and trade. Priority Area 5: Protect the rural environment of BiH through support for agrienvironmental programmes. Priority Area 6: Diversify rural ac vi es and improve the quality of life in rural areas.
Medium-term Development Strategy for BiH: 2004–2007 (revised document)
The revised BiH “Mid-term Development Strategy” for 2004 to 2007 makes reference to the strengthening of ins tu ons in the agriculture sector and to suppor ng the eff ec veness of exis ng subsidy systems, as well as to redirec on of support measures in line with agriculture and rural development priori es. This has resulted in rural development sector strategies at the en ty level, and increased en ty level funding from 2007.
Harmoniza on Opera onal Programme: 2008–2011
The “Harmoniza on Opera onal Programme” provides a detailed ac on plan for state level implementa on of the BiH “Strategic Plan for Harmoniza on of Agriculture, Food and Rural Development”. The measures have been developed taking full account of the ac ons defi ned in the BiH “Mid-term Development Strategy”, most of which have either been par ally implemented or not yet implemented. Ac ons in specifi c technical areas such as veterinary and phytosanitary control have been revised and updated in consulta on with the relevant state agencies.
BiH Development Strategy: 2008–2013 (dra ) and Social Inclusion Strategy
A dra BiH “Development Strategy” for 2008 to 2013 has been prepared, along with a “Social Inclusion Strategy”. The BiH
95
“Directorate for Economic Planning” (a body of the Council of Ministers) is responsible for coordina on of development of these economy-wide strategies, which have been submi ed to the adop on procedure. Ac on plans for BiH, en es and Brčko District have also been developed.
The focus of the “BiH Development Strategy” is divided into fi ve strategic goals: Compe on Macro-economic stability Employment Sustainable development EU integra on
The document is based on “scanning” of all adopted strategies within BiH, from the macro to the micro level and on “undertaking” goals arising from the chosen path of EU integra on. The strategy addi onally takes on board as-yet unrealized goals from the previous “BiH Development Strategy: 2004–2007” and further issues elaborated by working groups composed of representa ves from the state, en ty and Brčko District levels, together with social partners, civil society and the academic community.
Within its overall goals for social and economic development, the BiH Development Strategy states that rural development in the coming period should be focused on: Building human resources in rural areas and improving their informa on, skills and knowledge; Improvement of produc on infrastructure and infrastructure for the purchase of agricultural produce in rural areas; Improving the quality and safety of agricultural and food products in line with EU standards; Sustainable management of agricultural and forest land, livestock and, generally, of living condi ons in rural areas; Improving the quality and accessibility of public services for the rural popula on; Improvement of the posi on of women in rural areas;
Construc on and maintenance of rural infrastructure; Protec on and conserva on of natural and cultural-historical heritage in rural areas; Diversifi ca on of agricultural and non-agricultural ac vi es in rural communi es; Support to the establishment of all forms of micro-, small- and medium-sized enterprises in rural areas; and Development of agro- and rural tourism in rural areas.
In order to achieve these goals, the BiH Development Strategy defi nes the following priori es and measures:
Priority 1. Establishment of a func onal ins tu onal capacity for agriculture and rural development:• Measure 1. Strengthening of human
resources in the exis ng ins tu ons• Measure 2. Establishment of missing
ins tu ons in agriculture and rural development;
• Measure 3. Harmoniza on of the agriculture and rural development sector with the EU.
Priority 2. Improvement of the compe on in produc on, processing and trade of domes c agricultural products along with raising its quality and safety: • Measure 1. Inves ng in agricultural
proper es and organiza ons, and inves ng in moderniza on of exis ng and construc on of new capaci es for processing and fi nishing of agricultural products;
• Measure 2. Organiza on of farming land;• Measure 3. Establishment and improvement
of coopera on in the produc on and processing of agricultural products;
• Measure 4. Support to the introduc on of quality and control systems;
• Measure 5. Support to organiza ons of agriculture producers;
• Measure 6. Fishing industry: policy for improvement of domes c and export markets.
96
Priority 3. Protec on of nature and ra onal management of natural resources:• Measure 1. Support to environmental
protec on measures;• Measure 2. Support to biodiversity
protec on and sustainable use of gene c resources.
Priority 4. Improvement of living condi ons and introduc on of greater diversity of income-genera on in the rural economy:• Measure 1. Improvement of rural
infrastructure;• Measure 2. Support to the development
of rural, par cularly women’s, entrepreneurship;
• Measure 3. Support to the produc on of specifi c geographically brand-named products;
• Measure 4. Promo on of rural tourism;• Measure 5. Support to rural and especially
women entrepreneurs;• Measure 6. Promo on of rural tourism.
5.2.2 Strategy within the Federa on of Bosnia and Herzegovina
The Federa on of Bosnia and Herzegovina (FBiH) is in the process of implemen ng its “Midterm Strategy for Agriculture Sector Development: 2006–2010”, which was adopted in 2007 along with its Ac on Plan. The specifi c goals and priori es iden fi ed in the Strategy are: 1. Con nua on with rehabilita on of the
sector from the consequences of war. Clearance of minefi elds and restora on of land to its previous purpose. Suppor ng popula on returns and improving the quality of life in rural areas.
2. Establishment of sustainable development of agriculture and of the food processing industry, and its profi tability and compe veness. Strengthening of coopera ves, enterprises, and other producers’ organiza ons.
3. Legal establishment of agricultural ins tu ons and clear defi ni on of farms and other subjects in the agriculture sector.
4. Development of agriculture market and suppor ng the leasing of agricultural land.
5. Providing a suffi cient quan ty of good quality food to consumers at reasonable prices.
6. Harmoniza on of the protec on of animals and plants. Support for biological and ecological produc on.
7. Establishment and accredita on of reference laboratories. Enabling standardiza on and cer fi ca on of agricultural products, and establishing a system of guarantees and quality management. Building new facili es for food processing.
8. Establishing unifi ed management of agriculture and rural development at the state level. Establishing a single economic space and suppor ng the market for agricultural products throughout BiH.
9. Ensuring the par cipa on of agricultural products in interna onal markets under fair condi ons. Prepara on for WTO and EU membership. Elabora on of support programmes and prepara on for implementa on of the Paying Agency for disbursement of EU funds.
10. Suppor ng the export of agricultural and processed food products. Carrying out external media campaigns to a ract tourists to BiH.
11. Protec on and ra onal use of natural resources. Support to sustainable economic use of agriculture and forest land and waters.
The measures envisaged by the Strategy and Ac on Plan will seek to:1. Defi ne the exis ng situa on of rural
areas (economic, infrastructure and demographic specifi cs);
2. Adopt the “Rural Development Programme”;
3. Defi ne economically less-favoured areas (remote areas and less-favoured areas) and set out support measures for them;
4. Establish credit and micro-fi nance systems, while giving special allowances
97
for the development of agriculture, the food industry and other forms of employment for the rural popula on outside of agriculture;
5. Develop and apply a system of educa on for the rural popula on and establish advisory and extension services to carry out these ac vi es;
6. Develop a strategy for se ng up gender equality through the strengthening of the role of woman in rural society;
7. Establish a system of support to women entrepreneurs;
8. Develop a strategy for the protec on of women’s and children’s health and for promo on of their educa on;
9. Develop a programme for preserva on and sustainable u liza on of autochthonic fruit resources;
10. Defi ne the set of tradi onal products with the poten al to become products with protected origin, cra products and souvenirs;
11. Develop a programme for development of new products (from the list of tradi onal products);
12. Intensify the implementa on of the prescribed measures for protec on and recovery from natural and other disasters.
The FBiH “Opera onal Programme for Agriculture, Food and Rural Development” is currently under dra ing procedure. It will include ac vi es related to establishment of the Paying Agency and implementa on of IPARD.
5.2.3 Strategy within Republika Srpska
The Republika Srpska has an “Agricultural Development Strategy un l 2015” approved by its parliament in 2006. It is the fi rst, and s ll the main, strategic document addressing objec ves and other issues related to agriculture in this en ty. It defi nes the long-term objec ves of agricultural development in RS as follows:1. Increase the scope and adjust the
structures of agro-industrial produc on in order to achieve food self-suffi ciency;
2. Ensure op mal use of agrarian resources (land, water, forests, gene c poten al, etc.) and increase produc vity and compe veness, with improved technology, environmental protec on and sustainable development;
3. Achieve balanced integrated development, agrarian, rural and regional, whilst strengthening produc vity and economic protec on of market-oriented producers, preven ng depopula on and achieving socio-economic revitaliza on of rural, and par cularly upland, areas;
4. Maintain a stable market of agricultural and food products, and a supply of food whose quantity, structure, prices and quality is harmonized with nutritional needs and the level of consumer purchasing power, with a gradual decrease in the share of food expenditure within the structure of family budgets;
5. Increase exports with achievement of a higher level of foreign trade balance in agricultural and food industry products, based on produc vity, quality, harmonized legisla on (with EU and WTO) and an equivalent level of internal incen ves and external consumer protec on;
6. Implement ins tu onal, material, human, and technological improvement of agriculture with RS’s involvement in regional, European and world integra on processes.
This document was amended slightly in accordance with the entering into force of the RS “Rural Development Strategic Plan 2009–15”, adopted in 2009, which is now being implemented. This plan sets out three strategic goals, 16 specifi c goals, 54 measures and 161 submeasures.
The strategic goals for rural development in RS are defi ned as:
1. Improvement of compe veness in agriculture and forestry;
2. Preserva on of nature and ra onal management of natural resources;
98
3. Improvement of living condi ons and introduc on of diversifi ca on of income in the rural economy.
Specifi c goals or priori es foreseen by the strategy are:1. Farm investments;2. Investment in processing and marke ng
of agricultural products;3. Support to organiza ons of agriculture
producers and private forest owners;4. Improvement of human resources in
rural areas;5. Financial support to rural areas;6. Sustainable management of natural
resources in rural areas;7. Sustainable forest management;8. Sustainable management of hun ng and
fi shing resources;9. Sustainable management of village areas;10. Construc on and maintenance of village
infrastructure;11. Improvement of access to public services
for the rural popula on;12. Research and protec on of natural and
cultural-historical heritage in rural areas;13. Diversifi ca on of non-agricultural and
agricultural ac vi es in villages;14. Establishment of micro-, small- and
medium-sized enterprises in villages;15. Improvement and development of rural
tourism services;16. Support to local rural development
ini a ves.
5.2.4 Strategy within Brčko District
Brčko District (BD) has prepared its “Strategy for the Development of Agriculture, Food and Rural Development: 2009–2013” and accompanying “Ac on Plan”, which are currently in the adop on procedure.
According to the strategy, its strategic and opera onal goals are to:1. Intensify crop and animal produc on;2. Support revitaliza on of the food
processing industry;
3. Develop organic produc on, and apply principles of preserva on of the environment;
4. Improve the use and protec on of gene c resources in agriculture;
5. Support the moderniza on and introduc on of European and world standards in agricultural produc on and processing;
6. Improve professional educa on and skills of producers in agriculture and the food processing industry;
7. Develop ver cal and horizontal integra on with strengthening of market infrastructure;
8. Develop fi nancial sources for the agriculture sector;
9. Promote rural development;10. Improve the legal framework of
agriculture in BD;11. Support exis ng and establish new
ins tu ons to support agriculture;12. Adapt agrarian policy to good European
prac ce and to the real needs of the sector;
13. Increase fi nancial support to the agriculture sector.
The measures proposed to support rural development are: Establishment of Local Ac on Groups and development of capaci es for ini a on of rural development; Rehabilita on of exis ng and construc on of new pasture-access roads; Construc on of systems for carrying away waste from rural areas; Improvement of the quality of the sewage system in BD; Crea on of movable social infrastructure in rural areas of BD; Support to the establishment of small- and medium-sized enterprises in rural areas; Support to the development of non-conven onal agriculture produc on; Support to the development of complementary ac vi es on farms;
99
Support to the development of agro-tourism; Support to preserva on of the environment through raising awareness of the local popula on; Promo on of the natural and cultural-historical heritage of BD; Support to preserva on of tradi onal cra s; Support to restora on of forest resources.
5.2.5 Conclusions on the strategic planning framework
The BiH state, its two en es and Brčko District have all now dra ed strategic planning documents for agriculture and rural development along the lines of the EU programming process. The goals and priori es set out are comprehensive and ambi ous, perhaps appearing more of a “wish-list” than a targeted strategy, and create space for the implementa on of a very wide range of support measures and policies. What is less clear from these strategic level documents is exactly how
these laudable aims are to be achieved, and it is here that the policies actually implemented for the livestock sector give more insight into strategy in ac on.
5.3 Domes c support policy for the livestock sector
Only foreign trade policy is established at the state level, and so it is the support policies delivered within each en ty that have the most direct eff ect on agricultural producers.
5.3.1 Livestock support in Federa on of Bosnia and Herzegovina
Direct support to livestock producers in the Federa on is delivered partly by the en ty level government and partly by the cantons, with the exact nature of the support schemes varying from canton to canton. The following table summarizes the kinds of livestock subsidy36 paid in 2008 (the latest year for which detailed data were available for all cantons and at en ty level), together with the number of cantons applying each:
36 Subsidies were classifi ed into approximate types based on their tle in the supplied dataset. The term “Headage payment” is used for any subsidy that appears to be related to the number of animals kept, rather than the number bought (= “Input subsidy”) or the amount of product sold (= “Output subsidy”).
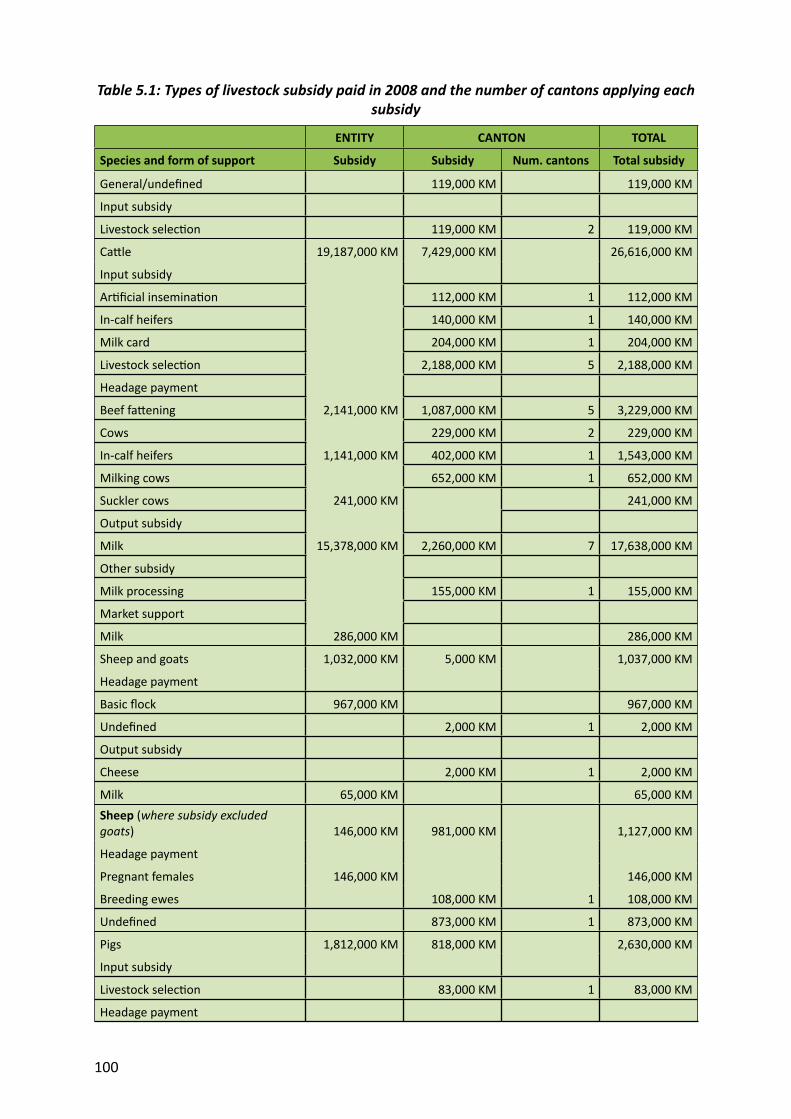
100
Table 5.1: Types of livestock subsidy paid in 2008 and the number of cantons applying each subsidy
ENTITY CANTON TOTAL
Species and form of support Subsidy Subsidy Num. cantons Total subsidy
General/undefi ned 119,000 KM 119,000 KM
Input subsidy
Livestock selec on 119,000 KM 2 119,000 KM
Ca le 19,187,000 KM 7,429,000 KM 26,616,000 KM
Input subsidy
Ar fi cial insemina on 112,000 KM 1 112,000 KM
In-calf heifers 140,000 KM 1 140,000 KM
Milk card 204,000 KM 1 204,000 KM
Livestock selec on 2,188,000 KM 5 2,188,000 KM
Headage payment
Beef fa ening 2,141,000 KM 1,087,000 KM 5 3,229,000 KM
Cows 229,000 KM 2 229,000 KM
In-calf heifers 1,141,000 KM 402,000 KM 1 1,543,000 KM
Milking cows 652,000 KM 1 652,000 KM
Suckler cows 241,000 KM 241,000 KM
Output subsidy
Milk 15,378,000 KM 2,260,000 KM 7 17,638,000 KM
Other subsidy
Milk processing 155,000 KM 1 155,000 KM
Market support
Milk 286,000 KM 286,000 KM
Sheep and goats 1,032,000 KM 5,000 KM 1,037,000 KM
Headage payment
Basic fl ock 967,000 KM 967,000 KM
Undefi ned 2,000 KM 1 2,000 KM
Output subsidy
Cheese 2,000 KM 1 2,000 KM
Milk 65,000 KM 65,000 KMSheep (where subsidy excluded goats) 146,000 KM 981,000 KM 1,127,000 KM
Headage payment
Pregnant females 146,000 KM 146,000 KM
Breeding ewes 108,000 KM 1 108,000 KM
Undefi ned 873,000 KM 1 873,000 KM
Pigs 1,812,000 KM 818,000 KM 2,630,000 KM
Input subsidy
Livestock selec on 83,000 KM 1 83,000 KM
Headage payment
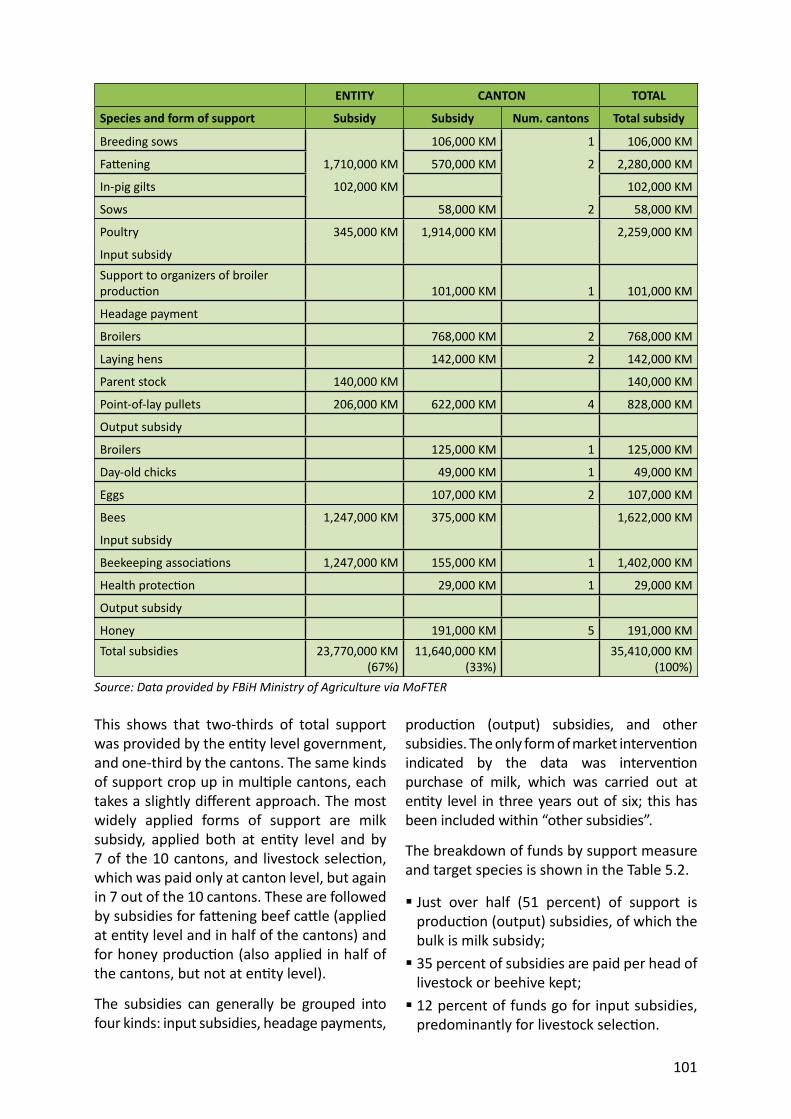
101
ENTITY CANTON TOTAL
Species and form of support Subsidy Subsidy Num. cantons Total subsidy
Breeding sows 106,000 KM 1 106,000 KM
Fa ening 1,710,000 KM 570,000 KM 2 2,280,000 KM
In-pig gilts 102,000 KM 102,000 KM
Sows 58,000 KM 2 58,000 KM
Poultry 345,000 KM 1,914,000 KM 2,259,000 KM
Input subsidySupport to organizers of broiler produc on 101,000 KM 1 101,000 KM
Headage payment
Broilers 768,000 KM 2 768,000 KM
Laying hens 142,000 KM 2 142,000 KM
Parent stock 140,000 KM 140,000 KM
Point-of-lay pullets 206,000 KM 622,000 KM 4 828,000 KM
Output subsidy
Broilers 125,000 KM 1 125,000 KM
Day-old chicks 49,000 KM 1 49,000 KM
Eggs 107,000 KM 2 107,000 KM
Bees 1,247,000 KM 375,000 KM 1,622,000 KM
Input subsidy
Beekeeping associa ons 1,247,000 KM 155,000 KM 1 1,402,000 KM
Health protec on 29,000 KM 1 29,000 KM
Output subsidy
Honey 191,000 KM 5 191,000 KMTotal subsidies 23,770,000 KM
(67%)11,640,000 KM
(33%)35,410,000 KM
(100%)Source: Data provided by FBiH Ministry of Agriculture via MoFTER
This shows that two-thirds of total support was provided by the en ty level government, and one-third by the cantons. The same kinds of support crop up in mul ple cantons, each takes a slightly diff erent approach. The most widely applied forms of support are milk subsidy, applied both at en ty level and by 7 of the 10 cantons, and livestock selec on, which was paid only at canton level, but again in 7 out of the 10 cantons. These are followed by subsidies for fa ening beef ca le (applied at en ty level and in half of the cantons) and for honey produc on (also applied in half of the cantons, but not at en ty level).
The subsidies can generally be grouped into four kinds: input subsidies, headage payments,
produc on (output) subsidies, and other subsidies. The only form of market interven on indicated by the data was interven on purchase of milk, which was carried out at en ty level in three years out of six; this has been included within “other subsidies”.
The breakdown of funds by support measure and target species is shown in the Table 5.2.
Just over half (51 percent) of support is produc on (output) subsidies, of which the bulk is milk subsidy; 35 percent of subsidies are paid per head of livestock or beehive kept; 12 percent of funds go for input subsidies, predominantly for livestock selec on.
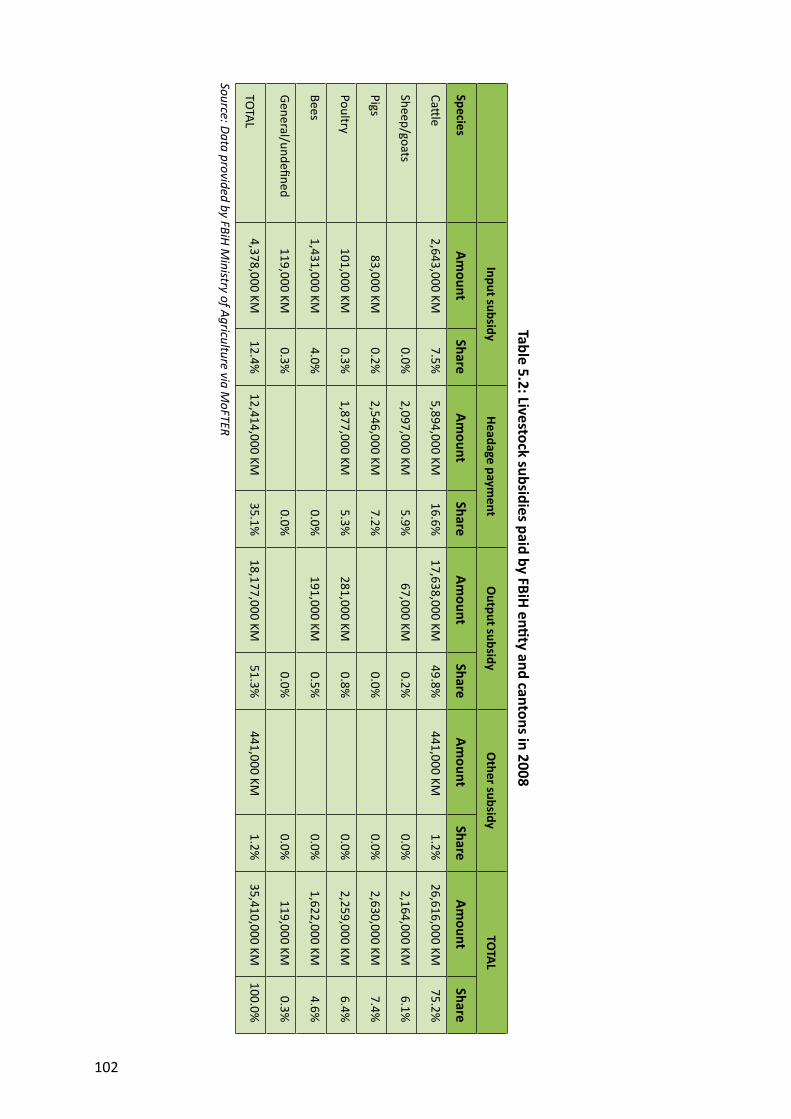
102
Table 5.2: Livestock subsidies paid by FBiH en ty and cantons in 2008
Input subsidyHeadage paym
entO
utput subsidyO
ther subsidyTO
TAL
SpeciesAm
ountShare
Amount
ShareAm
ountShare
Amount
ShareAm
ountShare
Ca le
2,643,000 KM7.5%
5,894,000 KM16.6%
17,638,000 KM49.8%
441,000 KM1.2%
26,616,000 KM75.2%
Sheep/goats0.0%
2,097,000 KM5.9%
67,000 KM0.2%
0.0%2,164,000 KM
6.1%
Pigs83,000 KM
0.2%2,546,000 KM
7.2%0.0%
0.0%2,630,000 KM
7.4%
Poultry101,000 KM
0.3%1,877,000 KM
5.3%281,000 KM
0.8%0.0%
2,259,000 KM6.4%
Bees1,431,000 KM
4.0%0.0%
191,000 KM0.5%
0.0%1,622,000 KM
4.6%
General/undefi ned119,000 KM
0.3%0.0%
0.0%0.0%
119,000 KM0.3%
TOTAL4,378,000 KM
12.4%12,414,000 KM
35.1%18,177,000 KM
51.3%441,000 KM
1.2%35,410,000 KM
100.0%
Source: Data provided by FBiH Ministry of Agriculture via M
oFTER
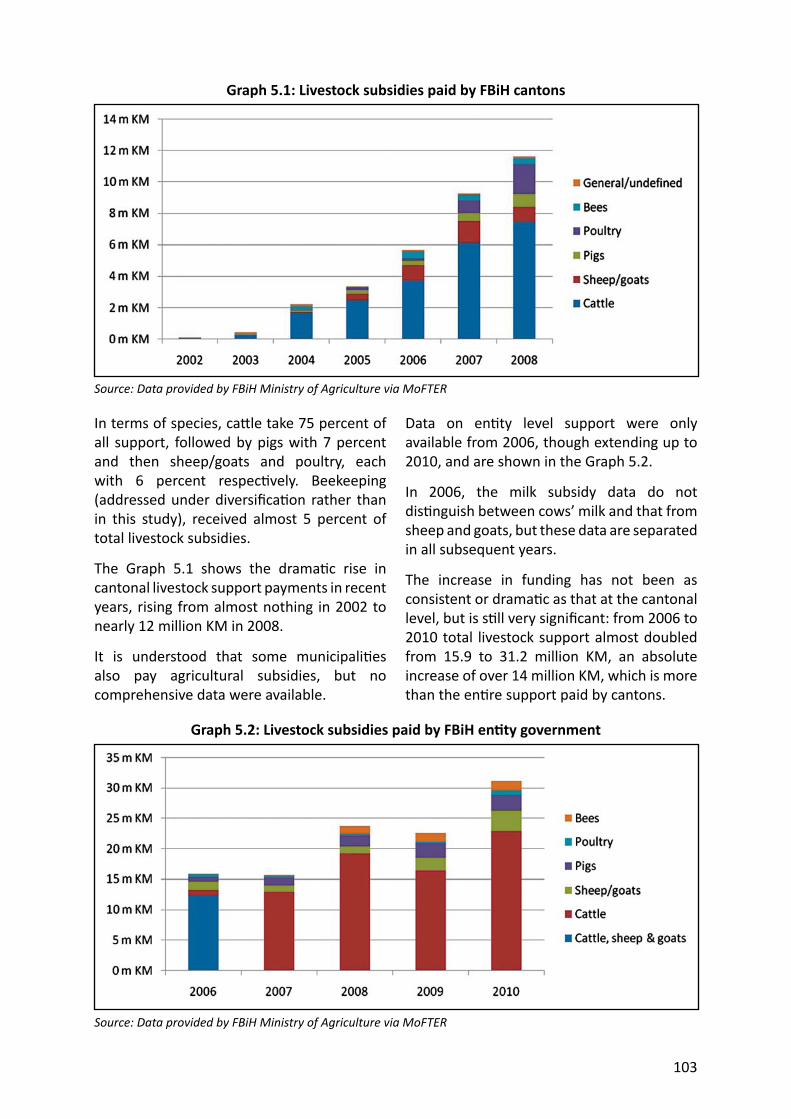
103
In terms of species, ca le take 75 percent of all support, followed by pigs with 7 percent and then sheep/goats and poultry, each with 6 percent respec vely. Beekeeping (addressed under diversifi ca on rather than in this study), received almost 5 percent of total livestock subsidies.
The Graph 5.1 shows the drama c rise in cantonal livestock support payments in recent years, rising from almost nothing in 2002 to nearly 12 million KM in 2008.
It is understood that some municipali es also pay agricultural subsidies, but no comprehensive data were available.
Graph 5.1: Livestock subsidies paid by FBiH cantons
Source: Data provided by FBiH Ministry of Agriculture via MoFTER
Data on en ty level support were only available from 2006, though extending up to 2010, and are shown in the Graph 5.2.
In 2006, the milk subsidy data do not dis nguish between cows’ milk and that from sheep and goats, but these data are separated in all subsequent years.
The increase in funding has not been as consistent or drama c as that at the cantonal level, but is s ll very signifi cant: from 2006 to 2010 total livestock support almost doubled from 15.9 to 31.2 million KM, an absolute increase of over 14 million KM, which is more than the en re support paid by cantons.
Graph 5.2: Livestock subsidies paid by FBiH en ty government
Source: Data provided by FBiH Ministry of Agriculture via MoFTER
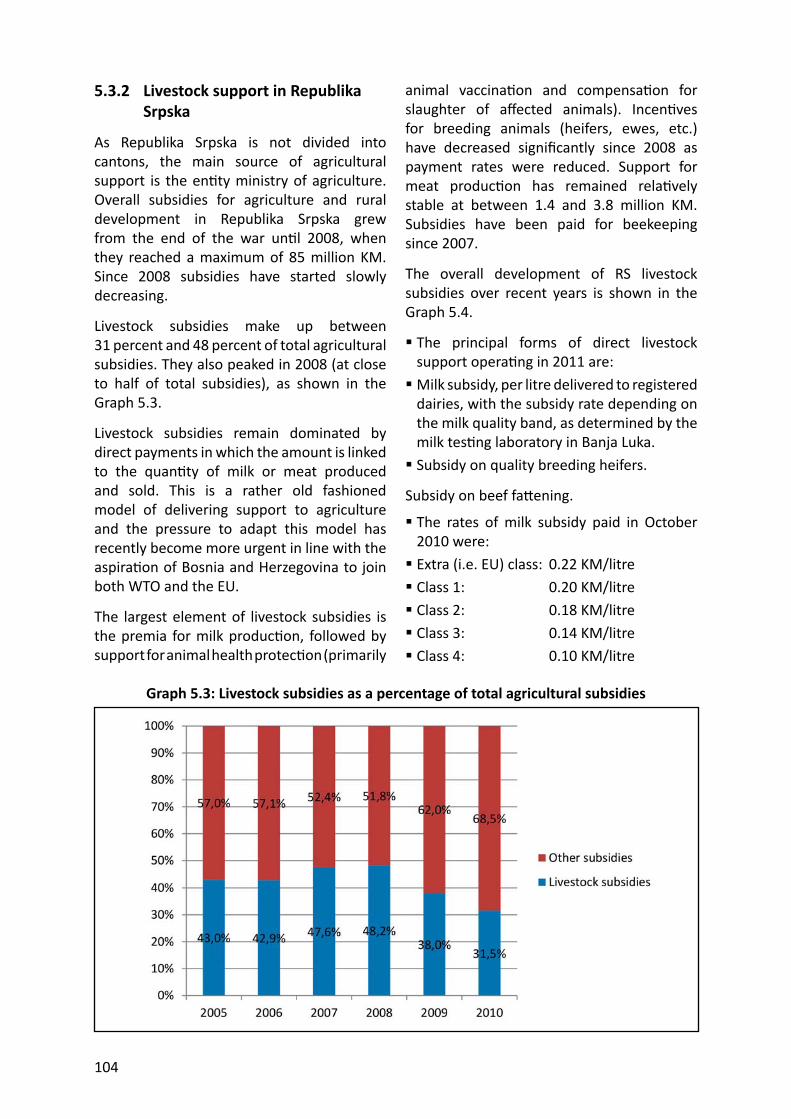
104
5.3.2 Livestock support in Republika Srpska
As Republika Srpska is not divided into cantons, the main source of agricultural support is the en ty ministry of agriculture. Overall subsidies for agriculture and rural development in Republika Srpska grew from the end of the war un l 2008, when they reached a maximum of 85 million KM. Since 2008 subsidies have started slowly decreasing.
Livestock subsidies make up between 31 percent and 48 percent of total agricultural subsidies. They also peaked in 2008 (at close to half of total subsidies), as shown in the Graph 5.3.
Livestock subsidies remain dominated by direct payments in which the amount is linked to the quan ty of milk or meat produced and sold. This is a rather old fashioned model of delivering support to agriculture and the pressure to adapt this model has recently become more urgent in line with the aspira on of Bosnia and Herzegovina to join both WTO and the EU.
The largest element of livestock subsidies is the premia for milk produc on, followed by support for animal health protec on (primarily
animal vaccina on and compensa on for slaughter of aff ected animals). Incen ves for breeding animals (heifers, ewes, etc.) have decreased signifi cantly since 2008 as payment rates were reduced. Support for meat produc on has remained rela vely stable at between 1.4 and 3.8 million KM. Subsidies have been paid for beekeeping since 2007.
The overall development of RS livestock subsidies over recent years is shown in the Graph 5.4.
The principal forms of direct livestock support opera ng in 2011 are: Milk subsidy, per litre delivered to registered dairies, with the subsidy rate depending on the milk quality band, as determined by the milk tes ng laboratory in Banja Luka. Subsidy on quality breeding heifers.
Subsidy on beef fa ening.
The rates of milk subsidy paid in October 2010 were: Extra (i.e. EU) class: 0.22 KM/litre Class 1: 0.20 KM/litre Class 2: 0.18 KM/litre Class 3: 0.14 KM/litre Class 4: 0.10 KM/litre
Graph 5.3: Livestock subsidies as a percentage of total agricultural subsidies
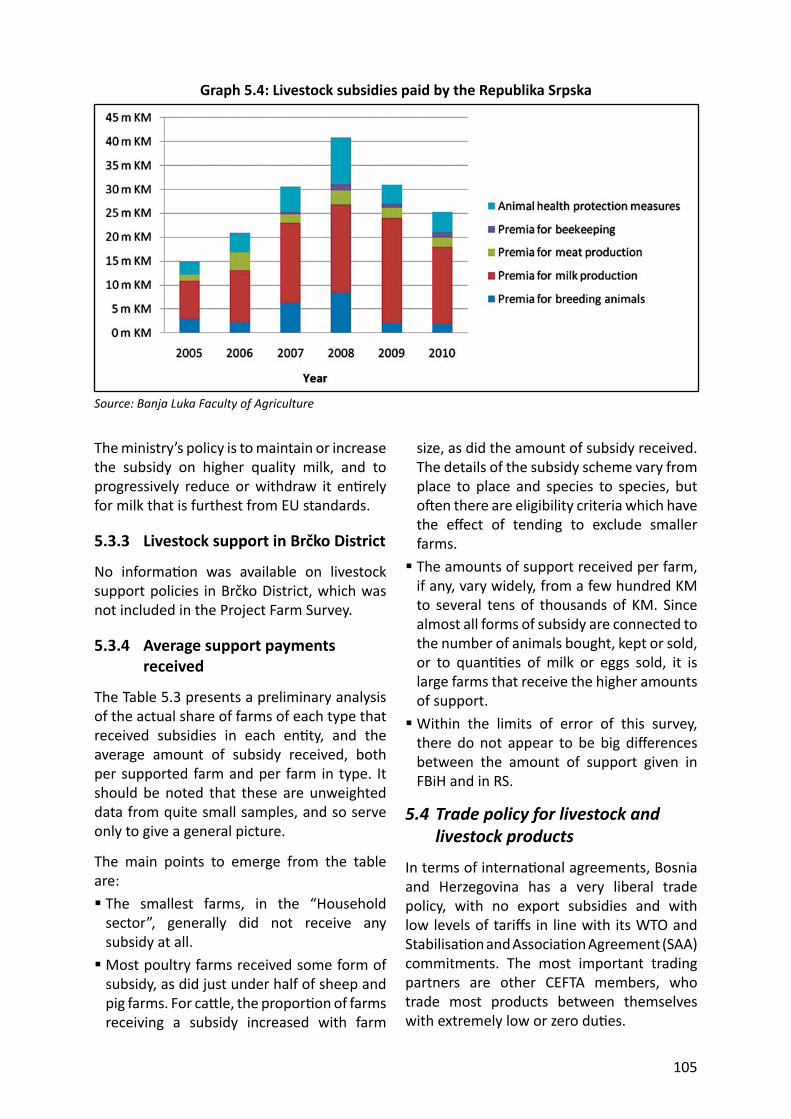
105
The ministry’s policy is to maintain or increase the subsidy on higher qu ality milk, and to progressively reduce or withdraw it en rely for milk that is furthest from EU standards.
5.3.3 Livestock support in Brčko District
No informa on was available on livestock support policies in Brčko District, which was not included in the Project Farm Survey.
5.3.4 Ave rage support payments received
The Table 5.3 presents a preliminary analysis of the actual share of farms of each type that received subsidies in each en ty, and the average amount of subsidy received, both per supported farm and per farm in type. It should be noted that these are unweighted data from quite small samples, and so serve only to give a general picture.
The main points to emerge from the table are: The smallest farms, in the “Household sector”, generally did not receive any subsidy at all. Most poultry farms received some form of subsidy, as did just under half of sheep and pig farms. For ca le, the propor on of farms receiving a subsidy increased with farm
Graph 5.4: Livestock subsidies paid by the Republika Srpska
Source: Banja Luka Faculty of Agriculture
size, as did the amount of subsidy received. The details of the subsidy scheme vary from place to place and species to species, but o en there are eligibility criteria which have the eff ect of tending to exclude smaller farms. The amounts of support received per farm, if any, vary widely, from a few hundred KM to several tens of thousands of KM. Since almost all forms of subsidy are connected to the number of animals bought, kept or sold, or to quan es of milk or eggs sold, it is large farms that receive the higher amounts of support. Within the limits of error of this survey, there do not appear to be big diff erences between the amount of support given in FBiH and in RS.
5.4 Trade policy for livestock and livestock products
In terms of interna onal agreements, Bosnia and Herzegovina has a very liberal trade policy, with no export subsidies and with low levels of tariff s in line with its WTO and Stabilisa on and Associa on Agreement (SAA) commitments. The most important trading partners are other CEFTA members, who trade most products between themselves with extremely low or zero du es.
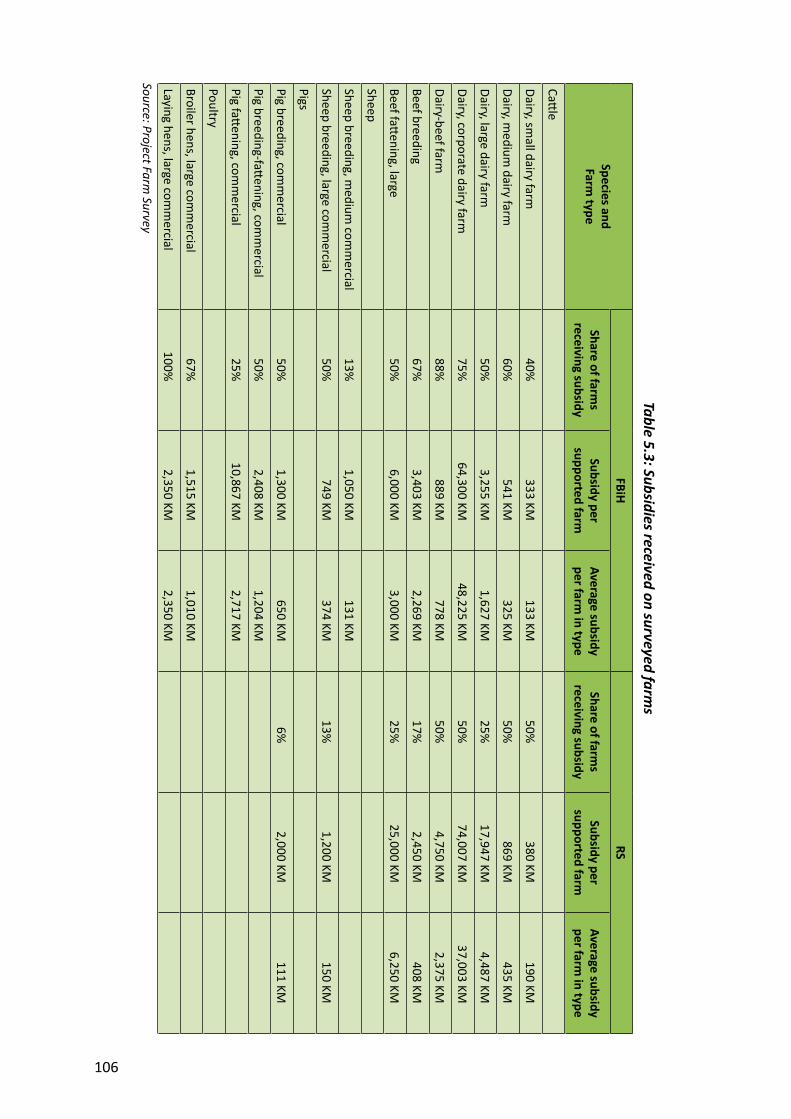
106
Table 5.3: Subsidies received on surveyed farms
Species andFarm
type
FBiHRS
Share of farms
receiving subsidySubsidy per
supported farmAverage subsidy per farm
in typeShare of farm
s receiving subsidy
Subsidy per supported farm
Average subsidy per farm
in type
Ca le
Dairy, small dairy farm
40%333 KM
133 KM50%
380 KM190 KM
Dairy, medium
dairy farm60%
541 KM325 KM
50%869 KM
435 KM
Dairy, large dairy farm50%
3,255 KM1,627 KM
25%17,947 KM
4,487 KM
Dairy, corporate dairy farm75%
64,300 KM48,225 KM
50%74,007 KM
37,003 KM
Dairy-beef farm88%
889 KM778 KM
50%4,750 KM
2,375 KM
Beef breeding67%
3,403 KM2,269 KM
17%2,450 KM
408 KM
Beef fa ening, large
50%6,000 KM
3,000 KM25%
25,000 KM6,250 KM
Sheep
Sheep breeding, medium
comm
ercial13%
1,050 KM131 KM
Sheep breeding, large comm
ercial50%
749 KM374 KM
13%1,200 KM
150 KM
Pigs
Pig breeding, comm
ercial50%
1,300 KM650 KM
6%2,000 KM
111 KM
Pig breeding-fa ening, com
mercial
50%2,408 KM
1,204 KM
Pig fa ening, com
mercial
25%10,867 KM
2,717 KM
Poultry
Broiler hens, large comm
ercial67%
1,515 KM1,010 KM
Laying hens, large comm
ercial100%
2,350 KM2,350 KM
Source: Project Farm Survey
107
However, domes c meat prices appear to be markedly above import prices (by up to 30 percent, according to some processors interviewed), indica ng that some barriers to trade do func on. The answer seems to lie within a requirement that processors incorporate a minimum percentage of domes cally produced meat (presumably in order to obtain a BiH Cer fi cate of Origin), which in eff ect gives a signifi cant level of protec on to the domes c industry.
Some commentators have observed (and Customs data confi rm) that much of the imported meat is frozen, which would be one reason for its rela ve cheapness compared to domes cally produced meat; some also allege that the imports are of lower quality. However, most meat processing plants can achieve their desired product quality from frozen raw material and did not report any problems with the quality or supply of imported materials, whilst they found local meat to be of indiff erent quality and hard to obtain in the consistent quan es they require. As noted in sec on 4.4.8, raw material represents up to 60 percent of meat processors’ opera ng cost and so has a very big impact on profi tability; a policy of obliging processors to use more domes cally produced meat would have the economic eff ect of taxing the processing industry and subsidizing primary producers.
5.5 Regula on and control of the livestock sector37
As in the EU, lead responsibility for regula on of livestock produc on and processing lies with the veterinary authori es. The Veterinary Offi ce of Bosnia and Herzegovina was created in 2000 to func on as the country’s “Central Competent Authority”, and represents BiH at the OIE (World Organisa on for Animal Health). The BiH Veterinary Offi ce, with its headquarters in Sarajevo, has a total of 75 staff and is responsible for the Agency for
Animal Iden fi ca on, located in Banja Luka, and for the Veterinary Border Inspectors at all of the country’s external borders. Beyond this federal level, responsibility for veterinary ma ers is split between mul ple organiza ons: The FBiH Ministry for Agriculture, Forestry and Water Management takes the lead for veterinary ma ers but has no veterinary inspectors of its own, as they are located within the general Federa on Administra on for Inspec on Aff airs. Below this, each canton has its own ministry of agriculture or, in one case, ministry of economy; two of these have their own veterinary inspectors whilst in the other eight cantons these are also located with a general Cantonal Administra on for Inspec on Aff airs. The RS Ministry for Agriculture, Forestry and Water Management includes a Veterinary Sector, but again the veterinary inspectors are based within a general Republic Administra on for Inspec on Aff airs and below them each municipality has its own inspec on department. The BD Department for Agriculture, Forestry and Water Management includes some veterinarians within its Veterinary Sub-department, but the Offi ce of the Mayor houses most of the inspectors, including veterinary inspectors.
The result of this is that there is no clear chain of command and the BiH Chief Veterinary Offi ce has no power to suspend or close an establishment that fails to comply with veterinary and hygiene standards. Although the BiH Veterinary Offi ce is responsible for giving “guarantees” of the sa sfactory nature of livestock products for export, the European Commission’s Directorate General for Health and Consumers (DG SANCO) and Food and Veterinary Offi ce (FVO) remain to be convinced and have so far approved only four establishments for export to the EU, all of them dealing with fi sh. An applica on
37 Most of the informa on in this sec on was supplied by the Veterinary Agency in Sarajevo, and refl ects the situa on in April 2011.
108
is in progress to gain approval for exports of honey (for which the main issue is usually pes cide residues, rather than control of establishments). Thus far, BiH has no approval to export live animals, meat, meat products, milk or milk products to the EU – meaning to any of the current 27 Member States and also to Croa a a er its accession.38 The BiH Veterinary Offi ce would like to obtain approval for the export of milk, dairy products and poultry meat, but it is far from certain that such approval will be granted whilst the current complex administra ve structure prevails.
State level veterinary control
In addi on to the roles discussed above (export cer fi ca on with regard to the EU, veterinary border controls, and animal iden fi ca on), there are at present state level ini a ves covering: Control of viral diseases of fi sh; Ac on against avian infl uenza; Brucellosis vaccina on.
There is no state level con ngency fund to deal with a major outbreak of epizoo c disease.
Veterinary control in the Federa on
Establishments wishing to export to non-EU countries in the region must be registered with the Federa on Ministry of Agriculture, whilst those wishing to trade within the country must register with the relevant offi ce in their local canton.
Veterinary control in Republika Srpska
The Chief Veterinary Offi cer within the RS Ministry for Agriculture, Forestry and Water Management is responsible for registering all establishments, whether trading locally or regionally.
Veterinary control in Brčko District
The Chief Veterinary Offi cer (head of the Veterinary Sub-department) is also the head of inspec on services throughout Brčko District.
Laboratory services
There are 14 func oning control laboratories within BiH, some of them dealing with food and veterinary ma ers, but they are registered at various diff erent levels and there is no central reference laboratory for either BiH or the en es. The Veterinary Ins tute at Banja Luka and the laboratory in Bihać are among the more advanced, but no ins tu on within BiH has ISO 17025 cer fi ca on for residue analysis, so all samples from the na onal residue tes ng programme are sent outside the country.
Legisla on
Veterinary legisla on at the state level is prepared by working groups convened by the BiH Veterinary Offi ce, with representa ves from the en es. All dra legisla on must be approved by both en es and Brčko District before it can be submi ed for state level approval by the Ministry of Foreign Trade and Economic Rela ons (MoFTER), the Council of Ministers, and/or the Parliament, depending on the form of legisla on.
Rendering of animal waste
Before the war there was one large rendering plant based in Brčko, but it is no longer func onal, and there are now just a few small private plants serving local customers. Na onal legisla on has been prepared on the subject but funding is needed to construct one or two large-scale rendering plants, with Instrument for Pre-Accession Assistance (IPA) viewed as a poten al source.
38 Interes ngly, both Customs data and stakeholder interviews indicate some export of milk and dairy products, poultry meat and red meat products to the EU, though no exports of live animals or red meat. Generally speaking, the highest veterinary risk is carried by live animals, followed by fresh meat and fresh milk; once meat has been processed into ham, sausages, etc. or milk into cheese or yoghurt, many of the more serious disease organisms are likely to have been destroyed. It was not clear whether these exports had been processed to such an extent that they are no longer considered a veterinary health risk, or whether a crea ve approach to expor ng was being used.
109
Animal iden fi ca on
The Agency for Animal Iden fi ca on has so far introduced an EU-compliant system for iden fi ca on and registra on of bovines. As in many countries of the region, the system is reasonably successful at ensuring that newborn calves are ear-tagged and entered onto the system (except for calves that are slaughtered on the holding before tagging can take place), but control of movements and repor ng of deaths and slaughters are weak, resul ng in the gradual accumula on of “ghost cows” in the database.
5.6 Conclusions on government policy and regula on
Strategy
A number of strategy documents are in place, though some mes appearing as more of a “wish list” than an opera onal strategy. A number of stakeholders referred to the lack of a clear vision for the sector, so there may be some weak points in the chain between top level strategy documents and implementa on at the level of farmers and processors.
Trade policy
Trade policy is managed at the state level; in principle there is a very liberal trading environment, though the signifi cant price diff eren als between imported and domes c meats indicate that there may be some non-tariff barriers at work.
Support policy
Direct support policies are set and implemented by the en es and, in FBiH, by the Cantons.
In line with most other countries in the region (and similar to many of the policies of the former Yugoslavia), most of the livestock support is related to farm inputs and outputs, par cularly milk, and rela vely li le is devoted to providing the “public good” services that are the clear responsibility of government. In FBiH, just over 10 percent of all livestock subsidy expenditure is for measures to
upgrade the sector – livestock selec on, ar fi cial insemina on, health protec on of bees, and support to beekeeping associa ons – with the other 90 percent being mainly input subsidies, headage payments and output subsidies. In RS, the largest share of expenditure is on milk subsidy, followed by “public good” health protec on measures of preventa ve vaccina on and disease eradica on (in previous years input subsidies and headage payments played a larger role, but have recently been reduced for budgetary reasons).
Expenditure on input subsidies for quality breeding animals is a debatable point: improving the na onal fl ocks and herds is clearly of strategic benefi t to the sector, but it is hard to judge to what extent such subsidies genuinely cause farms to purchase be er livestock, and to what extent they just provide a price subsidy for the same animals that would have been bought anyway.
Overall it seems that most of the budget is being used to help farmers stay in the same place, rather than to move the sector forwards to higher levels of effi ciency and greater readiness to enter the EU.
Regula on
In an EU-harmonized system, the most signifi cant regulatory role in the livestock sector is played by the veterinary authori es, and this is an area that came in for considerable cri cism during consulta on with stakeholders. No ma er how good an individual dairy or meat processor may be, they cannot export to the EU un l BiH has obtained the necessary country level approvals from the European Commission. So far this approval is en rely lacking in the key areas of meat, milk, and meat and dairy products, and the eff ects of this will be felt very soon through the loss of the major Croa an market when Croa a enters the EU.
The underlying weaknesses seem to be mainly ins tu onal, and thus the solu ons to them will involve considerable poli cal debate. It is not the role of this study to propose poli cal

110
or ins tu onal solu ons, but to point out that the people of Bosnia and Herzegovina must solve this problem themselves, and do so as quickly as possible in order for the livestock sector to retain its current markets and con nue developing towards its EU future.
111
6. Markets and trade
This chapter looks at domes c and interna onal trade in milk and dairy products: Sec on 6.1 gives a brief overview of the market and main trends in marke ng and consump on. Sec on 6.2 discusses the domes c marke ng structures applicable to meat, milk and dairy products. Sec on 6.3 looks at interna onal trade and discusses how Croa a’s imminent accession to the EU will impact on the BiH livestock sector. Sec on 6.4 presents an overall es mate of the supply balance for the livestock sector in value terms; this complements the physical supply balance for meat presented in sec on 3.10. Sec on 6.5 discusses the signifi cance of “non-marketed produc on” for markets and trade. Sec on 6.6 gives an overall summary of domes c marke ng, interna onal trade and the role of informal produc on and marke ng within the BiH livestock sector.
6.1 Overview
Bosnia and Herzegovina is a small exporter of eggs, approximately self-suffi cient in poultry meat and sheep meat, a minor net importer of pig meat, meat products and off al, and a major net importer of ca le, milk and dairy products. In fi nancial terms, its overall selfsuffi ciency in livestock products is es mated at just over 75 percent (see sec on 6.4 below).
The domes c market is developing, though rather more slowly than Serbia for example, remaining reliant on tradi onal products. A er priva za on of the dairy and meat processing companies, the market has taken progressive steps forward, as strong investment in moderniza on and new capaci es of processors enabled increased farm milk intake. However, the livestock sector is s ll underdeveloped and cannot supply even half of the needs of domes c
meat processors, crea ng a large nega ve trade balance in respect of imports. There are evident improvements in the quality and quan ty of processed milk and meat, especially in diversifi ca on of packaging standards and the range of pack sizes off ered.
The meat processing industry also has seen progressive development. Most of the former state slaughterhouses and meat processing plants simply collapsed in the war, but they have now been replaced by new private enterprises.
As an interes ng contrast to other former Yugoslav republics such as Serbia, the complete destruc on of many processing facili es in the war has meant that new entrepreneurs have o en started afresh on green-fi eld sites, without the burdens of outdated equipment and buildings and the over-manning that so o en hold back development in this region. Many people fl ed the country during the confl ict, and brought back with them not only capital, but also technical and market knowledge gained abroad, including some awareness of consumer trends in western Europe. Whilst there are obviously many excep ons to this generaliza on (e.g. old processing plants s ll func oning, people who remained in Bosnia throughout the war), it was observed at a number of the plants visited, and stood out as being markedly diff erent from most countries in the region.
6.1.1 Factors underlying the current situa on
Domes c commentators tend to a ribute Bosnia and Herzegovina’s lack of export success in the livestock sector to regulatory hurdles in reaching foreign markets, with par cular obstacles being iden fi ed as the lack of animal iden fi ca on systems and accredited laboratories for control of products of animal origin: animal iden fi ca on has been in place since 2006 for ca le, and the system is only now being extended to small
112
ruminants, whilst BiH does not yet have a single laboratory accredited for the control of dairy and meat products. These are commonly seen as being key reasons why Bosnia and Herzegovina is not yet able to export to the EU (whilst the opposite trade is fl ourishing), and its target market is mainly restricted to neighbouring pre-accession countries.
Whilst these are undeniably two important factors, the EU system of health cer fi ca on places increasing emphasis on process control in the expor ng country plants, rather than on tests of the fi nal product. The main restric ons on livestock exports from Bosnia and Herzegovina probably come down to two key issues:
Whether the EU’s DG SANCO and its Food and Veterinary Offi ce really have confi dence in the ability of Bosnia and Herzegovina’s complex and ill-coordinated veterinary services to consistently implement EU standards and rapidly iden fy and resolve problems when they emerge; Whether BiH producers are able to compete on price, quality and marke ng standards with dynamic and export-oriented EU Member States.
Once Bosnia and Herzegovina does succeed in developing a compe ve and well-regulated livestock sector, specifi c issues such as animal iden fi ca on and laboratory tes ng will be rela vely easy to solve.
However, this desirable situa on has not yet been achieved, and for now BiH is largely limited to expor ng its meat and dairy products to neighbouring CEFTA countries. Un l recently Croa a has had so er requirements than the EU and so has been the main des na on for BiH exporters. This has now changed with Croa a’s fi nal prepara ons for EU accession, and its market has begun to be inaccessible for animal products from BiH. Un l Bosnia and Herzegovina manages to fulfi l all requirements for export to the EU it will have to look for alterna ve des na ons to replace its lost Croa an export market by expor ng to less demanding countries (such
as the sudden growth in exports to Lebanon in 2010). During the socialist era a number of North African countries (including Lebanon, Algeria, Morocco and Libya) were signifi cant foreign trade partners for Yugoslavia’s livestock sector; it remains to be seen how the tumultuous events in the region this past year will aff ect trading rela onships.
An alterna ve strategy can be import subs tu on by domes c products. Development trends in the BiH poultry meat market provide a good example, where BiH reduced its trade defi cit by increasing domes c produc on and processing capaci es, and re-orientated them to the manufacture of more complex and higher value products.
As discussed extensively in this report, livestock produc on in BiH is characterized by a high degree of informal, small-scale produc on and consump on. With very low numbers of animals per farm, the small farms are oriented primarily towards produc on of milk and meat for own needs, with the occasional sale of temporary surpluses. This structure increases the costs of raw material collec on and makes it harder to provide a steady supply to processors, who in response turn to imports as a less expensive and more consistent source of raw materials. One view sees this as a vicious circle that progressively weakens internal marke ng structures and encourages producers to abandon their produc on; an alterna ve and more posi ve view of the informal sector is presented in sec on 6.5 at the end of this chapter.
A fi nal issue within the overall picture of livestock trade is the chronic dependence of Bosnia and Herzegovina on imports to secure quality breeding animals, in part because its na onal selec on system is s ll weak and fragmented. However, eff ec ve gene c selec on depends on having a solid base of rela vely large farms with good record-keeping and consistent high standards of feeding, management and health care. These condi ons are very far from the current reality in Bosnia and Herzegovina, and hence the import of gene c material will con nue
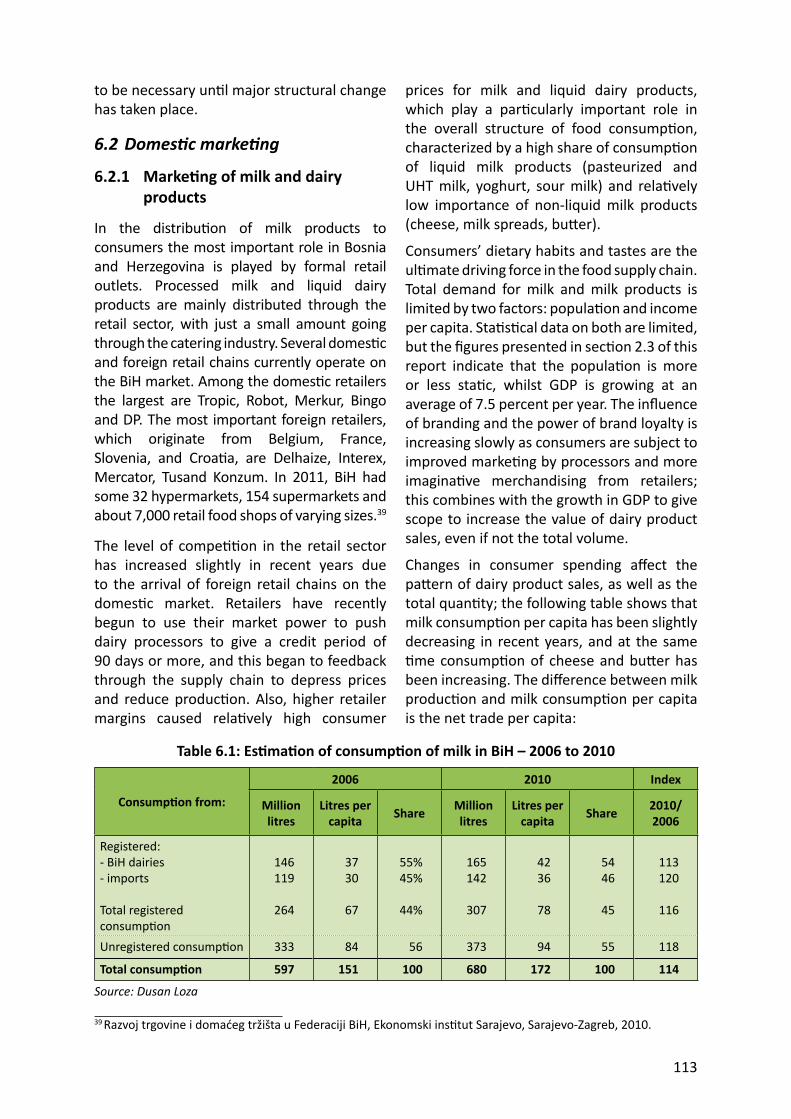
113
to be necessary un l major structural change has taken place.
6.2 Domes c marke ng
6.2.1 Marke ng of milk and dairy products
In the distribu on of milk products to consumers the most important role in Bosnia and Herzegovina is played by formal retail outlets. Processed milk and liquid dairy products are mainly distributed through the retail sector, with just a small amount going through the catering industry. Several domes c and foreign retail chains currently operate on the BiH market. Among the domes c retailers the largest are Tropic, Robot, Merkur, Bingo and DP. The most important foreign retailers, which originate from Belgium, France, Slovenia, and Croa a, are Delhaize, Interex, Mercator, Tusand Konzum. In 2011, BiH had some 32 hypermarkets, 154 supermarkets and about 7,000 retail food shops of varying sizes.39
The level of compe on in the retail sector has increased slightly in recent years due to the arrival of foreign retail chains on the domes c market. Retailers have recently begun to use their market power to push dairy processors to give a credit period of 90 days or more, and this began to feedback through the supply chain to depress prices and reduce produc on. Also, higher retailer margins caused rela vely high consumer
prices for milk and liquid dairy products, which play a par cularly important role in the overall structure of food consump on, characterized by a high share of consump on of liquid milk products (pasteurized and UHT milk, yoghurt, sour milk) and rela vely low importance of non-liquid milk products (cheese, milk spreads, bu er).
Consumers’ dietary habits and tastes are the ul mate driving force in the food supply chain. Total demand for milk and milk products is limited by two factors: popula on and income per capita. Sta s cal data on both are limited, but the fi gures presented in sec on 2.3 of this report indicate that the popula on is more or less sta c, whilst GDP is growing at an average of 7.5 percent per year. The infl uence of branding and the power of brand loyalty is increasing slowly as consumers are subject to improved marke ng by processors and more imagina ve merchandising from retailers; this combines with the growth in GDP to give scope to increase the value of dairy product sales, even if not the total volume.
Changes in consumer spending aff ect the pa ern of dairy product sales, as well as the total quan ty; the following table shows that milk consump on per capita has been slightly decreasing in recent years, and at the same me consump on of cheese and bu er has
been increasing. The diff erence between milk produc on and milk consump on per capita is the net trade per capita:
Table 6.1: Es ma on of consump on of milk in BiH – 2006 to 2010
Consump on from:
2006 2010 Index
Million litres
Litres per capita Share Million
litresLitres per
capita Share 2010/ 2006
Registered:- BiH dairies - imports
Total registered consump on
146119
264
3730
67
55%45%
44%
165142
307
4236
78
5446
45
113120
116
Unregistered consump on 333 84 56 373 94 55 118
Total consump on 597 151 100 680 172 100 114
Source: Dusan Loza
39 Razvoj trgovine i domaćeg tržišta u Federaciji BiH, Ekonomski ins tut Sarajevo, Sarajevo-Zagreb, 2010.
114
Consump on of milk per capita is approximately 172 litres, of which the registered consump on is 44 percent and unregistered consump on 56 percent; In comparison with 2005, per capita consump on of milk has risen 14 percent; Of the registered consump on in 2010, 54 percent was supplied by domes c dairies and 46 percent by imports of dairy products; Unregistered consump on is es mated here to be 56 percent of all milk.
The es mates of milk produc on made in Chapter 2 of this report, based on farm surveys, suggest that considerably more milk is produced and consumed in Bosnia and Herzegovina: Supply to dairies totalling 276 million litres (includes sales to unregistered dairies) instead of 165 million litres (though the same author quotes 211 million litres in another table, quoted in sec on 4.2.1 of this report); Total unregistered consump on (on farm, direct sale, and via green markets and middlemen) of 510 million litres, as compared to 373 million litres in the above table.
6.2.2 The market for milk and dairy products
The product off er in retail outlets is mainly confi ned to tradi onal Balkan staples, but with a reduced emphasis on fermented products. There is hardly any penetra on of imports of non-Balkan products, indica ng that the market is developing only slowly in respect of common EU products. For as long as this con nues, the market will not s mulate any need for product development and the consequent needs for investment.
Both imports and exports have increased over the last fi ve years, but with a con nuing trade gap which reached more than USD 75 million in 2010, almost the same as in 2006. However, the trade gap in terms of weight has narrowed to about 2,000 tonnes as opposed to more than 25,000 in 2006. This
suggests that the average cost of imports has risen more than that of exports, refl ec ng a tendency to import higher value products.The majority of dairy trade is with CEFTA which is the sole des na on for exports of dairy products. The other imports arise from EU Member States.
6.2.3 Domes c market channels
Milk and dairy products reach consumers through a variety of routes, principally: Household use by the extended farm family; Direct sale of milk and dairy products by producers; Sale at green markets, mainly of dairy products but also some mes fresh milk; Sale of packaged milk and dairy products at shops and supermarkets.
Household use
The farm survey conducted for this study found that almost 20 percent of milk was consumed by the “farm household”, though this included an average of 5.7 family members being supplied with milk and dairy products. Since the typical dairy farmer is in his 50s, in most cases this will not be the nuclear family of parents and young children, but the extended family. It is quite common in the rural areas of Bosnia and Herzegovina for a family to build their own house on several levels, with each fl oor occupied by a diff erent part of the family, e.g. parents on one fl oor, one brother and his family on another fl oor, another brother and family on the last fl oor. Whilst this would be treated in a popula on census as three diff erent households, all will use milk and dairy products from the same cows. Where the extended family is not physically located in the same building, it is common for rela ves to live in the same village and to come round each day for their milk.
As well as accoun ng for the rather large number of people included in “household use” of milk, these family arrangements also provide a labour source for ac vi es such as haymaking and repairs to farm buildings.
115
Direct sale
Despite the signifi cant quan es of milk and dairy products believed to be marketed through this route, approaching 10 percent of total human consump on, it has been very li le studied. In some parts of former Yugoslavia, milk producers travel door to door selling milk from a churn, though it is not known whether this prac ce is common in Bosnia and Herzegovina.
Another, and slightly more common, form of direct marke ng is sales of home-made cheese. Many families have their tradi onal supplier, to whom they go once a week to buy white cheese and similar products. O en these rela onships last for many years and become a regular part of the household rou ne.
The hygiene of this arrangement is only as good as that in the kitchens of the farmer and consumers: whilst far below EU standards for dairies and formal retail outlets, it does not appear to be a major source of health problems, and people choosing to buy in this way accept the same risks as if they kept their own cows.
Green markets
Green markets are a long established and important part of the BiH retail sector, though it is diffi cult to quan fy the amount of milk sold through them, since most of it is in the form of products made from the approximately 35 percent of milk processed on the holding. These are found in almost every town, organized by the local municipality and subject to control by veterinary, sanitary and market inspectors.
Usually the market consists of some permanent buildings as well as open-air stalls, with the main sec ons for meat, fi sh and dairy products located inside the buildings. The stalls are focussed on fruit, vegetables and other less sensi ve products but it is also possible to fi nd some hard cheese being sold in the open air. The level of hygiene depends on the size of the market: at the
large markets in Sarajevo, Banja Luka, Mostar and other main ci es the dairy counters have refrigera on, washable surfaces and appropriately clothed staff , whilst in the smaller markets the counter-top may be a simple plas c tablecloth.
Whilst originally conceived as “farmers’ markets” an increasing propor on of the trade is carried on by professional retailers or “middlemen”. Veterinary regula ons state that dairy products can only be sold at green markets from registered farms mee ng various hygiene condi ons and poten ally subject to inspec on. In prac ce this system may extend some control to the holding of the actual stallholders but fails to encompass the various neighbouring farmers whose products they also sell.
Each vendor at a green market has to pay rent for their stall, as well as being subject to various forms of inspec on. Therefore many of the markets spawned an informal periphery of street vendors, whose a en on to hygiene was scant, to say the least.
Shops and supermarkets
The approximately 35 percent of milk sold to registered dairies, plus the signifi cant quan es of dairy imports, fi nd their way to consumers almost en rely through formal shops and supermarkets. In the socialist era each major city in Bosnia and Herzegovina had one of more trade companies. They had from tens to thousands of shops, most of which sold food as well as other products. Most of these state companies have now been priva zed; some of the new owners have kept the same type of business but many of them have not. Parallel with priva za on of the established trading sector, some of the new entrepreneurs opened their own new shops. Most of the signifi cant popula on centres of Bosnia and Herzegovina are now covered by one or more of the large supermarket chains such as Delta (now Delhaize), Mercator, Interex and Konzum, but even so many locally owned companies have been successful in compe ng with them and so far have
116
survived.
The current retail structure can be viewed as three main groups:
Large supermarkets/hypermarkets. These include the larger stores of the big national chains, and the few but large supermarkets so far established by international or local chains. They are increasingly being located in edge-of-town retail parks and all have large areas for car parking. They tend to advertise nationally on television and in newspapers, using price and special offers to attract customers to their stores, and offer the keenest prices in the retail sector. Large shops/small supermarkets. These include the smaller in-town stores run by the na onal supermarket groups and by Konzum from Croa a, shops kept by local chains, and some independent shops. The large supermarket chains operate a fl at-rate pricing policy, so their smaller stores combine the convenience of a local shop with the a rac ve prices of a large chain. Small shops. These are mainly small family-run businesses, which can be found in every neighbourhood. They cannot match the buying power of the large mul ples and so their prices are higher, but they off er convenience and service, and will o en extend informal credit to their established customers.
The trend is defi nitely for growth of the larger supermarkets, and most families with a car tend to do their main weekly shop in a supermarket and use their local store for perishable products such as bread and milk, and for anything they run out of. However, there are s ll very many families without their own transport, who remain dependent on their neighbourhood shop.
All of these shops and supermarkets are subject to control by sanitary and, if they sell meat, veterinary inspectors. Whilst standards of management may vary from shop to shop, and space constraints some mes
threaten to compromise hygiene, prac cally all shops are equipped with chill cabinets, washable surfaces, etc. and should not face any par cular problems in complying with EU regula ons for the retail sale of milk and dairy products, and the large supermarket chains are already opera ng to EU standards.
The perishable nature of many dairy products means that small shops con nue to play a bigger role in the dairy sector than for many other kinds of products. The exact marke ng split varies from product to product, but unfortunately no detailed market data are yet available.
Shops and supermarkets obtain these products through contracts with dairy processors, and the larger the business, the greater the nego a ng power. The main suppliers of hypermarkets and supermarkets are the biggest diaries in BiH (Mlijekoprodukt, Megle, Inmer, Milkos, PPM Tuzla and Natura Vita). Small market chains and individual markets are mostly oriented to the supplies and product range off ered by the nearest local dairy, but as far as most other dairies are concerned, the supermarkets have the upper hand. Prac ces reported – and complained about loudly – by the surveyed dairies included: The system of “rebates” whereby the large retail chains nego ate discounts of 515 percent on the published price list that the dairies apply to their smaller customers. Long delays in payment, which mean that the supermarkets have usually sold the products and had use of the money for several weeks before paying their suppliers. The insistence by the larger retail chains that each of their suppliers pays a placement charge, some mes in thousands of euros, for each individual product (barcode) placed on their shelves.
6.3 Interna onal tradeThis sec on analyses the foreign trade of Bosnia and Herzegovina in each area of the livestock sector, based on offi cial customs data.
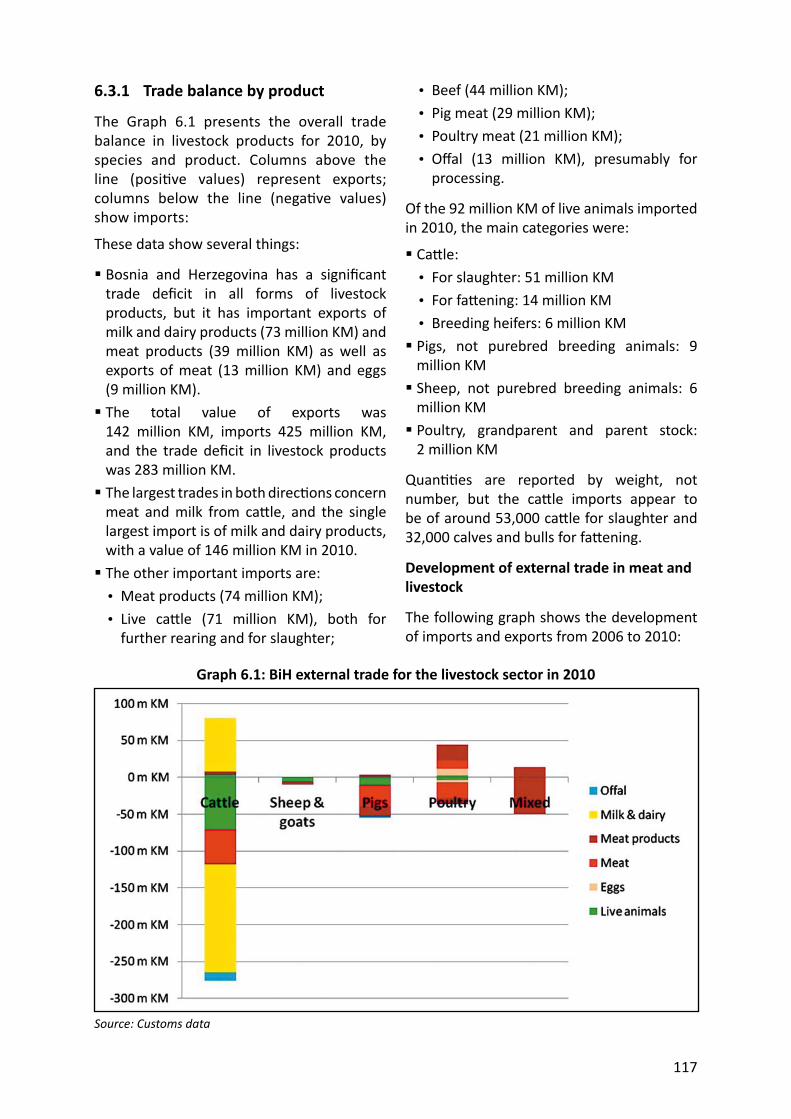
117
6.3.1 Trade balance by product
The Graph 6.1 presents the overall trade balance in livestock products for 2010, by species and product. Columns above the line (posi ve values) represent exports; columns below the line (nega ve values) show imports:
These data show several things:
Bosnia and Herzegovina has a signifi cant trade defi cit in all forms of livestock products, but it has important exports of milk and dairy products (73 million KM) and meat products (39 million KM) as well as exports of meat (13 million KM) and eggs (9 million KM). The total value of exports was 142 million KM, imports 425 million KM, and the trade defi cit in livestock products was 283 million KM. The largest trades in both direc ons concern meat and milk from ca le, and the single largest import is of milk and dairy products, with a value of 146 million KM in 2010. The other important imports are:• Meat products (74 million KM);• Live ca le (71 million KM), both for
further rearing and for slaughter;
Graph 6.1: BiH external trade for the livestock sector in 2010
Source: Customs data
• Beef (44 million KM);• Pig meat (29 million KM);• Poultry meat (21 million KM);• Off al (13 million KM), presumably for
processing.
Of the 92 million KM of live animals imported in 2010, the main categories were:
Ca le:• For slaughter: 51 million KM• For fa ening: 14 million KM• Breeding heifers: 6 million KM Pigs, not purebred breeding animals: 9 million KM Sheep, not purebred breeding animals: 6 million KM Poultry, grandparent and parent stock: 2 million KM
Quan es are reported by weight, not number, but the ca le imports appear to be of around 53,000 ca le for slaughter and 32,000 calves and bulls for fa ening.
Development of external trade in meat and livestock
The following graph shows the development of imports and exports from 2006 to 2010:
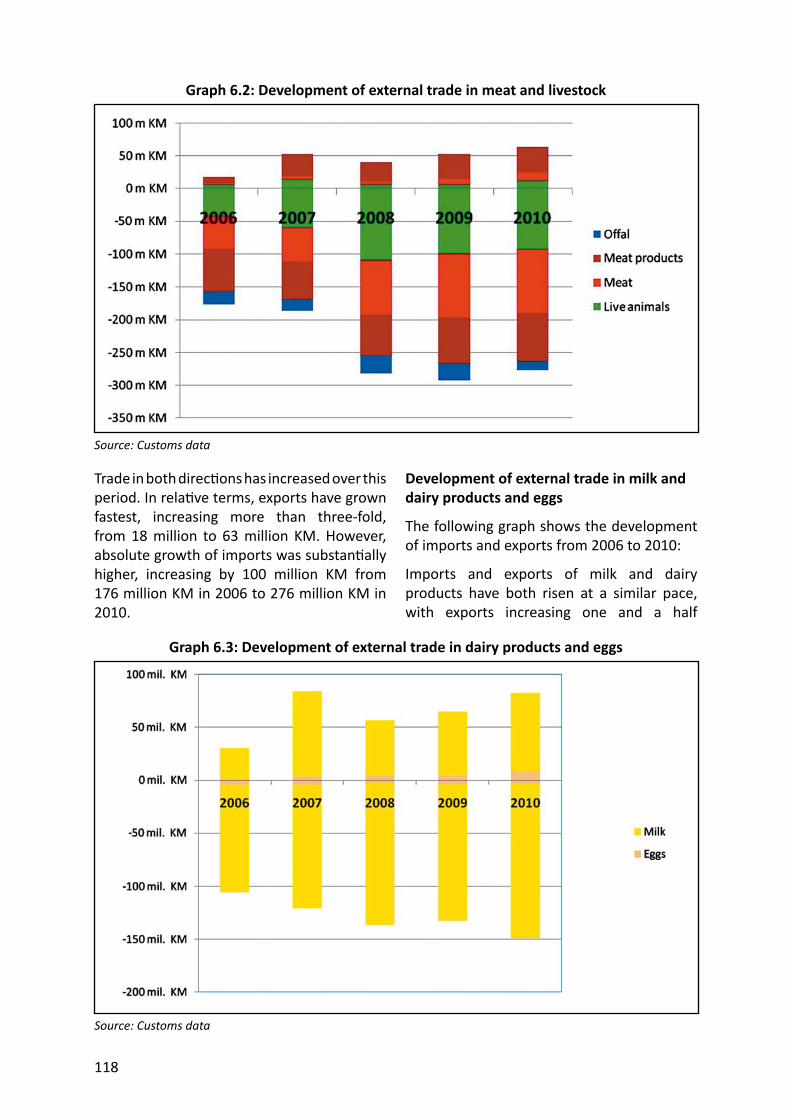
118
Trade in both direc ons has increased over this period. In rela ve terms, exports have grown fastest, increasing more than three-fold, from 18 million to 63 million KM. However, absolute growth of imports was substan ally higher, increasing by 100 million KM from 176 million KM in 2006 to 276 million KM in 2010.
Graph 6.2: Development of external trade in meat and livestock
Source: Customs data
Development of external trade in milk and dairy products and eggs
The following graph shows the development of imports and exports from 2006 to 2010:
Imports and exports of milk and dairy products have both risen at a similar pace, with exports increasing one and a half
Graph 6.3: Development of external trade in dairy products and eggs
Source: Customs data
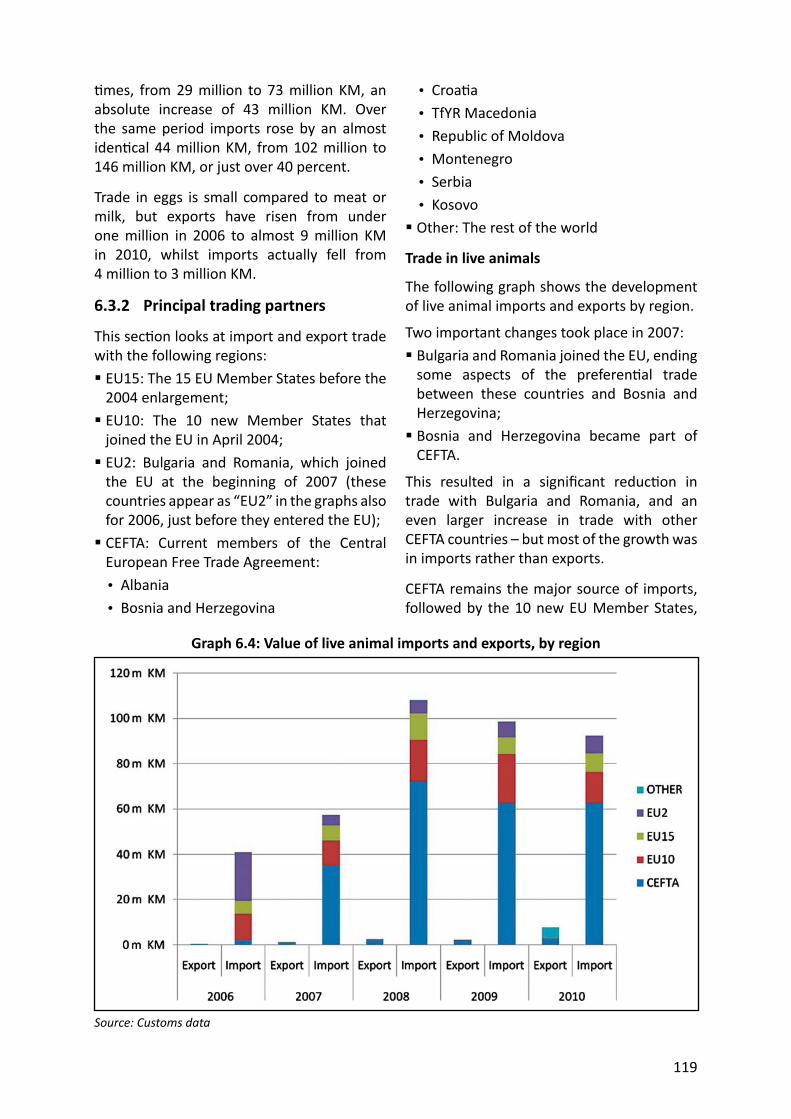
119
mes, from 29 million to 73 million KM, an absolute increase of 43 million KM. Over the same period imports rose by an almost iden cal 44 million KM, from 102 million to 146 million KM, or just over 40 percent.
Trade in eggs is small compared to meat or milk, but exports have risen from under one million in 2006 to almost 9 million KM in 2010, whilst imports actually fell from 4 million to 3 million KM.
6.3.2 Principal trading partners
This sec on looks at import and export trade with the following regions: EU15: The 15 EU Member States before the 2004 enlargement; EU10: The 10 new Member States that joined the EU in April 2004; EU2: Bulgaria and Romania, which joined the EU at the beginning of 2007 (these countries appear as “EU2” in the graphs also for 2006, just before they entered the EU); CEFTA: Current members of the Central European Free Trade Agreement:• Albania• Bosnia and Herzegovina
• Croa a• TfYR Macedonia• Republic of Moldova• Montenegro• Serbia• Kosovo Other: The rest of the world
Trade in live animals
The following graph shows the development of live animal imports and exports by region.
Two important changes took place in 2007: Bulgaria and Romania joined the EU, ending some aspects of the preferen al trade between these countries and Bosnia and Herzegovina; Bosnia and Herzegovina became part of CEFTA.
This resulted in a signifi cant reduc on in trade with Bulgaria and Romania, and an even larger increase in trade with other CEFTA countries – but most of the growth was in imports rather than exports.
CEFTA remains the major source of imports, followed by the 10 new EU Member States,
Graph 6.4: Value of live animal imports and exports, by region
Source: Customs data
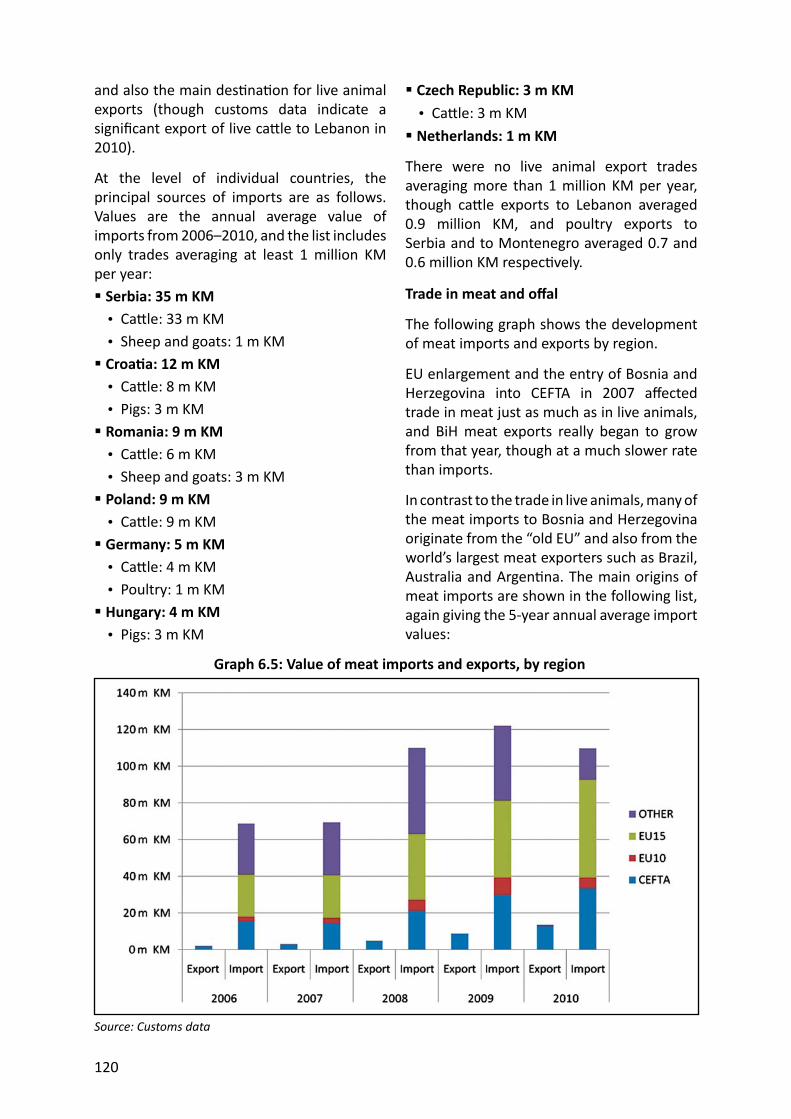
120
and also the main des na on for live animal exports (though customs data indicate a signifi cant export of live ca le to Lebanon in 2010).
At the level of individual countries, the principal sources of imports are as follows. Values are the annual average value of imports from 2006–2010, and the list includes only trades averaging at least 1 million KM per year: Serbia: 35 m KM• Ca le: 33 m KM• Sheep and goats: 1 m KM Croa a: 12 m KM• Ca le: 8 m KM• Pigs: 3 m KM Romania: 9 m KM• Ca le: 6 m KM• Sheep and goats: 3 m KM Poland: 9 m KM• Ca le: 9 m KM Germany: 5 m KM• Ca le: 4 m KM• Poultry: 1 m KM Hungary: 4 m KM• Pigs: 3 m KM
Czech Republic: 3 m KM• Ca le: 3 m KM Netherlands: 1 m KM
There were no live animal export trades averaging more than 1 million KM per year, though ca le exports to Lebanon averaged 0.9 million KM, and poultry exports to Serbia and to Montenegro averaged 0.7 and 0.6 million KM respec vely.
Trade in meat and off al
The following graph shows the development of meat imports and exports by region.
EU enlargement and the entry of Bosnia and Herzegovina into CEFTA in 2007 aff ected trade in meat just as much as in live animals, and BiH meat exports really began to grow from that year, though at a much slower rate than imports.
In contrast to the trade in live animals, many of the meat imports to Bosnia and Herzegovina originate from the “old EU” and also from the world’s largest meat exporters such as Brazil, Australia and Argen na. The main origins of meat imports are shown in the following list, again giving the 5-year annual average import values:
Graph 6.5: Value of meat imports and exports, by region
Source: Customs data
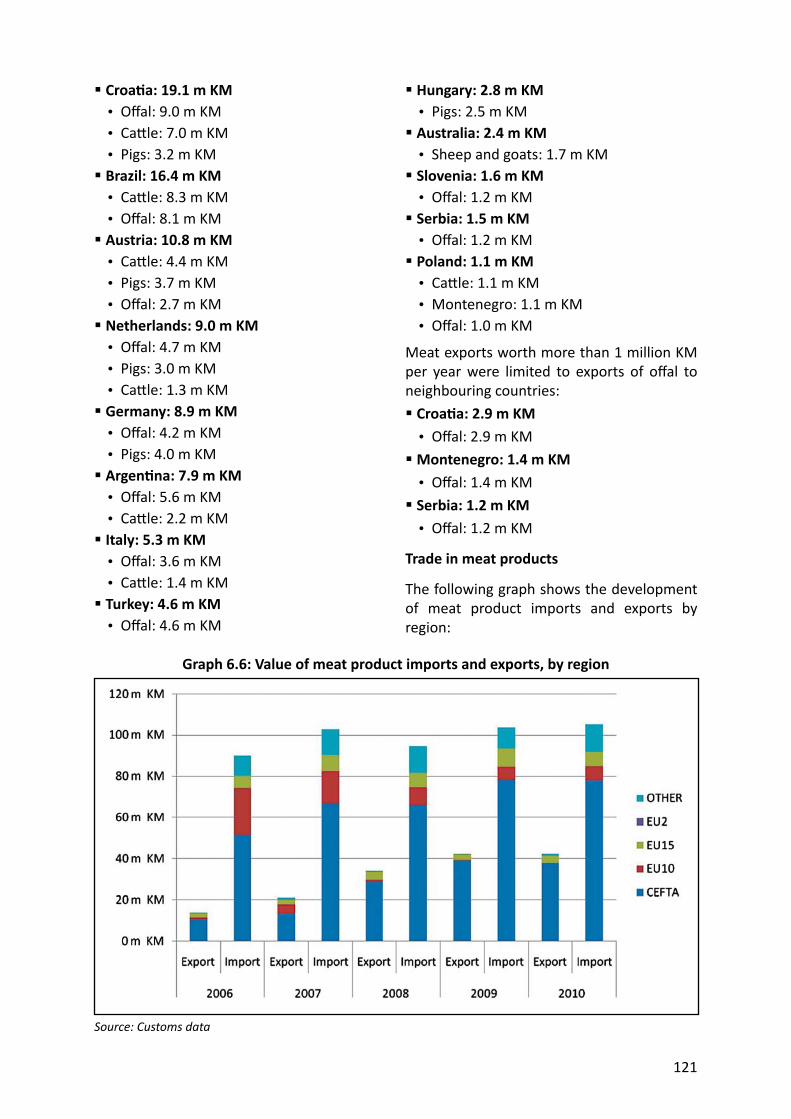
121
Croa a: 19.1 m KM• Off al: 9.0 m KM• Ca le: 7.0 m KM• Pigs: 3.2 m KM Brazil: 16.4 m KM• Ca le: 8.3 m KM• Off al: 8.1 m KM Austria: 10.8 m KM• Ca le: 4.4 m KM• Pigs: 3.7 m KM• Off al: 2.7 m KM Netherlands: 9.0 m KM• Off al: 4.7 m KM• Pigs: 3.0 m KM• Ca le: 1.3 m KM Germany: 8.9 m KM• Off al: 4.2 m KM• Pigs: 4.0 m KM Argen na: 7.9 m KM• Off al: 5.6 m KM• Ca le: 2.2 m KM Italy: 5.3 m KM• Off al: 3.6 m KM• Ca le: 1.4 m KM Turkey: 4.6 m KM• Off al: 4.6 m KM
Hungary: 2.8 m KM• Pigs: 2.5 m KM Australia: 2.4 m KM• Sheep and goats: 1.7 m KM Slovenia: 1.6 m KM• Off al: 1.2 m KM Serbia: 1.5 m KM• Off al: 1.2 m KM Poland: 1.1 m KM• Ca le: 1.1 m KM• Montenegro: 1.1 m KM• Off al: 1.0 m KM
Meat exports worth more than 1 million KM per year were limited to exports of off al to neighbouring countries: Croa a: 2.9 m KM• Off al: 2.9 m KM Montenegro: 1.4 m KM• Off al: 1.4 m KM Serbia: 1.2 m KM• Off al: 1.2 m KM
Trade in meat products
The following graph shows the development of meat product imports and exports by region:
Graph 6.6: Value of meat product imports and exports, by region
Source: Customs data
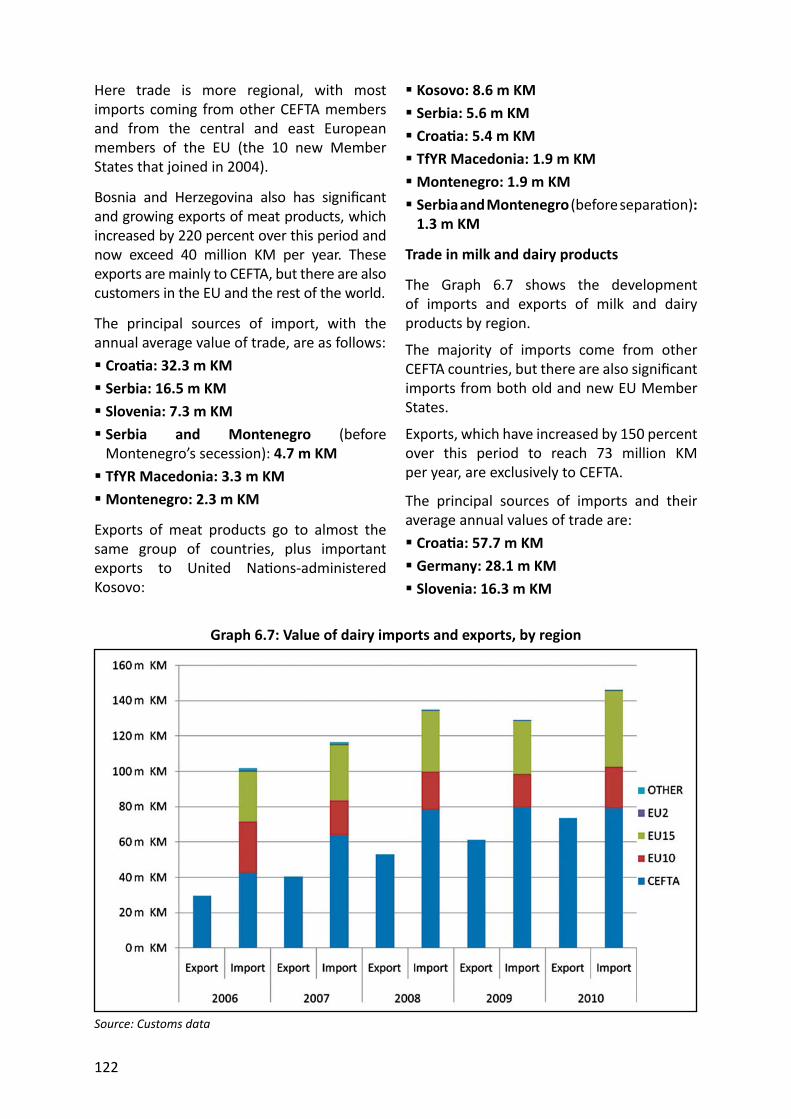
122
Here trade is more regional, with most imports coming from other CEFTA members and from the central and east European members of the EU (the 10 new Member States that joined in 2004).
Bosnia and Herzegovina also has signifi cant and growing exports of meat products, which increased by 220 percent over this period and now exceed 40 million KM per year. These exports are mainly to CEFTA, but there are also customers in the EU and the rest of the world.
The principal sources of import, with the annual average value of trade, are as follows: Croa a: 32.3 m KM Serbia: 16.5 m KM Slovenia: 7.3 m KM Serbia and Montenegro (before Montenegro’s secession): 4.7 m KM TfYR Macedonia: 3.3 m KM Montenegro: 2.3 m KM
Exports of meat products go to almost the same group of countries, plus important exports to United Na ons-administered Kosovo:
Kosovo: 8.6 m KM Serbia: 5.6 m KM Croa a: 5.4 m KM TfYR Macedonia: 1.9 m KM Montenegro: 1.9 m KM Serbia and Montenegro (before separa on): 1.3 m KM
Trade in milk and dairy products
The Graph 6.7 shows the development of imports and exports of milk and dairy products by region.
The majority of imports come from other CEFTA countries, but there are also signifi cant imports from both old and new EU Member States.
Exports, which have increased by 150 percent over this period to reach 73 million KM per year, are exclusively to CEFTA.
The principal sources of imports and their average annual values of trade are: Croa a: 57.7 m KM Germany: 28.1 m KM Slovenia: 16.3 m KM
Graph 6.7: Value of dairy imports and exports, by region
Source: Customs data
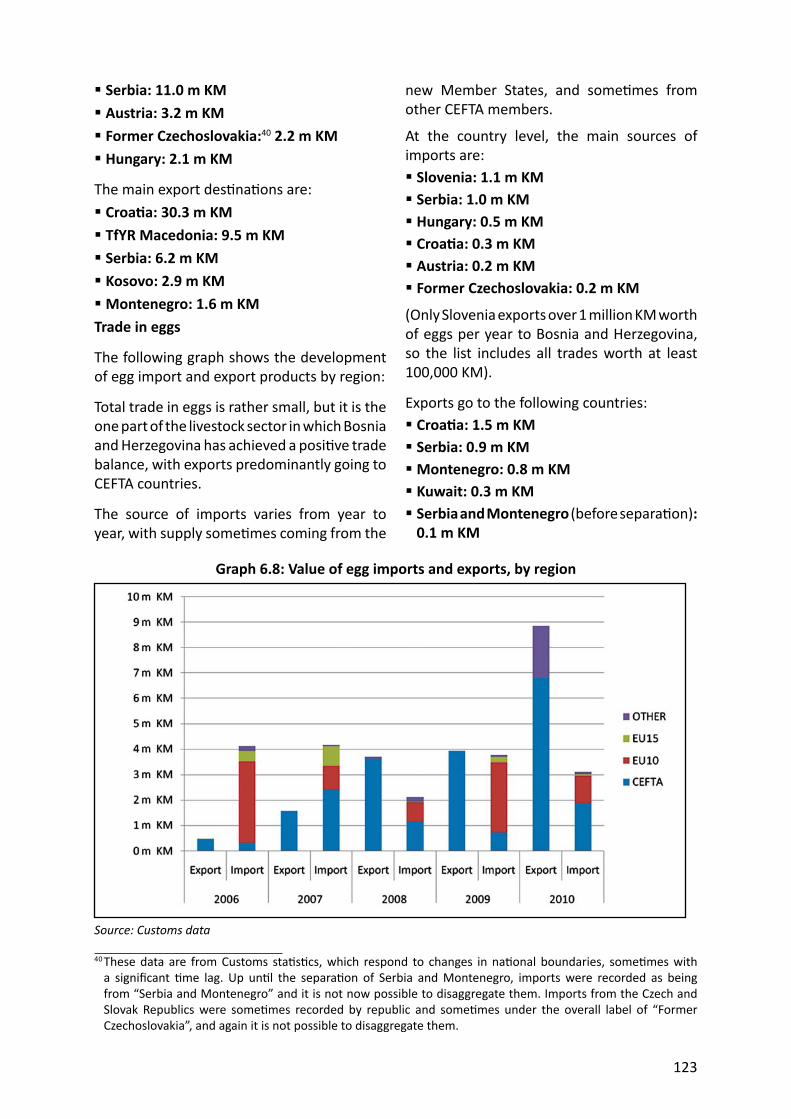
123
Serbia: 11.0 m KM Austria: 3.2 m KM Former Czechoslovakia:40 2.2 m KM Hungary: 2.1 m KM
The main export des na ons are: Croa a: 30.3 m KM TfYR Macedonia: 9.5 m KM Serbia: 6.2 m KM Kosovo: 2.9 m KM Montenegro: 1.6 m KM
Trade in eggs
The following graph shows the development of egg import and export products by region:
Total trade in eggs is rather small, but it is the one part of the livestock sector in which Bosnia and Herzegovina has achieved a posi ve trade balance, with exports predominantly going to CEFTA countries.
The source of imports varies from year to year, with supply some mes coming from the
Graph 6.8: Value of egg imports and exports, by region
Source: Customs data
new Member States, and some mes from other CEFTA members.
At the country level, the main sources of imports are: Slovenia: 1.1 m KM Serbia: 1.0 m KM Hungary: 0.5 m KM Croa a: 0.3 m KM Austria: 0.2 m KM Former Czechoslovakia: 0.2 m KM
(Only Slovenia exports over 1 million KM worth of eggs per year to Bosnia and Herzegovina, so the list includes all trades worth at least 100,000 KM).
Exports go to the following countries: Croa a: 1.5 m KM Serbia: 0.9 m KM Montenegro: 0.8 m KM Kuwait: 0.3 m KM Serbia and Montenegro (before separa on): 0.1 m KM
40 These data are from Customs sta s cs, which respond to changes in na onal boundaries, some mes with a signifi cant me lag. Up un l the separa on of Serbia and Montenegro, imports were recorded as being from “Serbia and Montenegro” and it is not now possible to disaggregate them. Imports from the Czech and Slovak Republics were some mes recorded by republic and some mes under the overall label of “Former Czechoslovakia”, and again it is not possible to disaggregate them.
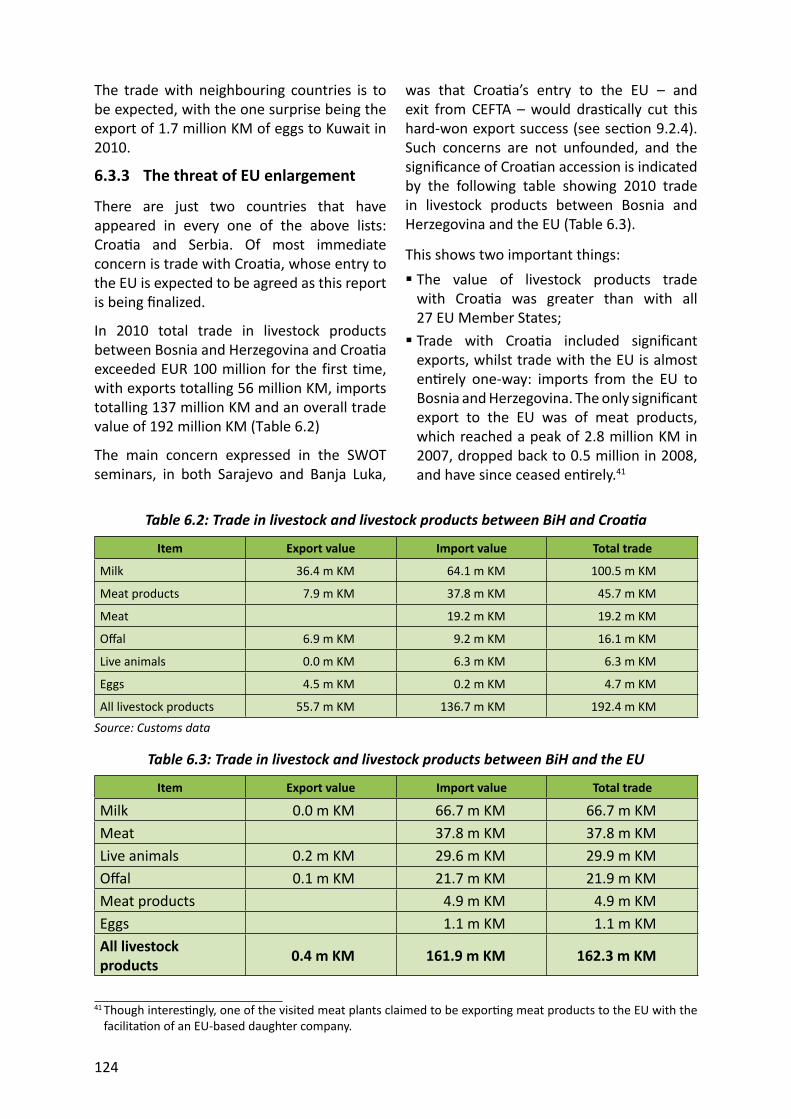
124
The trade with neighbouring countries is to be expected, with the one surprise being the export of 1.7 million KM of eggs to Kuwait in 2010.
6.3.3 The threat of EU enlargement
There are just two countries that have appeared in every one of the above lists: Croa a and Serbia. Of most immediate concern is trade with Croa a, whose entry to the EU is expected to be agreed as this report is being fi nalized.
In 2010 total trade in livestock products between Bosnia and Herzegovina and Croa a exceeded EUR 100 million for the first time, with exports totalling 56 million KM, imports totalling 137 million KM and an overall trade value of 192 million KM (Table 6.2)
The main concern expressed in the SWOT seminars, in both Sarajevo and Banja Luka,
Table 6.2: Trade in livestock and livestock products between BiH and Croa a
Item Export value Import value Total trade
Milk 36.4 m KM 64.1 m KM 100.5 m KM
Meat products 7.9 m KM 37.8 m KM 45.7 m KM
Meat 19.2 m KM 19.2 m KM
Off al 6.9 m KM 9.2 m KM 16.1 m KM
Live animals 0.0 m KM 6.3 m KM 6.3 m KM
Eggs 4.5 m KM 0.2 m KM 4.7 m KM
All livestock products 55.7 m KM 136.7 m KM 192.4 m KMSource: Customs data
Table 6.3: Trade in livestock and livestock products between BiH and the EU
Item Export value Import value Total trade
Milk 0.0 m KM 66.7 m KM 66.7 m KMMeat 37.8 m KM 37.8 m KMLive animals 0.2 m KM 29.6 m KM 29.9 m KMOff al 0.1 m KM 21.7 m KM 21.9 m KMMeat products 4.9 m KM 4.9 m KMEggs 1.1 m KM 1.1 m KMAll livestock products 0.4 m KM 161.9 m KM 162.3 m KM
was that Croa a’s entry to the EU – and exit from CEFTA – would dras cally cut this hard-won export success (see sec on 9.2.4). Such concerns are not unfounded, and the signifi cance of Croa an accession is indicated by the following table showing 2010 trade in livestock products between Bosnia and Herzegovina and the EU (Table 6.3).
This shows two important things: The value of livestock products trade with Croa a was greater than with all 27 EU Member States; Trade with Croa a included signifi cant exports, whilst trade with the EU is almost en rely one-way: imports from the EU to Bosnia and Herzegovina. The only signifi cant export to the EU was of meat products, which reached a peak of 2.8 million KM in 2007, dropped back to 0.5 million in 2008, and have since ceased en rely.41
41 Though interes ngly, one of the visited meat plants claimed to be expor ng meat products to the EU with the facilita on of an EU-based daughter company.
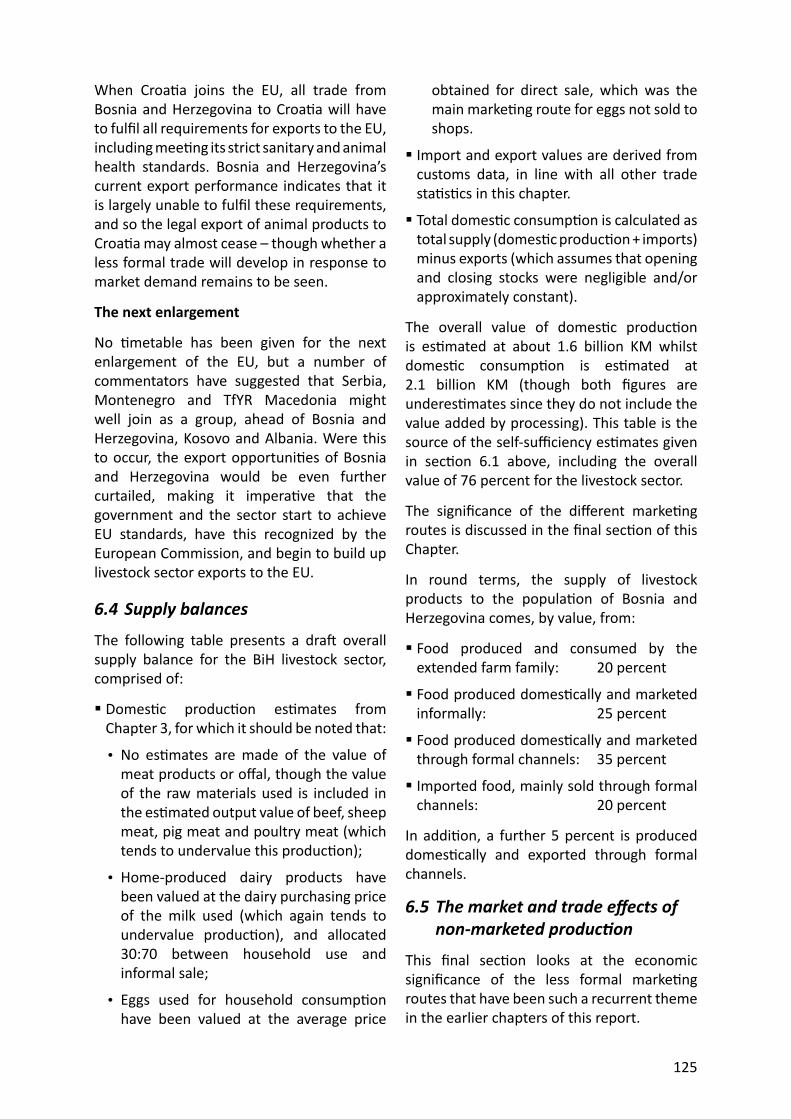
125
When Croa a joins the EU, all trade from Bosnia and Herzegovina to Croa a will have to fulfi l all requirements for exports to the EU, including mee ng its strict sanitary and animal health standards. Bosnia and Herzegovina’s current export performance indicates that it is largely unable to fulfi l these requirements, and so the legal export of animal products to Croa a may almost cease – though whether a less formal trade will develop in response to market demand remains to be seen.
The next enlargement
No metable has been given for the next enlargement of the EU, but a number of commentators have suggested that Serbia, Montenegro and TfYR Macedonia might well join as a group, ahead of Bosnia and Herzegovina, Kosovo and Albania. Were this to occur, the export opportuni es of Bosnia and Herzegovina would be even further curtailed, making it impera ve that the government and the sector start to achieve EU standards, have this recognized by the European Commission, and begin to build up livestock sector exports to the EU.
6.4 Supply balances
The following table presents a dra overall supply balance for the BiH livestock sector, comprised of:
Domes c produc on es mates from Chapter 3, for which it should be noted that:
• No es mates are made of the value of meat products or off al, though the value of the raw materials used is included in the es mated output value of beef, sheep meat, pig meat and poultry meat (which tends to undervalue this produc on);
• Home-produced dairy products have been valued at the dairy purchasing price of the milk used (which again tends to undervalue produc on), and allocated 30:70 between household use and informal sale;
• Eggs used for household consump on have been valued at the average price
obtained for direct sale, which was the main marke ng route for eggs not sold to shops.
Import and export values are derived from customs data, in line with all other trade sta s cs in this chapter.
Total domes c consump on is calculated as total supply (domes c produc on + imports) minus exports (which assumes that opening and closing stocks were negligible and/or approximately constant).
The overall value of domes c produc on is es mated at about 1.6 billion KM whilst domes c consump on is es mated at 2.1 billion KM (though both fi gures are underes mates since they do not include the value added by processing). This table is the source of the self-suffi ciency es mates given in sec on 6.1 above, including the overall value of 76 percent for the livestock sector.
The signifi cance of the diff erent marke ng routes is discussed in the fi nal sec on of this Chapter.
In round terms, the supply of livestock products to the popula on of Bosnia and Herzegovina comes, by value, from:
Food produced and consumed by the extended farm family: 20 percent
Food produced domes cally and marketed informally: 25 percent
Food produced domes cally and marketed through formal channels: 35 percent
Imported food, mainly sold through formal channels: 20 percent
In addi on, a further 5 percent is produced domes cally and exported through formal channels.
6.5 The market and trade eff ects of non-marketed produc on
This fi nal sec on looks at the economic signifi cance of the less formal marke ng routes that have been such a recurrent theme in the earlier chapters of this report.
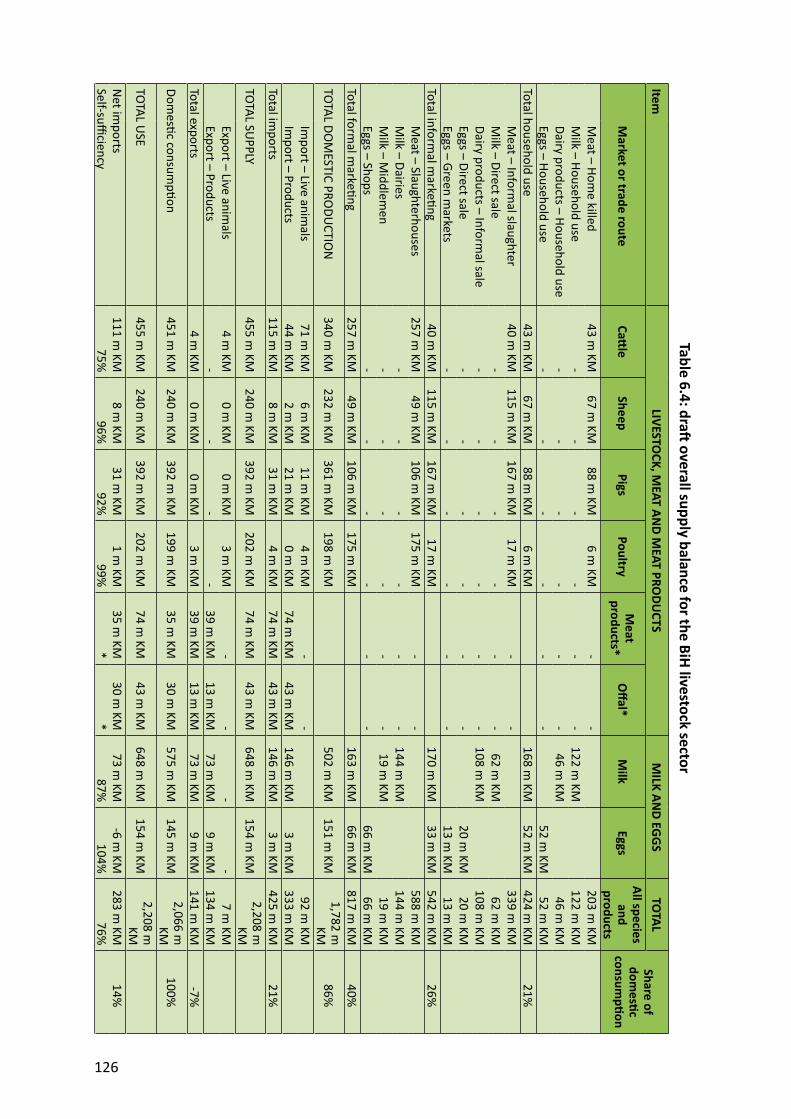
126
Table 6.4: dra overall supply balance for the BiH livestock sector
ItemLIVESTO
CK, MEAT AN
D MEAT PRO
DUCTS
MILK AN
D EGGSTO
TALShare of dom
es c
consump
on
Market or trade route
Ca le
SheepPigs
PoultryM
eat products*
Off al*
Milk
EggsAll species
and products
M
eat – Home killed
43 m KM
67 m KM
88 m KM
6 m KM
--
203 m KM
M
ilk – Household use-
--
--
-122 m
KM
122 m KM
Dairy products – Household use
--
--
--
46 m KM
46 m
KM
Eggs – Household use-
--
--
-
52 m KM
52 m KM
Total household use43 m
KM67 m
KM88 m
KM6 m
KM
168 m
KM52 m
KM424 m
KM21%
M
eat – Informal slaughter
40 m KM
115 m KM
167 m KM
17 m KM
--
339 m KM
M
ilk – Direct sale-
--
--
-62 m
KM
62 m KM
Dairy products – Inform
al sale-
--
--
-108 m
KM
108 m KM
Eggs – Direct sale
--
--
--
20 m
KM20 m
KM
Eggs – Green markets
--
--
--
13 m
KM13 m
KMTotal inform
al marke
ng40 m
KM115 m
KM167 m
KM17 m
KM
170 m
KM33 m
KM542 m
KM26%
M
eat – Slaughterhouses257 m
KM49 m
KM106 m
KM175 m
KM-
-
588 m
KM
Milk – Dairies
--
--
--
144 m KM
144 m
KM
Milk – M
iddlemen
--
--
--
19 m KM
19 m
KM
Eggs – Shops-
--
--
-
66 m KM
66 m KM
Total formal m
arke ng
257 m KM
49 m KM
106 m KM
175 m KM
163 m KM
66 m KM
817 m KM
40%
TOTAL DOM
ESTIC PRODU
CTION
340 m KM
232 m KM
361 m KM
198 m KM
502 m KM
151 m KM
1,782 m
KM86%
Im
port – Live animals
71 m KM
6 m KM
11 m KM
4 m KM
--
92 m KM
Im
port – Products44 m
KM2 m
KM21 m
KM0 m
KM74 m
KM43 m
KM146 m
KM3 m
KM333 m
KMTotal im
ports115 m
KM8 m
KM31 m
KM4 m
KM74 m
KM43 m
KM146 m
KM3 m
KM425 m
KM21%
TOTAL SUPPLY
455 m KM
240 m KM
392 m KM
202 m KM
74 m KM
43 m KM
648 m KM
154 m KM
2,208 m
KM
Export – Live animals
4 m KM
0 m KM
0 m KM
3 m KM
--
--
7 m KM
Export – Products
--
--
39 m KM
13 m KM
73 m KM
9 m KM
134 m KM
Total exports4 m
KM0 m
KM0 m
KM3 m
KM39 m
KM13 m
KM73 m
KM9 m
KM141 m
KM-7%
Domes
c consump
on451 m
KM240 m
KM392 m
KM199 m
KM35 m
KM30 m
KM575 m
KM145 m
KM2,066 m
KM
100%
TOTAL USE
455 m KM
240 m KM
392 m KM
202 m KM
74 m KM
43 m KM
648 m KM
154 m KM
2,208 m
KMN
et imports
111 m KM
8 m KM
31 m KM
1 m KM
35 m KM
30 m KM
73 m KM
-6 m KM
283 m KM
14%Self-suffi ciency
75%96%
92%99%
**
87%104%
76%
127
Marke ng routes for meat and milk
In Bosnia and Herzegovina, meat, milk and dairy products reach the consumer through fi ve main routes:1. Sale to registered slaughterhouses and
dairies, which in turn sell their products to registered shops and supermarkets. This route accounts for around 38 percent of all milk for human consump on and 54 percent of meat.
2. Sale through green markets; although less structured than shops and supermarkets, these are registered marke ng channels, subject to inspec on supervision and monitored by the sta s cal offi ces. They are not a major outlet for meat but account for up to a third of all milk, mainly in the form of cheese and fermented products produced on the holding.
3. Direct sale of live animals to butchers and restaurants; this results in unregistered slaughtering, though the fi nal retail sale of the meat in the butchers’ shops and restaurants is a registered ac vity. It is es mated that 28 percent of all meat is marketed in this way, with its role greatest for sheep meat and least important for poultry meat.
4. Direct sale of milk, dairy products, meat and live animals to friends and neighbours in the village; this is essen ally an unregistered ac vity, though it is common prac ce to submit pig meat samples to the local veterinarian for trichinella tes ng before star ng to consume a home-killed pig. Such direct sales are much more important for milk and dairy products than for meat, account for approximately 9 percent of milk.
5. Consump on by the farm family and rela ves without any marke ng or exchange of money. This is quite common in the villages, and as most town-dwellers s ll have some rela ves living in the countryside, it is common for them to bring back products such as cheese and pršut a er each visit to their rela ves. It is es mated that around 16 percent of all
milk is consumed by farming families and rela ves. Around 18 percent of all meat is slaughtered on the farm and either consumed by the farm family or (less frequently) sold directly to friends and neighbours.
There is a tendency for commentators and policy-makers to focus just on the fi rst of these fi ve routes, and thus to ignore around half of all livestock output (46 percent of meat produc on and 62 percent of dairy produc on), claiming that only the fi rst route counts as “market” or “commercial” produc on.
Contribu on to food supply and agricultural incomes
The main objectives of agriculture are to produce food for the consumer and income for the producer. Clearly all five routes contribute to the supply of food, and the first four routes all generate income for the farmer; indeed, the farmer who processes his own milk and sells the products direct or at a green market can double his cash income compared to selling the milk to a dairy. The fifth route does not directly generate income but it is “income-saving”, in that the farming family does not need to earn money to buy its meat and dairy products, and so is of equal value to the farmer. Thus from an economic perspective, all five routes are equally valid and all contribute to GDP.
The main weaknesses of the less formal marke ng routes are that hygiene and animal welfare are less controlled, that they tend to avoid the tax system, and that their products are not generally available for export, though they do contribute directly to the balance of payments.
Eff ect on markets and trade
If the “market” is considered as the formal wholesale and retail channels, with their supply, demand and price forma on, then how does each of the fi ve marke ng routes act on the market?
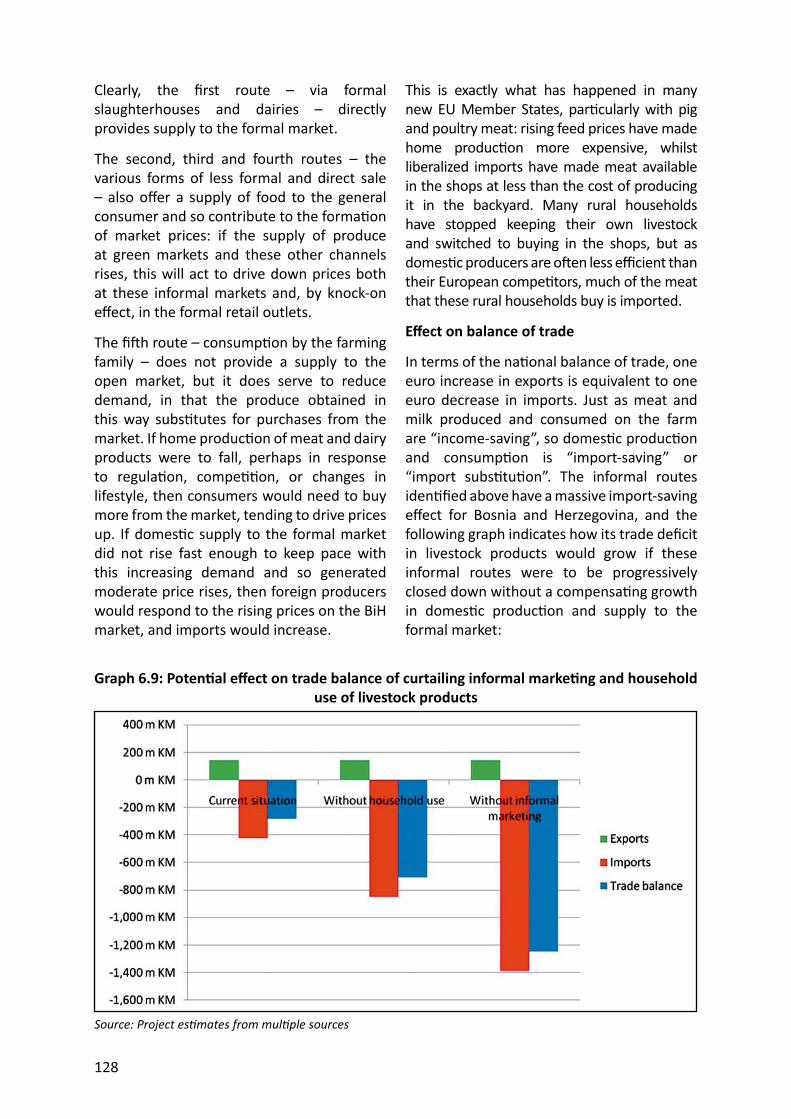
128
Clearly, the fi rst route – via formal slaughterhouses and dairies – directly provides supply to the formal market.
The second, third and fourth routes – the various forms of less formal and direct sale – also off er a supply of food to the general consumer and so contribute to the forma on of market prices: if the supply of produce at green markets and these other channels rises, this will act to drive down prices both at these informal markets and, by knock-on eff ect, in the formal retail outlets.
The fi h route – consump on by the farming family – does not provide a supply to the open market, but it does serve to reduce demand, in that the produce obtained in this way subs tutes for purchases from the market. If home produc on of meat and dairy products were to fall, perhaps in response to regula on, compe on, or changes in lifestyle, then consumers would need to buy more from the market, tending to drive prices up. If domes c supply to the formal market did not rise fast enough to keep pace with this increasing demand and so generated moderate price rises, then foreign producers would respond to the rising prices on the BiH market, and imports would increase.
This is exactly what has happened in many new EU Member States, par cularly with pig and poultry meat: rising feed prices have made home produc on more expensive, whilst liberalized imports have made meat available in the shops at less than the cost of producing it in the backyard. Many rural households have stopped keeping their own livestock and switched to buying in the shops, but as domes c producers are o en less effi cient than their European compe tors, much of the meat that these rural households buy is imported.
Eff ect on balance of trade
In terms of the na onal balance of trade, one euro increase in exports is equivalent to one euro decrease in imports. Just as meat and milk produced and consumed on the farm are “income-saving”, so domes c produc on and consump on is “import-saving” or “import subs tu on”. The informal routes iden fi ed above have a massive import-saving eff ect for Bosnia and Herzegovina, and the following graph indicates how its trade defi cit in livestock products would grow if these informal routes were to be progressively closed down without a compensa ng growth in domes c produc on and supply to the formal market:
Graph 6.9: Poten al eff ect on trade balance of curtailing informal marke ng and household use of livestock products
Source: Project es mates from mul ple sources
129
The fi rst set of columns shows the situa on in 2010: Livestock exports worth 140 million KM, imports worth 420 million KM, and a net trade defi cit for the sector of 280 million KM. The second set of columns show what would happen if household produc on and use of livestock products were to be abandoned and these consumers were instead to buy in the shops what they now produce. As domes c produc on is already less than demand for almost every product, it is likely that most of this extra food would have to be imported, causing imports to double to 850 million KM and the sectoral trade defi cit to rise 150 percent. The fi nal columns show what would happen if the government acted to stamp out informal slaughtering, processing and marke ng and producers responded by abandoning produc on, rather than supplying formal markets. Under this scenario, imports would rise to 3.3 mes their current level, at 1.4 billion KM, and the trade defi cit would reach 1.3 billion KM, some 4.4 mes its level now
It is not claimed that this graph shows exactly what would really happen under each of these scenarios, as diff erent producers would choose diff erent op ons in response to changing condi ons – some switching to formal market channels, some changing their form of produc on, and some indeed ceasing to produce. The point being made is that the import-subs tu ng eff ect of the household and informal sectors makes a very great contribu on to the na onal balance of payments – almost seven mes greater than the actual value of exports by the formal sector.
Conclusions
The current situa on is that informal market routes account for around half of the na onal food supply of meat and dairy products, half of farmers’ livestock incomes, and play an essen al role in the na onal balance of payments. However, the situa on that might
be expected in 20–30 years me could be very diff erent: A smaller number of larger farms, mainly selling through formal marke ng channels; A more urban popula on, with weaker links to the countryside and less access to family-produced livestock products; Membership of the EU, with strict EU standards applying to all formal marke ng channels and “equivalent na onal standards” applying to the “direct sale of products in small quan es to the fi nal consumer”; Greatly increased imports and exports within the EU Single Market.
Given the known current situa on and the expected future situa on, what policies should government apply now in respect of livestock produc on and marke ng? The key point is that government must focus on encouraging commercial producers and the formal processing and marke ng sectors, not on discouraging the small-scale and informal sectors. In par cular, over-zealous regula on of the informal markets could cause real hardship to some of the poorest households in society, and be disastrous for the na onal balance of payments.
6.6 S ummary of marke ng and trade
Domes c marke ng
Within BiH, livestock products reach their fi nal consumers through a wide range of marke ng routes – household consump on, direct sale, green markets, shops and supermarkets – with each playing an important role.
The sector has made rapid progress in recovering from the eff ects of the war, including product development, packaging and marke ng, though so far the emphasis has been mainly on tradi onal products consumed in BiH and neighbouring CEFTA countries, with innova on into newer west-European products progressing only slowly.
The recent arrival of several foreign-owned supermarket chains may supply a conduit for
130
introducing new products, and the steady rise in per capita GDP may increase the demand for novel and higher quality products. Whilst ini ally appearing as compe on, this development would give processors the s mulus and opportunity to develop new products that will be needed in future.
However, these supermarket chains bring with them their own business prac ces, including charging processors for each new product placed on their shelves and delaying payment for 90 days or more. Such prac ces will make it hard for small processors and suppliers, and may encourage polariza on of the processing and marke ng chains.
Interna onal trade
BiH runs a signifi cant trade defi cit in livestock and livestock products, now running annually at more than EUR 100 million (213 million KM in 2010). Both exports and imports are growing steadily. Exports are increasing in relative terms faster than imports – up two and half times in the four years from 2006 to 2010 – but imports were much higher to start with and the overall trade deficit is still increasing.
The most serious and urgent factor within interna onal trade will be the eff ect of Croa a’s entry into the EU later this year. Croa a forms BiH’s largest export market, and in recent years the value of livestock products trade with Croa a has been greater than
with all 27 EU Member States put together. This trade with Croa a includes signifi cant exports, whilst trade with the EU is almost en rely one-way: imports from the EU into Bosnia and Herzegovina.
Given that Bosnia and Herzegovina has not yet obtained EU approval for export of its key livestock products, formal export of such products to Croa a will stop abruptly on the la er’s entry to the EU.
The role of informal produc on and marke ng
As discussed specifi cally in sec on 6.5 above, informal market routes currently account for around half of the na onal food supply of meat and dairy products and half of farmers’ livestock incomes. They also play an essen al role in the na onal balance of payments, since the value of informally marketed products is equivalent to seven mes the total value of livestock-product exports.
This situa on will change over me, as BiH becomes more urban and more integrated into the EU, and its agriculture slowly changes from a pa ern of semi-subsistence small farms to more commercial produc on. However, such change will take a genera on or more, and in the mean me government has to develop policies that are appropriate to both the reality of today and the vision of tomorrow.
131
7. Level of a ainment of relevant EU standards
C hapter 4 on processors gives some indica on of their closeness to EU standards, Chapter 8 reviews on-farm infrastructure and the investment needed in order to come up to EU standards, and Chapter 5 outlines the system of policy and regula on that sets and enforces standards within Bosnia and Herzegovina. This chapter therefore provides a concise summary of the current state of play, and highlights those areas where most a en on is needed: Sec on 7.1 gives a very short summary of where Bosnia and Herzegovina currently stands in rela on to diff erent aspects of the EU acquis covering livestock produc on and processing. Sec on 7.2 reviews the standards and current situa on for livestock farms. Sec on 7.3 looks par cularly at milk quality, spanning the link between dairy farms and milk processors. Sec o n 7.4 reviews the standards and current status of milk and meat processors. Sec on 7.5 sets out very briefl y the situa on concerning export of meat, milk and dairy products to the EU. Sec on 7.6 presents conclusions on the a ainment of EU standards by farmers, processors and the offi cial veterinary services.
7.1 E U acquis for the livestock sector
Current implementa on of the EU acquis for the livestock sector is summarized under 12 areas in the Table 7.1. The remainder of this chapter focuses on the regulatory areas of greatest concern.
7.2 Standards for livestock farms
Regula on of livestock farms falls under state, en ty, canton and municipality level structures, as outlined in sec on 5.5 above, and suff ers from a lack of coherent organiza on and a clear chain of command. The main coordinated ini a ves so far
have focussed on animal health and animal iden fi ca on at the state level, and on milk hygiene and tes ng within the RS en ty.
Annex 6 presents a checklist for dairy farms, lis ng both specifi c requirements of EU legisla on and other factors without which it will be diffi cult in prac ce to meet the EU standards for milk hygiene.
7.2.1 Animal health
Bosnia and Herzegovina is an ac ve member of OIE, the World Organisa on for Animal Health, and is free of most serious epizoo c diseases, such as Foot and Mouth Disease. However, it has had recent outbreaks of Q-fever and brucellosis, the la er controlled by vaccina on.
In 2004, Bosnia and Herzegovina began to implement a programme of residue monitoring based on Council Direc ve 96/23/EC of 29 April 1996 on measures to monitor certain substances and residues thereof in live animals and animal products, which s pulates a minimum sampling frequency and tes ng regime in order to check a broad matrix of livestock products for residues of illegal growth promoters, veterinary medicine residues above permi ed limits, and contaminants. Analyses are performed in accredited laboratories abroad. An FVO mission in September 2010 reviewed this area and made a number of recommenda ons on the approval and control of veterinary medicines and on the residue tes ng programme, most of which have already been implemented.
The systems for marke ng and recording the use of veterinary medicines were not inves gated, but given the small and informal farm structure, problems might well occur.
7.2.2 Animal welfare
General standards for farm animal welfare are set out in Council Direc ve 98/58/EC of 20 July 1998 concerning the protec on of
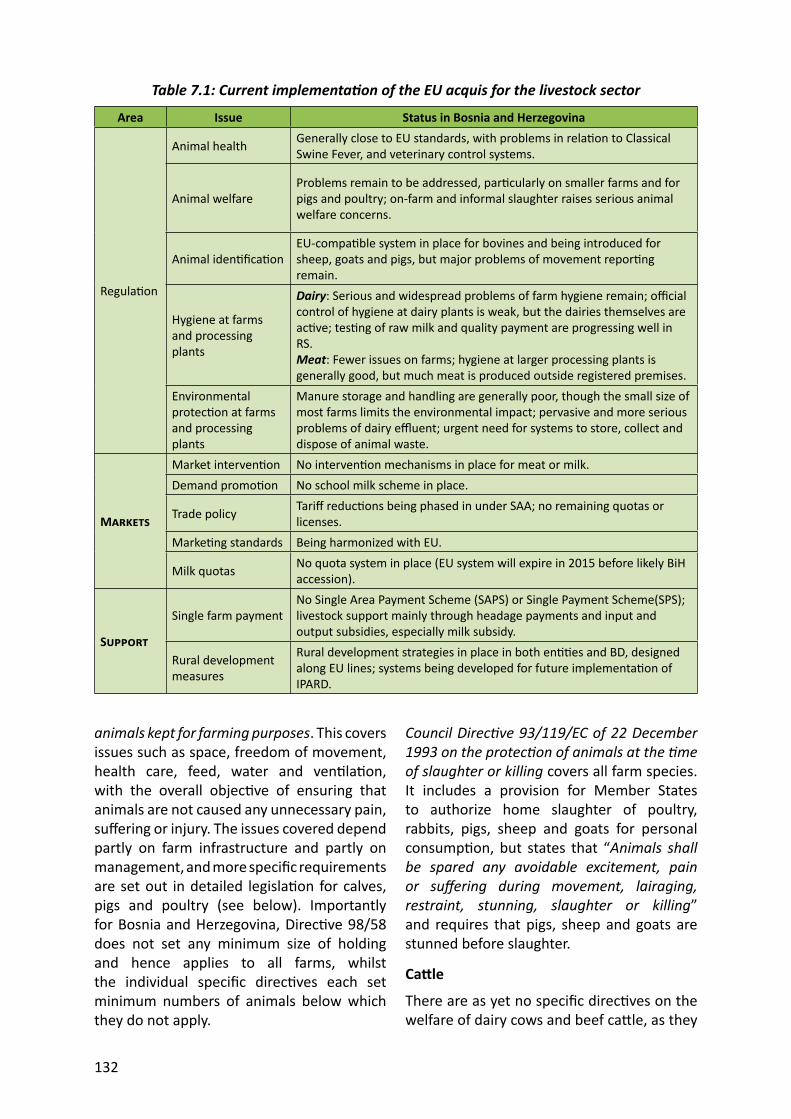
132
animals kept for farming purposes. This covers issues such as space, freedom of movement, health care, feed, water and ven la on, with the overall objec ve of ensuring that animals are not caused any unnecessary pain, suff ering or injury. The issues covered depend partly on farm infrastructure and partly on management, and more specifi c requirements are set out in detailed legisla on for calves, pigs and poultry (see below). Importantly for Bosnia and Herzegovina, Direc ve 98/58 does not set any minimum size of holding and hence applies to all farms, whilst the individual specifi c direc ves each set minimum numbers of animals below which they do not apply.
Table 7.1: Current implementa on of the EU acquis for the livestock sector
Area Issue Status in Bosnia and Herzegovina
Regula on
Animal health Generally close to EU standards, with problems in rela on to Classical Swine Fever, and veterinary control systems.
Animal welfareProblems remain to be addressed, par cularly on smaller farms and for pigs and poultry; on-farm and informal slaughter raises serious animal welfare concerns.
Animal iden fi ca onEU-compa ble system in place for bovines and being introduced for sheep, goats and pigs, but major problems of movement repor ng remain.
Hygiene at farms and processing plants
Dairy: Serious and widespread problems of farm hygiene remain; offi cial control of hygiene at dairy plants is weak, but the dairies themselves are ac ve; tes ng of raw milk and quality payment are progressing well in RS.Meat: Fewer issues on farms; hygiene at larger processing plants is generally good, but much meat is produced outside registered premises.
Environmental protec on at farms and processing plants
Manure storage and handling are generally poor, though the small size of most farms limits the environmental impact; pervasive and more serious problems of dairy effl uent; urgent need for systems to store, collect and dispose of animal waste.
M
Market interven on No interven on mechanisms in place for meat or milk.Demand promo on No school milk scheme in place.
Trade policy Tariff reduc ons being phased in under SAA; no remaining quotas or licenses.
Marke ng standards Being harmonized with EU.
Milk quotas No quota system in place (EU system will expire in 2015 before likely BiH accession).
S
Single farm paymentNo Single Area Payment Scheme (SAPS) or Single Payment Scheme(SPS); livestock support mainly through headage payments and input and output subsidies, especially milk subsidy.
Rural development measures
Rural development strategies in place in both en es and BD, designed along EU lines; systems being developed for future implementa on of IPARD.
Council Direc ve 93/119/EC of 22 December 1993 on the protec on of animals at the me of slaughter or killing covers all farm species. It includes a provision for Member States to authorize home slaughter of poultry, rabbits, pigs, sheep and goats for personal consump on, but states that “Animals shall be spared any avoidable excitement, pain or suff ering during movement, lairaging, restraint, stunning, slaughter or killing” and requires that pigs, sheep and goats are stunned before slaughter.
Ca le
There are as yet no specifi c direc ves on the welfare of dairy cows and beef ca le, as they
133
are not generally a problem area, and so the requirements of Direc ve 98/58 apply.
The principal concern in Bosnia and Herzegovina relates to housing, with a high propor on of cows being kept in tethered stalls or stables, frequently without adequate light or ven la on, and some mes with unreliable water supplies. This is one of the issues to be addressed by investments in ca le farm infrastructure.
Care and housing of six or more calves is covered by Council Direc ve 91/629/EEC laying down minimum standards for the protec on of calves, but as very few calves are intensively reared in Bosnia and Herzegovina, compliance with this direc ve will not be a widespread problem.
On-farm and informal slaughtering of calves is widespread, typically with primi ve restraint and no stunning, and is not permi ed under Direc ve 93/119.
Sheep
Generally similar to ca le, without species-specifi c legisla on. Most sheep are kept quite extensively and the main hazards they face come from the weather and wolves, rather than the man-made factors, though the Annex to Direc ve 93/119 states that “Animals not kept in buildings shall where necessary and possible be given protec on from adverse weather condi ons, predators and risks to their health”.
The same issues of on-farm and informal slaughter apply, par cularly in rela on to slaughter by restaurants and by families for special celebra ons. Within slaughterhouses, Direc ve 93/119 includes a special exemp on which allows religious slaughter without prior stunning, but this exemp on does not appear to extend to home slaughter, raising ques ons about household slaughter of sheep for Bajram.
Pigs
Council Direc ve 1991–630 laying down minimum standards for the protec on of
pigs applies to holdings with at least 6 pigs or 5 sows and their piglets, thus excluding a large number of small pig farms in Bosnia and Herzegovina.
For larger producers, the main compliance issue will relate to minimum space requirements. For growing pigs, which are usually moved through successive pens of increasing size as they grow, it will usually be possible to comply with the Direc ve through rela vely simple changes in management, though with some reduc on in total throughput per building. For breeding pigs, some facili es may require adapta on or reconstruc on in order to provide suffi cient space for each farrowing sow and her piglets.
Poultry
Council Direc ve 1999/74/EC of 19 July 1999 laying down minimum standards for the protec on of laying hens applies to holdings with more than 350 laying hens, and hence excludes the widespread backyard poultry produc on. Its most important provision is the phasing out, by January 2012, of tradi onal ba ery cages and their replacement by “enriched cages” with more space and with perches. It is not known how many ba ery farms in Bosnia and Herzegovina comply with the new requirements, but it is likely that many do not and so will require extensive investment in order to conform.
Council Direc ve 2007/43/EC of 28 June 2007 laying down minimum rules for the protec on of chickens kept for meat produc on covers holdings with more than 500 broilers, thus excluding typical household produc on of 50–100 broilers at a me. The main issue in implementa on will be the space requirement per hen, as high stocking densi es are o en employed in broiler units within BiH. The open-plan layout of most broiler buildings means that this can be complied with by simply reducing the number of hens in each cycle, without signifi cant infrastructural change. However, this will reduce the throughput per house and so will require the construc on of addi onal buildings in order
134
to maintain current output, let alone provide for future expansion.
7.2.3 Animal iden fi ca onAn EU-compa ble animal iden fi ca on system for ca le has been put in place with EU project assistance, and is currently being improved and extended to small ruminants. It suff ers to some extent from the four problems that aff ect all I&R systems in the region: Failure to register all holdings, apparently with quite a number of the very small holdings being omi ed; Late/non-registra on of births, with some calves being reared and slaughtered on farm without ever entering the database; Late/non-registra on of deaths and slaughterings, leading to “ghost cows” on the system; Late/non-repor ng of movements, leading to ca le not actually being in the place where they are recorded as being.
The implica ons of this when using the I&R system as a data source are discussed in sec on 3.1.1. The implica ons for animal and public health are that the I&R system cannot be treated as a 100 percent reliable basis for tracing and disease control, but as an extremely useful tool to support fi eldwork by veterinarians.
In summary, the system is not yet as good as it should be, but does form a solid basis for further development and improvement.
Environment
There are two main environmental risks from dairy farms: animal manure and silage effl uent.
Manure
Manure storage is clearly a problem, with around three-quarters of sampled farms having inadequate facili es. Priority should be given to addressing this on the larger farms, where the pollu on poten al is greatest.
Silage effl uent
The large majority of farms make hay rather than silage, and where silage is made it is
usually from maize, which has a higher dry ma er and hence less of an effl uent risk. Larger farms should be informed of the importance of proper si ng and design of silage clamps, but it does not appear to be a widespread environmental problem.
7.3 Milk hygiene and quality grading
Milk hygiene is measured by two parameters: Soma c Cell Count (SCC) and Total Bacterial Count (TBC). The former, SCC, is indica ve of animal health especially in rela on to mas s, a bacterial infec on of the udder which causes release of leucocytes (white blood cells) into the milk.
TBC is a direct measure of bacterial prolifera on as a result of poor milking hygiene and ineff ec ve cooling. Milk, the most perishable agricultural output, must be cooled to 6°C or less within two hours of drawing from the cow, and then maintained within this temperature range un l delivery to the dairy.
7.3.1 EU standards in force
EU legisla on sets fi rm standards for both Soma c Cell Count and Total Bacteria Count:
EU standards for Soma c Cell Count (SCC)
A three-monthly rolling geometric average of cell count in milk should not be greater than 400,000 cells per ml. However, in the majority of EU na ons the market usually demands much lower levels for premium products, with an average threshold of around 200,000 cells. EU milk processors typically pay a premium of 3 to 5 percent of milk price when the SCC is below the agreed premium threshold, a neutral price above that threshold and then price reduc ons of 5–10 percent are applied for a higher threshold, o en 250,000 cells, up to the regulatory level of 400,000. Milk with a persistently high cell count is rela vely worthless, even if some form of market can be found; dairies typically apply penal es of 30–60 percent of the regular price and also o en charge special collec on costs.
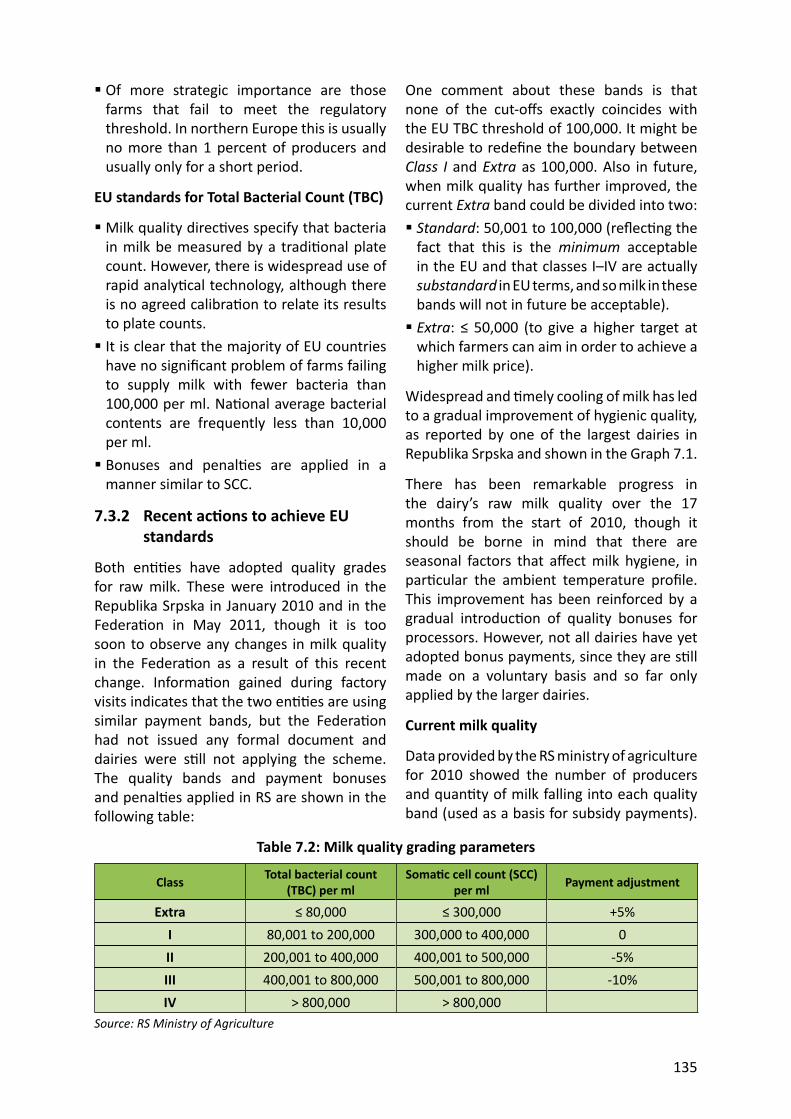
135
Of more strategic importance are those farms that fail to meet the regulatory threshold. In northern Europe this is usually no more than 1 percent of producers and usually only for a short period.
EU standards for Total Bacterial Count (TBC)
Milk quality direc ves specify that bacteria in milk be measured by a tradi onal plate count. However, there is widespread use of rapid analy cal technology, although there is no agreed calibra on to relate its results to plate counts. It is clear that the majority of EU countries have no signifi cant problem of farms failing to supply milk with fewer bacteria than 100,000 per ml. Na onal average bacterial contents are frequently less than 10,000 per ml. Bonuses and penal es are applied in a manner similar to SCC.
7.3.2 Recent ac ons to achieve EU standards
Both en es have adopted quality grades for raw milk. These were introduced in the Republika Srpska in January 2010 and in the Federa on in May 2011, though it is too soon to observe any changes in milk quality in the Federa on as a result of this recent change. Informa on gained during factory visits indicates that the two en es are using similar payment bands, but the Federa on had not issued any formal document and dairies were s ll not applying the scheme. The quality bands and payment bonuses and penal es applied in RS are shown in the following table:
One comment about these bands is that none of the cut-off s exactly coincides with the EU TBC threshold of 100,000. It might be desirable to redefi ne the boundary between Class I and Extra as 100,000. Also in future, when milk quality has further improved, the current Extra band could be divided into two: Standard: 50,001 to 100,000 (refl ec ng the fact that this is the minimum acceptable in the EU and that classes I–IV are actually substandard in EU terms, and so milk in these bands will not in future be acceptable). Extra: ≤ 50,000 (to give a higher target at which farmers can aim in order to achieve a higher milk price).
Widespread and mely cooling of milk has led to a gradual improvement of hygienic quality, as reported by one of the largest dairies in Republika Srpska and shown in the Graph 7.1.
There has been remarkable progress in the dairy’s raw milk quality over the 17 months from the start of 2010, though it should be borne in mind that there are seasonal factors that aff ect milk hygiene, in par cular the ambient temperature profi le. This improvement has been reinforced by a gradual introduc on of quality bonuses for processors. However, not all dairies have yet adopted bonus payments, since they are s ll made on a voluntary basis and so far only applied by the larger dairies.
Current milk quality
Data provided by the RS ministry of agriculture for 2010 showed the number of producers and quan ty of milk falling into each quality band (used as a basis for subsidy payments).
Table 7.2: Milk quality grading parameters
Class Total bacterial count (TBC) per ml
Soma c cell count (SCC) per ml Payment adjustment
Extra ≤ 80,000 ≤ 300,000 +5%I 80,001 to 200,000 300,000 to 400,000 0II 200,001 to 400,000 400,001 to 500,000 -5%III 400,001 to 800,000 500,001 to 800,000 -10%IV > 800,000 > 800,000
Source: RS Ministry of Agriculture
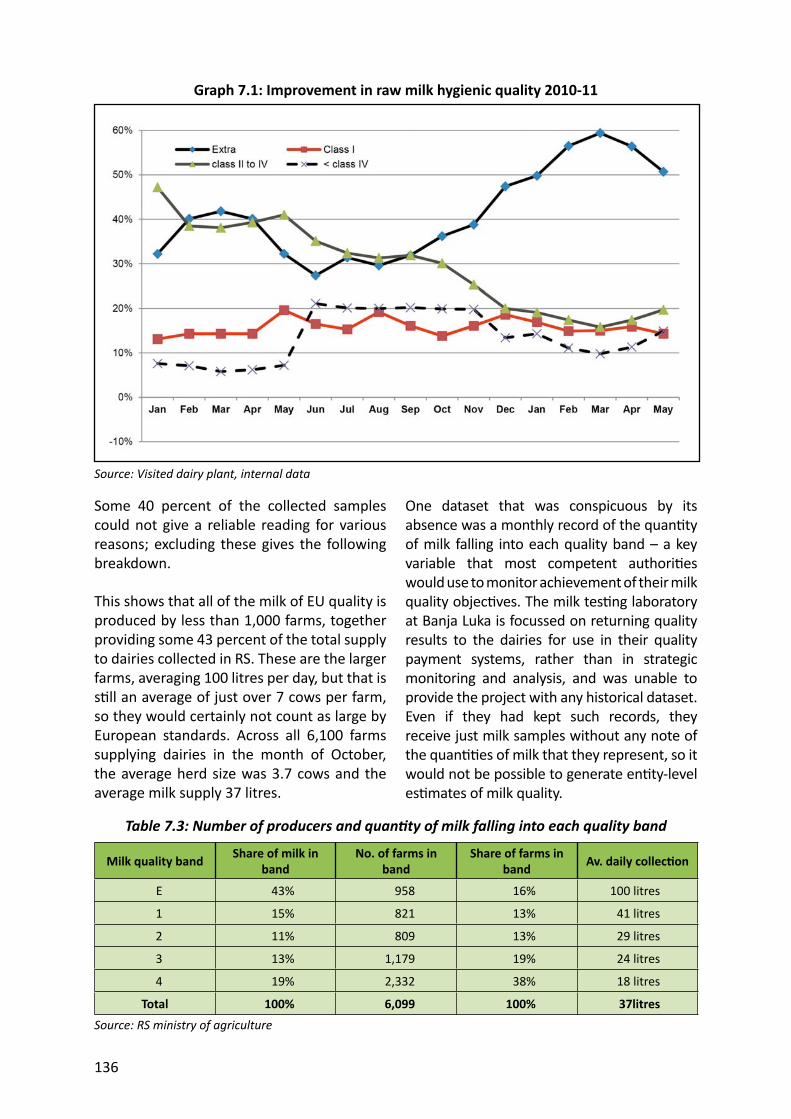
136
Some 40 percent of the collected samples could not give a reliable reading for various reasons; excluding these gives the following breakdown.
This shows that all of the milk of EU quality is produced by less than 1,000 farms, together providing some 43 percent of the total supply to dairies collected in RS. These are the larger farms, averaging 100 litres per day, but that is s ll an average of just over 7 cows per farm, so they would certainly not count as large by European standards. Across all 6,100 farms supplying dairies in the month of October, the average herd size was 3.7 cows and the average milk supply 37 litres.
One dataset that was conspicuous by its absence was a monthly record of the quan ty of milk falling into each quality band – a key variable that most competent authori es would use to monitor achievement of their milk quality objec ves. The milk tes ng laboratory at Banja Luka is focussed on returning quality results to the dairies for use in their quality payment systems, rather than in strategic monitoring and analysis, and was unable to provide the project with any historical dataset. Even if they had kept such records, they receive just milk samples without any note of the quan es of milk that they represent, so it would not be possible to generate en ty-level es mates of milk quality.
Graph 7.1: Improvement in raw milk hygienic quality 2010-11
Source: Visited dairy plant, internal data
Table 7.3: Number of producers and quan ty of milk falling into each quality band
Milk quality band Share of milk in band
No. of farms in band
Share of farms in band Av. daily collec on
E 43% 958 16% 100 litres
1 15% 821 13% 41 litres
2 11% 809 13% 29 litres
3 13% 1,179 19% 24 litres
4 19% 2,332 38% 18 litres
Total 100% 6,099 100% 37litresSource: RS ministry of agriculture
137
The project was provided with the above data from the RS ministry of agriculture, allowing analysis of milk quality for this one month, but it appeared that neither the ministry nor the milk laboratory considered the regular monitoring of milk quality to be one of their responsibili es. Given the importance of milk quality in preparing the dairy sector for EU integra on, and the broad diagnos c value of test results, it is recommended that the ministries in both en es should take a more proac ve role in leading the campaign to bring milk quality up to EU standards.
7.3.3 Factors aff ec ng milk quality
In many ways, milk tes ng is the easy part, and the real challenge for accession countries is how to implement changes in tens or even hundreds of thousands of dairy farms in order to ensure that they are capable of producing milk to EU standards. Here the hygiene chain depends on: Housing and milking areas Milking technology and hygiene Milk storage and handling areas Milk cooling and transport
Housing and milking areas
Many cows spend their me lying on soiled bedding or unclean fl oors, crea ng a serious risk of mas s spread and leading to poor hygiene around the udder. Only the largest farms use cubicle systems designed to keep the lying areas rela vely clean.
The very large majority of cows are milked in the stable itself, in unhygienic condi ons. Whilst milking in the stable is permi ed in the EU, it makes it considerably harder to meet the standards for total bacterial count (TBC).
Milking technology and hygiene
A signifi cant number of cows are s ll milked by hand (almost 90 percent of 1–cow farms and over 60 percent of 2–5 cows, according to the Project Farm Survey) crea ng a high risk of milk contamina on and excessive TBC levels, par cularly where milking is carried out in the stable. Many of the small and
medium-sized farms that do milk by machine are s ll using old-fashioned machines without pulsators, which o en caused udder damage and mas s and so result in SCC levels above EU standards.
Milking prac ce and hygiene standards also have a signifi cant eff ect on both SCC & TBC, and big improvements can be made with simple techniques such as udder washing, tes ng foremilk with strip cups, stripping out a er milking, and using disinfectant teat cups and sprays. Many projects in the Balkans have provided advice and training on such ma ers, but it will probably be the “carrot-and-s ck” of milk premia and penal es that will ul mately induce farmers to change their prac ces.
Milk storage and handling areas
Around a third of small farms store and handle their milk close to where the cows are kept, in breach of a specifi c requirement to have a separate area for milk handling and storage. The most common alterna ve for very small farms is to handle milk and wash milking equipment in the farm kitchen, which in principle is capable of achieving adequate hygiene.
Milk cooling and transport
In much of the region, one of the biggest problems of milk hygiene has been the lack of onfarm milk cooling and insulated milk tankers. Here the combined eff orts of dairies, farmers and a succession of diff erent projects have had a major impact, providing a combina on of individual and shared cooling tanks. The Project Farm Survey found that around 90 percent of surveyed farms supplying milk to dairies had access to some kind of milk cooling, and data from the dairies themselves confi rms that over 90 percent of their raw milk supply is cooled. The survey of dairies showed that almost all use hygienic insulated milk tankers, and it appears only to be the local movement of milk by middlemen that s ll uses uninsulated churns.
Thus milk cooling does not appear to be a major obstacle to mee ng EU standards
138
for those farms currently supplying dairies, though it is possible that some farms are eff ec vely forced to process their milk on farm due to the absence of facili es for milk cooling and collec on. If such farms did wish to switch to supplying the formal dairy system, then milk cooling is one of the many areas in which they would need to invest.
7.4 Standards for livestock processors
7.4.1 Dairy processors
Regula on of dairy processors is carried out by the rather complex hierarchy of veterinary supervision outlined in sec on 5.5, and may result in controls being carried out by offi cials from state, en ty, canton and municipality inspectorates.
Legisla on
There has been some harmoniza on of legisla on in rela on to raw milk quality, especially in the Republika Srpska. The key issues of HACCP, plant design, and dairy product quality, are more in need of improved implementa on and enforcement, rather than further legal approxima on.
Raw milk quality
The biggest single problem with food safety and standards in the dairy chain is the lack of laboratory capacity and systems for tes ng raw milk quality. The Republika Srpska is able to regularly conduct analyses to EU standards in its veterinary laboratory in Banja Luka. The Federa on has tes ng laboratories in Sarajevo, Tuzla and Bihać, which require some upgrading and procurement of higher standards of tes ng equipment to handle increased numbers of samples in conformity with EU requirements. Un l this problem is fully addressed the true hygiene posi on of the dairy industry will remain unknown in the Federa on, and many dairies will be excluded from any possibility of achieving EU export approval.
HACCP and process control
Na onal legisla on requires all dairies to have an approved HACCP plan, which almost
all dairies larger than four tonnes of milk per day now have. However, given that the logical fi rst Cri cal Control Point for any dairy is to measure the quality of raw milk, it is diffi cult to see how an appropriate HACCP plan can be put into eff ect without regular laboratory analysis of milk from each supplier. As far as milk sourced from the Federa on is concerned, it appears that either the HACCP plans themselves are defi cient, or they are not yet fully being put into eff ect.
Final product control
Whilst there is insuffi cient laboratory capacity for the high-volume tes ng of all raw milk, tes ng of fi nal products is within the capacity of exis ng laboratories with their classical methods, and appears to be carried out quite systema cally.
Inspec on and enforcement
There is a widespread opinion that enforcement of standards by veterinary inspectors is sporadic and inconsistent, due at least in part to the complex organiza onal structures, and the obvious discrepancies between legisla on and prac ce show that problems exist in this area.
7.4.2 Meat processors
Within the visited meat processing plants, both the infrastructure and the opera ng procedures were at or close to EU standards. However, the re cence of some operators to even allow a tour of their slaughtering facili es suggests that there are serious shortcomings in this area. The methods of separa ng and handling bovine “specifi ed risk material” could not be ascertained.
Environment
Disposal of dairy waste and processing effl uent is a general problem, and new effl uent-treatment facili es will be required to meet EU standards.
Most meat processing plants appear to achieve rela vely safe disposal of their liquid effl uent, usually with pre-treatment on-site
139
prior to discharge into the municipal system, but this may s ll fall short of EU requirements.
Rendering and disposal of animal waste from slaughterhouses is a ma er of considerable concern within the EU, and exis ng facili es are completely insuffi cient to comply with EU regula ons. One or two meat plants render pig fat on a small scale, but there is a great need for the slaughterhouse waste to be correctly processed to avoid environmental concerns and to ensure appropriate treatment of bovine specifi ed risk material.
7.5 Export to the EU
As reported in sec on 5.5 on policy, Bosnia and Herzegovina currently has EU export approval only for four fi sh processing establishments, and is in the process of seeking approval for the export of honey. Export of live animals, meat, milk and dairy products to the EU is not currently permi ed. The key factor hampering exports has been the overall structure of the veterinary control system, as discussed in that chapter, and un l this country level issue is resolved, no formal assessment of individual plants is likely to take place.
7.6 Conclusions on a ainment of EU standards
Farm level
There are three main areas requiring further a en on on livestock farms: Environment, primarily storage, handling and disposal of manure and slurry; Animal welfare, including design of livestock buildings and the widespread prac ce of backyard slaughter without prior stunning; Milk hygiene, par cularly improving the physical condi ons of ca le buildings and areas for milking and milk storage. Data
from the RS milk-tes ng system show that considerable progress is being made, with 58 percent of milk in the “Extra” and “1st class” bands; however, this represents only 29 percent of all farms supplying dairies, indica ng that some 70 percent of (generally small) farms s ll have a way to go in achieving EU hygiene standards.
Processing level
Many of the plants visited were well advanced in preparing for EU standards, with the main iden fi ed weaknesses being: Slaughtering facili es for red meat; Disposal of slaughterhouse waste, including “Specifi ed Risk Material”, with appropriate disposal facili es almost completely lacking in the country; Disposal of effl uent and contaminated water from both meat and milk processing; Improving the quality and quality tes ng of raw milk, par cularly in FBiH where there is not yet a comprehensive milk tes ng system in place.
Veterinary control and regula on
BiH is well advanced in implemen ng EU-compliant systems of animal iden fi ca on, and is progressively harmonizing its policies of disease preven on and control with EU standards.
Whilst considerable progress has been made in harmonizing legisla on with EU standards, the approach to legisla on – and par cularly to implementa on and enforcement – is s ll rather piecemeal and inconsistent.
The most urgent outstanding issue, as discussed in sec on 5.5, is that of improving the opera on of veterinary structures and obtaining EU export approval for livestock products.

140
141
8. Investment trends and future developments
The sec on examines the investment climate for the livestock sector. Sec on 8.1 gives a short impression of recent investments in livestock produc on and processing. Sec on 8.2 presents a comprehensive review of the fi nancial infrastructure in BiH and of the lending services available to the agri-food sector. Sec on 8.3 briefl y discusses the level of public support available to the sector, through government investment subsidies and grants. Sec on 8.4 draws conclusions on the availability of investment funds, and asks whether they will be suffi cient to ensure adequate co-fi nancing of IPARD grants.
8.1 Recent investments in the livestock sector
The picture of investment by farms emerges from the “Infrastructure” and “Machinery” sec ons of the Project Farm Survey, presented in sec on 9.4, whilst the situa on in processing plants is discussed in Chapter 4 and in the case studies of Annex 4. This sec on therefore gives a very brief summary of the situa on.
8.1.1 Investments on farms
Farm visits indicated three diff erent situa ons in terms of recent investment: A very small number of completely new farms or livestock enterprises, par cularly large dairy farms established by or with support from dairies in order to ensure a reliable supply of high quality raw material; A somewhat larger number of medium-sized commercial farms that are progressively inves ng and expanding within their fi nancial means: purchasing animals of higher gene c quality, adap ng exis ng buildings, adding extensions, buying individual pieces of machinery as the need and possibility arise – essen ally organic growth funded by a combina on of retained profi ts and formal and informal loans;
The large majority of small-scale farms opera ng with self-replacing fl ocks and herds, old machinery and even older buildings, usually able to make investments in, e.g. a milk cooling tank, only when helped by a project or by their dairy.
8.1.2 Investments in processing
The situa on in processing is rather diff erent, with many examples of recent investment in larger and medium-sized processing plants. It was not considered appropriate to ask the source of funds, but it is clear than many entrepreneurs spent me abroad during the war, allowing them to amass both capital and contacts. Some of the processing plants visited had used bank loans, but quite a remarkable amount of investment had been achieved with own resources, and the level of indebtedness was overall very low.
However, dairies have already begun preparing for EU accession and taking steps that will be necessary in order for them to secure export licences to the EU before the accession of Bosnia and Herzegovina. Once country level approval for dairy exports is obtained, it will probably be the foreign-owned dairies that will respond the quickest in mee ng full EU requirements and applying for export approval. The most immediate investment needs are likely to be for upgrading of premises and processing plant, with many businesses already in the early stages of planning for the next fi ve years.
Similar comments also apply to meat processors, and a number are already well advanced in construc ng new premises prior to securing fi nance for new plant and technology. Most meat processors are family-owned businesses with a sound tradi on in the industry, and are generally op mis c in their approach to the future. They seem capable of raising investment for capital expenditure from their own sources, but clearly would wish to avail themselves of new sources that might arise, including IPARD funding.
142
8.2 The agriculture lending and fi nancial sector in Bosnia and Herzegovina
Op ons of agricultural development based on successful management of the available fi xed funds is limited, so that any serious and long-term development is inevitably associated with new investment, for which addi onal funds must be provided. Financing of agricultural produc on, especially on small family farms, was and s ll is a current issue in this region. In the previous socio-economic system, agricultural development took place largely through the development of coopera ve rela ons between producers of certain agricultural products and their buyers, collectors and processors. Producers were supplied with the necessary inputs and services in exchange for raw materials, eff ec vely providing producers with commodity loans and guarantees. Apart from these direct producer-processor rela onships, an important media ng role was also played by the agricultural coopera ves.
With the recent transi on from a planned to a market economy, the integra ng role of coopera ves has been signifi cantly reduced. New or priva zed enterprises organize their own purchasing of agricultural products, but without direct credit arrangements.
Some family farms have managed to make investments thanks to dona ons by humanitarian, governmental and non-governmental organiza ons. The fi rst forms of renewed lending to agriculture began in the late 1990s through micro-credit organiza ons, and later by commercial banks. There were also arrangements in which lending was made by the state, through projects or the relevant ministry.42
Farmers s ll need addi onal resources to fund their investments. In a survey of 1,390 rural households in 2008, which was conducted
42 Vučenović, A. & Vaško, Ž. – Finansiranje poljoprivrede, Agroznaje, Vol. 10, No.4, 2009. pp 165–174.43 Data from a survey carried out to support the design of the Republika Srpska Strategic Plan of Rural Development
for the period 2009–15, RS Faculty of Agriculture, MAFWM, Banja Luka. 2009.
in 24 municipali es of the Republika Srpska, 72 percent of respondents said that the biggest obstacle facing their own business was shortage of funds.43 Lending is certainly one of the major sources of fi nancing for agricultural development, but according to the survey, 55 percent of households had never used loans, whilst 38 percent had used some form of agricultural loans (10 percent for the purchase of ca le, 10 percent for raw materials, 9 percent for purchases of machinery, 8 percent for the renova on of buildings and 2 percent for plan ng orchards and vineyards). In general, small- and medium-sized legal en es and coopera ves fi nd it somewhat easier to obtain loans.
The fi nancial sector in Bosnia and Herzegovina consists of banks, microcredit organiza ons and socie es, savings and credit organiza ons, and leasing companies, func oning as important partners for agricultural producers of all kinds. It has become increasingly common for buyers of certain agricultural products (e.g. milk, fruit and vegetables) to pay direct to the farmers’ bank accounts, and the same prac ce applies for the payment of subsidies by the agriculture ministries, cantons and municipali es, so that an increasing number of agricultural producers now make their payments through bank accounts.
Self-employed individuals, especially farmers, fi nd it diffi cult to provide loan guarantees and in most cases have to depend on employed rela ves or friends to act as guarantors. The increase in credit default and general indebtedness has reduced the number of poten al guarantors, which has made it more diffi cult to obtain credit. Established registers of borrowers off er one means of effi cient monitoring of the creditworthiness of borrowers and credit risk reduc on, and the RS Guarantee Fund has recently been founded and begun to work.
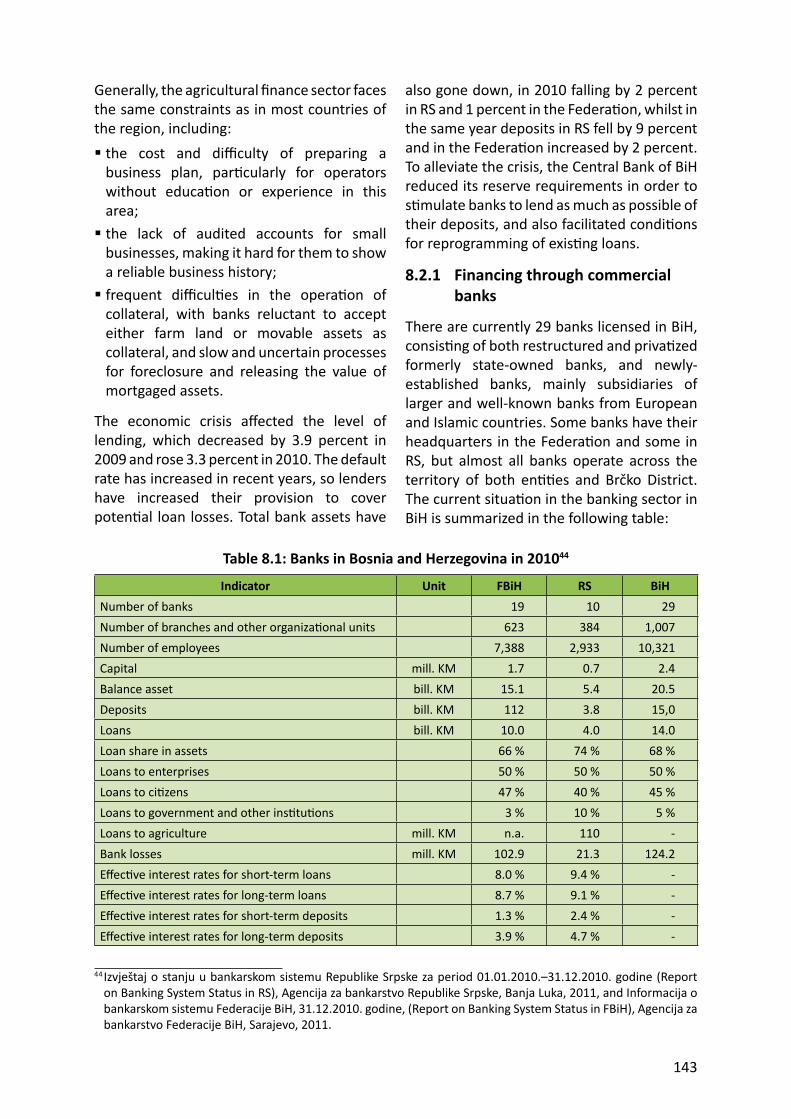
143
Generally, the agricultural fi nance sector faces the same constraints as in most countries of the region, including: the cost and diffi culty of preparing a business plan, par cularly for operators without educa on or experience in this area; the lack of audited accounts for small businesses, making it hard for them to show a reliable business history; frequent diffi cul es in the opera on of collateral, with banks reluctant to accept either farm land or movable assets as collateral, and slow and uncertain processes for foreclosure and releasing the value of mortgaged assets.
The economic crisis aff ected the level of lending, which decreased by 3.9 percent in 2009 and rose 3.3 percent in 2010. The default rate has increased in recent years, so lenders have increased their provision to cover poten al loan losses. Total bank assets have
Table 8.1: Banks in Bosnia and Herzegovina in 201044
Indicator Unit FBiH RS BiHNumber of banks 19 10 29Number of branches and other organiza onal units 623 384 1,007Number of employees 7,388 2,933 10,321Capital mill. KM 1.7 0.7 2.4Balance asset bill. KM 15.1 5.4 20.5Deposits bill. KM 112 3.8 15,0Loans bill. KM 10.0 4.0 14.0Loan share in assets 66 % 74 % 68 %Loans to enterprises 50 % 50 % 50 %Loans to ci zens 47 % 40 % 45 %Loans to government and other ins tu ons 3 % 10 % 5 %Loans to agriculture mill. KM n.a. 110 -Bank losses mill. KM 102.9 21.3 124.2Eff ec ve interest rates for short-term loans 8.0 % 9.4 % -Eff ec ve interest rates for long-term loans 8.7 % 9.1 % -Eff ec ve interest rates for short-term deposits 1.3 % 2.4 % -Eff ec ve interest rates for long-term deposits 3.9 % 4.7 % -
44 Izvještaj o stanju u bankarskom sistemu Republike Srpske za period 01.01.2010.–31.12.2010. godine (Report on Banking System Status in RS), Agencija za bankarstvo Republike Srpske, Banja Luka, 2011, and Informacija o bankarskom sistemu Federacije BiH, 31.12.2010. godine, (Report on Banking System Status in FBiH), Agencija za bankarstvo Federacije BiH, Sarajevo, 2011.
also gone down, in 2010 falling by 2 percent in RS and 1 percent in the Federa on, whilst in the same year deposits in RS fell by 9 percent and in the Federa on increased by 2 percent. To alleviate the crisis, the Central Bank of BiH reduced its reserve requirements in order to s mulate banks to lend as much as possible of their deposits, and also facilitated condi ons for reprogramming of exis ng loans.
8.2.1 Financing through commercial banks
There are currently 29 banks licensed in BiH, consis ng of both restructured and priva zed formerly state-owned banks, and newly-established banks, mainly subsidiaries of larger and well-known banks from European and Islamic countries. Some banks have their headquarters in the Federa on and some in RS, but almost all banks operate across the territory of both en es and Brčko District. The current situa on in the banking sector in BiH is summarized in the following table:
144
A er several years of expansion, the global economic and fi nancial crisis has le its mark on the banking sector in BiH. There was stagna on of their capital and balance sheet assets, falling profi tability, and increasing levels of non-performing assets and loans required provisioning on that basis, so that banks become more cau ous in gran ng new loans. The number of organiza onal units and the number of employees have been reduced, although with some 1,000 branches currently opera ng in BiH, it can be concluded that the availability of banking services to individuals and legal en es in BiH is good, with an average of one branch to every 4,000 inhabitants.
Companies in 2010 used about half of the total approved loans, and ci zens (including farmers) used 40 percent in RS and 47 percent in FBiH. The loan structure is dominated by long-term loans (> 1 year), which is largely used by physical rather than legal en es. The Banking Agency of RS reported that loans to the agriculture sector account for only 2.8 percent (110 million) of total loans in that en ty; data are not available for FBiH but it is understood that a similar situa on applies throughout BiH. However, some of the numerous “consumer loans” may also be used by farmers to support their businesses.
In terms of credit condi ons for companies engaged in agricultural produc on and the food industry, they generally have the same treatment as companies from other sectors. In some cases they have even enjoyed slightly more favourable credit condi ons or exclusive access to some of the dedicated lines of credit secured within project-funded
loans from the World Bank (Livestock and Rural Finance Development Project (LRFDP), Enhancing SME Access to Finance (EAF SME)) and the Interna onal Fund for Agricultural Development (LRFDP, Rural Enterprise Enhancement Project (REEP), Rural Livelihood Development Project (RLDP)).
Eff ec ve interest rates on short-term loans range from 8 percent (in FBiH) to 9.5 percent (RS), but are higher for individuals than for companies, with individuals paying average eff ec ve interest rates on short-term loans of 12.6–13.7 percent, and 9.510.5 percent on long-term loans. Although detailed data are not available on the structure of deposits, it appears that the rural popula on and farmers do not contribute greatly to overall bank deposits. Although some buyers of agricultural products pay to the farmer’s bank account, farmers usually withdraw this money in full immediately a er payment. Agricultural producers are not “favoured” by banks in terms of lending, because banks consider them as high-risk borrowers. Therefore, interest rates on agricultural loans to farmers, which they use as private individuals, are higher than for other users, and requested guarantees are the same, if not even more rigorous. Proper es in rural areas (agricultural land and buildings) are generally not accepted, and the alterna ve of a personal guarantor is hard for many farmers to fi nd. As a result, farmers depend mainly on loans from microcredit organiza ons. The excep ons are the projects men oned above (World Bank and IFAD), which have so far provided 12 million loans to farmers under favourable condi ons.
Some examples of typical bank loans available to farmers and SMEs from the sector as of June 2010 (based on data from the banks’ websites) are: NLB Tuzlanska Banka provides loans (including farmers) up to 50,000 KM for periods of up to 7 years, with an eff ec ve interest rate of 12.3 percent; Nova Bank AD Banja Luka provides short-term loans to individual farmers for
The ongoing World Bank project “Enhancing SME Access to Finance” (EAF SME) has a fund of USD 70 million, and off ers loans for SMEs from agro-processing and other industrial sectors. The condi ons of these loans are a loan amount up to EUR 2.5 million (EUR 400,000 for working capital), a repayment period of up to 10 years, a grace period of up to 3 years, and eff ec ve interest rates of LIBOR + EUR 4.5 to 5.5 percent (six-month LIBOR plus a spread, resul ng in 6-7 percent).
145
procurement of raw materials, agricultural equipment and spare parts. Loans are for up to 10,000 KM, the repayment period up to 12 months, the eff ec ve interest rate 13.2 percent, and guarantors are required (one guarantor for loans of up to 5,000 KM, and two for loan amounts of 5–10,000 KM). Long-term loans are available only for the region of Herzegovina, for periods of up to 10 years and an eff ec ve interest rate of 11.9 percent, though the loan amount depends on the creditworthiness of the borrower; BOR bank in FBiH off ers loans for export-oriented programmes and the agroprocessing industry in amounts from 50,000 to 1 million KM, with a repayment period of 8 years, a grace period (for agriculture) of up to 3 years, and an eff ec ve interest rate of 7.0 percent; Bobar Bank Bijeljina off ers a specifi c type of loan to farmers for buying tractors, in coopera on with sellers, with a repayment period of up to 36 months, a mandatory contribu on of benefi ciaries of 40 percent and an eff ec ve interest rate of 12.7 percent. The same bank approves short-term loans to agricultural enterprises up to 500,000 KM for a period of 12 months and 12.1 percent eff ec ve interest rate. Loans are available for companies to purchase agricultural machinery, for a period of 5 years, eff ec ve interest rate of 9.9 percent, and in amounts depending on the needs and creditworthiness of the borrower; Bosnia Bank Interna onal Sarajevo has long-term loans for agriculture for physical en es (for the purchase of land or agricultural machinery and construc on or renova on of buildings for agricultural purposes) with a term loan of up to 10 years, in amounts that depend on the creditworthiness of the borrower, without one specifi ed interest rate; ProCredit Bank provides loans to farmers of up to 50,000 KM for working capital for up to 24 months, and for fi xed assets for a period up to 84 months.
Most of the banks’ loan products are not diff eren ated for agricultural loans. They o en have no pre-defi ned condi ons for loans, par cularly in terms of the level of interest rates, which o en depend on whether the loan applicant is a client of the bank, whether the loan is used for the fi rst me, what security guarantees the applicant
can off er, etc. In general, a rela vely small number of farmers use bank loans (which is confi rmed by data on the total volume of loans for agriculture), because it can be diffi cult to meet the required condi ons and banks are much more rigorous when assessing the creditworthiness of this type of customer. SMEs from the agribusiness sector in terms of credits generally share the fate and condi on of all other SMEs without any special condi ons, although there are occasional lines of loans targeted exclusively at SMEs in the agriculture or food industries.
It has already been noted that signifi cant funding has been designated for loans to agriculture in BiH, under the special project fund provided by interna onal fi nancial ins tu ons (mainly the World Bank and IFAD), or by dona ons from governments of various developed countries. One of the most ac ve in this regard is the Interna onal Fund for Agricultural Development (IFAD) whose projects have so far approved about 67 million KM of cash loans for agriculture.
IFAD project lending
The Interna onal Fund for Agricultural Development in Bosnia and Herzegovina has implemented fi ve projects since 1996. Beginning from 2001, a mandatory component of IFAD’s projects was a line of credit intended for farmers and SMEs engaged in agriculture. These projects work equally with fi nancial intermediaries, banks and microcredit organiza ons. Credit terms of the two most important lines of credit under the Livestock and Rural Finance Development Project (LRFDP) and the Rural Enterprise Enhancement Project (REEP) are summarized in the following table:
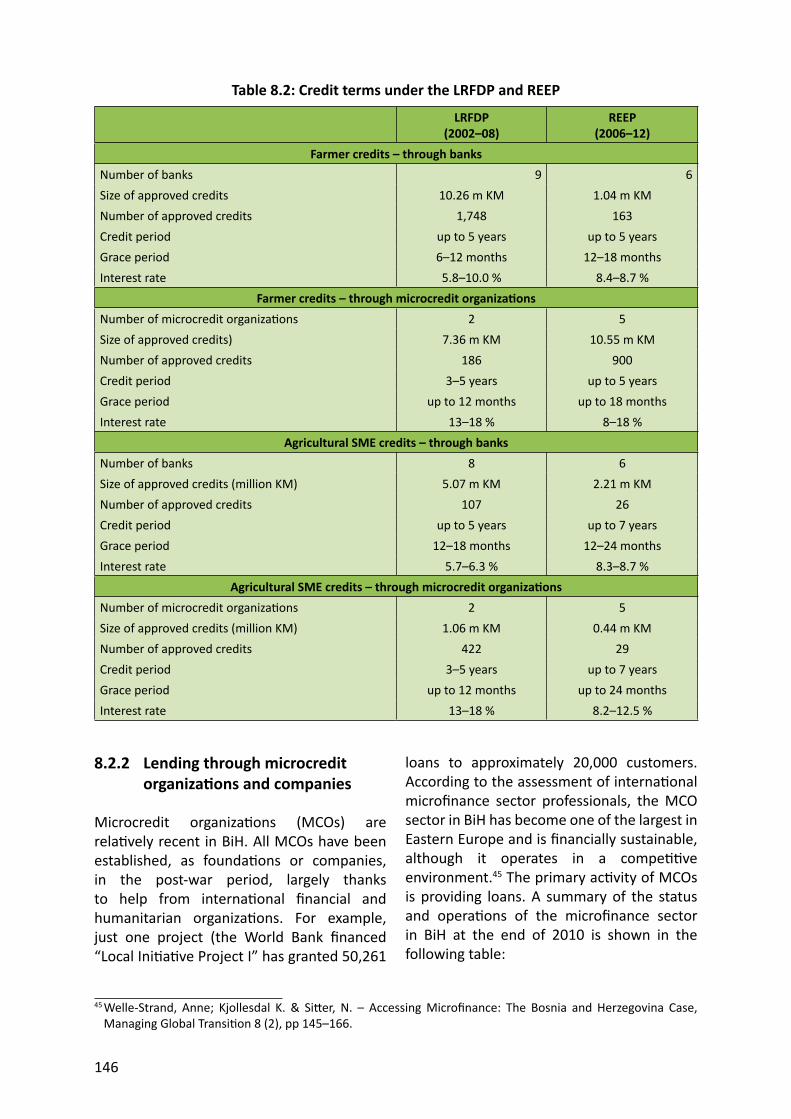
146
8.2.2 Lending through microcredit organiza ons and companies
Microcredit organiza ons (MCOs) are rela vely recent in BiH. All MCOs have been established, as founda ons or companies, in the post-war period, largely thanks to help from interna onal fi nancial and humanitarian organiza ons. For example, just one project (the World Bank fi nanced “Local Ini a ve Project I” has granted 50,261
Table 8.2: Credit terms under the LRFDP and REEP
LRFDP(2002–08)
REEP(2006–12)
Farmer credits – through banksNumber of banks 9 6Size of approved credits 10.26 m KM 1.04 m KMNumber of approved credits 1,748 163 Credit period up to 5 years up to 5 yearsGrace period 6–12 months 12–18 monthsInterest rate 5.8–10.0 % 8.4–8.7 %
Farmer credits – through microcredit organiza onsNumber of microcredit organiza ons 2 5Size of approved credits) 7.36 m KM 10.55 m KM Number of approved credits 186 900Credit period 3–5 years up to 5 yearsGrace period up to 12 months up to 18 monthsInterest rate 13–18 % 8–18 %
Agricultural SME credits – through banksNumber of banks 8 6Size of approved credits (million KM) 5.07 m KM 2.21 m KMNumber of approved credits 107 26Credit period up to 5 years up to 7 yearsGrace period 12–18 months 12–24 monthsInterest rate 5.7–6.3 % 8.3–8.7 %
Agricultural SME credits – through microcredit organiza onsNumber of microcredit organiza ons 2 5Size of approved credits (million KM) 1.06 m KM 0.44 m KMNumber of approved credits 422 29Credit period 3–5 years up to 7 yearsGrace period up to 12 months up to 24 monthsInterest rate 13–18 % 8.2–12.5 %
loans to approximately 20,000 customers. According to the assessment of interna onal microfi nance sector professionals, the MCO sector in BiH has become one of the largest in Eastern Europe and is fi nancially sustainable, although it operates in a compe ve environment.45 The primary ac vity of MCOs is providing loans. A summary of the status and opera ons of the microfi nance sector in BiH at the end of 2010 is shown in the following table:
45 Welle-Strand, Anne; Kjollesdal K. & Si er, N. – Accessing Microfi nance: The Bosnia and Herzegovina Case, Managing Global Transi on 8 (2), pp 145–166.
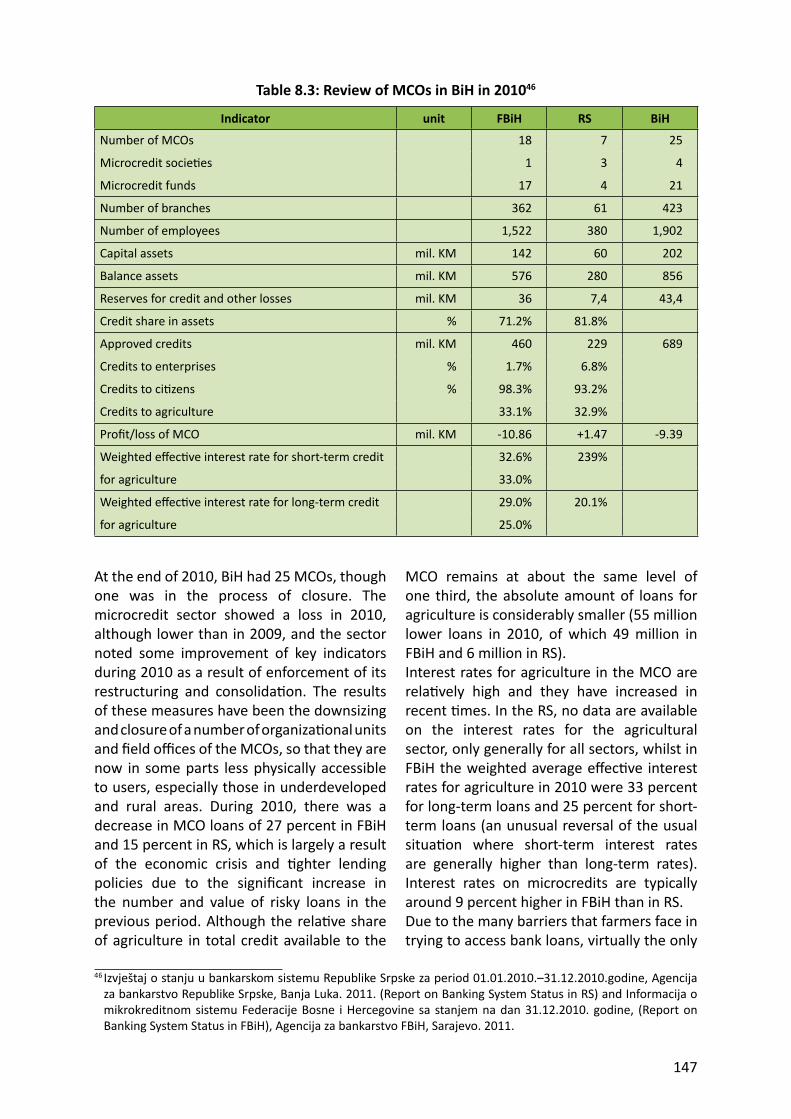
147
At the end of 2010, BiH had 25 MCOs, though one was in the process of closure. The microcredit sector showed a loss in 2010, although lower than in 2009, and the sector noted some improvement of key indicators during 2010 as a result of enforcement of its restructuring and consolida on. The results of these measures have been the downsizing and closure of a number of organiza onal units and fi eld offi ces of the MCOs, so that they are now in some parts less physically accessible to users, especially those in underdeveloped and rural areas. During 2010, there was a decrease in MCO loans of 27 percent in FBiH and 15 percent in RS, which is largely a result of the economic crisis and ghter lending policies due to the signifi cant increase in the number and value of risky loans in the previous period. Although the rela ve share of agriculture in total credit available to the
46 Izvještaj o stanju u bankarskom sistemu Republike Srpske za period 01.01.2010.–31.12.2010.godine, Agencija za bankarstvo Republike Srpske, Banja Luka. 2011. (Report on Banking System Status in RS) and Informacija o mikrokreditnom sistemu Federacije Bosne i Hercegovine sa stanjem na dan 31.12.2010. godine, (Report on Banking System Status in FBiH), Agencija za bankarstvo FBiH, Sarajevo. 2011.
Table 8.3: Review of MCOs in BiH in 201046
Indicator unit FBiH RS BiH
Number of MCOs 18 7 25
Microcredit socie es 1 3 4
Microcredit funds 17 4 21
Number of branches 362 61 423
Number of employees 1,522 380 1,902
Capital assets mil. KM 142 60 202
Balance assets mil. KM 576 280 856
Reserves for credit and other losses mil. KM 36 7,4 43,4
Credit share in assets % 71.2% 81.8%
Approved credits mil. KM 460 229 689
Credits to enterprises % 1.7% 6.8%
Credits to ci zens % 98.3% 93.2%
Credits to agriculture 33.1% 32.9%
Profi t/loss of MCO mil. KM -10.86 +1.47 -9.39
Weighted eff ec ve interest rate for short-term credit 32.6% 239%
for agriculture 33.0%
Weighted eff ec ve interest rate for long-term credit 29.0% 20.1%
for agriculture 25.0%
MCO remains at about the same level of one third, the absolute amount of loans for agriculture is considerably smaller (55 million lower loans in 2010, of which 49 million in FBiH and 6 million in RS).Interest rates for agriculture in the MCO are rela vely high and they have increased in recent mes. In the RS, no data are available on the interest rates for the agricultural sector, only generally for all sectors, whilst in FBiH the weighted average eff ec ve interest rates for agriculture in 2010 were 33 percent for long-term loans and 25 percent for short-term loans (an unusual reversal of the usual situa on where short-term interest rates are generally higher than long-term rates). Interest rates on microcredits are typically around 9 percent higher in FBiH than in RS.Due to the many barriers that farmers face in trying to access bank loans, virtually the only
148
loan source that they have are the MCOs. The total value of agriculture sector lending by MCOs in BiH is between 200 and 300 million per year. However, the scope for MCOs to provide co-fi nancing for IPARD grants may be constrained by the legal limits on maximum loan size: up to a maximum of 50,000 KM for microcredit companies and just 10,000 KM for microcredit founda ons.47
8.2.3 Lending through savings and credit organiza ons
There are just three savings and credit organiza ons in Republika Srpska and none in FBiH, where the legal framework is not yet in place. All three were established in 2008 as a result of pilot ac vi es under IFAD’s “Livestock and Rural Finance Development Project”. Their balance sheet is constantly decreasing, and at the end of 2010 it amounted to 430,000 KM. These organiza ons are of a local character and operate mainly in the municipali es of Derventa, Srbac and Berkovići. These organiza ons have established their capital on the basis of dona ons and from their members, but never managed to a ract signifi cant savings. They extend loans at more favourable terms than banks and MCOs (lower interest rates and fl exible terms of guarantee), but their credit poten al is limited and therefore they only approve loans of smaller amounts and for shorter terms. Most of their lending is for agricultural ac vi es, but due to their limited funds their eff ect on the credit market in BiH is minor.
RS Investment Development Bank and FBiH Development Bank
The Development Bank of the Federa on provides, directly or through commercial banks, so loans for all types of entrepreneurs (legal or physical persons), including farmers. It provides long-term loans to fi nance agricultural produc on, with a repayment period of 210 years and an eff ec ve interest rate of 4.3 percent. This bank has a credit line to encourage new employment, and within
47 Ar cle 4. of the Law on MCOs of RS, Sl. glasnik RS 64/06 and Ar cle 4. the Law on MCOs of FBiH, Sl. novine FBiH 59/06.
that provides loans for up to 7 years with a grace period of up to 2 years and a 3.3 percent eff ec ve interest rate, with a maximum loan amount of 10.000 KM per newly employed worker in agriculture produc on.
The Investment Development Bank (IDB) of Republika Srpska eff ec vely operates as a fund, because it does not distribute loans to customers directly but works through banks and microcredit organiza ons with which it has signed agreements (including almost all banks and MCOs based in RS). IDB has nine loan lines, of which two are exclusively intended for agriculture: a credit line for microbusiness in agriculture and a credit line for agriculture itself.
The condi ons of lending (which must be accepted by all intermediaries who use IDB funds) for microbusiness in agriculture are:
Benefi ciaries: Persons registered in the Farm Register; Purpose: Procurement of fi xed and current assets; Loan amount: 5–50,000 KM; Repayment period: Up to 10 years; Grace period: Up to 36 months; Interest rate: Basic interest rate of 5.9 percent (5.4 percent for underdeveloped municipali es and 5.6 percent for members of clusters).
The condi ons for loans to agriculture are: Benefi ciaries: Legal en es and individuals engaged in produc on or processing of agriculture or aquaculture; Purpose: Procurement of fi xed and current assets; refi nancing of exis ng obliga ons; Loan amount:• Legal en es: 30,000–5,000,000 KM for fi xed assets and 10,0002,000,000 KM for current assets
• Physical persons: 5,000–500,000 KM for fi xed assets and 5,000–100,000 KM for current assets;
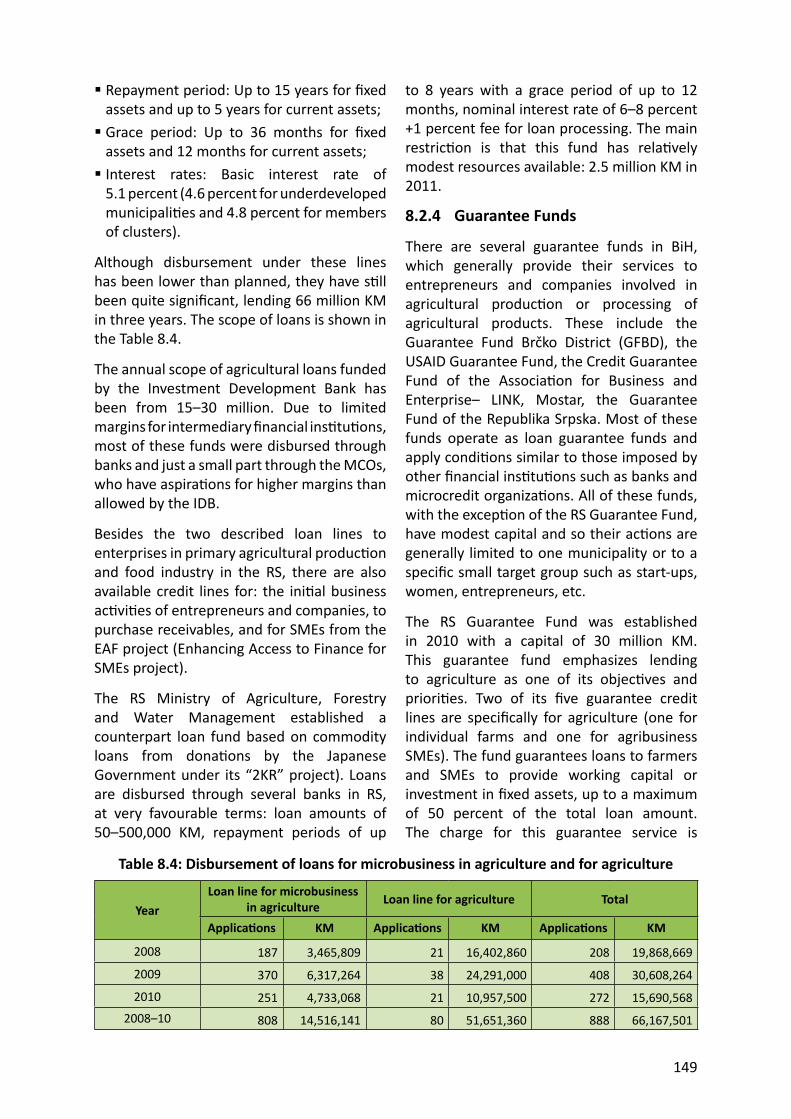
149
Repayment period: Up to 15 years for fi xed assets and up to 5 years for current assets; Grace period: Up to 36 months for fi xed assets and 12 months for current assets; Interest rates: Basic interest rate of 5.1 percent (4.6 percent for underdeveloped municipali es and 4.8 percent for members of clusters).
Although disbursement under these lines has been lower than planned, they have s ll been quite signifi cant, lending 66 million KM in three years. The scope of loans is shown in the Table 8.4.
The annual scope of agricultural loans funded by the Investment Development Bank has been from 15–30 million. Due to limited margins for intermediary fi nancial ins tu ons, most of these funds were disbursed through banks and just a small part through the MCOs, who have aspira ons for higher margins than allowed by the IDB.
Besides the two described loan lines to enterprises in primary agricultural produc on and food industry in the RS, there are also available credit lines for: the ini al business ac vi es of entrepreneurs and companies, to purchase receivables, and for SMEs from the EAF project (Enhancing Access to Finance for SMEs project).
The RS Ministry of Agriculture, Forestry and Water Management established a counterpart loan fund based on commodity loans from dona ons by the Japanese Government under its “2KR” project). Loans are disbursed through several banks in RS, at very favourable terms: loan amounts of 50–500,000 KM, repayment periods of up
Table 8.4: Disbursement of loans for microbusiness in agriculture and for agriculture
YearLoan line for microbusiness
in agriculture Loan line for agriculture Total
Applica ons KM Applica ons KM Applica ons KM
2008 187 3,465,809 21 16,402,860 208 19,868,669
2009 370 6,317,264 38 24,291,000 408 30,608,264
2010 251 4,733,068 21 10,957,500 272 15,690,5682008–10 808 14,516,141 80 51,651,360 888 66,167,501
to 8 years with a grace period of up to 12 months, nominal interest rate of 6–8 percent +1 percent fee for loan processing. The main restric on is that this fund has rela vely modest resources available: 2.5 million KM in 2011.
8.2.4 Guarantee Funds
There are several guarantee funds in BiH, which generally provide their services to entrepreneurs and companies involved in agricultural produc on or processing of agricultural products. These include the Guarantee Fund Brčko District (GFBD), the USAID Guarantee Fund, the Credit Guarantee Fund of the Associa on for Business and Enterprise– LINK, Mostar, the Guarantee Fund of the Republika Srpska. Most of these funds operate as loan guarantee funds and apply condi ons similar to those imposed by other fi nancial ins tu ons such as banks and microcredit organiza ons. All of these funds, with the excep on of the RS Guarantee Fund, have modest capital and so their ac ons are generally limited to one municipality or to a specifi c small target group such as start-ups, women, entrepreneurs, etc.
The RS Guarantee Fund was established in 2010 with a capital of 30 million KM. This guarantee fund emphasizes lending to agriculture as one of its objec ves and priori es. Two of its fi ve guarantee credit lines are specifi cally for agriculture (one for individual farms and one for agribusiness SMEs). The fund guarantees loans to farmers and SMEs to provide working capital or investment in fi xed assets, up to a maximum of 50 percent of the total loan amount. The charge for this guarantee service is
150
1.05–1.15 percent of the total loan amount. Like the RS Investment Development Bank, the fund has set maximum fi nal interest rates which banks and MCOs can charge to loan benefi ciaries who use guarantees (5.55.9 percent for benefi ciaries of agricultural loans), which may act to restrict the poten al number of users of these guarantees.
The fund is s ll at the beginning of its opera on and its short history is not yet suffi cient to gauge its eff ec veness. The fund has signed agreements with most of the banks and MCOs which operate in RS. Although some experts have suggested the establishment of a dedicated agrarian guarantee fund, the ini al idea is to focus on establishing a universal credit guarantee fund for all ac vi es, so there is a risk that agriculture will play just a marginal role within the fund’s overall por olio, leaving the problems of the agriculture sector largely unaddressed.
8.2.5 Leasing48
In Bosnia and Herzegovina, leasing services are provided in accordance with the respec ve laws on leasing of FBiH and of RS. Currently eight companies off er leasing, all are registered in the Federa on and have 28 branches in FBiH and 7 subsidiaries in RS. The one RS-based leasing company that used to operate has since been liquidated. Leasing showed considerable ini al growth and reached a peak in 2006–08, un l the global economic and fi nancial crisis struck. In 2009 there was a signifi cant drop in the amount of new leasing, though there was slight recovery in 2010.
In 2009, the leasing sector in BiH had a loss of 102 million KM, which was more than its total capital, though this was largely due to the bad performance of the largest leasing company. Total lease write-off s in that year alone were 158 million KM. The total assets of leasing companies in 2010 were 1.1 billion KM in FBiH and 80 million KM in RS. The number of ac ve contracts was 5,566, and
the volume of leasing receivables approved in 2010, 245 million KM. The structure of leased assets is dominated by cars and vehicles (52 percent), followed by machinery and equipment (33 percent), and then real estate (15 percent). About 10 percent of users are physical persons, and 90 percent legal en es. The weighted average interest rates depend on the subject of leasing, and in 2010 have usually ranged from 10–12 percent.
Within the agricultural sector, leasing services are much more important for companies carrying out primary agricultural produc on and food processing, and rela vely minor for farmers and individual entrepreneurs with the status of physical en es.
8.3 Public support to the livestock sector
The range of support measures off ered to farmers and agro-processors is discussed in sec on 5.3. Most of this support is linked to current produc on rather than investment, with the principal excep on being subsidies for the purchase of breeding livestock.
Within FBiH, many of the cantons do provide some grants for capital investment, but the majority of these target the crop sector, covering items such as greenhouses and irriga on systems. Only two cantons, ZE-DOK and SK, have specifi c measures for investment in the livestock sector, with total expenditure in 2008 of just under 700,000 KM, half of it for buildings and half for milking equipment. Such investment is clearly very small in rela on to the needs.
Similar schemes exist in RS, where the government subsidizes capital investment in agriculture from the budget allocated to the Ministry of Agriculture, Forestry and Water Management, with 10 million KM spent for this purpose in 2010. The RS ministry of agriculture off ers 40 percent subsidies for procurement of new agricultural machinery, including combine harvesters, tractors and
48 Informacija o sektoru lizinga u Federaciji BiH, Agencija za bankarstvo Federacije BiH, Sarajevo. 2011. (Informa on on the leasing sector in FBiH).
151
implements; milking machines; and newly constructed barns for cows, sheep and other kinds of livestock. The government also provides subsidies of 300 KM/head for the purchase of pregnant heifers (for a minimum herd of 5 cows) and 100 KM/head for pregnant sows (minimum herd of 20 sows).
In 2010 approval was given for 3,924 applica ons for machinery, 487 for livestock buildings, 267 for milking machines, 48 for heifers and 7 for sows. This direct subsidizing of investment in agriculture is in accordance with the long-term goals set out in the strategic documents of the RS government.
8.4 Conclusions on the availability of investment funds
Credit is clearly a signifi cant constraint for the livestock sector, par cularly for the small private farms that dominate the sector in every area except broiler produc on. A key ques on for this study is whether suffi cient co-fi nancing will be available to allow eff ec ve implementa on of the IPARD programme.
Experience from other countries shows that the large majority of IPARD grants are made to large farms and agro-processors, o en structured as companies, though it is not clear to what extent the shortage of fi nance was one of the barriers to smaller applicants. Within BiH, stakeholder interviews indicate that large farms and processors probably do have suffi cient access to fi nancing to allow eff ec ve opera on of IPARD, par cularly if the various state and interna onally funded development funds discussed above are involved in the IPARD planning process and encouraged to off er appropriate products.
Further development of specifi c credit products adapted to the needs of IPARD co-fi nancing should be priority for governments, responsible ministries and fi nancial intermediaries in BiH. However, the massive need for investment in private farms and small-scale businesses remains largely unreached by either current credit structures or the an cipated IPARD programme, and will require determined and targeted ac on if the country is to achieve the strategic goals it has set for the sector.

152
153
9. Iden fi ca on of poten al and needs of the sector
This chapter examines the strengths and weaknesses of the livestock sector and the opportuni es and threats facing both producers and processors, and builds on these to iden fy the kinds and level of investment needed: Sec on 9.1 outlines the consulta on process employed. Sec on 9.2 summarizes the results of the SWOT workshops held in Sarajevo and Banja Luka. Sec on 9.3 presents a synthesized picture of the strengths, weaknesses, opportuni es and threats aff ec ng specifi cally the dairy processing industry, drawn up by the processing consultant at the end of his missions. Sec on 9.4 presents the fi ndings of the Project Farm Survey concerning the current condi on of infrastructure on diff erent kinds of livestock farm. Sec on 9.5 brings together the fi ndings of this and earlier chapters to give a short analysis of how EU integra on is likely to impact on diff erent types of farms and processors. Sec on 9.6 draws conclusions on the principal investment needs and priori es, which form the basis of the recommenda ons in sec on 11.2.
9.1 Methodology
The key task of iden fying the poten al and needs of the sector was carried out in three sequen al steps.
SWOT workshops
The fi rst step was to conduct two stakeholder workshops, one in Sarajevo and one in Banja Luka, to collect par cipants’ opinions of the main strengths, weaknesses, opportuni es and threats, and to iden fy issues for further inves ga on during the study. At each workshop the par cipants divided into two groups, to focus on either meat or milk, and the results for each sector have been brought together below.
Project surveys
The next step was to collect structured data on infrastructure and investment needs, through structured surveys covering: 121 livestock farms 13 dairies 6 slaughterhouses and meat processors
Expert discussion and analysis
The fi nal step was to discuss these fi ndings with experts, compare them with published reports, and draw addi onal conclusions from the project’s extensive data analysis.
9.2 Strengths, Weaknesses, Opportuni es and Threats (SWOT) workshops
Two stakeholder SWOT workshops were held, one in Sarajevo and one in Banja Luka, and at each workshop the par cipants were divided into two groups, to focus on either meat or milk. Many similar points were made in both en es and for both subsectors, so the composite conclusions are presented below, grouped under the main themes that emerged in the discussions: Farms Processing Markets Finance Ins tu ons Policy Other
It should be noted that this sec on (9.2) simply presents a compila on of the views expressed by stakeholders in the SWOT workshops, including some confl ic ng views of diff erent par cipants. Later sec ons of this chapter bring in addi onal sources of informa on and the consultant’s own observa ons and experience, to develop overall conclusions on the main opportuni es and challenges facing farmers and processors (sec on 9.5) and their priority needs for investment (sec on 9.6).
154
The full results of the workshops, by en ty and subsector, are included in Annex 2.
9.2.1 Strengths
Farm level strengths
Good natural condi ons, including pastures for grazing ruminants, leading in par cular to cheaper produc on of sheep meat. Established capacity for both meat and milk produc on, including buildings, machinery and established herds. Large amount of available labour, in part due to the lack of alterna ve employment op ons in rural areas. Long tradi on in livestock produc on, with a good level of knowledge of producers and a number of well-established tradi onal dairy products. Par cularly high level of knowledge, equipment and achievements in poultry produc on, coupled with good gene c poten al of broiler stock. Generally good gene c quality of cows, as a consequence of large imports of breeding heifers a er the war. Milk produc on makes a suffi cient contribu on to household income to keep producers well mo vated.
Processing strengths
Considerable installed capacity in meat and milk processing, able to process both current and likely future quan es of product, manned by skilled staff . Tradi on in processing of both meat and milk, with several well-recognized brands of meat and dairy products on the market. A good network of milk collec on points, backed by rela vely regular and stable payment to producers, ensures stability of milk supply.
Market strengths
The dairy sector is quite oriented towards export and has economic power in the region. Rela vely good milk price (albeit lower than in Croa a and the EU).
Policy strengths
Stable and rela vely high milk subsidies.
Other strengths
Clean (unpolluted) natural environment. Favourable geographical posi on (both micro and macro loca on).
9.2.2 Weaknesses
Farm level weaknesses
Gene c material was generally seen as a problem, par cularly in pig produc on, with many widely used breeds not well suited to meat produc on. Weaknesses throughout the chain in health, hygiene, animal welfare, environmental management and traceability, with low producer knowledge on many of these issues. Dominated by large numbers of farms that are very small in both area and number of livestock, and usually fragmented into many small land parcels; scope for expansion and increased forage produc on is strongly limited by the shortage of available land. Tradi onal a tude to produc on, including gender roles, with a low level of technical knowledge, rather extensive produc on, and li le awareness of how breeding, feeding and health control can improve produc vity; animal feeding is a notable weak point. Ageing and rela vely uneducated farming popula on, with few young people interested in making a career in farming. Poorly equipped farms, with inadequate livestock buildings and li le specialized machinery such as silos, combines, hay balers and slurry tankers. Slaughtering of young categories of livestock, reducing total meat output below its poten al. Lack of fa ening capacity and a limited level of technology in much broiler produc on (contradicts one of the strengths iden fi ed above).
155
Unused natural resources (though the availability of such resources was iden fi ed as a strength). Poor meat produc vity and low milk yields, exacerbated in many cases by a poor breed structure. High prices of raw materials such as maize and concentrated feed. In direct contrast to the earlier comment that milk producers are well mo vated, it was also said that many livestock farmers are not really focussed on their produc on, which is a necessity rather than a choice un l they fi nd some other kind of employment.
Processing weaknesses
Inadequate health and hygiene control along the whole meat processing chain. Poor process control and limited innova on. Poor traceability, in processing as well as in primary produc on. Poor fi nancial results because of the low level of u liza on of processing capacity (the availability of spare capacity was noted above as a strength). Unsolved problem of dealing with animal waste, with no rendering facili es. Variable quality of raw milk, and high cost of milk collec on as tankers have to collect small quan es from many farms and collec on centres, and transport them long distances along bad roads.
Market weaknesses
Poorly organized market with weak linkages between meat and milk processors and their farm suppliers. Uncontrolled imports. Dairy product exports are focussed almost exclusively on the Croa an market. Limited range of dairy products and limited marke ng skills. Considerable investment will be needed to improve milk transport and tes ng.
Finance weaknesses
Diffi cul es in accessing credit, as many
farmers struggle to meet the requirements for collateral, farm registra on, and farm accounts.
Ins tu onal weaknesses
Poor func oning of the breeding-selec on service, border inspec on posts and laboratories. Lack of registers and animal iden fi ca on. Li le organiza on of producers, with weak farmers’ associa ons. Shortage of specialist agricultural schools and facili es for training and extension. Inadequate animal health protec on
Policy weaknesses
Poor alloca on of concessions to use state-owned agricultural land (in later discussions and farm visits, several stakeholders alleged that corrup on was common in this area). No support for young farmers. No clear strategy for commodity reserves. Weak coopera on between farmers’ associa ons and the agriculture ministries. Agricultural policy in Bosnia and Herzegovina has a social rather than development character.
Other weaknesses
Poor demographic picture (i.e. ageing popula on) in rural areas, leading to a shortage of labour (though the availability of labour was also noted as a strength). Poorly developed physical infrastructure. Lack of water. Poor botanical structure of meadows.
9.2.3 Opportuni es
Farm level opportuni es
The picture presented in the strengths and weaknesses listed above is generally one of unfulfi lled poten al, and many of the opportuni es seen for the sector consist of taking up that poten al through ac ons such as bringing uncul vated land into produc on to increase the fodder supply,
156
improving feeding systems, and improving gene c quality through be er ar fi cial insemina on services, all supported by knowledge-transfer through extension, educa on and training. Enlargement of holdings and herds to increase scale along with produc vity. The resul ng increases in produc on would spread fi xed costs across more output, lower unit costs, and allow BiH producers to be more compe ve. Sector specifi c opportuni es include contracted broiler produc on, more specializa on in milk produc on to develop a full- me stable income, and adding value through on-farm milk processing, par cularly into indigenous products such as kajmak and tradi onal cheeses. Ecological/organic produc on and processing. Some farmers saw scope for an increase in the rather variable milk price.
Processing opportuni es
Bringing unused exis ng capacity into opera on and increasing the quan es of meat and milk processed. Linking livestock produc on with other ac vi es such as tourism, gastronomy or bioenergy.
Market opportuni es
Trend of increasing consump on of milk and dairy products. Mul lateral agreements and increased access to EU markets, crea ng new export opportuni es par cularly for dairy products.
Finance opportuni es
Access to IPARD and other development funds (investment grants). Improving and increasingly applying entrepreneurial knowledge and skills (cost management, management).
Ins tu onal opportuni es
Implementa on of numerous interna onal projects in the fi eld of livestock produc on.
Increased coopera on of small producers, which could include forma on of an agricultural chamber.
Policy opportuni es
BiH’s progress in European integra on, leading eventually to EU accession. Introduc on of law on SEUROPE standard (pig produc on). Par cipa on in renewable energy sources (methane genera on from animal waste). Subsidies in livestock produc on could be reformed and made more eff ec ve. “Road map”.
Other opportuni es
Land consolida on (by sugges on/incen ves and by penal es). Unifying the quality of agricultural products.
9.2.4 Threats
Farm level threats
Livestock diseases. High and rising price of inputs in livestock produc on. Vaccina on against Classical Swine Fever poses a barrier to expor ng. Delayed payment for collected milk.
Processing threats
Possible failure to meet EU standards. Unstable milk collec on (some dairies stop or reduce milk collec on out of season).
Market threats
CEFTA agreement increases compe on from cheap imports, seen as being supported by an “import lobby”. Croa a’s accession to the EU will create many new barriers in accessing the largest current export market, and the rela vely accessible CEFTA market will con nue to shrink as other countries join the EU. Bilateral and mul lateral agreements on the recogni on of standards could make imports easier and/or exports more diffi cult.
157
Increasing supermarket power and the move to contracted produc on (which tends to exclude the smaller farmers). Frequent varia on in milk prices.
Finance threats
The demanding procedures to access IPARD funds may delay start of the programme and restrict the number of operators who can benefi t from them. Unfavourable lending policy, with high interest rates and complex administra ve requirements to obtain credit. Opera ons of the en es’ development funds (through the RS and FBiH development banks) were seen as threats by some stakeholders.
Ins tu onal threats
Complicated, long and expensive procedure to obtain a construc on permit for livestock buildings. Bad administra ve system and poor func oning of ins tu ons at the BiH level. Poor system for ensuring food quality and safety. Poor and expensive veterinary services (even though they have been priva zed). Shortage of ins tu ons for quality control of milk products. Shortage of standards cer fying ins tu ons.
Policy threats
Outstanding legisla on rela ng to the conversion of agricultural land and to land inheritance, and incomplete land res tu on. Poli cal instability, uncertainty and the many unresolved long-term issues. Undefi ned strategic direc on in produc on, with no clear policy as to what farmers should produce. Unclear ownership rela ons on land. State policy towards livestock produc on and processing was seen as unclear and/or inadequate. Inadequate budget for subsidies and policies.
Implementa on of EU standards. Lack of a long-term strategy for development of the sector Poli cians not understanding needs. Low milk price (lower than in Croa a and EU). Tax policy (introducing VAT on raw materials). Dairies’ monopoly. Lack of goat produc on incen ves (due to that there is li le goats’ milk). BiH’s entry into the EU (which producers lose and which benefi t).
Other threats
Corrup on. Minefi elds. Presence of the grey economy. Non-existence of “knowledge services” for accession. Undeveloped infrastructure (water/roads/electricity). Lack of local patrio sm (in food buying). Climate change (less rain, higher average temperature). More costly animal fodder and other raw materials (fuel). Pollu on of environment (water, soil, air). Zoonoses (animal diseases). Poor quality of semen for ar fi cial insemina on. Natural disasters (drought, hail, fl oods) and their infl uence on feed prices. Complicated procedures for issuing construc on, ecological and other permissions.
9.3 SWOT analysis of dairy processors
The following list of key strengths, weaknesses, opportuni es and threats aff ec ng dairy processors was drawn up by the processing experts a er par cipa ng in the SWOT workshops and comple ng his visits, case studies and desk research:
158
Strengths
Well managed and organized Aware of EU regula ons and standards Implemen ng gradually EU standards Earned HACCP and relevant ISO cer fi ca on Good rela onships with milk producers Technologically up-to-date Good packaging High hygienic standards 95percent of milk is cooled prior to recep on at dairies A raw milk quality improvement scheme is in place in some dairies Low levels of outstanding credit Sound understanding of the local market
Weaknesses
Many small milk producers – about 3 cows per farm Reportedly insuffi cient raw milk to sa sfy demand Many dairies compe ng for dispersed milk supplies leads to high costs of collec on Fragmented approach to milk quality improvement Cash fl ow problems caused by demand from retailers for extensive credit – o en more than 90 days Dairies operate mainly below installed capacity
Opportuni es
Product development into higher profi t lines, par cularly of longer shelf-life Con nued training of milk producers Strengthen the scope of dairy processors associa on to include establishing an industry training centre and partake in the harmoniza on of dairy legisla on Ra onaliza on of milk collec on routes Improved use of by-products such as skimmed milk and cheese whey
Threats
Lack of clear strategy or policy for agriculture in general and for milk in par cular
Lack of technical training for future industry employees Poor implementa on of exis ng legisla on Poor communica on between the industry and government and vice versa Reduc on of exports to CEFTA when the border with Croa a is closed a er their expected accession Con nued lack of support to exporters Failure of government to pay milk subsidy promptly to producers Deteriora on of global economic situa on
9.4 Infrastructure on livestock farms
The Project Farm Survey provided a detailed and structured assessment of the state of infrastructure on 112 livestock farms, covering almost every one of the farm types iden fi ed in Chapter 3.
The most important fi ndings are summarized here, together with short notes explaining the signifi cance of each observa on (shown a er the arrow):
9.4.1 Infrastructure on ca le farms
Large farms house cows all year and depend on carried forage Lost advantages of grazing Most small and medium farms tether cows, some mes all day Animal welfare problem Many small and medium farms need building repairs Hygiene problem and investment need Smallest farms give water in buckets Risk of restric ng output 60 percent of feed stores need improvement Probable wastage 75 percent of manure stores need improvement Environmental problem 88 percent of 1-cow farms and 63 percent of 2–5 cows milk by hand; 38 percent of 620 cow farms use inadequate milking machines TBC and SCC problem 10 percent of farms have no milk cooling TBC problem
159
Many small farms store milk near cows Non-compliant with EU 62 percent of farms need to improve milking equipment Investment need
Main investment needs
Buildings Milking machines and cooling tanks Manure storage Machinery for producing and handling forage
+ expansion of all facili es (and cows) to increase herd size
9.4.2 Infrastructure on sheep farms
Most house in winter only 90 percent of buildings need some improvement Many small farms give water in buckets 85 percent of feed stores need some improvement 79 percent of manure stores need improvement (but less pollu on risk than other species) 85 percent of farms shear by hand
Main investment needs
Buildings (fairly basic) Shearing equipment (not expensive) Expansion depends mainly on land and animals
9.4.3 Infrastructure on pig farms
18 percent of farms use some grazing/free-range 74 percent of buildings need minor or major improvement Many farms use manual feeding Less precise control of most expensive input 76 percent of feed stores need some improvement 52 percent of manure stores need major improvement or replacement Serious environmental problem
Main investment needs
Buildings
Automated feeding Manure storage
+ expansion of all facili es (and pigs) to increase herd size
9.4.4 Infrastructure on poultry farms
All large laying farms use cages Animal welfare issue Most buildings (especially on large farms) need only minor or no improvement Many farms use manual ven la on Most farms have no hea ng systems Many farms use manual feeding 80 percent of feed stores need some improvement 70 percent of manure stores need some improvement
Main investment needs
Adding automated feeding and climate control to exis ng buildings Minor or major improvements to buildings and feed stores Manure s torage
9.5 The implica ons of EU integra on for farms and processors
EU integra on will impact diff erently on diff erent types and sizes of livestock farms; this sec on gives a brief indica on of how each of the farm types iden fi ed in Chapter 3 is likely to be aff ected.
9.5.1 Ca le
It is a reasonable simplifi ca on to say that the EU treats milk as food as soon as it is drawn from the cow on the farm, whereas meat only becomes food in the slaughterhouse. Thus a dairy farm is a food producing establishment, whilst a beef (or sheep, or pig, or broiler) farm provides raw material for the food industry. Therefore dairy farms are subject to much ghter hygiene standards than other kinds of livestock farms, and consequently most accession countries have found that preparing their dairy sector has been one of
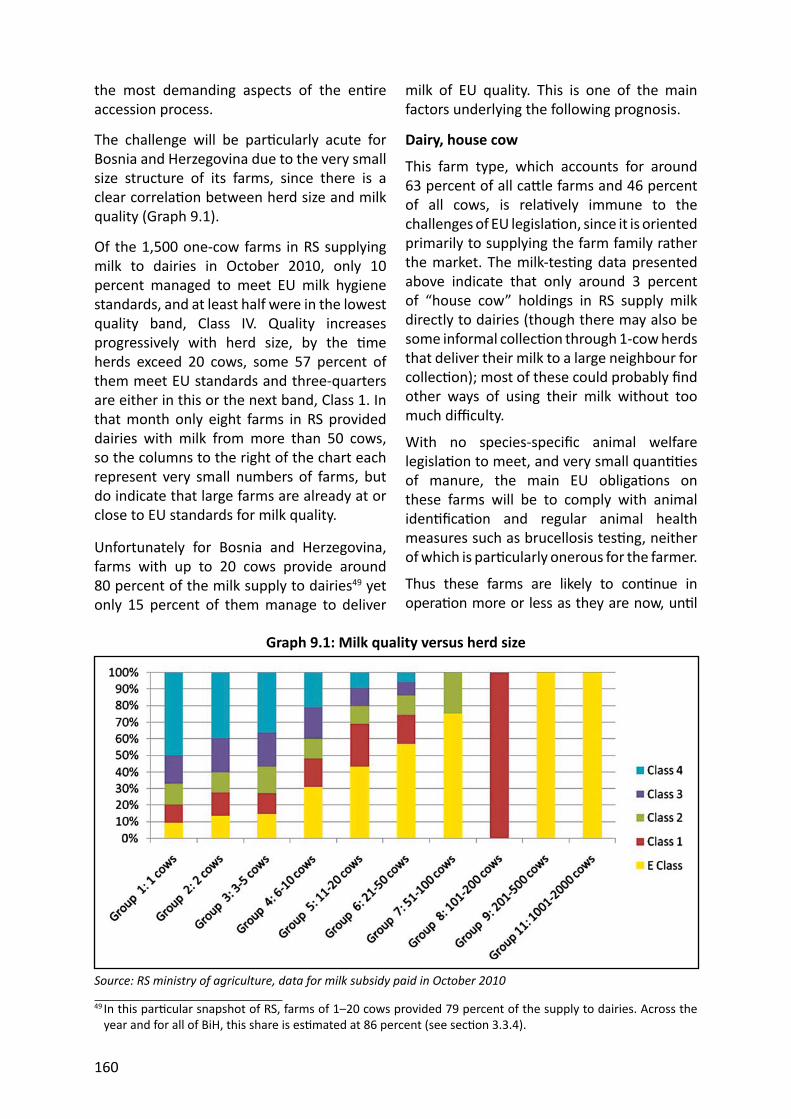
160
the most demanding aspects of the en re accession process.
The challenge will be par cularly acute for Bosnia and Herzegovina due to the very small size structure of its farms, since there is a clear correla on between herd size and milk quality (Graph 9.1).
Of the 1,500 one-cow farms in RS supplying milk to dairies in October 2010, only 10 percent managed to meet EU milk hygiene standards, and at least half were in the lowest quality band, Class IV. Quality increases progressively with herd size, by the me herds exceed 20 cows, some 57 percent of them meet EU standards and three-quarters are either in this or the next band, Class 1. In that month only eight farms in RS provided dairies with milk from more than 50 cows, so the columns to the right of the chart each represent very small numbers of farms, but do indicate that large farms are already at or close to EU standards for milk quality.
Unfortunately for Bosnia and Herzegovina, farms with up to 20 cows provide around 80 percent of the milk supply to dairies49 yet only 15 percent of them manage to deliver
Graph 9.1: Milk quality versus herd size
Source: RS ministry of agriculture, data for milk subsidy paid in October 2010
milk of EU quality. This is one of the main factors underlying the following prognosis.
Dairy, house cow
This farm type, which accounts for around 63 percent of all ca le farms and 46 percent of all cows, is rela vely immune to the challenges of EU legisla on, since it is oriented primarily to supplying the farm family rather the market. The milk-tes ng data presented above indicate that only around 3 percent of “house cow” holdings in RS supply milk directly to dairies (though there may also be some informal collec on through 1-cow herds that deliver their milk to a large neighbour for collec on); most of these could probably fi nd other ways of using their milk without too much diffi culty.
With no species-specifi c animal welfare legisla on to meet, and very small quan es of manure, the main EU obliga ons on these farms will be to comply with animal iden fi ca on and regular animal health measures such as brucellosis tes ng, neither of which is par cularly onerous for the farmer.
Thus these farms are likely to con nue in opera on more or less as they are now, un l
49 In this par cular snapshot of RS, farms of 1–20 cows provided 79 percent of the supply to dairies. Across the year and for all of BiH, this share is es mated at 86 percent (see sec on 3.3.4).
161
the farming family decides that it has be er things to do with its me and switches to buying its milk and dairy products. This change will largely be driven by non-agricultural factors of employment and income, and in many cases the younger genera on will migrate to the towns in search of work and the tradi onal “house cow” will gradually decline as the current genera on of small farmers ages.
9.5.1.1. Dairy, small dairy farm
These 2–5 cow farms account for around 22 percent of ca le farms, 39 percent of cows, and 40–60 percent of the milk supply to dairies50 – and form the most vulnerable group of all the ca le farms. The quan ty of milk produced on these holdings is too much for household use, and the main purpose of milk produc on is to generate a cash income, so the milk must be sold. These farms are s ll far from mee ng EU hygiene standards, with less than 15 percent of them currently producing EU-grade milk, yet they provide around half of the dairies’ milk supply and so simply excluding them from the system would cause a na onal shortage of milk for processing, as well as endangering the livelihoods of some 35,000 farming families.
The real problem is that there are dis nct economies of scale in dairy farming and it is very hard for a farm with just 2–3 cows (the average for this type) to recover the costs of the investment in buildings and milk equipment needed to produce hygienic milk. Therefore farms of this kind have four main op ons open to them:1. To upgrade to EU standards, and enlarge
the herd at the same me. The main constraints here will be capital (with which government measures could help) and access to land (which is more problema c);
50 From these milk subsidy data, 2–5 cow farms provided 40 percent of the dairy milk supply; the na onal es mate based on the Project Farm Survey, Master Sample and Pilot Agricultural Census was that 60 percent of the dairies’ input came from such farms.
51 The analysis of surveyed farmers’ inten ons, presented in sec on 9.7.1, suggests that most of this group believe they will stay in business and even expand. As noted in that sec on, the consultants doubt whether their future will be so bright, given the exac ng EU standards and the signifi cant economies of scale in dairying.
2. To cease supplying dairies and switch to on-farm processing for local sale and green markets. This will remain subject to na onal rather than EU legisla on and hence need not be so demanding;
3. To stop producing milk and switch to beef produc on, where hygiene standards are much less of an issue;
4. To get out of ca le produc on en rely and switch to some other form of economic ac vity, agricultural or otherwise.
In prac ce a propor on of the 35,000 “small dairy farms” will choose each of these four routes, and most of those that choose the “upgrade and enlarge” route will move up a size category to become “medium dairy farms”. Thus the overall outcome for this farm type is likely to involve a considerably smaller number of somewhat larger farms supplying dairies, with the total milk supply to dairies from this group signifi cantly reduced, but par ally off set by expansion of the next size group up.51
In policy terms, there are three ac ons that government can take to help this most vulnerable group:1. Provide good informa on and advice, so
that farmers know what to expect, what op ons are open to them, and how to move successfully along whichever of the four routes they choose;
2. Off er investment support to help “small dairy farms” grow into “medium dairy farms” and prepare to meet EU standards;
3. Ensure that the na onal regula on applied to green markets and informal sale is not too demanding. A emp ng to improve na onal milk quality by clamping down on green markets could well have disastrous consequences, either squeezing suppliers out of a
162
lightly-regulated system into completely unregulated direct sale or forcing them out of business en rely – to the serious detriment of household income. The focus should not be on shrinking the milk supply to green markets, but on increasing the supply to dairies.
Dairy, medium dairy farm
These 6–20 cow farms represent just 0.8 percent of ca le farms, 5.5 percent of cows and around 20 percent of the milk supply to dairies.52 Whilst small by interna onal standards, these are serious businesses within the BiH context, genera ng on average gross output of 17,000 KM per year from milk and a further 6,000 KM from beef; this is close to EUR 1,000 per month in a country where the official minimum monthly wage is around EUR 16053 (though there is a big diff erence between gross output and net profi t).
Just over half of these farms already produce milk at or near to EU standards (E Class or Class I) and those that do not face an increasing incen ve to improve their milk quality in order to receive the higher rates of milk subsidy and avoid price penal es from the dairies. More importantly, their herds are large enough to repay the costs of the inves ng in buildings and equipment.
This farm type should arguably become the main focus for na onal dairy policy, with a series of investment and advisory measures aiming to help such farms enlarge, upgrade to EU standards and improve milk yields, forage produc on and profi tability. Whilst the dairies would love to collect high quality milk a tonne at a me, the reality is that the exis ng 1,300 “medium dairy farms”, plus those “small dairy farms” that manage to expand above 5 cows, will form the backbone of the dairy supply chain for some years to come.
As well as the challenge of mee ng milk standards and regula ons, these farms must
also prepare for the compe on they will face from more effi cient EU Member States. The average milk yield in this group is around 4,000 litres and could almost certainly be profi tably increased through be er feeding – indica ng a clear goal for the extension services.
Dairy, large dairy farm
It is es mated that in all of BiH there are only around 70 private farms with 21–100 milking cows, together accoun ng for just 1 percent of cows and 3 percent of the milk supply to dairies. They are rela vely large businesses, producing at or close to EU standards and completely oriented to supplying milk to dairies. Average milk yields are close to 6,000 litres per cow, similar to their compe tors in the EU, and the main area for improvement should be in improved feeding and be er use of forage, so as to reduce the feed cost per litre. Although large, these are s ll predominantly family farms, opera ng as much as possible with family labour and keeping their wage bill down. One new issue that these larger farms have to contend with is manure storage and handling in order to comply with the EU Nitrates Direc ve, and many will need investment in this area.
Most importantly, these farms are generally large enough and well enough organized to contend eff ec vely for IPARD support and bank co-fi nancing. They are presented in sec on 11.2 of this study as one of the main targets for IPARD support, leaving government free to target its limited funds to the medium and small dairy farms that cannot realis cally benefi t from IPARD.
Dairy, corporate dairy farm
This category refers to farms with more than 100 dairy cows, most of which are registered as legal en es. Sta s cal returns indicate that there are around 30 such farms in BiH (including a few very large farms established by dairies), which have approximately
52 27 percent and 15 percent from the same two data sources, respec vely.53 343 KM in FBiH and 320 KM in RS, in 2009.
163
2.5 percent of all cows and provide some 10 percent of the formal milk supply. They tend to have professional management, access to fi nancing and good coopera on with their dairies, and are well aware of EU requirements for their sector. Any farm of this size has to have facili es for storing and handling manure, but the Project Farm Survey indicated that twothirds needed some further investment in this area.
The main weakness of these farms is fi nancial, since most have invested heavily, o en with borrowed money, and have signifi cant wage bills. During the world milk price boom of 20067 such farms did well across the Balkans, but under current condi ons they may have to give greater a en on to effi ciency and controlling costs in order to survive.
Eff ec vely these are medium-sized businesses with access to commercial capital and are not proposed as a key target for IPARD support, except in the specifi c area of manure storage and handling. However, these farms could provide a useful fallback in a later call for tenders should the smaller dairy farms prove incapable of sa sfying IPARD requirements.
Dairy-beef farm
There are close to 5,000 farms in Bosnia and Herzegovina that appear to combine dairy produc on with commercial beef fa ening, and together they account for around 9 percent of all ca le, 3 percent of cows and up to 11 percent of the total milk supply to dairies. EU integra on will aff ect their dairy enterprises as discussed above and their beef enterprises as discussed below, so this hybrid farm type will not be analysed any further – except to note that they probably have the fl exibility to expand their dairy herd at the expense of beef, or vice versa, giving them slightly more op ons than the average ca le farm.
Beef breeding
The 5,500 farms with beef cows account for almost 3.5 percent of ca le farms and a similar propor on of total cows. They are
typically very small, with one or two beef cows providing milk for household use and to help rear up one or two beef ca le, but also include larger commercial suckler cow units. In EU terms such farms have two advantages: As they do not provide milk to dairies, they do not have to comply with EU milk hygiene regula ons; A series of specifi c EU measures have provided support for suckler produc on. Successive reforms of the Common Agricultural Policy have shi ed funds from such “un-decoupled” payments into the core Single Farm Payment and it is not yet clear what regime will apply when Bosnia and Herzegovina eventually joins the EU, though there is quite a possibility that suckler cow payments will remain an op on at least in the “Less Favoured Areas” where they are most usually found.
RS has recently started to off er a subsidy to suckler cow producers, and this represents one of the prac cal alterna ves for small and/or remote dairy farms that either cannot aff ord the costs of upgrading to EU standards or cannot supply suffi cient quan es of milk to jus fy the costs of collec on. It is an area that should be developed further, including applied research and on-farm demonstra on to help farmers decide if this system is right for them, and then to implement it as profi tably as possible.
Beef fa ening, small
This category covers the 12,000 farms with 1–10 fa ening beef ca le and no milking cows. Together they account for 7 percent of all ca le and almost 20 percent of na onal beef produc on.
These farms should face no great challenges in complying with EU regula ons but will be quite suscep ble to compe on from the Single Market, as well as to imports from countries such as Brazil, Argen na and Botswana allowed under EU quota arrangements. Financial calcula ons for a few farms visited by the project team showed that feed costs plus the purchase price of the
164
calves represented a very high propor on of the total sale value; it seemed that the farms were only making a profi t because they grew much of the feed themselves, and they would have made almost as much money if they had got rid of the beef ca le and simply sold their maize and soya. Thus these farms are very sensi ve to price fl uctua ons, and an increase in feed cost or drop in the price of beef could move them from profi t to loss, whilst a good harvest bringing low feed costs should ensure a profi table year.
Making money from such a low margin enterprise depends on careful adjustment of the feeding level and forage-concentrate mix in response to changing market condi ons. Small farms are not normally good at such detailed management (and those that are rapidly become bigger); a good extension service could help, but the long-term development of the small beef farm sector will probably depend as much on world market trends as on any ac ons by the farmers themselves.
Beef fa ening, large
There are an es mated 130 farms in Bosnia and Herzegovina with more than 20 fa ening beef ca le, though many are considerably larger and the average herd size is just over 100 head. Together they represent almost 3.5 percent of total ca le and just over 10 percent of the beef supply.
The same economic issues apply as for smaller beef farms, but the diff erence is that the larger farms typically have be er management, be er access to land and be er machinery for forage produc on. Given their size, they could be signifi cant sources of water pollu on from manure (and occasionally also silage effl uent), and so many will need to invest in this area in order to meet EU standards.
These commercial farms probably would respond to good advice and to demonstra ons of improved forage techniques, as well as having suffi cient scale and business ability to par cipate in the IPARD programme for improvement and expansion of buildings,
construc on of manure storage facili es, and the purchase of new machinery.
9.5.2 Sheep
With the rela vely rare excep on of commercial sheep dairying (which has to meet EU standards very similar to those for dairy cows), sheep producers will not be greatly aff ected by EU legisla on. They will have to implement animal iden fi ca on (now being introduced in FBiH) and animal health controls, but have no major hygiene issues, no specifi c animal welfare legisla on to implement, and are generally extensive enough to avoid major problems of nitrate pollu on from manure. One EU-driven change that could aff ect the sector would be enforcement of the animal welfare requirement for stunning before on-farm slaughter, which could lead to changes in the marke ng chain, with more animals being channelled through slaughterhouses rather than being sold direct to households and restaurants.
Household sheep fa ening
The es mated 1,600 households that fa en 1-lamb to use some surplus pasture and provide meat for the household account for only 0.2 percent of all sheep. They are likely to con nue largely untouched by EU legisla on and may well ignore na onal regula ons as well. The lambs are – or should be – tagged on the farm of birth and so the only obliga on on the producer is to report their death or slaughter, which so far has proved almost impossible to enforce.
Household sheep breeding
Far more important at the household level is the prac ce of keeping 1–5 breeding ewes and rearing their lambs for household use and informal sale. With an es mated 21,000 such households, they account for a third of sheep holdings but only 6 percent of all sheep and 7 percent of sheep meat produc on.
The impact of EU regula on will be similar to that for the previous category, except that the breeding ewes should be ear-tagged and reported, and this is a rela vely profi table
165
form of produc on, with no lambs to buy and fairly limited use of concentrated feed. It is considerably less labour-intensive than keeping a “house cow” that needs to be milked twice a day, so this farm type will probably con nue rela vely unchanged un l socioeconomic developments reduce the number of people interested in backyard farming.
Commercial sheep fa ening
This category covers farms that buy and rear more than 5 lambs as a business. The es mated 3,200 farms of this kind typically have close to 30 fa ening lambs and probably rear them as a secondary farming enterprise. As with beef fa ening farms, they are sensi ve to the price of their inputs (young lambs and feed) and the price of their outputs (fi nished lambs), but as much of the feed comes from pasture they operate on healthier margins than beef producers and so are less immediately suscep ble to EU compe on.
Commercial sheep breeding, small
The es mated 27,000 farms with 6–20 breeding ewes represent 30 percent of the na onal sheep fl ock and 25 percent of its meat output. These will be part- me enterprises, with most of the household income origina ng from employment, pensions or other forms of agriculture, and the sheep output is mostly marketed informally.
The main impact of EU integra on on this sector would be if the ghtening up of marke ng and slaughtering reduced the eff ec ve price that producers got for their lambs and so made the business less profi table. That said, these farms generally operate from low opportunitycost land and labour, and so should be rela vely resilient.
Commercial sheep breeding, medium
Into this category fall almost 9,000 farms with 21–100 breeding ewes, producing for a variety of marke ng channels. They account for 34 percent of all sheep and 37 percent of sheep meat output, making this the most important part of the na onal supply.
Although small by na onal standards, these fl ocks will o en contribute a major share of household income. They do not have labour costs to pay but, because of the shortage of land on most of the small holdings in Bosnia and Herzegovina, will o en have to buy a signifi cant propor on of their winter feed. Thus the main factors infl uencing the development of this sector will be the economic ones of feed and lamb prices.
In many parts of the EU, sheep produc on is considered to make an essen al contribu on to the farmed environment, and hence a number of subsidies have been provided to sheep producers over the years. This could be a future opportunity for this group of farms, which is unlikely to par cipate much in the IPARD programme.
Commercial sheep breeding, large
The es mated 1,000 commercial farms with over 100 breeding ewes are compe ve in size with many producers in Europe. Together they account for around a quarter of the na onal sheep fl ock and a similar share of the sheep meat supply to slaughterhouses.
The issues aff ec ng these producers are similar to those of the previous category, except that they are likely to have higher cash outgoings, be even more dependent on sheep produc on for their livelihoods, and have a generally more professional approach to sheep produc on. Whilst one of the main economic strengths of the sheep sector is that it tends to require quite low levels of capital investment, some of the farms in this group might wish to take account of the opportunity of IPARD in order to construct buildings for overwintering and early lambing, and to buy new tractors and forage machinery.
9.5.3 Pigs
Experience across central Europe has shown that the pig sector is one of the areas of agriculture most aff ected by EU accession. One element is the investment needed in order to comply with EU requirements on animal welfare and manure handling, but
166
more infl uen al has been the compe on from large-scale and highly effi cient producers from countries such as Denmark, Belgium and the Netherlands. Feed cons tutes such a high propor on of total produc on costs that the original EU support mechanisms eff ec vely treated pig meat as “packaged feed”, and the diff erence between profi t and loss now depends on a few percentage points higher or lower feed conversion effi ciency and daily live weight gain. The tradi on of small-scale and backyard pig-keeping in many Balkan countries was founded on rela vely high import protec on, and once exposed to the EU Single Market even tradi onally strong producers such as Hungary found themselves under considerable pressure.
Home and informal slaughter are almost as important for pigs as for sheep, so the enforcement of EU standards for animal welfare at slaughter could have a signifi cant impact on the marke ng chain. Pigs also have to be brought into the EU-compa ble system of animal iden fi ca on before accession, but this is scheduled to take place a er the eartagging of sheep. The principal human health risk from pig produc on – that of trichinella infec on – is already eff ec vely addressed through low-cost tes ng by local veterinarians and so no major changes will be needed here.
Due to ethnic and religious tradi ons, pig produc on is concentrated in RS and BD, though s ll with a signifi cant amount of produc on in Croa an areas of the Federa on.
Household pig fa ening
The tradi onal prac ce of buying a couple of weaners in the summer and fa ening them up for the winter is es mated to take place on almost 80,000 households and account for just over 60 percent of pig holdings and a quarter of pigs. These producers are analogous to the “household sheep fa ening” farms discussed in the previous sec on, though numerically much more signifi cant, and like them will be almost untouched by EU regula ons other than those on slaughter.
However, what these households will see is EU-sourced pork, bacon and ham on sale in supermarkets for less than the cost at which they can fa en their own pigs on purchased feed. If the experience of other countries is anything to go by, a large propor on of households will simply stop rearing pigs and buy their meat instead. The fi rst-order eff ect of this would be a drop of 20 percent or more in na onal pig meat produc on, and so a cri cal ques on is to what extent commercial producers are able to expand their produc on to meet this new demand, in the face of strong compe on from imports.
Household pig breeding/fa ening, “house sow”
The es mated 23,000 households with a single breeding sow, accoun ng for 18 percent of pig holdings and 20 percent of all pigs, are closely linked to the system just described, partly producing pigs for it and partly fa ening their own pigs in very small-scale opera ons. These holdings will be just as suscep ble to EU compe on and may also be expected to decrease rapidly in response to imports, leading to a further reduc on of up to 14 percent of na onal produc on.
Commercial pig fa ening, pig breeding-fa ening, and breeding
The es mated 24,000 commercial pig farms have been split according to the main focus of their opera on, rather than by size, into: 8,000 pig fa ening farms, accoun ng for 6 percent of pig holdings and 8 percent of all pigs; 2,000 breeding-fa ening farms, represen ng 2 percent of pig holdings and 15 percent of pigs; 16,000 pig breeding farms (either selling weaners to specialist fa ening farms or, more frequently, selling them for slaughter as piglets), with 13 percent of pig farms and 31 percent of pigs.
All three farm types have to work within the very ght margins between feed in and pigs out, and will only survive if they can match
167
the effi ciency of their EU compe tors. Some smaller units will con nue to produce on the basis of home-grown feed and uncosted family labour, but most larger farms will have to make signifi cant improvements in order to secure their future. This may well result in major structural change similar to that already seen in the broiler industry, with development of a small number of quite large farms, quite o en linked to interna onal companies providing their gene c material, preven ve health care and management advice.
With compe vely driven restructuring and a need for major investment to meet EU animal welfare and hygiene standards, there is a clear role for IPARD in assis ng the pig sector, though for many small producers the future will lie in a business other than pigs.
9.5.4 Poultry
Poultry produc on eff ec vely comprises two completely diff erent businesses: egg produc on from laying hens and meat produc on from broilers. Both will be aff ected by EU animal welfare and, to a lesser extent, environmental standards.
Laying hens, household
It is es mated that nearly 170,000 households keep a few laying hens to provide the family with eggs. Together these account for almost 90 percent of all layer holdings, though many would not fi t in any other defi ni on of a “farm”.
This kind of produc on has mul ple objec ves: to provide really fresh eggs, typically perceived as being healthier than those bought from a shop; to use up household scraps; to provide manure for the vegetable garden; and as a daily ac vity that many people enjoy. As such it is not primarily driven by economic mo ves, and the fi nancial outlay is small, so this form of produc on is unlikely to be much aff ected by EU integra on and will develop more in response to changes in lifestyle and preferences. Thus the share of na onal egg produc on produced in this way
(currently es mated at 27 percent) is likely to decline gradually rather than drama cally.
Laying hens, small commercial
For the small-scale commercial producer (defi ned here as 21–500 laying hens but averaging only 40), the situa on is rather diff erent. These es mated 21,000 producers usually have to buy their feed and compete with shop-bought eggs from large producers or, a er accession, from elsewhere in the EU. Their food-conversion effi ciency is almost certainly much lower than that of large professional units, and they can only survive by achieving a price premium for locally sold eggs – or by simply not coun ng the real costs of produc on.
Such medium-scale produc on (currently producing just under 20 percent of total eggs in BiH) has declined considerably in the EU and is likely to do so in Bosnia and Herzegovina as well, resul ng in a pronounced bi-modal structure of very small and very large farms.
Laying hens, large commercial
It is es mated that there are close to 200 large-scale egg farms, together housing almost half of the na on’s laying hens and producing 54 percent of its eggs. Whilst the defi ni on used was any farm with more than 500 laying hens, in prac ce there are almost no farms in the hundreds of birds and the average for this type is 12,000 layers.
Although this sector has not developed as rapidly as broiler produc on over recent years, it is understood that most of these 200 are serious producers, working at or close to European levels of effi ciency. The principal threat to this group will come from the EU welfare requirement to completely re-equip tradi onal ba ery units with new “enriched cages”. This is an area where IPARD support could make a very mely interven on and help to prepare this sector for a viable future within the EU.
Broiler hens, household/small commercial
It is es mated that almost 30,000 households buy and rear a few broiler hens for their own
168
consump on. Whilst these represent 99 percent of all broiler holdings, the average number of birds is just 20, so together they account for less than 10 percent of all broiler hens, making this the most clearly bi-modal of all livestock sectors.
As with household pig fa ening, the feed cost is o en greater than the cost of buying chicken meat in the shops, and the process of killing, plucking and gu ng chickens is not as pleasurable as the daily collec on of eggs. Thus this form of produc on may be expected to decline rela vely rapidly in response to the availability of low-cost and ready-prepared poultry meat from home and abroad.
Broiler hens, large commercial
The es mated 300 large broiler producers, many of them structured as legal en es, are one of the success stories of BiH agriculture. Their number has more than doubled in the last fi ve years, supported by ver cal integra on whereby contracted growers are provided with both their key inputs and a guaranteed market. These 300 producers already produce over 80 percent of the country’s poultry meat output and seem set to expand, enabling them to fi ll the gap created by the decline of the small commercial sector before it is fi lled by imports.
EU regula on will put new pressures on this sector, principally through the welfare requirement to reduce stocking densi es but also through restric ons on manure disposal, whilst the compe on in this low margin business will require con nuous technical improvement. IPARD funds could assist these producers to improve and enlarge their buildings, thus allowing them to meet new stocking density requirements without loss of throughput, as well as suppor ng further growth of the sector.
9.5.5 Processors
Dairy processors will be faced with a whole ra of legisla on rela ng to milk quality and hygiene parameters. Both they and meat processors will face more rigorous standards for premises and inspec on rou nes.
Analysis of the current condi ons in dairies and meat processors during site visits and inspec ons indicates that the processing industry is generally well equipped, in suitable premises using modern technology. As would be expected, this is par cularly the case with the larger factories, and it was clear that almost all plants visited were upgrading their opera ons with reference to the appropriate EU standards. This upgrading process is proceeding without signifi cant support from competent authori es, such as en ty ministries of agriculture or their departments.
Before Bosnia and Herzegovina can accede to the EU, all of its meat and dairy plants will need to fulfi l the same requirements as for export to the EU now. Thus, if the competent authori es can secure the necessary country level approvals, processors will be able to start adap ng their opera ons and product ranges to meet EU requirements in advance of accession. The loss of Croa a as a CEFTA export market will be the most signifi cant factor in the short term; if BiH processors wish to con nue supplying this tradi onal market, they and the veterinary services will need to meet the requirements for trade to the EU as soon as poss ible.
9.6 Benchmarking
This sec on presents key fi gures on the BiH livestock industry in a European and regional context. The primary source of data is the FAOSTAT database for Europe54 for 2010,
54 Which excludes Cyprus.
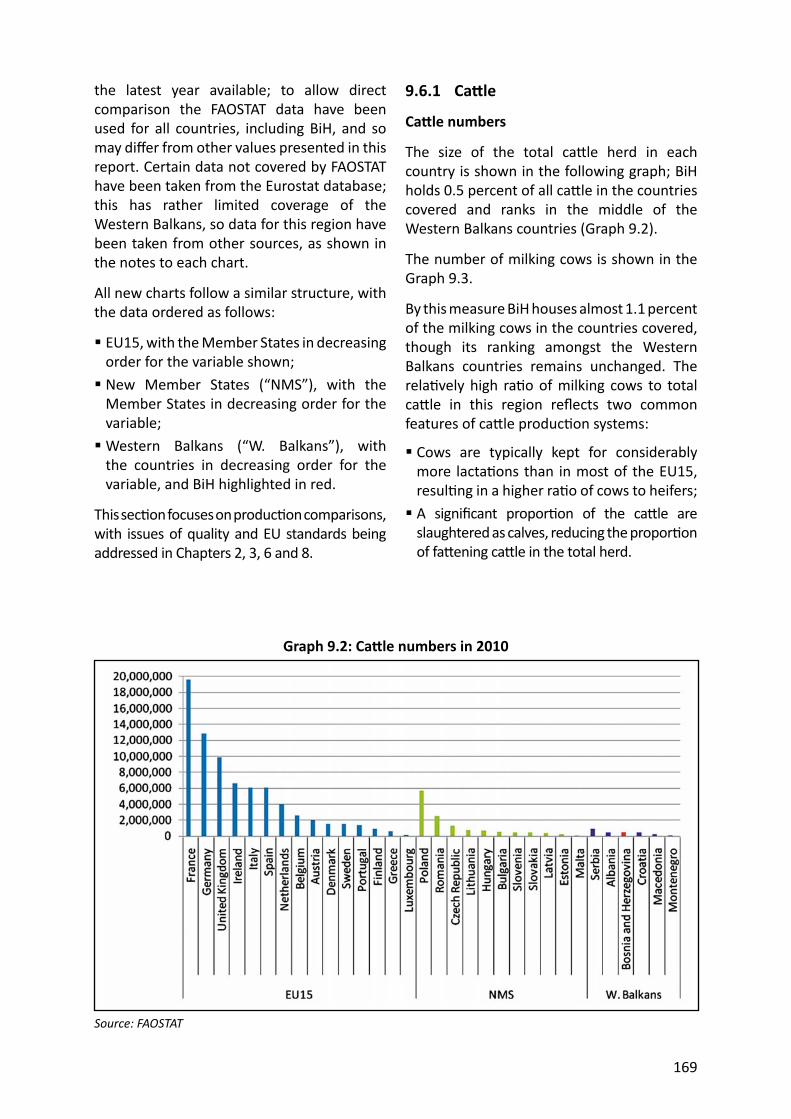
169
the latest year available; to allow direct comparison the FAOSTAT data have been used for all countries, including BiH, and so may diff er from other values presented in this report. Certain data not covered by FAOSTAT have been taken from the Eurostat database; this has rather limited coverage of the Western Balkans, so data for this region have been taken from other sources, as shown in the notes to each chart.
All new charts follow a similar structure, with the data ordered as follows:
EU15, with the Member States in decreasing order for the variable shown; New Member States (“NMS”), with the Member States in decreasing order for the variable; Western Balkans (“W. Balkans”), with the countries in decreasing order for the variable, and BiH highlighted in red.
This sec on focuses on produc on comparisons, with issues of quality and EU standards being addressed in Chapters 2, 3, 6 and 8.
Graph 9.2: Ca le numbers in 2010
Source: FAOSTAT
9.6.1 Ca le
Ca le numbers
The size of the total ca le herd in each country is shown in the following graph; BiH holds 0.5 percent of all ca le in the countries covered and ranks in the middle of the Western Balkans countries (Graph 9.2).
The number of milking cows is shown in the Graph 9.3.
By this measure BiH houses almost 1.1 percent of the milking cows in the countries covered, though its ranking amongst the Western Balkans countries remains unchanged. The rela vely high ra o of milking cows to total ca le in this region refl ects two common features of ca le produc on systems:
Cows are typically kept for considerably more lacta ons than in most of the EU15, resul ng in a higher ra o of cows to heifers; A signifi cant propor on of the ca le are slaughtered as calves, reducing the propor on of fa ening ca le in the total herd.
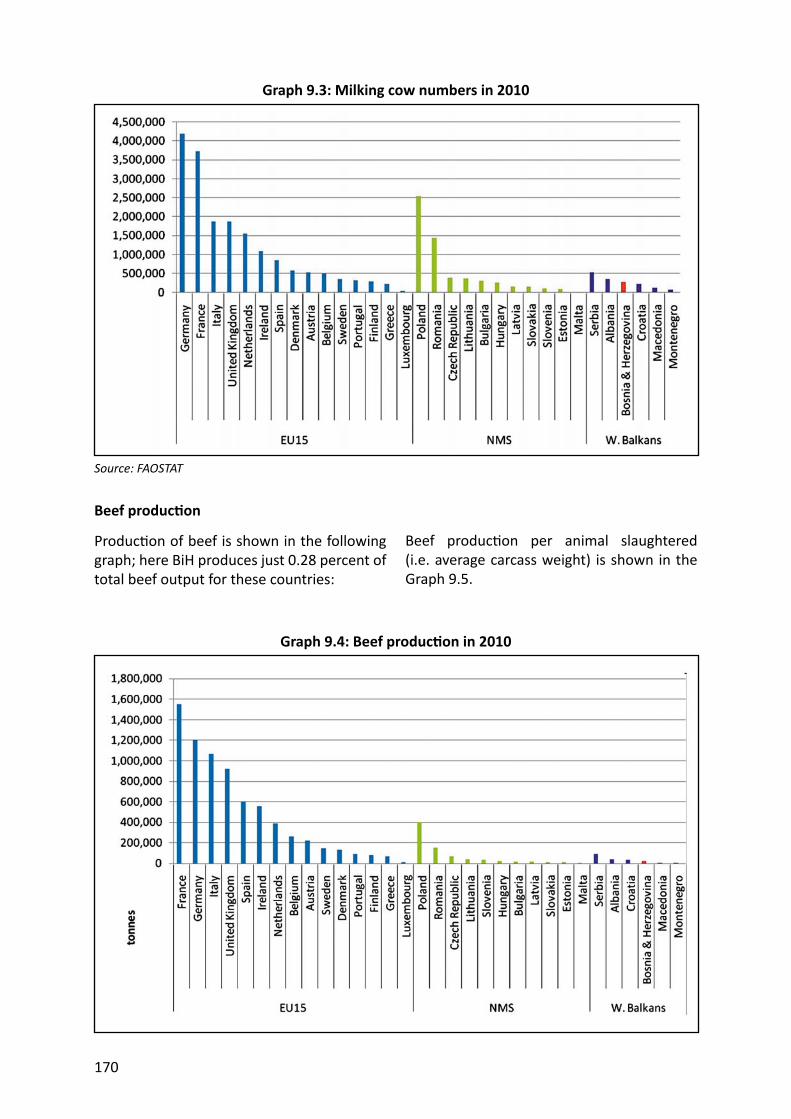
170
Beef produc on
Produc on of beef is shown in the following graph; here BiH produces just 0.28 percent of total beef output for these countries:
Graph 9.3: Milking cow numbers in 2010
Source: FAOSTAT
Graph 9.4: Beef produc on in 2010
Beef produc on per animal slaughtered (i.e. average carcass weight) is shown in the Graph 9.5.
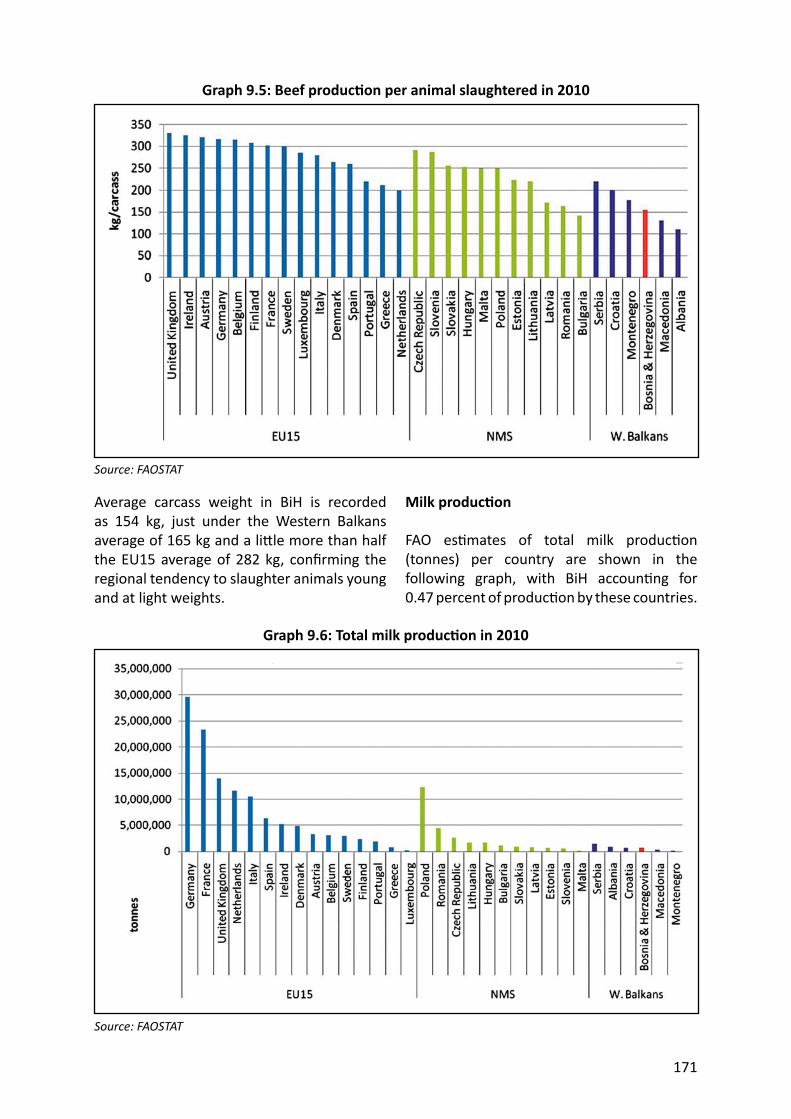
171
Average carcass weight in BiH is recorded as 154 kg, just under the Western Balkans average of 165 kg and a li le more than half the EU15 average of 282 kg, confi rming the regional tendency to slaughter animals young and at light weights.
Graph 9.5: Beef produc on per animal slaughtered in 2010
Source: FAOSTAT
Milk produc on
FAO es mates of total milk produc on (tonnes) per country are shown in the following graph, with BiH accoun ng for 0.47 percent of produc on by these countries.
Graph 9.6: Total milk produc on in 2010
Source: FAOSTAT
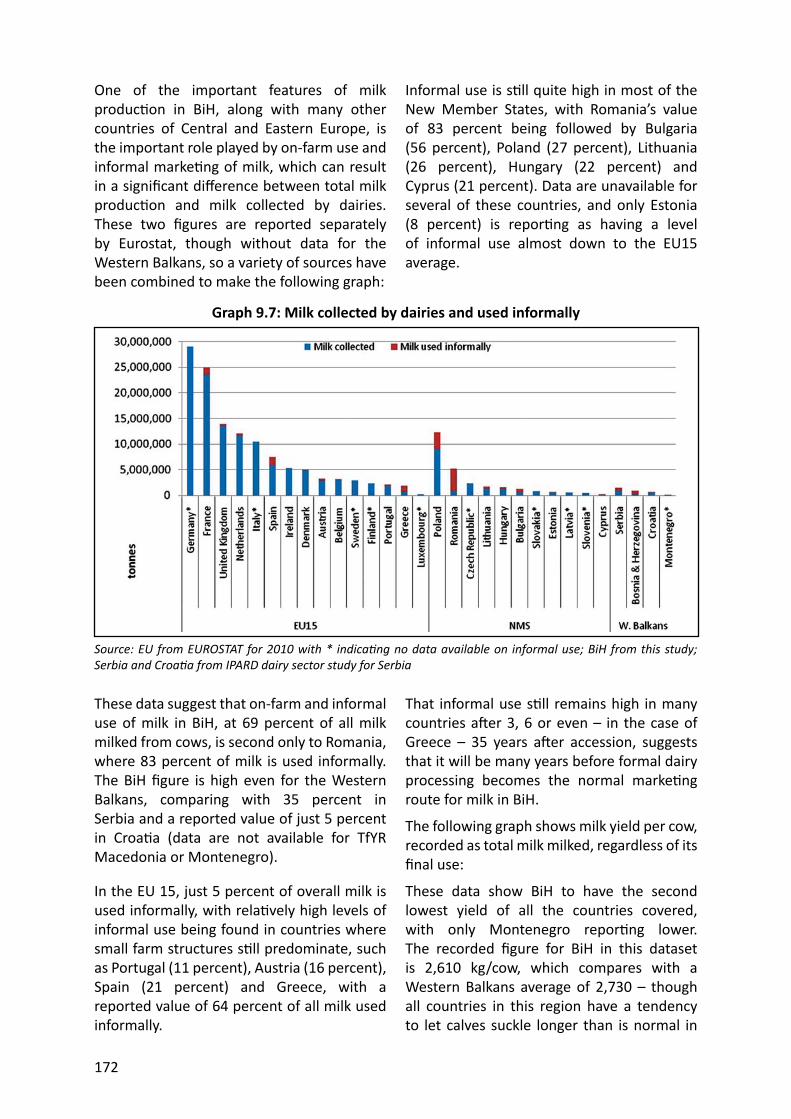
172
One of the important features of milk produc on in BiH, along with many other countries of Central and Eastern Europe, is the important role played by on-farm use and informal marke ng of milk, which can result in a signifi cant diff erence between total milk produc on and milk collected by dairies. These two fi gures are reported separately by Eurostat, though without data for the Western Balkans, so a variety of sources have been combined to make the following graph:
Graph 9.7: Milk collected by dairies and used informally
Source: EU from EUROSTAT for 2010 with * indica ng no data available on informal use; BiH from this study; Serbia and Croa a from IPARD dairy sector study for Serbia
These data suggest that on-farm and informal use of milk in BiH, at 69 percent of all milk milked from cows, is second only to Romania, where 83 percent of milk is used informally. The BiH fi gure is high even for the Western Balkans, comparing with 35 percent in Serbia and a reported value of just 5 percent in Croa a (data are not available for TfYR Macedonia or Montenegro).
In the EU 15, just 5 percent of overall milk is used informally, with rela vely high levels of informal use being found in countries where small farm structures s ll predominate, such as Portugal (11 percent), Austria (16 percent), Spain (21 percent) and Greece, with a reported value of 64 percent of all milk used informally.
Informal use is s ll quite high in most of the New Member States, with Romania’s value of 83 percent being followed by Bulgaria (56 percent), Poland (27 percent), Lithuania (26 percent), Hungary (22 percent) and Cyprus (21 percent). Data are unavailable for several of these countries, and only Estonia (8 percent) is repor ng as having a level of informal use almost down to the EU15 average.
That informal use s ll remains high in many countries a er 3, 6 or even – in the case of Greece – 35 years a er accession, suggests that it will be many years before formal dairy processing becomes the normal marke ng route for milk in BiH.
The following graph shows milk yield per cow, recorded as total milk milked, regardless of its fi nal use:
These data show BiH to have the second lowest yield of all the countries covered, with only Montenegro repor ng lower. The recorded fi gure for BiH in this dataset is 2,610 kg/cow, which compares with a Western Balkans average of 2,730 – though all countries in this region have a tendency to let calves suckle longer than is normal in
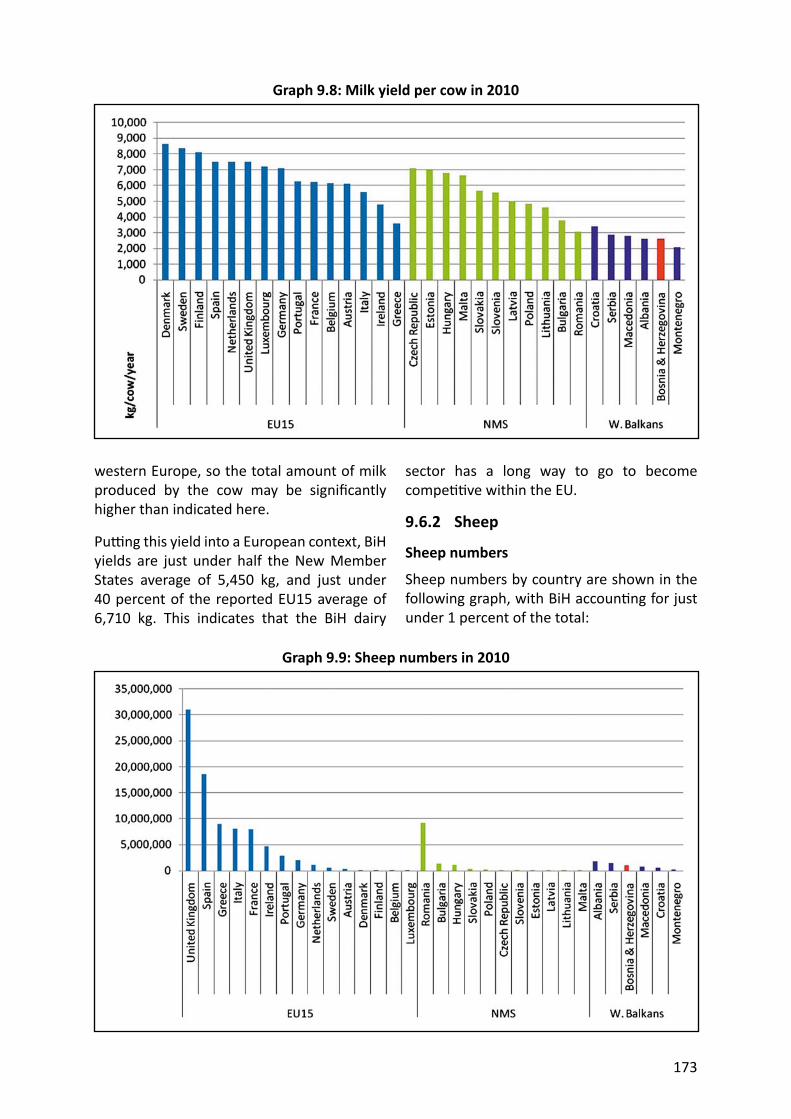
173
western Europe, so the total amount of milk produced by the cow may be signifi cantly higher than indicated here.
Pu ng this yield into a European context, BiH yields are just under half the New Member States average of 5,450 kg, and just under 40 percent of the reported EU15 average of 6,710 kg. This indicates that the BiH dairy
Graph 9.8: Milk yield per cow in 2010
sector has a long way to go to become compe ve within the EU.
9.6.2 Sheep
Sheep numbers
Sheep numbers by country are shown in the following graph, with BiH accoun ng for just under 1 percent of the total:
Graph 9.9: Sheep numbers in 2010
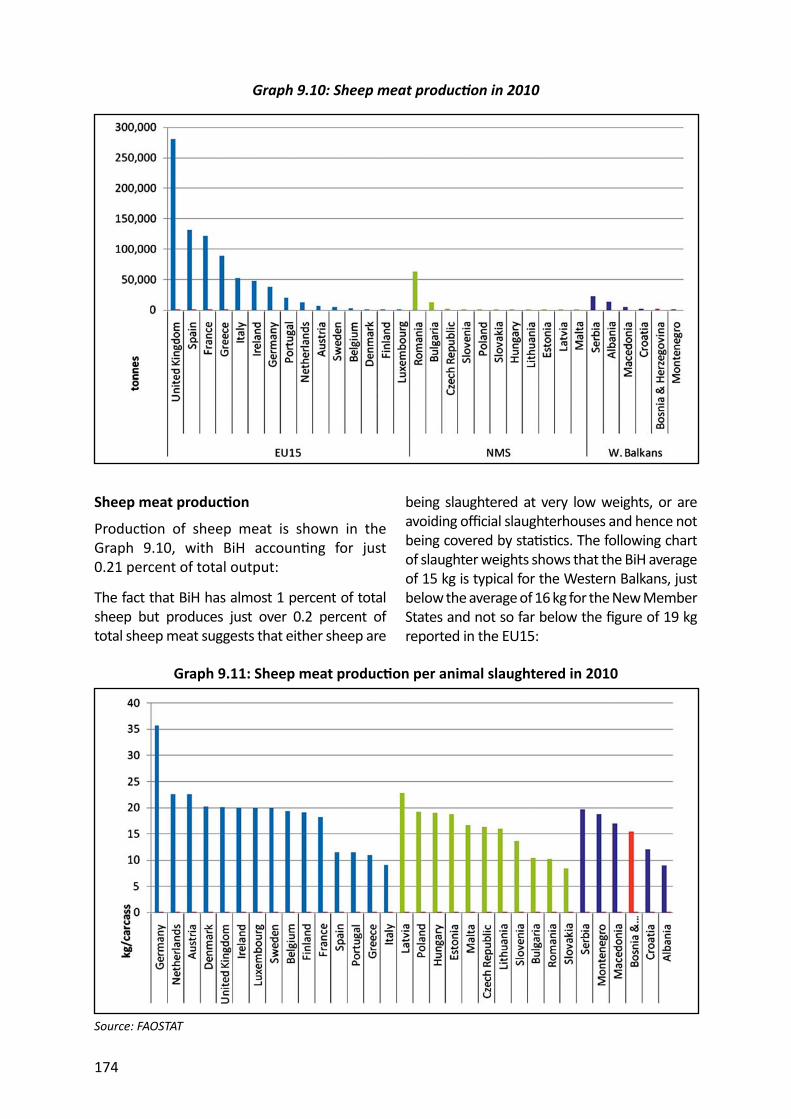
174
Sheep meat produc on
Produc on of sheep meat is shown in the Graph 9.10, with BiH accoun ng for just 0.21 percent of total output:
The fact that BiH has almost 1 percent of total sheep but produces just over 0.2 percent of total sheep meat suggests that either sheep are
Graph 9.10: Sheep meat produc on in 2010
being slaughtered at very low weights, or are avoiding offi cial slaughterhouses and hence not being covered by sta s cs. The following chart of slaughter weights shows that the BiH average of 15 kg is typical for the Western Balkans, just below the average of 16 kg for the New Member States and not so far below the fi gure of 19 kg reported in the EU15:
Graph 9.11: Sheep meat produc on per animal slaughtered in 2010
Source: FAOSTAT
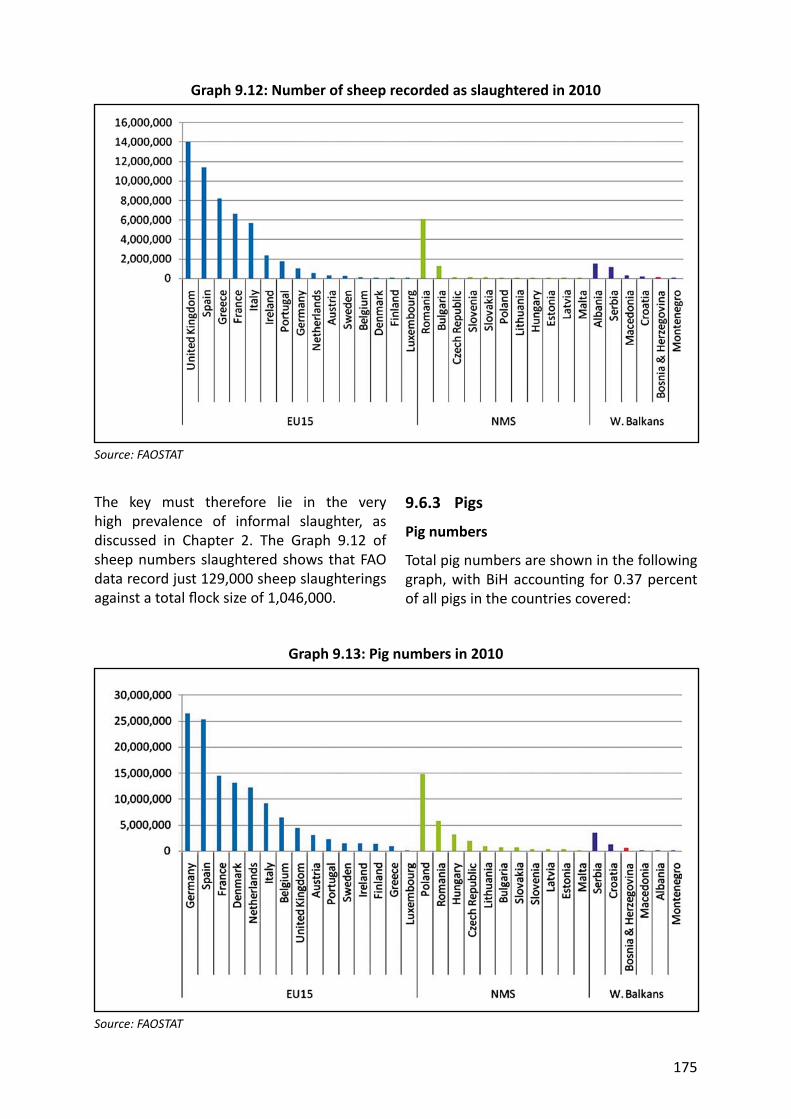
175
The key must therefore lie in the very high prevalence of informal slaughter, as discussed in Chapter 2. The Graph 9.12 of sheep numbers slaughtered shows that FAO data record just 129,000 sheep slaughterings against a total fl ock size of 1,046,000.
Graph 9.12: Number of sheep recorded as slaughtered in 2010
Source: FAOSTAT
Graph 9.13: Pig numbers in 2010
Source: FAOSTAT
9.6.3 Pigs
Pig numbers
Total pig numbers are shown in the following graph, with BiH accoun ng for 0.37 percent of all pigs in the countries covered:
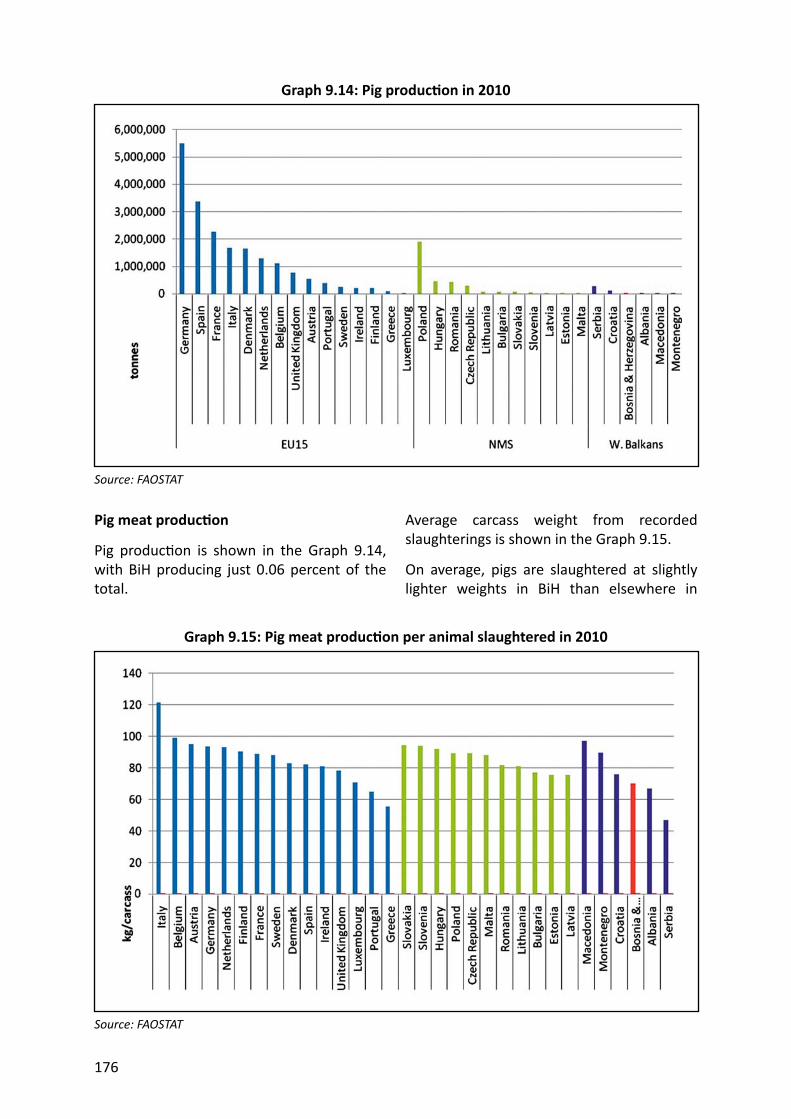
176
Pig meat produc on
Pig produc on is shown in the Graph 9.14, with BiH producing just 0.06 percent of the total.
Graph 9.14: Pig produc on in 2010
Source: FAOSTAT
Average carcass weight from recorded slaughterings is shown in the Graph 9.15.
On average, pigs are slaughtered at slightly lighter weights in BiH than elsewhere in
Graph 9.15: Pig meat produc on per animal slaughtered in 2010
Source: FAOSTAT
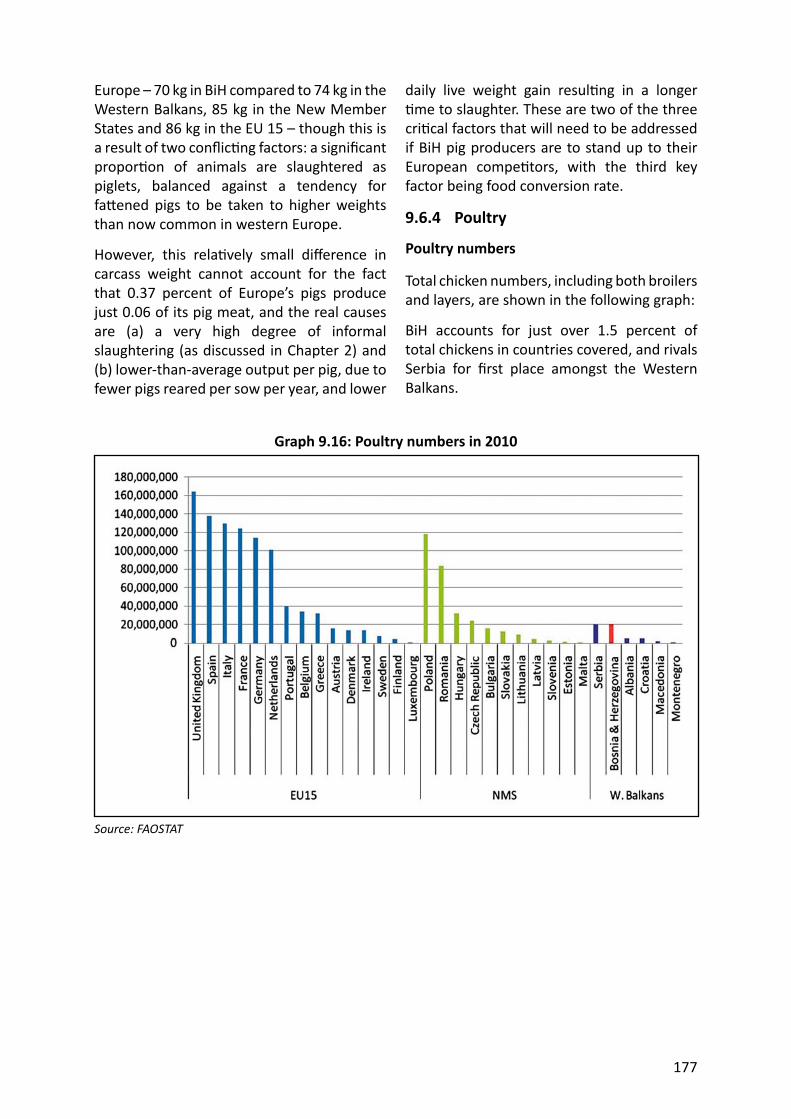
177
Europe – 70 kg in BiH compared to 74 kg in the Western Balkans, 85 kg in the New Member States and 86 kg in the EU 15 – though this is a result of two confl ic ng factors: a signifi cant propor on of animals are slaughtered as piglets, balanced against a tendency for fa ened pigs to be taken to higher weights than now common in western Europe.
However, this rela vely small diff erence in carcass weight cannot account for the fact that 0.37 percent of Europe’s pigs produce just 0.06 of its pig meat, and the real causes are (a) a very high degree of informal slaughtering (as discussed in Chapter 2) and (b) lower-than-average output per pig, due to fewer pigs reared per sow per year, and lower
Graph 9.16: Poultry numbers in 2010
Source: FAOSTAT
daily live weight gain resul ng in a longer me to slaughter. These are two of the three
cri cal factors that will need to be addressed if BiH pig producers are to stand up to their European compe tors, with the third key factor being food conversion rate.
9.6.4 Poultry
Poultry numbers
Total chicken numbers, including both broilers and layers, are shown in the following graph:
BiH accounts for just over 1.5 percent of total chickens in countries covered, and rivals Serbia for fi rst place amongst the Western Balkans.
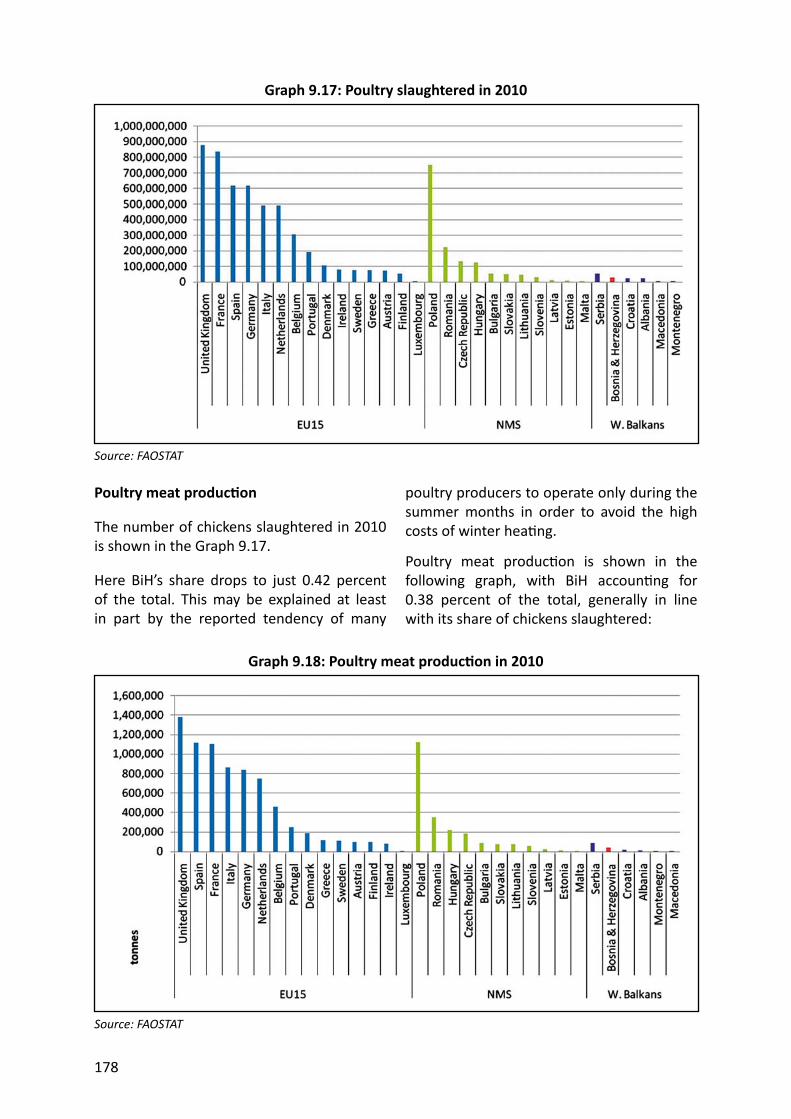
178
Poultry meat produc on
The number of chickens slaughtered in 2010 is shown in the Graph 9.17.
Here BiH’s share drops to just 0.42 percent of the total. This may be explained at least in part by the reported tendency of many
Graph 9.17: Poultry slaughtered in 2010
Source: FAOSTAT
poultry producers to operate only during the summer months in order to avoid the high costs of winter hea ng.
Poultry meat produc on is shown in the following graph, with BiH accoun ng for 0.38 percent of the total, generally in line with its share of chickens slaughtered:
Graph 9.18: Poultry meat produc on in 2010
Source: FAOSTAT
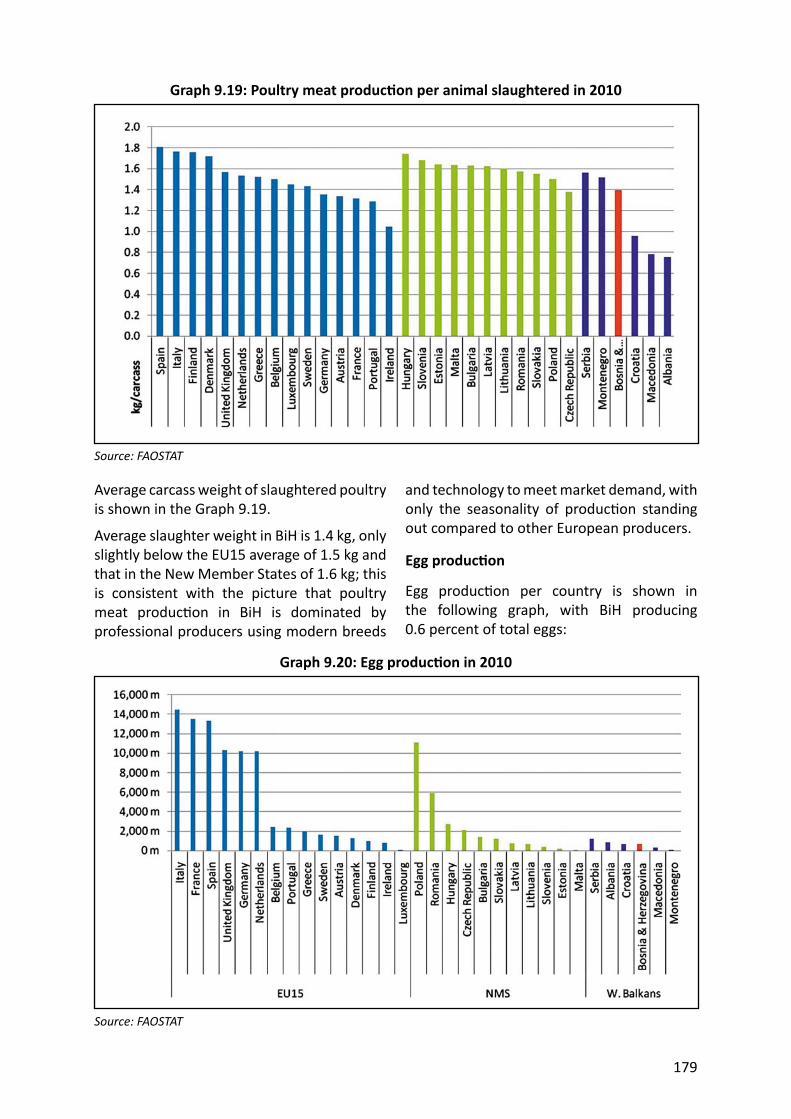
179
Average carcass weight of slaughtered poultry is shown in the Graph 9.19.
Average slaughter weight in BiH is 1.4 kg, only slightly below the EU15 average of 1.5 kg and that in the New Member States of 1.6 kg; this is consistent with the picture that poultry meat produc on in BiH is dominated by professional producers using modern breeds
Graph 9.19: Poultry meat produc on per animal slaughtered in 2010
Source: FAOSTAT
Graph 9.20: Egg produc on in 2010
Source: FAOSTAT
and technology to meet market demand, with only the seasonality of produc on standing out compared to other European producers.
Egg produc on
Egg produc on per country is shown in the following graph, with BiH producing 0.6 percent of total eggs:
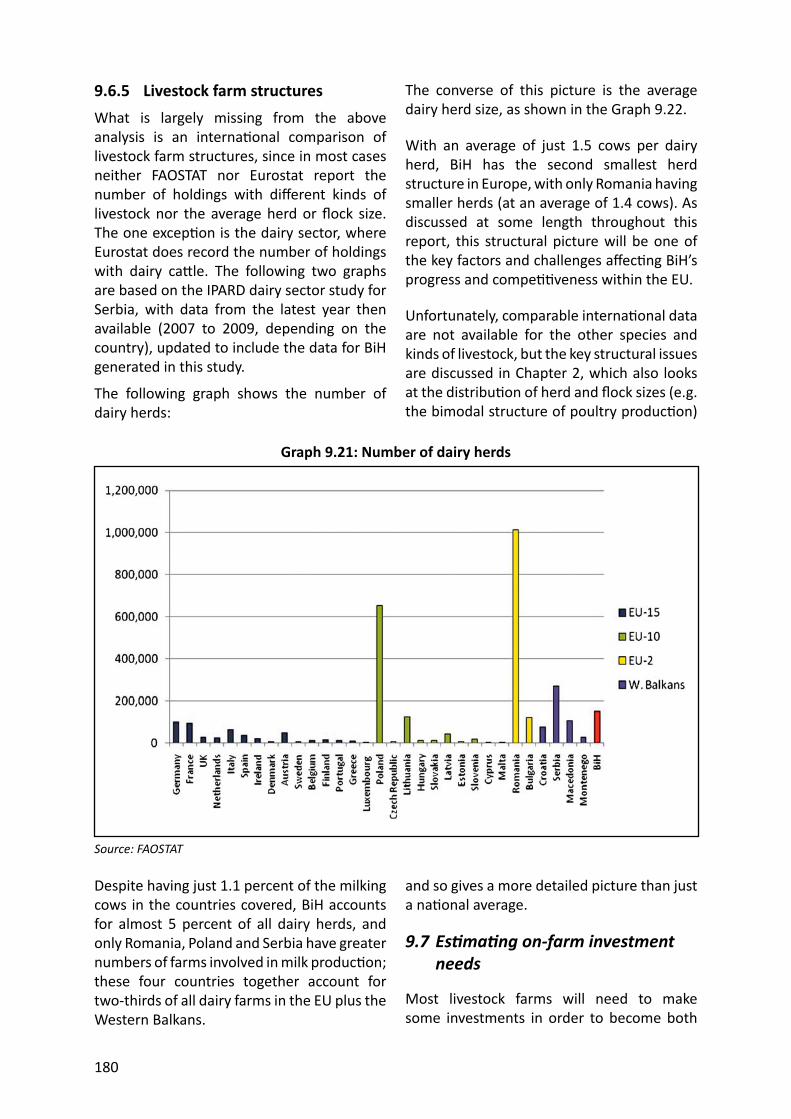
180
9.6.5 Livestock farm structuresWhat is largely missing from the above analysis is an interna onal comparison of livestock farm structures, since in most cases neither FAOSTAT nor Eurostat report the number of holdings with diff erent kinds of livestock nor the average herd or fl ock size. The one excep on is the dairy sector, where Eurostat does record the number of holdings with dairy ca le. The following two graphs are based on the IPARD dairy sector study for Serbia, with data from the latest year then available (2007 to 2009, depending on the country), updated to include the data for BiH generated in this study.
The following graph shows the number of dairy herds:
Graph 9.21: Number of dairy herds
Source: FAOSTAT
Despite having just 1.1 percent of the milking cows in the countries covered, BiH accounts for almost 5 percent of all dairy herds, and only Romania, Poland and Serbia have greater numbers of farms involved in milk produc on; these four countries together account for two-thirds of all dairy farms in the EU plus the Western Balkans.
The converse of this picture is the average dairy herd size, as shown in the Graph 9.22.
With an average of just 1.5 cows per dairy herd, BiH has the second smallest herd structure in Europe, with only Romania having smaller herds (at an average of 1.4 cows). As discussed at some length throughout this report, this structural picture will be one of the key factors and challenges aff ec ng BiH’s progress and compe veness within the EU.
Unfortunately, comparable interna onal data are not available for the other species and kinds of livestock, but the key structural issues are discussed in Chapter 2, which also looks at the distribu on of herd and fl ock sizes (e.g. the bimodal structure of poultry produc on)
and so gives a more detailed picture than just a na onal average.
9.7 Es ma ng on-farm investment needs
Most livestock farms will need to make some investments in order to become both
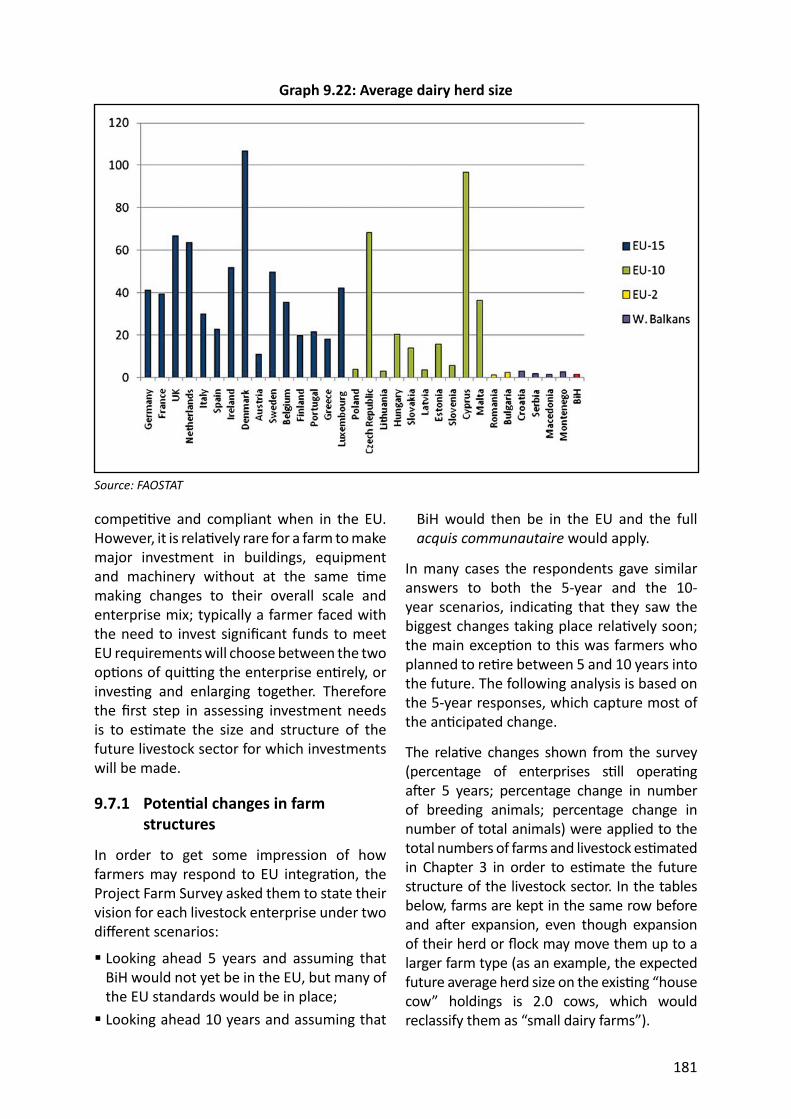
181
compe ve and compliant when in the EU. However, it is rela vely rare for a farm to make major investment in buildings, equipment and machinery without at the same me making changes to their overall scale and enterprise mix; typically a farmer faced with the need to invest signifi cant funds to meet EU requirements will choose between the two op ons of qui ng the enterprise en rely, or inves ng and enlarging together. Therefore the fi rst step in assessing investment needs is to es mate the size and structure of the future livestock sector for which investments will be made.
9.7.1 Poten al chang es in farm structures
In order to get some impression of how farmers may respond to EU integra on, the Project Farm Survey asked them to state their vision for each livestock enterprise under two diff erent scenarios:
Looking ahead 5 years and assuming that BiH would not yet be in the EU, but many of the EU standards would be in place; Looking ahead 10 years and assuming that
Graph 9.22: Average dairy herd size
Source: FAOSTAT
BiH would then be in the EU and the full acquis communautaire would apply.
In many cases the respondents gave similar answers to both the 5-year and the 10-year scenarios, indica ng that they saw the biggest changes taking place rela vely soon; the main excep on to this was farmers who planned to re re between 5 and 10 years into the future. The following analysis is based on the 5-year responses, which capture most of the an cipated change.
The rela ve changes shown from the survey (percentage of enterprises s ll opera ng a er 5 years; percentage change in number of breeding animals; percentage change in number of total animals) were applied to the total numbers of farms and livestock es mated in Chapter 3 in order to es mate the future structure of the livestock sector. In the tables below, farms are kept in the same row before and a er expansion, even though expansion of their herd or fl ock may move them up to a larger farm type (as an example, the expected future average herd size on the exis ng “house cow” holdings is 2.0 cows, which would reclassify them as “small dairy farms”).
182
Limita ons of the methodology
The farmers’ responses to this survey ques on should be treated with some cau on, for several reasons:1. At present, rela vely few BiH farmers
have an accurate understanding of what EU accession will mean for them. One par cular phenomenon that was seen following the last enlargements was that rural households found they could buy pig and poultry meat in the shops more cheaply than they could produce it themselves, so there was a drama c drop in backyard produc on of these two meats; whilst some respondents seem to have had a good idea of what was in store for them here, many did not and seem to have been unrealis c about their chances of survival within the EU’s Single Market.
2. Farmers, like other businessmen, o en overes mate how fast their businesses will develop in the future. The predicted growth in livestock numbers shown below is dis nctly more rapid than recent trends, and it might be more realis c to interpret these 5-year inten ons as indica ng what will really take 10 years to fulfi l.
3. Predic ng the future is always a diffi cult undertaking, as nobody can say what the world economy will look like in 5 or 10 years’ me, nor whether any outbreaks of epizoo c disease or other drama c events will aff ect the livestock sector during this period.
4. The rela vely small size of the Project Farm Survey is a signifi cant weakness for this par cular ques on, where the variability of answers is high.55
With these issues in mind, the following analysis is perhaps best treated as indica ng farmers’ current inten ons, rather than a direct predic on of future farm structures.
Inten ons of ca le farmers
The number of farms with ca le is es mated to fall by 32 percent, to 110,000. Somewhat surprisingly, the largest drop was predicted for the largest category, the corporate dairy farms, where half of all respondents said that they would cease opera ons in the next fi ve years. This may refl ect the current diffi cul es being faced by farmers who borrowed heavily to expand their herds during the milk price peak of 2007–8 and are now struggling to service their loans. The next biggest change is predicted at the other end of the scale, with the number of “house cows” dropping by 40 percent and the number of small beef fa ening units falling by a third. The category that the consultants consider to be most at risk, the “small dairy farms” that need a lot of investment yet lack economies of scale, only foresaw an 11 percent drop in numbers; the reality may be a much more drama c fall.
Most of the farms that expect to con nue in business foresee expansion, which would result in an enlargement of the total herd and of the average herd size: The number of breeding cows would increase by 30 percent to 289,000, bringing the average per farm up to 2.6 cows in place of the current 1.4; The number of total ca le would increase by 42 percent to 540,000, doubling the average herd size from 2.4 to 4.9 head.
The overall trend – for a drop in herd numbers and an increase in average herd size – is both plausible and in many ways desirable, though it is ques onable whether animal numbers will increase quite as fast as the farmers hope.
Detailed es mates for each ca le farm type are presented in the following table:
55 The Project Farm Survey is believed to give quite good indica ons of low-variance numbers, such as output per animal (where the highest values are only 2–3 mes the lowest values) or share of output marked through diff erent channels (where the total always sums to 100 percent). However, with one farmer with 50 chickens saying that he will reduce to zero and another saying that he will increase to 5,000, the sampling error becomes much more signifi cant, since the inclusion or exclusion of just one farmer can have a signifi cant impact on the overall result. In order to counter this, a few of the most extreme responses were excluded en rely from the analysis.
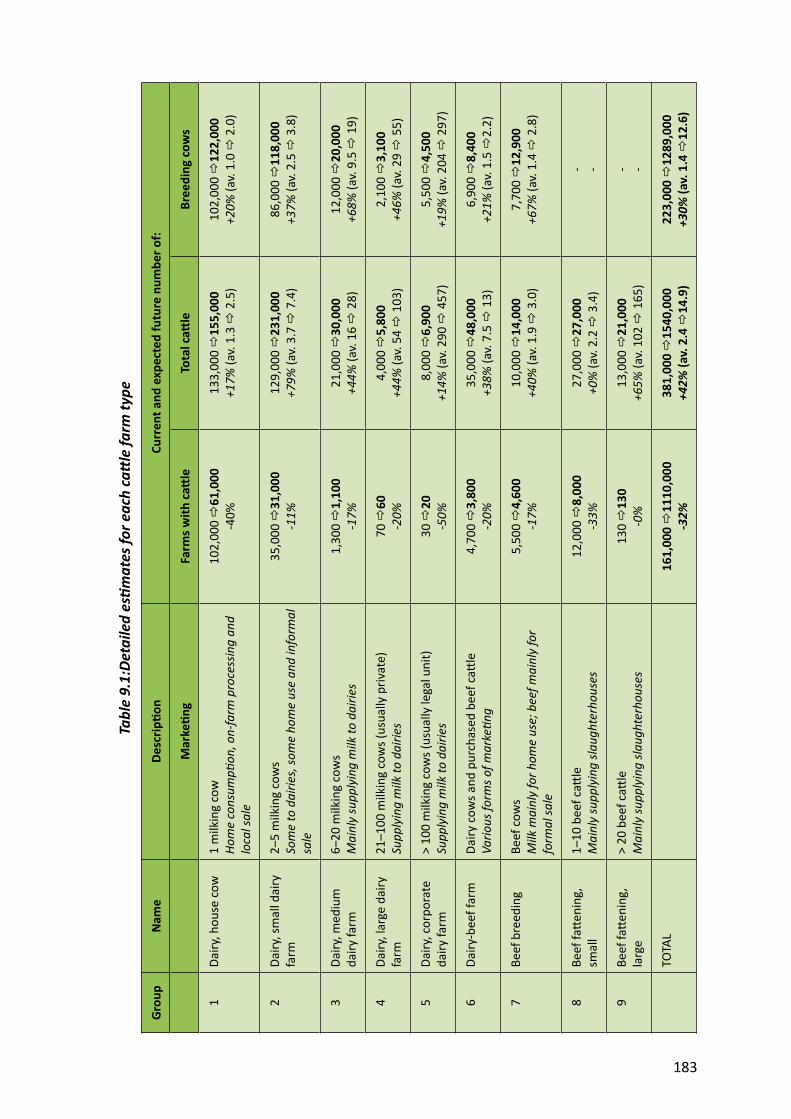
183
Tabl
e 9.
1:De
taile
d es
mat
es fo
r eac
h ca
le fa
rm ty
pe
Grou
pN
ame
Desc
rip o
nCu
rren
t and
exp
ecte
d fu
ture
num
ber o
f:
Mar
ke n
gFa
rms w
ith ca
leTo
tal c
a le
Bree
ding
cow
s
1Da
iry, h
ouse
cow
1 m
ilkin
g co
wHo
me
cons
ump
on,
on-
farm
pro
cess
ing
and
loca
l sal
e
102,
000
61,0
00-4
0%13
3,00
0
155,
000
+17%
(av.
1.3
2.5
)10
2,00
0
122,
000
+20%
(av.
1.0
2.0
)
2Da
iry, s
mal
l dai
ry
farm
2–5
milk
ing
cow
sSo
me
to d
airie
s, so
me
hom
e us
e an
d in
form
al
sale
35,0
00
31,0
00-1
1%12
9,00
0
231,
000
+79%
(av.
3.7
7.4
)86
,000
11
8,00
0+3
7% (a
v. 2.
5
3.8
)
3Da
iry, m
ediu
m
dairy
farm
6–20
milk
ing
cow
sM
ainl
y su
pply
ing
milk
to d
airie
s1,
300
1,10
0-1
7%21
,000
30
,000
+44%
(av.
16
28)
12,0
00
20,0
00+6
8% (a
v. 9.
5
19)
4Da
iry, l
arge
dai
ry
farm
21–1
00 m
ilkin
g co
ws (
usua
lly p
rivat
e)Su
pply
ing
milk
to d
airie
s70
60
-20%
4,00
0
5,80
0+4
4% (a
v. 54
1
03)
2,10
0
3,10
0+4
6% (a
v. 29
5
5)
5Da
iry, c
orpo
rate
da
iry fa
rm>
100
milk
ing
cow
s (us
ually
lega
l uni
t)Su
pply
ing
milk
to d
airie
s30
20
-50%
8,00
0
6,90
0+1
4% (a
v. 29
0
457
)5,
500
4,50
0+1
9% (a
v. 20
4
297
)
6Da
iry-b
eef f
arm
Dairy
cow
s and
pur
chas
ed b
eef c
a le
Vario
us fo
rms o
f mar
ke n
g4,
700
3,80
0-2
0%35
,000
48
,000
+38%
(av.
7.5
13)
6,
900
8,40
0+2
1% (a
v. 1.
5
2.2)
7Be
ef b
reed
ing
Beef
cow
sM
ilk m
ainl
y fo
r hom
e us
e; b
eef m
ainl
y fo
r fo
rmal
sale
5,50
0
4,60
0-1
7%10
,000
14
,000
+40%
(av.
1.9
3.0
)7,
700
12,9
00+6
7% (a
v. 1.
4
2.8
)
8Be
ef fa
eni
ng,
smal
l1–
10 b
eef c
a le
Mai
nly
supp
lyin
g sla
ught
erho
uses
12,0
00
8,00
0-3
3%27
,000
27
,000
+0%
(av.
2.2
3.4
)- -
9Be
ef fa
eni
ng,
larg
e>
20 b
eef c
a le
Mai
nly
supp
lyin
g sla
ught
erho
uses
130
130
-0%
13,0
00
21,0
00+6
5% (a
v. 10
2
165
)- -
TOTA
L16
1,00
0
1110
,000
-32%
381,
000
1540
,000
+42%
(av.
2.4
14
.9)
223,
000
1289
,000
+30%
(av.
1.4
12
.6)
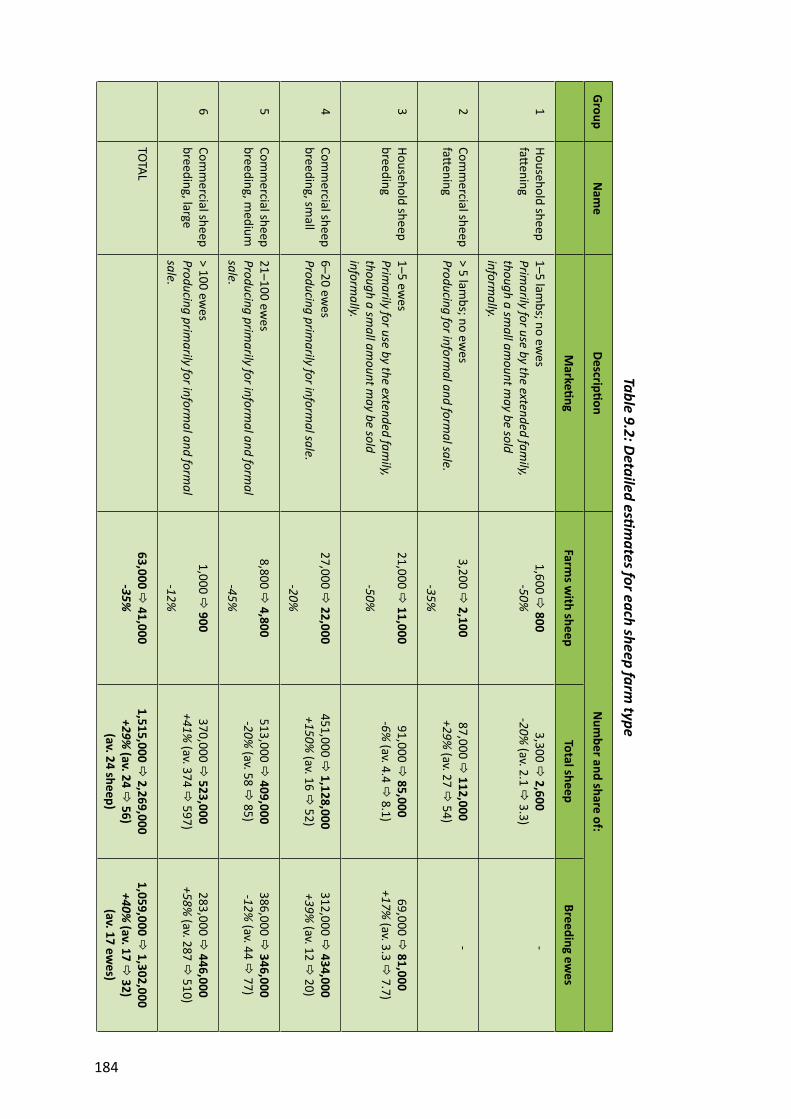
184
Table 9.2: Detailed es m
ates for each sheep farm type
GroupN
ame
Descrip on
Num
ber and share of:
Marke
ngFarm
s with sheep
Total sheepBreeding ew
es
1Household sheep fa
ening1–5 lam
bs; no ewes
Primarily for use by the extended fam
ily, though a sm
all amount m
ay be sold inform
ally.
1,600 800
-50%3,300
2,600-20%
(av. 2.1 3.3)
-
2Com
mercial sheep
fa ening
> 5 lambs; no ew
esProducing for inform
al and formal sale.
3,200 2,100
-35%
87,000 112,000
+29% (av. 27
54) -
3Household sheep breeding
1–5 ewes
Primarily for use by the extended fam
ily, though a sm
all amount m
ay be sold inform
ally.
21,000 11,000
-50%
91,000 85,000
-6% (av. 4.4
8.1)69,000
81,000+17%
(av. 3.3 7.7)
4Com
mercial sheep
breeding, small
6–20 ewes
Producing primarily for inform
al sale.27,000
22,000
-20%
451,000 1,128,000
+150% (av. 16
52)312,000
434,000+39%
(av. 12 20)
5Com
mercial sheep
breeding, medium
21–100 ewes
Producing primarily for inform
al and formal
sale.
8,800 4,800
-45%
513,000 409,000
-20% (av. 58
85)386,000
346,000-12%
(av. 44 77)
6Com
mercial sheep
breeding, large> 100 ew
esProducing prim
arily for informal and form
al sale.
1,000 900
-12%
370,000 523,000
+41% (av. 374
597)283,000
446,000+58%
(av. 287 510)
TOTAL63,000
41,000-35%
1,515,000 2,269,000
+29% (av. 24
56)(av. 24 sheep)
1,059,000 1,302,000
+40% (av. 17
32)(av. 17 ew
es)
185
Inten ons of sheep farmers
The number of sheep farms is predicted to drop by 37 percent, to 40,000. The biggest fall (50 percent) is foreseen for the smallest category, “household sheep breeding”, followed by a 45 percent drop in the number of medium-sized commercial sheep farms. As with ca le, con nuing farmers expect to expand with the following results: The number of breeding ewes would increase by 23 percent to 1.3 million, taking the average breeding fl ock up from 17 to 33 ewes;
The number of total sheep would increase by 49 percent to two and a quarter million, more than doubling the average fl ock size from 24 to 57.
These predicted trends seem quite reasonable even if, as with ca le, the farmers are somewhat over-op mis c about their future rate of growth.
Detailed es mates for each sheep farm type are presented in the Table 9.2.
Inten ons of pig farmers
The number of pig farms is predicted to drop markedly, down by 61 percent to 49,000. The biggest fall is foreseen in “backyard pig fa ening”, with 71 percent of current producers indica ng that they do not expect to be fa ening pigs in 5 years’ me; this would be en rely in line with the changes seen in other acceding countries.56 Rather surprisingly, all of the surveyed farmers currently involved in “backyard pig breeding” expected to remain in business; given the size of the predicted drop in their customer
base – the backyard pig fa eners to whom they sell their weaned piglets – it seems inevitable that this segment will also contract markedly. This par cular part of the sample was extremely small – just three producers – so it has instead been assumed that this sector will contract in line with the number of backyard pig fa eners.
Commercial pig fa eners (farms who buy piglets from specialist breeders) saw their future as bleak, with a predicted 55 percent drop in farm numbers. Those farms which most expected to con nue were the commercial integrated breeder-fa eners and specialist breeding farms including those producing piglets for slaughter.
Along with a large drop in farm numbers, the pig sector also envisaged substan al growth by its con nuing farms: The number of breeding sows would increase by 28 percent to 105,000, taking the average breeding herd up from 0.7 to a s ll very small 2.1;
The number of total pigs would increase by 81 percent to 1.1 million, taking the average herd up from 4.6 pigs to 22.
Pig farmers seem to be aware that the future will bring them big changes, and this sector will probably see more drama c restructuring than any other kind of livestock. But if anything they are s ll underes ma ng the impact of EU accession, and the consultants would expect to see a very drama c decline in backyard and small commercial pig produc on over the next 5–10 years.
Detailed es mates for each pig farm type are presented in the Table 9.3.
56 Two “backyard pig fa ening” farms were excluded from the analysis, as they envisaged a 10–30 fold increase in produc on equivalent to star ng a new commercial pig enterprise.
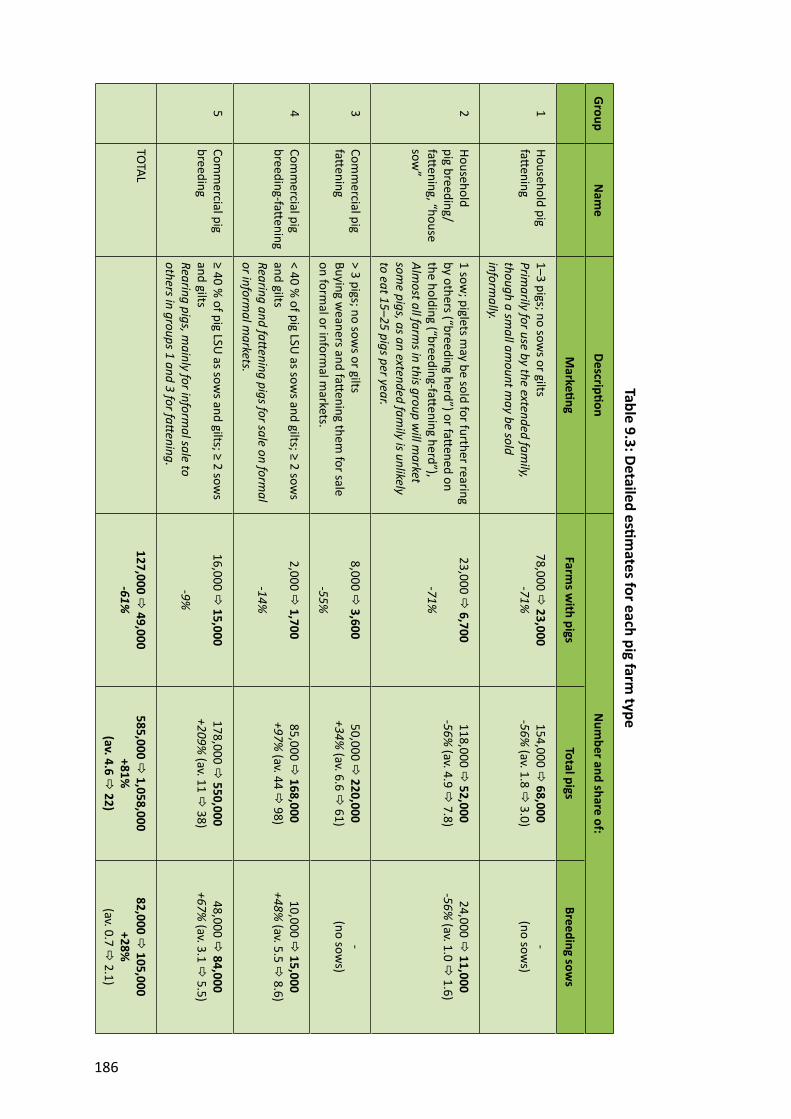
186
Table 9.3: Detailed es m
ates for each pig farm type
GroupN
ame
Descrip on
Num
ber and share of:
Marke
ngFarm
s with pigs
Total pigsBreeding sow
s
1Household pig fa
ening1–3 pigs; no sow
s or giltsPrim
arily for use by the extended family,
though a small am
ount may be sold
informally.
78,000 23,000
-71%154,000
68,000-56%
(av. 1.8 3.0)
-(no sow
s)
2Household pig breeding/fa
ening, “house sow
”
1 sow; piglets m
ay be sold for further rearing by others (“breeding herd”) or fa
ened on the holding (“breeding-fa
ening herd”),Alm
ost all farms in this group w
ill market
some pigs, as an extended fam
ily is unlikely to eat 15–25 pigs per year.
23,000 6,700
-71%
118,000 52,000
-56% (av. 4.9
7.8)24,000
11,000-56%
(av. 1.0 1.6)
3Com
mercial pig
fa ening
> 3 pigs; no sows or gilts
Buying weaners and fa
ening them for sale
on formal or inform
al markets.
8,000 3,600
-55%
50,000 220,000
+34% (av. 6.6
61)-
(no sows)
4Com
mercial pig
breeding-fa ening
< 40 % of pig LSU
as sows and gilts; ≥ 2 sow
s and giltsRearing and fa
ening pigs for sale on formal
or informal m
arkets.
2,000 1,700
-14%
85,000 168,000
+97% (av. 44
98)10,000
15,000+48%
(av. 5.5 8.6)
5Com
mercial pig
breeding≥ 40 %
of pig LSU as sow
s and gilts; ≥ 2 sows
and giltsRearing pigs, m
ainly for informal sale to
others in groups 1 and 3 for fa ening.
16,000 15,000
-9%
178,000 550,000
+209% (av. 11
38)48,000
84,000+67%
(av. 3.1 5.5)
TOTAL127,000
49,000-61%
585,000 1,058,000
+81%(av. 4.6
22)
82,000 105,000
+28%(av. 0.7
2.1)
187
Inten ons of poultry farmers
Here, laying hens and broilers are treated as two separate enterprises. Three surveyed farms that predicted very drama c expansion, almost equivalent to star ng an en rely new enterprise, have been excluded from the analysis.
The number of farms keeping laying hens is expected to drop by 65 percent to 65,000. The biggest drop is envisaged for “backyard laying hens”, down by almost 70 percent, followed by a 40 percent drop in “small commercial” producers. All of the surveyed “large commercial” farms, i.e. those with more than 500 laying hens, are expected to remain in business, and so will have to make the necessary investments to install “enriched cages” or other systems compliant with new EU rules on animal welfare. The con nuing farms predicted a modest expansion of 16 percent, up to 5.6 million hens.
The broiler sector was quite op mis c about its future, predic ng just a 20 percent drop, down to 23,000 farms. Most of this was represented by a 20 percent fall in the rela vely numerous “small commercial broiler” farms (those with up to 1,000 birds per cycle), whilst only 12 percent of the current “large commercial broiler” farms envisaged that they would cease produc on.
The con nuing broiler producers expected signifi cant growth, with an overall increase of 52 percent up to 10.1 million broilers per cycle. The larger producers were looking at increasing from an average of 20,000 birds up to 30,000 birds per farm, whilst the small commercial producers were looking at expanding from an average of 20 up to 90 birds.
Most elements of this scenario are quite plausible, par cularly the marked drop in backyard egg produc on and the con nuing expansion of the successful large broiler farms. Rather less plausible is the idea that some 23,000 farms will con nue to produce commercially with just a few tens or hundreds of broiler hens. With the con nuing expansion
of the large commercial sector plus the ready availability of cheap EU-sourced poultry meat, it seems more likely that this part of the industry will contract quite markedly.
Detailed es mates for each poultry farm type are presented in the Table 9.4.
Conclusions on farmers’ expressed inten ons
With the couple of excep ons noted above, the picture given by survey respondents seems generally quite plausible in terms of changes to the number of farms and to herd and fl ock sizes, as well as in the structural shi s from smaller to larger farm types.
The predicted rates of growth are markedly higher than those seen in recent years for all species except for poultry, where growth has indeed been drama c. It is true that EU measures tend to benefi t larger farms, both through the pre-accession IPARD measures whose procedures eff ec vely exclude small farms, and through the post-accession Single Farm Payment where support is directly propor onal to farm size. There is therefore some reason to assume that growth may occur, though the actual success of farmers in achieving their vision will be heavily dependent on the availability of investment funds – the extent of which are examined in the following sec on.
9.7.2 Investment costs
Investment needs vary quite considerably from farm to farm, depending on their unique individual circumstances. The very small farms that predominate in BiH are likely to use own labour, adapt exis ng buildings and buy second-hand machinery, resul ng in investment costs that are quite diff erent from those of a new building. Hence the fi gures generated in this sec on are only a very rough es mate to indicate the order of magnitude of the funds required, and a number of assump ons had to be made: Cost es mates are for buildings, equipment and machinery, but exclude livestock purchases;
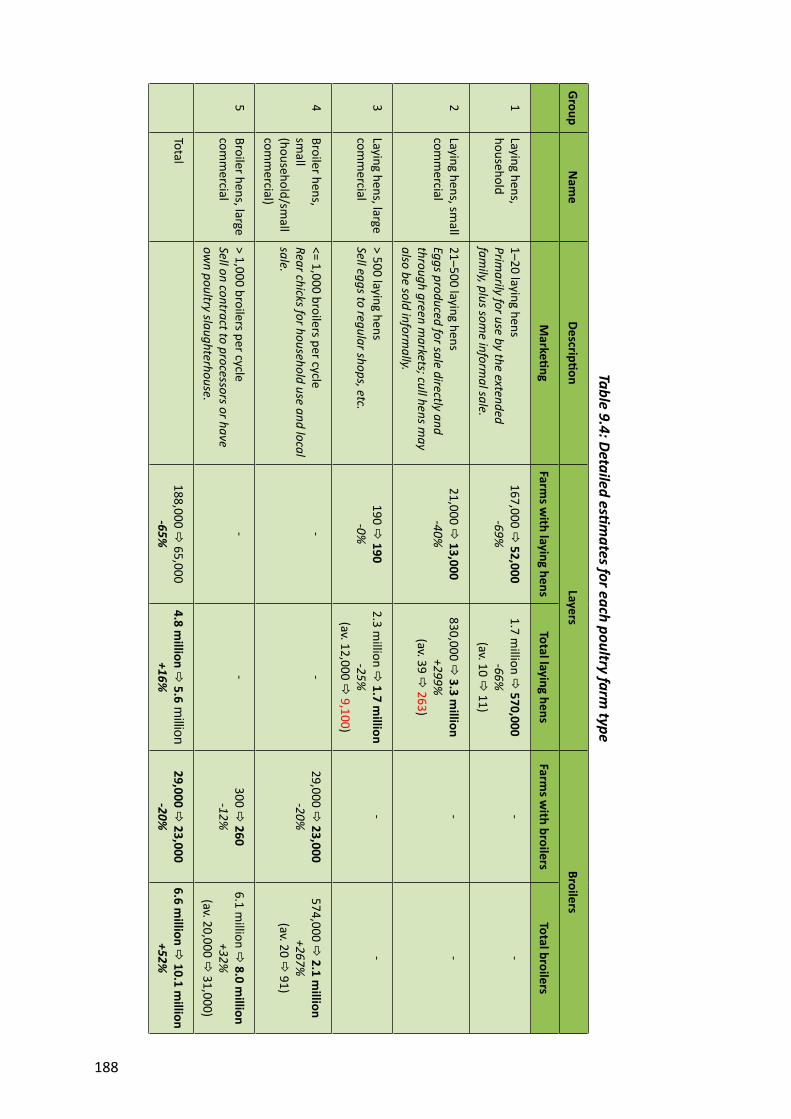
188
Table 9.4: Detailed es m
ates for each poultry farm type
GroupN
ame
Descrip on
LayersBroilers
Marke
ngFarm
s with laying hens
Total laying hensFarm
s with broilers
Total broilers
1Laying hens, household
1–20 laying hensPrim
arily for use by the extended fam
ily, plus some inform
al sale.
167,000 52,000
-69%1.7 m
illion 570,000
-66%(av. 10
11)
--
2Laying hens, sm
all com
mercial
21–500 laying hensEggs produced for sale directly and through green m
arkets; cull hens may
also be sold informally.
21,000 13,000
-40%830,000
3.3 million
+299%(av. 39
263)
--
3Laying hens, large com
mercial
> 500 laying hensSell eggs to regular shops, etc.
190 190
-0%2.3 m
illion 1.7 m
illion-25%
(av. 12,000 9,100)
--
4Broiler hens, sm
all(household/sm
all com
mercial)
<= 1,000 broilers per cycleRear chicks for household use and local sale.
--
29,000 23,000
-20%574,000
2.1 million
+267%(av. 20
91)
5Broiler hens, large com
mercial
> 1,000 broilers per cycleSell on contract to processors or have ow
n poultry slaughterhouse.
--
300 260
-12%6.1 m
illion 8.0 m
illion+32%
(av. 20,000 31,000)
Total188,000
65,000-65%
4.8 million
5.6 million
+16%29,000
23,000-20%
6.6 million
10.1 million
+52%
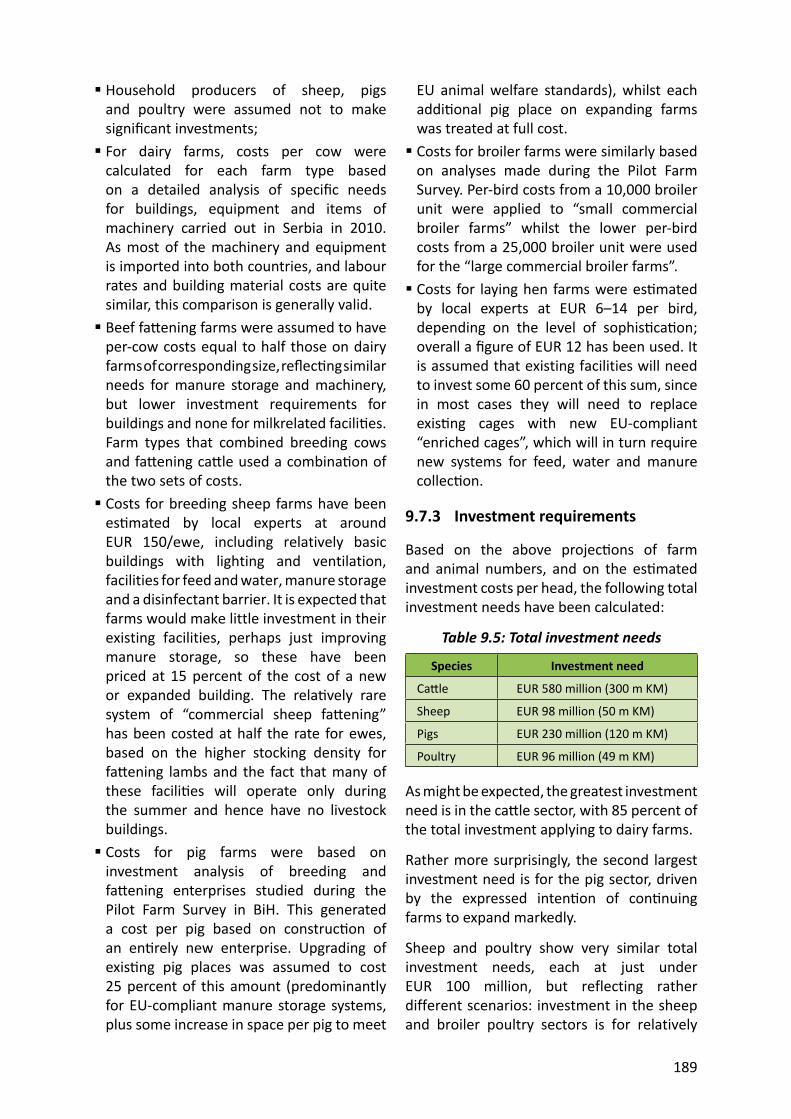
189
Household producers of sheep, pigs and poultry were assumed not to make signifi cant investments; For dairy farms, costs per cow were calculated for each farm type based on a detailed analysis of specifi c needs for buildings, equipment and items of machinery carried out in Serbia in 2010. As most of the machinery and equipment is imported into both countries, and labour rates and building material costs are quite similar, this comparison is generally valid. Beef fa ening farms were assumed to have per-cow costs equal to half those on dairy farms of corresponding size, refl ec ng similar needs for manure storage and machinery, but lower investment requirements for buildings and none for milkrelated facili es. Farm types that combined breeding cows and fa ening ca le used a combina on of the two sets of costs. Costs for breeding sheep farms have been es mated by local experts at around EUR 150/ewe, including relatively basic buildings with lighting and ventilation, facilities for feed and water, manure storage and a disinfectant barrier. It is expected that farms would make little investment in their existing facilities, perhaps just improving manure storage, so these have been priced at 15 percent of the cost of a new or expanded building. The rela vely rare system of “commercial sheep fa ening” has been costed at half the rate for ewes, based on the higher stocking density for fa ening lambs and the fact that many of these facili es will operate only during the summer and hence have no livestock buildings. Costs for pig farms were based on investment analysis of breeding and fa ening enterprises studied during the Pilot Farm Survey in BiH. This generated a cost per pig based on construc on of an en rely new enterprise. Upgrading of exis ng pig places was assumed to cost 25 percent of this amount (predominantly for EU-compliant manure storage systems, plus some increase in space per pig to meet
EU animal welfare standards), whilst each addi onal pig place on expanding farms was treated at full cost. Costs for broiler farms were similarly based on analyses made during the Pilot Farm Survey. Per-bird costs from a 10,000 broiler unit were applied to “small commercial broiler farms” whilst the lower per-bird costs from a 25,000 broiler unit were used for the “large commercial broiler farms”. Costs for laying hen farms were es mated by local experts at EUR 6–14 per bird, depending on the level of sophis ca on; overall a fi gure of EUR 12 has been used. It is assumed that existing facilities will need to invest some 60 percent of this sum, since in most cases they will need to replace exis ng cages with new EU-compliant “enriched cages”, which will in turn require new systems for feed, water and manure collec on.
9.7.3 Investment requirements
Based on the above projec ons of farm and animal numbers, and on the es mated investment costs per head, the following total investment needs have been calculated:
Table 9.5: Total investment needs
Species Investment need
Ca le EUR 580 million (300 m KM)
Sheep EUR 98 million (50 m KM)
Pigs EUR 230 million (120 m KM)
Poultry EUR 96 million (49 m KM)
As might be expected, the greatest investment need is in the ca le sector, with 85 percent of the total investment applying to dairy farms.
Rather more surprisingly, the second largest investment need is for the pig sector, driven by the expressed inten on of con nuing farms to expand markedly.
Sheep and poultry show very similar total investment needs, each at just under EUR 100 million, but reflecting rather different scenarios: investment in the sheep and broiler poultry sectors is for relatively
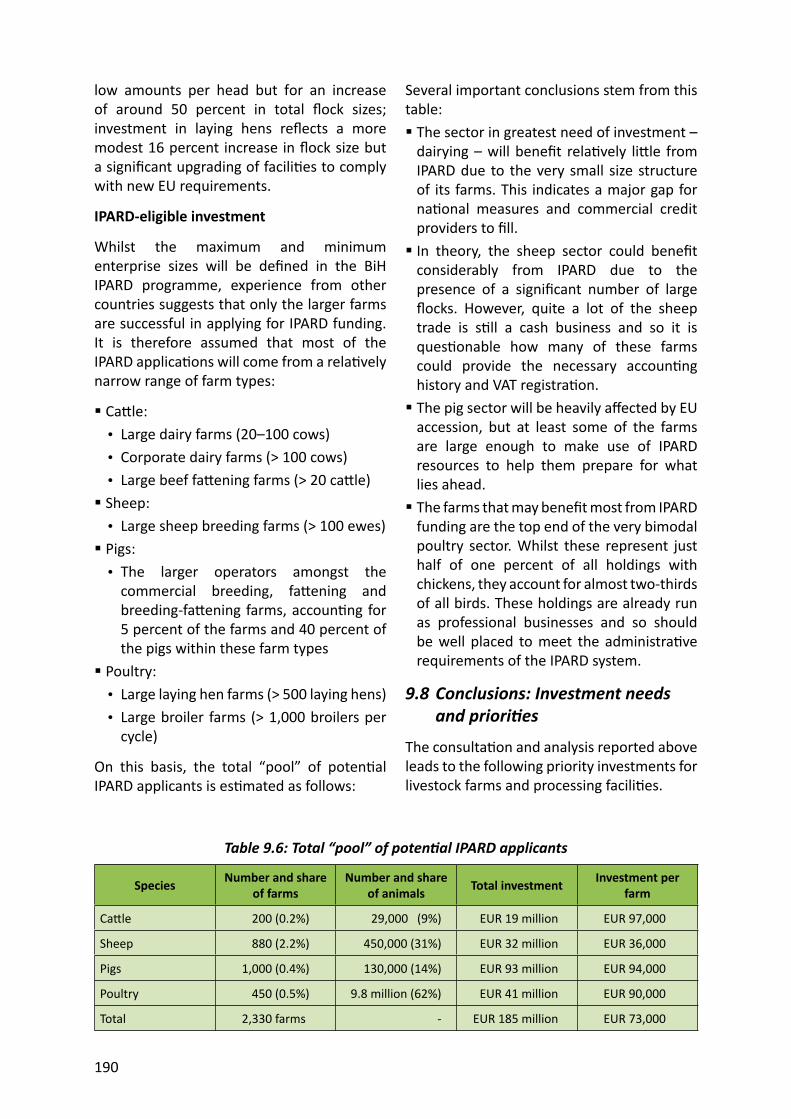
190
low amounts per head but for an increase of around 50 percent in total fl ock sizes; investment in laying hens refl ects a more modest 16 percent increase in fl ock size but a signifi cant upgrading of facili es to comply with new EU requirements.
IPARD-eligible investment
Whilst the maximum and minimum enterprise sizes will be defi ned in the BiH IPARD programme, experience from other countries suggests that only the larger farms are successful in applying for IPARD funding. It is therefore assumed that most of the IPARD applica ons will come from a rela vely narrow range of farm types:
Ca le:• Large dairy farms (20–100 cows)• Corporate dairy farms (> 100 cows)• Large beef fa ening farms (> 20 ca le) Sheep:• Large sheep breeding farms (> 100 ewes) Pigs:• The larger operators amongst the
commercial breeding, fa ening and breeding-fa ening farms, accoun ng for 5 percent of the farms and 40 percent of the pigs within these farm types
Poultry:• Large laying hen farms (> 500 laying hens)• Large broiler farms (> 1,000 broilers per
cycle)
On this basis, the total “pool” of poten al IPARD applicants is es mated as follows:
Several important conclusions stem from this table: The sector in greatest need of investment – dairying – will benefi t rela vely li le from IPARD due to the very small size structure of its farms. This indicates a major gap for na onal measures and commercial credit providers to fi ll. In theory, the sheep sector could benefi t considerably from IPARD due to the presence of a signifi cant number of large fl ocks. However, quite a lot of the sheep trade is s ll a cash business and so it is ques onable how many of these farms could provide the necessary accoun ng history and VAT registra on. The pig sector will be heavily aff ected by EU accession, but at least some of the farms are large enough to make use of IPARD resources to help them prepare for what lies ahead. The farms that may benefi t most from IPARD funding are the top end of the very bimodal poultry sector. Whilst these represent just half of one percent of all holdings with chickens, they account for almost two-thirds of all birds. These holdings are already run as professional businesses and so should be well placed to meet the administra ve requirements of the IPARD system.
9.8 Conclusions: Investment needs and priori es
The consulta on and analysis reported above leads to the following priority investments for livestock farms and processing facili es.
Table 9.6: Total “pool” of poten al IPARD applicants
Species Number and share of farms
Number and share of animals Total investment Investment per
farm
Ca le 200 (0.2%) 29,000 (9%) EUR 19 million EUR 97,000
Sheep 880 (2.2%) 450,000 (31%) EUR 32 million EUR 36,000
Pigs 1,000 (0.4%) 130,000 (14%) EUR 93 million EUR 94,000
Poultry 450 (0.5%) 9.8 million (62%) EUR 41 million EUR 90,000
Total 2,330 farms - EUR 185 million EUR 73,000
191
9.8.1 Priority investments on farms
Ca le
Enlargement of small dairy farms to reach a minimum size that can jus fy the investments necessary to meet EU milk hygiene standards (essen ally requiring na onal ac on since these farms are too small to par cipate eff ec vely in IPARD). In the short term, a valid minimum might be 6 cows (i.e. the bo om end of the “medium dairy farm” range), since even this small number will help to spread the costs of a proper milking machine, cooling tank and basic building improvements. However, no young person would be advised to enter dairying if they were likely to be limited to such a small herd; they would do be er to set their sights on becoming a “large dairy farm” of 20–100 cows; Upgrading of large, medium and formerly small family dairy farms to meet EU standards and improve effi ciency. This will include:• Upgrading ca le buildings to improve
hygiene, animal welfare and ease of opera on;
• Upgrading or replacing milking and milk cooling equipment in order to improve hygiene;
• Adap ng buildings to provide a separate hygienic space for milk handling and storage;
• Improving or construc ng manure storage facili es and providing equipment for transport and spreading of slurry and solid manure;
• Improving silage clamps (where used) to avoid pollu on by effl uent;
• Renewing and upgrading machinery for producing, conserving and handling forage.
Suppor ng con nued expansion of medium-sized dairy farms, including livestock, machinery, buildings and land (not all of which are eligible for IPARD support). Upgrading of facili es for manure storage, handling and disposal on the largest (usually corporate) dairy farms.
Similar upgrading of large beef fa ening farms in rela on to manure, silage and forage machinery.
Sheep
Increasing effi ciency and produc vity of larger sheep farms through:• Construc on or re-construc on of
buildings on larger sheep farms to allow over-wintering and earlier lambing;
• Renewing and upgrading machinery for producing, conserving and handling forage.
Pigs
Upgrading of buildings on larger pig farms to improve effi ciency and meet EU standards, including:• Adapta on of pens for sows and piglets
in order to meet EU animal welfare standards;
• Expansion of fa ening units where necessary to meet minimum EU space requirements per pig;
• Installa on or upgrading of automated equipment for feeding and ven la on;
• Improving manure storage facili es. Providing equipment for transport and spreading of manure.
Poultry
Upgrading of buildings on larger commercial layer farms in order to meet EU standards, par cularly for animal welfare. This will include replacement of tradi onal ba ery cages with EU-compliant “enriched cages”; Upgrading of larger broiler units to comply with lower EU stocking density limits and other animal welfare requirements; Expansion of (layer and broiler) buildings to allow all at least the exis ng capacity at the new lower stocking densi es; Upgrading of automated equipment for feeding, watering, ven la on and climate control; Improving facili es for storage of poultry manure and provision of machinery for manure transport and spreading.
192
All species
Upgrading the general machinery pool, in par cular through the provision of more modern tractors.
9.8.2 Priority investments in processing
Effl uent and waste-water treatment, at least as a pre-treatment process prior to discharge into municipal facili es; Disposal of solid waste from meat processing, via one or more rendering plants; Upgrading or building new slaughterhouses; Upgrading of technology where appropriate, including packaging equipment.
Visits to meat and dairy processors indicated that most businesses are able to fund their own investments in processing and packaging. This will be accomplished gradually as processors respond to new market opportuni es and the progressive harmoniza on of regula ons during the pre-accession process.
Processors do require investment in the collec on, treatment and disposal of factory effl uent. There also needs to be improvement in waste management, especially concerning meat and aba oirs. Such improvements will help environmental protec on and will bring some cost savings, but processors will see less immediate benefi ts than from investment in new processing or packaging equipment, and so there may be a greater role for IPARD and other forms of preferen al funding.
193
10. Iden fi ca on of training needs in the sector
This chapter looks at the needs for training, advice and underpinning knowledge services for the livestock sector. Sec on 10.1 briefl y reviews the exis ng systems of informa on, training and advice, as the primary systems through which future training will be delivered. Sec on 10.2 discusses the need for training at all levels in understanding EU regula ons and systems in agriculture. Sec on 10.3 iden fi es the most pressing training needs for farmers. Sec on 10.4 discusses the training needs of meat and dairy processors. Sec on 10.5 considers the training that inspectors will need if they are to play their part in developing a compe ve and EU-ready livestock sector. Sec on 10.6 presents overall conclusions on the needs for training and advice.
10.1 Current sources of informa on, training and advice
Agricultural extension
One of the earlier EU support projects helped to set up systems of agricultural extension in each en ty. A er comple on of the project, RS con nued with an en ty level system whilst FBiH transferred the responsibility – along with the extension staff – to the canton level. Brčko District employs three advisors (“senior expert associates” in crop produc on, fruit produc on and ca le produc on) within the Department for Agriculture, Forestry and Water Management. The general feedback from stakeholders, in individual discussion as well as in the formal SWOT workshops, is that extension is one of the weak points within the agricultural system, par cularly in FBiH.
Some recent support has been provided by the World Bank, and in 2010 both en ty governments adopted their own mid-term development strategies for extension services in agriculture. The strategy for RS envisages that by 2015 twenty new specialist consultants
and 74primaryagriculturaladvisers will be employed, with extension being delivered through both public and private extension services. The public advisory service is fi nanced from the budget, and private services from their own resources and revenue genera on, and they both need a licence for the provision of advisory services.
Such strategies are clearly a good start but considerable a en on and investment will be needed in order to develop a system capable of mee ng the needs of several hundred thousand producers, par cularly to ensure that the small farms which form the backbone of the livestock sector receive adequate and appropriate support. It will also be important to resist the danger that threatens many extension services in the region: that of being “hijacked” into an implementa on and enforcement service for IPARD and EU-like support measures, at the cost of providing the high quality and impar al advice on technical and business ma ers that is so desperately needed.
Market informa on
In BiH, an EU PHARE project established an opera onal Agricultural Market Informa on System (AMIS), in the period 1998 to 2000. The collec on, analysis and exchange of informa on was organized according to EU standards and operated through the exis ng network of agriculture extension services in RS and FBiH. Upon comple on of the EU PHARE project in December 2000 the system stopped working due to the lack of further funding and lack of understanding of the importance of this project.
In 2008, the ac vity of building an Agriculture Market Informa on System started again, this me supported by a USAID project. A working group was established, including representa ves of the en ty ministries, MOFTER and other stakeholders, to discuss general issues such as the legal basis for the establishment of the system, data collec on,
194
selec on of repor ng centres, and training of operators.
Since the Federa on does not currently have an en ty-wide agricultural extension service, it has not yet been possible to implement the market informa on system across the en re country. However, foreign donors and funding organiza ons have made it a condi on of their fi nancial support that one system should be established throughout BiH, in order to avoid the costs and ineffi ciency of having two separate systems and to support the opera on of the single economic space. Therefore development of the system has not progressed in either en ty.
The World Bank-funded Agriculture and Rural Development Project (ARDP), implemented by Agriculture Project Coordina on Units in RS and FBiH, is currently suppor ng AMIS within its overall project ac vity on development of agriculture informa on systems. A specifi c EUfunded project on AMIS is planned under IPA-2009 but has not yet started.
In the mean me, policy-makers do not have access to mely market informa on in order to help them develop and implement eff ec ve policies. Even more seriously, there is no opera onal system to help small producers nego ate more equally with larger and typically be er informed processors and traders, and thus to ensure the proper opera on of agricultural markets.
Training and educa on
Before the war, Bosnia and Herzegovina shared the Yugoslav-wide system of agricultural high schools, higher schools and facul es. The state of agricultural schools was not inves gated, but higher educa on is now carried out through facul es of agriculture in Sarajevo, Banja Luka and Mostar, all of which were key partners in the prepara on of these sectoral studies.
Projects and NGOs
Whilst BiH falls behind many of its neighbours in terms of the func oning of formal ins tu ons, it has been and con nues to be well served by
interna onal and nongovernmental projects, covering diverse aspects of agricultural, rural and general business development. Many of the best informed people in the country have made maximum use of this valuable source of informa on and training.
10.2 Generic training in EU awareness
Two consistent fi ndings throughout the study are that stakeholders at all levels – from farmers to policy-makers – are expressing the desire to be er understand the EU agricultural acquis, and that misconcep ons are at least as common as accurate understanding of EU systems. There is clear scope for an organized, impar al and ongoing campaign to make stakeholders aware of the ever-changing aquis. Two of the most pressing areas for such support will be in understanding the complex processes of expor ng to the EU and of benefi ng from future IPARD support. It is especially important that producers and processors contempla ng major investments, with or without IPARD funds, ensure that their new facili es can comply with current and likely future EU standards.
The EU itself would seem the most obvious organiza on to fund such a campaign, but it is important that stakeholders are helped to understand the costs and risks, as well as the benefi ts and opportuni es, and are given a realis c picture of what to expect and how to respond to it. Thus actual delivery would be be er carried out by an independent organiza on, even if ul mately funded by the EU.
10.3 Training of farmers
The most important thing for farmers to learn is not how to work the EU system, but how to produce and market be er, or more simply, how to become be er farmers.
The main topics on which livestock farmers need to improve their knowledge are: Feeding (all species) – In almost every livestock system, the biggest single cost is purchased feed, and the main factor limi ng
195
produc on is the intake of nutrients. Thus improvements in feeding will contribute directly to higher output and profi ts.Specifi c training topics include:• Op mum ra on formula on in response
to: » Feed availability and cost; » Gene c poten al and stage of lacta on/growth; » Market demand for e.g. carcass weight, backfat class, milk fat.
• Nutri on of replacement stock to ensure that they commence breeding at the right me and in the right condi on (especially
ca le and sheep). Forage produc on and conserva on (ca le and sheep) – Research and survey results throughout the world show the over-riding economic benefi ts of producing milk and meat from rela vely cheap forage instead of expensive concentrate. Whilst the benefi ts are well-known amongst researchers and leading farmers, eff ec ve produc on and use of forage is a surprisingly complex business, demanding a lot more of the farmer than simply buying and feeding more concentrate. Thus farmers will need to be shown and convinced of the benefi ts before they are likely to make the changes required, sugges ng that research and demonstra on ac vi es must be run in parallel with extension and training.Specifi c topics for demonstra on and training include:• Choice of forage species, variety, fer lizer
levels and cul va on prac ces;• Management of natural pastures and
meadows;• Forage conserva on techniques and
cu ng dates – including use of big-bale silage and an understanding of the determinants and eff ects of forage diges bility;
• Use of urea-treated straw as a source of non-protein nitrogen;
• Developing op mum ra ons to u lize the forage available;
• Although not strictly forage, this topic should also include the use of low-cost bulk feeds such as brewers’ grains, sugar-beet pulp and other processing byproducts.
Milking and mas s (milking cows, sheep and goats) – EU hygiene standards require comple on of the cold chain and control of mas s, which will also increase yields and longevity. This requires good milking machines, cooling tanks, hygienic buildings and be er management. Without these improvements, milk will be unmarketable once Bosnia and Herzegovina enters the EU.Specifi c training topics include:• EU, state and en ty standards for milk
quality;• Sources of bacterial contamina on, eff ect
of temperature on growth of TBC;• Causes, preven on and treatment of
mas s;• Building design and maintenance for
clean milk produc on;• Milking hygiene, including maintenance of
equipment, disinfec on, and procedures before, during and a er milking.
Fer lity and breeding (all species)• For ca le, reducing the interval between
each calving will increase average yield per lacta on and total meat output, whilst con nued and increased use of ar fi cial insemina on will be the most cost-eff ec ve means of gene c improvement for the large majority of farms. Improved nutri on and management of rearing heifers will increase feed intake and milk produc on in their fi rst few lacta ons. As farms enlarge and intensify, the choice between the tradi onal Simmental and the more produc ve but demanding Holstein-Friesian will need to be considered.
• For sheep, the ming of lambing has a big eff ect on market value, whilst breed selec on needs to take account of changing market demand.
• For serious pig and poultry producers who hope to compete with imports from
196
the EU, choice of gene c material will be one of the keys to success, though in prac ce much of the lead may be taken by commercial companies working with contracted producers.
Specifi c training topics include:• Replacement and culling policy;• Heat detec on, causes and cures of
anoestrus and infer lity;• Semen selec on;• Management and feeding of replacement
females;• Housing for young stock. Disease control (all species) – Control of zoono c and epizoo c disease is important for interna onal and EU trade, whilst be er hoof care and parasite control will increase produc vity.Specifi c training topics include:• Nutri on and health, including metabolic
disorders and the use of supplements;• Recogni on of epizoo c disease and
procedures to follow if suspected;• Parasite control;• Causes, preven on and cure of lameness
and hoof problems. Animal welfare (all species) – Awareness of EU regula ons applying to farmed animals in general and to pigs, calves and poultry in par cular.Specifi c training topics include:• Design of livestock buildings to ensure
current and future compliance with EU requirements;
• Management issues aff ec ng the welfare of each species;
• Welfare during transport and slaughter. Farm management (all) – Before addressing any of the above issues, the farmer needs to be sure that he is producing the right thing for the right market. Good understanding of income and costs is essen al for profi table produc on.Specifi c training topics include:• Choice of produc on system – specialist
dairy, beef or combined – in rela on to
the costs and returns of upgrading to produce EU-standard milk;
• Choice of market outlet – whether to supply dairies, green markets or to sell direct; understanding and working with dairy contracts;
• Gross margins and forage variable costs, as tools for planning and measuring the farm’s performance, and as benchmarks against which to compare;
• Management and organiza on of the farm, its land, labour, livestock and other resources;
• Record-keeping and accoun ng;• Prepara on of business plans and
applica ons for credits and grants, ul mately including applying for IPARD support.
If training of farmers follows the “80:20” rule, with 80 percent of the outputs coming from just 20 percent of the inputs, then the three changes that will have the most impact on farmers’ profi ts are these:1. Producing high yields of good quality
fresh and conserved forage;2. Selec ng the right types and amounts of
feed to use; and, for dairy farmers...3. Achieving EU standards for TBC and SCC.
If a training programme did no more than help farmers improve in these three areas, it would be well worthwhile.
10.4 Training of processors
Processors of milk and meat have training needs which are mainly related to the size and capacity of their businesses, which determine the variety of disciplines required. For example, the large majority of processing businesses are family-owned, usually by at least the second genera on. Their main requirements are readily met by in-house or on-the-job training, partly because academic qualifi ca ons are less important in this environment and partly because of the reduced opportunity for full- me study where the senior management
will always consist of family members.
197
However, this emphasis on prac cal skills over academic educa on may reveal itself as a weakness when processors need to prepare business plans to seek bank or IPARD funding, and so considerable support may be needed in this area.
Larger companies take on higher numbers of employees, and are usually less likely to be family businesses. Comments by some of their directors do not refl ect well on the current training role and func on of the universi es; for example, university teaching staff are infrequent visitors to processing plants of both milk and meat, and are perceived as passive partners in the agro-processing industry.
A empts have been made by processors to secure students as appren ces, to provide them with experience of industry whilst con nuing their academic studies. So far the success of this ini a ve has been negligible, and there is a growing feeling that the universi es are out of touch with technical ma ers and new developments in technology.
Another comment relates to the lack of technical knowledge related to processing within the universi es, as most teaching staff are academic rather than industrial experts.
There is a need, therefore, for a fresh approach to technical educa on and training for the food processing industries, preparing tailor-made courses to meet the needs of industry. This requires full consulta on of industry, which should be encouraged to off er prac cal and paid experience to students. A star ng point might be with “sandwich” courses, where periods of work experience are alternated with study at a selected college or faculty. Prepara on for any course will need to involve a familiariza on period for teaching staff , to harmonize the needs and aspira ons of both students and industry.
Within the milk sector, many dairies are now an important source of training to farmers, but they s ll have their own training needs, as do meat processors. A comprehensive list of training needs would include:
EU standards and procedures – Upda ng and extending processors’ knowledge on what EU integra on will mean for them.Specifi c training topics include:• EU standards for raw milk, milk processing
plants and dairy products;• EU standards for slaughterhouses and
meat processing plants;• The inspec on and approval process for
expor ng to the EU, including the role of na onal and EU authori es.
Hygienic infrastructure and opera on – The requirements for buildings, equipment and transport, in order to produce to EU standards.Specifi c training topics include:• EU-compliant building design;• Plant maintenance and control;• Sampling and control points (e.g.
slaughterhouse water, fi nished products);• Developing and implemen ng a HACCP
plan. Raw milk sampling and tes ng – Ensuring that all milk is tested in line with EU and na onal legisla on.Specifi c training topics include:• Establishment of an EU-compliant milk
laboratory, including building design, equipment requirements, and sources of specialist support;
• Laboratory opera on and quality control, including accredita on and par cipa on in na onal ring-tes ng;
• Organiza on of milk sampling, sample collec on, and calcula on of geometric averages;
• Design and implementa on of quality based payment schemes;
• Public and private sector op ons for small dairies unable to establish their own laboratories.
Business management – How to ensure that the business operates as profi tably as possible. Financing upgrading and growth.Specifi c training topics include:• Process management, use of fat balances,
waste management;
198
• Environmental considera ons, including effl uent management, treatment and disposal;
• Health and safety at work;• Good Manufacturing Prac ces, including
quality management and quality assurance;• Stock and inventory control;• General business management,
employment law and marke ng;• Sources of funding, including na onal
and interna onal support, in future poten ally including IPARD measures.
10.5 Training of inspectors
Given the fragmented nature of the veterinary inspec on services (see sec on 5.5) it can reasonably be assumed that many inspectors are not supported with regular training and upda ng of their knowledge. Inspectors should be involved in almost all of the training issues iden fi ed for processors in the previous sec on, par cularly those rela ng to EU standards and procedures, and there could be many benefi ts from bringing operators and inspectors together in some training courses. In addi on, inspectors should be provided with training and instruc on manuals on: Selec on of premises to be inspected, including risk analysis; Inspec on methodology, with checklists to be employed; Follow-up ac ons, with standard format documents such as visit report forms and improvement no ces.
This training should be linked to a wider improvement of the inspec on system and its suppor ng informa on systems.
10.6 Conclusions on training needs
The EU future to which Bosnia and Herzegovina aspires will be very different to the situation in the livestock sector today, which means change – change by farmers, change by processors, and change by all of the institutions that support, guide and regulate the sector. Extension and training can play a vital role in helping operators to prepare for this change and to make a successful transition to the more demanding and more competitive future that lies ahead.
Processors are already starting to prepare for the EU Single Market and are actively seeking out the information they need, but can be further helped by a systematic training programme as outlined in section10.4 above.
Farmers generally have much further to go, par cularly to bring their yields and technical effi ciency up to the level of their EU compe tors. It appears that government is largely failing them in this respect, with extension services woefully inadequate to meet the needs of more than 300,000 livestock producers and with no public market informa on service. These must be treated as high priori es for the whole sector.
A smaller but very important training need is that of preparing inspectors and their ins tu ons to work with EU standards. Quite a lot of training is being provided through EU and other interna onal projects, but it might also be benefi cial to design and implement a targeted training programme as proposed in sec on 10.4 above.
199
11. Outcomes
This study has progressively developed its analysis of the BiH livestock sector over the preceding nine chapters, with Chapter 9 in par cular reviewing the strengths, weaknesses and investment needs of the diff erent farm types. Therefore this chapter does not seek to repeat this analysis, but instead concisely summarizes the main conclusions aff ec ng investment and then concentrates on giving clear recommenda ons for development of the IPARD programme in Bosnia and Herzegovina.
11.1 Summary of key factors infl uencing investment
Three key factors that must feed into the design of the IPARD programme are investment needs, constraints to be overcome, and the underlying structure of the industry.
11.1.1 Key investment needs
The project farm survey, SWOT workshops and consulta on with stakeholders iden fi ed the following key investment needs (as discussed in greater detail in Chapter 9 above): Producers:• Herd/fl ock enlargement (livestock not
eligible for IPARD)• Buildings and equipment (especially dairy)• Machinery (especially forage)• Manure storage and handling (especially
ca le and pigs) Dairy processors:• Plant upgrading to improve opera ng
effi ciency and product range• In-house laboratories to improve product
quality• Effl uent storage and treatment to meet
environmental standards Meat processors:• Plant upgrading to improve opera ng
effi ciency• Animal waste storage, transport and
disposal
11.1.2 Key constraints
The main constraints iden fi ed in the SWOT workshops, farm visits and stakeholder consulta on (see also Chapter 9 above) were: Producers:• Limited access to land for expansion
(especially for ca le farms)• Limited access to capital• Low technical performance makes it hard
to fund investment• Small size distribu on of farms; poultry
concentrated Processors:• Limited access to capital (though
processors indicate fl exibility and a proac ve approach to obtaining fi nance).
11.1.3 Farm size distribu on
The farm size distribu on (analysed extensively in Chapter 3) has a cri cal bearing on the kinds of investment that are needed, aff ordable, and appropriate for IPARD funding: Ca le (160,000 holdings)• 1–5 cows = 99 percent of farms, 91
percent of cows• > 20 cows = 0.1 percent of farms,
0.9 percent of cows » Major structural problem in dairy produc on, with a need to help smaller farms adapt to the changing situa on; less serious situa on in beef produc on.
Sheep (50,000 holdings)• 1–20 sheep = 81 percent of farms, 30
percent of sheep• > 100 sheep = 1.9 percent of farms,
26 percent of sheep » Less serious structural problem, as even smaller farms can be EUcompliant and commercially viable, though only the larger farms are likely to par cipate in IPARD.
Pigs (130,000 holdings; approx. numbers):
200
• 1–20 sows = 95 percent of breeding farms, 83 percent of sows
• > 50 sows = 0.7 percent of breeding farms, 5.5 percent of sows » Big problem of compe veness, which is likely to see many small pig farms cease produc on; only the larger farms are likely to have a longterm commercial future, and these could benefi t greatly from IPARD assistance.
Poultry (220,000 holdings; very approx. numbers)• Laying hens:
• < 500 layers = 99.9 percent of farms, 29 percent of layers
• > 5,000 layers = 0.1 percent of farms, 71 percent of layers
» Current bi-modal structure is sustainable, as the many small farms are essen ally non-commercial; many large commercial farms will require substan al assistance to adapt to EU standards.
• Broilers:• < 200 broilers = 99 percent of farms,
6 percent of broilers• > 1,000 broilers = 1 percent of farms,
94 percent of broilers » Smaller broiler farms have li le commercial future; IPARD investment should focus on helping large broiler farms to adapt to EU standards, increase effi ciency and con nue to expand.
11.2 Proposed IPARD measures
The following six measures are proposed for implementa on in Bosnia and Herzegovina; each is discussed further in the following sec ons:
Moderniza on of agricultural holdings (101):• 101/1: Improvement and enlargement of
agricultural holdings• 101/2: Manure storage and disposal• 101/3: Forage machinery
Processing and marke ng of agricultural products (103):• 103/1. Improvement of processing
facili es• 103/2: Dairy effl uent storage and
treatment• 103/3: Animal waste collec on and
processing
Each measure is discussed under three main headings: Objec ve – What kinds of investment the measure would support and what it would set out to achieve. Eligible expenditure – The kinds of investment that would be eligible for IPARD support under the measure; in some cases farms would also make other investments, such as purchase of livestock, which cannot be supported through IPARD. Eligible size by end of investment – This sets out, as it says, the business size to be achieved by the end of the investment; in some cases smaller farms or businesses might apply for support, with a business plan that includes enlargement up to at least the minimum eligible size. Es mated number of poten al applicants – This sec on brings in the numbers from Chapters 3 and 4 to es mate how many operators are currently within or close to the eligible size range for each measure. Only a propor on of these would actually choose to apply, so these numbers set upper bounds on the expected number of applicants.
It should be noted that the proposed measures deliberately make no reference to business type, and all measures should be open equally to private farms and all kinds of legal en es such as companies, associa ons and coopera ves.
11.2.1 Measure 101/1: Improvement and enlargement of agricultural holdings
Objec ve: General investment with the aim of helping holdings to:
201
• Meet EU hygiene, welfare and/or environmental standards
• Increase compe veness through increase in herd/fl ock size and more effi cient opera on
Eligible expenditure:• (Re)construc on of buildings • Construc on of manure storage facili es• Purchase of machinery and fi xed
equipment Eligible size by end of investment:• 20–200 cows or fa ening ca le• 100–5,000 ewes• 20–500 sows• 200–5,000 fa ening pigs per cycle• 500–50,000 laying hens• 1,000–100,000 broilers per cycle Es mated number of poten al applicants:• Ca le: There are around 100 dairy farms
and 130 beef farms currently within the eligible size band, together with around 300 slightly smaller dairy farms that might manage to expand up to 20 cows. Together they represent around one-third of a percent of all ca le farms and 5 percent of all cows.
• Sheep: There are around 1,000 sheep farms in the eligible size range, with approximately a quarter of all sheep. However, many of these farms may choose to con nue with rela vely extensive and informal produc on, and only a minority are expected to pursue IPARD funding.
• Pigs: The survey data did not discover any private pig farms within the eligible size range, so most of the applicants would come from amongst the approximately 24 Legal Units that keep pigs. However, around 3 percent of all private pig farms (just under 4,000) have 10–20 sows and so might choose to expand up to the eligible minimum of 20. Together they represent around 3 percent of all pig farms and 20 percent of all pigs.
• Poultry: There are around 190 laying fl ocks within the proposed size band, all of which have at least 5,000 birds (the surveys found that laying fl ocks had either less than 500 or more than 5,000 birds). An es mate 300 broiler farms reach at least the minimum size threshold, and a few of them may already exceed the maximum size limit. Most of these 300 farms currently produce 15,000 broilers per cycle, and would probably wish to expand as well as improve their facili es.
11.2.2 Measure 101/2: Manure storage and disposal
Objec ve: Simplifi ed measure specifi cally to reduce pollu on aimed at farms that are either too large or too small to apply successfully under 101/1. Eligible expenditure:• Construc on of manure storage facili es• Purchase of machinery for collec ng and
spreading manure and slurry Eligible size by end of investment:• 10+ cows• 10+ sows• 20+ fa ening pigs per cycle• 500+ laying hens• 1,000 + broilers per cycle Es mated number of poten al applicants:• The number of farms that fall above
the maximum size thresholds proposed for measure 101/1 is extremely small: perhaps 30 ca le farms and few, if any, sheep or pig farms, whilst it is not known how many of the 25 legal units in the poultry sector have more than 50,000 laying hens or 100,000 broilers.
• However, extending the simplifi ed measure to smaller farms could poten ally lead to a large increase in the number of applicants, with up to 2,000 extra ca le farms and perhaps a similar number of pig farms.
• For poultry, this measure would not set a new lower limit, but off er a simpler
202
applica on procedure be er suited to some of the smaller fl ocks already included in the numbers es mated for measure 101/1.
11.2.3 Measure 101/3: Forage machinery
Objec ve: Specifi c measure to provide machinery for making and handling big-bale silage and other kinds of forage, to anyone who will cover a reasonable area, e.g. machinery rings, farmers’ associa ons and private contrac ng services (individual farmers would apply under measure 101/1). Eligible expenditure:• Forage handling machinery and
associated tractors and trailers Eligible size by end of investment:• Demonstrated capacity and business plan
to harvest at least 100 ha of forage for mul ple holdings
11.2.4 Measure 103/1: Improvement of processing facili es
Objec ve: General investment with the aim of helping dairies and meat plants to:• Meet EU hygiene, welfare and/or
environmental standards• Increase compe veness through
increased size, more effi cient opera on and increased product range.
Eligible expenditure:• (Re)construc on of buildings • Purchase of machinery and fi xed
equipment• Construc on/upgrading of effl uent
storage and treatment facili es• Construc on/upgrading of in-house
laboratories for rapid tes ng of incoming milk and for checking fi nal products
Eligible size by end of investment:• Dairies opera ng regularly at more than fi ve tonnes daily milk intake.
• Meat processors producing at least fi ve tonnes of products per day.
Es mated number of poten al applicants:
• Five dairies and four meat processors are known to be within this size range.
11.2.5 Measure 103/2: Dairy effl uent storage and treatment
Objec ve: Simplifi ed measure specifi cally to reduce pollu on aimed at processors that are too large to apply under 103/1. Eligible expenditure:• Construc on/upgrading of effl uent
storage and treatment facili es Eligible size by end of investment:• At least 20 tonnes of waste water per day. Es mated number of poten al applicants:• Approximately eight processors.
11.2.6 Measure 103/3: Animal waste collec on and processing
Objec ve: Investment for the safe collec on and disposal of animal waste in line with EU standards for public and animal health and the environment Eligible expenditure:• Construc on of rendering plant• Vehicles for transport of animal waste• (Storage at plants is eligible under 103/1) Eligible size by end of investment:• Not applicable – would probably be one
or two central facili es to serve many operators.
Es mated number of poten al applicants:• Depends on poli cal choices between
private and public investment, with the la er approach like to generate either one na onal or two regional rendering plants.
11.2.7 Measures considered but rejected
A number of possible measures were considered by the study team but eventually rejected, for the reasons given below:
Milk collec ng centres – Rejected as the milk cooling problem has largely been solved, at least for farms currently supplying dairies.
203
Livestock markets – Appear to be necessary, but experience shows very few successful examples of donor-established livestock markets. Establishment of coopera ves and associa ons – Again, the experience of donor-established associa ons is not good; however, coopera ves and associa ons would be eligible to apply for any relevant measure.
Possible measures to assist livestock producers to diversify into other ac vi es were also discussed, but the elabora on of measures has been le to the specifi c sector study on diversifi ca on.
11.3 Suppor ng ac ons to prepare the sector for EU accession
Whilst the main focus of this study has been on investment needs and the role that IPARD might play, there are two other areas that will be essen al to the future success of the livestock sector in Bosnia and Herzegovina: Policy and regula on Research, extension and training
11.3.1 Improving the policy and regulatory environment
There are some tasks essen al to the livestock sector that only government can undertake, including se ng and implemen ng regula ons, and nego a ng for interna onal
trade and access to EU markets. As discussed in Chapter 5, there are a number of areas in which BiH could improve, with the most urgent being the ac ons necessary to secure access to EU markets for livestock products.
It is also noted that the majority of domes c livestock support currently goes on input, output and produc on subsidies that have li le eff ect on helping the sector to change and become more compe ve. When Bosnia and Herzegovina does enter the EU, it will have to adopt the EU’s Common Agricultural Policy in whatever form it then takes, but un l accession the country has a window in which to apply “smart” subsidies that will help to restructure the sector and prepare it for the opportuni es and challenges of the EU Single Market.
11.3.2 Improving effi ciency through extension and training
In preparing to face these opportuni es and challenges, it is the farmers and processors themselves who will have to change the most, and here a vital role can and should be played by the extension services. As discussed in Chapter 10, there is a whole list of areas in which extension, training and extension are required – and are generally not being given. This should be treated by government as one of the top priori es for the en re sector, and given the funding and a en on that it needs.

204
205
ANNEX 1
Analysis of Poultry Numbers
I. The problem
Several specifi c factors aff ect es mates of the number of chickens in Bosnia and Herzegovina:1. The sector is characterized by a very large number of small producers and a small number
of very large producers who hold most of the poultry; these large producers tend to be concentrated in a few regions and villages. The sample-based sta s cs are likely to overes mate the number of poultry if they include one of these clusters of large farms, and to underes mate them if they do not; thus sample-based sta s cs (such as the Master Sample) are subject to a high degree of sampling error.
2. However, most of the large producers are legal en es, which are – at least in theory – subject to 100 percent annual repor ng to the en ty sta s cal offi ces.
3. The broiler produc on cycle involves around 43 days of rearing one batch of hens, followed by around 15 days to clean and disinfect the house, with the whole cycle repeated approximately six mes per year. Thus a producer with four houses each containing 15,000 broilers would, on average, have three occupied and one empty at any me, resul ng in three possible sta s cal measurements:a. Repor ng the number of poultry present on the holding on the day of the survey or
census would give the number 45,000 (15,000 × 3);b. Repor ng the u lized broiler capacity would give the number 60,000 (15,000 × 4);c. Repor ng the annual throughput of broilers would give the number 360,000 (15,000
× 4 × 6).4. Many sta s cs do not dis nguish between broiler chickens (with a life cycle of around
40 days), laying hens (with a laying cycle of around 40 weeks), and other poultry (such as turkeys, ducks and geese), though the la er are not believed to be very signifi cant in Bosnia and Herzegovina.
5. Backyard and small-scale produc on is quite seasonal; the Master Sample data were collected around the end of June 2009, when the poultry popula on is at its annual high, and offi cial sta s cs are collected at the end of December, when the popula on is at its annual low.
Thus all poultry sta s cs must be examined carefully to check how they were obtained and what defi ni ons were used.
II. Available data
1. Published sta s cs
The following table show the offi cial sta s cs for poultry numbers in 2010, with an overall total of 21.6 million:
Poultry class BD FBiH RS Grand TotalBreeding females 45,000 1,515,000 2,228,045 3,788,045
Other 755,000 6,983,000 10,076,190 17,814,190
All poultry 800,000 8,498,000 12,304,235 21,602,235
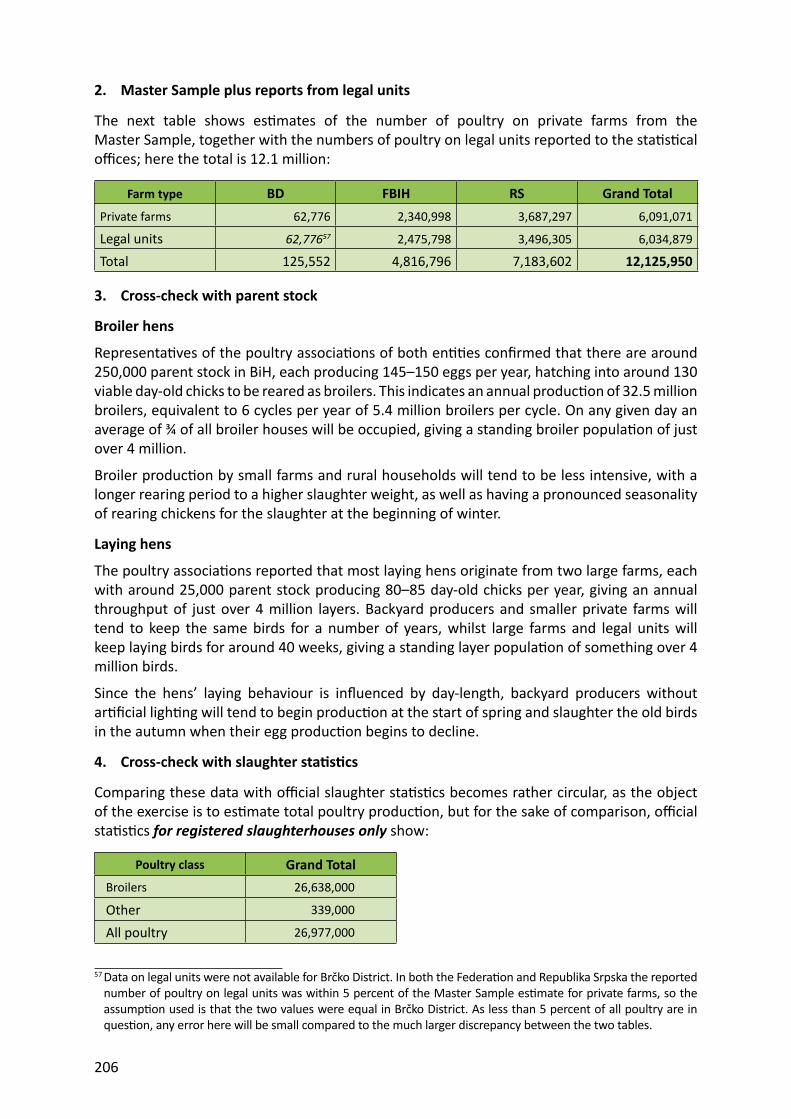
206
2. Master Sample plus reports from legal units
The next table shows es mates of the number of poultry on private farms from the Master Sample, together with the numbers of poultry on legal units reported to the sta s cal offi ces; here the total is 12.1 million:
Farm type BD FBIH RS Grand TotalPrivate farms 62,776 2,340,998 3,687,297 6,091,071
Legal units 62,77657 2,475,798 3,496,305 6,034,879
Total 125,552 4,816,796 7,183,602 12,125,950
3. Cross-check with parent stock
Broiler hens
Representa ves of the poultry associa ons of both en es confi rmed that there are around 250,000 parent stock in BiH, each producing 145–150 eggs per year, hatching into around 130 viable day-old chicks to be reared as broilers. This indicates an annual produc on of 32.5 million broilers, equivalent to 6 cycles per year of 5.4 million broilers per cycle. On any given day an average of ¾ of all broiler houses will be occupied, giving a standing broiler popula on of just over 4 million.
Broiler produc on by small farms and rural households will tend to be less intensive, with a longer rearing period to a higher slaughter weight, as well as having a pronounced seasonality of rearing chickens for the slaughter at the beginning of winter.
Laying hens
The poultry associa ons reported that most laying hens originate from two large farms, each with around 25,000 parent stock producing 80–85 day-old chicks per year, giving an annual throughput of just over 4 million layers. Backyard producers and smaller private farms will tend to keep the same birds for a number of years, whilst large farms and legal units will keep laying birds for around 40 weeks, giving a standing layer popula on of something over 4 million birds.
Since the hens’ laying behaviour is infl uenced by day-length, backyard producers without ar fi cial ligh ng will tend to begin produc on at the start of spring and slaughter the old birds in the autumn when their egg produc on begins to decline.
4. Cross-check with slaughter sta s cs
Comparing these data with offi cial slaughter sta s cs becomes rather circular, as the object of the exercise is to es mate total poultry produc on, but for the sake of comparison, offi cial sta s cs for registered slaughterhouses only show:
Poultry class Grand TotalBroilers 26,638,000
Other 339,000
All poultry 26,977,000
57 Data on legal units were not available for Brčko District. In both the Federa on and Republika Srpska the reported number of poultry on legal units was within 5 percent of the Master Sample es mate for private farms, so the assump on used is that the two values were equal in Brčko District. As less than 5 percent of all poultry are in ques on, any error here will be small compared to the much larger discrepancy between the two tables.
207
5. Comparison with Serbia
Although not directly relevant, a comparison with neighbouring Serbia might serve as another useful cross-check: Popula on of Bosnia and Herzegovina (3.76 million) = 51.5 percent of popula on of Serbia (7.29 million) Poultry in Serbia on 31 December 2009 = 22.8 million
× 51.5 percent gives 11.7 million birds for comparison Poultry meat produc on in Serbia in 2010 = 84,000 tonnes
× 51.5 percent gives 43,000 tonnes for comparison
III. Conclusions
Based on the Master Sample data for private farms and households, repor ng to en ty sta s cal offi ces for legal en es, and a cross-check with the number of parent stock, the number of poultry in Bosnia and Herzegovina is es mated as follows:
Layers
A total of 5.1 million u lized layer places: 2.7 million kept extensively on households and small private farms (up to 500 laying hens), with each bird being kept for an average of 2.5 years and producing 120 eggs per year; 2.5 million kept intensively on medium-sized private farms (> 500 laying hens) and legal en es, with each bird kept for an average of one year (40 weeks laying, plus 18 weeks rearing either on the same farm, if bought as day-old chicks, or on a diff erent farm, if bought as point-of-lay pullets) with an average of 183 eggs/bird/year (as shown in sta s cs):• 1.7 million on private farms;58
• 0.8 million on legal units.
The number of laying hens on any given day will range from a high of around 5 million in the middle of summer, to a low of around 4 million in the middle of winter.
Around 3.4 million old laying hens will be slaughtered each year, resul ng in a meat output of around 7,500 tonnes. Replacement of these hens requires around 3.5 million day-old-chicks per year.
Total annual egg output is es mated to total 771 million: 321 million (41 percent) on households and small private farms; 306 million (40 percent) on medium-sized private farms; 144 million (19 percent) on legal units.
Assuming that the medium-sized private farms market half of their eggs formally to shops and supermarkets, and half informally through direct sale and at green markets, overall around 60 percent of eggs would be marketed informally and 40 percent formally.
BroilersAnnual produc on of 32.1 million broilers:
58 The es mate of poultry numbers on medium-sized private farms is the least reliable part of these calcula ons, due to high sampling error caused by the inherent variance of these data and the rela vely small number of such farms in the Master Sample.
208
1.2 million on households and small private farms (< 1,000 broiler places) mostly producing just one cycle per year; 3.0 million on medium-sized private farms (> 1,000 broiler places) producing an average of 3 cycles per year, during the summer;59
27.9 million on legal units, producing an average of 5 cycles per year, with some producers reducing throughput in the winter months.
Input to these farms requires 33.8 million day-old-chicks per year, and total meat output is es mated at 48,800 tonnes: 2,400 tonnes from households and small private farms, almost all consumed on-farm or marketed informally; 4,500 tonnes from medium-sized farms, with perhaps half marketed informally and half sold to registered slaughterhouses; 41,800 tonnes from legal units, all marketed to registered slaughterhouses.
These 32 million broiler hens are produced in a number of cycles per year, so the maximum broiler popula on on any given day is likely to peak at around 7.5 million in summer and drop to 3.8 million in winter.
Combined
Adding together these two main kinds of poultry produc on gives the following totals: Number of u lized poultry places = 13.3 million; Number of poultry slaughtered per year = 35.4 million; Number of poultry on 31December = 7.7 million, rising to 12.4 million in summer.
The published sta s cal value of 21.6 million appears to lie somewhere between the number of poultry present on 31 December and the total annual throughput, possibly due to varying interpreta on of the ques on by diff erent es mators.
If there really were 3.8 million layers and 17.8 million broilers present at the end of the year, this would imply a throughput of 80–100 million birds per year, which is far higher than indicated by either the number of parent stock or the slaughter sta s cs.
Of the total of 35.4 million hens slaughtered annually, it is es mated that: 5.4 million (12 percent) are slaughtered informally, on-farm and by butchers and restaurants; 30.9 million (88 percent) are slaughtered in registered slaughterhouses. This is slightly higher than the 27.0 million reported in offi cial sta s cs, which may refl ect a degree of under-repor ng by slaughterhouses, possibly for tax reasons.
Total annual egg produc on is es mated at 771 million, some 11 percent higher than the fi gure of 694,000 given in offi cial sta s cs; this discrepancy is largely due to the higher number of laying hens on private households, the smallest of which were probably not taken into account in the sta s cs.
59 Same comment.
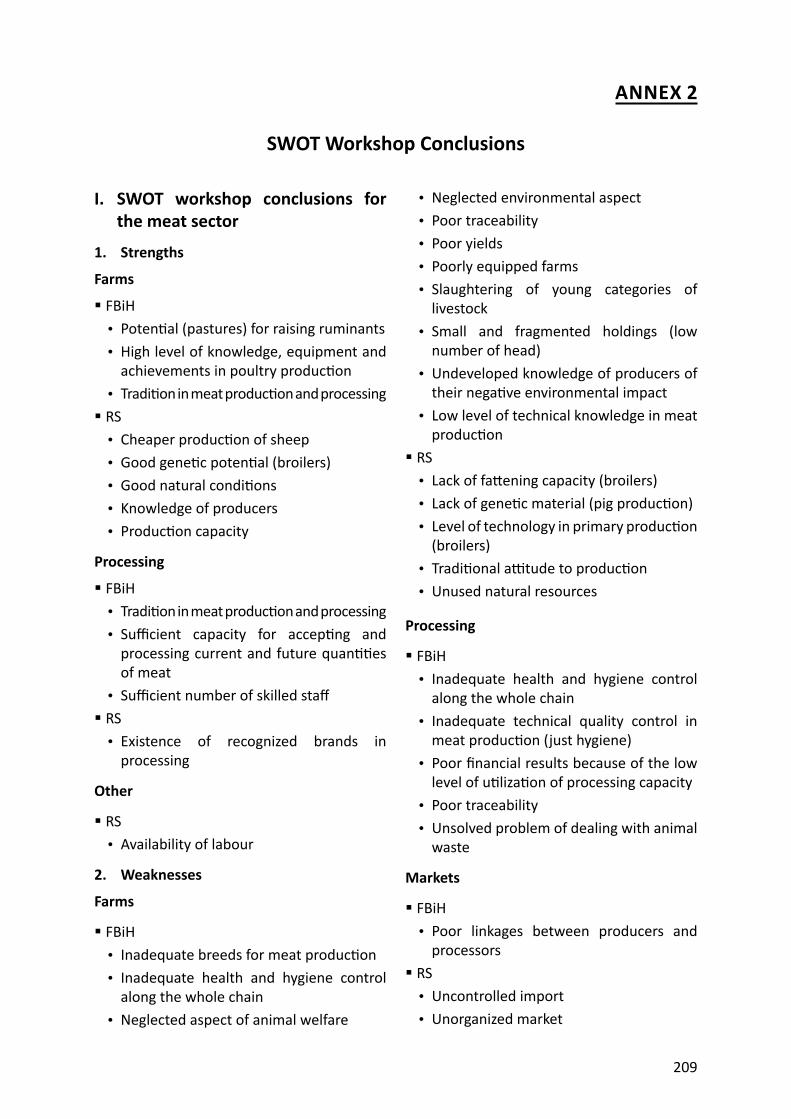
209
ANNEX 2
SWOT Workshop Conclusions
I. SWOT workshop conclusions for the meat sector
1. Strengths
Farms
FBiH• Poten al (pastures) for raising ruminants• High level of knowledge, equipment and
achievements in poultry produc on• Tradi on in meat produc on and processing RS• Cheaper produc on of sheep• Good gene c poten al (broilers)• Good natural condi ons• Knowledge of producers• Produc on capacity
Processing
FBiH• Tradi on in meat produc on and processing• Suffi cient capacity for accep ng and
processing current and future quan es of meat
• Suffi cient number of skilled staff RS• Existence of recognized brands in
processing
Other
RS• Availability of labour
2. Weaknesses
Farms
FBiH• Inadequate breeds for meat produc on• Inadequate health and hygiene control
along the whole chain• Neglected aspect of animal welfare
• Neglected environmental aspect• Poor traceability• Poor yields• Poorly equipped farms• Slaughtering of young categories of
livestock• Small and fragmented holdings (low
number of head)• Undeveloped knowledge of producers of
their nega ve environmental impact• Low level of technical knowledge in meat
produc on RS• Lack of fa ening capacity (broilers)• Lack of gene c material (pig produc on)• Level of technology in primary produc on
(broilers)• Tradi onal a tude to produc on• Unused natural resources
Processing
FBiH• Inadequate health and hygiene control
along the whole chain• Inadequate technical quality control in
meat produc on (just hygiene)• Poor fi nancial results because of the low
level of u liza on of processing capacity• Poor traceability• Unsolved problem of dealing with animal
waste
Markets
FBiH• Poor linkages between producers and
processors RS• Uncontrolled import• Unorganized market
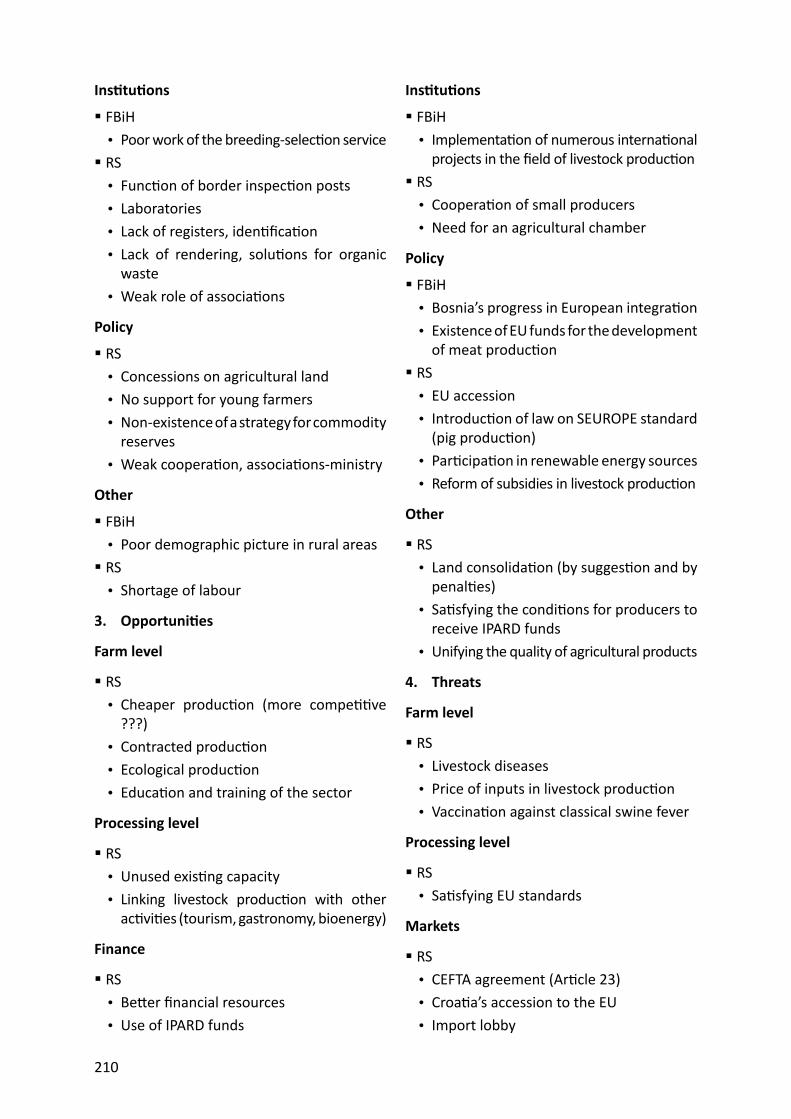
210
Ins tu ons
FBiH• Poor work of the breeding-selec on service RS• Func on of border inspec on posts• Laboratories• Lack of registers, iden fi ca on• Lack of rendering, solu ons for organic
waste• Weak role of associa ons
Policy
RS• Concessions on agricultural land• No support for young farmers• Non-existence of a strategy for commodity
reserves• Weak coopera on, associa ons-ministry
Other
FBiH• Poor demographic picture in rural areas RS• Shortage of labour
3. Opportuni es
Farm level
RS• Cheaper produc on (more compe ve
???)• Contracted produc on• Ecological produc on• Educa on and training of the sector
Processing level
RS• Unused exis ng capacity• Linking livestock produc on with other
ac vi es (tourism, gastronomy, bioenergy)
Finance
RS• Be er fi nancial resources• Use of IPARD funds
Ins tu ons
FBiH• Implementa on of numerous interna onal
projects in the fi eld of livestock produc on RS• Coopera on of small producers• Need for an agricultural chamber
Policy
FBiH• Bosnia’s progress in European integra on• Existence of EU funds for the development
of meat produc on RS• EU accession• Introduc on of law on SEUROPE standard
(pig produc on)• Par cipa on in renewable energy sources• Reform of subsidies in livestock produc on
Other
RS• Land consolida on (by sugges on and by
penal es)• Sa sfying the condi ons for producers to
receive IPARD funds• Unifying the quality of agricultural products
4. Threats
Farm level
RS• Livestock diseases• Price of inputs in livestock produc on• Vaccina on against classical swine fever
Processing level
RS• Sa sfying EU standards
Markets
RS• CEFTA agreement (Ar cle 23)• Croa a’s accession to the EU• Import lobby
211
Finance
RS• Procedures for IPARD funds
Ins tu ons
FBiH• Complicated, long and expensive
procedure to obtain a permit for construc ng a building for produc on
RS• Bad administra ve system• Func oning of ins tu ons at the BiH level
Policy
FBiH• Agricultural policy has a social rather than
development character• Entry of Croa a into the EU• Outstanding legisla on in the fi eld of
conversion of agricultural land, land inheritance and incomplete res tu on
• Poli cal instability• Undefi ned strategic direc on in
produc on (wheat or corn?) RS• Ownership rela ons on land• State policy towards the primary and
secondary sectors
Other
FBiH• Corrup on• Minefi elds• Poorly developed physical infrastructure• Presence of the grey economy
II. Workshop conclusions for the dairy sector
1. Strengths
Farm level
FBiH• Labour force• Meadows and pastures
• Processing and produc on capacity• Resources and climate• Tradi ons/Tradi onal products RS• Existence of building for livestock
placement (barns)• Exis ng agricultural machinery and other
equipment• Long family tradi on in livestock
produc on• Milk producers have economic mo va on
for dealing with that produc on• Producers already have knowledge and
experience in milk produc on• Basic herds of milking cows already exist• Available labour (without employment
opportuni es)
Processing level
FBiH• Processing and produc on capacity• Tradi ons/Tradi onal products RS• Rela vely regular and stable payment of
delivered milk
Markets
FBiH• Economic power – export orienta on RS• Good milk price (even lower than in the
EU and Croa a)• In most regions condi ons exist for milk
collec on (collec on points, etc.)
Policy
RS• Good breeding origin of cows (as a
consequence of post-war import of heifers)
Other
RS• Availability of meadows and pastures• Clean (non polluted) nature
212
• Favourable geographical posi on (micro and macro loca on)
2. Weaknesses
Farm level
FBiH• Farm structure/Fragmented produc on• Household rela onships (gender roles)• Lack of educa on/age• Lack of focus on produc on (wai ng
for a job/other op ons; not a choice – a necessity)
• Produc vity RS• Fragmenta on of farm holdings (small
size, many parcels)• Lack of knowledge for produc on
improvement (selec on, feeding, diseases)
• Old-fashioned (extensive) milk produc on technology by some milk producers
• Poor quality of animal feeding• Small herd size (lot of producers with less
than 5 cows)• Lack of own agricultural land (and own
animal feed)• Low milk yield per cow• Lack of specialized machinery (e.g. silo
combines, hay baling machines, cisterns)• Inadequate facili es for keeping animals
(barns) • S ll poor breeding structure among a
signifi cant number of producers
Processing level
FBiH• Dairies – unilaterally insuffi ciently
included (???)• Innova on• Variable quality RS• High cost of milk collec on (small
quan es, long distances, bad roads)
Markets
FBiH• Exclusive export focus on the Croa an
market• Market skills/product range RS• Credit accessibility (collateral, farm
registra on, balance sheets)• High prices of raw materials (maize,
concentrated feed)
Finance
FBiH• Costs of improving the quality of milk
transport/analy cal services
Ins tu ons
FBiH• Weak level of organiza on of producers RS• Defi cit of agricultural and other
specialized extension schools• Inadequate animal health protec on
Policy
RS• High share of elderly households in total
number of milk producers• Low interest of youth to con nue
produc on on the family farm
Other
RS• Lack of water• Poor botanical structure of meadows
3. Opportuni es
Farms
FBiH• Development of feeding systems• Fast and powerful increase in produc on• Knowledge transfer• Services – Ar fi cial insemina on
213
RS• Ability of self-employment based on
determina on for milk produc on• Milk processing on the farm• Produc on of indigenous milk products
(kajmak, cheeses)• Produc on of own off spring (be er
adapted and cost reduc on)• Possibili es of increased fodder
produc on based on cul va on of temporarily uncul vated land
• Fixed-cost reduc on due to increase of milk produc on
• Specializa on in milk produc on• Possibili es of achieving permanent and
stable income from milk produc on and sales
Processing
FBiH• Ecological produc on RS• Increase of milk collec on price (but it
o en varies)• Increase of milk processing quan ty and
dairy produc on programme dispersion
Markets
FBiH• Consumer habits – 172 litres/person/
year; following nutri on trends• Mul lateral agreements RS• Direct marke ng of milk and milk products• Opening EU market for milk products
from Bosnia and Herzegovina
Finance
FBiH• IPARD
Ins tu ons
RS• Access to IPARD and other development
funds (investment grants)
• Empowering extension providers and be er accessibility of extension services
• Organic produc on of milk (organic farm cer fi ca on)
• Improving and increasingly applying entrepreneurial knowledge and skills (cost management, management)
Policy
FBiH• “Road map” RS• Stable and rela vely high milk incen ves• Holdings enlargement and herd size
enlargement (bigger herd)
4. Threats
Processing
RS• Delay with payment of collected milk• Unstable milk collec on (some dairies
stop or reduce milk collec on out of season)
Markets
FBiH• Bilateral and mul lateral agreements on
the recogni on of standards• Cheap imports• Reduc on of CEFTA (as countries join the
EU)• Supermarkets/Contracted produc on RS• Import of milk and milk products (unfair
compe on)• Frequent varia on in milk prices
Finance
FBiH• Development fund of Bosnia and
Herzegovina RS• Unfavourable lending policy (high interest
rates)
214
Ins tu ons
FBiH• Administra on – Cost of credit, obtaining
credit/Development (entrepreneurial infrastructure)
• System for ensuring food quality and safety
RS• Poor and expensive veterinary services
(even though veterinary services are priva zed)
• Shortage of ins tu ons for milk product quality control
• Shortage of ins tu ons for cer fi ca on of achieving par cular standards
Policy
FBiH• Budget for subsidies and policies• Environment/Uncertainty/Unresolved
status/Long-term policy stability• Implementa on of EU standards• Lack of a long-term strategy for
development of the sector• Poli cians – not understanding needs RS• Low milk price (lower than in Croa a and
the EU)• Tax policy (introducing VAT on raw
materials)
• Dairies’ monopoly• Lack of goat produc on incen ves (due
to that there is li le goats’ milk)• Bosnia’s entry into the EU (which
producers lose and which benefi t)
Other
FBiH• Non-existence of “knowledge services”
for accession• Undeveloped infrastructure (water/
roads/electricity)• Lack of local patrio sm (in food-buying) RS• Climate change (less rain, higher average
temperature)• More costly animal fodder and other raw
materials (fuel)• Pollu on of environment (water, soil, air)• Zoonoses (animal diseases)• Poor quality of semen for ar fi cial
insemina on• Natural disasters (drought, hail, fl oods)
and their infl uence on feed prices• Complicated procedures of issuing
construc on, ecological and other permissions
• Unstable poli cal situa on in Bosnia and Herzegovina
215
ANNEX 3
Processing Survey Ques onnaires
Name of dairyDate of visit
1 Background Comments1.1 Year established year1.2 Original capacity tonnes p.a.1.3 Present average capacity tonnes p.a.1.4 Number of employees number1.5 Tonnes
milk/employee2 Milk collection
2.0 Number of collection lines number2.1 Area 1 W litres/day2.2 Area 2 IM litres/day2.3 Area 3 GM litres/day2.4 Area 4 GS litres/day2.5 Area 5 SA litres/day2.6 Area 6 ZG litres/day2.7 Area 7 BJ litres/day2.8 Area 8 SP litres/day
2.8.1 Own transport 1/02.8.2 Contracted transport 1/02.8.3 By agents 1/0
2.9 Number of collection vehicles number2.10 Total capacity of vehicles tonnes
3 Current milk supply3.1 Number of
suppliersnumber
3.2 Average milk intake per day litres/day3.3 Volume of cooled milk litres/day3.4 Are there occasions of milk surplus 1/03.5 Average litres per supplier litres/day3.6 Average ex farm price for 2010 KM/litre3.7 Is there a milk quality improvement
incentive1/0
3.8 Frequency of payment to producers3.8.1 Monthly 1/03.8.2 weekly 1/03.8.3 twice monthly 1/0
3.9 Number of lactofreezers owned by dairy number3.10 Lactofreezer capacity tonnes
Lactofreezer capacity as % of daily intake %3.11 Number of Milk Collection Centres (MCC) number3.12 MCC capacity tons
4 Milk composition and hygiene data4.1 Fat % %4.2 Protein % %4.3 snf % %4.4 Added water (fail FPD test) % of milk4.5 Antibiotics (fail
test)% of milk
4.6 TBC number/ml4.7 SCC number/ml4.8 Alkotest 1/0
I. Dairies
216
8 The market8.1 Local %8.2 National %8.3 Balkan region %8.4 Other %8.5 Current price list supplied 1/0
9 Effluent disposal9.1 Own treatment 1/09.2 Municipality 1/09.3 None 1/0
10 External controls10.1 Which authority controls finished products in respect of food
safety10.2 How frequent is this control10.3 Does the authority give feedback of results of analyses10.4 What tests are performed by the authority10.5 Does the authority assess the in house quality and HACCP
systems
NOTES: 1/0 indicates 1 = yes; 0 = nop.a. = per annum
5 Internal quality control5.1 Sampling frequency daily monthly5.2 At the farm 1 1/05.3 Raw milk on
delivery1 1/0
5.4 Storage tanks 1 1/05.5 Filled product 1 1/05.6 Cheese 1 1/05.7 From pasteurizer 1 1/05.8 Water supply 1 1/05.9 HACCP certification 1 1/0
6 Products manufactured in 2010 fat % litres/kg6.1 Pasteurized milk6.2 UHT milk6.3 Yoghurt6.4 Kiselo mleko6.5 Kisela pavlaka6.6 Butter6.7 Kajmak6.8 Sweet cream6.9 Cheese FDM % tonnes
6.9.1 Hard6.9.2 Semi hard6.9.3 Soft6.9.4 Processed6.9.5 Other
7 Condition of:7.1 Walls 0 57.2 Floor 0 57.3 Ceiling 0 57.4 No mould growth 0 5
217
Name of plant CommentsDate of visit
1 Background1.1 Year established
1.2 Number ofemployees
1.3 Installed capacity1.4 Operational capacity
LWt kg2 Species purchased Male Female
2.1 Bovine2.2 Sheep2.3 Pigs2.4 Poultry
Local Import3 Raw material origins kg av. KM/kg kg av. KM/kg
3.1 Bovine3.2 Sheep3.3 Pigs3.4 Poultry
4 Transport4.1 Company4.2 Contractor4.3 Other
5 Lairage5.1 Water supply5.2 Hygiene5.3 Animal treatment
6 Slaughtering6.1 Halal6.2 Other6.3 Veterinary presence
II. Meat processors
7 Carcass handling7.1 Bleeding7.2 Cutting7.3 Removal of stomach contents7.4 Removal of offal7.5 Skinning7.6 Cutting hygiene7.7 Mechanization level
8 Condition of:8.1 Walls8.2 Floor8.3 Ceiling8.4 Drainage
218
9 Products manufactured in 2010 kg9.19.29.39.49.59.69.79.89.9
10 Quality assurance10.1 HACCP in place10.2 Other certification10.3 EU standards aware
11 The market11.1 Local %11.2 National %11.3 Balkan region %11.4 Other %
12 Effluent disposal12.1 Own treatment12.2 Municipality12.3 None
13 External controls13.1 Which authority controls finished products in respect of food safety13.2 How frequent is this control13.3 Does the authority give feedback of results of analyses13.4 What tests are performed by the authority13.5 Does the authority assess the in house quality and HACCP systems
14 Investments ('000 KM) in: Plant QC other14.1 Recent14.2 Planned
219
ANNEX 4Processing Case Studies
I. Case study of dairy company # 1
Summary
Opera ng capacity 4,500 litres raw milk per day
Maximum capacity 6,000 litres per day
No. of producers 110
No. of employees 15
HACCP Not fully – in process
Background
This small business enterprise is totally family owned and was founded in 2004, using part of a shop’s premises to produce small quan es of yoghurt. Early success in the venture demanded proper premises which were built to the rear of the same shop. Further expansion was required in 2010 and a large redundant, single-storey building has been purchased with a view to accommoda ng new plant and equipment suffi cient to meet the new market demand.
Both original and new sites are situated close to a small town which also supports another, but smaller dairy plant.
Capacity
The original capacity is of about six tonnes of milk per day, on a single shi basis, and the new plant will be designed to manufacture ten tonnes per shi . There are currently 15 employees, which may need to be increased depending on the selec on of processing and packaging machinery.
Raw material base
Milk is collected from over 100 producers in three areas close to the dairy plant, at an average of 44 litres each on a daily basis. There are 14 milk collec on points in the collec on area, where units are located to cool and store milk prior to collec on by company transport. Half of these lactofreezers are owned and supplied by the dairy company,
thus s mula ng milk quality improvement. The dairy does not, however, pay any bonus for be er milk hygiene, a situa on which may be addressed when the new plant is opera onal.
Premises and processing
The current premises are acceptable but would require detailed a en on to meet EU standards. The owner recognizes this and prefers to invest in new equipment in the new loca on and refurbishing this building to the appropriate standards. During the fi rst visit, the new site was inspected, and whilst suitable in size and loca on there remained more remedial work than the owner had planned for. The small amount of new plant that had been installed was of a high standard, but looked unlikely to be completed by the November deadline. This was proved true during the second visit, and it appears that the business has run out of cash for the me being.
Process equipment is quite old, but well-maintained. At such low capacity there is no need for automa c fi lling and packaging equipment. There is no real possibility that HACCP could be achieved without considerable altera ons and investment.
Product range
Pasteurized milk in plas c sachets Yoghurt in plas c bo les Sour cream in plas c pots So cheese
Yoghurt and pasteurized milk are the best sellers but eff orts are being made to promote sales of so cheese, as cheese is a useful product to make in mes of milk surplus.
The market
Purely local at present, but is looking to export to Serbia and Montenegro in the future. However, the product range and
220
quality are unlikely to gain much export poten al unless the new plant is running, milk quality improves, and packaging and product quality are greatly improved. There is a lot of compe on in the CEFTA market and these products have li le appeal.
Management and fi nance
The owner seems to be afraid of delega on, even signing invoices for 1 or 2 KM during the interview. Whilst he demonstrates some vision of the future for his business he will need to trust in others to achieve his goals.
He was reluctant to discuss fi nance but suggested that his turnover was more than 1 million KM per annum. This seems an understatement, and 2.5 million would be more likely.
At that level, his previous investments could have been fi nanced from profi t.
The prognosis is not very good considering the current fi nancial climate and the size of opera on. Speedy comple on of the new plant at higher throughput, if the market is found, would underpin the company’s future.
II. Case study of dairy company # 16
Summary
Opera ng capacity 12,000 litres raw milk per day
Maximum capacity 15,000 litres per day
No. of producers 400
No. of employees 31
HACCP Yes
Background
This family owned business started in 1999 as a rural cra shop, making nominal amounts of yoghurt. The business is established in a rural loca on (small village) and employs 31 staff including family members of wife and two sons.
Capacity
It is now successfully opera ng at 12 to 15,000 litres of raw milk per day and preparing to
move into larger processing premises on the same site by the end of 2012, when the design capacity will be a maximum of 25,000 litres per day, planned to be achieved by 2015.
Raw material base
Milk is collected by the company’s road tankers from about 400 producers located in four municipali es, entailing a maximum distance of 45 km from the factory. Problems of collec on occur only in severe winter condi ons.
Milk quality has been improved over the last two years in par cular by a company training programme for milk producers, supported by the supply of lactofreezers in strategic collec on centres. All raw milk is today cooled to at least 6°C on arrival at the dairy.
Milk is subject to payment according to its composi on and hygienic quality, refl ected in the 50 percent of milk in the top band, classifi ed as Ekstra Grade, and subject to a 5 percent premium on the basic price agreed with producers. 10 percent of milk is of the lowest standard, Grade 4, and reducing gradually. This milk is subject to deduc ons from the basic price, which has encouraged producers to improve their performance, but many of these farmers have only two or three cows, so further improvements are less likely to occur in the short term.
The basic price paid is 0.58 KM per litre and there are also penal es if either water or an bio cs are iden fi ed in the milk.
Premises
The building housing the offi ces, processing and services is in excep onal order concerning the condi on of walls, fl oors and drains and absence of mould growth. Modern construc on materials have been used throughout.
Separate staff facili es for staff changing and toilets for men and women are in accordance with EU standards and there is a sta on installed for visitors to sterilize their hands and don protec ve clothing and footwear
221
prior to entry to the factory. All staff are suitably a red in clean work clothes.
Ligh ng in the processing area is adequate to provide a safe working environment.
Processing
Most of the equipment is fi ve to ten years old, which is normal for a stainless-steel plant, and is well maintained and clean. The usual items include storage tanks, heat exchangers, homogenizer and separator. Packaging machines are automa c or semi-manual and provided with safety devices.
Product range
Products are as follows: Pasteurized milk (3.2 percent fat) packed in 1-litre plas c sachets Yoghurt (3.2 percent fat) packed in three sizes of plas c cups Diet yoghurt (0.9 percent fat) in two sizes Cream (20 percent fat) in three sizes Cheese of four types, from fresh, so to Kackavalj type Kajmak of two types
The market
Product output has steadily increased, par cularly since 2007, in response to increased demand in the market. Products are sold mainly in Bosnia and Herzegovina but a propor on is exported to Montenegro. The company is inves ga ng other marke ng channels and opportuni es and considers the plans to increase product output to be realis c and achievable.
Management and fi nance
Four members of the family are employed in the business. The parents learned about dairying simply by doing the job and they have trained all other staff . The business is very well run with a pleasant atmosphere between the owners and the staff .
The company has expanded gradually, each stage of growth funded out of profi t. This seems a reasonable conclusion, as producers
have never suff ered late payment for their milk and other consumables are paid for in advance in order to obtain be er terms.
The recent annual turnover is es mated to be in excess of 5.5 million KM, whereas the company suggests only 3.5 million. Total costs have been calculated from the propor on of total costs borne by milk at 55 percent. This results in total costs of 4.6 million, an unlikely scenario, bearing in mind the state of the business.
The new, larger premises, of 1,800 sq. m. have already been paid for, but funding is needed to purchase plant and equipment, although some func ons of the exis ng building will form part of the new. The total budget cost of the new works is es mated by the company at around 3.5 million KM.
III. Case study of meat processing company # 11
Background
This meat processing plant is a family owned business established in 2003. The premises are modern and spacious, allowing a processing area which is well planned and full of natural light. The compound also houses refrigerated storage rooms and a services block, with adequate space for vehicle movements.
Source of raw materials
Three species are used in processing – pork, beef and chicken, some of which are imported from the EU. Most of the raw material is frozen and boneless and any fresh meat is obtained from a slaughterhouse contracted for the purpose and when required.
Imports from the EU are cheaper and of be er and more reliable quality than local material, even if this is available. It is reported that the prices for EU supplies are 30 percent lower than locally sourced meat. 50 percent of pork and beef are imported and 20 percent of chicken, and it was stated that government regula ons s pulate that at least 50 percent of processed meat products shall
222
be of domes c supply (presumably in order to acquire a BiH Cer fi cate of Origin for export).
Raw material bears the highest share of total opera ng costs at 75 percent, ensuring that the company seeks the cheapest source at the desired quality.
Plant capacity
The plant is opera ng at 50 percent of its design capacity of 10 tonnes of product per day, and un l the economic situa on improves there is no plan to reach the maximum. Of par cular concern is the lack of government support for exporters and poor regula on.
Product range
There is a narrow product range in comparison to other processors, consis ng en rely of canned tradi onal products, principally goulash and pâtés, which are classed as semidurable.
The cans used in produc on are supplied from either Croa a or Serbia and are pre-printed, except for 10 percent which are blank and require labelling on-site.
The company has achieved HACCP cer fi ca on through an Austrian agency, but is concerned that any meat from local slaughterhouses will not be in compliance with HACCP.
The market
Ninety percent of product is sold on the local market, and the balance exported to Serbia, Croa a and Montenegro. Concerns regarding the Croa an market, when it joins the EU, have been partly resolved by working with a Croa an company that will request permission for meat products made in Bosnia and Herzegovina to be imported into Croa a. During the last four years, the company has secured export sales of chicken pâté to Croa a at an average of 40 tonnes per annum.
This procedure is already in place and opera ng in exports to Serbia, where the product details are in Serbian but include the words “Made in Bosnia”.
Further to the export situa on, the company states that Serbia and TfYR Macedonia enjoy a 20 percent export subsidy on their products into Bosnia and Herzegovina, a subject of great concern. In addi on, TfYR Macedonia allows imports of meat products free of duty.
Because Bosnia and Herzegovina has yet to upgrade its regula ons for the meat industry according to EU requirements, there are frequent and costly delays at border control points.
Management and fi nance
The owners are experienced in the meat business and are progressive in their approach to the future. Even at 50 percent of single-shi design capacity the company reports an annual turnover in excess of 5 million KM, enabling some investment from its own resources.
The management reports that its main constraints are: Recurrent cash-fl ow problems due to late payments by some customers Compe on from imported products Inconsistencies in trade with CEFTA Lack of policy from the State Cost of credit at 9 percent interest
Cost structure, other than for raw materials, is as follows: Labour: 10 percent Packaging: 10 percent Credit: 5 percent
The company has invested 150,000 KM in 2011 in canned product technology and plans to invest a further 500,000 KM in respect of cold storage and a drying chamber for dried meat products.
Conclusion
This small opera on is conducted in an enterprising manner and should prove a suitable candidate for IPARD funding. The management a ended the meat industry
223
workshop and were pleased to learn more of IPARD procedure and where funds could be applied to the business i.e. produc on improvements and purchase of essen al equipment.
IV. Case study of meat processing company # 4
Background
The company has a long family history of meat industry business, forged on a chain of butchers’ shops in 1943. The ownership transferred in 1987 to the current family descendent, when meat processing became the focus rather than fresh product.
During the Balkan confl ict all the company’s assets were destroyed and in 1997 a fresh start was made in a new loca on, using a loan from government. By December 1999 the new plant was equipped in accordance with EU standards, with support from a foreign donor agency.
Source of raw materials
Raw material is confi ned to beef, veal, chicken and turkey, 60 percent of which is currently imported, mainly from the EU. Poultry imports are about 35 percent of total requirements and are mainly of frozen, boneless chicken. Turkey products, a recent introduc on, are manufactured using fresh meat produced in Bosnia and Herzegovina, about 40 km distant from the plant.
Plant capacity
The maximum capacity is 15 tonnes of fi nished product per day which can only be accomplished by opera ng an extra shi for packaging. Deliveries to the market are conducted during a night-shi to ensure that customers receive their orders before morning opening. In 2010, the company reports that produc on reached more than 1,000 tonnes.
Plant and equipment are in excellent condi on and because of the specialized
product range a high degree of automa on has been incorporated. The plant has recently been increased by an area of more than 3,000 sq.m. using modern construc on materials, such as thermally insulated panels which are epoxy-coated for easy cleaning and maintenance of hygiene.
There are around fi y permanent employees in the processing plant with a further fi y employed in marke ng, fi nance and other commercial ac vi es.
The processing unit has achieved HACCP cer fi ca on through SGS and the company has also been awarded cer fi ca on under ISO 9001:2008.
Product range
The off er of more than forty bar-coded products includes long shelf-life smoked items, which account for over 50 percent of output and are mainly of beef and veal. Other products are: Dried meat in slices Mortadella Cooked sausage Smoked beef and veal joints Smoked turkey
Product quality control is carried out by the appropriate Ins tute of Food Hygiene, taking daily samples of each product and tes ng for microbiology and heavy metals.
The market
The company tradi onally has a strong presence in the local market and enjoys a reputable brand name and a reputa on for high quality products. The export market is envisaged to be essen al for the future security of the business and an Austrian daughter company was recently formed. The company states that “We have been given an opportunity to overcome the obstacle when expor ng meat products from Bosnia and Herzegovina to EU countries. Currently, the plant, employing thirty workers, exports meat products to EU-12 countries”.
224
About fi een own label brands have been developed in parallel with specifi c retailers, which have proved very successful, which is seen as another way forward in securing the company’s progress and sustainability.
Management and fi nance
The management was reluctant to provide fi nancial details but it is es mated that the business should generate about 6 million KM of turnover per annum.
The company has recently invested 100,000 KM in extra processing equipment and a further 1 million KM investment is planned for cold-smoking facili es in par cular. Funds are also to be a ained for improvements to the effl uent plant.
Management complains of the cash-fl ow problems that o en plague the food processing industry as well as the lack of government support for the industry’s eff orts to secure be er export terms.
The company considered that it was well able to face compe on from imports and is already planning a marke ng strategy for the future, up to and including EU accession.
Conclusion
The business is very well managed especially in terms of sales and marke ng. The senior team members display enthusiasm for their work, and it appears that their future is secure, but dependent as always on any seriously adverse circumstances.
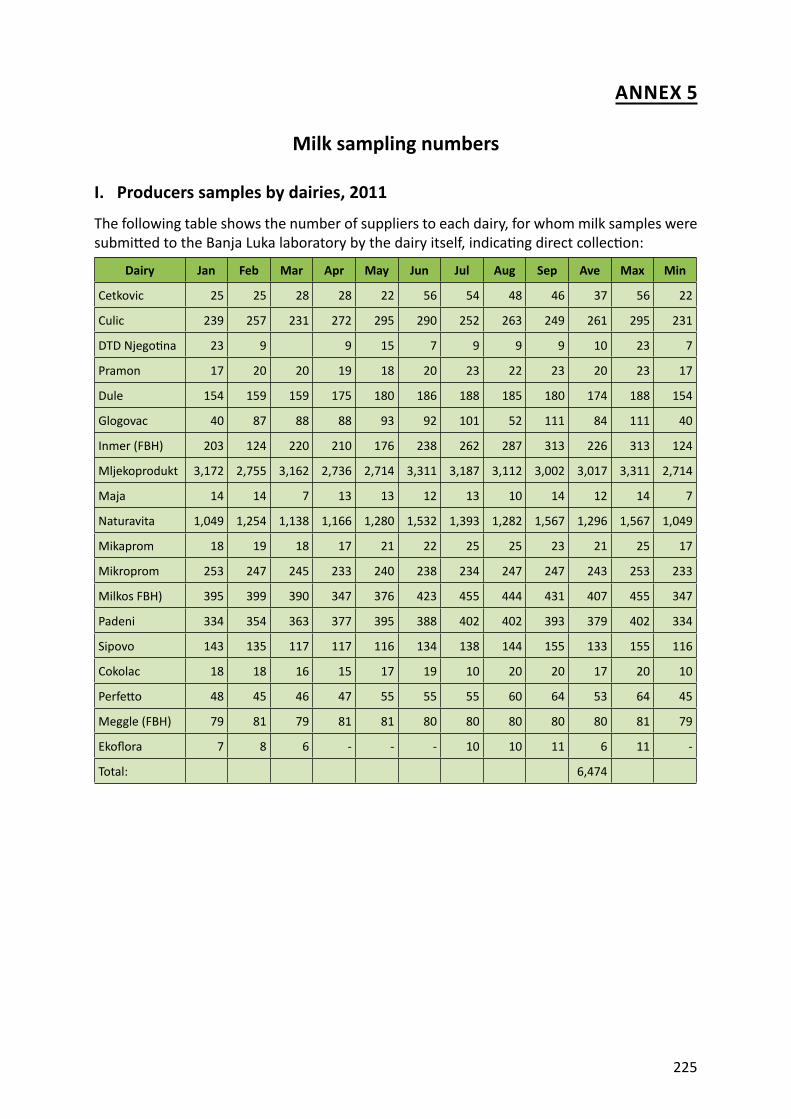
225
ANNEX 5
Milk sampling numbers
I. Producers samples by dairies, 2011
The following table shows the number of suppliers to each dairy, for whom milk samples were submi ed to the Banja Luka laboratory by the dairy itself, indica ng direct collec on:
Dairy Jan Feb Mar Apr May Jun Jul Aug Sep Ave Max Min
Cetkovic 25 25 28 28 22 56 54 48 46 37 56 22
Culic 239 257 231 272 295 290 252 263 249 261 295 231
DTD Njego na 23 9 9 15 7 9 9 9 10 23 7
Pramon 17 20 20 19 18 20 23 22 23 20 23 17
Dule 154 159 159 175 180 186 188 185 180 174 188 154
Glogovac 40 87 88 88 93 92 101 52 111 84 111 40
Inmer (FBH) 203 124 220 210 176 238 262 287 313 226 313 124
Mljekoprodukt 3,172 2,755 3,162 2,736 2,714 3,311 3,187 3,112 3,002 3,017 3,311 2,714
Maja 14 14 7 13 13 12 13 10 14 12 14 7
Naturavita 1,049 1,254 1,138 1,166 1,280 1,532 1,393 1,282 1,567 1,296 1,567 1,049
Mikaprom 18 19 18 17 21 22 25 25 23 21 25 17
Mikroprom 253 247 245 233 240 238 234 247 247 243 253 233
Milkos FBH) 395 399 390 347 376 423 455 444 431 407 455 347
Padeni 334 354 363 377 395 388 402 402 393 379 402 334
Sipovo 143 135 117 117 116 134 138 144 155 133 155 116
Cokolac 18 18 16 15 17 19 10 20 20 17 20 10
Perfe o 48 45 46 47 55 55 55 60 64 53 64 45
Meggle (FBH) 79 81 79 81 81 80 80 80 80 80 81 79
Ekofl ora 7 8 6 - - - 10 10 11 6 11 -
Total: 6,474
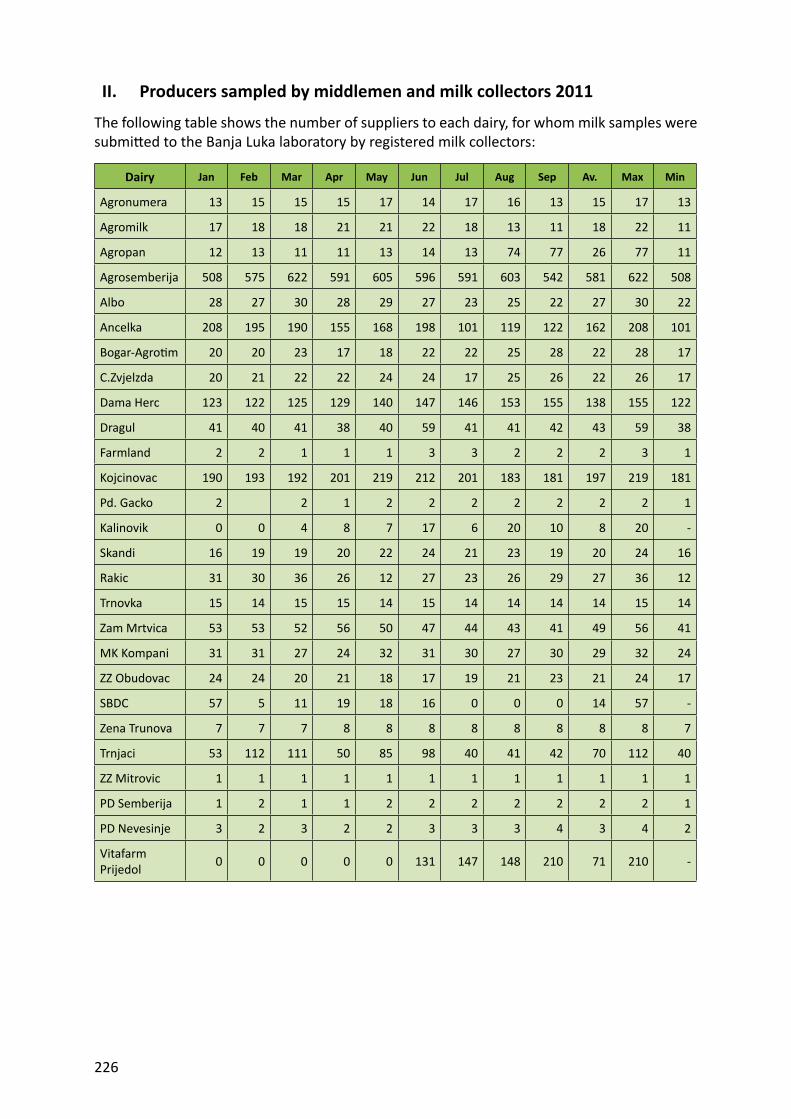
226
II. Producers sampled by middlemen and milk collectors 2011
The following table shows the number of suppliers to each dairy, for whom milk samples were submi ed to the Banja Luka laboratory by registered milk collectors:
Dairy Jan Feb Mar Apr May Jun Jul Aug Sep Av. Max Min
Agronumera 13 15 15 15 17 14 17 16 13 15 17 13
Agromilk 17 18 18 21 21 22 18 13 11 18 22 11
Agropan 12 13 11 11 13 14 13 74 77 26 77 11
Agrosemberija 508 575 622 591 605 596 591 603 542 581 622 508
Albo 28 27 30 28 29 27 23 25 22 27 30 22
Ancelka 208 195 190 155 168 198 101 119 122 162 208 101
Bogar-Agro m 20 20 23 17 18 22 22 25 28 22 28 17
C.Zvjelzda 20 21 22 22 24 24 17 25 26 22 26 17
Dama Herc 123 122 125 129 140 147 146 153 155 138 155 122
Dragul 41 40 41 38 40 59 41 41 42 43 59 38
Farmland 2 2 1 1 1 3 3 2 2 2 3 1
Kojcinovac 190 193 192 201 219 212 201 183 181 197 219 181
Pd. Gacko 2 2 1 2 2 2 2 2 2 2 1
Kalinovik 0 0 4 8 7 17 6 20 10 8 20 -
Skandi 16 19 19 20 22 24 21 23 19 20 24 16
Rakic 31 30 36 26 12 27 23 26 29 27 36 12
Trnovka 15 14 15 15 14 15 14 14 14 14 15 14
Zam Mrtvica 53 53 52 56 50 47 44 43 41 49 56 41
MK Kompani 31 31 27 24 32 31 30 27 30 29 32 24
ZZ Obudovac 24 24 20 21 18 17 19 21 23 21 24 17
SBDC 57 5 11 19 18 16 0 0 0 14 57 -
Zena Trunova 7 7 7 8 8 8 8 8 8 8 8 7
Trnjaci 53 112 111 50 85 98 40 41 42 70 112 40
ZZ Mitrovic 1 1 1 1 1 1 1 1 1 1 1 1
PD Semberija 1 2 1 1 2 2 2 2 2 2 2 1
PD Nevesinje 3 2 3 2 2 3 3 3 4 3 4 2
Vitafarm Prijedol 0 0 0 0 0 131 147 148 210 71 210 -
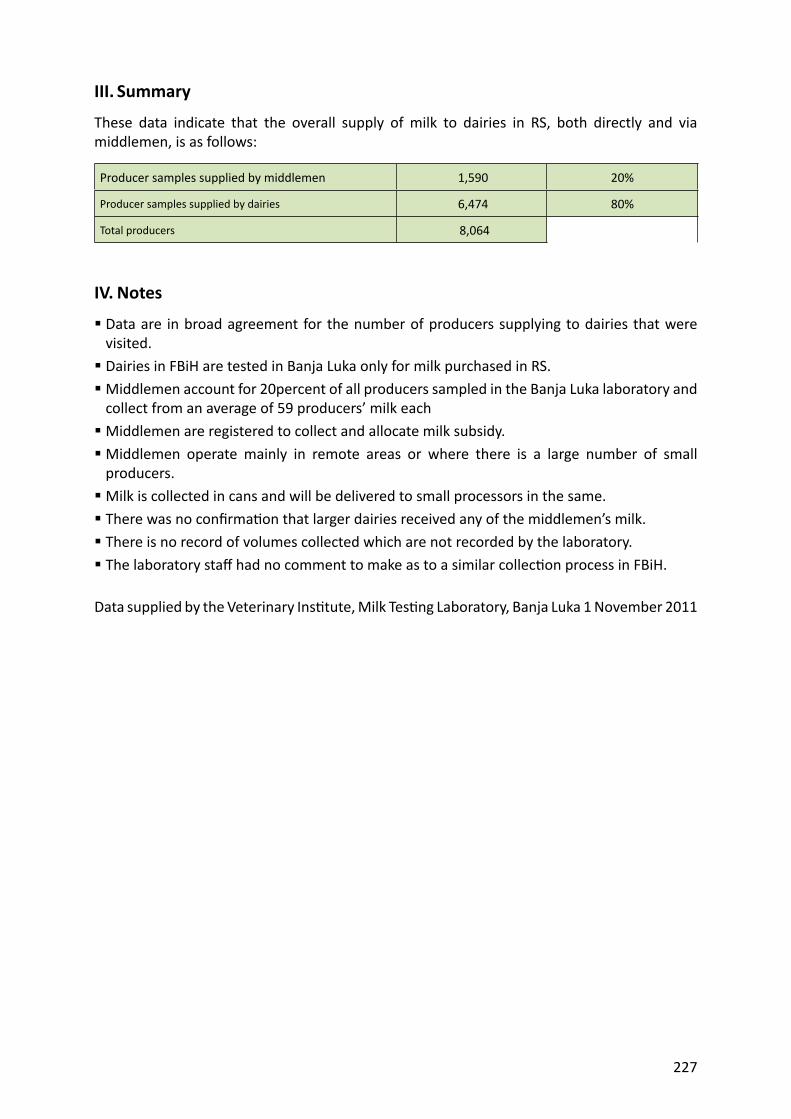
227
III. Summary
These data indicate that the overall supply of milk to dairies in RS, both directly and via middlemen, is as follows:
Producer samples supplied by middlemen 1,590 20%
Producer samples supplied by dairies 6,474 80%
Total producers 8,064
IV. Notes
Data are in broad agreement for the number of producers supplying to dairies that were visited. Dairies in FBiH are tested in Banja Luka only for milk purchased in RS. Middlemen account for 20percent of all producers sampled in the Banja Luka laboratory and collect from an average of 59 producers’ milk each Middlemen are registered to collect and allocate milk subsidy. Middlemen operate mainly in remote areas or where there is a large number of small producers. Milk is collected in cans and will be delivered to small processors in the same. There was no confi rma on that larger dairies received any of the middlemen’s milk. There is no record of volumes collected which are not recorded by the laboratory. The laboratory staff had no comment to make as to a similar collec on process in FBiH.
Data supplied by the Veterinary Ins tute, Milk Tes ng Laboratory, Banja Luka 1 November 2011

228
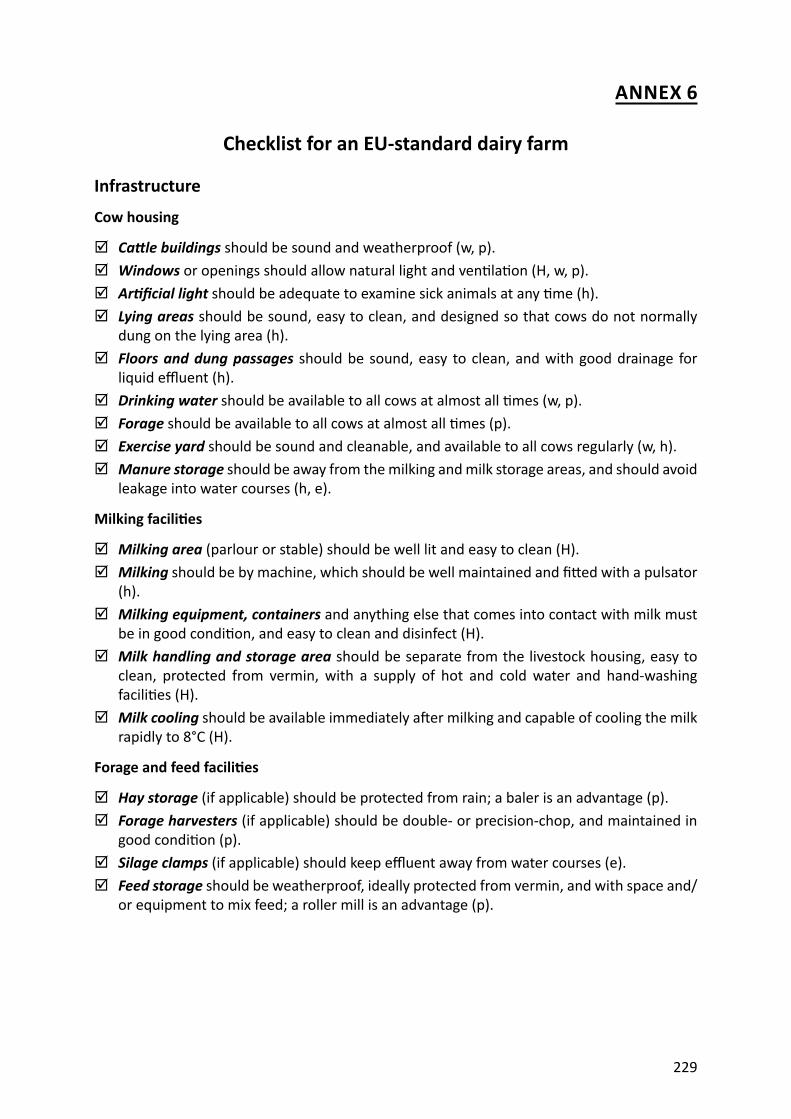
229
ANNEX 6
Checklist for an EU-standard dairy farm
Infrastructure
Cow housing
Ca le buildings should be sound and weatherproof (w, p).Windows or openings should allow natural light and ven la on (H, w, p).Ar fi cial light should be adequate to examine sick animals at any me (h).Lying areas should be sound, easy to clean, and designed so that cows do not normally
dung on the lying area (h).Floors and dung passages should be sound, easy to clean, and with good drainage for
liquid effl uent (h).Drinking water should be available to all cows at almost all mes (w, p).Forage should be available to all cows at almost all mes (p).Exercise yard should be sound and cleanable, and available to all cows regularly (w, h).Manure storage should be away from the milking and milk storage areas, and should avoid
leakage into water courses (h, e).
Milking facili es
Milking area (parlour or stable) should be well lit and easy to clean (H).Milking should be by machine, which should be well maintained and fi ed with a pulsator
(h).Milking equipment, containers and anything else that comes into contact with milk must
be in good condi on, and easy to clean and disinfect (H).Milk handling and storage area should be separate from the livestock housing, easy to
clean, protected from vermin, with a supply of hot and cold water and hand-washing facili es (H).
Milk cooling should be available immediately a er milking and capable of cooling the milk rapidly to 8°C (H).
Forage and feed facili es
Hay storage (if applicable) should be protected from rain; a baler is an advantage (p).Forage harvesters (if applicable) should be double- or precision-chop, and maintained in
good condi on (p).Silage clamps (if applicable) should keep effl uent away from water courses (e).Feed storage should be weatherproof, ideally protected from vermin, and with space and/
or equipment to mix feed; a roller mill is an advantage (p).
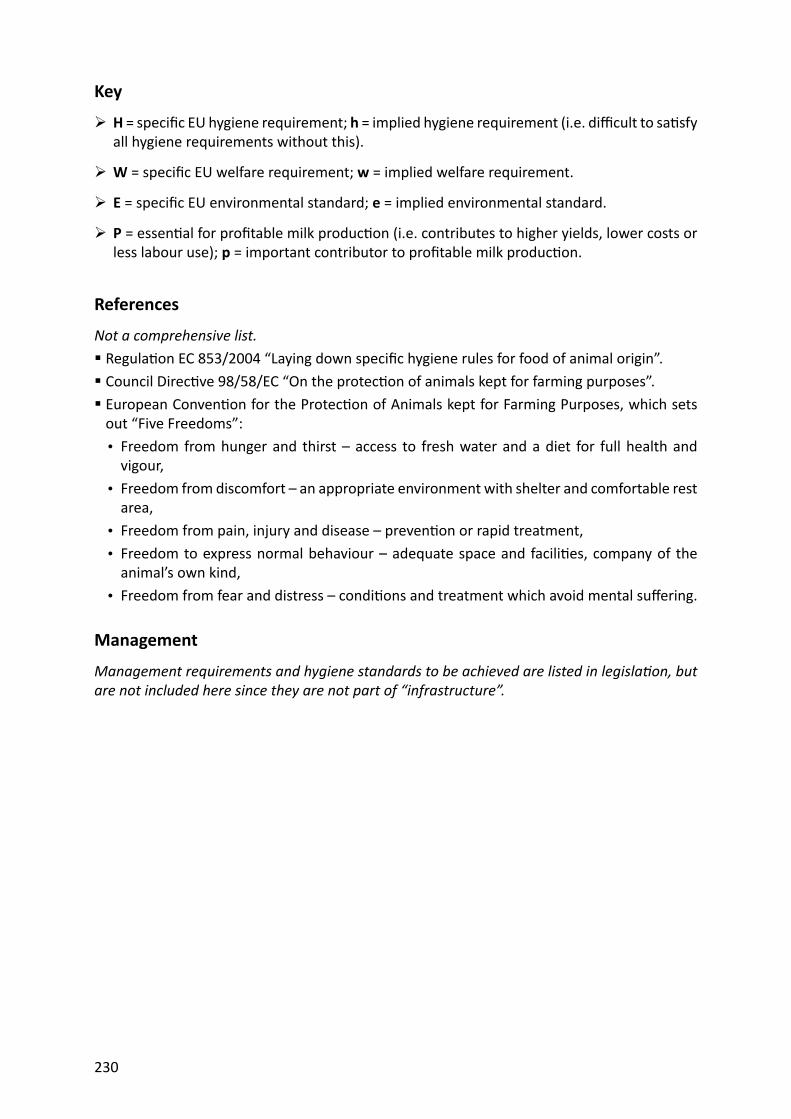
230
Key
H = specifi c EU hygiene requirement; h = implied hygiene requirement (i.e. diffi cult to sa sfy all hygiene requirements without this).
W = specifi c EU welfare requirement; w = implied welfare requirement.
E = specifi c EU environmental standard; e = implied environmental standard.
P = essen al for profi table milk produc on (i.e. contributes to higher yields, lower costs or less labour use); p = important contributor to profi table milk produc on.
References
Not a comprehensive list. Regula on EC 853/2004 “Laying down specifi c hygiene rules for food of animal origin”. Council Direc ve 98/58/EC “On the protec on of animals kept for farming purposes”. European Conven on for the Protec on of Animals kept for Farming Purposes, which sets out “Five Freedoms”:• Freedom from hunger and thirst – access to fresh water and a diet for full health and
vigour, • Freedom from discomfort – an appropriate environment with shelter and comfortable rest
area, • Freedom from pain, injury and disease – preven on or rapid treatment, • Freedom to express normal behaviour – adequate space and facili es, company of the
animal’s own kind, • Freedom from fear and distress – condi ons and treatment which avoid mental suff ering.
Management
Management requirements and hygiene standards to be achieved are listed in legisla on, but are not included here since they are not part of “infrastructure”.
231
ANNEX 7
Es mated farm and animal numbers by en ty
The following pages present en ty level es mates of farm and animal numbers, produced with the methodology explained in sec on 3.1 of the main report and used throughout.
It should be noted that the es mates of farm numbers have been made independently for each species, and so the same farm might be included under “Ca le” as well as “Sheep”, for example.
Es mates concerning small numbers of farms are subject to rela vely high sampling error; this applies par cularly to many of the farm types in Brčko District, where only the livestock totals for the en re District should be treated as reliable.
232
I. Federa on of Bosnia and Herzegovina
CATTLE: Farm type Defi ni on Farms Ca le Cows Av. herd size
Dairy, house cow 1 milking cow 58,252 73,000 58,000 1.3Dairy, small dairy farm 2–5 milking cows 15,647 54,000 37,000 3.5Dairy, medium dairy farm 6–20 milking cows 450 8,000 4,000 16.8
Dairy, large dairy farm 21–100 milking cows (usually private) 26 1,000 1,000 54.0
Dairy, corporate dairy farm > 100 milking cows (usually legal unit) 8 3,000 2,000 340.7
Dairy-beef farm Dairy cows and purchased beef ca le 1,819 13,000 3,000 7.0
Beef breeding Beef cows 2,918 5,000 4,000 1.7Beef fa ening, small 1–10 beef ca le 6,463 13,000 0 2.0Beef fa ening, large > 20 beef ca le 44 4,000 0 99.6All ca le farms 85,627 174,000 109,000 2.0
SHEEP: Farm type Defi ni on Farms Sheep Ewes Av. fl ock size
Sheep fa ening, household 1–5 lambs, no ewes 508 1,000 0 2.0Sheep fa ening, commercial > 5 lambs, no ewes 953 29,000 0 30.0Sheep breeding, household 1–5 breeding ewes 6,805 28,000 21,000 4.2Sheep breeding, small 6–20 breeding ewes 7,590 121,000 86,000 16.0Sheep breeding, medium 21–100 breeding ewes 3,082 193,000 145,000 62.7Sheep breeding, large > 100 breeding ewes 630 226,000 171,000 358.6All sheep farms 19,568 598,000 423,000 30.6
PIGS: Farm type Defi ni on Farms Pigs Sows Av. herd size
Pig breeding, household 1 breeding sow (may also fa en piglets) 4,123 16,000 4,000 4.0
Pig fa ening, household 1–3 fa ening pigs, no sows 17,251 33,000 0 1.9Pig fa ening, commercial > 3 pigs (no sows) 1,385 7,000 0 5.3Pig breeding-fa ening, commercial
> 1 breeding sow (fa ening most piglets) 163 5,000 1,000 30.7
Pig breeding, commercial > 1 breeding sow (selling most piglets) 2,538 19,000 7,000 7.6
All pig farms 25,461 81,000 11,000 3.2
POULTRY: Farm type Defi ni on Farms Hens Layers Av. fl ock size
Laying hens, household 1–20 laying hens 67,489 745,000 600,000 11Laying hens, small commercial 21–500 laying hens 8,658 554,000 381,000 64
Laying hens, large commercial > 500 laying hens 50 700,000 699,000 14,100
Broiler hens, household/small commercial
<= 1,000 broilers per cycle, no laying hens 10,831 244,000 0 23
Broiler hens, large commercial
> 1,000 broilers per cycle, no laying hens 227 2,629,000 0 11,575
All poultry farms 87,255 4,871,000 1,680,000 56
233
II. Republika Srpska
CATTLE: Farm type Defi ni on Farms Ca le Cows Av. herd size
Dairy, house cow 1 milking cow 43,430 59,000 43,000 1.3Dairy, small dairy farm 2–5 milking cows 18,820 73,000 47,000 3.9Dairy, medium dairy farm 6–20 milking cows 799 13,000 7,000 15.7
Dairy, large dairy farm 21–100 milking cows (usually private) 43 2,000 1,000 54.3
Dairy, corporate dairy farm > 100 milking cows (usually legal unit) 19 5,000 4,000 270.5
Dairy-beef farm Dairy cows and purchased beef ca le 2,757 21,000 4,000 7.6
Beef breeding Beef cows 2,533 5,000 4,000 2.1Beef fa ening, small 1–10 beef ca le 5,710 14,000 0 2.5Beef fa ening, large > 20 beef ca le 81 9,000 0 104.6All ca le farms 74,192 201,000 111,000 2.7
SHEEP: Farm type Defi ni on Farms Sheep Ewes Av. fl ock size
Sheep fa ening, household 1–5 lambs, no ewes 1,037 2,000 0 2.2Sheep fa ening, commercial > 5 lambs, no ewes 2,274 59,000 0 25.8Sheep breeding, household 1–5 breeding ewes 13,895 62,000 47,000 4.5Sheep breeding, small 6–20 breeding ewes 19,756 328,000 234,000 16.6Sheep breeding, medium 21–100 breeding ewes 5,715 319,000 241,000 55.9Sheep breeding, large > 100 breeding ewes 358 144,000 113,000 401.5All sheep farms 43,035 914,000 634,000 21.2
PIGS: Farm type Defi ni on Farms Pigs Sows Av. herd size
Pig breeding, household 1 breeding sow (may also fa en piglets) 18,806 96,000 19,000 5.1
Pig fa ening, household 1–3 fa ening pigs, no sows 59,309 111,000 0 1.9Pig fa ening, commercial > 3 pigs (no sows) 6,469 44,000 0 6.8Pig breeding-fa ening, commercial
> 1 breeding sow (fa ening most piglets) 1,755 79,000 10,000 45.1
Pig breeding, commercial > 1 breeding sow (selling most piglets) 13,046 156,000 42,000 12.0
All pig farms 99,385 487,000 70,000 4.9
POULTRY: Farm type Defi ni on Farms Hens Layers Av. fl ock size
Laying hens, household 1–20 laying hens 96,852 1,261,000 1,079,000 13Laying hens, small commercial 21–500 laying hens 12,199 528,000 435,000 43
Laying hens, large commercial > 500 laying hens 142 1,629,000 1,627,000 11,506
Broiler hens, household/small commercial
<= 1,000 broilers per cycle, no laying hens 17,707 320,000 0 18
Broiler hens, large commercial
> 1,000 broilers per cycle, no laying hens 176 3,478,000 0 19,766
All poultry farms 127,076 7,217,000 3,140,000 57
234
III. Brčko District
CATTLE: Farm type Defi ni on Farms Ca le Cows Av. herd size
Dairy, house cow 1 milking cow 762 1,075 762 1.4Dairy, small dairy farm 2–5 milking cows 512 2,402 1,417 4.7Dairy, medium dairy farm 6–20 milking cows 46 821 467 17.7
Dairy, large dairy farm 21–100 milking cows (usually private) 3 113 59 44.2
Dairy, corporate dairy farm > 100 milking cows (usually legal unit) 1 128 90 256.5
Dairy-beef farm Dairy cows and purchased beef ca le 103 993 183 9.6
Beef breeding Beef cows 51 128 90 2.5Beef fa ening, small 1–10 beef ca le 124 394 0 3.2Beef fa ening, large > 20 beef ca le 3 184 0 60.3All ca le farms 1,605 6,000 3,000 3.9
SHEEP: Farm type Defi ni on Farms Sheep Ewes Av. fl ock size
Sheep fa ening, household 1–5 lambs, no ewes 8 19 0 2.4Sheep fa ening, commercial > 5 lambs, no ewes 10 186 0 17.9Sheep breeding, household 1–5 breeding ewes 105 505 394 4.8Sheep breeding, small 6–20 breeding ewes 111 1,724 1,227 15.5Sheep breeding, medium 21–100 breeding ewes 6 351 278 63.3Sheep breeding, large > 100 breeding ewes 1 - - -All sheep farms 241 3,000 2,000 11.6
PIGS: Farm type Defi ni on Farms Pigs Sows Av. herd size
Pig breeding, household 1 breeding sow (may also fa en piglets) 453 2,911 473 6.4
Pig fa ening, household 1–3 fa ening pigs, no sows 873 1,900 0 2.2Pig fa ening, commercial > 3 pigs (no sows) 185 1,528 0 8.2Pig breeding-fa ening, commercial
> 1 breeding sow (fa ening most piglets) 90 4,089 470 45.3
Pig breeding, commercial > 1 breeding sow (selling most piglets) 442 6,824 1,574 15.5
All pig farms 2,043 17,000 3,000 8.4
POULTRY: Farm type Defi ni on Farms All hens Layers Av. fl ock size
Laying hens, household 1–20 laying hens 2,255 33,677 27,384 15Laying hens, small commercial 21–500 laying hens 485 19,808 16,110 41
Laying hens, large commercial > 500 laying hens 0.4 7,714 7,714 19,285
Broiler hens, household/small commercial
<= 1,000 broilers per cycle, no laying hens 473 9,291 0 20
Broiler hens, large commercial
> 1,000 broilers per cycle, no laying hens 12 62,901 0 5,376
All poultry farms 3,226 133,000 51,000 41

The Meat and Dairy Sector in Bosnia and Herzegovina
Preparation of IPARD Sector Analyses in Bosnia and Herzegovina
2012
FAO Regional Office for Europe and Central Asia
FAO Regional Office for Europe and Central Asia
31 August 2012
The
Mea
t an
d D
airy
Sec
tor
in B
osni
a an
d H
erze
govi
na
This project is funded by the European Union
Please address comments and inquiries to:
Regional Office for Europe and Central Asia Food and Agriculture Organization of the United Nations (FAO)
Benczúr u. 34, 1068 Budapest, HungaryTelephone: (+36) 1 461 2000Fax: (+36) 1 351 7029Email: [email protected]: www.fao.org/europe/en
Electronic Version of the report: http://www.fao.org/europe/publications/documents-and-reports/IPARD-BiH/